STV Applied to 2008 Result Nov 8 2011
40
Possible STV electorates in 2008 This paper describes how the 2008 general election might have played out under the Single Transferable Vote (STV system). STV electorates The boundaries described below (and illustrated in separate maps) are based on the following principles derived from the Electoral Act and the report of the 1986 Royal Commission on the Electoral System’ s description of how STV could work in New Zealand. • At least 80% of electorates must have 5 members • No electorate may have fewer that 3 or more than 7 members • No general electorate may straddle the North and South Islands • The total number of electorates is fixed at 120 • Given the above the best fit is deemed to be o South Island general, 27 MPs o North Island general, 81 MPs o Maori roll, 12 MPs • This makes the North Island slightly over-represented o In the South Island, a 5-member electorat e would be the same size as 2.96 existing MMP electorates. o In the North Island, a 5-member electorate would be the same size as 2.90 existing MMP electorates. o In the Maori electorate, a 5-member electorate would be the same size as 2.92 existing MMP electorates.
Transcript of STV Applied to 2008 Result Nov 8 2011

8/3/2019 STV Applied to 2008 Result Nov 8 2011
http://slidepdf.com/reader/full/stv-applied-to-2008-result-nov-8-2011 1/47
Possible STV electorates in 2008 This paper describes how the 2008 general election might have played out under the Single Transferable Vote (STVsystem).
STV electorates
The boundaries described below (and illustrated in separate maps) are based on the following principles derivedfrom the Electoral Act and the report of the 1986 Royal Commission on the Electoral System’s description of howSTV could work in New Zealand.
• At least 80% of electorates must have 5 members
•
No electorate may have fewer that 3 or more than 7 members• No general electorate may straddle the North and South Islands
• The total number of electorates is fixed at 120
• Given the above the best fit is deemed to beo South Island general, 27 MPs
o North Island general, 81 MPs
o Maori roll, 12 MPs
• This makes the North Island slightly over-representedo In the South Island, a 5-member electorate would be the same size as 2.96 existing MMP electorates.
o In the North Island, a 5-member electorate would be the same size as 2.90 existing MMP electorates.
o In the Maori electorate, a 5-member electorate would be the same size as 2.92 existing MMPelectorates.

8/3/2019 STV Applied to 2008 Result Nov 8 2011
http://slidepdf.com/reader/full/stv-applied-to-2008-result-nov-8-2011 2/47
The specific boundaries below represent one possible scenario. While in some cases (eg Wellington) there is acompelling logic behind the electorate described, in other cases there are several workable solutions and thechoice is semi-arbitrary. Examples of this are
a) splitting Auckland City north-south into the suggested Auckland Central and One Tree Hill. The same areacould just as easily be split east-west.
b) The division of the upper South Island (ex Christchurch) into a 5-member Canterbury-West Coast electorateand a 4-member Top of the South electorate. The same area could just as easily be split into a 4-memberCanterbury electorate and a 5-member West Coast-Nelson-Marlborough-North Canterbury electorate.

8/3/2019 STV Applied to 2008 Result Nov 8 2011
http://slidepdf.com/reader/full/stv-applied-to-2008-result-nov-8-2011 3/47
8/3/2019 STV Applied to 2008 Result Nov 8 2011
http://slidepdf.com/reader/full/stv-applied-to-2008-result-nov-8-2011 4/47

8/3/2019 STV Applied to 2008 Result Nov 8 2011
http://slidepdf.com/reader/full/stv-applied-to-2008-result-nov-8-2011 5/47
Results
Calculating the result in each electorate is both simple and complex. Simple because in the great majority of cases
it is pretty obvious what that result would be, complex because the mathematical procedures to demonstrate thatresult are fraught with complications.
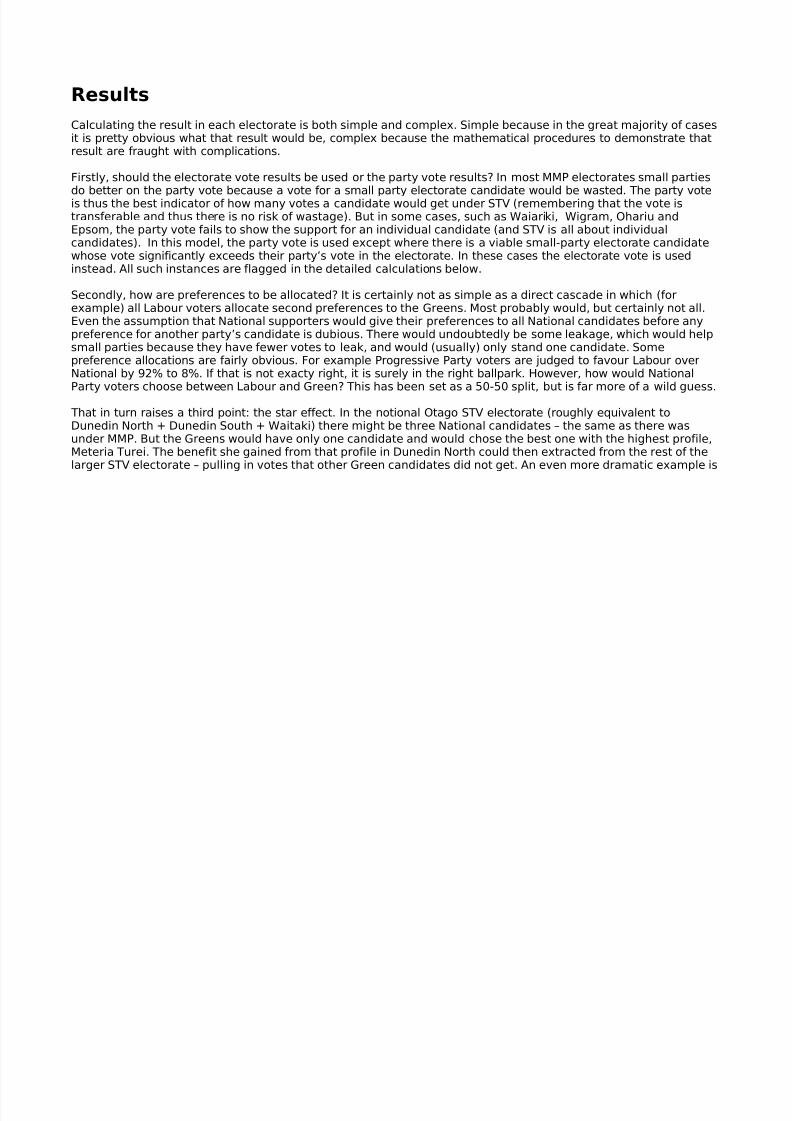
Firstly, should the electorate vote results be used or the party vote results? In most MMP electorates small partiesdo better on the party vote because a vote for a small party electorate candidate would be wasted. The party voteis thus the best indicator of how many votes a candidate would get under STV (remembering that the vote istransferable and thus there is no risk of wastage). But in some cases, such as Waiariki, Wigram, Ohariu andEpsom, the party vote fails to show the support for an individual candidate (and STV is all about individualcandidates). In this model, the party vote is used except where there is a viable small-party electorate candidatewhose vote significantly exceeds their party’s vote in the electorate. In these cases the electorate vote is usedinstead. All such instances are flagged in the detailed calculations below.
Secondly, how are preferences to be allocated? It is certainly not as simple as a direct cascade in which (forexample) all Labour voters allocate second preferences to the Greens. Most probably would, but certainly not all.Even the assumption that National supporters would give their preferences to all National candidates before anypreference for another party’s candidate is dubious. There would undoubtedly be some leakage, which would helpsmall parties because they have fewer votes to leak, and would (usually) only stand one candidate. Somepreference allocations are fairly obvious. For example Progressive Party voters are judged to favour Labour overNational by 92% to 8%. If that is not exacty right, it is surely in the right ballpark. However, how would NationalParty voters choose between Labour and Green? This has been set as a 50-50 split, but is far more of a wild guess.
That in turn raises a third point: the star effect. In the notional Otago STV electorate (roughly equivalent toDunedin North + Dunedin South + Waitaki) there might be three National candidates – the same as there wasunder MMP. But the Greens would have only one candidate and would chose the best one with the highest profile,Meteria Turei. The benefit she gained from that profile in Dunedin North could then extracted from the rest of thelarger STV electorate – pulling in votes that other Green candidates did not get. An even more dramatic example is

8/3/2019 STV Applied to 2008 Result Nov 8 2011
http://slidepdf.com/reader/full/stv-applied-to-2008-result-nov-8-2011 6/47
in the notional Wellington STV electorate. In Ohariu, the UnitedFuture candidate (Peter Dunne) got 33% of thevote. In Wellington Central the UnitedFuture candidate (Vaughan Smith) got 0.5% of the vote. While there is nomathematical basis for it, common sense suggests that Mr Dunne’s popularity does not simply stop when theelectorate boundary is crossed. He would have pulled in votes from the Wellington Central and Rongotai areas thatother UnitedFuture candidates did not. Such special cases are noted and explained in the detailed analysis below.
The following standard procedures have been used:
• Results are calculated using party votes, except when there is a large difference between party andelectorate votes that could change the result, in which case the electorate vote is used. This leaves out thevote for parties which did not stand a candidate, but these are always votes that would have ended up beingtransferred anyway. These cases are labelled.
• For simplicity, votes cast for parties which did not gather more than 0.75% of the vote are ignored. Besidesmaking almost no difference to the count, it is very hard to guess how the preferences of the Bill and BenParty would flow!
• All preferences are allocated within parties before they are allocated to other parties. Eg it is assumed aLabour voter will rank all Labour candidates ahead of any other-party candidate.
• Votes are allocated from each MMP electorate to each STV electorate under the assumption that partysupport is evenly distributed within the electorate. For example, if the notional STV electorate X contains onethird of MMP electorate Y then one third of the votes for each party in Y are allocated to X. (In practice votes
are not evenly distributed in this way but trying to allocate and count individual polling booths would magnifythe complexity of the task by a factor of about 20.)

8/3/2019 STV Applied to 2008 Result Nov 8 2011
http://slidepdf.com/reader/full/stv-applied-to-2008-result-nov-8-2011 7/47
• The quota of votes for electing one MP is 1 divided by (#of MPs in electorate plus 1) plus infinitesimal, thenrounded up to the nearest whole number. For example, in a 5-member electorate the quota is the nearestwhole number that is greater than 1/6 of the vote.
• Because STV votes are transferable, it is vital to have a model for how voters’ second (and subsequent)preferences would be distributed. A full iteration of all preferences would be vastly complex, so a simplifiedmodel is used:
o All voters cast a full set of preferences
o To simplify the process small party votes are usually reallocated direct to those parties which areactually in the hunt for a seat rather than step by step.
o To simplify calculations, where multiple reallocations are made they are made on the basis of the
intermediate party’s preference tree. For example, if a Progressive vote is reallocated to NZ First, andNZ First is then eliminated, the Progressive vote is reallocated according to the NZ First preference treerather than returning to the Progressive tree.
The preference distribution models are as follows:
FIRST CHOICE SECOND CHOICE THIRD CHOICE
National Labour 45 Green35
NZ First 10
Green 45 Labour35
NZ First 10
FIRST CHOICE SECOND CHOICE THIRD CHOICE
Labour National 10 Green5
NZ First 5
Green 80 National 20NZ First 80
NZ First 10 Green 7
8/3/2019 STV Applied to 2008 Result Nov 8 2011
http://slidepdf.com/reader/full/stv-applied-to-2008-result-nov-8-2011 8/47
NZ First 10 Green 5Labour 5
Total 100 Total 100
National 3
Total 100 Total 100
FIRST CHOICE SECOND CHOICE THIRD CHOICE
Green Labour 88 National44
NZ First 44
National 8 Labour 7NZ First 1
NZ First 4 National 2
Labour 2
Total 100 Total 100
FIRST CHOICE SECOND CHOICE THIRD CHOICE
NZ First Labour 50 Green30
National 20
Green 10 Labour9
National 1
National 40 Green 20Labour 20
Total 100 Total 100
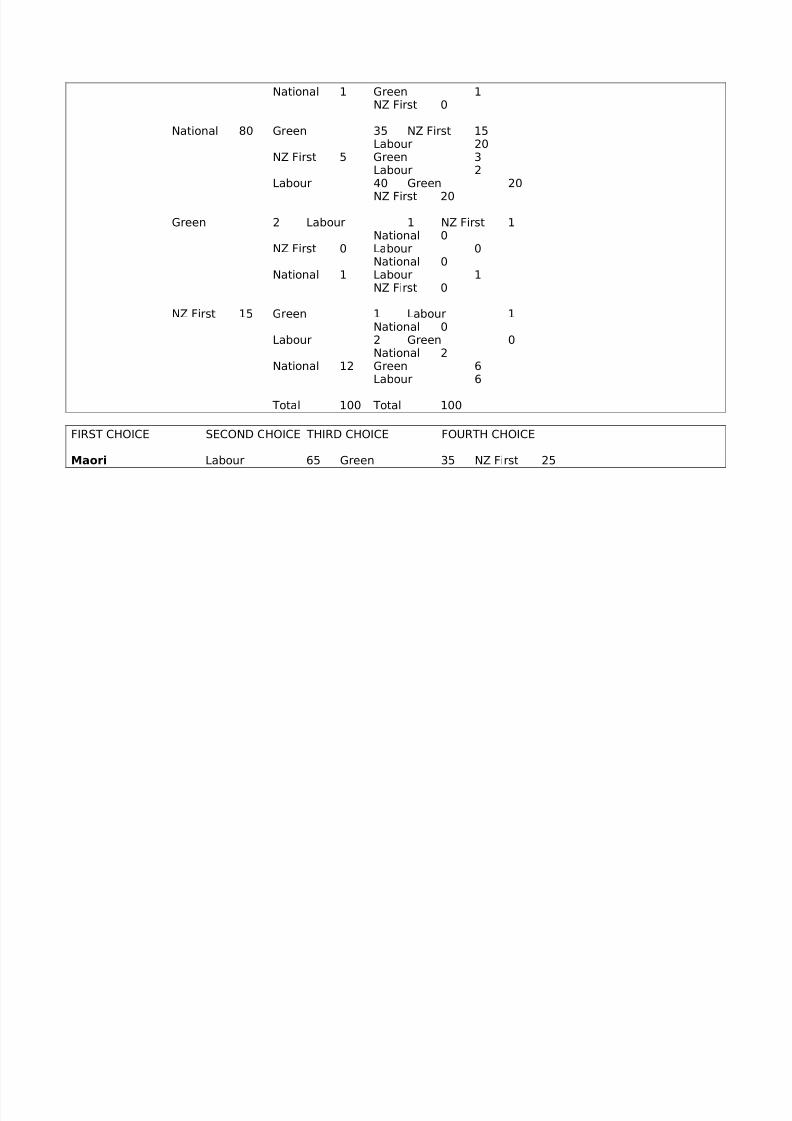
FIRST CHOICE SECOND CHOICE THIRD CHOICE FOURTH CHOICE
Act Labour 3 Green 1 NZ First 1National 0
NZ First 1 Green 0National 1
8/3/2019 STV Applied to 2008 Result Nov 8 2011
http://slidepdf.com/reader/full/stv-applied-to-2008-result-nov-8-2011 9/47
National 1 Green 1NZ First 0
National 80 Green 35 NZ First 15Labour 20
NZ First 5 Green 3Labour 2
Labour 40 Green 20NZ First 20
Green 2 Labour 1 NZ First 1National 0
NZ First 0 Labour 0National 0
National 1 Labour 1NZ First 0
NZ First 15 Green 1 Labour 1National 0
Labour 2 Green 0National 2
National 12 Green 6Labour 6
Total 100 Total 100
FIRST CHOICE SECOND CHOICE THIRD CHOICE FOURTH CHOICE
Maori Labour 65 Green 35 NZ First 25

8/3/2019 STV Applied to 2008 Result Nov 8 2011
http://slidepdf.com/reader/full/stv-applied-to-2008-result-nov-8-2011 10/47
National 10NZ First 20 Green 15
National 5National 10 Green 5
NZ First 5
National 15 Green 4 NZ First 2Labour 2
NZ First 7 Green 2Labour 5
Labour 4 Green 2NZ First 2
Green 10 Labour 8 NZ First 5
National 3NZ First 1 Labour 1
National 0National 1 Labour 1
NZ First 0
NZ First 10 Green 3 Labour 2National 1
Labour 6 Green 4National 1
National 2 Green 1
Labour 1
Total 100 Total 100

8/3/2019 STV Applied to 2008 Result Nov 8 2011
http://slidepdf.com/reader/full/stv-applied-to-2008-result-nov-8-2011 11/47
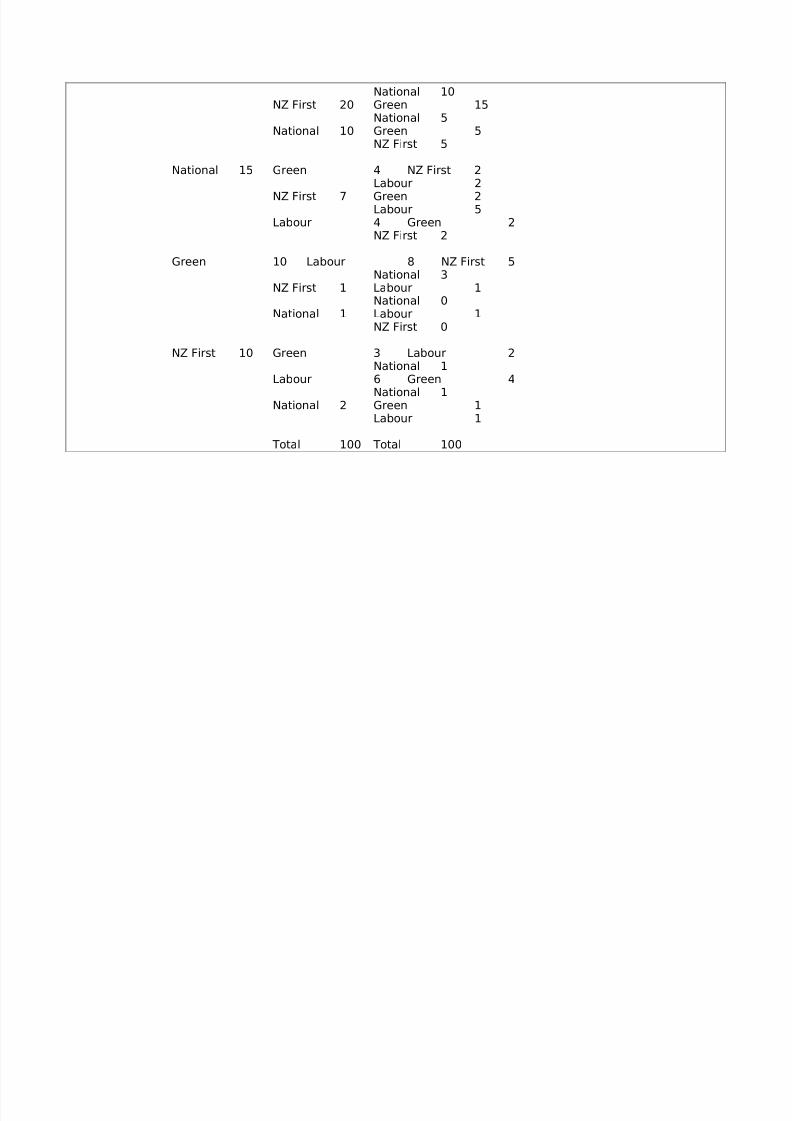
FIRST CHOICE SECOND CHOICE THIRD CHOICE FOURTH CHOICE
Progressive Labour 76 Green 36 NZ First 31National 5
NZ First 35 Green 20National 15
National 5 Green 4NZ First 1
National 4 Green 2 NZ First 1Labour 1
NZ First 1 Green 0Labour 1
Labour 1 Green 1
NZ First 0
Green 10 Labour 7 NZ First 5National 2
NZ First 2 Labour 2National 0
National 1 Labour 1NZ First 0
NZ First 10 Green 2 Labour 1National 1
Labour 6 Green 5National 1
National 2 Green 1Labour 1
8/3/2019 STV Applied to 2008 Result Nov 8 2011
http://slidepdf.com/reader/full/stv-applied-to-2008-result-nov-8-2011 12/47
Total 100 Total 100
FIRST CHOICE SECOND CHOICE THIRD CHOICE FOURTH CHOICE
United Future Labour 15 Green 7 NZ First 1National 6
NZ First 1 Green 0National 1
National 7 Green 4NZ First 3
National 80 Green 37 NZ First 7Labour 30
NZ First 6 Green 2Labour 4
Labour 37 Green 30NZ First 7
Green 4 Labour 2 NZ First 1National 1
NZ First 0 Labour 0National 0
National 2 Labour 2NZ First 0
NZ First 1 Green 0 Labour 0National 0
Labour 1 Green 1

8/3/2019 STV Applied to 2008 Result Nov 8 2011
http://slidepdf.com/reader/full/stv-applied-to-2008-result-nov-8-2011 13/47
National 0National 0 Green 0
Labour 0
Total 100 Total 100
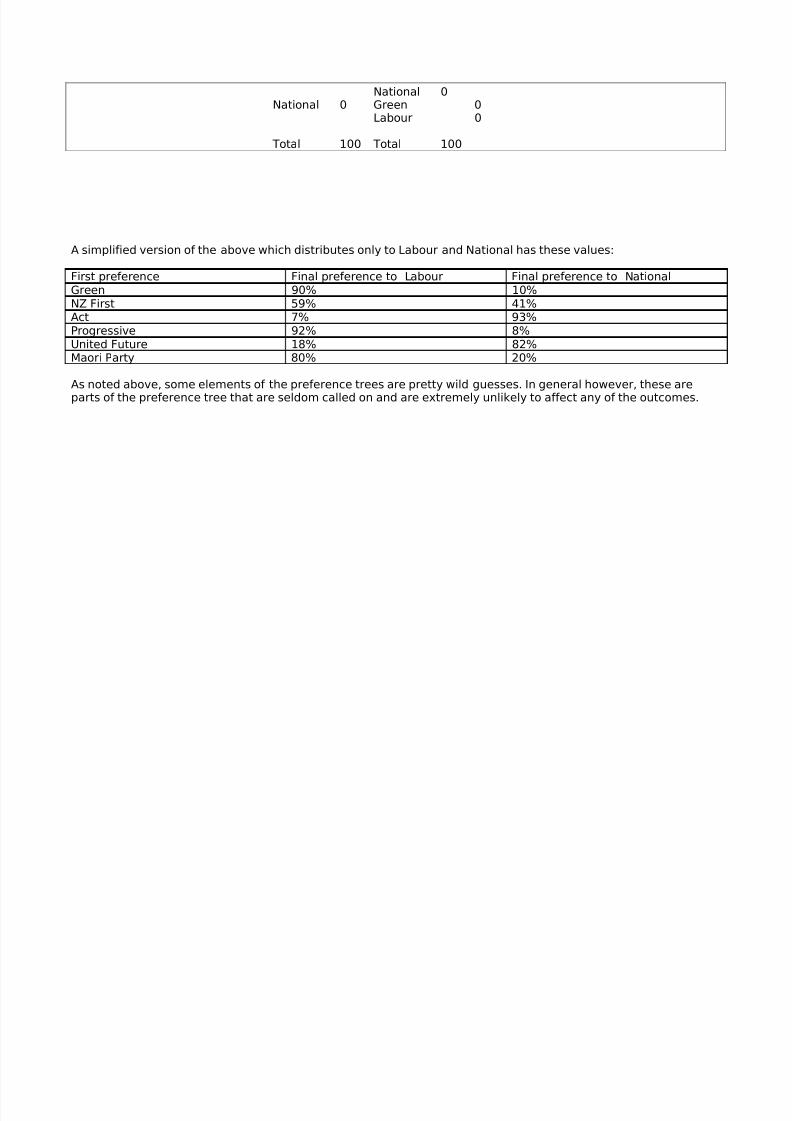
A simplified version of the above which distributes only to Labour and National has these values:
First preference Final preference to Labour Final preference to NationalGreen 90% 10%NZ First 59% 41%Act 7% 93%Progressive 92% 8%United Future 18% 82%Maori Party 80% 20%
As noted above, some elements of the preference trees are pretty wild guesses. In general however, these areparts of the preference tree that are seldom called on and are extremely unlikely to affect any of the outcomes.

8/3/2019 STV Applied to 2008 Result Nov 8 2011
http://slidepdf.com/reader/full/stv-applied-to-2008-result-nov-8-2011 14/47
The electorates and resultsSOUTHLAND (3 MPs)Party/MMP
electorate
Invercargill
(100%)
Clutha-Southland
(77%)
Total
Act 947 1013 1960Green 1492 1329 2821Labour 12,927 6230 19,157
205 109 314National 16,663 15,581 32,244NZ First 1192 745 1937Progressive 292 174 466UnitedFuture 319 196 515
Total 59,414
(Q=14,854)
Southland preference distribution and results (quota = 14,854)Party First preference vote RemainderAct 1960 1960Green 2821 2821Labour 19,157 (1 elected) 4303
Maori Party 314 314National 32,244 (2 elected)
2536
NZ First 1937 1937Progressive 466 466UnitedFuture 515 515All seats allocated on first preferences
8/3/2019 STV Applied to 2008 Result Nov 8 2011
http://slidepdf.com/reader/full/stv-applied-to-2008-result-nov-8-2011 15/47
OTAGO (5 MPs)Party/MMPelectorate
Dunedin North(100%)
Dunedin South(77%)
Clutha-Southland(23%)
Waitaki (73%) Total
Act 749 785 302 1045 2881
Green 5221 2971 397 2035 10,624Labour 14,608 17,408 1861 8731 42,608Maori Party 230 160 32 145 567National 9692 12,742 4654 14,911 41,999NZ First 1132 1700 223 1056 4111Progressive 310 461 52 279 1102UnitedFuture 312 276 58 204 850
Total 104,742(Q=17,458)
Otago preference distribution and results (quota = 17,458)Party Total Remainder Act, Maori, NZF,
Progessive, UFvotes
Labour votes
Act 2881 2881Green 10,624 10,624 11,568 21,491 (1
elected) Labour 42,608 (2 elected)
7692 11,406
Maori Party 567 567
National 41,999 (2 elected)
7083 11,931 13, 413
NZ First 4111 4111Progressive 1102 1102

8/3/2019 STV Applied to 2008 Result Nov 8 2011
http://slidepdf.com/reader/full/stv-applied-to-2008-result-nov-8-2011 16/47
UnitedFuture 850 850
A VERY close result! However, application of the star factor (if undertaken) would have helped theGreens anyway.
8/3/2019 STV Applied to 2008 Result Nov 8 2011
http://slidepdf.com/reader/full/stv-applied-to-2008-result-nov-8-2011 17/47
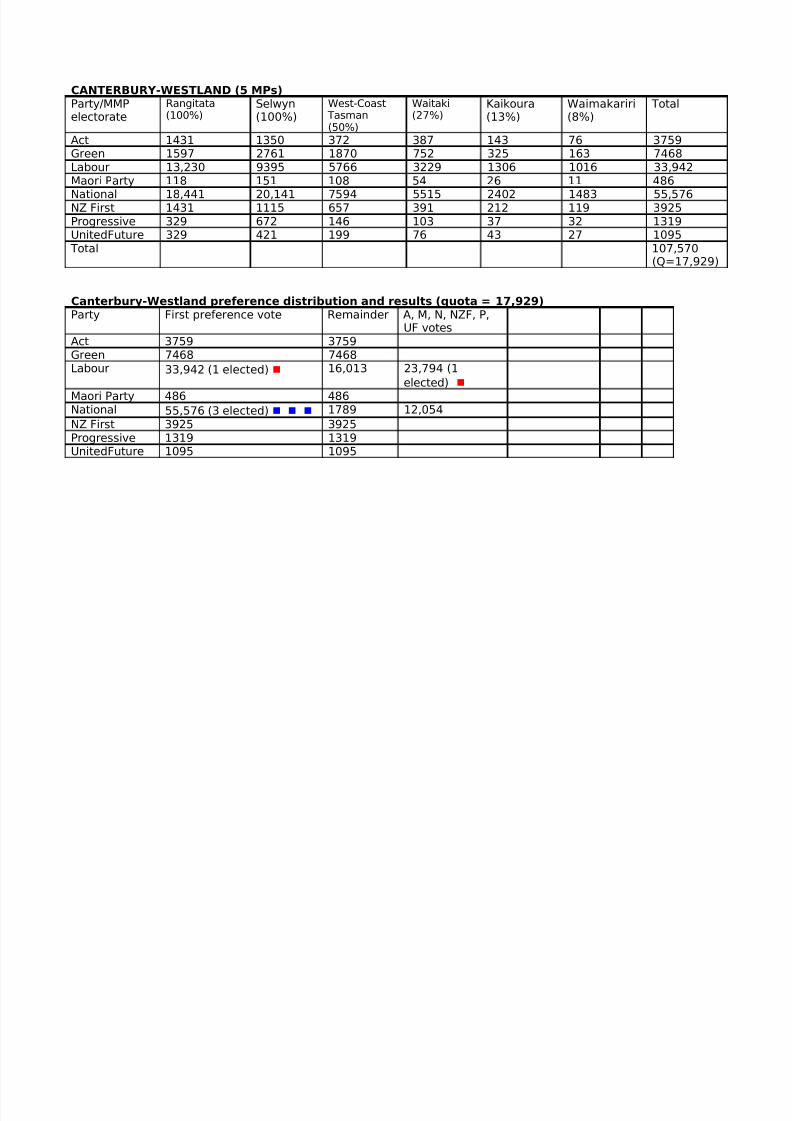
CANTERBURY-WESTLAND (5 MPs)Party/MMPelectorate
Rangitata(100%)
Selwyn(100%)
West-Coast Tasman(50%)
Waitaki(27%)
Kaikoura(13%)
Waimakariri(8%)
Total
Act 1431 1350 372 387 143 76 3759Green 1597 2761 1870 752 325 163 7468Labour 13,230 9395 5766 3229 1306 1016 33,942Maori Party 118 151 108 54 26 11 486National 18,441 20,141 7594 5515 2402 1483 55,576NZ First 1431 1115 657 391 212 119 3925Progressive 329 672 146 103 37 32 1319UnitedFuture 329 421 199 76 43 27 1095
Total 107,570(Q=17,929)
Canterbury-Westland preference distribution and results (quota = 17,929)Party First preference vote Remainder A, M, N, NZF, P,
UF votesAct 3759 3759Green 7468 7468Labour 33,942 (1 elected) 16,013 23,794 (1
elected)
Maori Party 486 486National
55,576 (3 elected)
1789 12,054
NZ First 3925 3925Progressive 1319 1319UnitedFuture 1095 1095

8/3/2019 STV Applied to 2008 Result Nov 8 2011
http://slidepdf.com/reader/full/stv-applied-to-2008-result-nov-8-2011 18/47
TOP OF THE SOUTH (4 MPs)Party/MMPelectorate
Nelson (100%) Kaikoura (87%) West-Coast Tasman (50%)
Total
Act 900 958 372 2230
Green 3417 2174 1870 7461Labour 13,689 8740 5766 28,375Maori Party 184 175 108 467National 15,378 16,077 7594 39,049NZ First 1104 1419 657 3180Progressive 282 248 146 676UnitedFuture 387 288 199 874
82,312(Q=16,463)
TOP OF THE SOUTH preference distribution and results (quota = 16,463)Party First preference vote Remainde
rM, P, UF, A, NZFvotes
G votes
Act 2230 2230Green 7461 7461 8020Labour 28,375 (1 elected) 11,912 14,637 21,855 (1 elected) Maori Party 467 467National 39,049 (2 elected) 6123 10,264 11,066
NZ First 3180 3180
Progressive 676 676UnitedFuture 874 874

8/3/2019 STV Applied to 2008 Result Nov 8 2011
http://slidepdf.com/reader/full/stv-applied-to-2008-result-nov-8-2011 19/47
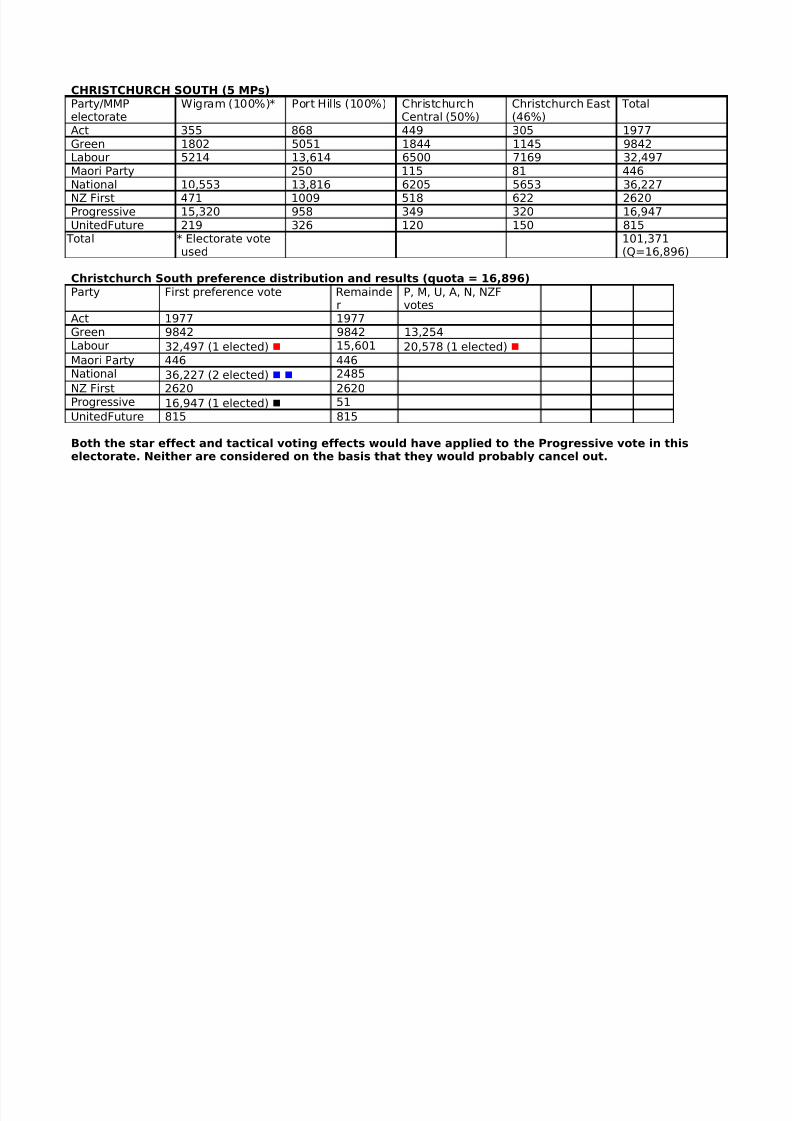
CHRISTCHURCH SOUTH (5 MPs)Party/MMPelectorate
Wigram (100%)* Port Hills (100%) ChristchurchCentral (50%)
Christchurch East(46%)
Total
Act 355 868 449 305 1977
Green 1802 5051 1844 1145 9842Labour 5214 13,614 6500 7169 32,497Maori Party 250 115 81 446National 10,553 13,816 6205 5653 36,227NZ First 471 1009 518 622 2620Progressive 15,320 958 349 320 16,947UnitedFuture 219 326 120 150 815
Total * Electorate voteused
101,371(Q=16,896)
Christchurch South preference distribution and results (quota = 16,896)Party First preference vote Remainde
rP, M, U, A, N, NZFvotes
Act 1977 1977Green 9842 9842 13,254Labour 32,497 (1 elected) 15,601 20,578 (1 elected) Maori Party 446 446National 36,227 (2 elected) 2485
NZ First 2620 2620Progressive 16,947 (1 elected) 51
UnitedFuture 815 815
Both the star effect and tactical voting effects would have applied to the Progressive vote in thiselectorate. Neither are considered on the basis that they would probably cancel out.

8/3/2019 STV Applied to 2008 Result Nov 8 2011
http://slidepdf.com/reader/full/stv-applied-to-2008-result-nov-8-2011 20/47
CHRISTCHURCH NORTH (5 MPs)Party/MMPelectorate
Ilam (100%) Waimakariri(92%)
Christchurch East(54%)
ChristchurchCentral (50%)
Act 1422 877 359 449 3107
Green 3034 1873 1344 1844 8095Labour 10,168 11,686 8416 6500 36,770Maori Party 195 129 95 115 534National 19,541 17,056 6636 6205 49,438NZ First 893 1363 730 518 3504Progressive 550 365 376 349 1640UnitedFuture 516 315 176 120 1127
Total 104,215(Q=17,370)
Christchurch North preference distribution and results (quota = 17,370)Party First preference vote Remainder M, U, P, L, A votesAct 3107 3107Green 8095 8095 11,749Labour 36,770 (2 elected)
2030
Maori Party 534 534National 49,438 (2 elected)
14,698 19,477 (1 elected)
NZ First 3504 3504 3504*Progressive 1640 1640UnitedFuture 1127 1127

8/3/2019 STV Applied to 2008 Result Nov 8 2011
http://slidepdf.com/reader/full/stv-applied-to-2008-result-nov-8-2011 21/47
*Intermediate distribution to NZ First ignored as it would not have changed result

8/3/2019 STV Applied to 2008 Result Nov 8 2011
http://slidepdf.com/reader/full/stv-applied-to-2008-result-nov-8-2011 22/47
WELLINGTON (5 MPs)Party/MMPelectorate
Rongotai (100%) WellingtonCentral (100%)
Ohariu (90%)* Total
Act 758 1628 438 2824
Green 6464 8494 2399 17,357Labour 16,263 14,244 10,167 40,674Maori Party 351 351 702National 11,950 14,589 9008 35,547NZ First 960 629 1589Progressive 291 272 563UnitedFuture 326 412 11,072 11,810
37,363 40,619 33,084 111,066(Q=18,511)
* Electorate vote used
Wellington preference distribution and results (quota = 18,511)Party Total Remainder Star effect* L votesAct 2824 2824 2824Green 17,357 17,357 17,357 18,880 (1
elected) Labour 40,674 (2 elected) 3652 1754
Maori Party 702 702 702National 35,547 (1 elected)
17,036 9327 9555
NZ First 1589 1589 1589Progressive 563 563 563UnitedFuture 11,810 11,810 21,417 (1
elected)

8/3/2019 STV Applied to 2008 Result Nov 8 2011
http://slidepdf.com/reader/full/stv-applied-to-2008-result-nov-8-2011 23/47
* Star effect: UF gets half the % dif between Ohariu and Wgtn C UF vote in Wgtn C area, and onequarter in Rongotai area, taken 80% from National and 20% from Labour. Possible tactical votingeffect is ignored as there was little tactical reason for voters to back Mr Dunne (his party was clearly
unlikely to get a second MP).

8/3/2019 STV Applied to 2008 Result Nov 8 2011
http://slidepdf.com/reader/full/stv-applied-to-2008-result-nov-8-2011 24/47
HUTT VALLEY-PORIRUA (5 MPs)Party/MMPelectorates
Hutt South(100%)
Rimutaka (100%) Mana (80%) Ohariu (10%)
Act 950 909 655 130 2644
Green 2655 2107 2322 349 7433Labour 14,769 14,685 12,167 1273 42,894Maori Party 293 260 285 28 866National 13,057 14,452 10,161 1767 39,437NZ First 1208 1453 823 80 3564Progressive 305 345 219 27 896UnitedFuture 490 499 366 84 1439
Total 99,173(Q=16,529)
Hutt Valley-Porirua preference distribution and results (quota = 16,529)Party First preference vote Remaind
erM, P, U, A,NZF votes
G votes
Act 2644 2644Green 7433 7433 8197Labour 42,894 (2 elected) 9836 13,275 20,652 (1 elected) Maori Party 866 866National 39,437 (2 elected) 6379 11,587 12,406
NZ First 3564 3564Progressive 896 896UnitedFuture 1439 1439
8/3/2019 STV Applied to 2008 Result Nov 8 2011
http://slidepdf.com/reader/full/stv-applied-to-2008-result-nov-8-2011 25/47
MANAWATU (5 MPs)Party/MMPelectorates
Palmerston North(100%)
Otaki (90%) Rangitikei (70%) Mana (20%)
Act 948 1014 1014 164 3140
Green 2258 2207 1285 581 6331Labour 14,108 14,472 6509 3042 38,131Maori Party 247 321 215 71 854National 14,103 17,534 12,398 2540 46,575NZ First 1404 2153 1203 206 4966Progressive 408 453 216 55 1132UnitedFuture 430 397 272 92 1191
Total 102, 320(Q=17,054)
Manawatu preference distribution and results (quota = 17,054)Party First preference vote Remainde
rM, P, U, Avotes
NZF votes
Act 3140 3140Green 6331 6331 6638 7202Labour 38,131 (2 elected)
4023 5710 8533
Maori Party 854 854National 46,575 (2 elected)
12,467 16,104 18,362 (1 elected)
NZ First 4966 4966 5646Progressive 1132 1132UnitedFuture 1191 1191

8/3/2019 STV Applied to 2008 Result Nov 8 2011
http://slidepdf.com/reader/full/stv-applied-to-2008-result-nov-8-2011 26/47
WEST CENTRAL (5 MPs)Party/MMPelectorates
New Plymouth(100%)
Whanganui(100%)
Taranaki-KingCountry (60%)
Rangitikei (30%)
Act 1106 1052 980 434 3572
Green 2230 1809 964 551 5554Labour 10901 12,170 4106 2789 29,966Maori Party 260 342 196 92 890National 17512 15869 11,539 5313 50,233NZ First 1404 1761 871 516 4552Progressive 232 253 115 93 693UnitedFuture 227 224 155 116 722
Total 96,182(Q=16,031)
West Central preference distribution and results (quota = 16,031)Party First preference vote Remainder P, U, M, N votesAct 3572 3572 3572*Green 5554 5554 7239Labour 29,966 (1 elected) 13,935 16,692 (1 elected) Maori Party 890 890National 50,233 (3 elected)
2140
NZ First 4552 4552 4552*
Progressive 693 693UnitedFuture 722 722*Intermediate distribution to NZ First and Act ignored as it would not have changed result

8/3/2019 STV Applied to 2008 Result Nov 8 2011
http://slidepdf.com/reader/full/stv-applied-to-2008-result-nov-8-2011 27/47
HAWKE’S BAY-WAIRARAPA (5 MPs)Party/MMPelectorate
Wairarapa(100%)
Tukutuki (100%) Napier (90%) Total
Act 1660 1552 1166 4378
Green 2109 2146 1772 6027Labour 11,464 11,457 11,359 34,280Maori Party 266 310 245 821National 17,860 17,904 15,095 50,859NZ First 2040 1129 1183 4352Progressive 251 309 242 802UnitedFuture 248 196 192 636
102,155(Q=17,026)
Hawke’s Bay-Wairarapa preference distribution and results (quota = 17,026)Party First preference vote Remainde
rU votes
Act 4378 4378 4378Green 6027 6027 6103Labour 34,280 (2 elected) 228 228
Maori Party 821 821 821National 50,859 (2 elected) 16,807 17,366 (1 elected)
NZ First 4352 4352 4352Progressive 802 802 802UnitedFuture 636 636

8/3/2019 STV Applied to 2008 Result Nov 8 2011
http://slidepdf.com/reader/full/stv-applied-to-2008-result-nov-8-2011 28/47
EAST CAPE (5 MPs)
Party/MMP
electorates
East Coast
(100%)
Rotorua (100%) Taupo (80%) Napier (10%) Total
Act 816 879 996 130 2821Green 2025 1666 1279 197 5167Labour 10,075 10,044 8287 1262 29,668Maori Party 457 596 260 27 1340National 15,160 16,836 15,201 1677 48,874NZ First 1862 2122 1459 131 5574Progressive 199 200 189 27 615UnitedFuture 698 282 227 21 1228
Total 95,287
(Q=15,882)
East Cape preference distribution and results (quota = 15,882)Party First preference vote Remainde
rAct 2821 2821Green 5167 5167 7525Labour 29,668 (1 elected) 13,786 17,586 (1 elected)
Maori Party 1340 1340
National 48,874 (3 elected)
1228
NZ First 5574 5574 6639Progressive 615 615

8/3/2019 STV Applied to 2008 Result Nov 8 2011
http://slidepdf.com/reader/full/stv-applied-to-2008-result-nov-8-2011 29/47
UnitedFuture 1228 1228

8/3/2019 STV Applied to 2008 Result Nov 8 2011
http://slidepdf.com/reader/full/stv-applied-to-2008-result-nov-8-2011 30/47
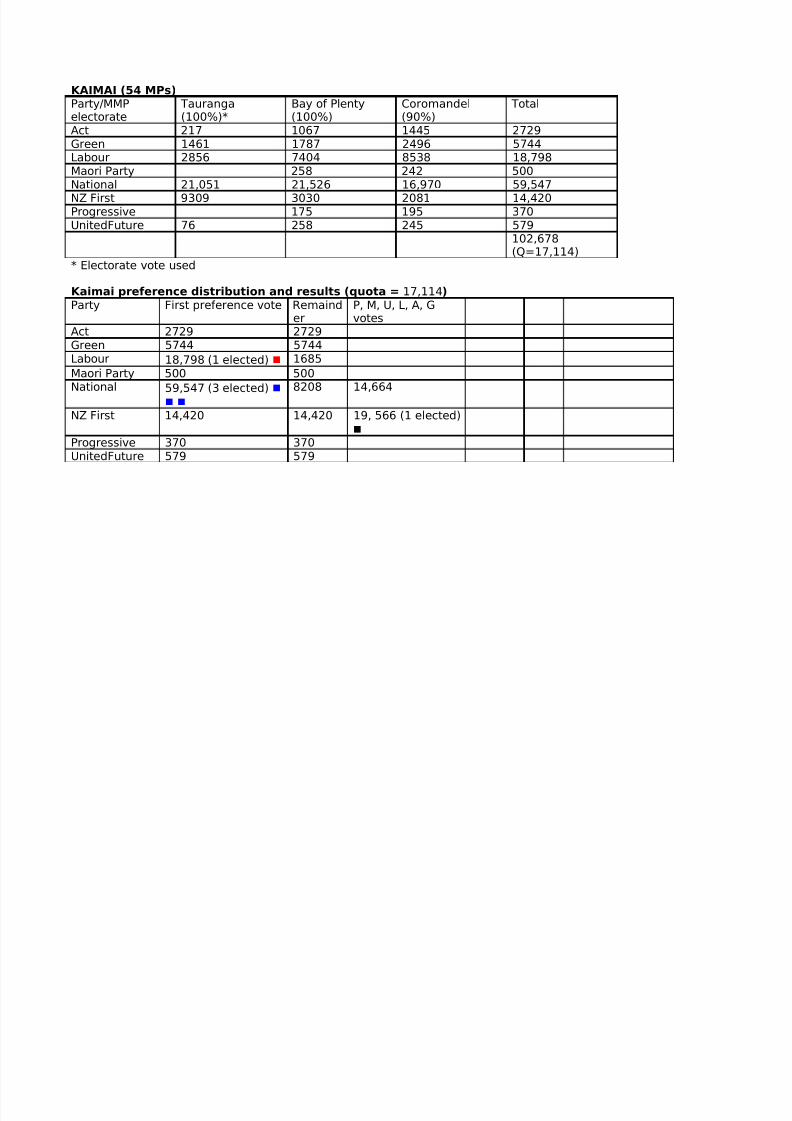
KAIMAI (54 MPs)Party/MMPelectorate
Tauranga(100%)*
Bay of Plenty(100%)
Coromandel(90%)
Total
Act 217 1067 1445 2729
Green 1461 1787 2496 5744Labour 2856 7404 8538 18,798Maori Party 258 242 500National 21,051 21,526 16,970 59,547NZ First 9309 3030 2081 14,420Progressive 175 195 370UnitedFuture 76 258 245 579
102,678(Q=17,114)
* Electorate vote used
Kaimai preference distribution and results (quota = 17,114)Party First preference vote Remaind
erP, M, U, L, A, Gvotes
Act 2729 2729Green 5744 5744Labour 18,798 (1 elected) 1685
Maori Party 500 500National 59,547 (3 elected)
8208 14,664
NZ First 14,420 14,420 19, 566 (1 elected)
Progressive 370 370UnitedFuture 579 579
8/3/2019 STV Applied to 2008 Result Nov 8 2011
http://slidepdf.com/reader/full/stv-applied-to-2008-result-nov-8-2011 31/47
WAIKATO SOUTH (5 MPs)Party/MMPelectorate
Hamilton West(100%)
HamiltonEast(100%)
Taranaki-KingCountry(40%)
Waikato(30%)
Taupo(20%)
Total
Act 1263 1387 654 626 249 4179Green 1719 2439 643 381 320 5502Labour 12,048 10,420 2738 2184 2072 29,462Maori Party 360 323 131 71 65 950National 15,541 16,745 7693 5560 3800 49,339NZ First 1449 1113 580 512 365 4019Progressive 189 190 77 56 47 559UnitedFuture 378 458 103 86 57 1082
Total 95,092(Q=15,849)
Waikato South preference distribution and results (quota = 15,849)Party First preference vote Remaind
erAct 4179 4179Green 5502 5502 10,327Labour 29,462 (1 elected) ) 13,613 21,364 (1 elected) )
Maori Party 950 950National 49,339 (3 elected) )
1792
NZ First 4019 4019Progressive 559 559UnitedFuture 1082 1082

8/3/2019 STV Applied to 2008 Result Nov 8 2011
http://slidepdf.com/reader/full/stv-applied-to-2008-result-nov-8-2011 32/47
WAIKATO NORTH (5 MPs)Party/MMPelectorate
Hunua (100%) Papakura(100%)
Waikato(70%)
Coromandel (10%)
Botany(10%)
TOTAL
Act 2859 1967 1462 161 153 6602
Green 1168 961 890 277 76 3372Labour 6836 9493 5096 949 796 23,170Maori Party 189 300 165 27 10 691National 21,032 16,672 12,972 1886 1936 54,498NZ First 1516 1643 1196 231 68 4654Progressive 194 254 132 22 22 624UnitedFuture 286 269 285 27 22 889
Total 94500(Q=15,750)
Waikato North preference distribution and results (quota = 15,750)Party First preference vote Remaind
erP, M, U, G, NZF, Avotes *
Act 6602 6602Green 3372 3372Labour 23,170 (1 elected) 7420 14,947
Maori Party 691 691National 54,498 (3 elected)
7248 16,547 (1
elected)
NZ First 4654 4654
Progressive 624 624UnitedFuture 889 889*There is no way Act can overtake L or NClose result in which National narrowly captures last seat to create 4-1 split

8/3/2019 STV Applied to 2008 Result Nov 8 2011
http://slidepdf.com/reader/full/stv-applied-to-2008-result-nov-8-2011 33/47
MANUKAU (5 MPs)Party/MMPelectorate
Mangere (100%) Manurewa(100%)
Manukau East(90%)
Total
Act 280 633 395 1308
Green 511 588 438 1537Labour 15,446 13,673 14,523 43,642Maori Party 241 331 248 820National 4120 7941 5921 17,982NZ First 830 1187 899 2916Progressive 165 276 337 778UnitedFuture 218 170 113 501
69,484(Q=11,581)
Manukau preference distribution and results (quota = 11,581)Party First preference vote RemainderAct 1308 1308Green 1537 1537Labour 43,642 (3 elected)
8899 13,464 (1 elected)
Maori Party 820 820 9601National 17,982 (1 elected) 6401
NZ First 2916 2916
Progressive 778 778UnitedFuture 501 501

8/3/2019 STV Applied to 2008 Result Nov 8 2011
http://slidepdf.com/reader/full/stv-applied-to-2008-result-nov-8-2011 34/47
TAMAKI (5 MPs)Party/MMPelectorates
Pakuranga(100%)
Botany (90%) Tamaki (85%) Maugnakiekie(15%)
Act 2541 1375 2595 238 6749
Green 1273 680 1734 288 3975Labour 7872 7162 6929 2081 24,044Maori Party 106 88 171 36 401National 21,099 17,420 19,724 2235 60,478NZ First 1231 610 811 155 2807Progressive 265 195 160 50 670UnitedFuture 338 198 250 60 846
Total 99,970(Q=16,662)
Tamaki preference distribution and results (quota = 16,662)Party First preference vote Remainder M, P, U, NZF, G, A
votesAct 6749 6749Green 3975 3975Labour 24,044 (1 elected) 7382 14176
Maori Party 401 401National 60,478 (3 elected)
10,492 19,191 (1
elected)
NZ First 2807 2807Progressive 670 670UnitedFuture 846 846

8/3/2019 STV Applied to 2008 Result Nov 8 2011
http://slidepdf.com/reader/full/stv-applied-to-2008-result-nov-8-2011 35/47
ONE TREE HILL (5 MPs)Party/MMPelectorate
Mt Roskill(100%)
Maungakiekie (85%)
New Lynn(72%)
Mt Albert(25%)
ManukauEast (10%)
Total
Act 1165 1351 940 307 44 3807
Green 1459 1633 1932 962 49 6035Labour 14,533 11,792 10,199 3724 1614 41,862Maori Party 163 203 177 68 28 639National 14,346 12,668 10,156 3117 658 40,945NZ First 955 880 902 234 100 3071Progressive 281 284 229 61 37 892UnitedFuture 296 337 213 58 13 917
Total 98,168(Q=16,362)
One Tree Hill preference distribution and results (quota = 16,362)Party First preference vote RemainderAct 3807 3807Green 6035 6035Labour 41,862 (2 elected) 9138 18,143 (1 elected) Maori Party 639 639National 40,945 (2 elected) 8221 14,572
NZ First 3071 3071Progressive 892 892UnitedFuture 917 917

8/3/2019 STV Applied to 2008 Result Nov 8 2011
http://slidepdf.com/reader/full/stv-applied-to-2008-result-nov-8-2011 36/47
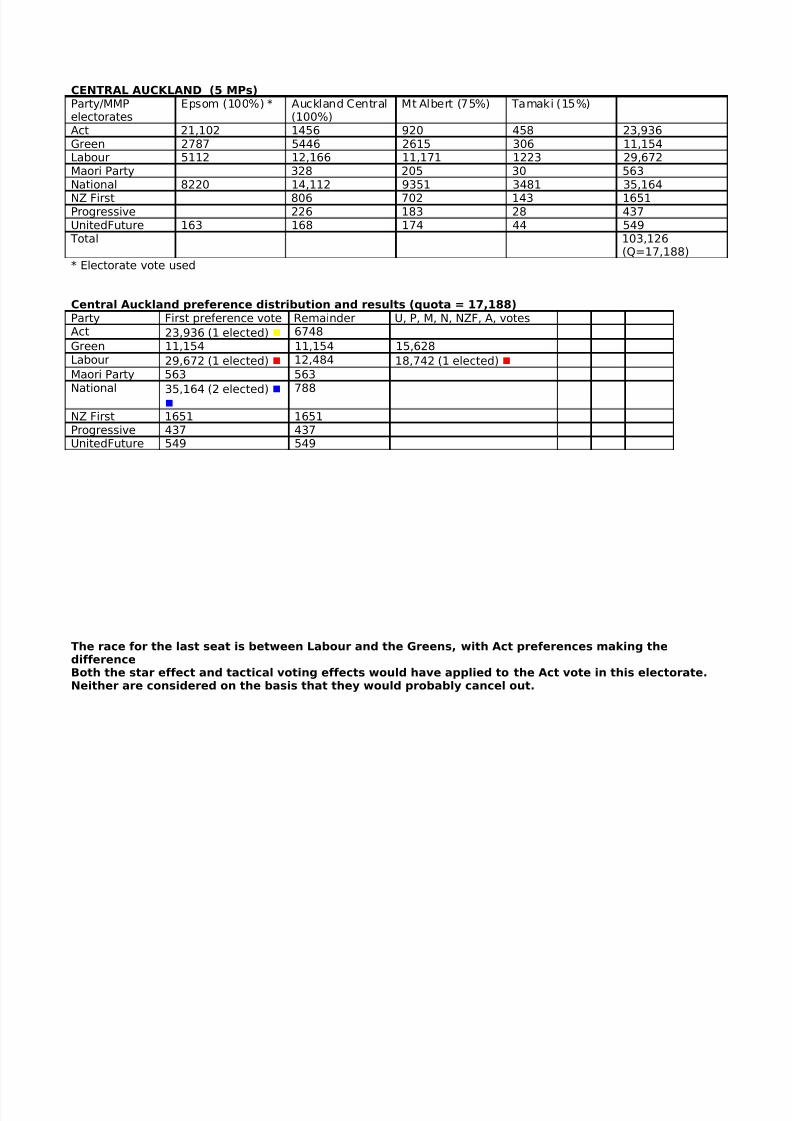
CENTRAL AUCKLAND (5 MPs)Party/MMPelectorates
Epsom (100%) * Auckland Central(100%)
Mt Albert (75%) Tamaki (15%)
Act 21,102 1456 920 458 23,936
Green 2787 5446 2615 306 11,154Labour 5112 12,166 11,171 1223 29,672Maori Party 328 205 30 563National 8220 14,112 9351 3481 35,164NZ First 806 702 143 1651Progressive 226 183 28 437UnitedFuture 163 168 174 44 549
Total 103,126(Q=17,188)
* Electorate vote used
Central Auckland preference distribution and results (quota = 17,188)Party First preference vote Remainder U, P, M, N, NZF, A, votesAct 23,936 (1 elected) 6748
Green 11,154 11,154 15,628Labour 29,672 (1 elected) 12,484 18,742 (1 elected) Maori Party 563 563National 35,164 (2 elected)
788
NZ First 1651 1651Progressive 437 437UnitedFuture 549 549

8/3/2019 STV Applied to 2008 Result Nov 8 2011
http://slidepdf.com/reader/full/stv-applied-to-2008-result-nov-8-2011 37/47
The race for the last seat is between Labour and the Greens, with Act preferences making thedifferenceBoth the star effect and tactical voting effects would have applied to the Act vote in this electorate.Neither are considered on the basis that they would probably cancel out.
8/3/2019 STV Applied to 2008 Result Nov 8 2011
http://slidepdf.com/reader/full/stv-applied-to-2008-result-nov-8-2011 38/47
WAITAKERE (6 MPs)Party/MMPelectorate
Waitakere(100%)
Helensville(100%)
Te Atatu(100%)
New Lynn(28%)
East CoastBays (10%)
Rodney(10%
TOTAL
Act 1067 2481 1002 366 200 250 5366
Green 2032 1814 1270 752 144 197 6209Labour 12,498 6826 13,171 3966 764 784 38,009Maori Party 241 182 264 69 14 18 788National 12, 952 23,559 13,183 3949 2168 2244 58,055NZ First 1117 182 1328 351 100 172 3250Progressive 225 195 267 89 21 20 817UnitedFuture 224 289 278 83 26 29 929
Total 113,423(Q=16,203)
Waitakere preference distribution and results (quota = 16,203)Party First preference vote Remainder P, U, M, G, NZF, Act votesAct 5366 5366Green 6209 6209 6931Labour 38,009 (2 elected)
5603 8872
Maori Party 788 788National 58,055 (3 elected)
9446 16,607 (1 elected)
NZ First 3250 3250
Progressive 817 817UnitedFuture 929 929National narrowly secures the sixth seat to gain a 4-2 split.
8/3/2019 STV Applied to 2008 Result Nov 8 2011
http://slidepdf.com/reader/full/stv-applied-to-2008-result-nov-8-2011 39/47
NORTH SHORE (5 MPs)Party/MMPelectorate
North Shore(100%)
Northcote (100%) East Coast Bays(90%)
Total
Act 2927 1877 1800 6604
Green 2590 2368 1295 6253Labour 8381 10,517 6878 25,776Maori Party 234 227 127 588National 22,738 17,827 19,513 60,078NZ First 1149 1118 901 3168Progressive 165 299 193 657UnitedFuture 370 348 237 955
104,081(Q=17,347)
North Shore preference distribution and results (quota = 17,347)Party First preference vote Remainder M, P, U, NZF, G, A votesAct 6604 6604Green 6253 6253Labour 25,776 (1 elected) 8429 17,632 (1 elected) Maori Party 588 588National 60,078 (3 elected)
8037 17,053
NZ First 3168 3168
Progressive 657 657UnitedFuture 955 955Labour JUST captures the last seat for a 3-2 split to National

8/3/2019 STV Applied to 2008 Result Nov 8 2011
http://slidepdf.com/reader/full/stv-applied-to-2008-result-nov-8-2011 40/47
NORTHLAND (5 MPs)Party/MMPelectorate
Northland (100%) Whangarei(100%)
Rodney (90%)
Act 1443 1385 2246 5074
Green 2514 2187 1772 6473Labour 8573 10,433 7058 26,064Maori Party 507 333 164 1004National 17,703 18,252 20,197 56,152NZ First 2194 2246 1550 5990Progressive 258 531 177 966UnitedFuture 228 260 259 747
102,470(Q=17,079)
Northland preference distribution and results (quota = 17,079)Party First preference vote Remainde
rU, M, Pvotes
Actvotes
G votes NZF votes
Act 5074 5074 5074*Green 6473 6473 6698 6799Labour 26,064 (1 elected) 8985 10,483 10,635 16,618 20,880 (1 elected)
Maori Party 1004 1004National 56,152 (3 elected)
4915 5700 9759 10,302 13,264
NZ First 5990 5990 6193 6954 7225Progressive 966 966

8/3/2019 STV Applied to 2008 Result Nov 8 2011
http://slidepdf.com/reader/full/stv-applied-to-2008-result-nov-8-2011 41/47
UnitedFuture 747 747* No votes transferred to Act as obvious Act will not stay ahead of National – simplifies calculation

8/3/2019 STV Applied to 2008 Result Nov 8 2011
http://slidepdf.com/reader/full/stv-applied-to-2008-result-nov-8-2011 42/47
SOUTHERN MAORI (5 MPs)Party/MMPelectorates
Te Tai Tonga(100%)*
Te Tai Hauauru(100%)*
Ikaroa Rawhiti(100%)*
Act
Green 2076 1070 3146Labour 7962 5589 9927 23,478Maori Party 9011 13,406 8282 30,699NationalNZ FirstProgressiveUnitedFuture
Total 57,323 (Q=9554)* Electorate vote used
Southern Maori preference distribution and results (quota = 9554)Party First preference vote Remainder
ActGreen 3146Labour 23,478 (2 elected) Maori Party 30,699 (3 elected) NationalNZ FirstProgressive
UnitedFutureAll seats allocated on first preferences

8/3/2019 STV Applied to 2008 Result Nov 8 2011
http://slidepdf.com/reader/full/stv-applied-to-2008-result-nov-8-2011 43/47
NORTHERN MAORI (7 MPs)Party/MMPelectorates
Waiariki(100%)*
Hauraki-Waikato(100%)*
TamakiMakauru(100%)*
Te Tai Tokerau(100%)*
Total
Act 680 680Green 931 931Labour 5969 9349 5336 5711 26,365Maori Party 12, 781 8461 12,876 12,019 46,137NationalNZ FirstProgressiveUnitedFuture
Total 74,113(Q=9265)
Northern Maori preference distribution and results (quota = 9265)Party First preference vote Remainder A, G votesAct 680 680Green 931 931Labour 26,365 (2 elected) 7835 8505
Maori Party 46,137 (4 elected) 9077 10,017 (1 elected) NationalNZ First
ProgressiveUnitedFuture

8/3/2019 STV Applied to 2008 Result Nov 8 2011
http://slidepdf.com/reader/full/stv-applied-to-2008-result-nov-8-2011 44/47
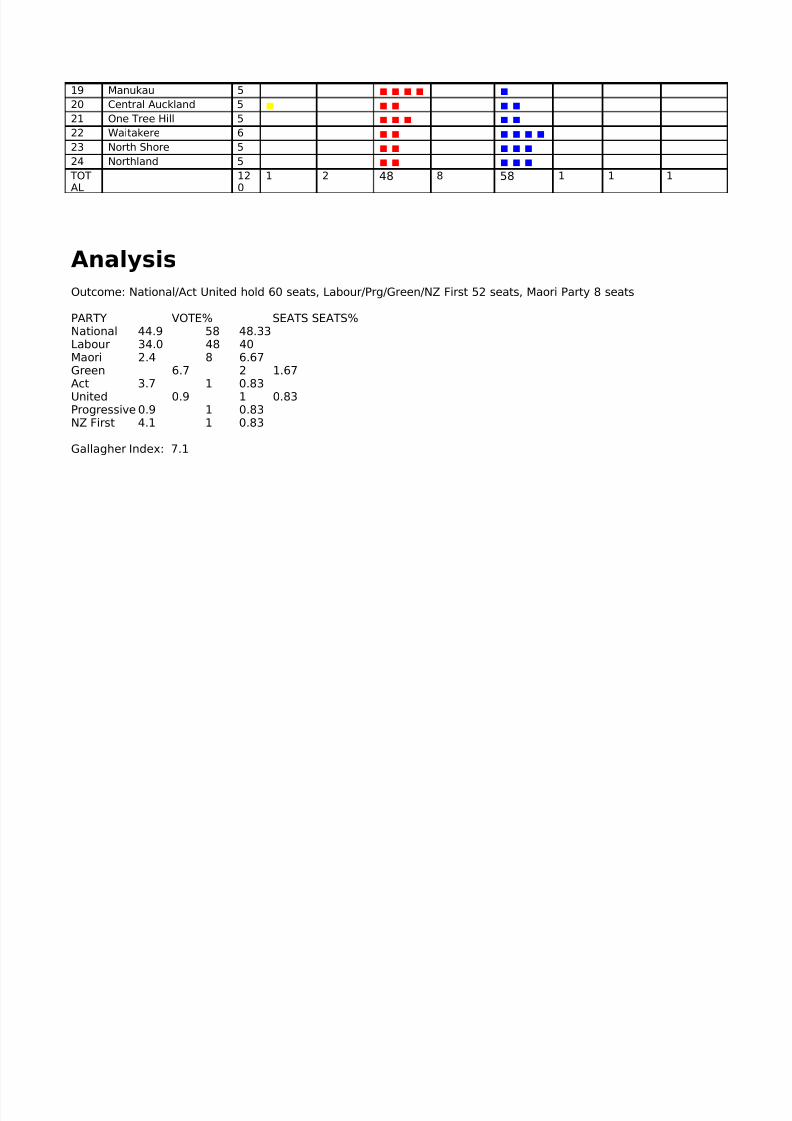
Summary of electorate results
STV electorate MPs
Act Green Labour Maori National NZFirst
Progressive
UnitedFuture
1 Northern Maori 7
2 Southern Maori 5 3 Southland 3 4 Otago 5 5 Canterbury-West
Coast5
6 Christchurch South 5
7 Christchurch North 5 8 Top of the South 4 9 Wellington 5
10 Hutt-Porirua 5 11 Manawatu 5 12 West Central 5 13 Hawke’s Bay-
Wairarapa5
14 East Cape 5 15 Kaimai 5
16 Waikato South 5 17 Waikato North 5 18 Tamaki 5

8/3/2019 STV Applied to 2008 Result Nov 8 2011
http://slidepdf.com/reader/full/stv-applied-to-2008-result-nov-8-2011 45/47
19 Manukau 5 20 Central Auckland 5 21 One Tree Hill 5 22 Waitakere 6
23 North Shore 5 24 Northland 5 TOTAL
120
1 2 48 8 58 1 1 1
Analysis
Outcome: National/Act United hold 60 seats, Labour/Prg/Green/NZ First 52 seats, Maori Party 8 seats
PARTY VOTE% SEATS SEATS%National 44.9 58 48.33Labour 34.0 48 40Maori 2.4 8 6.67Green 6.7 2 1.67Act 3.7 1 0.83United 0.9 1 0.83Progressive 0.9 1 0.83
NZ First 4.1 1 0.83
Gallagher Index: 7.1

8/3/2019 STV Applied to 2008 Result Nov 8 2011
http://slidepdf.com/reader/full/stv-applied-to-2008-result-nov-8-2011 46/47
Underperformance of NationalNational beats Labour by 10.9% in vote share, but by only 8.3% in seats. Despite National/Act/United winning49.5% of the vote to other parties’ 48.1 the two blocks get equal seats. Why? Essentially because electorates arebased on electoral population, not on votes. Labour wins 4 seats in Manukau on a quota of only 11,581, while
National’s 4 seats in neighbouring Tamaki come at a quota of 16,662. Labour wins 4 of the Maori seats at quotas of 9554 and 9265, and the Maori Party wins seven seats at these prices, while National gets none so cheap.
Sensitive dependence on boundaries The STV electorates described above have been devised with careful attention to geography, community of interest and other relevant criteria from the Electoral Act in addition to the set mathematical formulae.Nevertheless they are only a might-have-been. Someone else might have come up with a different set of solutionsto those equations. While some electorates would have to be pretty close to those described, there are other caseswhere radically alternatives are possible. This can affect the results.For example, in the upper South Island there is a 5-member Canterbury-Westland electorate and a 4-member Top-of-the-South electorate. It is perfectly feasible for this to be reversed, with a 4-member Canterbury electorate and
a 5-member Top-of-the-South-West Coast electorate. Instead of being split 3-2 and 2-2, the alternative wouldprobably be split 3-1 and 3-2, meaning one more seat for National without any change in the votes. Smallboundary changes in other marginal seats could also change results.
Marginal electoratesA near-necessary feature of STV is that with only 24 electorates there can only be a few real marginal seats (whichexacerbates sensitivity to electorate boundaries). In this model there are only four really close results:
• Otago – where the Green Party narrowly pips Labour for the last seat (2N, 2L, 1G)
• Waikato North – where National narrowly pips Labour for the last seat (4N, 1L)
• Waitakere – where National narrowly pips Labour for the last seat (4N, 2L)• North Shore – where Labour narrowly pips National for the last seat (3N, 2L)
Special factors

8/3/2019 STV Applied to 2008 Result Nov 8 2011
http://slidepdf.com/reader/full/stv-applied-to-2008-result-nov-8-2011 47/47
There are several electorates where special factors are clearly at play in the 2008 result
• Central Auckland (Rodney Hide)
• Wellington (Peter Dunne)
• Kaimai (Winston Peters)
• Christchurch South (Jim Anderton) This means that the results ascribed to those electorates (especially Wellington) rest on shaky foundations. I thinkthe results given are what probably would have happened, but these results are wide open for debate.
ErrorsI acknowledge that this modelling probably contains mathematical mistakes, certainly contains many arbitraryassumptions and shortcuts have often been taken in calculations. I am optimistic, however, that any errorsintroduced are non-significant. The work required to eliminate known sources of possible error is not feasible forme to undertake (it would probably multiply the time taken to complete the work by a factor of ten), and would beessentially trivial in the face of large and irreducible sources of uncertainty such as how Act Party preferences
would divide between NZ First and the Green Party.
Stephen Russell, November 2011