Studying Optimal Design of Strict Fractional Frequency ...Studying Optimal Design of Strict...
5
International Journal of Computer Applications (0975 – 8887) Volume 116 – No. 1, April 2015 28 Studying Optimal Design of Strict Fractional Frequency Reuse in OFDMA Cellular System Mahmoud Nagieb, Mona Shokair and Waleed Saad Faculty of Electronic Engineering, El-Menoufia University, Menouf, 32952, Egypt ABSTRACT The key characteristic of a cellular network is the ability to reuse frequencies to increase both coverage and capacity. Fractional frequency reuse (FFR) is considered to be an efficient inter-cell interference coordination technique well- suited for OFDMA based on wireless communication networks where the cells are partitioned into spatial regions with different frequency reuse factors. In this paper, evaluating strict FFR which represents a type of FFR deployments is presented with four different system models by changing the inner-cell shape for each model. System simulations are used to compare and evaluate the effect of changing the inner-cell shape based on strict FFR performance which performed using dense Monte Carlo simulations. In addition, the effects of some system model parameters are discussed. Keywords OFDMA, Fractional Frequency Reuse 1. INTRODUCTION Using frequency reuse of one in LTE supports Orthogonal Frequency Reuse (OFDMA) which means that all cells operate on the same frequency channel is to maximize spectral efficiency. Because of the using of OFDMA, intra- cell users are assumed to be orthogonal to each other and the primary source of interference is inter-cell interference [1]. FFR has been proposed as an ICIC technique in OFDMA based wireless networks that improves network performance [2] [3]. The basic mechanism of FFR corresponds to partitioning the macro-cell service area into spatial regions [4], and each sub-region is assigned with different frequency sub-bands. Therefore, cell edge-zone users do not interfere with center-zone users. As a result, the cell-edge-zone users receive an acceptable signal quality, which subsequently reduces the blocking probability and increases the network capacity. The FFR scheme operates on a relatively large time scale. This is referred to as a static FFR scheme. In contrast, dynamic FFR schemes can operate on short timescales and can be optimized for system utility with varying network dynamics. However, they are more complex and less scalable than static schemes. There are three FFR schemes presented for OFDMA based networks: strict FFR, soft FFR and FFR3 [5]. Strict FFR is a modification of the traditional frequency reuse used in multi-cell networks. Fig. 1 illustrates a strict FFR deployment with a cell-edge-reuse factor of N= 3. Users in each inner cells share the same sub-band frequencies while cell-edge users, bandwidth is partitioned across cells based on reuse factor of N. Strict FFR requires a total of N+1 sub-bands [6]. Fig. 1 Strict FFR deployment with N =3 cell edge reuse factor. Soft FFR uses a cell partitioning technique similar to that of the strict FFR scheme. However, the center zone users are allowed to use the sub-bands of cell-edge zone of the neighboring cells within the cluster. In this scheme, one of the major advantages of soft FFR is that it has better spectrum efficiency than strict FFR . FFR-3, the macro-cell coverage area is partitioned into center and edge zones, including three sectors each. The entire frequency band is divided into two parts, one part is solely assigned to the center zone and the other part is partitioned into three sub-bands assigned to the three edge zones. In this paper, the main goals of our strict FFR based LTE network model are reaching to the best design for strict FFR system to maximize throughput, minimize blocking probability and achieve best quality of service at the system. This is done by changing center zone cell shape and obtaining the best performance. The previous researchers concentrated on the trade-offs associated with strict FFR and soft FFR systems in comparison with universal frequency reuse and sensitivity to the interior radius selection [7]. Also, they focused on optimal design of FFR systems by utilizing advanced techniques such as graph theory [8] and convex optimization [9] [10] to maximize network throughput. No one has studied the performance while changing the inner cell shape which will be focused by this paper. The rest of the paper is organized as follows, the system model, its specifications and mathematical analysis will be presented in Section 1. Then, Simulation results and its discussion will be investigated in Section 2. Afterwards, the discussions of the simulation results will be discussed in Section 3. Finally, conclusions will be made in Section 4.
Transcript of Studying Optimal Design of Strict Fractional Frequency ...Studying Optimal Design of Strict...
International Journal of Computer Applications (0975 – 8887)
Volume 116 – No. 1, April 2015
28
Studying Optimal Design of Strict Fractional Frequency
Reuse in OFDMA Cellular System
Mahmoud Nagieb, Mona Shokair and Waleed Saad Faculty of Electronic Engineering,
El-Menoufia University, Menouf, 32952, Egypt
ABSTRACT The key characteristic of a cellular network is the ability to
reuse frequencies to increase both coverage and capacity.
Fractional frequency reuse (FFR) is considered to be an
efficient inter-cell interference coordination technique well-
suited for OFDMA based on wireless communication
networks where the cells are partitioned into spatial regions
with different frequency reuse factors. In this paper,
evaluating strict FFR which represents a type of FFR
deployments is presented with four different system models
by changing the inner-cell shape for each model. System
simulations are used to compare and evaluate the effect of
changing the inner-cell shape based on strict FFR
performance which performed using dense Monte Carlo
simulations. In addition, the effects of some system model
parameters are discussed.
Keywords OFDMA, Fractional Frequency Reuse
1. INTRODUCTION Using frequency reuse of one in LTE supports Orthogonal
Frequency Reuse (OFDMA) which means that all cells
operate on the same frequency channel is to maximize
spectral efficiency. Because of the using of OFDMA, intra-
cell users are assumed to be orthogonal to each other and the
primary source of interference is inter-cell interference [1].
FFR has been proposed as an ICIC technique in OFDMA
based wireless networks that improves network performance
[2] [3]. The basic mechanism of FFR corresponds to
partitioning the macro-cell service area into spatial regions
[4], and each sub-region is assigned with different frequency
sub-bands. Therefore, cell edge-zone users do not interfere
with center-zone users. As a result, the cell-edge-zone users
receive an acceptable signal quality, which subsequently
reduces the blocking probability and increases the network
capacity. The FFR scheme operates on a relatively large time
scale. This is referred to as a static FFR scheme. In contrast,
dynamic FFR schemes can operate on short timescales and
can be optimized for system utility with varying network
dynamics. However, they are more complex and less scalable
than static schemes.
There are three FFR schemes presented for OFDMA based
networks: strict FFR, soft FFR and FFR3 [5].
Strict FFR is a modification of the traditional frequency
reuse used in multi-cell networks. Fig. 1 illustrates a strict
FFR deployment with a cell-edge-reuse factor of N= 3. Users
in each inner cells share the same sub-band frequencies while
cell-edge users, bandwidth is partitioned across cells based on
reuse factor of N. Strict FFR requires a total of N+1 sub-bands
[6].
Fig. 1 Strict FFR deployment with N =3 cell edge reuse
factor.
Soft FFR uses a cell partitioning technique similar to that of
the strict FFR scheme. However, the center zone users are
allowed to use the sub-bands of cell-edge zone of the
neighboring cells within the cluster. In this scheme, one of the
major advantages of soft FFR is that it has better spectrum
efficiency than strict FFR .
FFR-3, the macro-cell coverage area is partitioned into center
and edge zones, including three sectors each. The entire
frequency band is divided into two parts, one part is solely
assigned to the center zone and the other part is partitioned
into three sub-bands assigned to the three edge zones.
In this paper, the main goals of our strict FFR based LTE
network model are reaching to the best design for strict FFR
system to maximize throughput, minimize blocking
probability and achieve best quality of service at the system.
This is done by changing center zone cell shape and obtaining
the best performance.
The previous researchers concentrated on the trade-offs
associated with strict FFR and soft FFR systems in
comparison with universal frequency reuse and sensitivity to
the interior radius selection [7]. Also, they focused on optimal
design of FFR systems by utilizing advanced techniques such
as graph theory [8] and convex optimization [9] [10] to
maximize network throughput. No one has studied the
performance while changing the inner cell shape which will
be focused by this paper.
The rest of the paper is organized as follows, the system
model, its specifications and mathematical analysis will be
presented in Section 1. Then, Simulation results and its
discussion will be investigated in Section 2. Afterwards, the
discussions of the simulation results will be discussed in
Section 3. Finally, conclusions will be made in Section 4.
International Journal of Computer Applications (0975 – 8887)
Volume 116 – No. 1, April 2015
29
2. SYSTEM MODEL The system model typically assumed for strict FFR over LTE
standard. Our model is shown in Fig. 1. It consists of three
macro cells in which each cell is partitioned into center and
edge zone. The resource allocation between interior and cell-
edge users is proportional to the square of the ratio of interior
radius and the cell radius is represented by R. this is when
user locations are assumed to be uniformly distributed [11].
One of the most important design parameters here is the
radius of the center zone of the macro-cell. Using Monte
Carlo simulations, it was shown in [5] that, for uniformly
users distributions. If the cell-center zone radius (rcenter) is
0.65 times the macro-cell radius (R). The average network
throughput is maximized. Therefore, the ratio of (rint/R)
=0,65. With Nband total sub-bands available to the cell, the
allocation of sub-bands available for the interior users is Nint
and exterior users Next is given as,
Nint = Nband (rint
R)2 (1)
Next = (Nband − Nint )/3 (2)
In this scheme, the cell-edge users are not interfered with each
other, this reduces the inter-cell interference. Also, since the
center-zone and edge zone users use different sub-bands,
intra-cell interference is mitigated. In contrast, center-zone
users will suffer from inter-cell interference because of using
the same band.
The associated signal to interference plus noise ratio (SINR)
for user y served by base station x for strict FFR is given as
[7]
SINy = Phxy Gxy
σ2 + Phzy GzyzϵZ (3)
Where P is the transmit power of the base station, hxy is the
exponentially distributed channel fading power, and Gxy is
the path loss associated with the channel between user y and
base station x, and σ2 is the noise power. The set Z represents
the entire interfering base stations, i.e. base stations that are
using the same sub-band as user y. the path-loss factor Gxy
between a base station and user is based on the simple
exponential path-loss expression:
Gxy = x − y −α ,
where α is the desired path-loss exponent and equal to 4 [7].
For frequency channel allocation in inner-cell users, SINRth
is selected to be the reference for SINRy and SINRy to be
compared with it. The decision about the channel frequency
assignment is determined by the following, SINRy > SINRth.
Then, the frequency channel is selected.
3. SIMULATION RESULTS
3.1. Simulation Setup Several Monte Carlo MATLAB simulation experiments are
made to study the performance of strict FFR system models.
The simulation parameters are illustrated in Table 1.
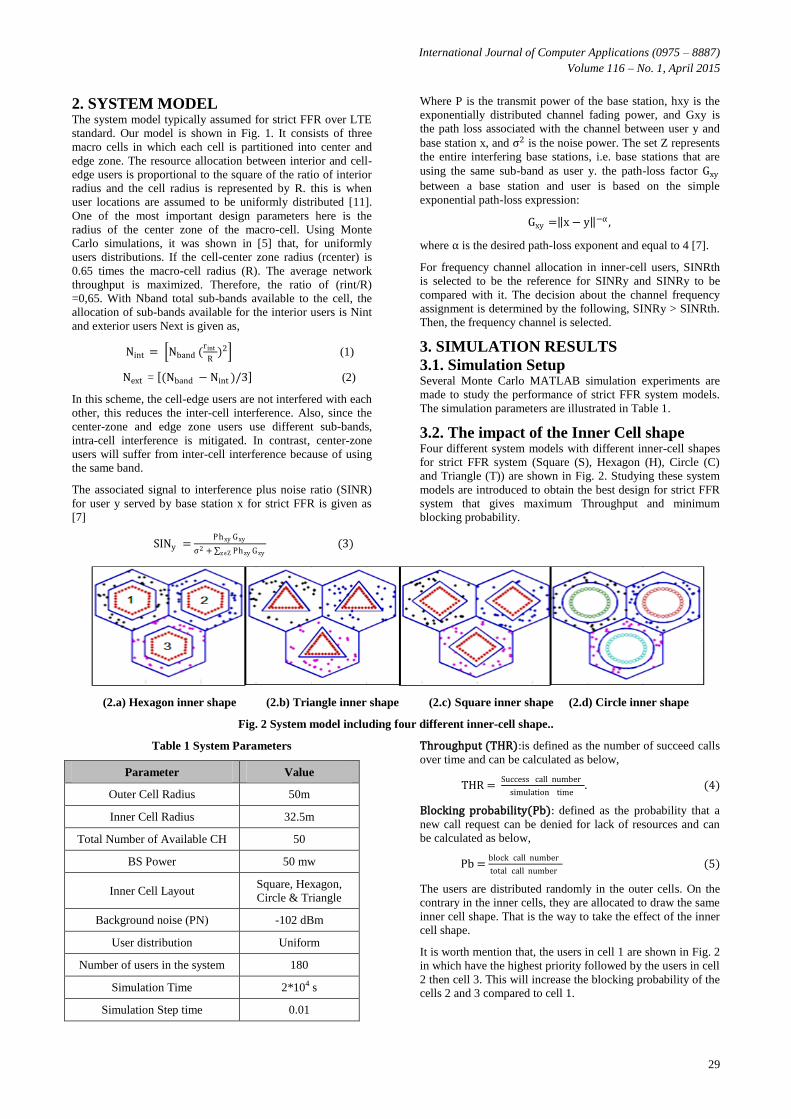
3.2. The impact of the Inner Cell shape Four different system models with different inner-cell shapes
for strict FFR system (Square (S), Hexagon (H), Circle (C)
and Triangle (T)) are shown in Fig. 2. Studying these system
models are introduced to obtain the best design for strict FFR
system that gives maximum Throughput and minimum
blocking probability.
(2.a) Hexagon inner shape (2.b) Triangle inner shape (2.c) Square inner shape (2.d) Circle inner shape
Fig. 2 System model including four different inner-cell shape..
Table 1 System Parameters
Parameter Value
Outer Cell Radius 50m
Inner Cell Radius 32.5m
Total Number of Available CH 50
BS Power 50 mw
Inner Cell Layout Square, Hexagon,
Circle & Triangle
Background noise (PN) -102 dBm
User distribution Uniform
Number of users in the system 180
Simulation Time 2*104 s
Simulation Step time 0.01
Throughput (THR):is defined as the number of succeed calls
over time and can be calculated as below,
THR = Success call number
simulation time. (4)
Blocking probability(Pb): defined as the probability that a
new call request can be denied for lack of resources and can
be calculated as below,
Pb = block call number
total call number (5)
The users are distributed randomly in the outer cells. On the
contrary in the inner cells, they are allocated to draw the same
inner cell shape. That is the way to take the effect of the inner
cell shape.
It is worth mention that, the users in cell 1 are shown in Fig. 2
in which have the highest priority followed by the users in cell
2 then cell 3. This will increase the blocking probability of the
cells 2 and 3 compared to cell 1.
International Journal of Computer Applications (0975 – 8887)
Volume 116 – No. 1, April 2015
30
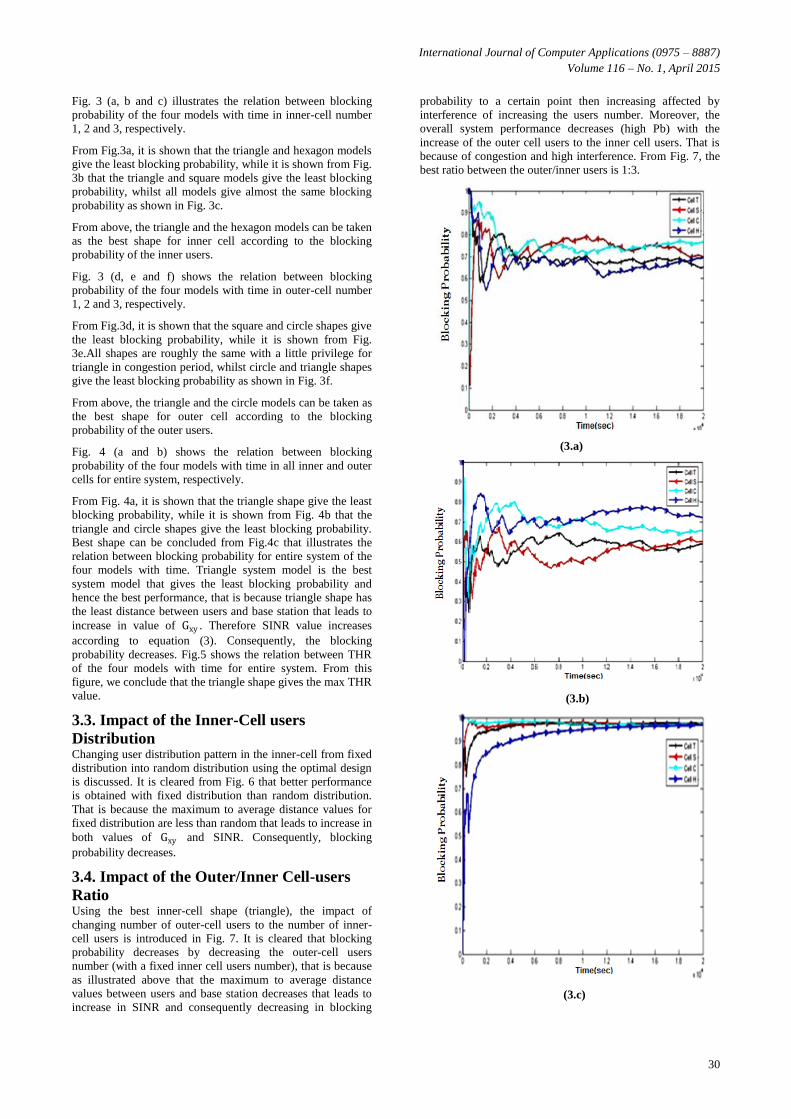
Fig. 3 (a, b and c) illustrates the relation between blocking
probability of the four models with time in inner-cell number
1, 2 and 3, respectively.
From Fig.3a, it is shown that the triangle and hexagon models
give the least blocking probability, while it is shown from Fig.
3b that the triangle and square models give the least blocking
probability, whilst all models give almost the same blocking
probability as shown in Fig. 3c.
From above, the triangle and the hexagon models can be taken
as the best shape for inner cell according to the blocking
probability of the inner users.
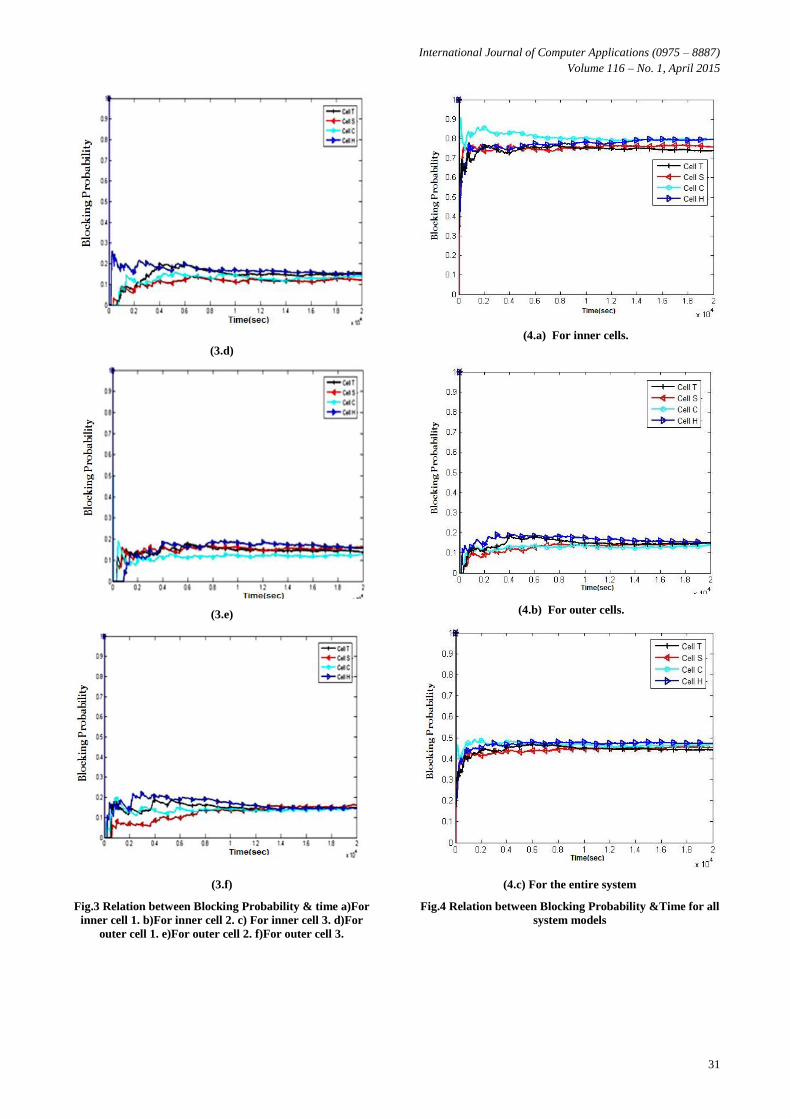
Fig. 3 (d, e and f) shows the relation between blocking
probability of the four models with time in outer-cell number
1, 2 and 3, respectively.
From Fig.3d, it is shown that the square and circle shapes give
the least blocking probability, while it is shown from Fig.
3e.All shapes are roughly the same with a little privilege for
triangle in congestion period, whilst circle and triangle shapes
give the least blocking probability as shown in Fig. 3f.
From above, the triangle and the circle models can be taken as
the best shape for outer cell according to the blocking
probability of the outer users.
Fig. 4 (a and b) shows the relation between blocking
probability of the four models with time in all inner and outer
cells for entire system, respectively.
From Fig. 4a, it is shown that the triangle shape give the least
blocking probability, while it is shown from Fig. 4b that the
triangle and circle shapes give the least blocking probability.
Best shape can be concluded from Fig.4c that illustrates the
relation between blocking probability for entire system of the
four models with time. Triangle system model is the best
system model that gives the least blocking probability and
hence the best performance, that is because triangle shape has
the least distance between users and base station that leads to
increase in value of Gxy . Therefore SINR value increases
according to equation (3). Consequently, the blocking
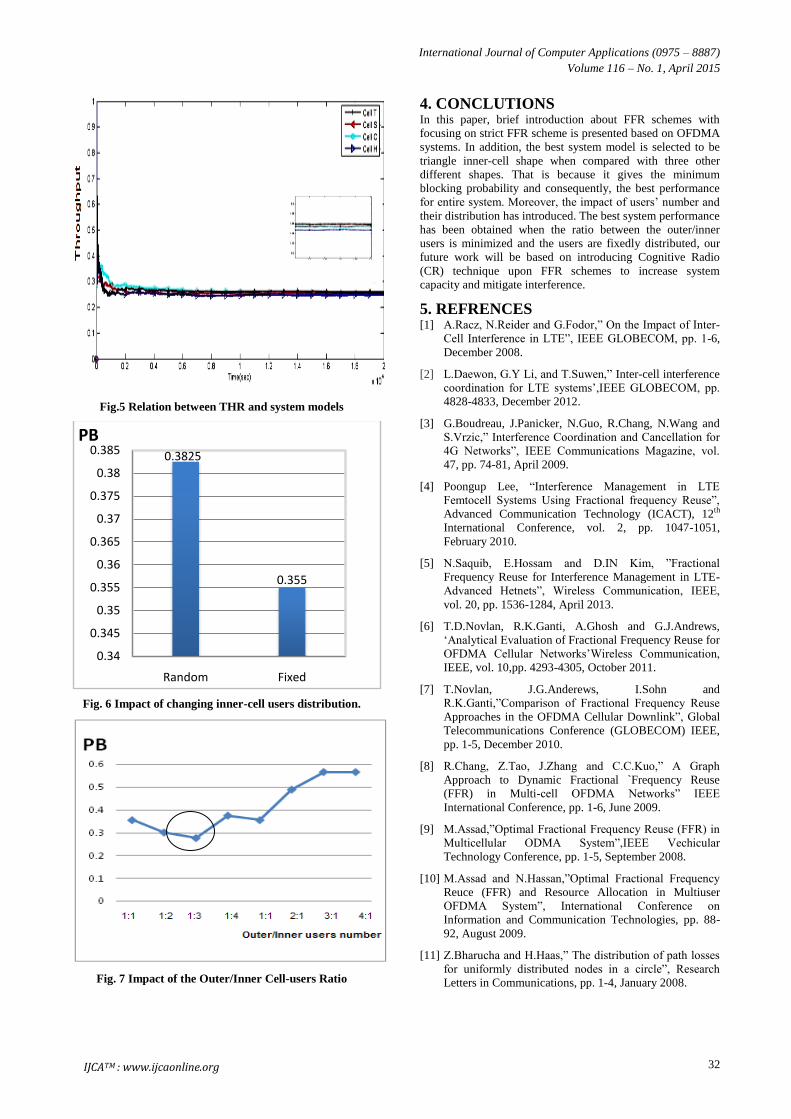
probability decreases. Fig.5 shows the relation between THR
of the four models with time for entire system. From this
figure, we conclude that the triangle shape gives the max THR
value.
3.3. Impact of the Inner-Cell users
Distribution Changing user distribution pattern in the inner-cell from fixed
distribution into random distribution using the optimal design
is discussed. It is cleared from Fig. 6 that better performance
is obtained with fixed distribution than random distribution.
That is because the maximum to average distance values for
fixed distribution are less than random that leads to increase in
both values of Gxy and SINR. Consequently, blocking
probability decreases.
3.4. Impact of the Outer/Inner Cell-users
Ratio Using the best inner-cell shape (triangle), the impact of
changing number of outer-cell users to the number of inner-
cell users is introduced in Fig. 7. It is cleared that blocking
probability decreases by decreasing the outer-cell users
number (with a fixed inner cell users number), that is because
as illustrated above that the maximum to average distance
values between users and base station decreases that leads to
increase in SINR and consequently decreasing in blocking
probability to a certain point then increasing affected by
interference of increasing the users number. Moreover, the
overall system performance decreases (high Pb) with the
increase of the outer cell users to the inner cell users. That is
because of congestion and high interference. From Fig. 7, the
best ratio between the outer/inner users is 1:3.
(3.a)
(3.b)
(3.c)
International Journal of Computer Applications (0975 – 8887)
Volume 116 – No. 1, April 2015
31
(4.a) For inner cells.
(3.d)
(3.e)
(4.b) For outer cells.
(3.f)
Fig.3 Relation between Blocking Probability & time a)For
inner cell 1. b)For inner cell 2. c) For inner cell 3. d)For
outer cell 1. e)For outer cell 2. f)For outer cell 3.
(4.c) For the entire system
Fig.4 Relation between Blocking Probability &Time for all
system models
International Journal of Computer Applications (0975 – 8887)
Volume 116 – No. 1, April 2015
32
Fig.5 Relation between THR and system models
Fig. 6 Impact of changing inner-cell users distribution.
Fig. 7 Impact of the Outer/Inner Cell-users Ratio
4. CONCLUTIONS In this paper, brief introduction about FFR schemes with
focusing on strict FFR scheme is presented based on OFDMA
systems. In addition, the best system model is selected to be
triangle inner-cell shape when compared with three other
different shapes. That is because it gives the minimum
blocking probability and consequently, the best performance
for entire system. Moreover, the impact of users‟ number and
their distribution has introduced. The best system performance
has been obtained when the ratio between the outer/inner
users is minimized and the users are fixedly distributed, our
future work will be based on introducing Cognitive Radio
(CR) technique upon FFR schemes to increase system
capacity and mitigate interference.
5. REFRENCES [1] A.Racz, N.Reider and G.Fodor,” On the Impact of Inter-
Cell Interference in LTE”, IEEE GLOBECOM, pp. 1-6,
December 2008.
[2] L.Daewon, G.Y Li, and T.Suwen,” Inter-cell interference
coordination for LTE systems‟,IEEE GLOBECOM, pp.
4828-4833, December 2012.
[3] G.Boudreau, J.Panicker, N.Guo, R.Chang, N.Wang and
S.Vrzic,” Interference Coordination and Cancellation for
4G Networks”, IEEE Communications Magazine, vol.
47, pp. 74-81, April 2009.
[4] Poongup Lee, “Interference Management in LTE
Femtocell Systems Using Fractional frequency Reuse”,
Advanced Communication Technology (ICACT), 12th
International Conference, vol. 2, pp. 1047-1051,
February 2010.
[5] N.Saquib, E.Hossam and D.IN Kim, ”Fractional
Frequency Reuse for Interference Management in LTE-
Advanced Hetnets”, Wireless Communication, IEEE,
vol. 20, pp. 1536-1284, April 2013.
[6] T.D.Novlan, R.K.Ganti, A.Ghosh and G.J.Andrews,
„Analytical Evaluation of Fractional Frequency Reuse for
OFDMA Cellular Networks‟Wireless Communication,
IEEE, vol. 10,pp. 4293-4305, October 2011.
[7] T.Novlan, J.G.Anderews, I.Sohn and
R.K.Ganti,”Comparison of Fractional Frequency Reuse
Approaches in the OFDMA Cellular Downlink”, Global
Telecommunications Conference (GLOBECOM) IEEE,
pp. 1-5, December 2010.
[8] R.Chang, Z.Tao, J.Zhang and C.C.Kuo,” A Graph
Approach to Dynamic Fractional `Frequency Reuse
(FFR) in Multi-cell OFDMA Networks” IEEE
International Conference, pp. 1-6, June 2009.
[9] M.Assad,”Optimal Fractional Frequency Reuse (FFR) in
Multicellular ODMA System”,IEEE Vechicular
Technology Conference, pp. 1-5, September 2008.
[10] M.Assad and N.Hassan,”Optimal Fractional Frequency
Reuce (FFR) and Resource Allocation in Multiuser
OFDMA System”, International Conference on
Information and Communication Technologies, pp. 88-
92, August 2009.
[11] Z.Bharucha and H.Haas,” The distribution of path losses
for uniformly distributed nodes in a circle”, Research
Letters in Communications, pp. 1-4, January 2008.
0.3825
0.355
0.34
0.345
0.35
0.355
0.36
0.365
0.37
0.375
0.38
0.385
Random Fixed
PB
IJCATM : www.ijcaonline.org


![Fractional Cascading Fractional Cascading I: A Data Structuring Technique Fractional Cascading II: Applications [Chazaelle & Guibas 1986] Dynamic Fractional.](https://static.fdocuments.in/doc/165x107/56649ea25503460f94ba64dd/fractional-cascading-fractional-cascading-i-a-data-structuring-technique-fractional.jpg)