Study the Oxidative Stress Statues in Cardiovascular and ...
127
Republic of Iraq Ministry of Higher Education and Scientific Research Al-Nahrain University College of Science Department of Chemistry Study the Oxidative Stress Statues in Cardiovascular and Hypertension Diseases in Female Patients A Thesis Submitted to the College of Science/Al-Nahrain University as a Partial Fulfillment of the Requirements for the Degree of M.Sc. in Chemistry By Yasmeen Muhialdeen Hussein B.Sc. Chemistry/ College of Science/ Al-Nahrain University (2012) Supervised by Assist. Prof. Dr. Alaa Hussein Jawad April 2015 Jumada II 1436
Transcript of Study the Oxidative Stress Statues in Cardiovascular and ...
Republic of Iraq
Ministry of Higher Education
and Scientific Research
Al-Nahrain University
College of Science
Department of Chemistry
Study the Oxidative Stress Statues in
Cardiovascular and Hypertension Diseases in
Female Patients
A Thesis Submitted to the College of Science/Al-Nahrain
University as a Partial Fulfillment of the Requirements for the
Degree of M.Sc. in Chemistry
By
Yasmeen Muhialdeen Hussein
B.Sc. Chemistry/ College of Science/ Al-Nahrain University (2012)
Supervised by
Assist. Prof. Dr. Alaa Hussein Jawad
April 2015 Jumada II 1436

I
Dedication
To The Realest And Purest Love In
The World
Mother
And To All My Family
And to my country Iraq
And to Iraqi soldiers, those who far from as
now but keeping us continue life
Yasmeen
Acknowledgment
First of all I would like to thank our God for his merciful and
continuous help through my life.
I am very thankful for chemistry department of college of
science of al-Nahrain University for give me research part.
I thank Dr Alaa the supervisor for my study.
I am very grateful for friendly assistance and continuous
kindly advices by Dr. Perry Habeeb in different stages along
this study.
I also very thankful to staff of Ibn Al-Nafese for their help
to gain and stored sample in my study.
I am very thankful to Dr. Wisam for his continuous
advice through study.
I would like to thank Mr. Zaid N. Abbas for his big
assistance in molecular study.
I would like to thank Dr. Rasha Saad for her facilitate to
gain close access papers.
I am specially thankful to my friend Ala'a for her
assistance and kind standing behind me along study.
Appreciable thanks are to those brave men on the fire
borders, saving their citizens, families, and land, make us
continue life, work and study, sacrificing their own souls,
they deserve our success as a gift.
Supervisor Certification
I certify that this thesis entitled " Study the Oxidative Stress Statues in
Cardiovascular and Hypertension Diseases in Female Patients " was prepared
by "Yasmeen Muhialdeen Hussein" under my supervision at the
College of Science/ Al-Nahrain University as a partial requirements for
the Degree of Master of Science in Chemistry.
Signature:
Name: Dr. Alaa Hussein Jawad
Scientific degree: Assistant Professor
Date: / /2015
In view of the available recommendation, I forward this
thesis for debate by the Examining Committee.
Signature:
Name: Dr. Nasreen R. Jber
Scientific Degree :Assistant Professor
Head of Department Chemistry
College of Science
Al Nahrain University
XII
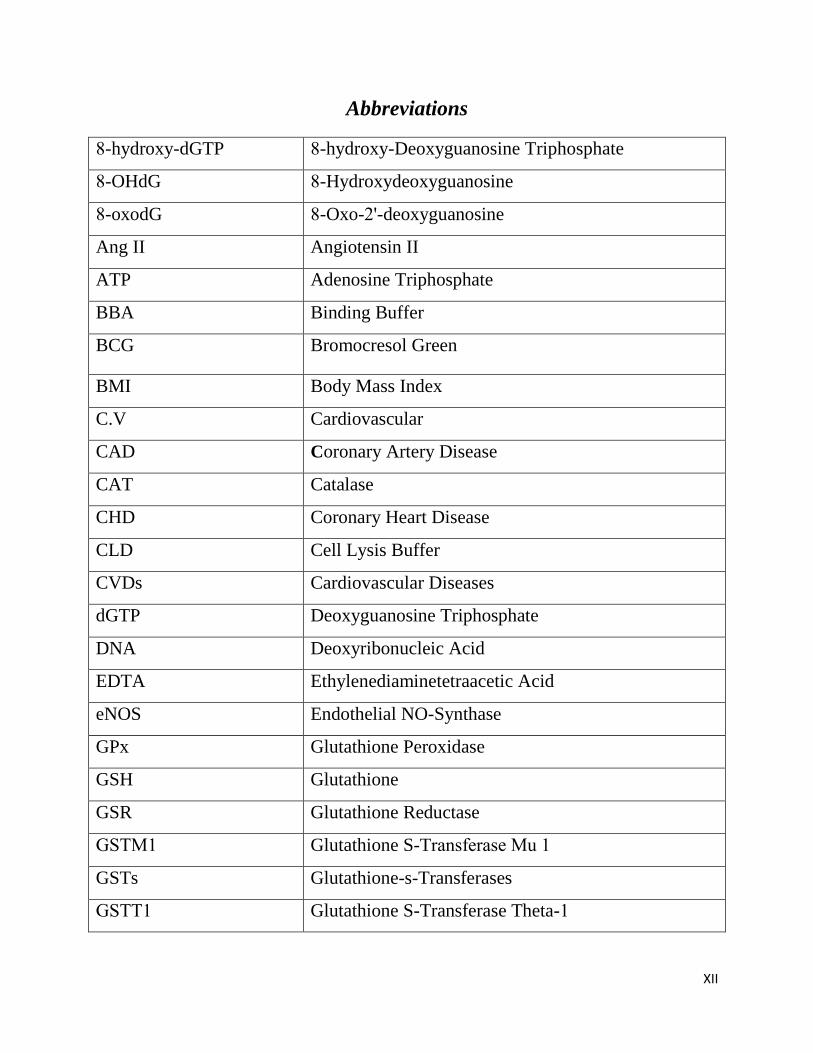
Abbreviations
8-hydroxy-dGTP 8-hydroxy-Deoxyguanosine Triphosphate
8-OHdG 8-Hydroxydeoxyguanosine
8-oxodG 8-Oxo-2'-deoxyguanosine
Ang II Angiotensin II
ATP Adenosine Triphosphate
BBA Binding Buffer
BCG Bromocresol Green
BMI Body Mass Index
C.V Cardiovascular
CAD Coronary Artery Disease
CAT Catalase
CHD Coronary Heart Disease
CLD Cell Lysis Buffer
CVDs Cardiovascular Diseases
dGTP Deoxyguanosine Triphosphate
DNA Deoxyribonucleic Acid
EDTA Ethylenediaminetetraacetic Acid
eNOS Endothelial NO-Synthase
GPx Glutathione Peroxidase
GSH Glutathione
GSR Glutathione Reductase
GSTM1 Glutathione S-Transferase Mu 1
GSTs Glutathione-s-Transferases
GSTT1 Glutathione S-Transferase Theta-1
XIII
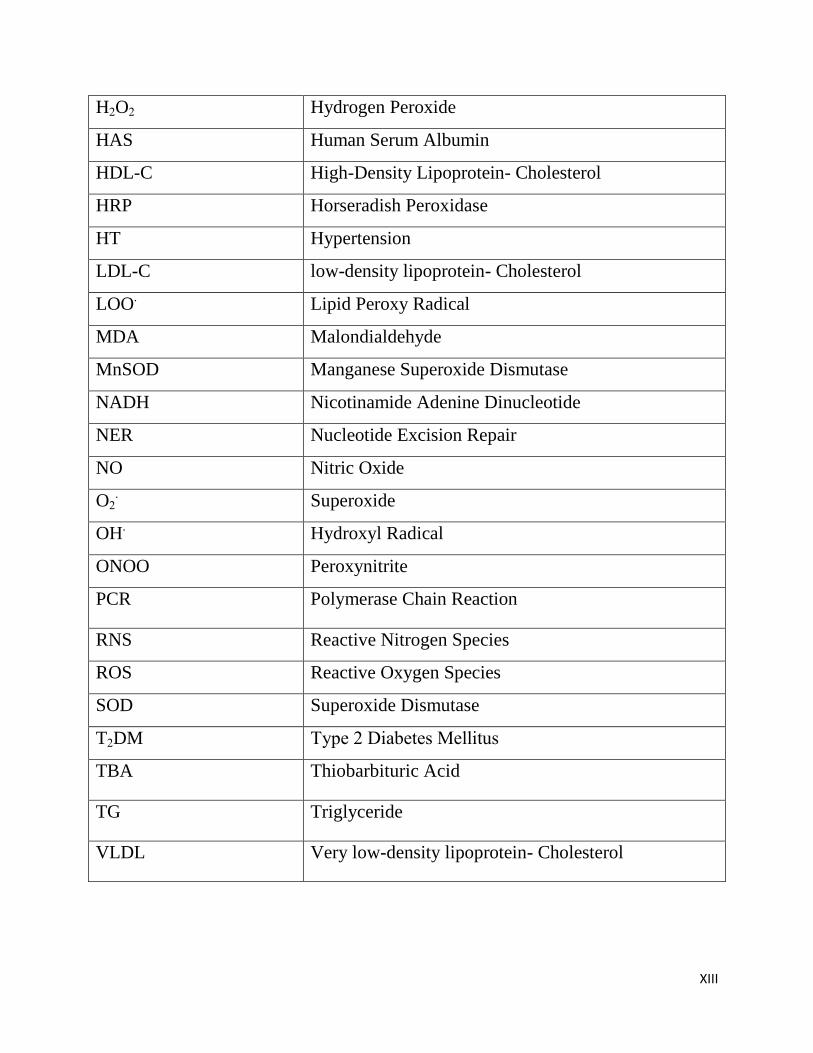
H2O2 Hydrogen Peroxide
HAS Human Serum Albumin
HDL-C High-Density Lipoprotein- Cholesterol
HRP Horseradish Peroxidase
HT Hypertension
LDL-C low-density lipoprotein- Cholesterol
LOO. Lipid Peroxy Radical
MDA Malondialdehyde
MnSOD Manganese Superoxide Dismutase
NADH Nicotinamide Adenine Dinucleotide
NER Nucleotide Excision Repair
NO Nitric Oxide
O2. Superoxide
OH. Hydroxyl Radical
ONOO Peroxynitrite
PCR Polymerase Chain Reaction
RNS Reactive Nitrogen Species
ROS Reactive Oxygen Species
SOD Superoxide Dismutase
T2DM Type 2 Diabetes Mellitus
TBA Thiobarbituric Acid
TG Triglyceride
VLDL Very low-density lipoprotein- Cholesterol
Committee Certfication
We, the examining committee certify that we have read this thesis
entitled " Study the Oxidative Stress Statues in Cardiovascular and
hypertension diseases in female patients" and examined the student
"Yasmeen Muhialdeen Hussein" in its contents and that in our opinion,
it is accepted for the Degree of Master of Science in Chemistry.
Signature: Name: Prof. Dr. Sanad B. Al-Arragi
Date: / /2015
(Chairman)
Signature:
Name: Assist. Prof. Amer H. Abd-Allah
Date: / /2015
(Member)
Signature:
Name:Assist. Prof Salman A. Ahmed
Date: / /2015
(Member)
Signature:
Name: Assist. Prof. Alaa H. Jawad
Date: / /2015
(Supervisor)
I, hereby certify upon the decision of the examining committee.
Signature:
Name: Assist. Prof. Dr. Hadi M. A. Abood
Dean of the College of Science.
Date: / /2015

I
Summary
Hypertension (HT) and cardiovascular diseases (CVD) share in that one of
the main reasons for them is to increase the oxidative stress, which in turn
increases the severity of the disease and exacerbation of symptoms. Reactive
molecules produced from oxidative stress, in addition to causing tissue damage by
oxidation of biomolecules like DNA, lipids, proteins and sugars; it is lead to the
formation of mediators with potent inflammatory effect. The objective of this study
was to investigate the some markers of oxidative stress in HT and CVD patients in
addition to some biochemical parameters related to these diseases.
This study involved 84 female subjects aged between (30-65) year equally
divided to three groups, first and second one belong to CVD and HT patients from
Ibn Al-Nafese hospital, while the third one for apparently healthy 28 subjects
considered as control group. For each subject in the three groups these markers and
parameters were evaluated; malondialdehyde (MDA), 8-hydroxydeoxyguanosine
(8-OHdG), albumin, uric acid, urea, creatinine. Also electrophoretic study on the
DNA of patients and control group controlled by placental DNA was done to
investigate the possible oxidative stress after Fenton reaction in vitro on it. And
study the deletion of Glutathion S transferase mu (GSTM1) gene using polymerase
chain reaction PCR.
The results were compared to control; Lipid profile show higher significant
(p<0.01) levels in both CVD and HT compared to control group. There was a
significantly higher (p<0.01) in MDA, and 8-OHdG levels in both CVD and HT
patients, while serum albumin shows significantly (p<0.01) lower levels. Uric acid
unexpectedly shows higher levels than control group with (p<0.01) although is
antioxidant. The electrophoresis study for GSTM1 gene show a significant
difference (p<0.01) in deletion of this gene. Further there is appositive correlation

II
in deletion of this gene and higher MDA and 8 OHdG and negative with albumin
while no correlation with urea, creatinine and uric acid.
The elevation levels of oxidative stress markers may be due to oxidative
damage of tissues that caused by these inflammatory diseases. It concludes there
was a positive relation between oxidation results from these diseases and their
developments and suggest increase need to intake of antioxidants as precaution in
front of these disease.
III
Contents
Summary I
Contents III
List of Tables VII
List of Figures VIII
Abbreviations X
Chapter One Introduction & Literature Review
1.1 The Arterial structure 2
1.2 Cardiovascular diseases 3
1.2.1 Definition 3
1.2.2 Symptoms 4
1.3 Hypertension 5
1.3.1 Definition of Blood Pressure 5
1.3.2 Definition of Hypertension 5
1.3.3 Symptoms of Hypertension 5
1.4 Lipid profile 6
1.4.1 Definition and classification 6
1.4.2 Lipoproteins 7
1.5 Oxidants 9
1.5.1 Free Radicals 9
1.5.2 Reactive oxygen species 9
1.6 Antioxidant defence 11
1.7 Oxidative stress 12
1.8 Oxidative stress and Arterial Diseases 14

IV
1.9 Definition of Oxidative stress biomarkers 15
1.10 Oxidative stress biomarker 16
1.10.1 Malondialdehyde (MDA) 16
1.10.2 8-Hydroxydeoxyguanosine (8-OHdG) 17
1.10.3 Glutathione S-Transferases mu gene 19
1.11 Antioxidant small molecules 21
1.11.1 Albumin 21
1.11.2 Uric acid 23
1.11.3 Creatinine and Urea 25
Aim of the Study 27
Chapter Two Materials & Methods
2.1 Subjects 29
2.2 Materials 29
2.2.1 Chemicals and biological materials 29
2.2.2 Instruments 30
2.3 Methods 31
2.3.1 Blood Sampling 31
2.3.2 Determination of Body Mass Index (BMI) 32
2.3.3 Determination of Hemoglobin (Hb) 32
2.3.4 Lipid Profile 33
2.3.4.1 Determination of Serum Cholesterol 33
2.3.4.2 Determination of Serum Triglyceride (TG) 34
2.3.4.3 Determination of Serum High-Density Lipoprotein-
Cholesterol (HDL-Cholesterol)
36

V
2.3.4.4 Determination of Serum Low-Density Lipoprotein-
Cholesterol (LDL-Cholesterol)
37
2.3.4.5 Determination of Serum Very Low-Density Lipoprotein-
Cholesterol (LDL- Cholesterol)
38
2.3.5 Determination of Serum Malondialdehyde Level (MDA) 38
2.3.6 Determination of Serum 8-Hydroxy-Desoxyguanosine(8-
OHdG)
39
2.3.7 Determination of Albumin 41
2.3.8 Determination of Serum Uric Acid 42
2.3.9 Determination of Serum Urea 43
2.3.10 Determination of Serum Creatinine 45
2.3.11 Molecular Biological Studies 46
2.3.11.1 DNA Extraction
46
2.3.11.2 Fenton Reaction in Vitro on Human DNA 47
2.3.11.3 GSTM1 Deletions Analysis by PCR 48
2.3.11.4 Agarose Gel Electrophoresis 50
2.4 Statistics Analysis 52
Chapter Three Results & Discussion
3.1 Patient Descriptive Data
54
3.1.1 Distribution of groups
54
3.1.2 Clinical feature of groups 55
3.1.2 Groups according to menopausal state 56

VI
3.2 Lipid profile levels 57
3.3 Oxidative Stress Markers And Parameters
62
3.3.1 Malondildehyde (MDA) levels 62
3.3.2 8-Hydroxydeoxyguanosine levels 65
3.3.3 Serum Albumin levels 68
3.3.4 Serum uric acid levels 71
3.3.5 Serum Urea and levels 73
3.3.6 Serum Creatinine levels 74
3.4 Molecular Study 75
3.4.1 DNA Isolation 75
3.4.2 Fenton Reaction In Vitro 76
3.4.3 Evalution of Glutathion S transferase mu gene (GSTM1
gene) deletion:
77
VII
List of Tables
Table No. Title Page
2.1 Chemicals and biological materials used in the study 29
2.2 Apparatus and Equipment 30
2.3 Primer Sequence used for GSTM1 deletion detections 49
2.4 PCR program for mixture A 50
2.5 PCR program for mixture B 50
3.1 Clinical Feature of Studying Group 55
3.2 Groups According to Menopausal State 57
3.3 Values of Lipid Profile Levels in the Cardiovascular
Diseases and Control Group
58
3.4 Values of the Lipid Profile in Hypertension and
Control Group
59
3.5 Values of MDA Between Groups 62
3.6 Values of 8-OHdG in Patient and Control Group 65
3.7 Values of Albumin Between Groups 69
3.8 Values of Uric Acid Between GroupS 71
3.9 Values of Urea in Studying Groups 73
3.10 Values of Creatinine in Studying Groups 74
3.11 Purity of Extracted DNA of Study Groups 76
3.12 Concentrations of DNA of Study Groups 76
3.13 Distribution of Microdeletion of GSTM1 80
3.14 Effect of Gene in Study Parameters in HT groups 81
3.15 Effect of Gene in study parameters 82
VIII
List of Figures
Figure No Title Page
1-1 The Arterial structure 3
1-2 The Structure of a Plasma Lipoprotein 7
1-3 Sources and Effects of Reactive oxygen species 11
1-4 Generation and Metabolization of Reactive Oxygen
Species in the Vasculature
13
1-5 Reactive Oxygen Species in the Arterial 15
1-6 Chemical Structure of Malondialdehyde 16
1-7 Producing 8-OHdG 18
1-8 Generation and Metabolism of 8-
Hydroxydeoxyguanosine
19
1-9 Genomic location of the human GSTM1 20
1-10 Structure of Albumin 22
1-11 Overview of Steps Leading to Cys-34 Oxidation and
Thiolation
23
1-12 Urate Anion Structures 23
1-13 The Conversion Of Purines Into Uric Acid 24
1-14 Metabolic Pathway of Creatinine 25
1-15 Structure of urea 26
2-1 Standard Curve for 8-OHdG 41
3-1 Distribution of studying group. 54
3-2 Values of lipid profile between groups
59
IX
3-3 Role of oxidized lipoproteins in plaque formation in
arterial wall 61
3-4 Mean Conc of Oxidative Marker MDA for Studied
Groups.
63
3-5 Correlation of MDA with LDL in CVD Patients 64
3-6 Correlation of MDA with LDL in Hypertensive
Patients.
64
3-7 8-OHdG Levels in Patients and Control Group 65
3-8 Correlation Directly Between MDA and 8-OHdG for
Control group.
67
3-9 Correlation Directly Between MDA and 8-OHdG for
Hypertensive Group.
67
3-10 Correlation Directly Between MDA and 8-OHdG for
C.V. Group
68
3-11 Values for Albumin [g/L] in Patients and Control Group 69
3-12 Correlation Between Albumin and MDA in CVD
patients
70
3-13 Correlation Between Albumin and MDA in
Hypertensive Patients
71
3-14 Values for Uric Acid [mg/dL] in Patients and Control
Groups
72
3-15 Genomic DNA Profile from Blood Sample of Subjects,
GAgarose gel (1%), 5 V/cm for 1 hr., Stained with
Ethidium Bromide
75
3-16 Fenton reaction on DNA 77
3-17 Studied Exons of GSTM1 78
3-18 Gel electrophoresis for GSTM1 79
Chapter one Introduction
2
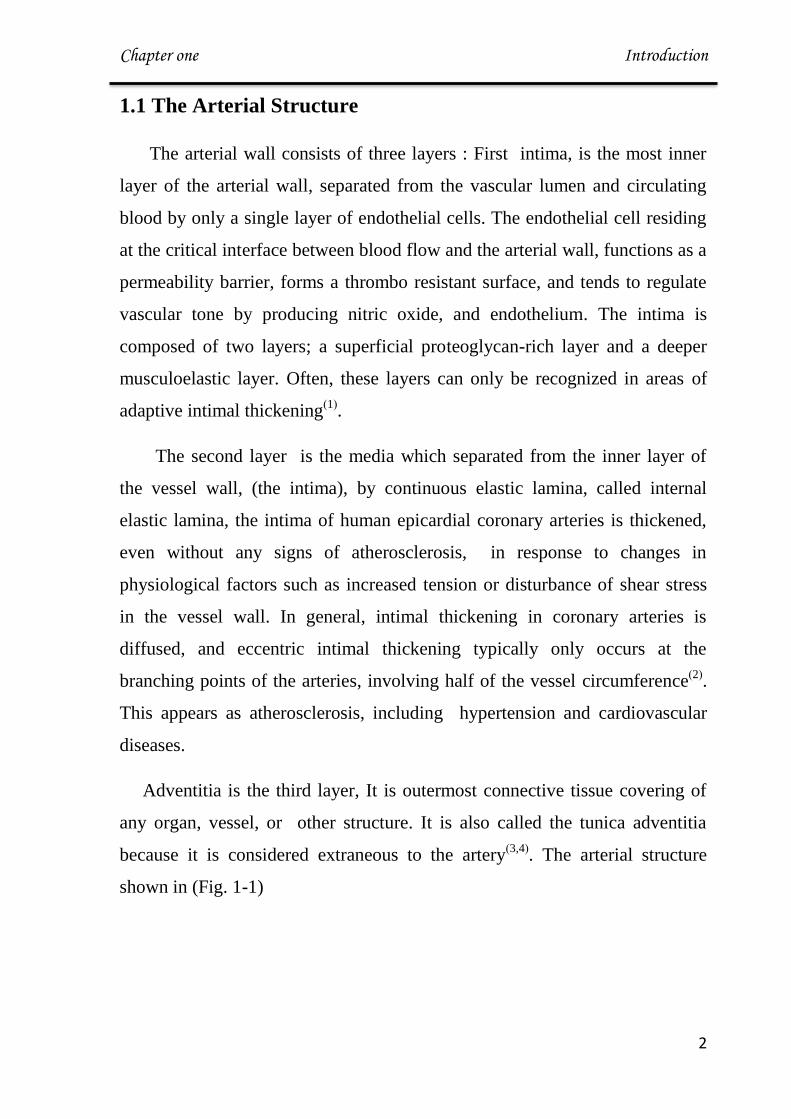
1.1 The Arterial Structure
The arterial wall consists of three layers : First intima, is the most inner
layer of the arterial wall, separated from the vascular lumen and circulating
blood by only a single layer of endothelial cells. The endothelial cell residing
at the critical interface between blood flow and the arterial wall, functions as a
permeability barrier, forms a thrombo resistant surface, and tends to regulate
vascular tone by producing nitric oxide, and endothelium. The intima is
composed of two layers; a superficial proteoglycan-rich layer and a deeper
musculoelastic layer. Often, these layers can only be recognized in areas of
adaptive intimal thickening)1(
.
The second layer is the media which separated from the inner layer of
the vessel wall, (the intima), by continuous elastic lamina, called internal
elastic lamina, the intima of human epicardial coronary arteries is thickened,
even without any signs of atherosclerosis, in response to changes in
physiological factors such as increased tension or disturbance of shear stress
in the vessel wall. In general, intimal thickening in coronary arteries is
diffused, and eccentric intimal thickening typically only occurs at the
branching points of the arteries, involving half of the vessel circumference)2(
.
This appears as atherosclerosis, including hypertension and cardiovascular
diseases.
Adventitia is the third layer, It is outermost connective tissue covering of
any organ, vessel, or other structure. It is also called the tunica adventitia
because it is considered extraneous to the artery)3,4(
. The arterial structure
shown in (Fig. 1-1)

Chapter one Introduction
3
Figure (1-1):The arterial structure)5(
1.2. Cardiovascular Diseases
1.2.1 Definition
Cardiovascular diseases (CVDs) are a group of disorders of the heart and
blood vessels and they include:
Coronary heart disease: disease of the blood vessels supplying the heart
muscle.
Rheumatic heart disease: damage to the heart muscle and heart valves
from rheumatic fever, caused by streptococcal bacteria.
Congenital heart disease: malformations of heart structure existing at
birth.

Chapter one Introduction
4
Deep vein thrombosis and pulmonary embolism: blood clots in
the leg veins, which can dislodge and move to the heart and
lungs )6(
.
Cardiovascular diseases is the result of the accumulation of atheromatous
plaques within the walls of the arteries that supply myocardium with oxygen
and nutrients. After decades of progression, some atheromatous plaques may
rupture and may thus severely restrict the flow of oxygen carrying blood to the
myocardium. As a consequence, a heart attack can occur(7)
1.2.2 Symptoms
Often, there are no symptoms of the underlying disease of the blood
vessels. A heart attack or stroke may be the first warning of underlying
disease. Symptoms of a heart attack include)7,8(
.
Pain or discomfort in the centre of the chest.
Pain or discomfort in the arms, the left shoulder, elbows, jaw, or back.
In addition the person may experience difficulty in breathing or shortness
of breath; feeling sick or vomiting; feeling light-headed or faint; breaking into
a cold sweat; and becoming pale. Women are more likely to have shortness of
breath, nausea, vomiting, and back or jaw pain.
The most common symptom of a stroke is sudden weakness of the face,
arm, or leg, most often on one side of the body. Other symptoms include
sudden onset of:
Numbness of the face, arm, or leg, especially on one side of the body.
Confusion, difficulty speaking or understanding speech.
Difficulty seeing with one or both eyes.
Difficulty walking, dizziness, loss of balance or coordination.

Chapter one Introduction
5
Severe headache with no known cause.
Fainting or unconsciousness )6,9,10(
.
The major risk factors for CVD including: high blood
pressure (hypertension) smoking ,high blood cholesterol ,diabetes ,lack of
exercise being overweight or obese ,a family history of heart disease and
ethnic background )7(
Growing evidence suggests that highly reactive oxygen
derived free radicals reactive oxygen species (ROS) of endogenous or
environmental origin play a cognitive role in the genesis and progression of
various CVDs )8,9(
.
1.3 Hypertension:
1.3.1 Definition of Blood Pressure :
Blood pressure is a measure of the force that the circulating blood exerts
on the walls of the main arteries. The pressure wave transmitted along the
arteries with each heartbeat is easily felt as the pulse, the highest (systolic)
pressure is created by the heart contracting and the lowest (diastolic) pressure
is measured as the heart fills )11(.
1.3.2 Definition of Hypertension :
Hypertension is defined as an average systolic blood pressure greater
than or equal to140 mmHg or an average diastolic blood pressure of greater
than or equal to 90 mmHg )12(
, Hypertension is a disease and blood pressure is
a biomarker )13(
.
1.3.3 Symptoms of Hypertension
Hypertension is a disease which in its early stages is almost without obvious
symptoms its identification is usually through screening. A proportion of
people with high blood pressure report headaches (particularly at the back of
Chapter one Introduction
6
the head and in the morning), as well as lightheadedness, vertigo, tinnitus
(buzzing or hissing in the ears), altered vision or fainting episodes)14(
.
1.4 Lipid profile
1.4.1 Difenition and Classification
Lipids play a critical role in almost all aspects of biological life, they
are structural components in cells and are involved in metabolic and hormonal
Pathways. Lipid metabolism is usefully based on the concept of lipoproteins,
the form in which lipids circulate in plasma, large spherical complex molecule
)15(.
Chylomicrons contain a lipid core that composed of dietary lipid and lipid
synthesized in the intestinal cells. Chylomicrons are the lipoprotein particles
lowest in density and largest in size, and contain the highest percentage of lipid
and the smallest percentage of protein(17)
.
Cholesterol is essential precursor of steroid hormones, bile acids and
vitamin D, and is required structurally for cell membranes, strengthen cell
membranes and make hormones (16)
, cholesterol risk levels are positively
correlated to the development of atherosclerosis, a process initiated by
deposition of excess insoluble sterols in the arterial wall. High cholesterol is a
major risk factor for CVD and stroke (17)
. The American Heart Association
(AHA) has identified untreated total cholesterol <3.5-5 mmol/L (for children)
and <5.18 mmol/L (for adults))18(
Triglyceride (strictly triacylglycerol) is formed by reaction of two
molecules of fatty acyl-CoA with glycerol 3-phosphate to form phosphotidic
acid , this is dephosphorylated to a diacylglycerol and then acylated by a third
molecule of fatty acyl-COA to yield a triacylglycerol)17(
Triglyceride is
presented in dietary fat ,and can be synthesized in the liver and adipose tissue

Chapter one Introduction
7
to provide a source of a stored energy, which can be mobilized when required.
Levels of serum triglycerides have also been linked positively to lower levels
of high-density lipoprotein- Cholesterol (HDL-C) and low-density lipoprotein-
Cholesterol (LDL-C) particle size . Both these conditions have been linked to
an elevated risk of developing diseases)16,17)
, The value of triglyceride is lower
than 1.69 mmol/L (18)
. After its absorption into the intestinal mucosal cell,
cholesterol, together with triglycerides, phospholipids, and a number of specifi
apoproteins, is assembled into a large lipoprotein a chylomicron
1.4.2 Lipoproteins
The major plasma lipids are not circulating free in the blood. They are
bound to a specific protein, (Apoproteins) to form large spherical complex
molecule called lipoprotein, which are transported through plasma)20
(
Figure 1-2: The structure of a plasma lipoprotein)21(

Chapter one Introduction
8
High-density lipoprotein- Cholesterol transport cholesterol to liver or
steroidogeine organs such as adrenal , ovary and tests for synthesis of steroid
hormone)22(
. HDL promote expulsion of cholesterol from peripheral cells and ,
indirectly from the body thus; protecting against cardiovascular disease. Several
studies of large populations have shown that the risk of developing
manifestation of ischemic heart disease is inversely related to the serum
concentration (HDL-cholesterol).)23,24,25(
, The recommended HDL level is
above 1.0mmol/L (men) and above 1.2mmol/L (women))18,26(
.
Low-density lipoprotein- Cholesterol LDL carry cholesterol to peripheral
tissues and help regulate cholesterol levels in those tissues)16(
, making it
available to the tissue cells for membrane or hormonal synthesis and for
storage for later use. This type of cholesterol is considered harmful as it
transports a large amount of cholesterol. The recommended LDL level is
below 3.0mmol/L )17,18(
Cardiac diseases and Hypertension are known to be associated with
alterations in lipid metabolism which gives rise to abnormalities in serum lipid
and lipoprotein levels (12)
Standard lipoprotein analysis of measurement of total serum cholesterol,
total triglyceride, high density lipoprotein cholesterol, and calculation of low-
density lipoprotein cholesterol is medically necessary for prediction of risk for
coronary artery disease

Chapter one Introduction
9
1.5 Oxidants:
1.5.1 Free Radicals :
Free radicals can be defined as molecules or molecular fragments having
one or more unpaired electrons in atomic or molecular orbitals. Examples
Nitric oxide (NO.), superoxide(O2
.–), hydroxyl radical (
.OH), lipid peroxy
radical (LOO.). This unpaired electron(s) frequently gives a considerable
degree of reactivity to the free radical(27)
. Radicals derived from oxygen
represent the most essential class of radical species generated in living
systems(28)
.
1.5.2 Reactive Oxygen Species :
Although molecular oxygen (O2) has two unpaired electrons in two
different orbitals, it is not a free radical. Molecular oxygen, however, reacts
rapidly with most other radicals, forming other free radicals that are more
reactive(29)
.
Reactive oxygen species (ROS) is a group term used for a group of
oxidants, which are either free radicals or molecular species capable of
generating free radicals(30)
, may initiate from both exogenous and endogenous
sources.
Exogenous sources consist of environmental agents, radiation, therapeutic
agents, and tobacco smoke. Endogenous sources involved mitochondria,
peroxisomes, and inflammatory cell activation as summarized in Figure (1-3).
In a perfect world, cells will use oxygen to produce adenine tri phosphate
(ATP) and water without any toxic byproducts or activated (also active)
oxygen
species. However, damage to mitochondria in pathophysiological
conditions or through mitochondrial dysfunction, the electron transport
mechanism in the mitochondrial respiratory chain is impaired. This leads to
Chapter one Introduction
01
reactive oxygen species formation (e.g., superoxide anion) from one-electron
reduction of oxygen (29)
Hydrogen peroxide is not a free radical, but is a
precursor of free radicals. UV radiation causes the hemolytic
cleavage of the oxygen–oxygen bond to form hydroxyl radicals
(.OH). Redox metal ions (Fe
+2 or Fe
+3 or Cu
+) react with hydrogen
peroxide to produce hydroxyl radicals (the Fenton reaction) (29)
In physiological conditions, low levels of ROS play a protecting role in
the organism, while elevated levels of ROS can cause damage to cell
structures, nucleic acids, lipids and proteins or DNA damage (30,31)
Though the Fenton's reaction, these hydrogen peroxides react with
metal iron or copper to form more highly reactive hydroxyl ions, .OH
-
Fe2+
+ H2O2 →Fe3+
+ .OH +
.OH
Though Haber-Weiss reaction , catalyzed by metals :
O2. + H2O2 O2 +
.OH +
.OH
H2O2 reacts with Cl-, Br
-, I
- and is used by myloperoxidase to form more
reactive hypochloric acid/hyperchlorite.(32)
H2O2 + Cl→ HOCl + OH-
Formation of peroxynitrite is the primary reaction(31)
.
O2 + NO → ONOO.
The second order rate constant for the formation of the .OH via the
Fe(II)- mediated Fenton reaction is 76 L mol-1
s- , This indicates that there
may be between 46 to 458 .OH formed per second in a cell, indicating that
even the lower rate of reaction is biologically significant (33)
.
Another immunologically relevant reactive oxygen species is
hypochlorous acid (HOCl, or bleach). HOCl is formed from
Chapter one Introduction
00
myeloperoxidase/H2O2-dependent oxidation of chloride anion. HOCl has
intermediate reactivity-more reactive than H2O2 but considerably less reactive
than hydroxyl radicals(29)
.
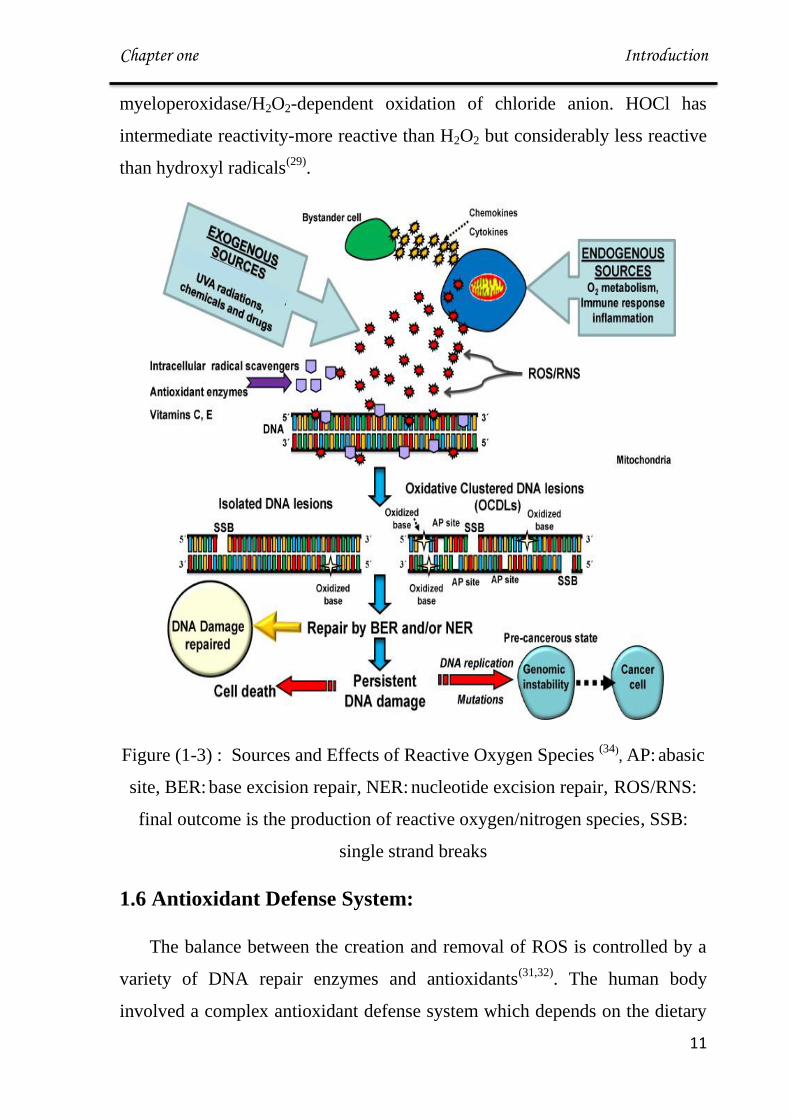
Figure (1-3) : Sources and Effects of Reactive Oxygen Species (34)
, AP: abasic
site, BER: base excision repair, NER: nucleotide excision repair, ROS/RNS:
final outcome is the production of reactive oxygen/nitrogen species, SSB:
single strand breaks
1.6 Antioxidant Defense System:
The balance between the creation and removal of ROS is controlled by a
variety of DNA repair enzymes and antioxidants(31,32)
. The human body
involved a complex antioxidant defense system which depends on the dietary
Chapter one Introduction
02
intake of antioxidants as well as the endogenous production of antioxidative
compounds Antioxidants can be classified into a number of different groups:
1. Antioxidant enzymes: which scavenge free radicals. These enzymes
make up a preventive type of antioxidative network superoxide dismutase
(SOD), catalase (CAT), glutathione peroxidase (GPx), glutathione reductase
(GSR).
2. Antioxidative proteins :that avoid the formation of ROS include
hemoglobin, transferrin, albumin, lactoferrin
3. Small-molecular-weight compounds: are able to respond directly to and
eliminate free radicals and are therefore called radical-scavenging antioxidants
ascorbic acid (vitamin C), tocopherols (vitamin E), glutathione (GSH), uric
acid, selenium, bilirubin, glucose.
4. Ubiquinone (coenzyme Q-10)
5. Flavonoids (29,36)
.
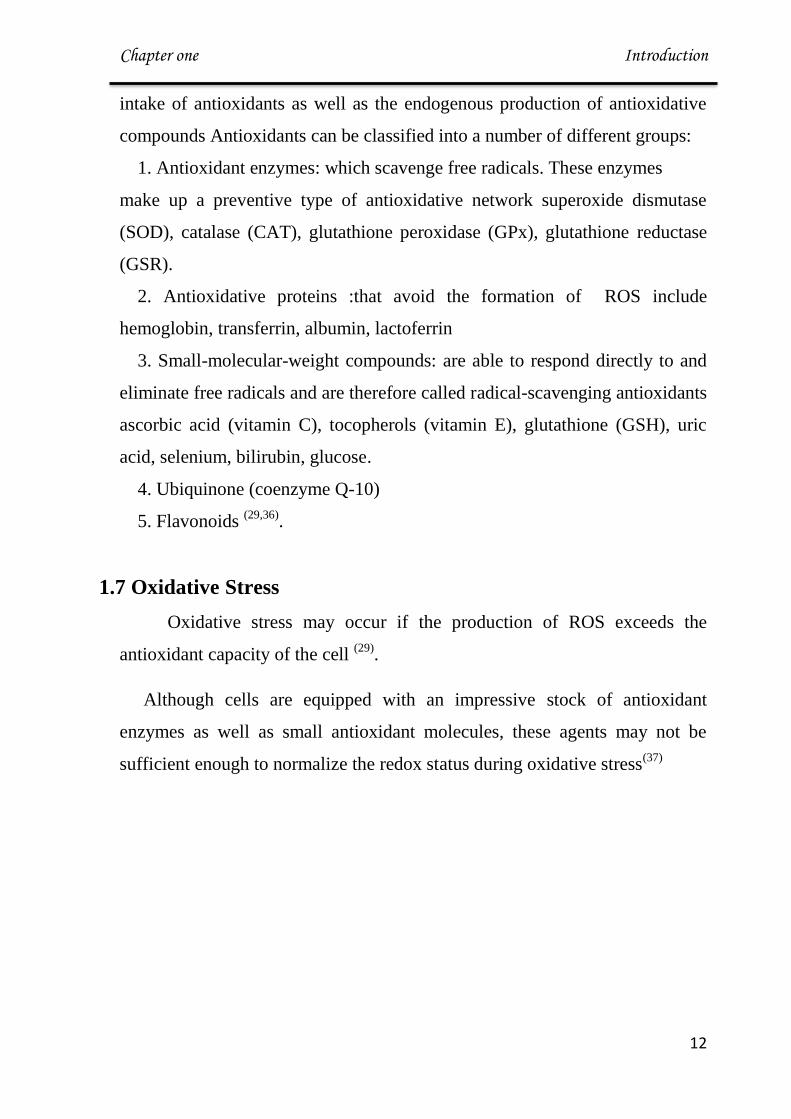
1.7 Oxidative Stress
Oxidative stress may occur if the production of ROS exceeds the
antioxidant capacity of the cell (29)
.
Although cells are equipped with an impressive stock of antioxidant
enzymes as well as small antioxidant molecules, these agents may not be
sufficient enough to normalize the redox status during oxidative stress(37)
Chapter one Introduction
03
Figure (1-4) . Generation and metabolization of reactive oxygen . (38)
Chapter one Introduction
04
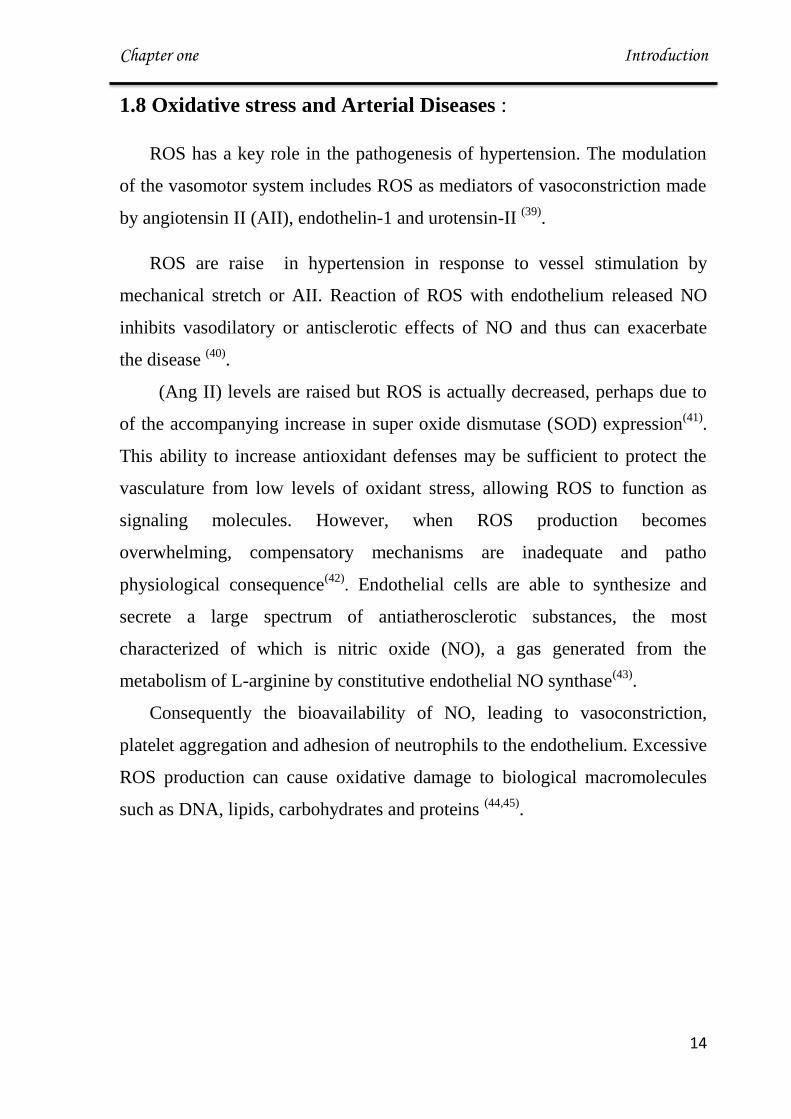
1.8 Oxidative stress and Arterial Diseases :
ROS has a key role in the pathogenesis of hypertension. The modulation
of the vasomotor system includes ROS as mediators of vasoconstriction made
by angiotensin II (AII), endothelin-1 and urotensin-II (39)
.
ROS are raise in hypertension in response to vessel stimulation by
mechanical stretch or AII. Reaction of ROS with endothelium released NO
inhibits vasodilatory or antisclerotic effects of NO and thus can exacerbate
the disease (40)
.
(Ang II) levels are raised but ROS is actually decreased, perhaps due to
of the accompanying increase in super oxide dismutase (SOD) expression(41)
.
This ability to increase antioxidant defenses may be sufficient to protect the
vasculature from low levels of oxidant stress, allowing ROS to function as
signaling molecules. However, when ROS production becomes
overwhelming, compensatory mechanisms are inadequate and patho
physiological consequence(42)
. Endothelial cells are able to synthesize and
secrete a large spectrum of antiatherosclerotic substances, the most
characterized of which is nitric oxide (NO), a gas generated from the
metabolism of L-arginine by constitutive endothelial NO synthase(43)
.
Consequently the bioavailability of NO, leading to vasoconstriction,
platelet aggregation and adhesion of neutrophils to the endothelium. Excessive
ROS production can cause oxidative damage to biological macromolecules
such as DNA, lipids, carbohydrates and proteins (44,45)
.
Chapter one Introduction
05
Figure (1-5) Reactive oxygen species in the arterial .( NO nitrogen oxide , AII
angiotensin )(44)
.
1.9 Definition of Oxidative Stress Biomarkers:
A commonly used definition is which proposed in 2001 by the biomarkers
definition working group by the national institute of health and food and drug
administration (NIH/FDA) in the USA " a characteristic that is objectively
measured and evaluated as an indicator of normal biological processes,
pathogenic processes, or pharmacologic responses to therapeutic intervention
(46).
There are three types of biomarkers:
1) disease biomarkers-used to monitor and diagnose the progression of a
disease.
2) drug efficacy/toxicity biomarkers- used to monitor the efficacy or
toxicity of treatment regime
3) pharmacodynamics markers for monitoring pharmacological response
(47).
Chapter one Introduction
06
1.10 Oxidative Stress Biomarker
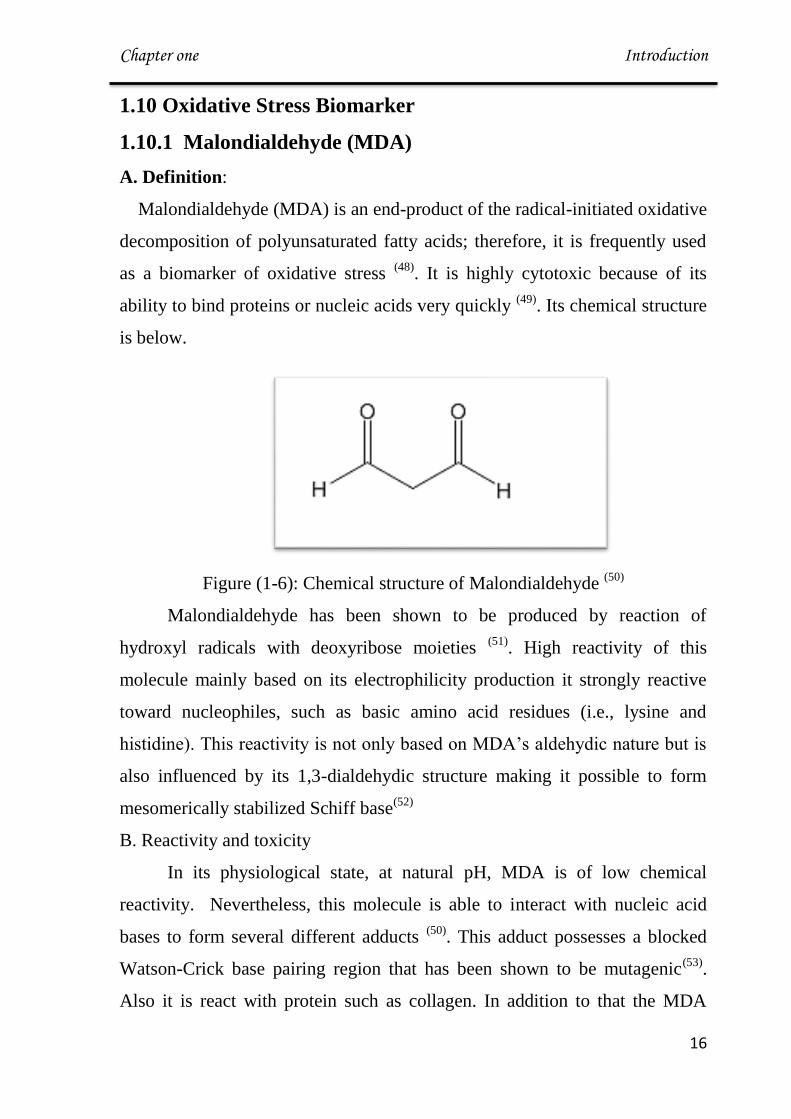
1.10.1 Malondialdehyde (MDA)
A. Definition:
Malondialdehyde (MDA) is an end-product of the radical-initiated oxidative
decomposition of polyunsaturated fatty acids; therefore, it is frequently used
as a biomarker of oxidative stress (48)
. It is highly cytotoxic because of its
ability to bind proteins or nucleic acids very quickly (49)
. Its chemical structure
is below.
Figure (1-6): Chemical structure of Malondialdehyde (50)
Malondialdehyde has been shown to be produced by reaction of
hydroxyl radicals with deoxyribose moieties (51)
. High reactivity of this
molecule mainly based on its electrophilicity production it strongly reactive
toward nucleophiles, such as basic amino acid residues (i.e., lysine and
histidine). This reactivity is not only based on MDA’s aldehydic nature but is
also influenced by its 1,3-dialdehydic structure making it possible to form
mesomerically stabilized Schiff base(52)
B. Reactivity and toxicity
In its physiological state, at natural pH, MDA is of low chemical
reactivity. Nevertheless, this molecule is able to interact with nucleic acid
bases to form several different adducts (50)
. This adduct possesses a blocked
Watson-Crick base pairing region that has been shown to be mutagenic(53)
.
Also it is react with protein such as collagen. In addition to that the MDA
Chapter one Introduction
07
product can cause the cross-linkage of membrane elements by affecting the
ion exchange from cell membranes(54)
, which gives way to aftermaths
including a change in ion permeability and enzyme activity(55)
. Therefore
MDA is able to impair several physiological mechanisms of human body
through its ability to react with molecules such as DNA and proteins;
therefore it's useful to consider this molecule as something more than a lipid
peroxidation product (50)
.
Clinical data have indicated that MDA-type epitopes are prominent and
prevalent and are important in cardiovascular disease, ( Bartoli ), (Seema L. )
and (Khalid Al-Fartosi) found higher MDA is correlated with chronic cardiac
disease. (56-58)
1.10.2 8-Hydroxydeoxyguanosine (8-OHdG)
A. Definition
8-Hydroxydeoxyguanosine (8-OHdG) is an oxidized nucleoside that is
excreted in the bodily fluids with DNA repair. 8-OHdG is a most common
stable product of oxidative DNA damage following enzymatic cleavage after
ROS induced 8-hydroxylation of guanine base on mitochondrial and nuclear
DNA (59)
. It is can be recognized at an increase level in all bodily fluids and
tissues, where an inflammatory process exists (60)
, and is considered a measure
of DNA oxidation in response to free radicals (61)
.
The synthesis of (8-OHdG) is the main DNA modification induced by
(ROS) and may be responsible for DNA base mutations. It has been
demonstrated that oxidative DNA adducts accumulate and are only repaired
through enzyme pathways, causing in further DNA damage (62)
.
Chapter one Introduction
08
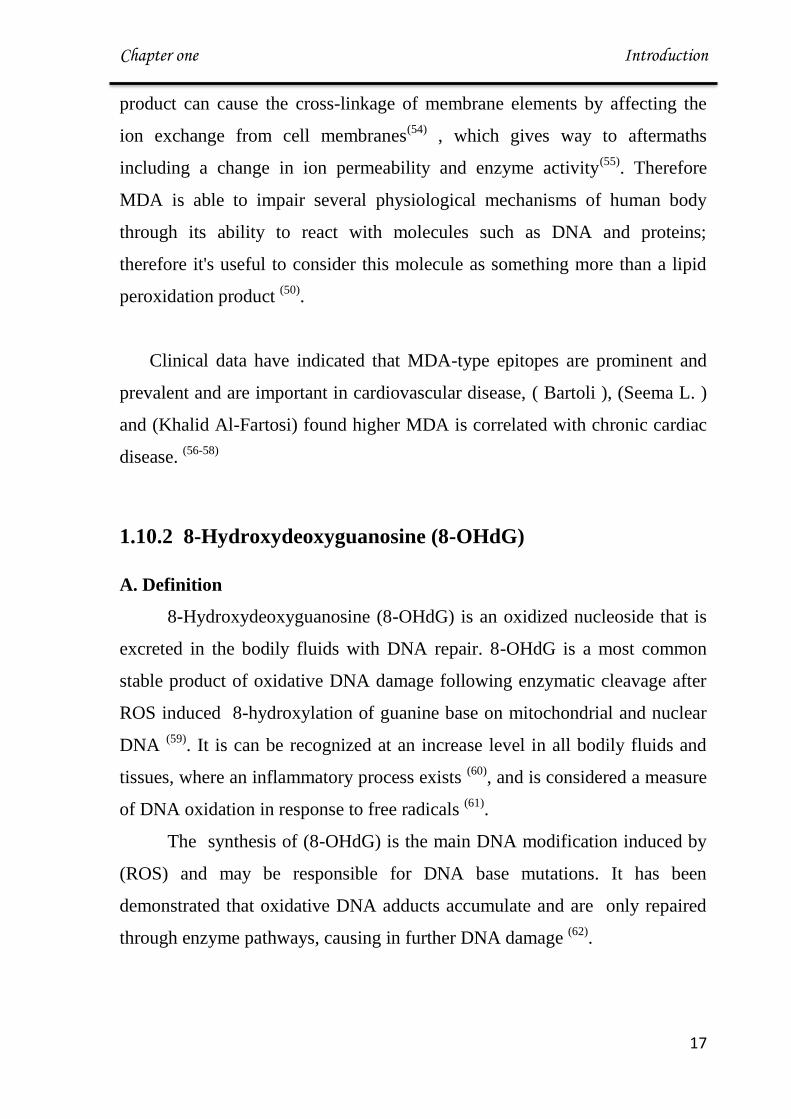
Figure (1-7): Producing 8-OHdG. (64)
B. Generation and Metabolism of 8-hydroxydeoxyguanosine
When DNA is attacked by oxidative stress such as ROS, ultraviolet
light, or genotoxic agents, guanine is easily oxidized into 8-oxo-7,8-
dihydroguanine(8-oxo-Gua). The existence of this oxidized guanine in
genomic DNA can cause transversion mutation such as G-T or G-A binding,
accumulation of which can lead to detrimental consequences (65)
.
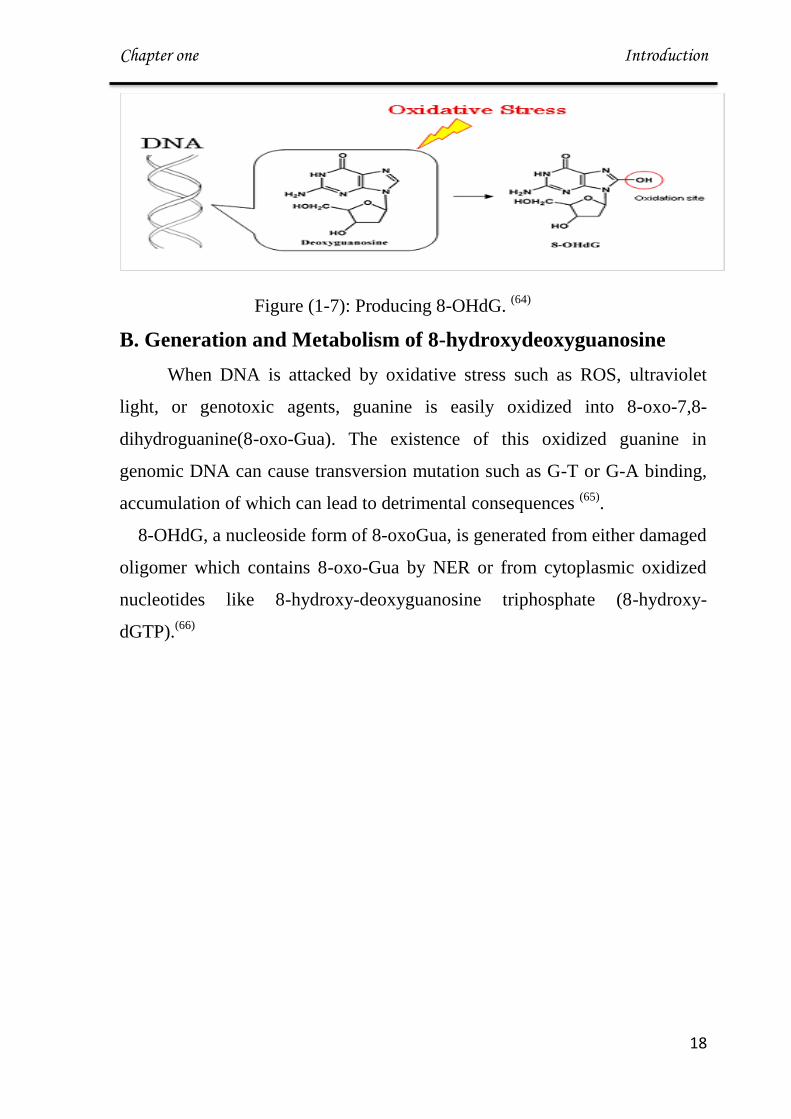
8-OHdG, a nucleoside form of 8-oxoGua, is generated from either damaged
oligomer which contains 8-oxo-Gua by NER or from cytoplasmic oxidized
nucleotides like 8-hydroxy-deoxyguanosine triphosphate (8-hydroxy-
dGTP).(66)
Chapter one Introduction
09
Figure (1-8) Generation and metabolism of 8-hydroxydeoxyguanosine (65)
.
8-OHdG has been reported to be strongly associated with diabetes
mellitus, cancer, gastrointestinal diseases , 8-oxodG has also been found to be
increased in atherosclerosis plaques and have been found to correlate in
patients with end-stage renal disease (61, 66-70)
.
1.10.3 Glutathione S-Transferases mu gene:
Glutathione S-transferase (GST) is a multigene family of enzymes
that detoxify reactive electrophiles, products of oxidative stress, and
known or suspected carcinogenic compounds through conjugation
with reduced glutathione (GSH) (71)
.
Glutathione-s-transferases (GSTs) are one of the most important
supergene family of isoenzymes known to catalyze the detoxification of
reactive electrophilic compounds, such as carcinogens, therapeutic drugs,
environmental toxins, and products of oxidative stress, chiefly by conjugation

Chapter one Introduction
21
with soluble glutathione (72)
. In addition, GSTs are able to modulate the
induction of other enzymes and proteins which are important in cellular
functions, such as DNA repair, and are therefore important in maintaining
genomic integrity (73)
.
At present, eight distinct classes of the soluble cytoplasmic mammalian
glutathione S-transferases have been known : alpha, kappa, mu, omega, pi,
sigma, theta and zeta. The genes encoding the mu class of enzymes are
organized in a gene cluster and are known to be highly polymorphic (73,74)
.
Figure(1-9): Genomic Location of the Human MU –Class Glutathione S-
Transferase (www.genecard.org) )75(
Chapter one Introduction
20
Genetic polymorphisms of these GST enzymes are in the form of gene
deletions, yielding no transcription or translation of the respective proteins.
Decreased functionality of detoxifying and antioxidant enzymes may pose a
greater risk of toxic insult potentially caused by lowered control of reactive
oxygen species leading to chronic oxidative stress (76)
, the oxidative stress
might be the necessary link between GSTM1 activity and arterial diseases. It
is worth noting that deleted polymorphisms in the GST genes may also
influence the susceptibility to coronary artery disease by modulating the
detoxification of genotoxic atherogen (73)
. Due to genetic variation, higher
amounts of ROS reaching tumor cells and exaggerating cytotoxic activity may
increase survival. Since radiotherapy exerts part of its antineoplastic effect via
the generation of oxidative stress, the presence of this gene will prolong
survival in patients who received radiotherapy (76)
.
The GSTM1 gene was studied as marker for oxidative stress, Massimo
found correlation of null GSTM1 and increase exposure to ozone )77(
. In
cardiac patient null GSTM1 associated with endothelial injury and dysfunction
and observed association between asthma risk and the GSTM1 deletion (78,79)
.
1.11 Antioxidant Molecules
1.11.1 Albumin
Albumin is a non-glycosylated protein of 66 kDa ; its normal plasma
concentration is between 35 and 50 g/l constituting up to 60% of total plasma
proteins. Its half-life is 20 days in normal conditions (80)
. The human serum
albumin (HSA) structure consists of a single-chain polypeptide of 585 amino
acid residues and approximately 67% alpha-helix and no beta-sheet . The
antioxidant properties of HSA related to its structure.

Chapter one Introduction
22
Figure (1-10) Structure of Albumin (81)
(HSA) shows antioxidant capability related to ligand-binding capacities
HSA is well known for binding a large variety of molecules, including fatty
acids, drugs, hormones, and metal ions (80)
.The main ligands of HSA implied
in direct or indirect antioxidant functions of the protein are transition metal
ions (copper and iron essentially) (81)
. Free redox-active transition metal ions
like (Cu(II) and Fe(II)) can potentially be extremely pro-oxidant. Indeed,
through the Fenton reaction, they can interact with hydrogen peroxide (H2O2)
catalyzing the production of aggressive ROS (29)
.
The radical-trapping properties, upon secretion in physiological conditions,
one-third of the HSA pool exists as disulfides mixed with cysteine,
homocysteine, or glutathione (GSH) (HSA-S-S-R) and two-thirds of the HSA
molecules exist in a reduced form with a free thiol in the Cys-34 residue
(HSA-SH), named as human mercaptalbumin (81,84)
. This redox thiol group, in
connection with the high concentration of HSA in the circulation, accounts for
80% thiols in plasma, constituting the major extracellular source of reactive
free thiol (85)
. Working as a free radical scavenger, the Cys34 residue is able to

Chapter one Introduction
23
trap multiple ROS and RNS, such as hydrogen peroxide (H2O2), peroxynitrite
(ONOO-) or superoxide (81)
.
It also function antioxidant from its ability to bind bilirubin and
homocysteine because it contains one high affinity site (Lys240) for
bilirubin(86)
. The resulting HAS bound bilirubin acts as an inhibitor of lipid
peroxidation and thus represents an indirect antioxidant property of HAS(81,86)
.
Figure (1-11) :Overview of steps leading to Cys-34 oxidation and thiolation
(highlighted in red). (86)
1.11.2 Uric Acid
Uric acid (UA) is the end of purine catabolism and is excreted in urine of
humans. It is a weak organic acid with a pK of 5.75, and exists mainly as
monosodium urate (MSU) at physiological pH (87)
. Uric acid structure is
shown figure 1-12
Figure (1-12) Urate anion structure(30)
Chapter one Introduction
24
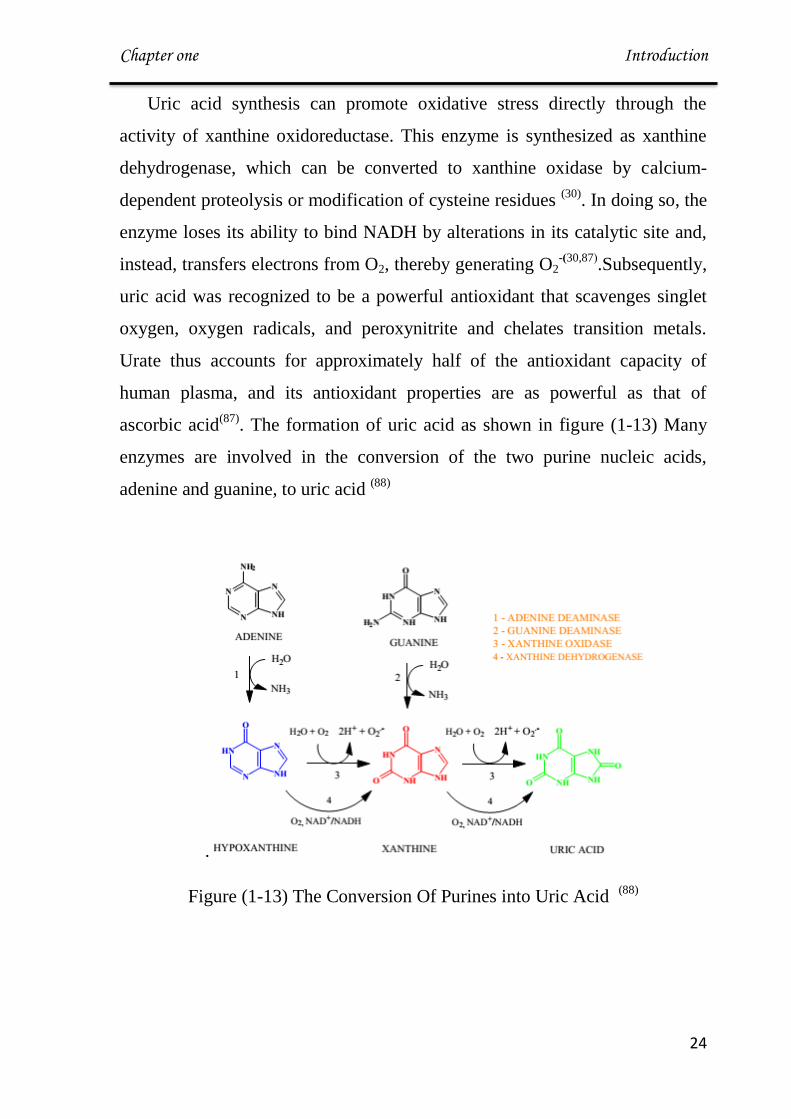
Uric acid synthesis can promote oxidative stress directly through the
activity of xanthine oxidoreductase. This enzyme is synthesized as xanthine
dehydrogenase, which can be converted to xanthine oxidase by calcium-
dependent proteolysis or modification of cysteine residues (30)
. In doing so, the
enzyme loses its ability to bind NADH by alterations in its catalytic site and,
instead, transfers electrons from O2, thereby generating O2-)30,87(
.Subsequently,
uric acid was recognized to be a powerful antioxidant that scavenges singlet
oxygen, oxygen radicals, and peroxynitrite and chelates transition metals.
Urate thus accounts for approximately half of the antioxidant capacity of
human plasma, and its antioxidant properties are as powerful as that of
ascorbic acid(87)
. The formation of uric acid as shown in figure (1-13) Many
enzymes are involved in the conversion of the two purine nucleic acids,
adenine and guanine, to uric acid (88)
.
Figure (1-13) The Conversion Of Purines into Uric Acid (88)
Chapter one Introduction
25
1.11.3 Creatinine and Urea
Creatinine is the cyclic anhydride of creatine which is an end product of
the dissociation of phosphocreatine (89)
. The kidneys, liver and pancreas are
sites of production of creatine which are enzymatically modulated. The initial
reaction involves transmidation of arginine and glycine to form
guanidinoacetic acid. This is then followed with methylation of acid occurs
with s-anosylmethionine as the methyl donor (90)
. Creatinine is then
transported to other organs such as brain and muscles where it is
phosphorylated to phosphocreatinine, a high-energy compound. The
interconversion of phosphocreatinine to creatinine is a particular feature of the
metabolic process of muscle contraction (90,91)
.
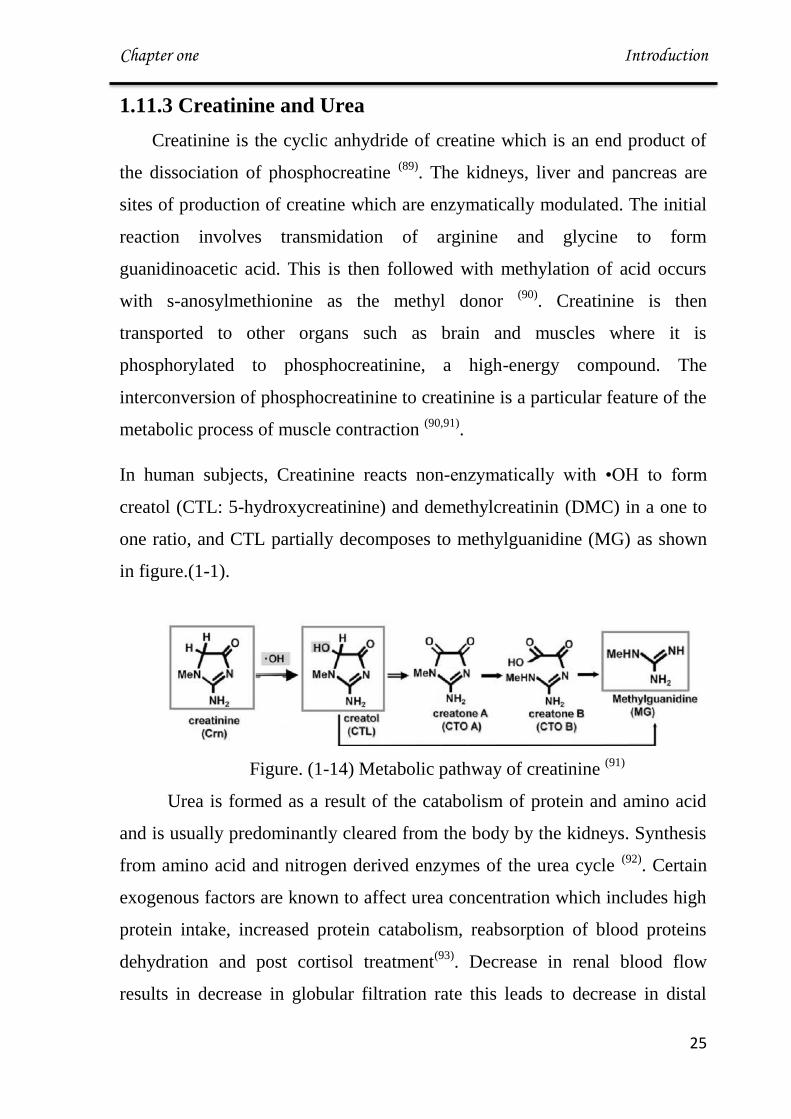
In human subjects, Creatinine reacts non-enzymatically with •OH to form
creatol (CTL: 5-hydroxycreatinine) and demethylcreatinin (DMC) in a one to
one ratio, and CTL partially decomposes to methylguanidine (MG) as shown
in figure.(1-1).
Figure. (1-14) Metabolic pathway of creatinine (91)
Urea is formed as a result of the catabolism of protein and amino acid
and is usually predominantly cleared from the body by the kidneys. Synthesis
from amino acid and nitrogen derived enzymes of the urea cycle (92)
. Certain
exogenous factors are known to affect urea concentration which includes high
protein intake, increased protein catabolism, reabsorption of blood proteins
dehydration and post cortisol treatment(93)
. Decrease in renal blood flow
results in decrease in globular filtration rate this leads to decrease in distal

Chapter one Introduction
26
tubular flow rate which leads to increase in urea reabsorption and decreased
secretion which may be the reason for elevated serum urea concentration (17,93).
In available references I cannot find a path for urea as antioxidant
Figure (1-15) Structure of urea(94)
Chapter one Introduction
27
Aim of Study
1. Investigate oxidative stress effects using malondialdehyde and 8-
OHdG as markers and albumin, uric acid, urea, creatinin as
possible effective endogenous antioxidants, in serum of
hypertensive and cardiovascular diseases patients.
2. Investigate possible associations among markers and parameters
of oxidative stress in hypertension and cardiovascular diseases.
3. Investigate the possible effect of oxidative stress on glutathione-
S- transferase m1 gene that leading to weaken of defense system
of the body .

Chapter Two Subject, Materials and Methods
92
2.1 Subjects
The subject collected for this study include 56 female patients of two of
atherosclerosis diseases namely hypertensive (28) and cardiovascular
diseases(28) aged between 30–65 years referred to Ibn Alnafese hospital during
the period from November 2013 to March 2014. The diagnosis of disease was
made by physician with exclusion of presence of other diseases known to be
associated with elevated oxidative stress (cancer, diabetes, arthritis, or cystic
fibrosis and vitamin supplements taken in the last 4 weeks ).
For comparative purpose, age matching group of 28 healthy female devoid of
conditions like diabetes mellitus, epilepsy, psychiatric disorders or history of any
drug intake are selected as control group.
A systematic questionnaire for the various etiological factors of relevant
medical disorders (e.g. age, diabetes, blood pressure, varicocele, trauma,
smoking) was administered (Appendix )
2.2 Materials
2.2.1 Chemicals and biological materials
The chemicals and biological materials used in this work are listed in
table 2-1 below:
Table (2-1) : Chemicals and biological materials used in the study
Chemicals Suppliers
Agarose Promega(USA)
Albumin kit Biosystem (France)
Cholesterol kit Randox ( United Kingdom)
Creatinine kit Randox (United Kingdom)
DNA extraction kit Promega (USA)

Chapter Two Subject, Materials and Methods
03
DNA ladder Marker (100bP) Promega(USA)
Ethidium bromide Promega(USA)
GoTaq Green Master Mix Promega (USA)
GSTM1 Primers Alpha DNA (Canada)
HDL – Cholesterol kit Randox ( United Kingdom)
Loading dye Promega(USA)
Nuclease Free Water Promega (USA)
Na-EDTA, FeCl2 BDH (England )
Triglyceride kit Randox ( United Kingdom)
Thiobarbituric acid, Na2HPO4,
NaH2PO4.
Fluka (Germany)
Trichloroacetic acid Fluka (Germany)
TBE buffer Promega(USA)
Urea kit Biomerieux (France)
Uric Acid Kit Spinreact (Spain)
2.2.2 Instruments
Table (2-2) Apparatus and Equipment used in this study
Name of instrument Company
Centrifuge Hettich (Germany)
Deep freeze Froilabo ( France)
Electronic sensitive Balance DENVER (USA)
(Enzyme-Linked Immunosorbent
Assay) Elisa
Asys (Australia)
Gel Documentation system BioRad(USA)
Gel electrophoresis system Major Science (Japan)
Chapter Two Subject, Materials and Methods
03
Incubator BDH. (United Kingdom)
Microcenterifuge Eppendrof (Germany)
Micropipette (Automatic) Dragon (China)
Microwave LG (Thailand)
Nano drop Thermo (USA)
Refrigerator Samsung (Thailand)
Rotisserie Shaker Kolb (Germany) Karl
Thermocycler BioRad (USA)
UV- visible spectrophotometer Aple (Japan)
Water bath JEIO TECH (Korea)
Vortex Humatwist-Human (Germany)
2.3 Methods
2.3.1 Blood Sampling
Blood sampling was performed at 9.00 – 11.00 a.m. in the fasting state. A
10mL of venous blood was obtained. Two and half milliliter of these blood
samples were added into EDTA tubes and used for DNA extraction and remained
blood was allowed to clot for at least 10-15 min. at room temperature,
centrifuged for (10) min. at (4000 rpm). Serum was divided into several parts by
using sterilized eppindrof tubes, some for measuring the biochemical
parameters and the other part was stored at -40 °C until the time of MDA and 8-
OHdG assay.

Chapter Two Subject, Materials and Methods
09
2.3.2 Determination of Body Mass Index (BMI)
Height was measured to the nearest 0.5 cm and weight to the nearest 0.1 Kg.
Body mass index is calculated by dividing subjects weight (Kg) by their height
(m2). BMI is calculated as:
According to [WHO;and Fost] a BMI of (<16-18.5)indicates to underweight
while a person with ~ 15-16 sever underweight and <15 is very sever underweight
)95(, 18.5-24.9 indicates a person of normal weight . A person with a BMI of 25 -
29.9 is overweight , while person with BMI > 30-35 is moderately obese, > 35-40
severity obese and > 40 is very severity )96(
.
2.3.3 Determination of Hemoglobin (Hb)
A-Principle:
The Cell-Dyn 1700 System counts, sizes and classifies blood cells by
impedance and focused flow methods which incorporates electrical resistance
and electronic sizing principles. The Cell-Dyn 1700 system utilizes a
spectrophotometric method for hemoglobin concentration, which is measured
optically by absorbance at 540 nm )97(
B-Procedure:
Cell-dyn 1700 was needed approximately 30 μL from the whole blood
Venous to complete the assay. The tube of the blood samples was presented
under the needle and the start cycle trigger was pressed and then the results were
taken from the Cell-dyn 1700.

Chapter Two Subject, Materials and Methods
00
2.3.4 Lipid Profile
2.3.4.1 Determination of Serum Cholesterol
Serum cholesterol level was measured by enzymatic end point method
supplied by Giesse Diagnostic. This was determined by totally enzymatic method
as supplied by Randox Company.
A-Principle:
The colorimetric measurement of cholesterol is performed using the
commercially available kits for total cholesterol estimation which based on .In the
presence of cholesterol esterase, the cholesterol esters in the sample are hydrolyzed
to cholesterol and free fatty acid. The cholesterol produced is oxidized by cholesterol
oxidase to Cholesterol-3-one and hydrogen peroxide is then detected by a
chromogenic oxygen acceptor , phenol aminopyrine, in the presence of peroxidase
)98(.
Cholesterol ester Cholesterol esterase
Cholesterol +fatty acid
Cholesterol +O2 Cholesterol oxidase
Cholesterol-3-one +H2O2
2H2O2 + phenol+4-aminoantipyrine Peroxidase
quinonmine + 4H2O
The red quinonimine formed is proportional to the amount of cholesterol
present in the sample
B- Solutions:
Reagent 1
4-Aminonitropyrine (0.3 mmol/L)
Phenol (6 mmol/L)
Peroxidase (≥ 0.5 U/mL)
Chapter Two Subject, Materials and Methods
03
Cholesterol esterase (≥ 0.1 U/mL)
Pipes Buffer (80 mmol/L ; pH 6.8)
Standard Cholesterol (5.1 mmol/L)
C-Procedures:
Three tubes were labeled as blank, sample and standard firstly. Ten μls of the
serum were added to sample tube. followed by adding 1ml of reagent1.
In standard tube 5.1 mmol/L of standard were added, then added 1ml of
reagent 1. Finally, 10 μl of ddH2O were mixed with 1 ml of reaction reagent in
blank tube. Reaction mixtures were mixed well, incubated for 5 min. at 37°C.
Samples and standard were read at 500 nm against blank.
D- Calculation:
A Sample
Cholesterol (mmol/L)= --------------- × Standard Concentration(5.1 mmol/L)
A Standard
2.3.4.2 Determination of Serum Triglyceride (TG)
Measuring of serum triglyceride concentration was done by colorimetric
method (with deprotinization) using kit provided by Randox ,laboratory Ltd-
United Kingdom.
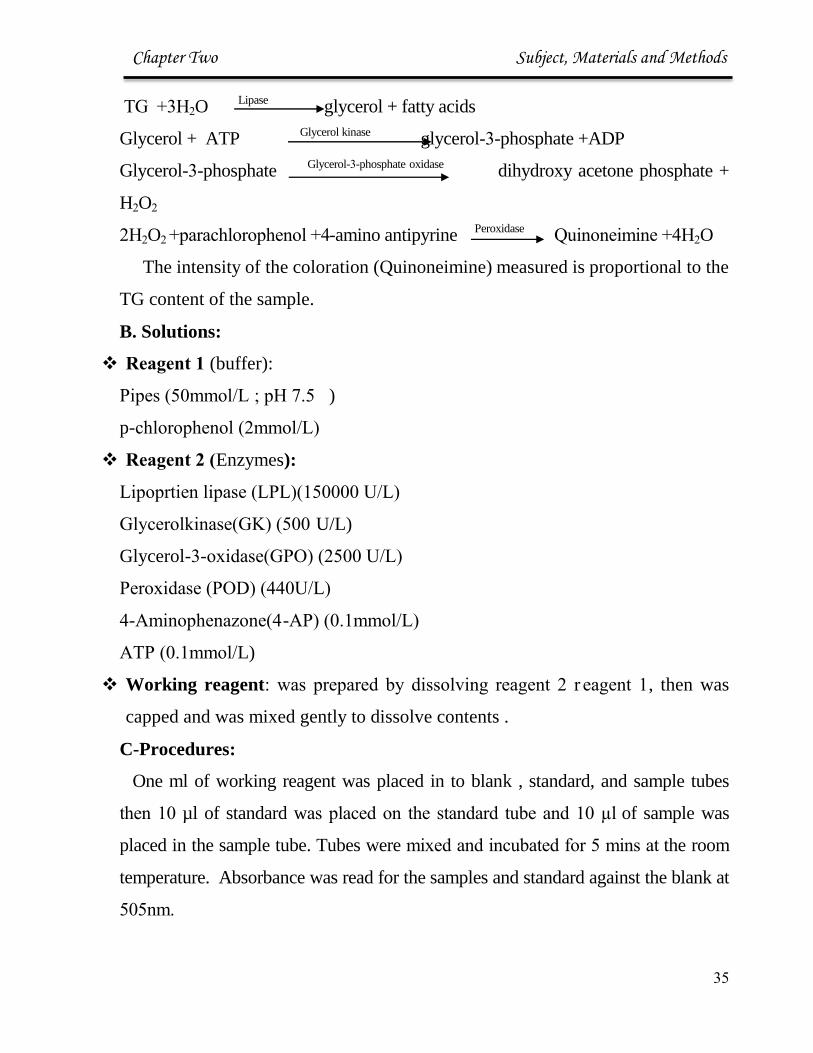
A-Principle:
The TG were determined after hydrolysis with lipase enzyme into fatty acids
and glycerol. The resultant glycerol is then phosphorelated in the presence of ATP
and glycerokinase to give hydrogen peroxide that react in presence of peroxidase
with 4-aminoantipyrine and parachlorophenol to give colored chromophene
quinoneimine as in the following equation )99(
:
Chapter Two Subject, Materials and Methods
03
TG +3H2O Lipase
glycerol + fatty acids
Glycerol + ATP Glycerol kinase
glycerol-3-phosphate +ADP
Glycerol-3-phosphate Glycerol-3-phosphate oxidase
dihydroxy acetone phosphate +
H2O2
2H2O2 +parachlorophenol +4-amino antipyrine Peroxidase
Quinoneimine +4H2O
The intensity of the coloration (Quinoneimine) measured is proportional to the
TG content of the sample.
B. Solutions:
Reagent 1 (buffer):
Pipes (50mmol/L ; pH 7.5 )
p-chlorophenol (2mmol/L)
Reagent 2 (Enzymes):
Lipoprtien lipase (LPL)(150000 U/L)
Glycerolkinase(GK) (500 U/L)
Glycerol-3-oxidase(GPO) (2500 U/L)
Peroxidase (POD) (440U/L)
4-Aminophenazone(4-AP) (0.1mmol/L)
ATP (0.1mmol/L)
Working reagent: was prepared by dissolving reagent 2 r eagent 1, then was
capped and was mixed gently to dissolve contents .
C-Procedures:
One ml of working reagent was placed in to blank , standard, and sample tubes
then 10 µl of standard was placed on the standard tube and 10 µl of sample was
placed in the sample tube. Tubes were mixed and incubated for 5 mins at the room
temperature. Absorbance was read for the samples and standard against the blank at
505nm.

Chapter Two Subject, Materials and Methods
03
D- Calculation:
Triglyceride (mmol/L) = A Sample x standard concentration (2.2 mmol/L)
A Standard
2.3.4.3 Determination of Serum High-Density Lipoprotein-
Cholesterol (HDL-Cholesterol)
A. Principle:
The chylomicrons and lipoproteins of VLDL and LDL contained in the sample
are precipitated by the addition of phosphotungistic acid in the presence of
magnesium ions.
The supernatant obtained after centrifugation contains HDL. From which the
cholesterol can be determined using the cholesterol enzymatic reagent and by
following the same method for total cholesterol estimation )100(
.
B. Solutions:
Reagent (1):
Phosphotungstic acid (0.55 mmol / L)
Magnesium chlorid (25 mmol /L)
pH 6.2
Cholesterol Enzymatic working solution:
Cholesterol oxidase (300 U / L)
Peroxidase (1250 U / L)
Cholesterol esterase (300 U / L)
4 – Amino phenazone (0.4 mmol / L)
Reagent (2) standard
Cholesterol (50 mmol / L)

Chapter Two Subject, Materials and Methods
03
C-Procedures:
In test tube 0.5 μls of the serum and 0.5 μls of reagent 1 were added and
mixed well, followed by centrifugation at 3000 rpm for 10 minutes then the
supernatant obtained after centrifugation contained HDL-cholesterol from which
the cholesterol can be determined using the cholesterol enzymatic reagent and by
following the same method for total cholesterol estimation .
D- Calculation:
A Sample
HDL- Cholesterol = ---------------× Standard Concentration(50 mmol / L) ×2*
A Standard
2* =Factor of dilution
2.3.4.4 Determination of Serum Low-Density Lipoprotein-
Cholesterol (LDL-Cholesterol)
Low-density lipoprotein-cholesterol was estimated by using formula of
friedwald )101(
Principle:
LDL-cholesterol is very difficult to isolate and measure .Hence, LDL level is
most usually derived by the Friedwalds formula as follows
LDL- cholesterol = Total cholesterol – [HDL- cholesterol + TG/5]

Chapter Two Subject, Materials and Methods
03
2.3.4.5 Determination of Serum Very Low-Density Lipoprotein-
Cholesterol (LDL- Cholesterol)
Very low-density lipoprotein- cholesterol was estimated by using formula of
Friedwald )101(
[VLDL-Cholesterol] = TG/5
2.3.5 Determination of Serum Malondialdehyde Level (MDA)
A-Principle:
Lipid peroxidation end products, particularly malondialdehyde (MDA) react
with thiobarbituric acid under acidic conditions and heating to give a pink color
that is measured spectrophotometrically at 532 nm )102(
.
The molar extinction coefficient of MDA is 1.56 X 10⁵ M
-1 cm
-1 .
B-Solution:
17.5% w/v trichloroacetic acid (TCA)
0.6% w/v 2-thiobarbituric acid (TBA)
70% w/v TCA
N
N
OH
OHHS
CH2
CHO
CHO
+
N
N
OH
SHOH
N
N
CH CH = CH
S OH
OH
+ 2H2O
TBA MDA Product (red color)
Chapter Two Subject, Materials and Methods
02
C-Procedure:
Sequentially 0.25 ml of serum , 0.5 ml 17.5% TCA and 0.5 ml 0.6% TBA
were added to sample tube and mix well; sample tubes were boiled for 30 mins.
After cooling, 1 ml of 70% TCA is added with mixing; allow standing at room
temperature for 20 minutes. Clear supernatant was separated after centrifuge at
3000 rpm for 15 minutes and read at 532 nm against blank
Blank was prepared by adding 0.25 ml distilled water instead of test serum and
processed similarly.
D- Calculation:
6
1-1-510factorDilution
mol cm 101.56
sample of Absorbance)(μμmol/SerumMDA
Dilution factor = 9.
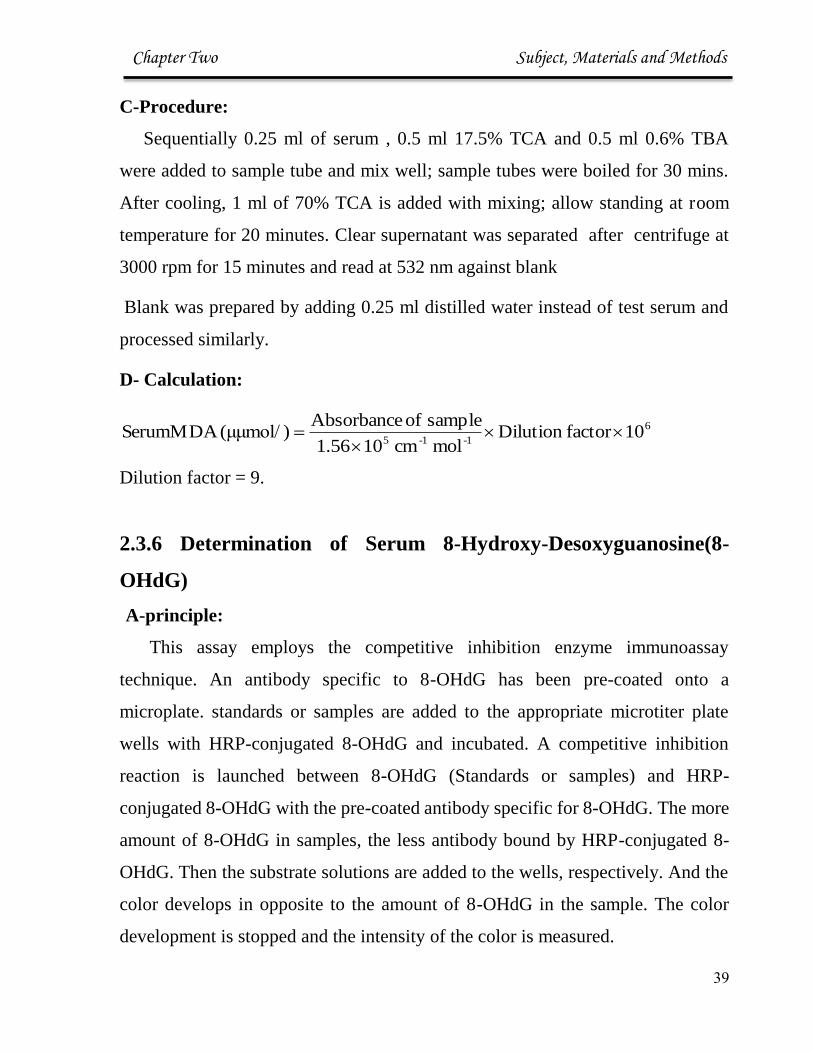
2.3.6 Determination of Serum 8-Hydroxy-Desoxyguanosine(8-
OHdG)
A-principle:
This assay employs the competitive inhibition enzyme immunoassay
technique. An antibody specific to 8-OHdG has been pre-coated onto a
microplate. standards or samples are added to the appropriate microtiter plate
wells with HRP-conjugated 8-OHdG and incubated. A competitive inhibition
reaction is launched between 8-OHdG (Standards or samples) and HRP-
conjugated 8-OHdG with the pre-coated antibody specific for 8-OHdG. The more
amount of 8-OHdG in samples, the less antibody bound by HRP-conjugated 8-
OHdG. Then the substrate solutions are added to the wells, respectively. And the
color develops in opposite to the amount of 8-OHdG in the sample. The color
development is stopped and the intensity of the color is measured.
Chapter Two Subject, Materials and Methods
33
B- solution:
Standards: ( 2, 8, 40, 200 and 800) ng/mL
HRP-conjugate
Wash Buffer
Substrate A
Substrate B
Stop Solution
C- Procedure:
8-Hydroxy-desoxyguanosine measured in serum sampled were conducted
according to manufacture protocol CUSABIO/China as the quantitative
determination of endogenic human 8-OHdG concentration (Test Kit No.CSB-
E10140h). 50μL of Standard or Sample was added per well then 50μl of HRP-
conjugate were added to each well (not to Blank well), Mixed well and then
incubated for 1 hour at 37°C.
Wells were wished with wash buffer three times. Then 50μL of Substrate A and
Substrate B were added to each well, mixed well and incubated for 15 minutes at
37°C.
The reaction was stopped by added 50μL of Stop Solution. The concentration
were determined by absorption at 450 nm using microplate reader.
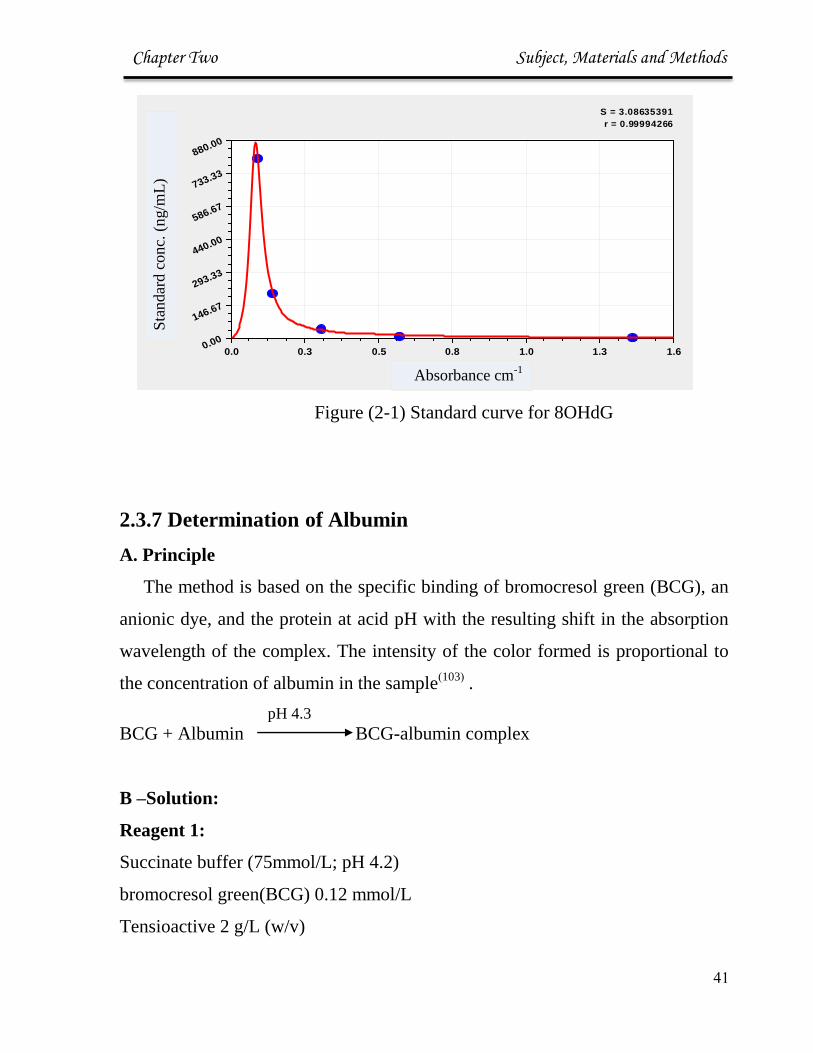
D-Calculation:
Standard curve created by reducing the data using computer software and then
by the same program calculation the concentration of samples.
Chapter Two Subject, Materials and Methods
33
Figure (2-1) Standard curve for 8OHdG
2.3.7 Determination of Albumin
A. Principle
The method is based on the specific binding of bromocresol green (BCG), an
anionic dye, and the protein at acid pH with the resulting shift in the absorption
wavelength of the complex. The intensity of the color formed is proportional to
the concentration of albumin in the sample)103(
.
pH 4.3
BCG + Albumin BCG-albumin complex
B –Solution:
Reagent 1:
Succinate buffer (75mmol/L; pH 4.2)
bromocresol green(BCG) 0.12 mmol/L
Tensioactive 2 g/L (w/v)
S = 3.08635391
r = 0.99994266
X Axis (units)
Y A
xis
(u
nit
s)
0.0 0.3 0.5 0.8 1.0 1.3 1.60.00
146.67
293.33
440.00
586.67
733.33
880.00
Sta
nd
ard
co
nc.
(n
g/m
L)
Absorbance cm-1
Chapter Two Subject, Materials and Methods
39
Albumin standard: Bovine serum albumin (5 g/dL (50g/L)).
C- Procedure
Two tubes were labeled as blank, sample and standard firstly. 10 μL of the
serum and of 2mL of BCG were added to sample tube.
In standard tube 10 μL of standard were added, , then 2ml of BCG were added,
mixed and let to stand for 1 minute at room temperature. Read the absorbance (A)
of the samples and the standard at 630 nm against the reagent blank(BCG).
2.3.8 Determination of Serum Uric Acid
Serum uric acid level was measured by enzymatic method supplied by Giesse
Diagnostics)104(
.
A-Principle:
Uric acid is oxidized by uricase to allantoin and hydrogen peroxide.The released
hydrogen peroxide together with 3-hydroxy-2,4,6-triiodobenzoic acid and 4-amino
antipyrine ,in the presence of peroxidase ,form a red dye compound. The intensity of
the red color produced is directly proportional to the uric acid quantity in serum.
Uric acid + O2 +H2O Uricase
H202+ allantoin
2H2O2+ [ 3-hydroxy-2,4,6-triiodobenzoic acid] + 4-amino- antipyrine Peroxidase
H2O+quinonimine
B-Solution:
Reagent 1 (Buffer solution)
phosphate buffer (50 mmol/L; pH 7.4)

Chapter Two Subject, Materials and Methods
30
2-4dichlorophenol sulfonate (DCPS) (4 mmol/L)
Reagent 2 (vial of enzymes)
Uricase (70 U/L)
Peroxidase( 660 U/L)
Reagent 3
Standard Uric acid (60 mg/L )357umol/L
Working reagent was prepared by dissolved reagent 2 in reagent 1 .
C- Procedure:
Two tubes were labeled as sample and standard . 25 μLs of the serum and
standard were added to labeled tubes respectively then 1ml of working reagent was
added.
All tubes were mixed well and incubated for 5 minute at 37 oC . Sample and
standard were read at 510 nm against blank(Working reagent).
2.3.9 Determination of Serum Urea
Blood urea level was measured by enzymatic colorimetric (Berthelot
modified method) method supplied by Biomerieux company.
A-Principle
Urease catalyses the conversion of urea to ammonia. In a modified Berthelot
reaction ,the ammonium ions react with a mixture of salicylate, hypochlorite and
nitroprusside to yield a blue-green (Indophenol).The absorbance of this dye is
proportional to the concentration of urea in the sample: )105(
.
Chapter Two Subject, Materials and Methods
33
Urea +H2O Urease
2NH3+CO2
NH3 +salicylate +hypochloritic Nitroprusside
2,2-dicarboxy indophenol
B- Solution:
Reagent (1) Standared Urea 8.3 mg/dL
Reagent (2) ( Enzyme ) Urease 350 KU/L
Reagent (3) Color reagent:
Phosphate buffer (50 mmol/L ; pH 8)
Sodium Salisylate (62 mmol/L)
Sodium Nitroprusside (3.35 mmol/L)
EDTA(1 mmol/L)
Reagent (4)
Alkaline reagent
Sodium Hydroxide NaOH (0.5 mmol/L)
Sodium Hypocloride NaClO (24.8 mmol)
C-Procedures:
Three tubes were labeled as blank, sample and standard firstly. 10 μLs of the
serum were added to sample tube. Followed by adding 1mL of reagent 1.
In standard tube 10 μLs of standard were added, then diluted with 1mL of
reagent 1.
In blank tube 1ml of reagent 1 was added. All tubes were mix well and incubated
for 5 minute at 37 oC. Finally, 1mL of reagent 4 were added to all tubes, mixed
well and incubated for 5 minute at 37 oC .Sample and standard were read at 590
nm against blank.

Chapter Two Subject, Materials and Methods
33
D-Calculation:
A Sample
Urea (mmol/L) = ---------------------- × Standard Concentration(8.3 mg/dL)
A Standard
2.3.10 Determination of Serum Creatinine
A-Principle
Creatinine in alkaline solution reacts with picric acid to form a colored
complex. The amount of the complex formed is directly proportional to the creatinine
concentration )106(
.
B- Solution:
Reagent1: Picric acid 25 mmol/L
Reagent 2: Alkaline buffer
Phosphate buffer (300 mmol/L ; pH 12.7 )
SDS (2.0 g/L (w/v))
Creatinine standard 177µmol/L (2 mg/dL)
Working reagent: Mix 1 volume of reagent1 and 1 volume of reagent 2.
C-Procedures:
Two tubes were labeled as sample and standard. 100 μls of the serum ,
standard were added to labeled tubes. followed by adding 1ml of reagent 1 to
each tube.

Chapter Two Subject, Materials and Methods
33
In blank tube 1ml of reagent 1 mixture was added. Then mix well and the
absorbance A1 was read after 30 seconds of the standard and sample. Exactly 2
minutes later, absorbance A2 of standard and sample was read all against blank.
D-Calculation:
∆ A sample = A2 – A1
Creatinine (mmol/L) = (∆ A sample / ∆ A standard ) * standard
concentration(2.03 mmol/L)
2.3.11 Molecular Biological Studies:
2.3.11.1 DNA Extraction
Principal:
The ReliaPrep™ gDNA Miniprep System provides a fast, simple technique
for preparation of purified and intact DNA from mammalian. Samples are
processed using a binding column in a micro centrifuge tube. The genomic DNA
isolated is of high-quality and can be used in common applications such as
Agarose gel analysis, restriction enzyme digestion and PCR analysis )107(
Procedure of DNA Extraction from Blood
DNA Extraction from blood samples were conducted according to manufacture
protocol (Promega).200 µl of blood were added to tube containing the Protenase K
solution and mixed.Blood cells were lysised by adding cell Lysis Buffer (CLD)to
mixture and vorted properly. After incubation at 56°C for 10 minutes.
The mixture was then adjusted to high salt concentration binding Buffer (BBA)
and applied to silica-based column. Column were wished with wash solution by

Chapter Two Subject, Materials and Methods
33
centrifugation and then DNA eluted from the column with Nuclease-Free water. The
DNA concentration war determined by absorption at 260 nm using Nanodrope.
Procedure of DNA Extraction from Placenta
Fresh tissue placenta specimens were fixed by normal saline for 2 weeks then
washed several times with phosphate buffer saline pH=7.5, tissues were crushed and
homogenized in the same solution and the DNA was extracted according to
manufacture protocol ( Promega) ) 108(
2.3.11.2 Fenton Reaction in Vitro on Human DNA on placental and
healthy female DNA samples
Reagent:
(NH4)2Fe(SO4)2.6H2O
EDTA
H2O2 (0.3%)
sodium ascorbate
sodium acetate
thiourea
phosphate buffer
The Fe II EDTA solution was prepared by mixing equal volumes of 0.2 mM
(NH4)2Fe(SO4)2.6H2O and 0.4 mM EDTA.
Procedure:
In eppendorf tube added 10 µl of each Fe+2
EDTA solution, DNA(80 ng/ mL) ,
phosphate buffer , H2O2 (0.3%) and sodium ascorbate and premixed on the inside wall
of an Eppendorf tube and then immediately added to the DNA solution and allowed to
react for 2 min. Reactions were stopped by addition of 100μ L of a stop solution
containing 10 mM thiourea, 30 mM EDTA, and 0.6 mM sodium acetate.
Chapter Two Subject, Materials and Methods
33
These conditions were determined to result in no more than one strand break
per DNA molecule )109(
.
2.3.11.3 GSTM1 Deletions Analysis by PCR
Principal:
The GSTM1 deletion detection system consists of two primer pair using in
three PCR reactions which provide a simple and rapid method for the detection
of specific region that deleted in GSTM1 locus. This system is designed to detect
famous and candidate deletion occurring in GSTM1 region. The primers have
been combined into two reactions PCR. This makes it possible to determine the
presence or absence of GSTM1, null allele and microdeletions in GSTM1 gene
performing two independent PCR amplifications.
This Part of research has been done in Biotechnology department / Molecular
Biology Lab/ University of Al-Nahrain
Primers
PCR reaction was performed using 4 deletion-specific primers for GSTM1
which are (GSTM1 del. Up-F, GSTM1 del. Up-R, GSTM1 del. Do-F and
GSTM1 del. Do-R). These primers were designed from non-coding sequence
flanking the gene.
Lyophilized primers were dissolved in a nuclease free water to give a primary
concentration of (100 µM) (as stock solution). For working solution, 10µl of
stock was dilute with 90µl of nuclease free water to get (10 µM) as a final
concentration. The sequences of these primers were explained in (Table: 2-3):
Chapter Two Subject, Materials and Methods
32
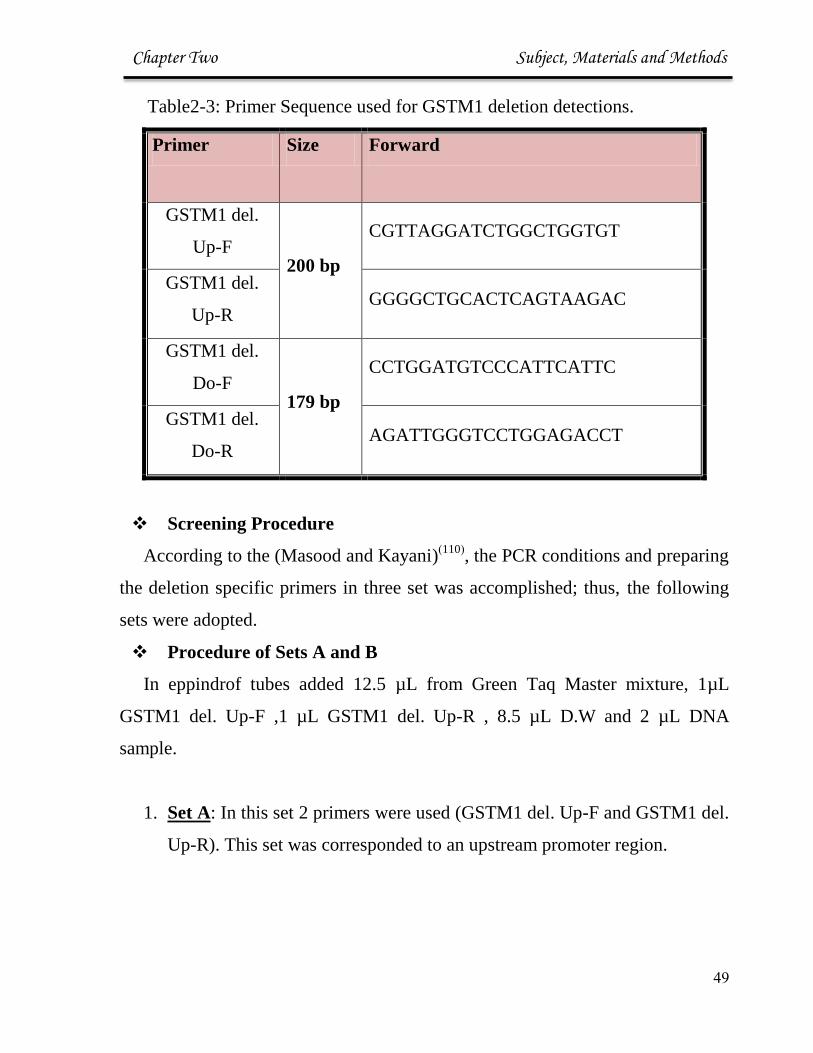
Table2-3: Primer Sequence used for GSTM1 deletion detections.
Primer Size Forward
GSTM1 del.
Up-F 200 bp
CGTTAGGATCTGGCTGGTGT
GSTM1 del.
Up-R GGGGCTGCACTCAGTAAGAC
GSTM1 del.
Do-F 179 bp
CCTGGATGTCCCATTCATTC
GSTM1 del.
Do-R AGATTGGGTCCTGGAGACCT
Screening Procedure
According to the (Masood and Kayani))110(
, the PCR conditions and preparing
the deletion specific primers in three set was accomplished; thus, the following
sets were adopted.
Procedure of Sets A and B
In eppindrof tubes added 12.5 µL from Green Taq Master mixture, 1µL
GSTM1 del. Up-F ,1 µL GSTM1 del. Up-R , 8.5 µL D.W and 2 µL DNA
sample.
1. Set A: In this set 2 primers were used (GSTM1 del. Up-F and GSTM1 del.
Up-R). This set was corresponded to an upstream promoter region.
Chapter Two Subject, Materials and Methods
33
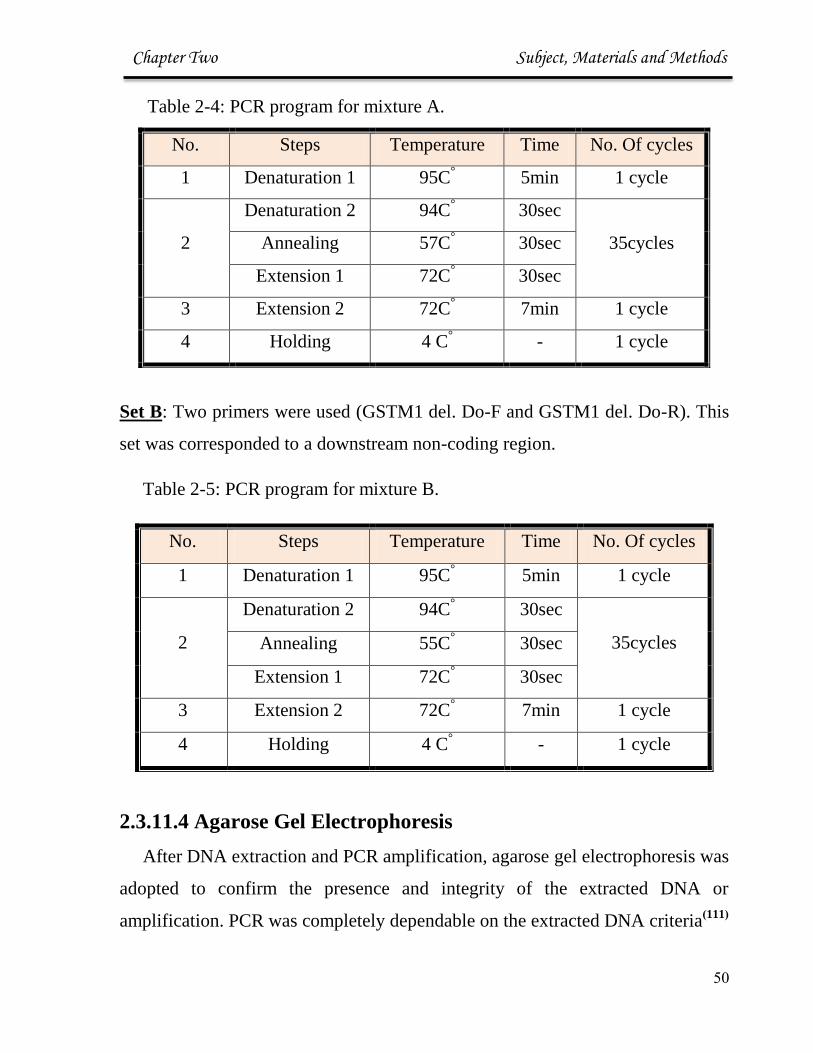
Table 2-4: PCR program for mixture A.
Set B: Two primers were used (GSTM1 del. Do-F and GSTM1 del. Do-R). This
set was corresponded to a downstream non-coding region.
Table 2-5: PCR program for mixture B.
No. Steps Temperature Time No. Of cycles
1 Denaturation 1 95C° 5min 1 cycle
2
Denaturation 2 94C° 30sec
35cycles Annealing 55C° 30sec
Extension 1 72C° 30sec
3 Extension 2 72C° 7min 1 cycle
4 Holding 4 C° - 1 cycle
2.3.11.4 Agarose Gel Electrophoresis
After DNA extraction and PCR amplification, agarose gel electrophoresis was
adopted to confirm the presence and integrity of the extracted DNA or
amplification. PCR was completely dependable on the extracted DNA criteria)111(
No. Steps Temperature Time No. Of cycles
1 Denaturation 1 95C° 5min 1 cycle
2
Denaturation 2 94C° 30sec
35cycles Annealing 57C° 30sec
Extension 1 72C° 30sec
3 Extension 2 72C° 7min 1 cycle
4 Holding 4 C° - 1 cycle
Chapter Two Subject, Materials and Methods
33
Solutions
1 X TBE buffer.
Loading dye.
DNA ladder marker.
Ethidium bromide (10mg / mL)
Procedure :
1- Preparation of Agarose Gel:
The gel with a final concentration of 1% of agarose was prepared by dissolved
1 g of agarose in 100 mL 1X TBE then heated until all gel particles were
dissolved .then added 1μL of Ethidium Bromide and stirred to get mixed and
then allowed to cool down at 20-25 0C.
2- Casting of the Horizontal Agarose Gel:
The agarose solution was poured into the gel tray after both the edges were
sealed with cellophane tapes and the agarose was allowed to gel at room
temperature for 30 minutes. The tray was filled with 1X TBE-electrophoresis
buffer until the buffer reached 3-5 mm over the surface of the gel.
3- DNA Loading
Two μL of loading buffer was applied to each 5μl DNA sample, and samples
were added carefully to the individual wells. PCR products were loaded directly.
Electrical power was turned on at 7v/cm for 2 h. DNA moves from Cathode to
plus Anode poles. The Ethidium bromide stained bands in gel were visualized
using Gel imaging system.

Chapter Two Subject, Materials and Methods
39
2.4 Statistical Analysis
All statistical analysis in studies were performed using SPSS
)112(.Descriptive analysis was used to show the mean and standard
deviation of variables. The significance of difference between mean
values was estimated by Student T-Test. The probability p≤ 0.05 =
significant, p> 0.05 = non-significant. Correlation analysis was used to
test the linear relationship between parameters.

Chapter Three Discussion
45
3.1 Patient Descriptive Data:
3.1.1 Distribution of Groups :
The present study included 84 subjects divided into three groups; two of
atherosclerosis volunteers patients, first one is the cardiovascular volunteers
patients (28 subjects), the second one is the hypertensive volunteers patients
(28 subjects), and 28 apparently healthy individuals as control group, all
shown in figure (3-1) below with their percentage
Figure (3-1): Distribution of studying group.
Control; n=28 33.33%
Hypertensive; n=28 33.33%
Cardiac disease; n=28
33.33%

Chapter Three Discussion
44
3.1.2 Clinical Feature of groups:
The clinical feature of the group in the underlying study ( shown in
table 3-1) which include; ages , body mass index, systolic and diastolic blood
pressure, hemoglobin and family history of diseases.
Table (3-1): Clinical Feature of Studying Group (mean ± SD):
* significance difference relative to control group with p< 0.05.
Hypertension
group
n=28
Control group
n=28
Cardiovascular
group
n=28
Characteristic
46.8±8.2 43.4±9.3 52.3±9.3 Age ( year)
31.48 ± 0.95* 27.27 ±0.97 32.59 ± 1.24* BMI ( Kg/ m2)
151.62±17.9* 119.5±3.96 136.94±5.46 Systolic blood
pressure(mmHg)
94.18±12.16 81.59±8.01 86.96±9.98 Diastolic blood
pressure (mmHg)
12.5±1.6 12.00±1.36 .1.1±.11.1 Hb g/dL
16 (57.14%) * 10(35.71%) 17 (60.72%) * Menopausal
no. (%)
*%(68114).8
%(46186).1 *%(16181)..
Menstruating
no. (%)
12(42.85%) 12(32.14%)
(For both diseases)
14(50%) Family history of
disease
no (%)

Chapter Three Discussion
45
The significant difference in BMI between CVD patients and control
group may be interpret the incident with that disease (p<0.05). This result was
agree with (Ngoungou B. et al) )113(
who recorded this relation as a risk factor
for cardiovascular incident. For coronary heart disease and mortality the risk
increases with increasing body mass indices BMIs >25 kg m-2
)114(
, obesity
increases total blood volume and cardiac output. Also cardiac workload is
greater in obesity. Typically, obese patients have a higher cardiac output but a
lower level of total peripheral resistance at any given level of arterial pressure.
Most of the increase in cardiac output with obesity is caused by stroke
volume(114)
.
The significant difference in BMI (p<0.05) between HT and control group
reveal the positive correlation between obesity and disease, this finding was
agree with (Ahmed A. et al) and (Shugar L et al) they found a significant
increase in BMI in hypertensive patients )39,115(
. Obese patients are more able
to be hypertensive than lean patients, and weight gain is typically associated
with increases in arterial pressure )116(
.
3.1.2 Groups According to Menopausal State :
From distributive data (table 3-1) there was a significant difference
(p<0.05) in menopausal and menstruating subjects. Further, inside the groups
(as shown in table 3-2), of cardiovascular group patients ; percent of
menstruating subjects was 11 (39.28%) which is differ significantly (p<0.05)
from menopausal subjects which is 17 (60.72%). Inside the hypertensive
group subjects the menstruating was 12(42.86%) and the menopausal subjects
16 (57.14%) .These results was agreed with several studies like (Roberta L
et al), ( Zanchetti et al) , (Megan et al), and (Masoumeh et al) . But disagree
with (Luoto et al).)117-121(
.
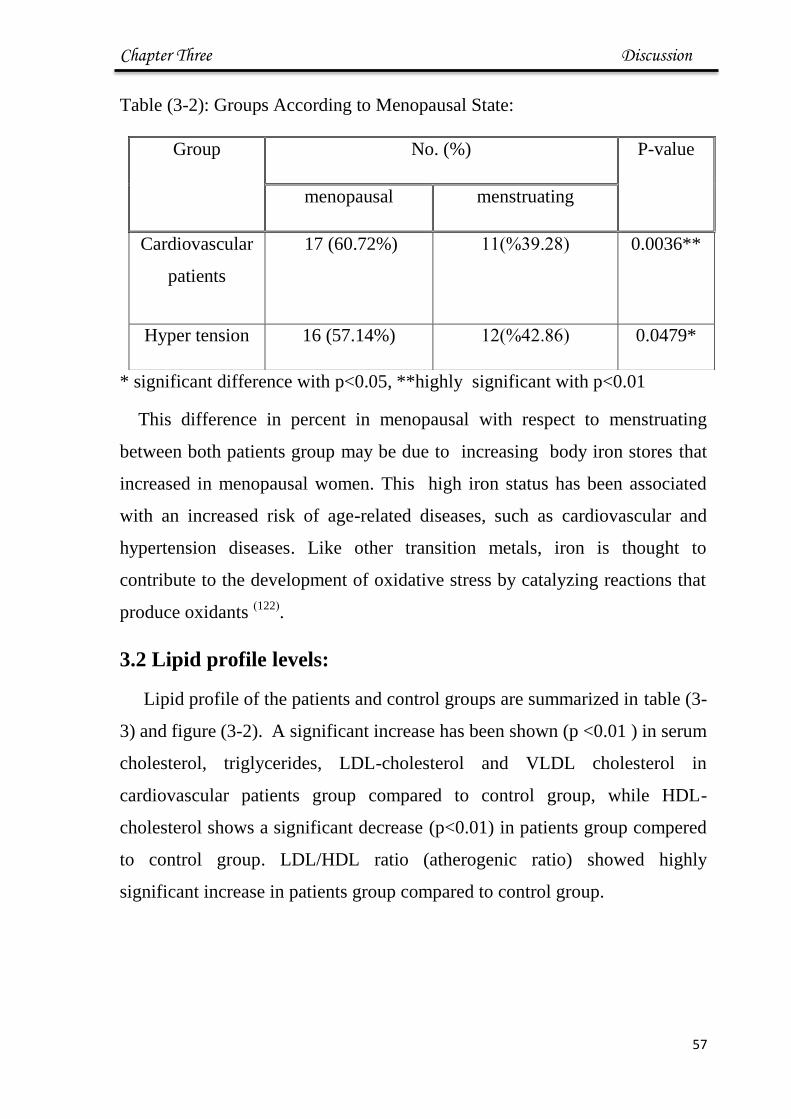
Chapter Three Discussion
46
Table (3-2): Groups According to Menopausal State:
* significant difference with p<0.05, **highly significant with p<0.01
This difference in percent in menopausal with respect to menstruating
between both patients group may be due to increasing body iron stores that
increased in menopausal women. This high iron status has been associated
with an increased risk of age-related diseases, such as cardiovascular and
hypertension diseases. Like other transition metals, iron is thought to
contribute to the development of oxidative stress by catalyzing reactions that
produce oxidants )122(
.
3.2 Lipid profile levels:
Lipid profile of the patients and control groups are summarized in table (3-
3) and figure (3-2). A significant increase has been shown (p <0.01 ) in serum
cholesterol, triglycerides, LDL-cholesterol and VLDL cholesterol in
cardiovascular patients group compared to control group, while HDL-
cholesterol shows a significant decrease (p<0.01) in patients group compered
to control group. LDL/HDL ratio (atherogenic ratio) showed highly
significant increase in patients group compared to control group.
Group No. (%) P-value
menopausal menstruating
Cardiovascular
patients
17 (60.72%) (16181)%..
0.0036**
Hyper tension 16 (57.14%) (68114)%.8 0.0479*
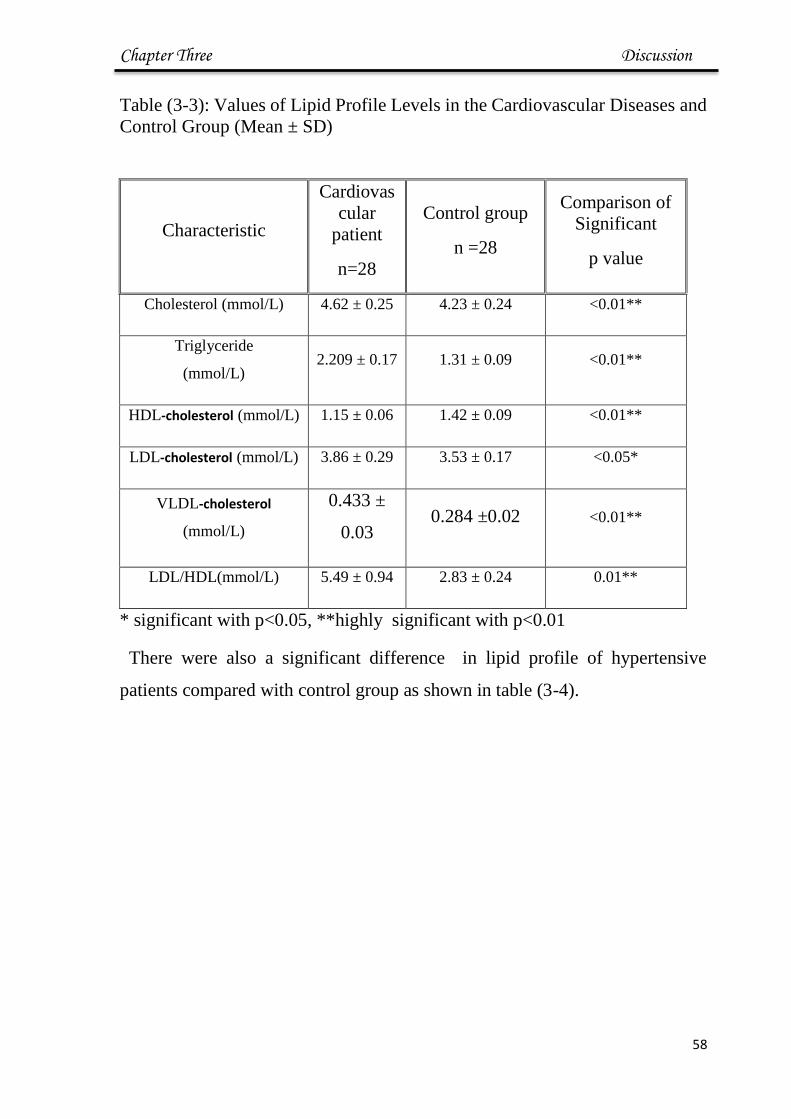
Chapter Three Discussion
47
Table (3-3): Values of Lipid Profile Levels in the Cardiovascular Diseases and
Control Group (Mean ± SD)
* significant with p<0.05, **highly significant with p<0.01
There were also a significant difference in lipid profile of hypertensive
patients compared with control group as shown in table (3-4).
Comparison of
Significant
p value
Control group
n =28
Cardiovas
cular
patient
n=28
Characteristic
<0.01** 4.23 ± 0.24 4.62 ± 0.25 Cholesterol (mmol/L)
<0.01** 1.31 ± 0.09 2.209 ± 0.17 Triglyceride
(mmol/L)
<0.01** 1.42 ± 0.09 1.15 ± 0.06 HDL-cholesterol (mmol/L)
<0.05* 3.53 ± 0.17 3.86 ± 0.29 LDL-cholesterol (mmol/L)
<0.01** 0.284 ±0.02 0.433 ±
0.03
VLDL-cholesterol
(mmol/L)
0.01** 2.83 ± 0.24 5.49 ± 0.94 LDL/HDL(mmol/L)
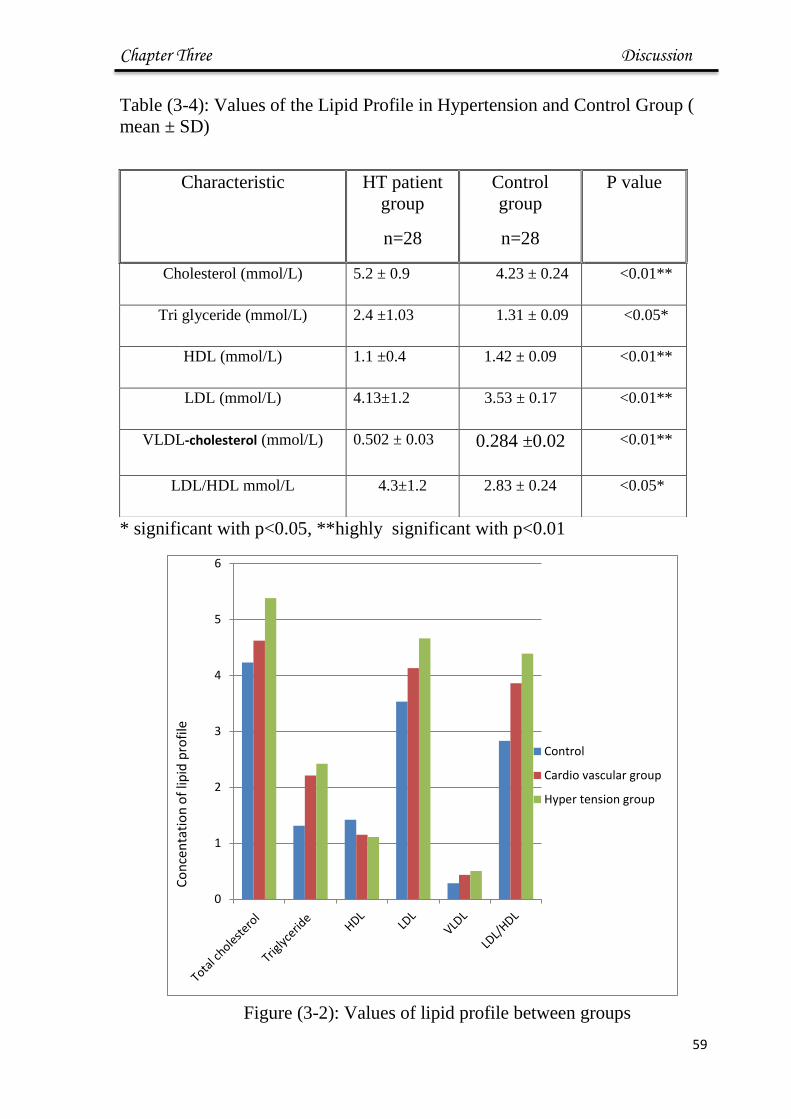
Chapter Three Discussion
48
Table (3-4): Values of the Lipid Profile in Hypertension and Control Group (
mean ± SD)
* significant with p<0.05, **highly significant with p<0.01
Figure (3-2): Values of lipid profile between groups
0
1
2
3
4
5
6
Control
Cardio vascular group
Hyper tension group
Co
nce
nta
tio
n o
f lip
id p
rofi
le
P value Control
group
n=28
HT patient
group
n=28
Characteristic
<0.01** 4.23 ± 0.24 5.2 ± 0.9 Cholesterol (mmol/L)
<0.05* 1.31 ± 0.09 2.4 ±1.03 Tri glyceride (mmol/L)
<0.01** 1.42 ± 0.09 1.1 ±0.4 HDL (mmol/L)
<0.01** 3.53 ± 0.17 4.13±1.2 LDL (mmol/L)
<0.01** 0.284 ±0.02 0.502 ± 0.03 VLDL-cholesterol (mmol/L)
<0.05* 2.83 ± 0.24 4.3±1.2 LDL/HDL mmol/L
Chapter Three Discussion
56
The significant increase in cholesterol in both groups (p<0.05) was agreed
with (Mohsen M. et al.))123)
which may be due to that cholesterol plaque
causes the muscle cells to enlarge and form a hard cover over the affected
area. This hard cover is what causes a narrowing of the artery, blood flow will
be reduced and increasing blood pressure. Plaques are covered with a fibrous
cap and it creates a bump on the artery wall, as the process of atherosclerosis
continues, the bump gets bigger. A big enough bump can create a blockage(2,4).
The significant increase in LDL (p<0.01) in cardiovascular patients is
agrees with study of (Jasim M.) )23(
which is may be due to that the LDL-
cholesterol invasion, crosses damaged endothelium.
The cholesterol enters into the area of the damaged vessel and deposit
there)124(
Inflammatory cells, like macrophages, will also enter the damaged
area, causing inflammation and engulfing the lipids. Once inside the vessel
wall, LDL-cholesterol particles get stuck and their content becomes more
prone to oxidation. The damage caused by the oxidized LDL-cholesterol
molecules triggers a cascade of immune responses which over time can
produce an atheroma. First, the immune system sends specialized white blood
cells (macrophages and T-lymphocytes) to absorb the oxidized LDL-
cholesterol, forming specialized foam cells. As a result, the macrophages will
often have a foamy appearance. These white blood cells are not able to
process the oxidized LDL-cholesterol )125(
. The LDL lipoprotein increase
atherogenicity and available data suggest that LDL is more atherogenic. The
figure 3-3 below explains this effect.
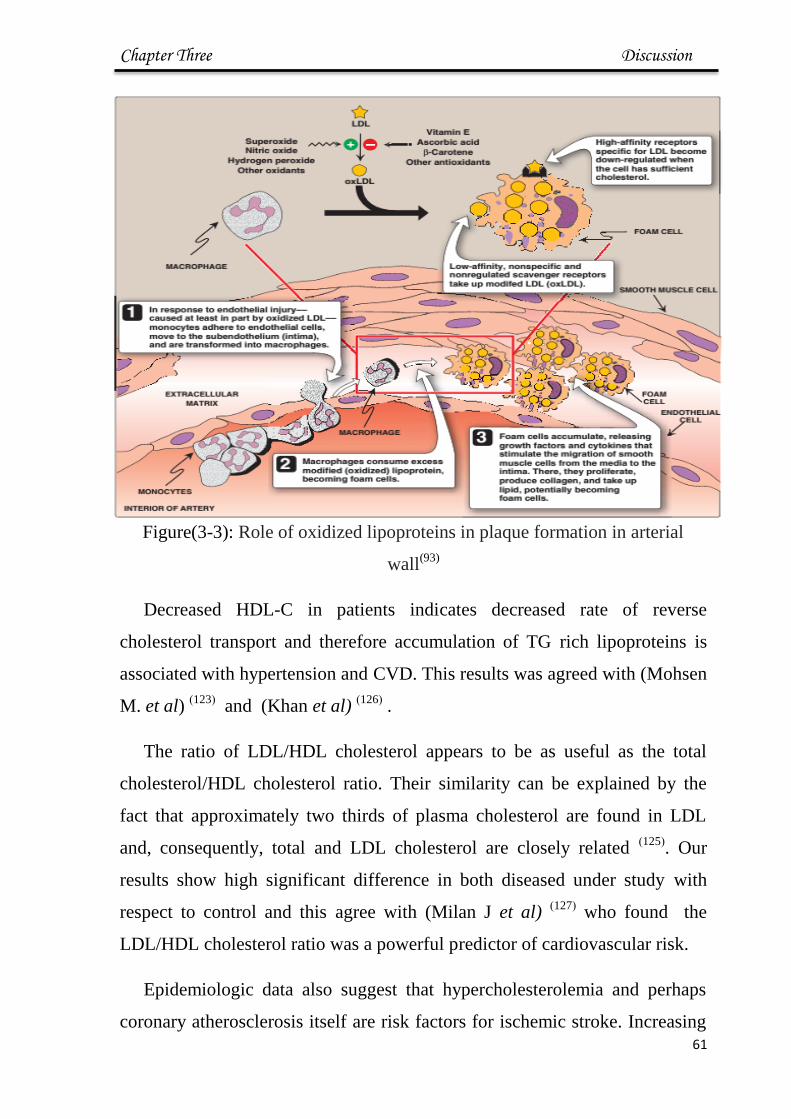
Chapter Three Discussion
56
Figure(3-3): Role of oxidized lipoproteins in plaque formation in arterial
wall(93)
Decreased HDL-C in patients indicates decreased rate of reverse
cholesterol transport and therefore accumulation of TG rich lipoproteins is
associated with hypertension and CVD. This results was agreed with (Mohsen
M. et al) )123(
and (Khan et al) )126(
.
The ratio of LDL/HDL cholesterol appears to be as useful as the total
cholesterol/HDL cholesterol ratio. Their similarity can be explained by the
fact that approximately two thirds of plasma cholesterol are found in LDL
and, consequently, total and LDL cholesterol are closely related )125(
. Our
results show high significant difference in both diseased under study with
respect to control and this agree with (Milan J et al) )127(
who found the
LDL/HDL cholesterol ratio was a powerful predictor of cardiovascular risk.
Epidemiologic data also suggest that hypercholesterolemia and perhaps
coronary atherosclerosis itself are risk factors for ischemic stroke. Increasing
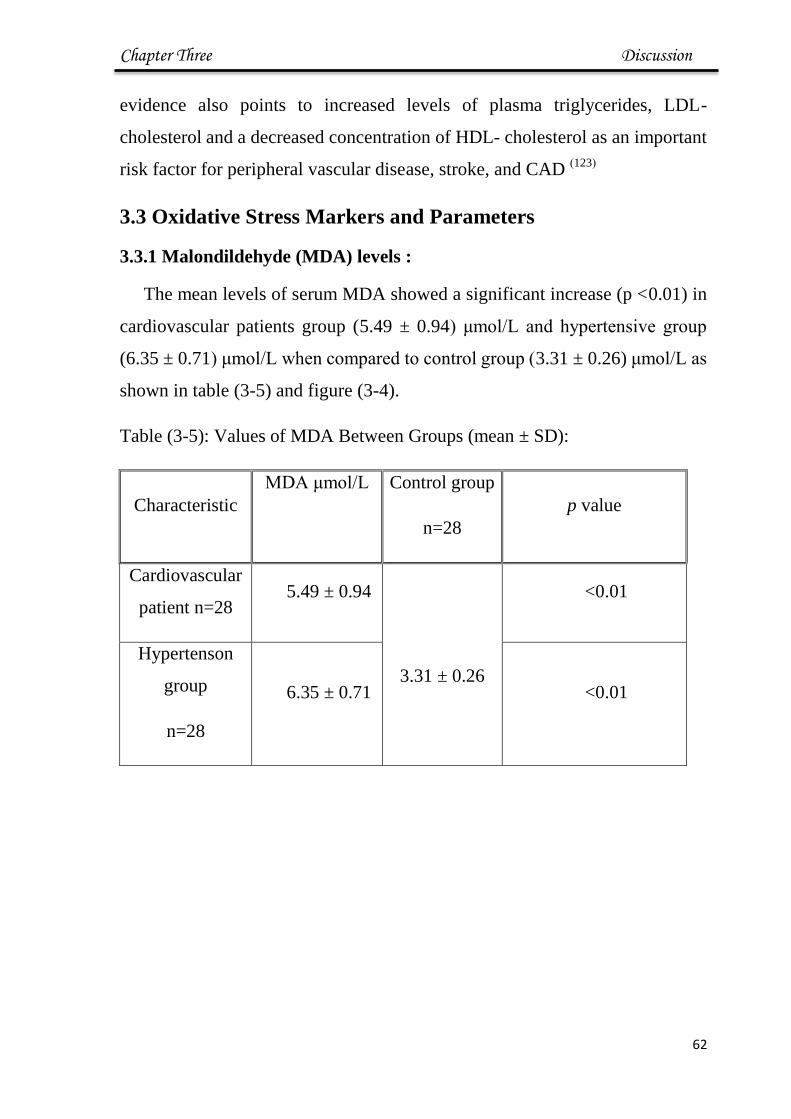
Chapter Three Discussion
56
evidence also points to increased levels of plasma triglycerides, LDL-
cholesterol and a decreased concentration of HDL- cholesterol as an important
risk factor for peripheral vascular disease, stroke, and CAD )123(
3.3 Oxidative Stress Markers and Parameters
3.3.1 Malondildehyde (MDA) levels :
The mean levels of serum MDA showed a significant increase (p <0.01) in
cardiovascular patients group (5.49 ± 0.94) μmol/L and hypertensive group
(6.35 ± 0.71) μmol/L when compared to control group (3.31 ± 0.26) μmol/L as
shown in table (3-5) and figure (3-4).
Table (3-5): Values of MDA Between Groups (mean ± SD):
p value
Control group
n=28
MDA μmol/L
Characteristic
<0.01
3.31 ± 0.26
5.49 ± 0.94 Cardiovascular
patient n=28
<0.01 6.35 ± 0.71
Hypertenson
group
n=28
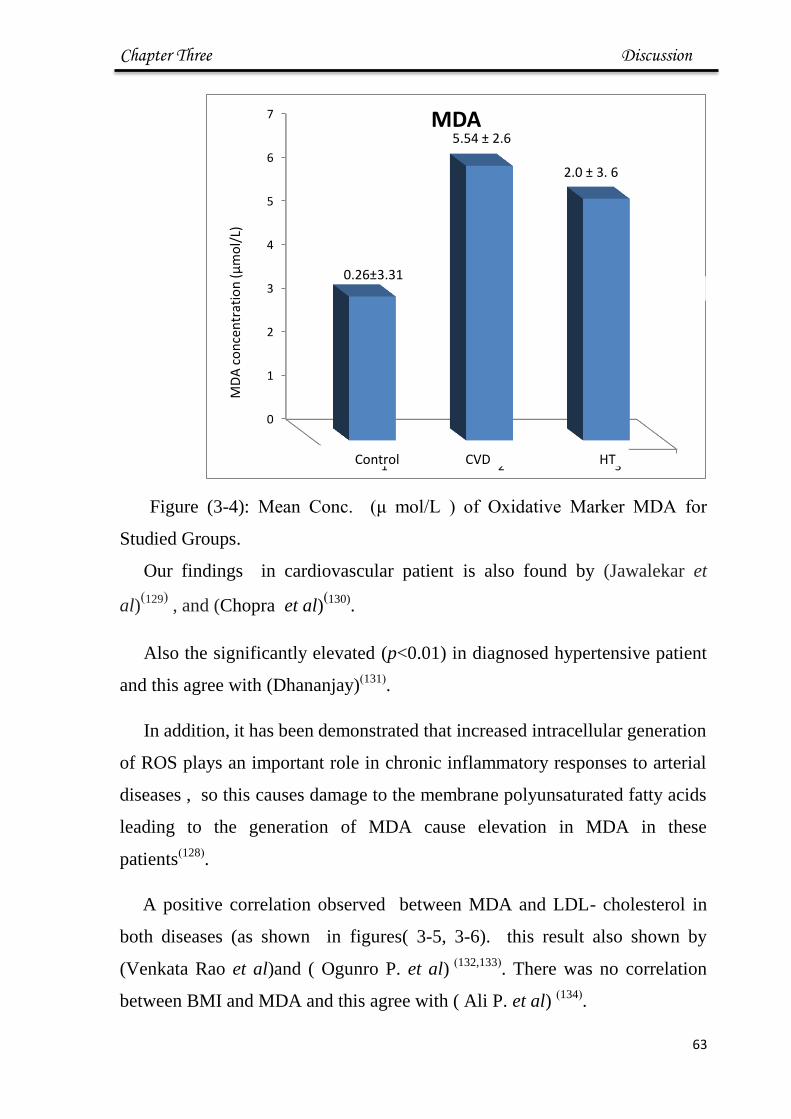
Chapter Three Discussion
56
Figure (3-4): Mean Conc. (μ mol/L ) of Oxidative Marker MDA for
Studied Groups.
Our findings in cardiovascular patient is also found by (Jawalekar et
al))129(
, and (Chopra et al))130)
.
Also the significantly elevated (p<0.01) in diagnosed hypertensive patient
and this agree with (Dhananjay))131(
.
In addition, it has been demonstrated that increased intracellular generation
of ROS plays an important role in chronic inflammatory responses to arterial
diseases , so this causes damage to the membrane polyunsaturated fatty acids
leading to the generation of MDA cause elevation in MDA in these
patients)128(
.
A positive correlation observed between MDA and LDL- cholesterol in
both diseases (as shown in figures( 3-5, 3-6). this result also shown by
(Venkata Rao et al)and ( Ogunro P. et al) )132,133(
. There was no correlation
between BMI and MDA and this agree with ( Ali P. et al) )134(
.
0
1
2
3
4
5
6
7
1 2 3
MDA
1سلسلة3.31±0.26
5.54 ± 2.6
6 .3 ± 2.0
Control CVD HT
MD
A c
on
cen
trat
ion
(μ
mo
l/L)

Chapter Three Discussion
55
Figure (3-5): Correlation of MDA with LDL in CVD Patients.
Figure (3-6): Correlation of MDA with LDL in Hypertensive Patients.
Lipid peroxidation produces reactive aldehydes such as MDA and MDA
acetaldehyde that form immunogenic adducts on for example LDL-cholesterol
particles. Hypercholesterolemia and hypertriglyceridemia are independent risk
factors that alone or together can accelerate the development of atherosclerosis
and progression of atherosclerotic lesions. One of the initial events in the
development of arterial diseases is the accumulation of cells containing excess
y = 0.0948x + 3.5303 R² = 0.1298
R= 0.30
0
1
2
3
4
5
6
7
0 5 10 15 20 25
LDL
con
. mm
ol/
L
MDA con μmol/L
LDL and MDA in CV
LDL CV.
LDL)خطي CV).
y = 0.6613x + 2.7841 R² = 0.0514
R= 0.4
0
2
4
6
8
10
12
14
0 1 2 3 4 5 6 7
LDL
co
n. m
mo
l/L
MDA conc. μmol/L
LDL and MDA in HT
LDL HT
(LDL HT)خطي
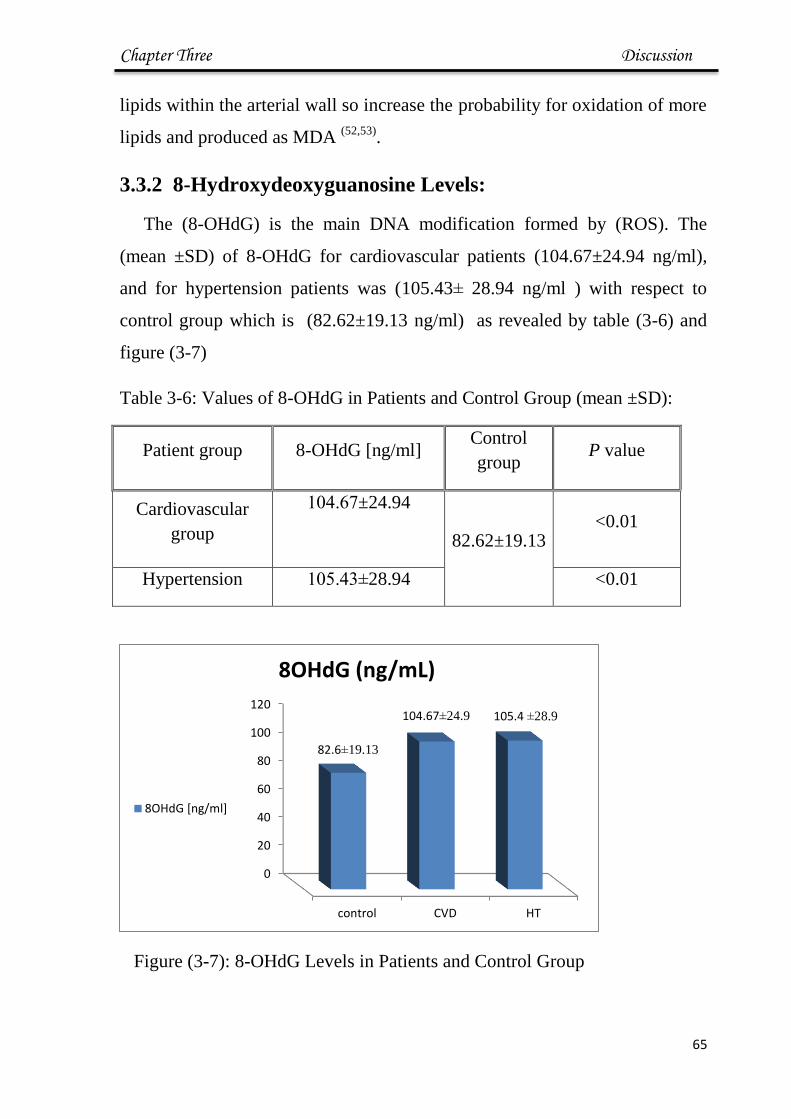
Chapter Three Discussion
54
lipids within the arterial wall so increase the probability for oxidation of more
lipids and produced as MDA (52,53)
.
3.3.2 8-Hydroxydeoxyguanosine Levels:
The (8-OHdG) is the main DNA modification formed by (ROS). The
(mean ±SD) of 8-OHdG for cardiovascular patients (104.67±24.94 ng/ml),
and for hypertension patients was (105.43± 28.94 ng/ml ) with respect to
control group which is (82.62±19.13 ng/ml) as revealed by table (3-6) and
figure (3-7)
Table 3-6: Values of 8-OHdG in Patients and Control Group (mean ±SD):
Patient group 8-OHdG [ng/ml] Control
group P value
Cardiovascular
group
±24.94.66141
82.62±19.13
<0.01
Hypertension 28.94±.61161 <0.01
Figure (3-7): 8-OHdG Levels in Patients and Control Group
0
20
40
60
80
100
120
control CVD HT
82.6±19.13
104.67±24.9 105.4 ±28.9
8OHdG (ng/mL)
8OHdG [ng/ml]
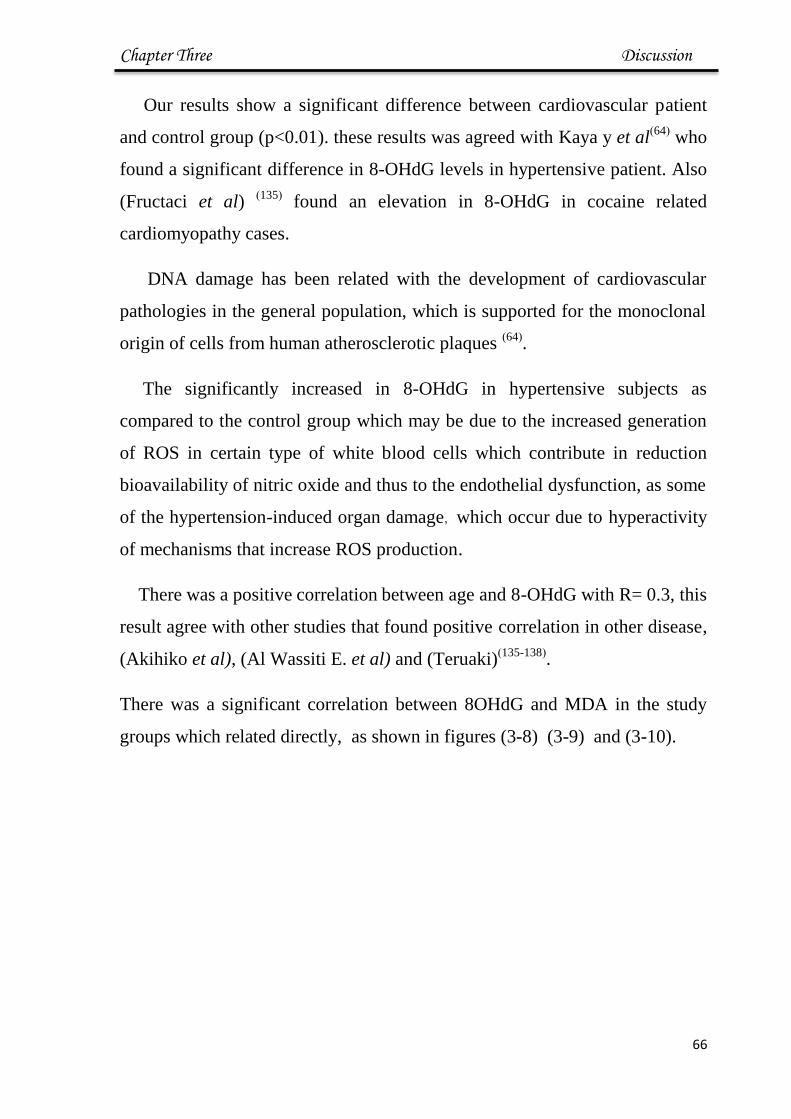
Chapter Three Discussion
55
Our results show a significant difference between cardiovascular patient
and control group (p<0.01). these results was agreed with Kaya y et al)64(
who
found a significant difference in 8-OHdG levels in hypertensive patient. Also
(Fructaci et al) )135(
found an elevation in 8-OHdG in cocaine related
cardiomyopathy cases.
DNA damage has been related with the development of cardiovascular
pathologies in the general population, which is supported for the monoclonal
origin of cells from human atherosclerotic plaques )64(
.
The significantly increased in 8-OHdG in hypertensive subjects as
compared to the control group which may be due to the increased generation
of ROS in certain type of white blood cells which contribute in reduction
bioavailability of nitric oxide and thus to the endothelial dysfunction, as some
of the hypertension-induced organ damage, which occur due to hyperactivity
of mechanisms that increase ROS production.
There was a positive correlation between age and 8-OHdG with R= 0.3, this
result agree with other studies that found positive correlation in other disease,
(Akihiko et al), (Al Wassiti E. et al) and (Teruaki))135-138(
.
There was a significant correlation between 8OHdG and MDA in the study
groups which related directly, as shown in figures (3-8) (3-9) and (3-10).

Chapter Three Discussion
56
Figure (3-8): Correlation Directly Between MDA and 8-OHdG for
Control group.
Figure ( 3-9 ): Correlation Directly Between MDA and 8-OHdG for
Hypertensive Group.
y = 5.2339x + 65.261 R=0.33
0
20
40
60
80
100
120
0 2 4 6 8 10
-8
OH
dG
ng/
ml
MDA conc. μmol /L
MDA and 8-OHdG for Cont.
MDA Cont
(MDA Cont)خطي
y = 7.6228x + 58.584 R=0.708
0
20
40
60
80
100
120
140
160
180
200
0 5 10 15
8 O
Hd
G n
g/m
l
MDA conc. μmol/L
MDA and 8-OHdG in HT
MDA HT
(MDA HT)خطي

Chapter Three Discussion
57
Figure ( 3-10 ): Correlation Directly Between MDA and 8-OHdG for
CVD Group
The direct correlation between these two parameters shows increasing
oxidative stress in all levels in the cell. The positive correlation between MDA
and 8OHdG was also found by (Sakona et al) in healthy supplier by
antioxidant nutrition(139)
.
3.3.3 Serum Albumin Levels:
The mean levels of total serum albumin showed a significant decrease in
both patients group when compared to control group (p<0.05) table 3-7 and
figure 3-11 show results :
y = 7.2488x + 71.413 R= 0.2533
0
20
40
60
80
100
120
140
160
180
200
0 2 4 6 8 10
8O
Hd
G (
ng/
ml)
MDA μg/ml
MDA and 8 OHdG in CVD
MDA CV
(MDA CV)خطي

Chapter Three Discussion
58
Table (3-7): Values of Albumin Between Groups ( mean ± SD):
Comparison of Significant
p value
Control group
n =28
Albumin g /L
Characteristic
<0.01
44.18 ±2.20
35.49 ± 1.47
Cardiovascular
patient N=28
<0.01 35.52 ± 1.84
Hypertension
group
N=28
Figure (3-11): Values for Albumin [g/L] in Patients and Control Groups
The results of the present study showed that the levels of albumin was
significantly decrease (p<0.01) in diagnosed cardiovascular and hypertensive
0
10
20
30
40
50
Control CVD HT
Albumin(g/L)
Albumin(g/L)
35.52 ± 1.84 35.49 ± 1.47
44.18 ±2.20

Chapter Three Discussion
66
patients which is agree with Liu et al in CVD and (Oda E) in
hypertention(140,141)
The decrease in albumin in patient is may be due to its function as
antioxidant activity.
The atherosclerosis has been considered as an inflammatory and
immunizing disease. It is widely accepted that inflammation represents a risk
factor for atrial fibrillation and for prothrombotic conditions. Different
molecules behave differently during an inflammatory phase; albumin
synthesis decreases, while other inflammatory globulins rise)142(
. In
hypertension which is not inflammatory disease in basic, the decrease in
albumin levels may be due to antioxidant activity more than its behavior as
acute phase protein.
There was a negative correlation between albumin and MDA as shown in
Figures (3-12),(3-13)
Figure(3-12): Correlation Between Albumin and MDA in CVD patients
y = -0.2551x + 36.681 R² = 0.0103
R= - 0.1
0
10
20
30
40
50
60
70
0 5 10 15 20 25
Alb
um
in g
/L
MDA μmol/L
MDA and Albumin in CVD
mda cv
( mda cv)خطي
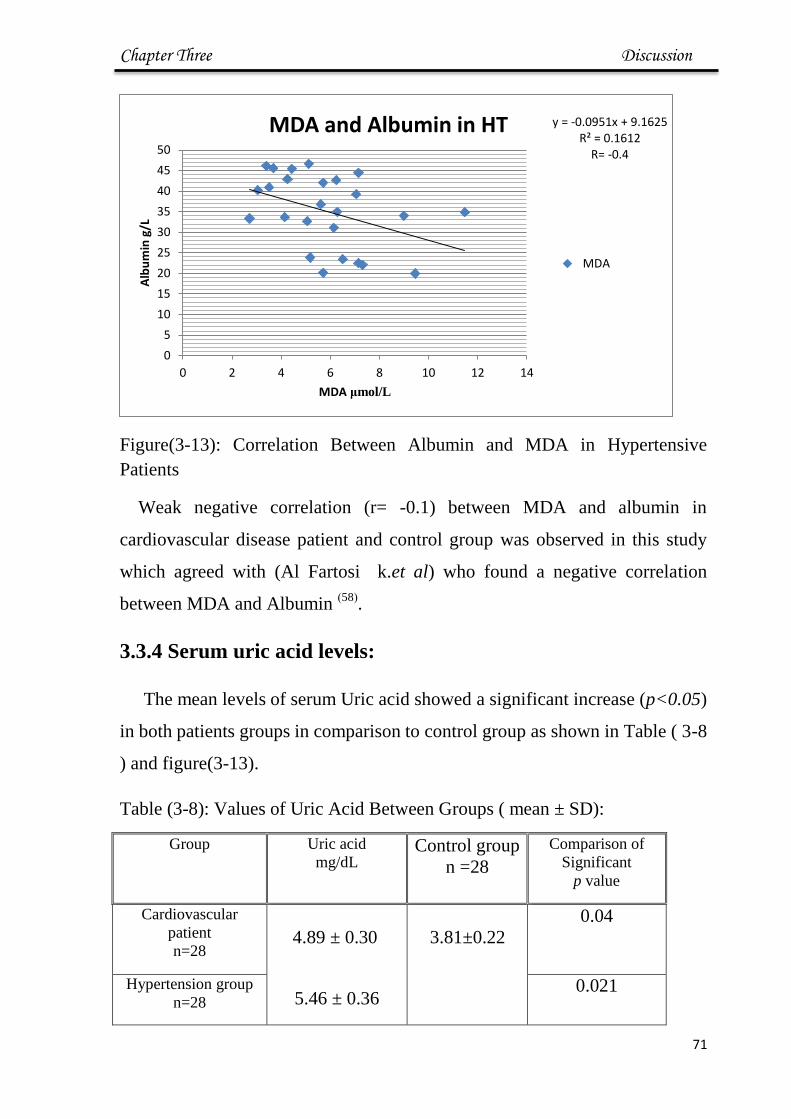
Chapter Three Discussion
66
Figure(3-13): Correlation Between Albumin and MDA in Hypertensive
Patients
Weak negative correlation (r= -0.1) between MDA and albumin in
cardiovascular disease patient and control group was observed in this study
which agreed with (Al Fartosi k.et al) who found a negative correlation
between MDA and Albumin )58(
.
3.3.4 Serum uric acid levels:
The mean levels of serum Uric acid showed a significant increase (p<0.05)
in both patients groups in comparison to control group as shown in Table ( 3-8
) and figure(3-13).
Table (3-8): Values of Uric Acid Between Groups ( mean ± SD):
Group Uric acid
mg/dL Control group
n =28
Comparison of
Significant
p value
Cardiovascular
patient
n=28
4.89 ± 0.30
5.46 ± 0.36
3.81±0.22
0.04
Hypertension group
n=28 0.021
y = -0.0951x + 9.1625 R² = 0.1612
R= -0.4
0
5
10
15
20
25
30
35
40
45
50
0 2 4 6 8 10 12 14
Alb
um
in g
/L
MDA μmol/L
MDA and Albumin in HT
MDA- P
(MDA- P)خطي

Chapter Three Discussion
66
Figure (3-14): Values for Uric Acid [mg/dL] in Patients and Control Groups
The current study shows that there were elevated level of serum uric acid
in patients groups when compared to control group and this results are agree
with other studies, who's reporting an elevation of uric acid in serum of
patients with CVD (Li Qin et al),( Cerezo C. et al), (Takayama S))143-145(
and
in hypertention disease (Ali Malek , Heinig M, Jin M.) )146-148(
. Our findings
reported the high results compared to control group which may be due to
disease conditions that overwhelming antioxidant activity of uric acid.
Uric acid was considered an inert waste product that crystallizes at high
concentrations to form renal stones and provoke gouty arthritis. Subsequently,
uric acid was recognized to be a powerful antioxidant that scavenges singlet
oxygen, oxygen radicals, and peroxynitrite and chelates transition metals, to
reduce, for instance, iron ion–mediated ascorbic acid oxidation. Together,
these antioxidant actions underlie the protective effects of uric acid action in
cardiovascular diseases )146(
Several studies have demonstrated a strong relationship between serum
uric acid levels and coronary heart disease (CHD) )143-145(
. Some studies
suggested that uric acid may be an independent related with for cardiovascular
disease )149(
. Increased serum uric acid was found to be associated with
important risk factors for atherosclerosis like hypertension.)143,147(
. Together,
0
1
2
3
4
5
6
cont CVD HT
3.8±0.22 4.89±0.3
5.46±0.36
Uric acid
Uric acid

Chapter Three Discussion
66
the available information indicates that uric acid has complex chemical and
biological effects and that its pro-oxidant or NO-reducing properties may
explain the association among hyperuricemia, hypertension, the metabolic
syndrome, and cardiovascular disease)150(
.
3.3.5 Serum Urea levels:
The mean levels of serum urea showed was higher significantly (p<0.05)
in both patients groups compared to control group as shown in Table ( 3-9 )
Table (3-9): Values of Urea in Studying Groups (mean±SD):
Group Urea
Control group
n =28
Comparison of
Significant p value
Cardiovascular
patient
n=28
5.57 ± 1.76
1.90±6181
0.04*
Hypertension group
n=28
5.8 ± 2.6 0.021*
* significant difference with p<0.05
The present study showed high level of the urea in patients groups when
compared to control group and this result agreed with ( Jasim N.) )23(
in CVD
and with (Rakhee et al) in hypertension and disagree with (Pragna Patel. et
al).152-153)

Chapter Three Discussion
65
3.3.6 Serum Creatinine Level:
The mean levels of serum creatinine of both patients groups compared to
control group are shown in table (3-10)
Table (3-10): Values of Creatinine in Studying Groups (mean±SD):
Group Creatinine
mg/L
Control group
n =28
Comparison of
Significant p value
Cardiovascular
patient
n=28
0.953 ± 0.16
0.701 ± 0.1
0.06
Hypertension
group n=28
1.09 ± 0.16 0.21
The results showed non-significant in Creatinine levels in patients groups
when compared to control group.
Urea is the major excretory product of protein metabolism. It is formed in
the liver from amino groups (-NH2) and free ammonia generated during
protein catabolism)17(
. In large cohorts of patients with acute and chronic heart
disease, an elevated urea has been shown to be a strong predictor of morbidity
and mortality)151(
.In the heart failure and hypertension the blood flow decrease
so less blood is delivered to the kidney; consequently, less urea is filtered )93(
.
A reduction in renal blood flow leads to a decrease of glumular filtration, this
is lead to a decrease distal tubular flow rate which lead to increase of urea
reabsorption and decreased secretion which may be the reason for elevated
serum urea concentration.)154(
.
There was no significant difference between patients ant control in
creatinine concentration, Creatinine produced as a waste product of muscle
creatine, about 1 % of the total muscle creatine pool is converted daily
creatinine through the spontaneous, nonenzymatic loss of water. Since it is

Chapter Three Discussion
64
released into the blood at a constant rate, and since its excretion is closely
matched to glomerular filtration rate)153(
.
3.4 Molecular Study:
3.4.1. DNA Isolation
Blood samples from controls and patients were used for DNA isolation
procedure at the same day blood sample were taken. Approximately, all
samples yielded intact genomic DNA, as shown in
(Figure 3-15)
Figure (3-15): Genomic DNA Profile from Blood Sample of Subjects,
Agarose gel (1%), 5 V/cm for 1 hr., Stained with Ethidium Bromide. Lane 1
placenta's DNA, lane 2-5 controls' DNA, lane 5-7 CVDs' group DNA, lane 8-
11 HTs' group DNA.
The concentration and purity of DNA was determined by nano drop
spectrophotometry and results are shown in table (3-11,3-12).
The 260/280 purity ratio of DNA purity with values for "pure" nucleic
acid commonly in the range of (1.8-2.2)(155)
.
1 1 2 3 4 5 6 7 8 9 10 11

Chapter Three Discussion
65
Table: (3-11) Concentrations of DNA of Study Groups (Mean± SD):
Group DNA conc. ng/μL DNA conc. of
Control n=28 p-value
Cardiovascular
patients n=28 88.05 ± 10.86
81.76 ±4.45
0.210
Hypertension
n=28 89.27 ± 7.73 0.83
Table: (3-12) Purity of Extracted DNA of Study Groups (Mean± SD):
Characteristic DNA purity Control
n=28
p-value
Cardiovascular
patients n=28
1.80 ± 0.02
1.83 ± 0.02
0.240
Hypertension
n=28
1.83 ± 0.07 0.852
3.4.2 Fenton Reaction in Vitro:
Active oxygen species such as superoxide anion radical
(O2●), hydrogen peroxide (H2O2), and hydroxyl radical (
●OH) can damage
almost all cell components, including DNA, membranes, and proteins )29(
.
Reduction of H2O2 by reduced transition metals results in the formation of
●OH and related oxidants via the Fenton reaction
)29.33(:
Fe2+
+ H2O2 + H+
Fe3+
+ H2O + ●OH
The produced hydroxide radical has been already done in vitro test tube
experiments under Fenton's reaction conditions. ●OH has damaging effect on

Chapter Three Discussion
66
DNA, it may cause denaturation for double strands, mutation, as a means of
inducing strand cleavage in DNA (156)
Placental DNA used as approximately unaffected DNA by oxidative stress.
Using fenton reaction to show oxidative stress effect on DNA, damaged of
placenta's and control's DNA was monitored by agarose gel electrophoresis
and the result show this effect.
Figure (3-16): Fenton reaction on DNA, lane 1: placenta's DNA, lane 2-
9 : DNA with Fenton's reaction 2- 14 min.
Placental DNA used as approximately unaffected DNA by oxidative stress
using fenton reaction to show oxidative stress effect on DNA This result agree
with (Plionical et al))157(
who suggested high concentration of H2O2 led to the
degradation of all of major membrane proteins.
3.4.3 Evalution of Glutathion S transferase mu Gene (GSTM1
gene) deletion:
Glutathione S - transferase (GST) modulates the effects of various
cytotoxic and genotoxic agents, GST ,along with other antioxidant enzymes,
1 2 3 4 5 6 7 8
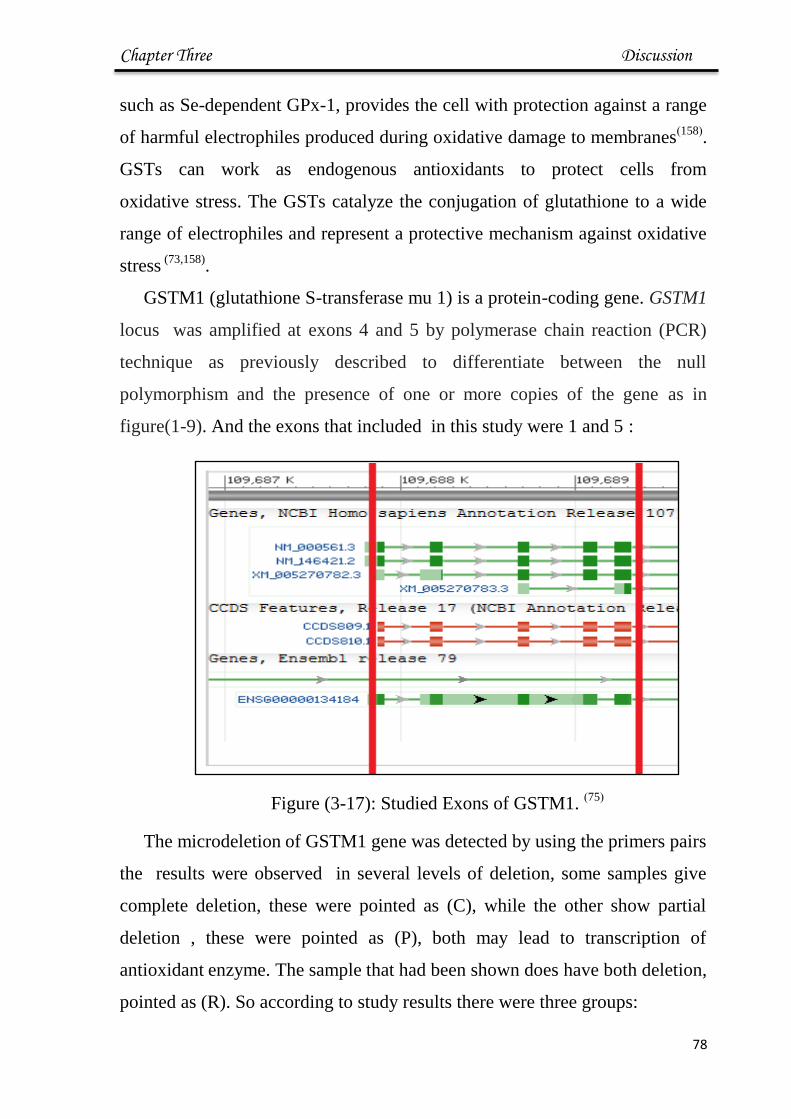
Chapter Three Discussion
67
such as Se-dependent GPx-1, provides the cell with protection against a range
of harmful electrophiles produced during oxidative damage to membranes)158(
.
GSTs can work as endogenous antioxidants to protect cells from
oxidative stress. The GSTs catalyze the conjugation of glutathione to a wide
range of electrophiles and represent a protective mechanism against oxidative
stress (73,158)
.
GSTM1 (glutathione S-transferase mu 1) is a protein-coding gene. GSTM1
locus was amplified at exons 4 and 5 by polymerase chain reaction (PCR)
technique as previously described to differentiate between the null
polymorphism and the presence of one or more copies of the gene as in
figure(1-9). And the exons that included in this study were 1 and 5 :
Figure (3-17): Studied Exons of GSTM1. )75(
The microdeletion of GSTM1 gene was detected by using the primers pairs
the results were observed in several levels of deletion, some samples give
complete deletion, these were pointed as (C), while the other show partial
deletion , these were pointed as (P), both may lead to transcription of
antioxidant enzyme. The sample that had been shown does have both deletion,
pointed as (R). So according to study results there were three groups:
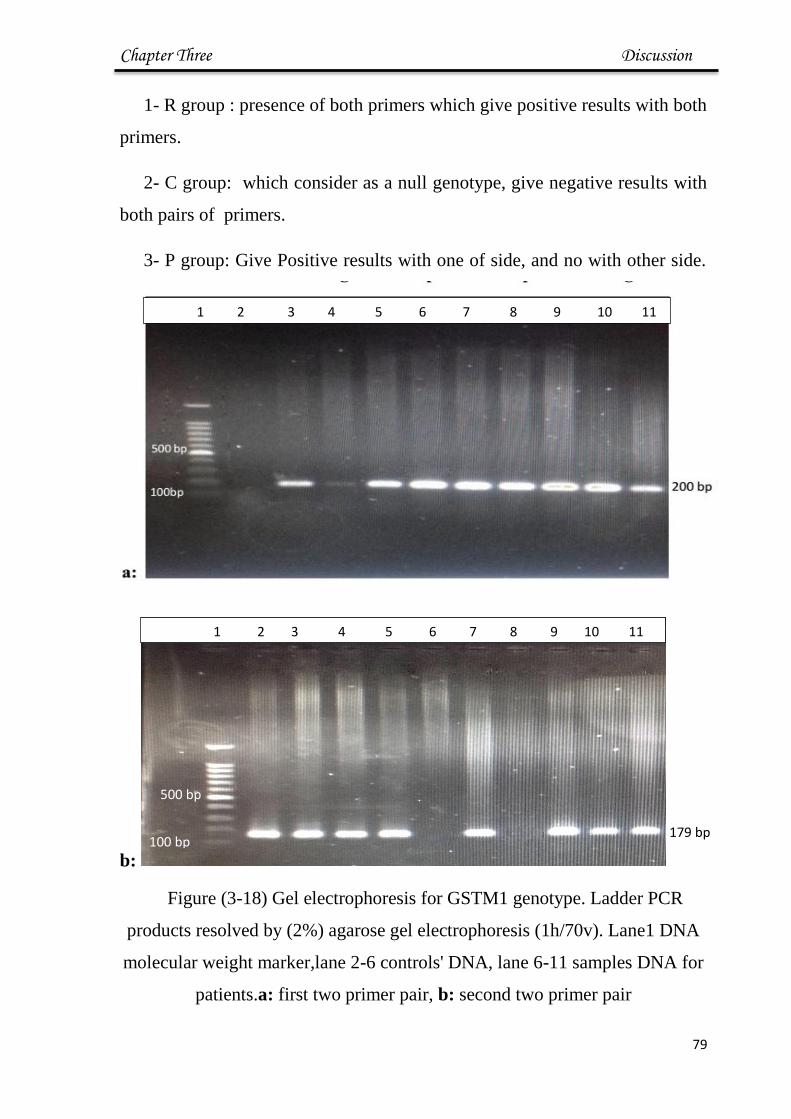
Chapter Three Discussion
68
1- R group : presence of both primers which give positive results with both
primers.
2- C group: which consider as a null genotype, give negative results with
both pairs of primers.
3- P group: Give Positive results with one of side, and no with other side.
b:
Figure (3-18) Gel electrophoresis for GSTM1 genotype. Ladder PCR
products resolved by (2%) agarose gel electrophoresis (1h/70v). Lane1 DNA
molecular weight marker,lane 2-6 controls' DNA, lane 6-11 samples DNA for
patients.a: first two primer pair, b: second two primer pair
100 bp
500 bp
179 bp
1 2 3 4 5 6 7 8 9 10 11
1 2 3 4 5 6 7 8 9 10 11

Chapter Three Discussion
76
The distribution of GST genotype and alleles of the three study groups
were given; the GSTM1 positive genotype occurs at higher frequencies in
healthy controls (46.42%) and lower for Cardiovascular (33.33%) group and
(37.04%) for HT group. Ramprasath et al.)159(
who found the GSTT1 positive
genotype occurs at higher frequencies in controls than in T2DM with
cardiovascular and T2DM without cardiovascular patients. As for the GSTM1
positive genotype was occurs at higher frequencies in controls than in T2DM
with CAD patients and T2DM without CAD patient. (Dadbinpour et al))160(
who observed that the absence or deletion of detoxification pathway of
GSTT1 has no significant effect on the side effects of T2DM, but GSTM1–
null had significant relationship with diabetes retinopathy, indicating the role
of detoxification of this genes in this regards.
(Kolla K. et al.))161(
found that the frequency of both positive and null of
GSTT1 and GSTM1 did not differ significantly between control and patients.
Table (3-13): Distribution of Microdeletion of GSTM1 Between Groups (n%)
Group No. (%) Chisquare-
χ2
P-value
C (null) R (complete) P (partial)
Control 2 (7.41%) 13 (46.42%) 13(48.15%) 9.327 ** 0.0049
Cardiovascular 4 (14.28%) 9 (33.33%) 15(55.56%) 11.840 ** 0.0012
Hyper tension 6 (21.42%) 10 (37.04%) 12
(44.44%)
9.072 ** 0.0052
Chi-square-χ2 5.139 * 4.924 * 5.081 * --- ---
P-value 0.0447 0.0529 0.0496 --- ---
* significant difference with p<0.05, **highly significant with p<0.01
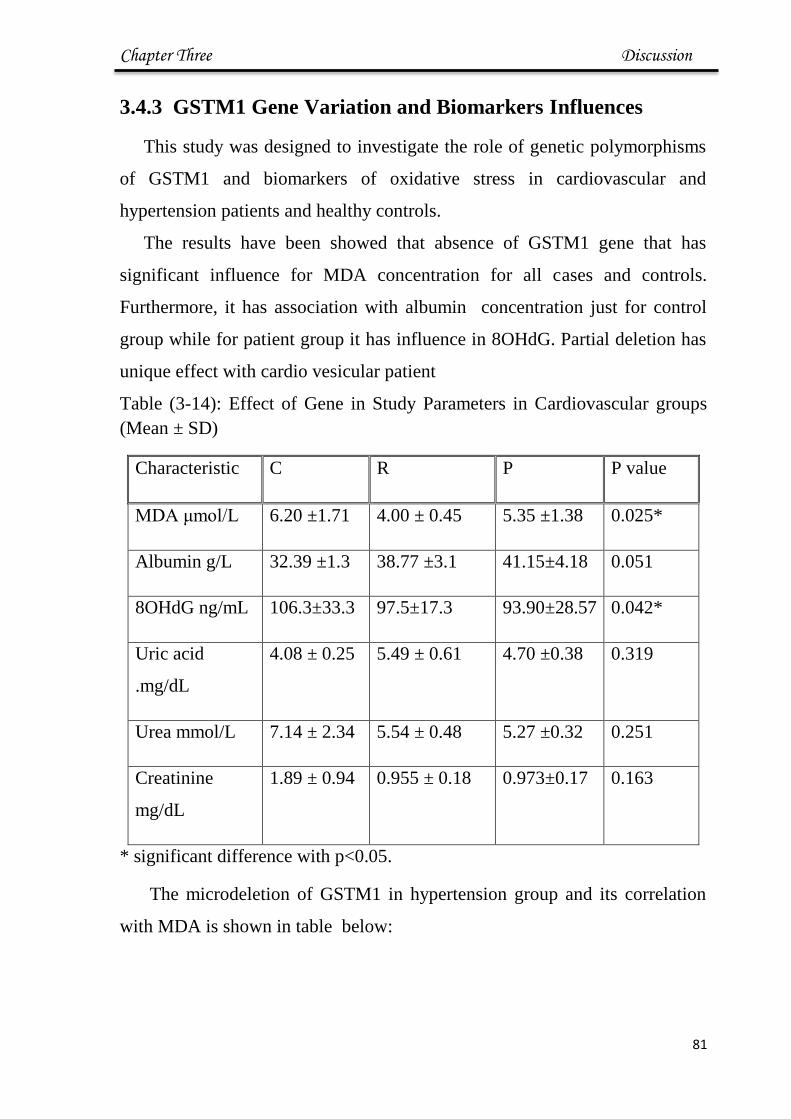
Chapter Three Discussion
76
3.4.3 GSTM1 Gene Variation and Biomarkers Influences
This study was designed to investigate the role of genetic polymorphisms
of GSTM1 and biomarkers of oxidative stress in cardiovascular and
hypertension patients and healthy controls.
The results have been showed that absence of GSTM1 gene that has
significant influence for MDA concentration for all cases and controls.
Furthermore, it has association with albumin concentration just for control
group while for patient group it has influence in 8OHdG. Partial deletion has
unique effect with cardio vesicular patient
Table (3-14): Effect of Gene in Study Parameters in Cardiovascular groups
(Mean ± SD)
Characteristic C R P P value
MDA μmol/L 6.20 ±1.71 4.00 ± 0.45 5.35 ±1.38 0.025*
Albumin g/L 32.39 ±1.3 38.77 ±3.1 41.15±4.18 0.051
8OHdG ng/mL 106.3±33.3 97.5±17.3 93.90±28.57 0.042*
Uric acid
.mg/dL
4.08 ± 0.25 5.49 ± 0.61 4.70 ±0.38 0.319
Urea mmol/L 7.14 ± 2.34 5.54 ± 0.48 5.27 ±0.32 0.251
Creatinine
mg/dL
1.89 ± 0.94 0.955 ± 0.18 0.973±0.17 0.163
* significant difference with p<0.05.
The microdeletion of GSTM1 in hypertension group and its correlation
with MDA is shown in table below:

Chapter Three Discussion
76
Table(3-15): Effect of Gene in Study Parameters in Hypertension (Mean ±SD)
Characteristic C R P P value
MDA μmol/L 6.72 ± 1.65 4.15 ± 0.22 4.72 ± 0.15 0.0023**
Albumin g/L 35.27 ±4.09 41.78 ± 3.38 34.56 ±2.73 0.05*
8OHdG ng/mL 110.45±23.12 90.31±22.8 105.48±29.23 0.043*
Uric acid mg/dL 5.91 ±0.81 5.88 ± 0.65 4.94 ± 0.51 0.446
Urea mmol/L 7.32 ± 1.32 5.29 ± 0.90 5.75 ± 0.72 0.402
Creatinine
mg/dL
0.655 ±0.08 1.07 ± 0.51 1.02 ± 0.14 0.616
* significant difference with p<0.05, **highly significant with p<0.01
The significant increase in MDA levels in GSTM1 null gene as also
found by (Abhishek et al) who found this correlation in exposure to pollutants
)162).
Albumin was decrease significantly in null genotype of GSTM1 that
were lacking efficiency in antioxidant esponses due to the combination of the
GSTM1 deletion)159(
.
This agree with (Nochelas et al) )75(
who found increase in ROS effects in
null of this gene.
(Al- Ubeidy M.) found correlation between deletion of this gene and risk of
cardiovascular disease(163)
The concentration of albumin is lower significantly in null and positive
genotype in all groups and in partial deletion there no significant. That’s may
be means, in the form of gene deletions, yielding no transcription or
translation of the respective proteins , Decreased functionality of detoxifying
and antioxidant enzymes may pose a greater risk of toxic insult potentially
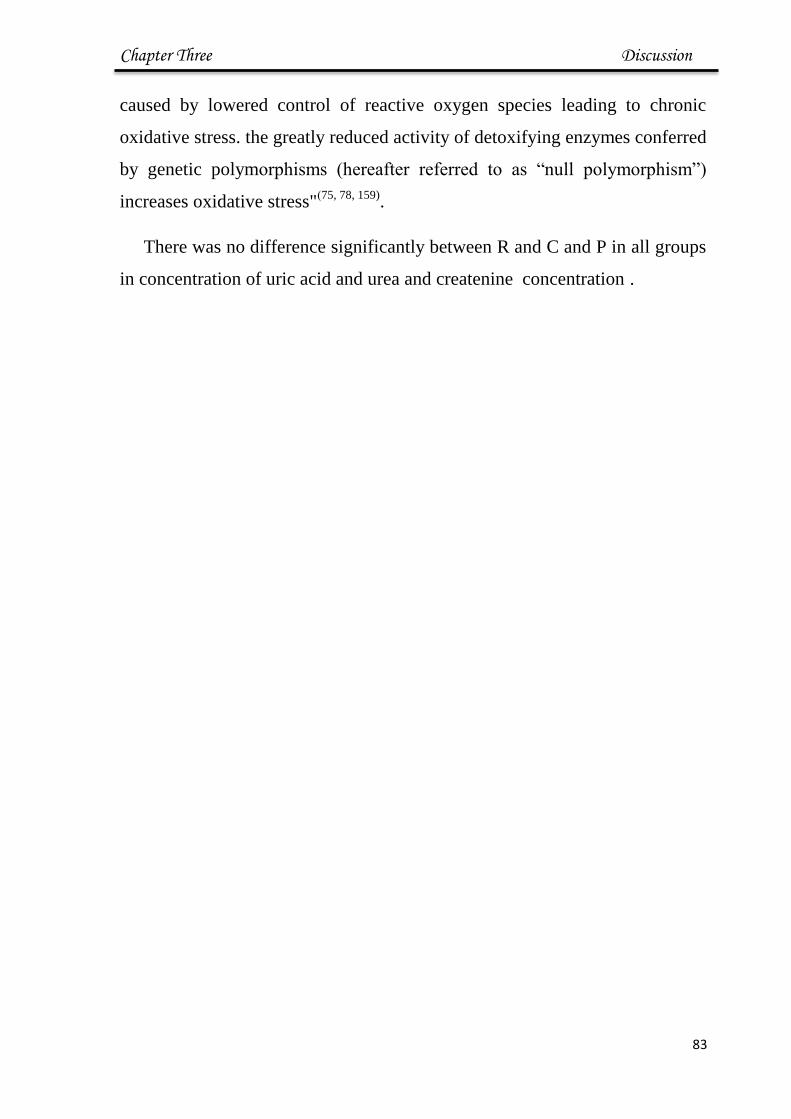
Chapter Three Discussion
76
caused by lowered control of reactive oxygen species leading to chronic
oxidative stress. the greatly reduced activity of detoxifying enzymes conferred
by genetic polymorphisms (hereafter referred to as “null polymorphism”)
increases oxidative stress")75, 78, 159)
.
There was no difference significantly between R and C and P in all groups
in concentration of uric acid and urea and createnine concentration .

58
Conclusion
1. Oxidative stress in its markers and parameters is the main chemical
manifestation of hypertension and cardiovascular diseases in the
patients of underlying study. This conclusion was obvious in high
sgnficant difference between serum malondialdehyde, 8-OHdG and
albumin in patients of both hypertension and cardiovascular
diseases. Uric acid, urea, creatinin field in achieve this results.
2. The association between items of lipid profile and
malondialdehyde leads to concludes that high serum levels of lipid
is very risky due to high probability of its oxidation which is
exacerbate the diseases of underlying study. Also the association
between malondialdehyde and 8-OHdG leads to conclude the deep
effect of cells from membrane to the nucleus by oxidative species
3. The association between deletion of glutathione-S- transferase gene
(in genome) with increasing serum malondialdehyde leading to
believe that oxidation damage have adverse effect on defense
system in addition to biomolecules.
86
Recommendation and Future Work
1- Estimation of glutathione -S- transferase enzyme in parallel with
Glutathion -S- transferase mu gene (GSTM1 gene), so we can get full
picture on the oxidative stress effect on the defense body system with
regard to this gene.
2- Design the intervention study involve supplementing patient volunteer
with natural antioxidant to follow up the decreasing oxidative stress in
response to these antioxidant.
3- Detect the values of body Iron or Cupper as oxidant maker.
4- Study the effect of drugs supplements for these disease on oxidative
stress
References
88
[1] Williams KJ., (2001), Arterial wall chondroition sulphated proteoglycan:
diverse molecules with distinct role in lipoprotein retention and atherogenesis,
Curr Opin Lipidol, 12, 477-487.
[2] Giovanni F., Maria G., Alessandro G., Daniela B., (2009),
Atherosclerosis, inflammation and Chlamydia pneumonia, World J
Cardiology, 1(1), 31-40.
[3] Stary H., Blankenhorn D., Chandler A., Glagov S., Insull W.,
Richaredson M., Rosenfeld M.E., Schaffer S.A., Schwartz C.J., Wagner
W.D., (2002), A definition of the intima of human arteries and of its
atherosclerosis prone regions. A report from the committee on Vascular
Lesions of the Council on Arteriosclerosis, American Heart Association,
Arterioscler Thromb, 12, 120-134.
[4] Ross R., (1999), Atherosclerosis: an inflammatory disease, National
England J Medicine, 340, 115–126.
[5] http://www.who.int/topics/cardiovascular_diseases/en/
[6] Parikh N.I and Vasan R.S., (2008), The epidemiology of heart failure."
Colucci WS, editor. Atlas of heart failure, 5th ed. Philadelphia, Pennsylvania:
Springer; 1–14.
[7]"World Heart Federation: Cardiovascular disease risk factors" (WHO).
[8] Mackay, Mensah, Mendis, (2004), WHO publishes definitive atlas on
global heart disease and stroke epidemic, Indian J Med Sci., 58(9), 405 -406.
[9] Go A., Mozaffarian D., Roger V., Benjamin E., Berry J., (2014), Heart
Disease and Stroke Statistics-2014 Update: A Report From the American
Heart Association. American Heart Association, Circulation, 129(3), 228-292.
References
88
[10] Libby P., Ridker P.M., Georan K.H., (2009), Inflammation in
atherosclerosis, from pathophysiology to practice, J Amrrican Collge
Cardiology, 54(23), 2129-2138.
[11] Giuseppe M., Fagard R., Narkiewicz K., Redán J., Zanchetti A., Böhm
M., Christiaens T., Cifkova R., De Backer G., Dominiczak A., Galderisi M.,
Grobbee D.E., Jaarsma T., Kirchof P., Kjeldsen S.E., Laurent S., Manolis
A.J., Nilsson P.M., Ruilope L.M., Schmieder R.E., Sirnes P.A., Sleight P.,
Viigimaa M., Waeber B., Zannad F., (2013), 2013 Practice guidelines for the
management of arterial hypertension of the European Society of Hypertension
(ESH) and the European Society of Cardiology (ESC): ESH/ESC Task Force
for the Management of Arterial Hypertension, J of Hypertension , 31(10),
1925-1938.
[12] Caroline M., (2013), Introduction to Epidemiology: Distribution and
Determinants of Disease, Cengage Learning, 302-303.
[13] Thomas D., (2014), Hypertension 101: the place to start, J Clinical
Hypertension, 16(1), 4-5.
[14] Michael J.M., (2011). Small Artery Remodelling in Hypertension , Basic
Clinical of Pharmacology and Toxicology, 110, 49-55.
[15] Crook M.A., Clinical biochemistry and metabolic medicine, 11th Ed.
Hoddeer education, Ch.13, 201-215.
[16] Fletcher B., Berra K., Ades P., Braun L., (2005), Managing Abnormal
Blood Lipids. American Heart Association, Circulation, 112(20), 3184 -3209
[17] Carl A., Ashwood E., Bruns D, (2010), Textbook Of
Clinical Chemistryand Molecular Diagnostics, 5th
ed, Elsevier, USA.

References
89
[18] American Heart Association (2014), High Blood Cholesterol & Other
Lipids, statistical fact sheet.
[19] Chatterjea M.N. and Shinde R., (2007), In: “Textbook of Medical
Biochemistry”. 7th Ed. Jaypee Brothers Med ical Publications, New Delhi. 92-
113.
[20] Maki K.C., Dicklin M.R., Davidson M.H., Mize P.D., Kulkarni K.R.,
(2012), Indicators of the Atherogenic Lipoprotein Phenotype Measured with
Density Gradient Ultracentrifugation Predict Changes in Carotid Intima-
Media Thickness in Men and Women, Vasc Health Risk Manag., 8, 31-38.
[21] Chapman M., Ginsberg H., Amarenco P., Andreotti F., Borén J.,
Catapano A., (2011), Triglyceride-rich lipoproteins and high-density
lipoprotein cholesterol in patients at high risk of cardiovascular disease:
evidence and guidance for management, European Heart J., 32(11), 1345-
1361.
[22] Pfrieger F.W., Ungerer N., Cholesterol metabolism in neurons and
astrocytes, Prog. Lipid Res., 50, 357-371.
[23] Jasim N., (2014), Biochemical Study of E3 SUMO-Protein
Ligase NSE2 (NSMCE2) and Other Parameters in Patients with
Atherosclerosis, Thesis of biochemistry, Sci., Baghdad University.
[24] Michael D., Ashlin T., Buckley M., Ramji D., (2012), Macrophages,
lipid metabolism and gene expression in atherogenesis: a therapeutic target of
the future. Clinical Lipidology, 7(1), 37-48.
[25] Ahaneku G., Osuji C.U., Anisiuba B.C., Ikeh V.O., Oguejiofor O.C.,
Ahaneku J.E., (2011), Evaluation of blood pressure and indices of obesity in

References
89
a typical rural community in eastern Nigeria, Ann African Medicine J , 10(2),
120-126.
[26] Valenza M., Leoni V., Karasinska J.M., (2010), Cholesterol defect is
marked across multiple rodent models of Huntington’s disease and is manifest
in astrocytes, J. Neurosci, 30, 10844-10850.
[27] Holzerová E., Prokisch H., (2015), Mitochondria: Much ado about
nothing? How dangerous is reactive oxygen species production?, Int J
Biochemistry and Cell Biology, 21, 5 pages.
[28] Crohns M., (2010), Antioxidants, Cytokines and Markers of
Oxidative Stress in Lung Cancer Associations with adverse events, response
and survival, Tampere, 7, 21-25.
[29] Kalyanaraman B., (2013), Teaching the basics of redox biology to
medical and graduate students: Oxidants, antioxidants and disease
mechanisms, J of Redox Biology, 1, 244-257.
[30] José A., (2013), Oxidative Stress and Chronic Degenerative Diseases - a
Role for Antioxidants, Janeza Trdine, 34-35.
[31] Shiv K., (2011), Free Radicals and Antioxidants: Human and Food
System, Advances in Applied Science Research, 2, 129-135.
[32] Grant S.S., Kauffman B., Chand N., Hasely N., Hung D.T., (2012),
Eradication of bacterial persisters with antibiotic-generated hydroxyl radicals,
Proceedings of the National Academy of Science of USA, 109(30), 12147-
12152.
[33] Kelly M., (2008), Analysis of Oxidative Damage to DNA
Mediated by Transition Metal-Fenton Reactions: Thesis PhD, Dublin City
University, 59.

References
89
[34] Zimniak P.,(2007), Relationship of electrophilic stress to aging., Free
Radical Biology and Medicine, 51(6), 1087-1105.
[35] Spooner R., Yilmaz O., (2011), The Role of Reactive-Oxygen-Species
in Microbial Persistence and Inflmmation. International J of Molecular
Science, 12, 334-352.
[36] Noori S., (2012), An Overview of Oxidative Stress and Antioxidant
Defensive System, Open Access Scientific Reports, 1, 1-8.
[37] Kunwar A., Priyadarsini K., (2012), Free radicals, oxi dative stress and
importance of antioxidants in human health, J of Medical and Allied Sciences,
1(2), 53-60.
[38] Suvorava T., Kojda G., (2009), Reactive oxygen species as
cardiovascular mediators: Lessons from endothelial-specifi c protein,
Biochemical et Biophysical Acta, 1787, 802-810.
[39] Ahmad A., Singhal U., Mohd M., Islam N., Rivisi I., (2013), The Role of
the Endogenous Antioxidant Enzymes and Malondialdehyde in Essential
Hypertension, J Clinical Diagnostic Research, 7, 987-990.
[40] Steven D., (2014), The Cooperative Roles of Inflammation and
Oxidative Stress in the Pathogenesis of Hypertension, Antioxidant and Redox
Signal, 20(1), 102-120.
[41] Rodrigo R., Jaime G., Paoletto F., (2011), The role of oxidative stress in
the pathophysiology of hypertension, The Japanese Society of Hypertension,
34, 431-440.
[42] Taniyama Y., Griendling K., (2003), Reactive Oxygen Species in the
Vasculature : Molecular and Cellular Mechanisms, Hypertension., 42, 1174-
1181.

References
89
[43] Versari D., Daghini E., Virdis A., Lorenzo G., Taddei S., (2009),
Endothelium-dependent contractions and endothelial dysfunction in human
hypertension, British J of Pharmacology, 157(4), 527-536.
[44] Hirata Y., Satonaka H., (2000), Hypertension and Oxidative Stress, J of
the Japan Medical Association , 124 (11), 1575-1579.
[45] Vogiatzi G., Tousoulis D., Stefanadis C., (2009), The Role of Oxidative
Stress in Atherosclerosis. Hellenic J Cardiology, 50(5), 402-409.
[46] Biomarkers Definitions Working Group, (2001), Biomarkers Definitions
working group, Biomarkers and surrogate endpoints: preferred definitions and
conceptual framework. Clinical and Pharmacology Ther, 69(3), 69-89.
[47] http:/www.bii.a-star.edu.sg.
[48] Yang T., Yi-Jie C., Shwu-Fen C., Chu-Huang C., Po-Yuan C., (2014),
Malondialdehyde mediates oxidized LDL-induced coronary toxicity through
the Akt-FGF2 pathway via DNA methylation, J Biomed Sci., 21, 1-12.
[49] Cipierre C., Stéphane H., Boulch D., Paul S.,
Picaud J., (2013), Malondialdehyde Adduct to Hemoglobin: A New Marker
of Oxidative Stress Suitable for Full-Term and Preterm Neonates, Oxid Med
Cell Longev., 6 pages.
[50] Rio D.D., Stewart A.J., Pellegrini N., (2005), A review of recent studies
on malondialdehyde as toxic molecule and biological marker of oxidative
stress, Nutr. Metab.Cardiovasc.dis, 15(4), 316-328
[51] Jiangang L., Changsheng L., Lijuan S., Hongxiang G., Jiankang
L.,(2008), Neuronal Mitochondrial Toxicity of Malondialdehyde: Inhibitory
Effects on Respiratory Function and Enzyme Activities in Rat Brain
Mitochondria, Neurochem Res, 34, 786-794.

References
89
[52] Giera M.,Lingeman H., Wilfried M, Niessen A., (2012), Recent
Advancements in the LC- and GC-Based Analysis of Malondialdehyde
(MDA): A Brief Overview, J of Chromatographia, 75, 433440.
[53] Marnett L.J. (1999). Lipid peroxidation-DNA damage by
malondialdehyde, Mutat. Res., 424(1-2), 83-95. [Abstract].
[54] Slatter D.A. Bolton C.H., Bailey A.J., (2000), The importance of lipid-
derived malondialdehyde in diabetes mellitus, Diabetologia, 43(5), 550-
7.[Abstract]
[55] Karaman U., Çelik T., KiranT.R., (2008), Malondialdehyde,
Glutathione, and Nitric Oxide Levels in Toxoplasma gondii Seropositive
Patients, Korean J. Parasitology, 46(4) , 293-295. [Abstract].
[56] Bartoli M.L . , Novelli F., Costa F., Malagrino L., Bacci F., Cianchetti
S., Dente F.L., Franco A., Vagaggini D., Paggiaro P.L., (2011),
Malondialdehyde in exhaled Breath Condensate as a Marker of Oxidative
Stress in Different Pulmonary Diseases, Mediators Inflamm., 2011, 7 pages.
[57] Seemma L.J., Ujjwala J., Vasant T., Deshmukh Y. A, (2010), Status of
Lipid profile, MDA and protein carbonyl in patients with cardiovascular
diseases, Archives of App.Sci. R., 2, 8-14.
[58] ] Al-Fartosi K., Al-Salih R., Salih J., (2010), Study of relationship
between blood parameters and oxidant-antioxidant status of patients with
unstable angina pectoris and myocardial infractions, Thi-Qar Medical J. 4, 47-
64.
[59] Arunima P.R., Rajeev V., Kurra S.B., Mohan R., Nita S., (2014),
Salivary 8 - Hydroxydeoxyguanosine – avaluable indicator for oxidat ive
DNA damage in periodontal disease, The Saudi J Dental Research, 2, 1-6.
References
89
[60] Caraiane A., Victoria B., Florin B., Grigorian M., (2014) , Salivary
Interleukin-1 and 8-didroxydeoxyguanosine And Their Relation With The
Periodontal Status, Romanian J of Oral Rehabilitation, 6(2), 8-13.
[61] Ibrahim A., Saleh D.S., (2014), DNA Damage in Lung Cancer Patients
and Control Iraqi Subjects Using Elisa Technique., International J Biological
& Pharmacological research, 5(8), 627-629.
[62] Borrego S., Vazquez A., Dasí F., Cerda C., Iradi A., Tormos C., Sánchez
M., Bagán L., Boix J., Zaragoza C., Camps J., (2013), Oxidative Stress and
DNA Damage in Human Gastric Carcinoma: 8-Oxo-7'8-dihydro-2'-
deoxyguanosine (8-oxo-dG) as a Possible Tumor Marker, International J
Molecular Sci., 14, 3467-3486.
[63] Kikuchi H., Nanri A., Hor A., Masao S., Kazuaki K., (2013), Lower
serum levels of total cholesterol are associated with higher urinary levels of 8 -
hydroxydeoxyguanosine, Nutrition and Metabolism J, 10(1), 5-9.
[64] Kaya Y., Ayşegül C., Nihat S., Halit D., Hamit H., Ebubekir B., (2012),
Correlations between Oxidative DNA Damage, Oxidative Stress and
Coenzyme Q10 in Patients with Coronary Artery Disease, International J of
Medicine Sci, 9(8), 621-626.
[65] Young C., Kim E., Choi D., Lee H., Hahm K., Heechung M., (2012), 8-
Hydroxydeoxyguanosine: Not mere biomarker for oxidative stress, but
remedy for oxidative stress-implicated gastrointestinal diseases, World J
Gastroenterol, 18(4), 302-308.
[66] Tyrberg B., Kamen A., Sergio A., Wang J, Yoon k., Fred L., (2002), Islet
expression of the DNA repair enzyme 8 -oxoguanosine DNA glycosylase
(Ogg1) in human type 2 diabetes, BMC Endocrine Disorder, 2(1), 10 pages.

References
89
[67] Ezzeldin N., Diyaa M., Ezzeldin H., HUSSEIN S.A., FAROUK H.,
KANDIL M., (2012), A Study of the Relationship between the Blood Levels
of the 8-Oxoguanine DNA Glycosylase, Smoking and Risk of Lung Cancer,
Medicine J Cairo Uni., 80(1), 495-499.
[68] Huang C., Tien S., Chung C., Shiau P., Show C., Yuan C., Chang W.,
Hsueh Y., (2012), Urinary total arsenic and 8-hydroxydeoxyguanosine are
associated with renal cell carcinoma in an area without obvious arsenic
exposure, Toxicology and Applied Pharmacology, 262 , 349–354.
[69] Sova H., Vuorinen A., Puistola U., Kauppila S., Karihtala P., (2010), 8-
Hydroxydeoxyguan osine :a new potential independent prognostic factor in
breast cancer, British J of Cancer, 102, 1018-1023.
[70] Noren H., Ejiogu N., Zonderman B.A., Evans M., (2012), Association
of Oxidative DNA Damage and C-Reactive Protein in Women at Risk for
Cardiovascular Disease, Arteriosclerosis Thrombosis of Vascular Biology,
32(11), 2776-2788.
[71] Ragin C, Langevin S, Rubin S, Taioli E, (2010), Review of studies on
metabolic genes and cancer in populations of African descent, J of medical
genetic, 12(1), 12–18.
[72] Xianjun L., Qiliu P., Yu L., Shan L., Xue Q., Zhiping C., Junqiang C.,
(2014), Glutathione S-transferase gene GSTM1, gene-gene interaction, and
gastric cancer susceptibility: evidence from an updated meta-analysis, J of
Cancer Cell International, 14(127), 15 pages.
[73] Bessa S., Ali M., Hamdy S., (2009), The role of glutathione S-
transferase M1 and T1 gene polymorphisms and oxidative stress -related
parameters in Egyptian patients with essential hypertension, European J of
Intern Med, 20, 625–630.

References
89
[74] Wlodarczyk M., Nowicka G., (2012), Common polymorphisms in
CYP1A1,GSTM1 , GSTT1, GSTP1 and XPD genes and endogenous DNA
damage, Molecular Biology Reports, 39, 5699-5704.
[75] www.genecards.org/cgi-bin/carddisp.pl?gene=GSTM1
[76] Nicholas J., Abby C., Bowen L., Pritsos K., Geoffrey G., Kosta A., Gary
C., Pritso C., (2009), Polymorphisms in the NQO1, GSTT and GSTM genes
are associated with coronary heart disease and bio markers of oxidative stress,
Mutation Research J., 674(1-2), 93-100.
[77] Massimo C., Rossella A. , Matteo G., Vittoria V., Giuseppina F., Paola
M., Stefania C., Enrico B., Licia R., Mutti A., (2002), Biomarkers of
oxidative stress after controlled human exposure to ozone, J of Toxicolo Lett.,
134, 219-225.
[78] Teresa C., Andrea B., Augusto L., Robert O., Dian G., David S., Pantel
V., (2007), Particulate Air Pollution, Oxidative Stress Genes, and Heart Rate
Variability in an Elderly Cohort, Environ Health Perspect, 115(11), 1617-
1622.
[79] Liang S., Xuan W., Chen G., Jinmei W., Zhangrong C., Xiaoli C., Zhibo
W., Jingmin D., (2013), Significant association between asthma risk and the
GSTM1 and GSTT1 deletion polymorphisms: An updated meta -analysis of
case–control studies, Asian Pacific Society of Respirology, 18, 774–783.
[80] Quinlan G.J., Martin G.S., Evans T.W. (2005), Albumin: Biochemical
Properties and Therapeutic Potential., Hepatology, 41, 1211–1219.
[81] Marjolaine R., Philippe R., Nihar R, Evelyne T., Emmanuel B., (2008),
Minire view The antioxidant properties of serum albumin, Federation of
European Biochemical Societies, 582, 1783–1787.

References
88
[82] Fanali G., Di Masi A., Trezza V., Marino M., Fasano M., (2012), Human
serum albumin: from bench to bedside, Mol Aspects Med., 33, 209–290.
[83] Oettl K., Stauber R., (2007), Physiological and pathological changes in
the redox state of human serum albumin critically influence its binding
properties. Br J Pharmacol., 151, 580–590.
[84] Colombo G., Clerici M., Giustarini D., Rossi R., Milzani A., Dalle-
Donne I., (2012), Redox albuminomics: oxidized albumin in human diseases.
Antioxid Redox Signal, 17,1515-1527.
[85] Durga P., Shabana S., Shalini G., (2014), Assessment of Copper,
Ceruloplasmin, Total Proteins and Albumin in Gestational Hypertension,
Dental and Medical Scie. J., 13, 101-105.
[86] Taverna M., Anne L., Jean P., Bertrand G., (2013), Specific antioxidant
properties of human serum albumin, Annals of Intensive Care, 3(4), 7 pages.
[87] Nagesh M., Kumar L., Pathiputhuru A., Jupalle N., Robby K., Anuj K.,
(2015), Review of Concepts and Controversies of Uric Acid as Antioxidant
and Pro-Oxidant, Archives Medecal Review J, 24(1), 19-40.
[88] Acworth L., Phil D., Oxon, (2003), The handbook of redox biochemistry ,
ESA, 1ST
ed. USA, 358-360
[89] George G.S.,Wakasi M.E., Egoro E., (2014), Creatinine and Urea Levels
as Critical Markers in End-Stage Renal Failure, RRJMHS , 3(1), 41-44.
[90] Lam A., (2010), Outpatient management of chronic kidney disease.
Proteinimia, anemia, are bone disease as therapeutic targets, Dis Mon., 56(4),
215-232

References
88
[91] Kazuharu I., Takako Y., (2011), Creatinine and HMH (5-hydroxy-1-
methylhydantoin, NZ-419) as intrinsic hydroxyl radical scavengers Drug
Discoveries Therapeutics, 5(4), 162-175.
[92] Hamdani I., (2010), Estimation of Serum Uric Acid, Urea and Creatinine
in Essential Hypertensive Patients, Tikrit Medical J., 16(1), 152-158.
[93] Harvey R., Ferrier D., (2011), Lippincott’s Illustrated Reviews
Biochemistry, 5th
ed., Walter Kluwer, Philadelphia.
[94]Koolman J., Roehm K.H., (2005), Color Atlas of
Biochemistry, 2nd
ed. Thieme, New York, 999.
[95] World Health Organization WHO (2011), Implementing National
Diabetes programs".Geneva, Switzerland, WHO Technical Report Series.
[96] Fost L., Hane L.J., Vestergaard P., (2005), Overweight and obesity as
risk factors for atrial fibrillation or flutter: the Danish Diet, Cancer, and
Health Study, Am. J.Med., 118, 489-495.
[97] M.L., (2005), In: “Clinical Haematology Theory Procedures”. Part2.
Chap5. Normal Erythrocyte Life-Cycle and Physiology.4th
Ed. Philadelphia.
[98] Vassault A., (1986), determination of cholesterol in blood oxidase , Ann.
Biol.Clin., 44, 686 -688.
[99] Klotzsch S.G., and Namara J.R., (1990), Triglyceride Measurments a
Review of Methods and Interferences Clin., Chem., 36, 1605-1613.
[100] Burstien M., Scholnick H.R., Morfin R., (1970), Rapid method for the
isolation of lipoproteins from human serum by precipitation with polyanions,
lipid res., 11,583-595.
References
999
[101] Friedwald W.T., Levy R.I., Fredrickson D.S., (1972), Estimation of the
concentration of low density lipoprotein cholesterol in plasma without use of
ultracentrifuge, Clin.Chem., 18, 499-502.
[102] Shah S.V., Walker P.D., (1988), Evidence suggesting a role for
hydroxyl radical in glycerol-induced acute renal failure, ., Am J Physiol.,
255(3 Pt 2), 438-443.
[103] Doumas B.T., Watson W.A., Biggas H.G., (1971), Albumin standards
and the measurement of serum albumin with bromcresol green, Clinical
Chimemistry Acta., 31(1), 87-96.
[104] Artiss J.D. and Entwistle W.M., (1981), The application of sensitive
uricase-prroxidase coupled reaction to a centrifugal fast analyzer for the
determination of uric acid, Clinical Chemistry Acta, 116, 301 -309.
[105] Tabacco A., Meiattini F., Moda E., Tarli P., (1979), Simplified
enzymic/colorimetric serum, Clin.Chem., 25, 2-336.
[106] Nakamura K, Ienaga K, Nakano K, Nakai M, Nakamura Y,
Hasegawa G, Sawada M, Kondo M, Mori H, Kanatsuna T.
(1994), Creatol, a creatinine metabolite, as a useful determinant of
renal function. Nephron., 66:140-146.
[107] Hook B., Vincent E., Schagat T., (2011), ReliaPrep™ Blood gDNA
Miniprep System: Low Elution Volume with High Yield. Promega
Corporation. Website. http://www.promega.com/resources/pubhub/reliaprep-
blood-gdna miniprep-system-low-elution-volume-with-high-yield/ Updated.
References
999
[108] Raoof I., (2013), Biochemical and Molecular Study in Women with
Diabetes Mellitus Type 1, Thesis PhD. Baghdad University.
[109] Wendy J.P., Timothy J.M., Thomas D.T., (1995), What Species Is
Responsible for Strand Scission in the Reaction of [FeEDTA]2-
and H2O2 with
DNA?, J Am. Chem., 117, 6428-6433.
[110] Masood K., Kayani A, (2013), Protection against laryngeal and
pharyngeal carcinoma: Heterozygous vs. homozygous deletions of GSTM1
and GSTT1, Genet Mol Biol., 36(1), 1-6.
[111] Sambrook E., Fritsch F., Maniatis T., (1989), Molecular cloning: A
laboratory manual: 2nd ed. Edited by J. Cold Spring Harbor Laboratory Press,
Cold Spring Harbor, New York.
[112] Cary N.C., (2012), Statistical Analysis System, User's Guide.
Statistical. Version 9.1th
ed. SAS. Inst. Inc.. USA.
[113] Ngoungou E.,Victor A., Philomène K., Roger M., Jean E., Nzengue C.,
Carine N., Marc L., Pierre M., (2012), Prevalence of cardiovascular disease in
Gabon: A population study, Archives of Cardiovascular Disease J, 105, 77-
83.
[114] Hong E., Reum K., Eun R., Eu J.,,Kim Y.,, Kyoung M., Jae M.,
Sung H., Kyong S.,Woon K., (2015), Counterint uitive Relatio nship Between
Visceral Fat and All-Cause Mortality in an Elderly Asian Popula tion, Obesity
J, 23(1), 220-228.
[115] Shuger S., Xuemei S., Timothy S., Rebecca A., Meriwether S., (2008),
Body Mass Index as a Predictor of Hypertension Incidence Among Initially
Healthy Normotensive Women, American J of Hypertension, 21(6) , 613-619.
References
999
[116] Lavie C.J., Milani R.V., Ventura H.O., (2009), Obesity and
Cardiovascular Disease Risk Factor, Paradox, and Impact of Weight Loss, J
American College of Cardiology, 53 (21), 1926-1932.
[117] Roberta L., Marion W., Jane F. R., (2012), Hypertension in
Postmenopausal Women, Curr Hypertens Rep, 14(3), 254-260.
[118] Zanchetti A., Facchetti R., Cesana G., Modena M., Pirrelli A., Sega R.,
(2005), Menopause-related blood pressure increase and its relationship to age
and body mass index: the SIMONA epidemiological study. J Hypertens., 23,
2269-2276.
[119] Megan C., Jane F., Pamela O., (2008), Menopause and Hypertension
An Age-Old Debate. Hypertension., 51(4), 952-959.
[120] Masoumeh S., Khalili M., Pourmoghaddas M., Talaei M., (2012), The
correlation between blood pressure and hot flashes in menopausal women ,
ARYA Atheroscler, 8(1), 32-35.
[121] Luoto R., Sharrett A.R., Schreiner P., Sorlie P. D., Arnett D. , Ephross
S., (2000), Blood pressure and menopausal transition: the Atherosclerosis
Risk in Communities study (1987–95). J Hypertension, 18, 27–33.
[122] Stadtman E.,(1992), Protein oxidation and aging, Science J, 257, 1220-
25.
[123] Mohsen M., Ahmed I., Khaldoon S., Mona A., (2013), Lipid profile in
Egyptian patients with coronary artery disease, The Egyptian Heart J., 65, 79–
85.
[124] Nicholls S. and Lundman P., (2004), The emerging role of lipoproteins
in atherogenesis: beyond LDL cholesterol, Semin Vasc Med, 4, 187 -195.

References
999
[125] Pelusoa I., Morabitob G., Urbana L., Ioannonea F., Serafinia M., (
2012), Oxidative Stress in Atherosclerosis Development: The Central Role of
LDL and Oxidative Burst, Endocr Metab Immune Disord Drug Targets,
12(4):351 -60.
[126] Khan H.A., Alhomida A., Sobki S.H., (2013), Lipid Profile of Patients
with Acute Myocardial Infarction and its Correlation with Systemic
Inflammation. J. Biomarker Insights, 8, 1-7.
[127] Millan J., Xavier P., Anna M., Manuel Z., Joan R., Ascaso F., Luis M.,
Alipio M., Mijares A. H., Pedro G., Juan F A., Juan P., (2009), Lipoprotein
ratios: Physiological significance and clinical usefulness in cardiovascular
prevention, Vasc Health Risk Manag, 5, 757–765.
[128] Hasan R., Ahmad M., Aisha J., Zaka F., (2013), A study on the
variations in lipid profile of valvular heart disease patients, Int J Biol Med
Res., 4 , 3414-3418.
[129] Jawalekar S. L. J., Ujjwala J., Vasant T. , Deshmukh Y. A. (2010),
Status of Lipid profile, MDA and protein carbonyl in patients with
cardiovascular diseases, Archives of Applied Science Research, 2, 8 -14.
[130] Chopra S, Ashok K., Anju H., Meenakshi D., (2015), Relationship
between Body Iron Status and Cardiovascular Risk Factors in Patients with
Coronary Artery Disease, J of Cardiovascular Disease Research, 6, 18-23.
[131] Dhananjay V., Manjusha D., Roshan K. , Aasiya S., Devendra M.,
Ashlesha B., (2013), Study of Oxidative Stress in Patients with Hypertension,
Inter. J of R. Trends in Sci. And Tech., 9(1), 157-158.

References
999
[132] Venkata R. and Ravi K., (2011), Evaluation of correlation between
oxidative stress and abnormal lipid profile in coronary artery disease, J
Cardiovasc Dis Res, 2, 57-60.
[133] Ogunro P., Balogun W., Fadero F., Idogun E. , Oninla S., Elemile P.,
Eziyi A.,(2009), Plasma Lipid Peroxidation and Total Antioxidant Status
among Dyslipidaemic and Hypertensive Nigerians with High Risk of
Coronary Heart Disease, West African J. of Medicine, 28, 87-91.
[134] Ali P., Nemati A., Naghizadeh A., (2008), Serum MDA as a
Diagnostic`s Biomarker in Stable Coronary Heart Disease, Research J of Bio
Scien., 3, 206-210.
[135] Frustaci A., Matteo A., (2015), Oxidative myocardial damage in human
cocaine-related cardiomyopathy, Eur J Heart Fail, 17, 283-290.
[136] Akihiko K., Mari O. and Akira H., (2003), Blood 8 -hydroxy-29-
deoxyguanosine is associated with erythropoietin resistance in haemodialysis
patients, Nephrol Dial Transplant, 18, 931-936.
[137] Al Wassiti., Najat A.H., Anam R., (2010), Evaluation of markers of
oxidative DNA damage in females with breast tumors. IRAQI J MED SCI,
8(1), 51-65.
[138] Teruaki N., Yuki A., Tetsuo M., Rieko I., Sonoko N., Hidekazu Y.,
(2011), Effects of Body Mass Index (BMI), Dietary Intake and Serum
Antioxidant Vitamin Concentration on Urinary 8 -hydroxydeoxyguanosine
and F2-isoprostane Excretions. Anti-Aging Medicine, 8(1) , 1-6.
[139] Sakano N., Wang D.H., Takahashi N., Wang B., Sauriasari R., Kanbara
S., Sato Y., Takigawa T., Takaki J., Ogino K., (2009), Oxidative stress
References
999
biomarkers and lifestyles in Japanese healthy people. J Clin Biochem Nutr ,
44:185–195
[140] Liu M., Chan C. P., Yan BP., Zhang Q., Lam Y., Li R.J., Sanderson
J.E., Coats A.J., Sun J.P., Yip G.W., Yu C.M., (2012)
Albumin levels predict survival in patients with heart
failure and preserved ejection fraction , Eurpain J Heart Failure, 14(1), 39-44.
[141] Oda E., (2012) , Decreased serum albumin predicts hypertension in a
Japanese health screening population . intern Med., 53(7), 655-660.
[142] Zecca B., Mandelli C., Maino A., Casiraghi C., Bolla G., Consonni D.,
Santalucia P. and Torgano G., (2014), A bioclinical pattern for the early
diagnosis of cardioembolic stroke. Emerg Med Int., 242171.
[143] Li Q., Yang Z., Gu H., Lu S., Shi Q., Xing Y., Li X., Li R., Ning G., Su
Q., (2014), Association between serum uric acid levels and cardiovascular
disease in middle-aged and elderly Chinese individuals. BMC Cardiovasc
Disord., 25, 14:26.
[144] Cerezo C. and Ruilope L.M.,(2012), Uric Acid and Cardiovascular
Risk Considered: an Update, E- journal, 10, 1-6.
[145] Takayama S., Kawamoto R., Kusunoki T., Abe M., Onji M., (2012),
Uric acid is an independent risk factor for carotid atherosclerosis in a
Japanese elderly population without metabolic syndrome. Cardiovasc
Diabetol ,10, 11-20.
[146] Jin M., Yang F., Yang I., Yin Y., Luo J.J., Wang H., Yang X.F., (2012),
Uric Acid Hyperuricemia and Vascular Diseases, Front Biosci (Landmark
Ed), 17, 656-669.

References
999
[147] Heinig M., Johnson R.J., (2006), Role of uric acid in hypertension,
renal disease, and metabolic syndrome. Cleve Clin J Med., 73(12), 1059-
1064.
[148] Ali M., Samandari S., Almeida O., Jafarian S.R., Abdolvand M.,
Aliyari F., Foroughi S., (2014), Correlation Between Hypertension, C -
Reactive Protein and Serum Uric Acid With Psychological Well-being Iran
Red Crescent Med J., 16(7), 1-9.
[149] Juraschek S.P., Tunstall-Pedoe H., Woodward M., (2014), Serum uric
acid and the risk of mortality during 23 years follow -up in the Scottish Heart
Health Extended Cohort Study. Atherosclerosis , 233, 623-629.
[150] Sayyah S., (2014), Serum Uric acid Level in the Blood of Asthmatic
patients in Basrah, Governorate-Iraq, 40(2), 138-146.
[151] Divya R., Chandra S., Ashok V., (2014), A comparative study of
biochemical markers of renal function and creatinine clearance in
hypertensive and normotensive males, Inter. J. of Recent Trends in Sci. and
tech., 11(2), 241-244.
[152] Rakhee Y., Jai P., Sunil K., Manoj K., (2014), Evaluation of blood urea,
creatinine and uric acid as markers of kidney functions in hypertensive
patients: a prospective study. Ind J of Basic and Applied Med. R., 3(2), 682 -
689
[153] Pragna P., Donald J.D., (2015), Hypertension-Related Congestive Heart
Failure in West Africa: A Framework for Global Blood Pressure Control, J
Clin Hypertens (Greenwich)., 16, 8 pages.
[154] Hasan E., (2010), Estimation of Serum Uric Acid, Urea and Creatinine
in Essential Hypertensive Patients, Tikrit Med. J., 16(1), 152 -159
References
999
[155] Desjardins Ph., and Conkin D., (2010), Nanodrop Microvolum
Quantitiation of Nucleic Acide, Journal of Visualized Experiments, 45, 4
pages.
[156] Thomas B., Anastassiya B., Polycarpos P., Alexandros G., (2011), Role
of oxidative stress and DNA damage in human carcinogenesis a Review,
Mutation Research, 711, 193–201.
[157] Pleonsil P., Suwanwong P., (2013), An in vitro study of c-phycocyanin
activity on protection of DNA and human erythrocyte membrane from
oxidative damage, Journal of Chemical and Pharmaceutical Research, 5(5),
332-336.
[158] Hayes J., Strange R.C., (1995), Potential contribution of the glutathione
S Transferase supergene family to resistance to oxidative stress, Free Radical
Res, 22, 193-207.
[159] Ramprasath T., Murugon P.S., Prabakaran A.D., Gomathi P.,
Rathinavel A., Selvam G.S., (2011), Potential risk modification of GsTT1,
GSTM1, and GSTP1 (glutathione – S - transferases) variants and
theirassociation to CAD in patients with type 2 diabetes - Biochamical and
Biophysical Research Commumications 407 :49 -53
[160] Dadbinpour A., Afkhami M.A.(2013), Investingating GSTT1 and
GSTM1 null genotype as the risk factor of diabetes type 2 retinopathy.
Journal of Diabetes and Metabolic Disorders, 2013, 12 -48.
[161] Kolla K., Vidyullatha P, Jeedigunta, Y.Pranary Penagaluru K . P., Joshi
1, S, Rani P .U. and Reddy P., (2011) Glutathione Stransferase M1 and T1
gene polymorphisms in South Indian Stroke patients , Journal of Medical
Genetics and Genomics, 3(4), 65-70.
[162] Abhishek S., Kaur N., Lata M., Sharma J.K., Sharma A., (2010),
Association of GSTM1 and GSTT1 gene deletions with susceptibility to DNA

References
998
damage in the pesticide-exposed workers of Punjab. Rejuvenation
Res., 13(2-3), 281 -284.
[163] Al- Ubeidy M., (2014), Evaluation of the Association of Glutathione S–
Transferase GST(T1,M1)Genetic polymorphism in Iraqi Arab Females with
Type 2 Diabetes Mellitus and Coronary Artery Diseases , Thesis, sci. ,
Baghdad University.

الخلاصة
الاصجبة اىشئضخ اىؤدخ ىلاصبثخ احذ اسرفبع اىضغظ اشاض اىقيت اىػبئخ رزشبسك ف ا
ثب رزاذ اىجذ اىزبمضذ اىز ثذس زذ شذح اىشض فبق اػشاض. اىجزئبد اىفؼبىخ
اىبرجخ اىجذ اىزبمضذ ثبلاضبفخ اى اب رضجت ريفب ثبلاضجخ ثبمضذح اىجزئبد اىحخ ضو اه
بد، ف رؤد اى رىذ صبئظ راد ربصشاد اىزبثخ ششظ اى اىذ اىجشربد اىضنش
مبخ. اىذف ز اىذساصخ ىجحش ثؼض ؤششاد اىجذ اىزبمضذ ف شض اسرفبع ضغظ
اىذ اشاض اىقيت اىػبئخ. ثبلاضبفخ اى ثؼض اىؤششاد اىنحخ اىزؼيقخ ثز الاشاض.
ثشنو زضب اى قضذ ( 56-03اح اػبس )رزش اشأح 48ز اىذساصخ اصزيزذ
ض اىقيت اىػبئخ ػي اىزاى صلاس جبغ، الاى اىضبخ ىشض اسرفبع ضغظ اىذ شا
ف اىجػبد اىضلاس، ضزشف اث اىفش، اىضبىضخ فيضبء صيبد ضيذ جػخ صطشح. ىنو ػخ
ذسمض دمض ماص ، الاىج، حض -4 دا اىذبذ، اىبى اىؤششاد:ر قبس ز
اىسل، اىسب، اىنشبر. اضب اجشذ دساصخ رشحو مشثبئ ػي اىششظ اى ىيشض
ثؼذ رؼشض ىزفبػو فز اىزأمضذاىجذ رأصشىجحش الاصحبء غ اىششظ اى اىش
.PCRثاصطخ رفبػو اىجىشز اىززبثؼ اىنيربص اس رشاضفشز د جدساصخ ج، خزجشب
اىذ ف اىذ صجيذ اسرفبػب ؼب ضطشح فضزبد قسذ اىزبئج ثجػخ اى
(p<0.01) .مبذ اسرفبع ؼف ملا اىشض قبسخ ثجػخ اىضطشح ((p<0.01 ف
ماص، ف ملا اسرفبع اىضغظ بذسمش دمض -4اه ضزبد اىبى دا اىذبذ
ف ضزبر. حض (p<0.01) اخفبضب ؼب اشاض اىقيت اىػبئخ. ثب صجو الاىج
ف ضزبر قبسخ p<0.05) )صجو اسرفبػب ثبػزجبس ضبدا ىلأمضذح اىسك ثشنو غش زقغ
اىشض ( ف مو (p<0.01ب ؼ بفشق د شاىنشثبئ اظدساصخ اىزشحو ثجػخ اىضطشح.
ف جد ج اىنيربصب اس رشاضفشز ، ا بك ػلاقخ طشدخ ث غبة جػخ اىضطشح
ذسمض دمض ماص ػنضخ غ 4زا اىج اسرفبع ضزبد اىبى دا اىذبذ
الاىج .
بد ؤششاد اىجذ اىزبمضذ سثب ؼز اى اىزيف اىزبمضذ ف الاضجخ الاسرفبع ف ضز
ب ضجت ز الاشاض الاىزبثخ. اصززج ز اىذساصخ ثب بك ػلاقخ اجبثخ ث الامضذح
ا اىزيف اىبرج الامضذح شو اىظب اىذفبػ اىجزئبد اىبرجخ ز الاشاض رفبقب
رقزشح اىحبجخ ىزبدح اخز ضبداد الامضذح مبجشاء قبئ ز الاشاض. اىحخ .

Appendix
( Subjects Questioners)
التاريخ:
تسلسل المريضة:
رقم المريضة:
الأسم:
سن اليأس؟: العمر:
الطول: الوزن:
نوع المرض:
مدة المرض:
هل هناك أمراض
ثانية؟
هل المرض وراثي؟
العلاج المتعاطي
السكن:
العمل:
تدخين:
هىريت العراقـــــــــــــــــــــــــــجو
وزارة التعلين العالي والبحث العلوي
ن ــــــــــت النهريـــــــــــــــــــــجاهع
لىمـــــــــــــت العــــــــــــــــــــــــكلي
اءـــــــــــسن الكيويــــــــــــــــــــــــق
ضات مستىات الاجهاد التأكسد عىد مر دراسة
وضغط الدم الأوعة القلبة
رسالة
جامعة الىهره -مقدمة ال كلة العلىم
جزء مه متطلبات ول درجة الماجستر ف علىم الكماءك
من قبل
ياسمين محي الدين حسين (1021)بكالىرىس
بإشراف
جىادعلاء حسه الدكتىر الاستاذ المساعد
وسان جمادي اخر
م 1022 هـ 2341

Chapter One
Introduction &
Literature Review

Chapter Two
Materials & Methods

Chapter Three
Results & Discussion

References

Conclusions &
Recommendation