Study Purpose: Extract, Analyze, and Disseminate ... · Web viewThis technique can also be adapted...
28
Donald B. Keck The first FP devices were demonstrated in the late 1970s (Cox and Jones 1983), where one of two parallel reflecting surfaces moved in response to the pressure changes. Later, Metricor (now Photonetics, Inc.) developed a very compact version of this device based on anodically bonding a silicon membrane to the end of a fiber (Saaski, Hartl, and Mitchell 1986). Thus, the diameter of the sensor unit was the same as the fiber itself. Additionally, the interferometer is monitored at two wavelengths to avoid competing effects. This approach can measure pressure to an accuracy of a few percent, which is sufficient for many applications. This technique can also be adapted to measure temperature and refractive index. Sira, Ltd., produces a device based on this technology. In the early 1980s, pressure sensors based on microbending were demonstrated (Fields et al. 1980). In this technique the fiber is positioned between two opposing serrated plates that bend the fiber, causing signal loss in response to movement of the plates. This method can be configured to sense displacement as well as pressure. Babcock and Wilcox is one of the companies producing pressure sensors based on this technique (Berthold 1994). For extremely high pressures, stress-birefringent polarization-based sensors have been demonstrated. A number of universities have constructed devices capable of operating over pressure ranges 0 - 100 MPa (760,000 torr) (Wolinski 1994). The current state of the art in pressure sensing is capacity to sense pressures in the range of 0 to 700,000 torr. Probably the largest of the applications, biomedical sensors, operates only in the range of 0 to 300 torr. The sensitivity of typical devices is 0.5 to 5 torr (0.01 to 0.1 psi); the best devices can sense 0.06 torr (Rao and Jackson 1994). Relatively little is reported from Japanese companies in the pressure sensor area. Displacement and position sensors 116
Transcript of Study Purpose: Extract, Analyze, and Disseminate ... · Web viewThis technique can also be adapted...

Donald B. Keck
The first FP devices were demonstrated in the late 1970s (Cox and Jones 1983), where one of two parallel reflecting surfaces moved in response to the pressure changes. Later, Metricor (now Photonetics, Inc.) developed a very compact version of this device based on anodically bonding a silicon membrane to the end of a fiber (Saaski, Hartl, and Mitchell 1986). Thus, the diameter of the sensor unit was the same as the fiber itself. Additionally, the interferometer is monitored at two wavelengths to avoid competing effects. This approach can measure pressure to an accuracy of a few percent, which is sufficient for many applications. This technique can also be adapted to measure temperature and refractive index. Sira, Ltd., produces a device based on this technology.
In the early 1980s, pressure sensors based on microbending were demonstrated (Fields et al. 1980). In this technique the fiber is positioned between two opposing serrated plates that bend the fiber, causing signal loss in response to movement of the plates. This method can be configured to sense displacement as well as pressure. Babcock and Wilcox is one of the companies producing pressure sensors based on this technique (Berthold 1994).
For extremely high pressures, stress-birefringent polarization-based sensors have been demonstrated. A number of universities have constructed devices capable of operating over pressure ranges 0 - 100 MPa (760,000 torr) (Wolinski 1994). The current state of the art in pressure sensing is capacity to sense pressures in the range of 0 to 700,000 torr. Probably the largest of the applications, biomedical sensors, operates only in the range of 0 to 300 torr. The sensitivity of typical devices is 0.5 to 5 torr (0.01 to 0.1 psi); the best devices can sense 0.06 torr (Rao and Jackson 1994). Relatively little is reported from Japanese companies in the pressure sensor area.
Displacement and position sensors
Displacement sensors were some of the first optoelectronic sensors to be developed, beginning in the late 1970s and early 1980s. The simplest sensors rely on the change in retroreflectance of light into a fiber because of movement of a proximal mirror surface. One of the first Photonetics sensors was of this type, in which a conical tip is applied to the end of a fiber (Cartellier 1990). Light is totally reflected back into the fiber if the surrounding medium is air; however, if the fiber is inserted into a liquid matching the fiber index, light is extracted from the fiber and lost. Thus, displacement of the liquid surface can be tracked. For obvious reasons, these displacement sensors are referred to as liquid level sensors.
Babcock and Wilcox has also used microbending concepts to sense displacement by causing loss in a fiber due to serrated plates variably pressing on the fiber. Some of these sensors are reported to detect displacements as small as 10-10 m/ Hz (Lagakos et al. 1987). A more practical sensitivity might be 10 mm. As for the range of displacements possible, some of the fly-by-light sensors have been reported to operate from 0 to 50 cm.
Acoustic and vibration sensors
116

6. Optical Sensors and Specialty Fibers
For the most part, fiber-optic vibration sensing has been done in the form of hydrophones for naval applications. Initial work dates to the early 1980s, when omnidirectional devices were made. Fiber-optic devices have provided equal or superior performance to conventional hydrophones in the areas of towed arrays, planar arrays, and fixed undersea surveillance arrays.
More recently, acoustic microphones have been fabricated using similar designs. The basic configuration is a coil of fiber wrapped on a compliant cylinder. As the cylinder flexes in response to the acoustic wave, the resulting stress in the fiber coil is monitored interferometrically. Much of the data is summarized in a review paper from NRL (Wang et al. 1994). The frequency response of these devices can be made very flat, from 0.01 to over 4000 Hz. They can also be made nearly independent of absolute pressure from 0.7 to 3 MPa. The most responsive of these devices can be ~ -300 dB re 1 mPa, well below sea-state zero. NRL reported on a 48-sensor towed array in 1990 and on a 49-channel planar array in 1993. Ultrasonic devices have also been reported that are capable of operating from 10 to 60 kHz.
Acoustic microphones have been fabricated by wrapping fiber around styrofoam cylinders and inserting this optical device in one arm of a Mach-Zehnder interferometer. Performance as good as commercial microphones has been reported. Above 200 Hz the noise floor can be below 20 dB re 20 mPa (Cho and Bualat 1994), and the frequency response is flat to within 2 dB up to 2000 Hz. Though unconfirmed, some U.S. researchers interviewed by the JTEC panel believe that audio microphones of this type are being made by some Japanese audio equipment manufacturers.
Miscellaneous sensors
Several other sensor types have been fabricated in fiber-optic versions: index-of-refraction sensing has been accomplished at the 10-5 level by monitoring the evanescent coupling between a fiber and planar waveguide (Johnstone, Fawcett, and Yim 1994). Ranges of index from about 1.3 to 1.7 can be measured. Index-of-refraction sensors are useful in food processing applications, for example, to monitor sugar content, oil of hydrogenation, or brine content of an operation. Flow sensors have been fabricated in which optical pressure sensors are used to monitor vortex shedding around a suitable obstruction or by the use of aperture plates. Accelerometers based upon sensing an angular displacement using fiber optics are reported to have a detection threshold for angular movement of 4 x 10⁻¹⁰ rad/ Hz and acceleration of approximately 10-6 g/ Hz (Listvin et al. 1994). Still other sensors have been reported that are not relevant to the scope of this JTEC technology assessment.
Enabling Sensor Components
Specialty fibers for sensors
Since a large percentage of today’s optical sensors involve optical fibers in some form, it is important to discuss the status of fiber R&D. For much of the work, sensor designers
117

Donald B. Keck
have made use of the all-glass fibers that are readily available commercially due to high-volume use in telecommunications. Interferometric sensors need single-mode, all-glass fibers; intensity type sensors typically utilize multimode fiber for greater light-gathering capability. While high-NA (numerical aperture) plastic fibers are used for some intensity type sensors, the transmission and fluorescence properties of the plastic complicate the spectral response, so all-glass fibers are favored for many spectroscopic-type sensors. Polarized light transmission is important for a number of sensors (e.g., the fiber-optic gyroscope, FOG); many fiber devices are designed to retain this property along the length of the fiber and in the presence of macro- and micro-bending. In the case of the FOG, the requirements are for a small coil of fiber for which the bending loss must be small, the polarization properties of the light must be maintained, and the physical strength of the fiber must not be jeopardized. For many of the chemical sensors, it is important for the light wave to interact with its surroundings. Therefore, fibers have been made where the core is close to the cladding-outside interface. An example of this type of fiber is the “D-fiber.” Shown in Figure 6.7 are the cross-section views of several types of fiber manufactured and used today.
Figure 6. Specialty Fiber End-Views
Single-mode Fiber Multimode Fiber D-Fiber
Elliptic CoreStress-Rod
Polarization-Maintaining Fibers
Fig. 6.7. End view of specialty fibers.
Several companies around the world manufacture optical fibers. The large telecommunications fiber manufacturers are Corning and AT&T in the United States; Sumitomo, Fujikura, Furukawa, and Optical Fibres Australia in Asia and the Pacific; and Alcatel, Pirelli, Optical Fibers Ltd., and Siecor, GmBh, in Europe. Many of these companies also fabricate special fibers required for optical fiber sensing. In addition, there are numerous smaller-volume fiber manufacturers such as 3M, Lightspec, Spectran, and Andrew in the United States; Hitachi in Japan; and York in Europe, to name a few. While it is difficult to ascertain leadership in manufacturing optical sensor fibers, due to the fact that many sensors utilize existing telecommunications fibers, it would generally seem that
118

6. Optical Sensors and Specialty Fibers
the United States, by virtue of its large fiber manufacturing base and fiber sensor research, has the strongest position in both the design and manufacture of sensor fibers.Detectors
While not much change has taken place in the semiconductor devices actually used to convert photons into electrons, progress continues to be made in readout techniques for the sensor signals. Of particular note is the use of optical fiber interferometers to monitor other interferometric sensors. NRL has led this activity (Kersey, Borkoff, and Morey 1992) and has reported using fiber Mach-Zehnder (MZ) devices to monitor fiber Bragg grating laser cavities and observe strain resolutions of 1.8 x 10⁻¹³/ Hz . NRL has also reported that detection of wavelength shifts in Brillouin and Bragg grating sensors has been improved recently using an all-fiber Fourier transform spectrometer. A demonstrated spectral resolution capability of 0.07 cm-1 corresponds to a Bragg wavelength shift of ~0.015 nm in the 1.55 mm region (Davis and Kersey 1994). In other detection work, workers at Photonetics report using an erbium-doped fiber source in an optical coherence domain reflectometer (OCDR) (LeFevre 1994); they observe a sensitivity of -100 dB in backreflection. Workers at the University of Tokyo are also investigating this technique, but with the addition of phase-modulation (Hotata and Saida 1994).
Light sources
The majority of optical sensors still utilize semiconductor lasers and LEDs as light sources. Increasingly, however, the low-cost semiconductor lasers have been used to pump rare-earth-doped fibers to provide excellent, stable fluorescent sources for chemical monitoring.
A thulium-doped zirconium fluoride fiber exhibiting strong bands at 1.47 mm and 1.9 mm when pumped at 0.79 mm has been used to measure water content. It could have application in measurement of relative humidity, moisture content in paper, and monitoring of ammonia gas (MacCraith and McAleavey 1994).
Erbium-doped superfluorescent fiber sources have been developed for gyroscopes. Pumping at 980 nm, these have emerged as the preferred light sources for rotation (FOG) sensors. They avoid the unacceptably high thermal stability coefficient (~400 ppm/°C) for navigational gyroscopes and offer 1 ppm stability (Hall, Burns, and Moeller 1994).
Networks and Instrumentation
All early sensor demonstrations were of single-sensor units. Eventually in an effort to reduce system cost and increase reliability, several sensors were connected together in either an array or a distributed network. Sensing was accomplished using optical techniques, and only at the end of the network was the optical signal converted into an electrical signal. Various frequency and time division multiplexing techniques were used to extract the desired optical signal. The earliest array demonstrations began in about 1982 using frequency-division multiplexing (FDM) technology (Dandridge 1994). In 1988,
119

Donald B. Keck
Plessey demonstrated a 6-element time-division multiplexed (TDM) acoustic array. At NRL in the same timeframe, 10 sensors were being multiplexed using both FDM and TDM techniques. More recently, a 16-element FDM acoustic sensor (hydrophone) has been described (Yurek et al. 1993). Much of the interest in sensor arrays arises from considerations of cost and avoiding having to link multiple pieces of remote electronics with nonoptical systems. Interest is now focused upon reducing costs of the optical elements, such as 2 x 2 couplers, MZ interferometers, and FBGs. Use of multiplexed networks has also moved away from multiple semiconductor lasers to use of single, high-performance Nd:YAG lasers; the resulting cost per photon is less by 2 to 10 times.
Several recent examples of sensor networks have been reported. The European BRITE-EURAM STABILOS project is intending to use FBG technology to perform strain monitoring in mine networks for such activities as on-line excavation and blasting (Ferdinand et al. 1994). The desire is to have a temperature-insensitive concatenation of strain and pressure sensors capable of detecting <0.1% strain and 0.1 bar pressure. The strain and pressure range needed is 0 to 500 mm and 0 to 1000 bar. As many as 10 sensors per line are desired in a STAR topology. Fiber network lengths could be a few kilometers.
Arrays of fiber Bragg grating sensors have been deployed for sensing strain in bridges and other structures. Recently, 15 FBG sensors were embedded within the precast concrete girders of a bridge during their construction (Maaskant et al. 1994). It was demonstrated that these sensors can measure the change in internal strain within the girders associated with both static and dynamic loading of the bridge with a truck. The sensor arrays were used to directly test both steel and carbon composite tendons within the concrete deck support girders. This is the first bridge in the world to use carbon fiber composite tendons.
TECHNOLOGY SUMMARY
Table 6.5 summarizes relative national capabilities in the optical sensor technologies discussed in the preceding sections. The table lists the major sensor categories, the broadest range of capability, and the highest sensitivity demonstrated in the laboratory today. For some of the sensor types, also listed is the sensitivity that may be expected in a practical device. The columns beside both the range and sensitivity list the nationality of the organization having demonstrated the result. The state-of-the-art research result for the majority of sensor types has been recorded by U.S. organizations. Much of this work has been done at the Naval Research Laboratory and the National Institute of Standards and Technology Laboratory. Overall, these results indicate that the United States leads in research and development of optical sensors.
MARKETS AND APPLICATIONS
Many market surveys for optical sensors have been done over the past several years in the United States, Japan, and Europe. While the estimates vary considerably, owing to the variety of assumptions, they nevertheless agree in predicting a large and growing optical
120

6. Optical Sensors and Specialty Fibers
fiber sensor market over the next two decades. Shown in Figure 6.8 are data from a 1993 Frost and Sullivan Market Intelligence estimate (FSMI 1993) and also data from OITDA.
Table 6.5 Best Performance Levels of Various Optical Sensor Types
Sensor Type Range Leader
Sensitivity
Laboratory Leader
Practical
ChemicalO2 0 - >100% U.S. 6 ppm U.S. 1%Trichloroethylene 0 - > 25 ppm U.S. 5 ppb U.S.H2S ~ 1-5 ppb U.S.
Temperature -96 - >3000 o C U.S. 10 -6 - >10 -3 o C 0.1 - > 1Strain 0 - 8000 µe Can. 10 -13 e / Hz U.S. 1 - >10µe
BiomedicalpO2, pCO2 0 - >300 mm Hg U.S. 0.1 - >1 mm Hg U.S.Glucose 2.8 - >22 mMImmunoglobulins 1 - >10 nM
Electric 0.0001 - 100 Tesla U.S. 1 pTesla/ Hz U.S. 10 pTesla/ Hz& Magnetic 0 - 25 kA U.S. 200 nA/ Hz U.S. 1 - >10 A
0 - > ± 100 kV 20 nV/ Hz U.S. 200 - >2000 nV/ HzRotation 0 - >1400 o /s U.S. 10 -3 - 10 -4 o /Hr / Hz U.S. 0.1o/Hr/ HzVibration
Acoustic 45 - >160 dB re 1µP U.S. 7 dB re µP / Hz U.S.Ultrasonic 200 kHz - >5 MHz 2 Hz
Displacement 0 - 50 cm 10 -4 µm/ Hz Japan
Pressure 0 - >700,000 torr Eur 0.06 torr Eur 0.5 - >5 torrOther
Flow 0 - > 2000 mm/s 0.1 - >1 mm/sRefractive Index 1.3 - >1.7 ~ 10 -5 Eur ~ 10 -3
121

Donald B. Keck
0
200
400
600
800
1000
1200
1985 1986 1987 1988 1989 1990 1991 1992 1993 1994 1995 1996 1997 1998 1999 2000
$'s
(Mill
ions
)
1993 Frost & Sullivan Survey OITDA Data
Fig. 6.8. Optical sensor market survey.The obvious differences between the U.S. and Japanese figures are thought to be a result of OITDA including more of the sensor systems in its numbers. OITDA’s numbers are the sums of actual sales figures obtained from direct polling of member companies; likewise, future projections are the sums of estimates polled from OITDA members. (Newer OITDA projections were unavailable when this report was prepared.)
The FSMI report indicates that the unit price of sensors, a very important parameter, is currently about $300 and is expected to decline to about $150 by the year 2000. This would seem contrary to many reports. For example, major programs are in place to reduce rotation sensor prices below $1,000, aiming toward $500 (Elwood 1995). Reasons for this discrepancy include the mix of products being sold: many of the high-unit-volume sensors are low in cost. Additionally, many sensors used in medical applications are disposable, so that instrumentation unit costs are amortized over many sensor units.
The mix of sensor types has changed over the years as well. In the early days of sensor development, it was projected that displacement, position, and proximity sensors would constitute the majority of units sold. The segment occupied by these sensors today is small and decreasing. Today, temperature, pressure, and chemical sensors probably constitute the biggest segment of the sensor market. Of these three, chemical sensing, mostly associated with medical and biomedical applications, is showing the fastest growth. Another market area of considerable interest is automotive sensing. Potentially, the automotive sensor market could grow to several billion dollars over the next several decades if all the parameters to be sensed could be done cost-effectively in an optical format. However, this market is extremely price conscious, and it is not clear that optical techniques will be able to penetrate the market.
Another important market area for sensing is the civil infrastructure. The constantly aging system of bridges, highways, buildings, railroads, dams, pipelines, etc., continually suffer outages due to material fatigue. Increasingly, embedded fiber-optic sensors hold promise for more routinely monitoring this aging and offer the possibility of taking remedial action
122

6. Optical Sensors and Specialty Fibers
prior to catastrophic failure. A conference on the subject of “smart structures” was first held in 1992 (SPIE 1992) and has become an annual event. Issues associated with the technology for this market mostly have to do with packaging and attachment of the sensors. It is in these areas that much research is taking place, mostly at universities. The other issue is cost; currently optical sensors are as much as 100 times more expensive than corresponding mechanical or electronic sensors.
COMPARISON OF U.S. AND JAPANESE EFFORTS
The JTEC panel visited three Japanese optical sensor manufacturers: Hitachi Cable, Hoya Glass, and Furukawa Cable. One of the panel’s most instructive site visits on the subject of optical sensing was to Hitachi Cable (see site report in Appendix D). There, Hitachi representatives told the panel that the company has both distributed temperature sensors and fiber-optic gyroscopes as commercial products; Hitachi is probably the largest FOG producer in the world, with production capability for intermediate grade FOGs (1° to 10°/hr, 100°/sec) of 2,500 units/month/shift; the Hitachi representatives indicated that they normally run two 12-hour shifts a day. Hitachi Cable’s distributed temperature sensor is used to detect hot-spots in motor windings and infrastructure ducts.
During the Hoya Glass site visit (see site report in Appendix D), panelists were told that the company is making fluoride fibers for IR transmission, with applications in laser surgery and temperature sensing. Hoya Glass is also producing a special flint glass fiber for magnetic field sensing. Company officials at Furukawa Cable (see site report in Appendix D) indicated that the company is producing a fiber with an offset core for methane sensing. With the core offset, the evanescent wave can interrogate the region surrounding the fiber. For a 20 cm fiber length, the panel’s hosts reported obtaining 1- and 2-dB signal changes for, respectively, 50% and 100% methane surrounding the fiber.
To obtain a more complete evaluation of the Japanese optical sensing capability, JTEC performed an extensive literature search. As noted earlier, the United States leads all other nations by a wide margin in number of optical sensor publications. Of those listed in the INSPEC Database, approximately 6,000 articles published during the past decade, about 50% originated in the United States. Considering the number of times a U.S.-based organization holds the world record for performance, as Table 6.5 shows, one must conclude that most of the leading research is being done in the United States; however, as noted in Figure 6.4 and discussed above, Japanese scientists do produce more patents than U.S. scientists.
Analysis of the publication record can be taken deeper. Figures 6.9 and 6.10 show separately a breakdown into the 12 different categories of the optical sensor publications shown earlier in Figure 6.5, for the United States and Asia (where most publications are Japanese).
Comparison of Sensor Technology Activities
123

Donald B. Keck
To more clearly compare the activity levels of U.S. and Japanese R&D in optical sensors, Figures 6.11 to 6.19 present the publication chronology separately for each of the twelve categories in the United States, Asia (dominated by Japan), and Europe (presented but not analyzed).
The category enabling science and components is the largest area for both the United States and Asia and has shown steady growth over the last ten years. Networks and instrumentation is the second largest area; there has been a sharper increase in publications in the United States than in Japan, due to the large increase in U.S. defense R&D on network and cascade sensors, focused on providing more cost-effective systems. Ignoring the category other, which incorporates pressure, flow, displacement, and vibration sensors, the third largest category is chemical sensing. Here again, the U.S. activity has increased sharply, driven by concerns for the environment and the need to be able to “measure” in order to “change.” The Japanese effort has not grown as rapidly.
124

6. Optical Sensors and Specialty Fibers
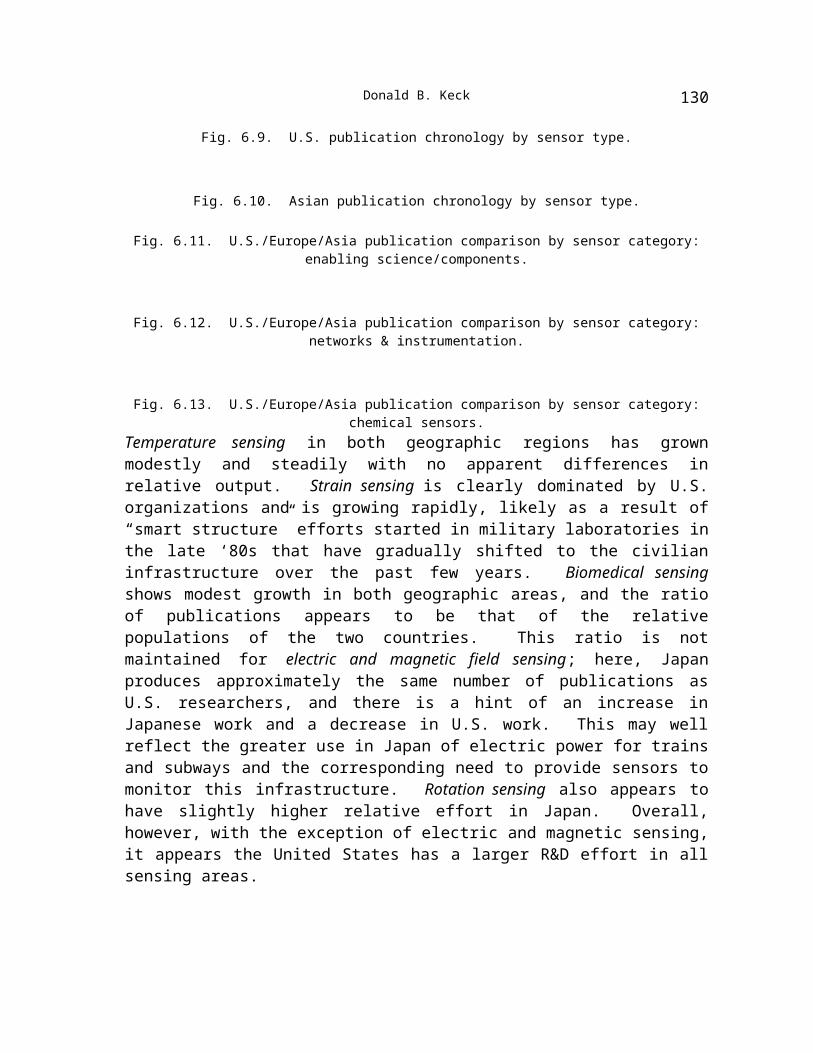
Fig. 6.9. U.S. publication chronology by sensor type.
Fig. 6.10. Asian publication chronology by sensor type.
Fig. 6.11. U.S./Europe/Asia publication comparison by sensor category: enabling science/components.
Fig. 6.12. U.S./Europe/Asia publication comparison by sensor category: networks & instrumentation.
Fig. 6.13. U.S./Europe/Asia publication comparison by sensor category: chemical sensors.
Temperature sensing in both geographic regions has grown modestly and steadily with no apparent differences in relative output. Strain sensing is clearly dominated by U.S. organizations and is growing rapidly, likely as a result of “smart structure” efforts started in military laboratories in the late ‘80s that have gradually shifted to the civilian infrastructure over the past few years. Biomedical sensing shows modest growth in both geographic areas, and the ratio of publications appears to be that of the relative populations of the two countries. This ratio is not maintained for electric and magnetic field sensing; here, Japan produces approximately the same number of publications as U.S. researchers, and there is a hint of an increase in Japanese work and a decrease in U.S. work. This may well reflect the greater use in Japan of electric power for trains and subways and the corresponding need to provide sensors to monitor this infrastructure. Rotation sensing also appears to have slightly higher relative effort in Japan. Overall, however, with the exception of electric and magnetic sensing, it appears the United States has a larger R&D effort in all sensing areas.
Fig. 6.14. U.S./Europe/Asia publication comparison by sensor category: temperature sensors.
Fig. 6.15. U.S./Europe/Asia publication comparison by sensor category: strain sensors.
Fig. 6.16. U.S./Europe/Asia publication comparison by sensor category: biomedical sensors.
Fig. 6.17. U.S./Europe/Asia publication comparison by sensor category: electric/magnetic sensors.
Fig. 6.18. U.S./Europe/Asia publication comparison by sensor category: rotation sensors.
Fig. 6.19. U.S./Europe/Asia publication comparison by sensor category: other sensors.
125

Donald B. Keck
Comparison of Commercial Activities
Figure 6.20 shows data regarding the geographic distribution of companies selling optical sensors. Approximately 100 sensor companies were identified, nearly 50% being in the United States and less than 10% in Japan. This probably reflects the facts that this technology and market are very fragmented and that many small entrepreneurial companies are active, particularly in the United States. The active companies in Japan tend to be large, such as Hitachi, Hoya, Tokyo Electric, and Sumitomo, to name a few.
Fig. 6.20. Geographic distribution of companies producing optical sensors
(UK Optical Sensors Collaborative Association 1994).It is interesting to speculate regarding the observation that Hitachi is commercially pursuing the intermediate gyroscope market by concentrating on manufacturing for the large-volume automotive market. The U.S. companies attempting to reduce gyroscope costs under the U.S. Air Force Man-Tech programs, notably Honeywell and Litton, are working toward navigational grade (higher performance) units for markets with much smaller potential volume. Over the next three years these programs should generate about 30,000 units (Elwood 1995); Hitachi can currently produce that number of units in a single year. Like Japan’s application of optoelectronic data storage technology to compact disk and archival mass storage products, this appears to be another example of Japan’s market strategy of targeting consumer goods for high-volume, medium-grade, low-cost applications of cutting-edge electronics and optoelectronics technologies.
SUMMARY AND CONCLUSIONS
Table 6.6 summarizes Japan’s strengths compared to those of the United States in the twelve optical sensor technology fields discussed in this chapter. The table compares R&D activities as well as commercial or application activities, and looks at both current and future work.
Table 6.6Optical Sensor Technology Status, Japan Compared to the United States
SENSOR TECHNOLOGY R&D ApplicationsCurrent Trend Current Trend
Enabling Science & Components - ß + Þ
Networks & Instrumentation - ß 0 Þ
Temperature - ß 0, + Ý
Chemical - ß - ß
Strain - ß - ß
Rotation - ß + Þ
Electric & Magnetic - Þ + Ý
126

6. Optical Sensors and Specialty Fibers
Biomedical - ß - ß
Pressure - Þ - Þ
Displacement - Þ - Þ
Vibration - Þ + Ý
Flow - Þ - Þ
Key- Japan Behind ß Japan Losing0 Japan/U.S. Neutral Þ Japan/U.S. Neutral
+ Japan Ahead Ý Japan Gaining
Research and Development of Optical Sensor Technologies
The JTEC panel’s assessment is that Japan lags the United States in all areas of current R&D. As already noted in Table 6.5, virtually all state-of-the-art results have been generated by U.S. laboratories. U.S. Government laboratories, in particular NRL and NIST, have played a seminal role in establishing U.S. technological leadership in the optical sensors field. Several university programs, such as that of the University of Virginia, have also made significant contributions.
The panel also concludes that the trend is for the United States to lead Japan in most optical sensor R&D categories in the near future, with the exception of the electric and magnetic sensing area, where publications activity indicates increasing activity in Japan and a neutral position relative to the United States. The R&D trend for the pressure, displacement, vibration, and flow sensors is rated neutral simply because activity levels are so small that no conclusion is possible.
Applications of Optical Sensor Technologies
Enabling science and components
In the applications and commercial aspects of optical sensor technology, the JTEC panel finds the picture to be more mixed. It seems that Japan is ahead in the area of enabling science and components. Optical sensor technology was built on the foundation of fiber communications components and technologies. As noted in other chapters (see especially Chapters 4 and 5), Japan’s activity in optical packaging and many optoelectronic enabling components is ahead of the United States. The semiconductor lasers used in many sensor devices come from Japanese companies. The electronic packaging and connector technology of companies such as Kyocera, Sumitomo, Fujikura, and Furukawa will be very valuable to optical sensor development and commercialization efforts. Work is increasing in the United States, however, and the trend over time will likely be toward neutrality.
Networks and instrumentation
127

Donald B. Keck
The relative status of Japan and the United States in networks and instrumentation appears neutral. Japanese companies have already deployed distributed temperature sensors. Certainly network technology of optical fiber communications is an area where the two countries compete quite evenly, and networking with optical sensors will be increasingly common. It is expected that parity will continue.
Chemical
The United States is ahead in the chemical sensor application area. Several U.S. companies are selling units to measure various gases. For example, First Alert’s carbon monoxide monitor, which uses optical techniques, sells many thousand units a year. The trend is expected to continue in favor of the United States because of U.S. environmental and safety concerns.
Temperature
There are two ratings for temperature sensor applications: parity exists in the area of point sensors (the number of applications is small); however, for distributed sensors, Japanese companies have the lead in deployment, and their relative position is likely to become stronger over time, since there is little U.S. activity in this field.
Strain
In the area of strain sensing, the United States is ahead. Babcock & Wilcox is selling microbend sensors. Currently there appears to be no Japanese commercial presence. The trend is expected to continue.
Biomedical
The United States is ahead in the biomedical area. Camino Laboratories is thought to be selling about 60,000 units a year to perform cranial pressure sensing. The 3M subsidiary, CDI, is reported to be selling per month on the order of 10,000 blood gas analyzers that use optical sensing technology. The trend should continue in favor of the United States, since little activity is noted among Japanese companies.
Electric and Magnetic
Japanese companies are probably ahead in the area of electric and magnetic field sensing. Deployment of current and voltage sensors has already taken place in Japan and Europe. The trend is expected to continue in favor of Japanese companies.
Rotation
128

6. Optical Sensors and Specialty Fibers
For rotation sensors, at least of the intermediate grade, the Japanese are clearly ahead. As noted above, Hitachi is capable of producing 5,000 units a month and is selling to automobile manufacturers. The United States has in place programs to provide cost reduction and scale-up. The trend is expected to be neutral, provided automotive FOGs do not become incorporated in a broader cross-section of vehicles. This will be interesting to watch over the next few years.
Other sensors
For pressure, displacement, vibration, and flow sensing, relatively little activity is occurring; nevertheless the United States appears to lead in all these areas, with the possible exception of vibration. In that area, it is rumored that Japanese companies are selling an optical microphone. If so, the trend is expected to continue in favor of Japan. In the other areas, the trend is likely to be neutral.
In sum, the JTEC panel’s assessment is that the United States leads in virtually all high-performance optical sensing work. This has occurred due to the strong effort of the national and Defense Department laboratories, notably NRL and NIST, together with DoD-funded work at several leading universities. The United States also leads in start-up companies in the optical sensor field. Several of these have been purchased by non-U.S. companies over the last few years; e.g., Metricor by Photonetics and the Westinghouse effort by ABB. It appears that Japanese companies active in this field are focusing on high-volume applications with perhaps lower performance requirements. This is certainly true for Hitachi’s fiber-optic gyroscope and may also be true for distributed temperature and voltage sensors.
REFERENCES
Baldini, F., and A. Mignani. 1994. “In-vivo biomedical monitoring by fiber optic systems.” Proc. 10th Optical Fibre Sensors Conference, SPIE 2360:80.
Berthold, J. 1994. “Historical review of microbend fiber optic sensors.” Proc. 10th Optical Fibre Sensors Conference, SPIE 2360:182.
Bohnert, K., H. Brandle, and G. Frosio. 1994. “Field test of interferometric optical fiber high-voltage and current sensors.” Proc. 10th Optical Fibre Sensors Conference, SPIE 2360:16.
Bosselmann, T., and P. Menke. 1994. “Intrinsic temperature compensation of magnetooptic AC current transformers with glass ring sensor head.” Proc. 10th Optical Fibre Sensors Conference, SPIE 2360:20.
Cartellier, A. 1990. “Optical probes for local void fraction measurements; characterization of performance.” Rev. Sci, Instrum. 61:874-886.
Cho, Y., and M. Bualat. 1994. “Fiber-optic interferometric sensors for aeroacoustic measurements: anechoic chamber tests.” Proc. of the SPIE 2292:73.
Cox, E., and B. Jones. 1983. “Fiber optic color sensors based on Fabry-Pérot interferometry.” First International Conf. On Optical Fiber Sensors, 122-126.
129
Donald B. Keck
Crossley, S. 1994. “Commercially available fibre optic sensors - 10 years of progress?” Proceedings 10th Optical Fibre Sensors Conference, SPIE 2360:249.
Dandridge, A. 1994. “The development of fiber optic sensor systems.” Proc. 10th Optical Fibre Sensors Conference, SPIE 2360:154.
Davis, M., and A. Kersey. 1994. “Fiber Fourier transform spectrometer for decoding Bragg grating sensors.” Proc. 10th Optical Fibre Sensors Conference, SPIE 2360:167.
Day, G., et al. 1994. “Optical fiber sensors: accelerating applications in navy ships.” U.S. Department of Commerce, NISTIR 5018, 28.
Deeter, M., G. Day, T. Beahn, and M. Manheimer. 1993. “Magneto-optic magnetic field sensor with 1.4 pT/ÖHz noise equivalent field at 1 kHz.” Elec. Lett. 29:993-994.
Dialog File 4. 1994. INSPEC Database (fiber and optical sensor publications). London: Institution of Electrical Engineers. (Compiled by JTEC, John Ward.)
Dialog File 347. 1994/5. Japan Patent Office: JAPIO Database. (Compiled by JTEC, John Ward.)
Dialog File 348. 1995. European Patent Office Database. (Compiled by JTEC, John Ward.)
Elwood, P. 1995. “Manufacturing technology for tactical grade fiber optics gyros.” OSA Proc. Integrated Photonics Research Conference.
Ezekiel, S., S. Smith, M. Shahriar, and P. Hemmer. 1994. “New opportunities in fiber optic sensors.” Proc. 10th Optical Fibre Sensors Conference, SPIE 2360:3.
Fabiny, L., S. Vohra, and F. Bucholtz. 1994. “Ultra-low drift, sub-microvolt low-frequency fiber optic voltage sensor.” Proc. 10th Optical Fibre Sensors Conference, SPIE 2360:45.
Ferdinand, P., O Ferragu, L. Lechien, B. Lescop, V. Marty, S. Rougeault, G. Pierre, C. Renouf, B. Jarret, G. Lotrotsios, V. Neuman, Y. Depeursinge, J. Michel, M. VanUffelen, Y. Verbandt, M. Voet, and D. Toscano. 1994. “Mine operating accurate STABILity control with optical fiber sensing and Bragg grating technology: the BRITE-EURAM Stabilos project.” Proc. 10th Optical Fibre Sensors Conference, SPIE 2360:162.
Fernicola, V., and L. Crovini. 1992. “Two fluorescent decay-time thermometers.” Temperature, Its Measurement and Control in Science and Industry, vol. 6( part 2) New York: AIP, 725-30.
_____. 1994. “Digital signal processing for fiber-optic thermometers.” CPEM ‘94 Boulder, CO.
Fields, J., et. al. 1980. “Fiber optic pressure sensor.” J. Acous. Soc. Am. 67:816.
Flavin, D., R. McBride, and J. Jones. 1994. “Temperature-insensitive interferometric measurement of strain using grating-coupled LED sources.” Proc. 10th Optical Fibre Sensors Conf., SPIE 2360:195.
FSMI (Frost and Sullivan Market Intelligence). 1993. “World fiber optic sensor markets.” Report 912-40. Mountain View, CA:FSMI.
Gehrich, J., D. Lubbers, N. Optiz, D. Hansmann, W. Miller, K. Tusa, and M. Yafuso. 1986. “Optical fluorescence and its application to an intravascular blood gas monitoring system.” IEEE Trans. Biom. Eng. BME-33 (no.2):117-132.
Hall, D., W. Burns, and R. Moeller. 1994. “Optimization of wavelength stability in Er-doped super-fluorescent fiber sources for gyroscopes.” Proc. 10th Optical Fibre Sensors Conf., SPIE 2360:116.
Healey, B., S. Chadna, D. Walt, F. Milanovich, J. Richards, and S. Brown. 1994. “Development of sensor arrays for continuous ground water monitoring.” Proc. 10th Optical Fibre Sensors Conference, SPIE 2360:101.
130

6. Optical Sensors and Specialty Fibers
Hotate, K., and T. Saida. 1994. “Phase-modulating optical coherence domain reflectometry by synthesis of coherence function: proposal and experiments.” Proc. 10th Optical Fibre Sensors Conference, SPIE 2360:534.
Itoh, N., et al. 1995. “Optical magnetic field sensors with high linearity using Bi-substituted Rare earth iron garnets.” 1995 IEEE International Magnetics Conf., San Antonio, TX. Paper CD-10.
Jin, W., G. Stewart, B. Culshaw, and S. Murray. 1994. “Source noise limitation of fibre optic methane sensors.” Proc. 10th Optical Fibre Sensors Conference, SPIE 2360:75.
Johnstone, W., G. Fawcett, and L. Yim. 1994. “In-line fibre-optic refractometry using index-sensitive resonance positions in single-mode fibre-to-planar-polymer-waveguide couplers.” IEE Proc. Optoelec. 141 (no.5):299-302.
Kersey, A., T. Berkoff, and W. Morey. 1992. Elec. Lett. 28:236.
Kersey, A., and M. Marrone. 1994. “Fiber Bragg grating high-magnetic-field probe.” Proc. 10th Optical Fibre Sensors Conference, SPIE 2360:53.
Kim, S., B. Kim, and H. Kim. 1994. “Investigation of Er+3-doped fiber ring laser for its application to rotation sensing.” Proc. 10th Optical Fibre Sensors Conf., SPIE 2360: 108.
Kurosawa, K., S. Yoshida, K. Sakamoto, I. Masuda, and T. Yamashita. 1994. “An optical fiber-type current sensor utilizing the Faraday effect of the flint glass fiber.” Proc. 10th Optical Fibre Sensors Conference, SPIE 2360:24.
Lagakos, N., et al. 1987. “Microbend fiber optic sensor.” Appl. Opt. 26:2171.
Lefevre, H. C. 1994. “Optical fiber sensors at photonetics: a small company experience.” Proc. 10th Optical Fibre Sensors Conference, SPIE 2360:228.
Lefevre, H., et al. 1994. “Latest advances in fiber-optic gyroscope technology at Photonetics.” Proc. 9th Optical Fibre Sensors Conference, SPIE 2292:156.
Listvin, A., V. Listvin, V. Potapov, and S. Tverdov. 1994. “ Passive fiber-optic accelerometer.” J. Comm. Tech. And Elec. 39 (4):65-69.
Maaskant, R., T. Alavie, R. Measures, M. Ohn, S. Karr, C. Wade, G. Tadros, and S. Rizkalla. 1994. “Fiber optic Bragg grating sensor network installed in a concrete road bridge.” Proc. Smart Structures and Materials Conference, SPIE 2191:53.
MacCraith, B., and F. McAleavey. 1994. “Water detection using fluorescent thulium-doped fluoride fibre pumped by low-cost semiconductor laser.” Proc. 10th Optical Fibre Sensors Conference, SPIE 2360:90.
Maurice, E., G. Monnom, D. Ostrowsky, and G. Baxter. 1994. “High-temperature point sensor using green fluorescence intensity ratio in Er-doped silica fibre.” Proc. 10th Optical Fibre Sensors Conference, SPIE. 2360:219.
Milanovich, F., S. Brown, B. Colston, and P. Daley. 1994. “A fiber-optic system for remote long-term monitoring of soil and groundwater contamination.” Proc. 10th Optical Fibre Sensors Conference, SPIE 2360:98.
Morey, W., G. Meltz, and J. Weiss. 1994. “High temperature capabilities and limitations of fiber grating sensors.” Proc. 10th Optical Fibre Sensors Conference, SPIE 2360:234.
Noel, B., W. Turley, W. Lewis, K. Tobin and D. Beshears. 1992. “Phosphor thermometry on turbine-engine blades and vanes,” in Temperature, Its Measurement and Control in Science and Industry, vol. 6. New York: AIP, 1249-54.
131

Donald B. Keck
OITDA (Optoelectronics Industry and Technology Development Association). 1994. Report.
Pahler, R., and A. Roberts. 1977. “Design of a fiber optic pressure transducer.” Trans. ASME. 274-280.
Rao, Y. J., and D. A. Jackson. 1994. “A prototype fibre-optic-based Fizeau medical pressure and temperature sensor system using coherence reading.” J. Measurement Science & Tech 5(6):741-6.
Rochford, K., A. Rose, M. Deeter, and G. Day. 1994. “Faraday effect current sensor with improved sensitivity-bandwidth product.” Proc. 10th Optical Fibre Sensors Conf., SPIE 2360:32.
Ryan, Hankin, and Kent. 1992. “Emerging markets in fiber optics.” Lightwave Industry Program ‘91.
Saaski, E., J. Hartl, and G. Mitchell. 1986. “A fiber-optic sensing system based on spectral modulation.” Proc. ISA/86 International Conference (Houston, TX).
Shen, Y., Y. Wang, L. Ye, Z. Ding. 1994. “Study on the doped crystal fiber high temperature sensor.” Proc. Fiber Optic and Laser Sensors XII, SPIE 2292:421.
Shimizu, K., T. Horiguchi, and Y. Koyamada. 1994. “Measurement of distributed strain and temperature in a branched optical fiber network by using Brillouin OTDR.” Proc. 10th Optical Fibre Sensors Conference, SPIE 2360:142.
SPIE. 1992. First European conf. on smart structures and materials, Glasgow. Proc. SPIE 1777.
Tanaka, Y., and K. Hotate. 1994. “Fiber Brillouin ring laser without polarization-fluctuation-induced instability: a candidate applicable for Brillouin fiber optic gyro.” Proc. 10th Optical Fibre Sensors Conference, SPIE 2360:112.
Wakami, T., and S. Tanaka. 1994. “1.55 mm long-span fiber-optic distributed temperature sensor.” Proc. 10th Optical Fibre Sensors Conference, SPIE 2360:134.
Walczak, I., W. Love, T. Cook, and R. Slovacek.. 1992. “The application of evancescent wave sensing to a high-sensitivity fluoroimmunoassay.” J. Biosensor & Bioelectronics 7:39-48.
Wallace, P., Y. Yang, and M. Campbell. 1994. “Application of sol-gel processes for fibre optic chemical sensor development.” Proc. 10th Optical Fibre Sensors Conf., SPIE 2360: 465.
Wang, C., A. Dandridge, A. Tveten, and A. Yurek. 1994. “Very high responsivity fiber optic hydro-phones for commercial applications.” Proc. 10th Optical Fibre Sensors Conf., SPIE 2360:360.
Wolinski, T. 1994. “Stress effects in twisted highly birefringent fibers.” Proc. of the SPIE 2070:392-403.
Wosinski, L., M. Breidne, R. Stubbe, B. Sahlgren, and J. Betend-Bon. 1994. “Experiment system considerations for distributed sensing with grating Fabry-Perot interferometers.” Proc. 10th Optical Fibre Sensors Conference, SPIE 2360:146.
Yurek, A., et al. 1993. Proc. Optical Fibers Sensors Conference, 1993 (Florence, Italy).
Zhang, Z., K. Grattan, and A. Palmer. 1992. “Sensitive fibre optic thermometer using Cr:LiSAF fluorescence for biomedical sensing applications.” Proc. 8th Optical Fibre Sensors Conf. (Monterey, CA), 93-96.
132

6. Optical Sensors and Specialty Fibers133