Study on Thermal Deposition in the Interaction Region Magnets
24
CARE 06 INFN–LNF 15-17 November 2006 Study on Thermal Deposition in the Interaction Region Magnets [email protected] nfn.it francesco.broggi@cern
-
Upload
levi-holland -
Category
Documents
-
view
26 -
download
1
description
Study on Thermal Deposition in the Interaction Region Magnets. [email protected] [email protected]. Outline. Chronology (where this study comes from) Method of calculations Cases and results 2005/06 reprise of the problem Work done this year Next. - PowerPoint PPT Presentation
Transcript of Study on Thermal Deposition in the Interaction Region Magnets

CARE 06INFN–LNF 15-17 November 2006
Study on Thermal Deposition in the Interaction Region
Magnets

CARE 06INFN–LNF 15-17 November 2006
Outline
• Chronology (where this study comes from)
• Method of calculations
• Cases and results
• 2005/06 reprise of the problem
• Work done this year
• Next
CARE 06INFN–LNF 15-17 November 2006
Chronology
• Study of a new Nb3Sn design for the LHC insertion quad started in 1995, suggested by the Milan group (L.Rossi)
• Ended in 1998 (1999 final report)
CARE 06INFN–LNF 15-17 November 2006
Purpose of the Study was:
• Use of the Nb3Sn technology instead of the "traditional" NbTi, for the construction of the focussing quadrupoles in the interaction region of LHC in order to have :
Higher focussing gradient (higher luminosity), in the same magnet aperture
or The same focussing gradient in a larger aperture,
(easier beam dynamics, especially at the injection).
CARE 06INFN–LNF 15-17 November 2006
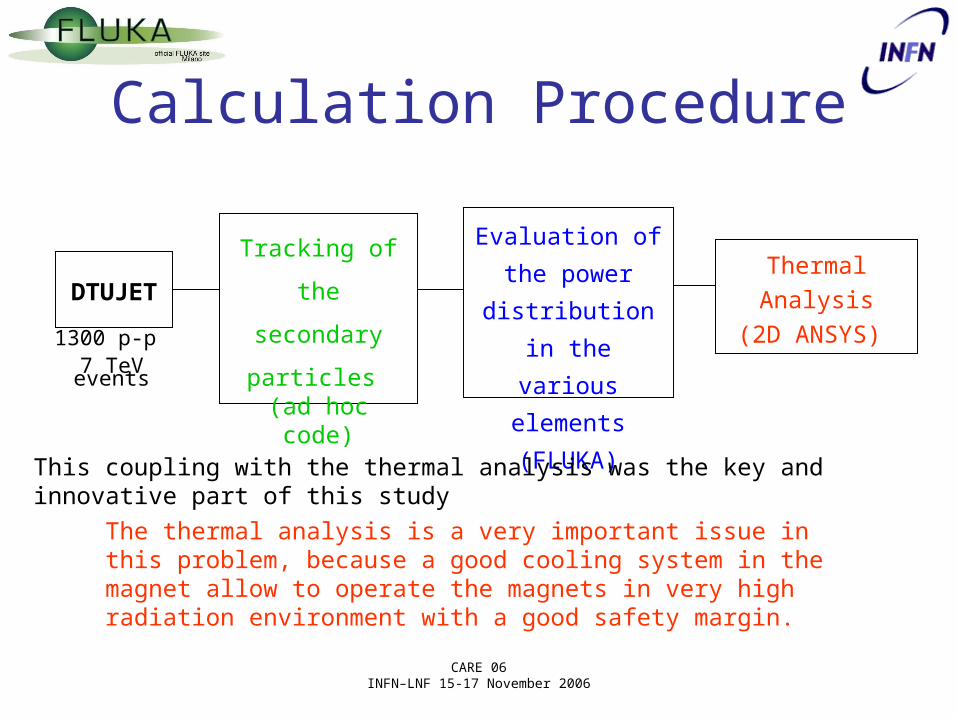
Thermal Analysis
(2D ANSYS) DTUJET
Tracking of the
secondary
particles (ad hoc code)
Evaluation of the
power distribution
in the various
elements
(FLUKA)
1300 p-p 7 TeV events
Calculation Procedure
The thermal analysis is a very important issue in this problem, because a good cooling system in the magnet allow to operate the magnets in very high radiation environment with a good safety margin.
This coupling with the thermal analysis was the key and innovative part of this study

CARE 06INFN–LNF 15-17 November 2006
“Old” Cases Studied
Case Number
Aperture (mm)
Main Gradient
(T/m)
Trim Gradient
(T/m)
Absorbers Type / Thickness (mm)
1 70 235 82 No 2 70 235 82 Cylindrical uniform / 5 3 70 300 105 No 4 85 235 82 No 5 70 227 80 Suited / 12; 10; 4.5; 4.5; 4.5
Version LHC 6.5 with G = 203 T/m and Beam Screens

CARE 06INFN–LNF 15-17 November 2006
Modelization and Hypothesis
TRACKING• Beam pipe thickness 1.5 mm• Detector peak field 2 T• Detector radius 1.1 m• Detector length 5.3 m• Crossing angle 200 rad • Cross section
(inel.+ single diff. event) 80 mbarn• Luminosity 1034 cm-2s-1
THERMAL ANALYSISMODEL 2D - Steady StateThermal Conductivity Computed from cable-insulation stackInsulation Non isotropic G10Heat flux Purely longitudinalHeat transfer coefficient 1000 W/m2K at 1.9 K
FLUKA• Cut off for Hadrons 1 MeV• Cut off for electrons/positron 1.5 MeV• Cut off for photons 0.2 MeV• Cut off for neutrons 0.4 eV
Detailed description of the magnets with the coil layers, insulation, wedges and yokes
CARE 06INFN–LNF 15-17 November 2006
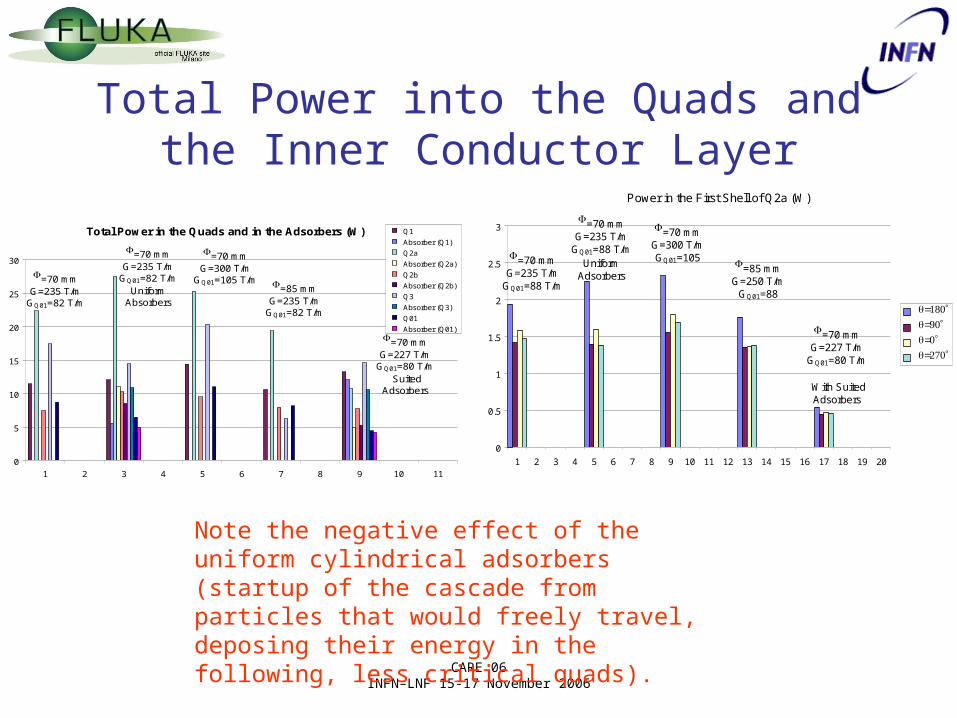
Total Power into the Quads and the Inner Conductor Layer
Total Power in the Quads and in the Adsorbers (W)
0
5
10
15
20
25
30
1 2 3 4 5 6 7 8 9 10 11
Q1
Absorber (Q1)
Q2a
Absorber (Q2a)
Q2b
Absorber (Q2b)
Q3
Absorber (Q3)
Q01
Absorber (Q01)
=70 mm G=235 T/m
GQ01=82 T/m
=70 mm G=235 T/m
GQ01=82 T/mUniform
Absorbers
=70 mm G=300 T/m
GQ01=105 T/m =85 mm G=235 T/m
GQ01=82 T/m
=70 mm G=227 T/m
GQ01=80 T/m Suited
Adsorbers
Power in the First Shell of Q2a (W)
0
0.5
1
1.5
2
2.5
3
1 2 3 4 5 6 7 8 9 10 11 12 13 14 15 16 17 18 19 20
=70 mm G=235 T/m
GQ01=88 T/m
=70 mm G=235 T/m
GQ01=88 T/m Uniform
Adsorbers
=70 mm G=300 T/m GQ01=105
T/m=85 mm
G=250 T/m GQ01=88
T/m
=70 mm G=227 T/m
GQ01=80 T/m
With Suited Adsorbers
Note the negative effect of the uniform cylindrical adsorbers (startup of the cascade from particles that would freely travel, deposing their energy in the following, less critical quads).
CARE 06INFN–LNF 15-17 November 2006
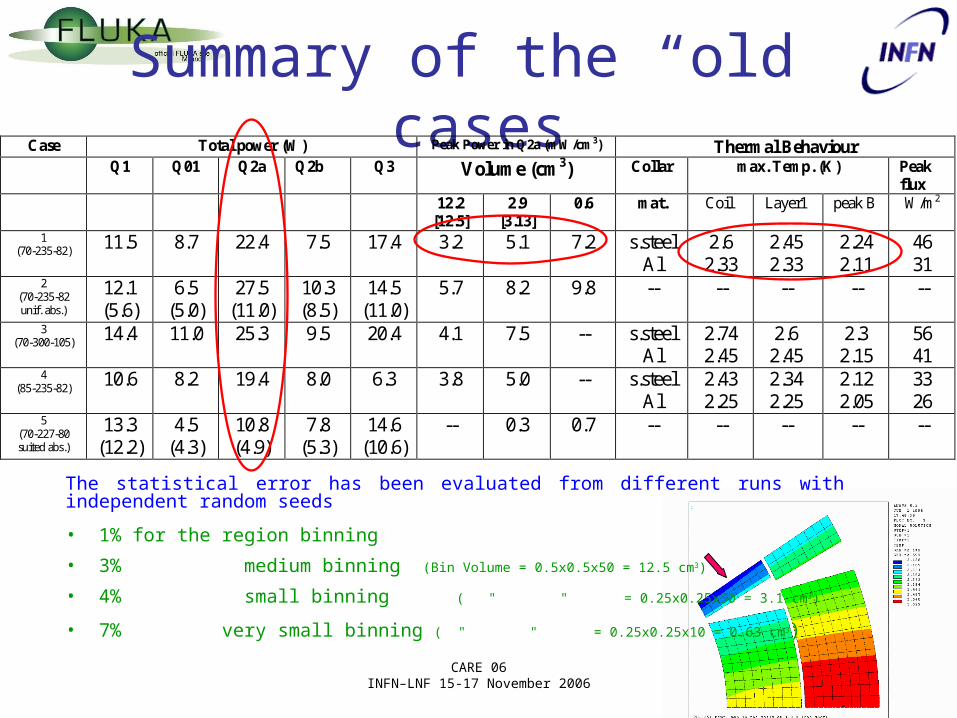
Summary of the “old” casesCase Total power (W) Peak Power in Q2a (mW/cm3) Thermal Behaviour
Q1 Q01 Q2a Q2b Q3 Volume (cm3) Collar max. Temp. (K)
Peak flux
12.2 [12.5]
2.9 [3.13]
0.6 mat. Coil Layer1 peak B W/m2
1 (70-235-82) 11.5 8.7 22.4 7.5 17.4 3.2 5.1 7.2 s.steel
Al 2.6
2.33 2.45 2.33
2.24 2.11
46 31
2 (70-235-82 unif. abs.)
12.1 (5.6)
6.5 (5.0)
27.5 (11.0)
10.3 (8.5)
14.5 (11.0)
5.7 8.2 9.8 -- -- -- -- --
3 (70-300-105) 14.4 11.0 25.3 9.5 20.4 4.1 7.5 -- s.steel
Al 2.74 2.45
2.6 2.45
2.3 2.15
56 41
4 (85-235-82)
10.6 8.2 19.4 8.0 6.3 3.8 5.0 -- s.steel Al
2.43 2.25
2.34 2.25
2.12 2.05
33 26
5 (70-227-80 suited abs.)
13.3 (12.2)
4.5 (4.3)
10.8 (4.9)
7.8 (5.3)
14.6 (10.6)
-- 0.3 0.7 -- -- -- -- --
The statistical error has been evaluated from different runs with independent random seeds
• 1% for the region binning
• 3% medium binning (Bin Volume = 0.5x0.5x50 = 12.5 cm3)
• 4% small binning ( " " = 0.25x0.25x50 = 3.1 cm3)
• 7% very small binning ( " " = 0.25x0.25x10 = 0.63 cm3)
CARE 06INFN–LNF 15-17 November 2006
Indications from the”old” cases I• Negative effect of the cylindrical absorbers
• The case with higher gradient (G=300 T/m) is slightly worst than the reference case (G=235 T/m)
• Case with lager aperture (=85 mm) is better for the deposed power but it has a small increment in the peak power.
• From the thermal analysis the power released by the radiation does not endanger the operating point of the magnets and guarantee a good stability margin, as a matter of fact the maximum temperature is in the median plane, where the magnetic field is lower enough to guarantee a safe combination of the two parameters.
• Conversely in the higher field regions the temperature increment is not too high .
• Larger stability margin can be achieved by using the aluminum collars instead of the stainless steel ones (tradeoff with the mechanical properties).
• Nb3Sn is a good solution for the second generation low- quads, either to increase the focussing gradient, or to get the same focussing performance in a larger aperture.

CARE 06INFN–LNF 15-17 November 2006
Indications from the”old” cases II
In the “nominal (academic) case” or LHC version 6.5 with beam screens:
• quad aperture; 70 mm ;
• quad gradient; 235/203 T/m;
• trim quad between Q1 and Q2a; 82 T/m
The most loaded quad is the second or the last one (Q2a,Q3), absorbing some 25-35 W with a peak power of about 7-10 mW/cm3
(depending on the bin volume)
With the actual luminosity value L=1034 cm2s-1
Indication of a positive effect by opening the aperture, this lead to consider large (100 mm) quad aperture for the “new” studies

CARE 06INFN–LNF 15-17 November 2006
New Studies
Approaching the triplet to the IP opens the possibility of an increased focusing and hence of a significantly larger luminosity (J.-P. Koutchouk)
Conversely the energy deposition in the magnets becomes a critical point, because of the different secondary beam dynamics and the increased power
Why moving towards IP ?
What the energy/power deposed in the magnets if moving closer to IP

CARE 06INFN–LNF 15-17 November 2006
HypothesisTRACKING
• Beam pipe aperture 58.0 - 34.0 mm (TAS) - 95.5 mm (Beam screens after the TAS are taken into account)
• Detector Solenoid Field with its fringing field (theoretical)• Detector peak field 2 T (ATLAS)• “ radius 1.1 m• “ length 5.3 m• Hard edge approx. for the quadrupole field
FLUKA• Quad aperture 100.0 mm• Accurate definition of the quadrupole structure
(current, insulation, wedges, collars, yokes)
• Magnetic field in the quad material (ROXIE)
• Cut off for Hadrons 1 MeV• Cut off for electrons/positron 1.5 MeV• Cut off for photons 0.2 MeV• Cut off for neutrons 0.4 eV
Cross section = 80 mbarn(inel.+ single diff. event)

CARE 06INFN–LNF 15-17 November 2006
Geometry and materials
G10 Insulation (0.2, 0.7, 0.5 mm)
Nb3Sn Current shells (15 mm, 60°)
S.S. Pole wedges
S.S. Collar (20 mm)
Fe Yoke (18 cm)
S.S. Beam pipe (1.75 mm)
S.S. Beam screen with cooling tubes

CARE 06INFN–LNF 15-17 November 2006
Cases studiedDistance IP – Q1 = 23 m ; L = 8.64 1034 cm2s-1
Quad Gradient = 193 T/m ;cr = 512 rad
0 10 20 30 40 50 60-0.8
-0.6
-0.4
-0.2
0.0
0.2
0.4
0.6
0.8
Ve
rtic
al Dump
Dump
Dump
Dump
Dump
TAS
Q3Q2bQ2aQ1
DetectorSolenoid
Hor
izo
nta
l Co
ord
ina
te (
cm)
z(m)
0 10 20 30 40 50 60-0.8
-0.6
-0.4
-0.2
0.0
0.2
0.4
0.6
0.8
Dump
Dump
Dump
Dump
Dump
TAS
Q3Q2bQ2aQ1
DetectorSolenoid
Ho
rizo
nta
l Co
ord
ina
te (
cm)
z(m)
Distance IP – Q1 = 19 m ; L = 8.67 1034 cm2s-1
Quad Gradient = 204 T/m ;cr = 514 rad
Distance IP – Q1 = 16 m ; L = 8.72 1034 cm2s-1
Quad Gradient = 208 T/m ;cr = 507 rad
Distance IP – Q1 = 13 m ; L = 8.77 1034 cm2s-1
Quad Gradient = 213 T/m ;cr = 500 rad
(As from J.-P. K. computations)

CARE 06INFN–LNF 15-17 November 2006
Results I (mean values)
Total Power in the Quadrupoles
0.0
50.0
100.0
150.0
200.0
250.0
300.0
350.0
400.0
450.0
Q1
Q2a
Q2b
Q3
Ip - Q1 = 23 mL = 8.64E34
cr = 512 radG = 193 T/m
IP - Q1 = 19 mL = 8.67E34
cr = 514 radG = 204 T/m
IP - Q1 = 16 mL = 8.72E34
cr = 507 radG = 208 T/m
IP - Q1 = 13 mL = 8.77E34
cr = 500 radG = 213 T/m
Pow
er (W
)
The power is increased of about one order of magnitude, respect to the actual case, because of the corresponding increase of the Luminosity
The study is a parametric one, so it is should be used to check the effects of the insertion moving.
Cut-offs values and biasing option in order to have “reasonable” CPU Time (~ 60 hours on Intel Centrino 2 GHz for each configuration)
More accurate absolute values can be obtained with different calculation option and higher CPU times.
PTAS~ 1 kW
Pcharged ~ 60%
Pneutral ~ 40%
15 % Hadron
73 % em showers

CARE 06INFN–LNF 15-17 November 2006
Results II(mean values)
Power in the First Shell of Q2a
0.0
5.0
10.0
15.0
20.0
25.0
30.0
35.0
Pow
er (W
)
Ip - Q1 = 23 mL = 8.64E34
cr = 512 radG = 193 T/m
IP - Q1 = 19 mL = 8.67E34
cr = 514 radG = 204 T/m
IP - Q1 = 16 mL = 8.72E34
cr = 507 radG = 208 T/m
IP - Q1 = 13 mL = 8.77E34
cr = 500 radG = 213 T/m
Power in the First Shell of Q2b
0.0
5.0
10.0
15.0
20.0
25.0
30.0
35.0
Pow
er (W
)
Ip - Q1 = 23 mL = 8.64E34
cr = 512 radG = 193 T/m
IP - Q1 = 19 mL = 8.67E34
cr = 514 radG = 204 T/m
IP - Q1 = 16 mL = 8.72E34
cr = 507 radG = 208 T/m
IP - Q1 = 13 mL = 8.77E34
cr = 500 radG = 213 T/m
Power in the First Shell of Q3
0.0
5.0
10.0
15.0
20.0
25.0
30.0
35.0
40.0
45.0
50.0
Pow
er (W
)
Ip - Q1 = 23 mL = 8.64E34
cr = 512 radG = 193 T/m
IP - Q1 = 19 mL = 8.67E34
cr = 514 radG = 204 T/m
IP - Q1 = 16 mL = 8.72E34
cr = 507 radG = 208 T/m
IP - Q1 = 13 mL = 8.77E34
cr = 500 radG = 213 T/m
Power in the First Shell of Q1
0.0
5.0
10.0
15.0
20.0
25.0
30.0
35.0
Pow
er (W
)
Ip - Q1 = 23 mL = 8.64E34
cr = 512 radG = 193 T/m
IP - Q1 = 19 mL = 8.67E34
cr = 514 radG = 204 T/m
IP - Q1 = 16 mL = 8.72E34
cr = 507 radG = 208 T/m
IP - Q1 = 13 mL = 8.77E34
cr = 500 radG = 213 T/m
CARE 06INFN–LNF 15-17 November 2006
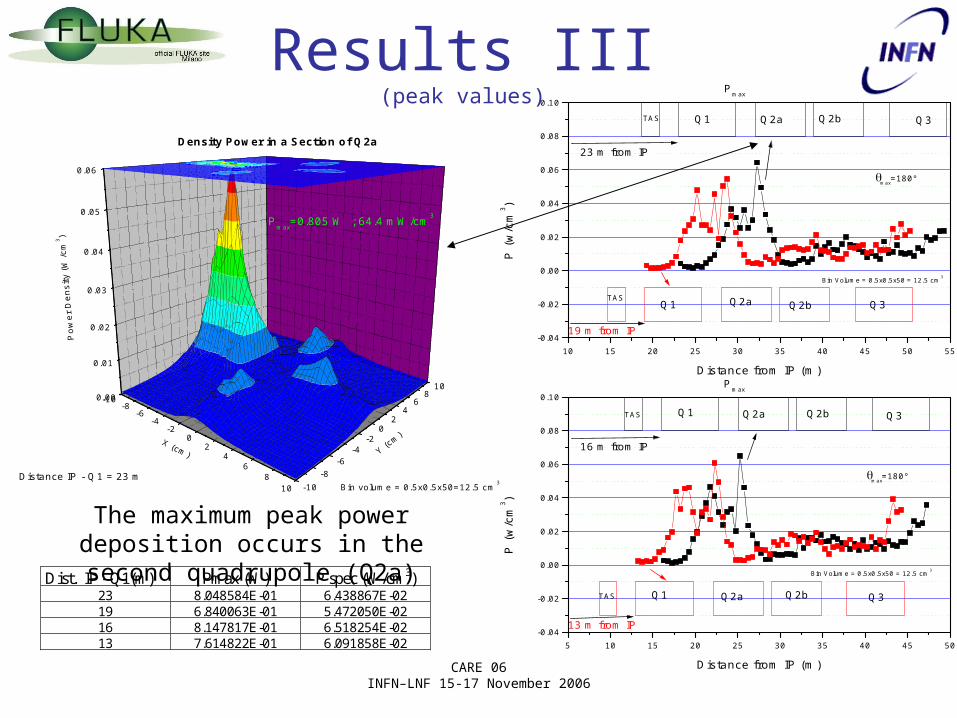
Results III(peak values)
-10-8
-6-4
-20
24
68
10 -10-8
-6-4
-20
24
68
100.00
0.01
0.02
0.03
0.04
0.05
0.06
Pmax
=0.805 W ; 64.4 mW/cm3
Density Power in a Section of Q2a
Bin volume = 0.5x0.5x50=12.5 cm3
Distance IP - Q1 = 23 m
Pow
er D
ensi
ty (
W/c
m3 )
Y (cm)
X (cm)
The maximum peak power deposition occurs in the second quadrupole (Q2a)Dist. IP –Q1(m) Pmax (W) P spec (W/cm3)
23 8.048584E-01 6.438867E-02 19 6.840063E-01 5.472050E-02 16 8.147817E-01 6.518254E-02 13 7.614822E-01 6.091858E-02
5 10 15 20 25 30 35 40 45 50-0.04
-0.02
0.00
0.02
0.04
0.06
0.08
0.10
max=180°
Bin Volume = 0.5x0.5x50 = 12.5 cm3
Pmax
13 m from IP
16 m from IP
TAS
TAS
Q2a
Q2a
Q2b
Q2b
Q3
Q3
Q1
Q1
P (
w/c
m3 )
Distance from IP (m)
10 15 20 25 30 35 40 45 50 55-0.04
-0.02
0.00
0.02
0.04
0.06
0.08
0.10
max=180°
Bin Volume = 0.5x0.5x50 = 12.5 cm3
Pmax
19 m from IP
23 m from IP
TAS
TAS
Q2a
Q2a
Q2b
Q2b
Q3
Q3
Q1
Q1
P (
w/c
m3 )
Distance from IP (m)

CARE 06INFN–LNF 15-17 November 2006
Results IV(peak values)
0.00
0.01
0.02
0.03
0.04
0
30
60
90
120
150
180
210
240
270
300
330
0.00
0.01
0.02
0.03
0.04
(r = 5.3 cm)
Bin Volume = 0.5x0.5x50 = 12.5 cm3
IP - Q1 = 23 m
Pow
er (
W/c
m3 )
Power Density Distribution in Q1
23.75 m from IP 24.25 m 24.75 m 25.25 m 25.75 m 26.25 m 26.75 m 27.25 m 27.75 m 28.25 m 28.75 m 29.25 m 29.75 m
0.00
0.01
0.02
0.03
0.04
0.05
0.06
0.07
0
30
60
90
120
150
180
210
240
270
300
330
0.00
0.01
0.02
0.03
0.04
0.05
0.06
0.07
(r = 5.3 cm)Power Density Distribution in Q2a
Pow
er (
W/c
m3 )
IP - Q1 = 23 m
Bin Volume = 0.5x0.5x50 = 12.5 cm3
32.75 m from IP 33.25 m 33.75 m 34.25 m 34.75 m 35.25 m 35.75 m 36.25 m 36.75 m 37.25 m 37.75 m
0.000
0.005
0.010
0.015
0.020
0
30
60
90
120
150
180
210
240
270
300
330
0.000
0.005
0.010
0.015
0.020
Pow
er (
W/c
m3 )
Bin Volume = 0.5x0.5x50 = 12.5 cm3 IP - Q1 = 23 m
(r = 5.3 cm)Power Density Distribution in Q2b
39.75 m from IP 40.25 m 40.75 m 41.25 m 41.75 m 42.25 m 42.75 m 43.25 m 43.75 m 44.25 m 44.75 m
-0.005
0.000
0.005
0.010
0.015
0.020
0.025
0
30
60
90
120
150
180
210
240
270
300
330
-0.005
0.000
0.005
0.010
0.015
0.020
0.025
Bin Volume = 0.5x0.5x50 = 12.5 cm3
IP - Q1 = 23 m
(r = 5.3 cm)Power Density Distribution in Q3
Pow
er (
W/c
m3 )
48.25 m from IP 48.75 m 49.25 m 49.75 m 50.25 m 50.75 m 51.25 m 51.75 m 52.25 m 52.75 m 53.25 m 53.75 m 54.25 m 54.75 m

CARE 06INFN–LNF 15-17 November 2006
Results V(peak values)
0.00
0.01
0.02
0.03
0.04
0.05
0.06
0.07
0
30
60
90
120
150
180
210
240
270
300
330
0.00
0.01
0.02
0.03
0.04
0.05
0.06
0.07
(r = 5.3 cm)
Bin Volume = 0.5x0.5x50 = 12.5 cm3
Pow
er D
ensi
ty (
W/c
m3 )
(at z position where the maximum power deposition occurs)Power Density in Q2a
IP-Q1 = 23 m cr = 512 rad
IP-Q1 = 19 m cr = 514 rad
IP-Q1 = 16 m cr = 507 rad
IP-Q1 = 13 m cr = 500 rad
The asymmetric distribution is due to the crossing angle (in these cases it is higher
than the actual LHC parameter of 200 rad)
CARE 06INFN–LNF 15-17 November 2006
What indications ?The power deposed in the TAS is almost constant for all the cases
The total power deposed into the quads increases, approaching the IP
The power deposition in Q1 and in its first shells increase almost linearly, approaching the IP
The power deposition in Q3 increase too, but the behaviour is less “linear”
The peak power is almost constant for all the situations examined
The “hottest” quads is Q2a for IP-Q1 = 23 m while in the other cases the hottest one is Q3
The highest peak power deposition is in Q2a and it is almost constant for all the cases studied
The power distribution in the last quad is more spreaded
CARE 06INFN–LNF 15-17 November 2006
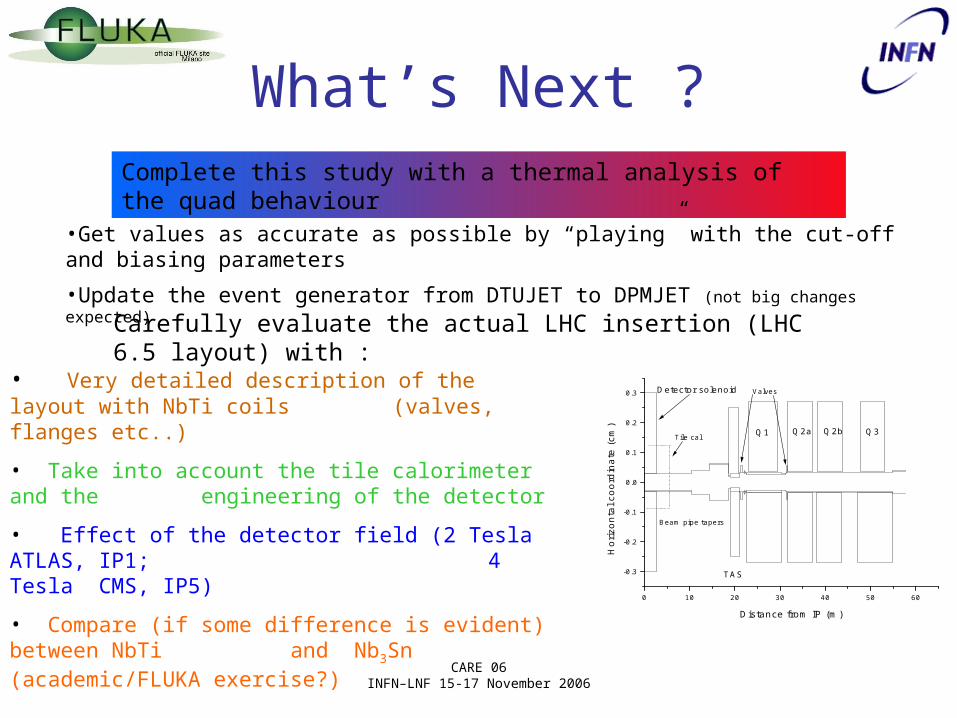
What’s Next ?Complete this study with a thermal analysis of the quad behaviour
Carefully evaluate the actual LHC insertion (LHC 6.5 layout) with :
• Very detailed description of the layout with NbTi coils (valves, flanges etc..)
• Take into account the tile calorimeter and the engineering of the detector
• Effect of the detector field (2 Tesla ATLAS, IP1; 4 Tesla CMS, IP5)
• Compare (if some difference is evident) between NbTi and Nb3Sn (academic/FLUKA exercise?) 0 10 20 30 40 50 60
-0.3
-0.2
-0.1
0.0
0.1
0.2
0.3
Tile cal
Valves
Beam pipe tapers
Q3Q2bQ2aQ1
TAS
Detector solenoid
Ho
rizo
nta
l co
ord
ina
te (
cm)
Distance from IP (m)
•Get values as accurate as possible by “playing” with the cut-off and biasing parameters
•Update the event generator from DTUJET to DPMJET (not big changes expected)
CARE 06INFN–LNF 15-17 November 2006
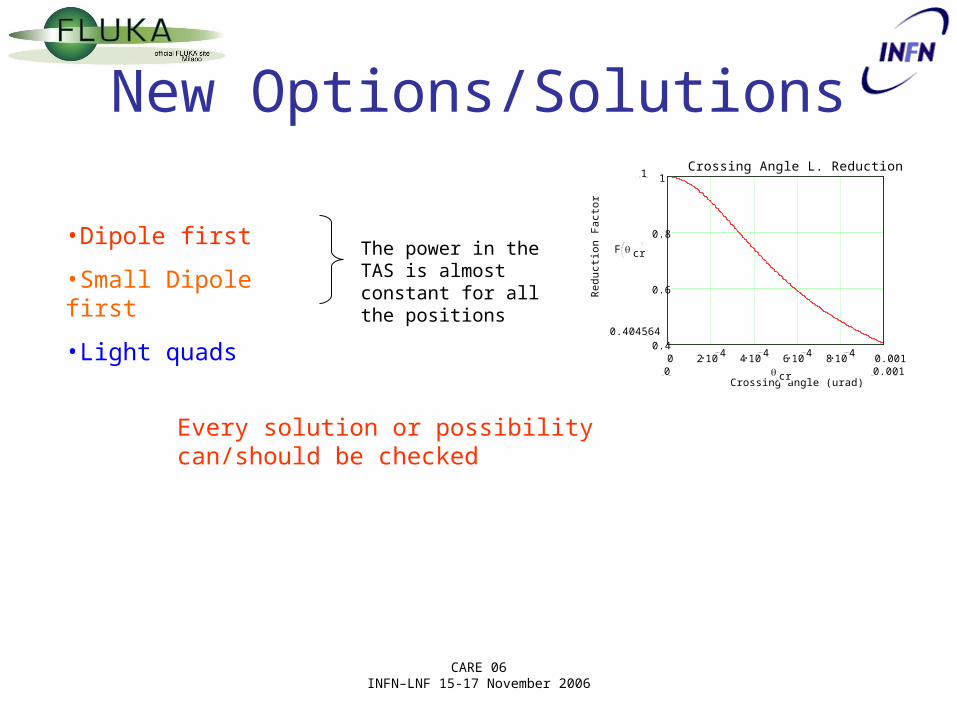
New Options/Solutions
•Dipole first
•Small Dipole first
•Light quads
Every solution or possibility can/should be checked
0 2 10 4 4 10 4 6 10 4 8 10 4 0.0010.4
0.6
0.8
1Crossing Angle L. Reduction Factor
Crossing angle (urad)
Red
ucti
on F
acto
r
1
0.404564
F cr
0.0010 cr
The power in the TAS is almost constant for all the positions

CARE 06INFN–LNF 15-17 November 2006
Thanks
• G.Battistoni(INFN), A. Ferrari and the CERN FLUKA Group
• J.-P. Koutchouk (parameters for the study)
• C. Vollinger (ROXIE quad field map)
• C.Hoa, E. Wildner, G. Sterbini for the fruitful discussions and help in developing the study