Study on the multiple characteristics of M generation of ...
13
Study on the multiple characteristics of M 3 generation of pea mutants obtained by neutron irradiation Dapeng Xu 1,3* , Ze’en Yao 1,3* , Jianbin Pan 2 , Huyuan Feng 2 , Zhiqi Guo 1,3 , Xiaolong Lu 1,3 1 School of Nuclear Science and Technology, Lanzhou University, Lanzhou 730000, China; 2 School of Life Sciences, Lanzhou University, Lanzhou 730000, China; 3 Engineering Research Center for Neutron Application Technology, Ministry of Education, Lanzhou University, Lanzhou 730000, China * Corresponding author: Ze’en Yao (email: [email protected]), Dapeng Xu (email: [email protected]) Abstract: Irradiation breeding is an important technique in the effort to solve food shortages and improve the quality of agricultural products. In this study, a field test was implemented on the M3 generation of two mutant pea plants gained from previous neutron radiation of pea seeds. The relationship between agronomic characteristics and yields of the mutants was investigated. Moreover, differences in physiological and biochemical properties and seed nutrients were analyzed. The results demonstrated that the plant height, effective pods per plant, and yield per plant of mutant Leaf-M1 were 45.0%, 43.2%, and 50.9% higher than those of the control group. Further analysis attributed the increase in yield per plant to the increased branching number. The yield per plant of mutant Leaf-M2 was 7.8% higher than that of the control group, which could be related with the increased chlorophyll content in the leaves. There was a significant difference between the two mutants in the increase of yield per plant owing to morphological variation between the two mutants. There were significant differences in SOD activity and MDA content between the two mutants and the control, indicating that the physiological regulation of the two mutants also changed. In addition, the iron element content of seeds of the two mutants were about 10.9% lower than in the seeds of the control group, a significant difference. These findings indicate that the mutants Leaf-M1 and Leaf-M2 have breeding value and material value for molecular biological studies. Keywords neutron radiation, irradiation breeding, pea mutant, agronomic characteristic, yield 1. Introduction Food shortages are a worldwide problem. According to the FAO (Food and Agriculture Organization of the United Nations) report on “The State of Food Security and Nutrition in the World (2019),” 820 million people suffer from hunger worldwide [1]. Irradiation breeding is an important solution to food shortages. In 1928, Stadler, an American scientist, carried out a radiation study on corn and wheat and proved for the first time that X-rays could induce mutations, opening a new research field radiation-induced plant mutation [2]. Since then, scientists worldwide have studied radiation mutation breeding and the biological effects caused by radiation. Much research has been conducted in the last decade [3-11]. According to statistical data from the FAO and International Atomic Energy Agency (IAEA), a total of 3,322 plant mutant species have been developed around
Transcript of Study on the multiple characteristics of M generation of ...

Study on the multiple characteristics of M3 generation
of pea mutants obtained by neutron irradiation
Dapeng Xu1,3*, Ze’en Yao1,3*, Jianbin Pan2, Huyuan Feng2, Zhiqi Guo1,3, Xiaolong Lu1,3 1School of Nuclear Science and Technology, Lanzhou University, Lanzhou 730000, China; 2School of Life
Sciences, Lanzhou University, Lanzhou 730000, China; 3Engineering Research Center for Neutron Application
Technology, Ministry of Education, Lanzhou University, Lanzhou 730000, China
*Corresponding author: Ze’en Yao (email: [email protected]), Dapeng Xu (email: [email protected])
Abstract: Irradiation breeding is an important technique in the effort to solve food shortages and improve the
quality of agricultural products. In this study, a field test was implemented on the M3 generation of two mutant pea
plants gained from previous neutron radiation of pea seeds. The relationship between agronomic characteristics and
yields of the mutants was investigated. Moreover, differences in physiological and biochemical properties and seed
nutrients were analyzed. The results demonstrated that the plant height, effective pods per plant, and yield per plant
of mutant Leaf-M1 were 45.0%, 43.2%, and 50.9% higher than those of the control group. Further analysis
attributed the increase in yield per plant to the increased branching number. The yield per plant of mutant Leaf-M2
was 7.8% higher than that of the control group, which could be related with the increased chlorophyll content in the
leaves. There was a significant difference between the two mutants in the increase of yield per plant owing to
morphological variation between the two mutants. There were significant differences in SOD activity and MDA
content between the two mutants and the control, indicating that the physiological regulation of the two mutants
also changed. In addition, the iron element content of seeds of the two mutants were about 10.9% lower than in the
seeds of the control group, a significant difference. These findings indicate that the mutants Leaf-M1 and Leaf-M2
have breeding value and material value for molecular biological studies.
Keywords neutron radiation, irradiation breeding, pea mutant, agronomic characteristic, yield
1. Introduction
Food shortages are a worldwide problem. According to the FAO (Food and Agriculture
Organization of the United Nations) report on “The State of Food Security and Nutrition in the World
(2019),” 820 million people suffer from hunger worldwide [1]. Irradiation breeding is an important
solution to food shortages. In 1928, Stadler, an American scientist, carried out a radiation study on
corn and wheat and proved for the first time that X-rays could induce mutations, opening a new
research field radiation-induced plant mutation [2]. Since then, scientists worldwide have studied
radiation mutation breeding and the biological effects caused by radiation. Much research has been
conducted in the last decade [3-11]. According to statistical data from the FAO and International
Atomic Energy Agency (IAEA), a total of 3,322 plant mutant species have been developed around
the world as of March 2020 [12]. The successful application of mutant species can increase crop
yields and improve the quality of agricultural products, promoting the development of the
agricultural economy.
Neutron irradiation breeding is an important part of the research field of irradiation breeding.
Neutron rays are a kind of high LET (Linear Energy Transfer) ray [13]. As compared with X-ray and
γ-ray radiation, neutron radiation has the characteristics of strong penetrability, wide
mutation spectra, high rate of variation, and relatively stable characteristics of the offspring of
variation, producing greater and more obvious biological effects than γ-ray [14-15]. Marshak was the
pioneer of neutron radiation of plants or plant cells. In 1939, he used fast neutrons to irradiate root tip
cells of tomato plants and found that the population of normal late cells decreased to the lowest point
after 3 to 9 h of neutron radiation [16]. Subsequently, international research institutions have studied
the biological effects of mutation breeding through neutron irradiation of plants via various
techniques. The relevant biological effects have undergone preliminary analysis, and abundant
research fruits have been achieved over the decades. Recent research achievements are introduced in
the References [17-23].
As one of three major legume crops in the world [24], the pea (Pisum sativum L.) plant has a
direct impact on human life and productivity. It has been a scientific research hotspot [25-29] since
Mendel used it to derive the basic law of genetics [25]. In our previous study on neutron-radiated pea
seeds, two mutants with significant morphological changes were obtained which maintained the
morphological characteristics of variation throughout their life. In the following study, we will
evaluate the breeding values and molecular biology research potential of these two mutants through
analysis of their physiological, biochemical, and agronomic characteristics, particularly their yield.
2. Materials and Methods
2.1 Materials
In 2014 and 2015, we irradiated pea seeds with 252Cf isotopic neutrons [30]. We used the
needle-leafed pea MZ-1 (Pisum sativum L. var. MZ-1), a leafless variety imported by the Institute of
Soil Fertilizer and Water-saving Agriculture, Gansu Academy of Agricultural Sciences [31]. The
absorbed dose of neutron radiation administered to the seeds was 0.51-9.27 Gy. During the M1
Generation field experiment in 2016, we found two mutant plants with significant variation in leaf
characteristics through screening and analysis of mutants. As shown in Fig.1, the needle-shaped
leaves of one mutant pea changed to broad leaves (here named as Leaf-M1) and the leaves of the
other mutant pea changed from dark green to emerald green (here named as Leaf-M2). In a
subsequent M2 Generation field experiment, morphological observation and DNA molecular analysis
of self-crosses verified that the novel characteristics of the two mutants had high genetic stability.

Fig.1 Two mutant peas and control peas. (a)&(c): The left plant is the mutant Leaf-M1 and the right is the control
pea MZ-1; (b)&(d): The left is the mutant Leaf-M2 and the right is the control pea MZ-1.
2.2 Field trials and methods
Leaf-M1, Leaf-M2, and MZ-1 seeds were sown in a field in the Yuzhong Campus of Lanzhou
University on April 6th, 2017, for the field experiment of the M3 generation. Five replications were
set up with 20 peas per replicate. Unified operation was adopted for the whole experimental field.
Growth conditions during the seedling stage were recorded and the agronomic characteristics of the
pea plants (including plant height, branching number, yield per plant, effective pod number per plant,
pod number per branch, and yield per pod) were measured at three different stages. The parameters
of plant height and yield were measured using a rule with 1 mm to 1000 mm scales and an electronic
balance with 0.1 g to 999 g mass scales respectively. The harvested M3 generation pea seeds were
also tested for composition. Water content was tested by direct drying method, protein was tested by
Kjeldahl method, crude fat was tested by residual method, and crude starch was tested by acid
hydrolyzation method. Phosphorus (P) content was tested by acid solution-Vanadium molybdate
yellow colorimetry. Potassium (K) content was detected by acid solution-flame photometry. Iron (Fe),
Zinc (Zn), Manganese (Mn), Copper (Cu), and Magnesium (Mg) were tested by flame atomic
absorption spectrometry. Tests were completed with the assistance of the Agricultural Test Center of
Gansu Academy of Agricultural Sciences, from which the test report was issued.

2.3 Experimental analysis on physiological and biochemical characteristics
At the late stage of pea seedling formation, a quantity of leaves were cut from each replicate for
analysis of the physiological and biochemical characteristics of the peas. The analyzed characteristics
included SOD (Superoxide Dismutase) activity, MDA (Malondialdehyde) content, reducing sugar
content, and chlorophyll relative content. Details are as follows.
SOD activity in pea leaves was analyzed by NBT method. First, 0.5 g pea leaves were rinsed in
distilled water and cut into pieces, then placed in a pre-cooled pot. Next, 5 ml cooled 50 mmol/L
phosphate buffer was added in 3 steps to prepare a homogenate. The homogenate was then
centrifuged for 10 min on a centrifugal machine at 4000 g. The resulting supernate was the crude
enzyme solution, for which the total volume was measured. Four test tubes of supernate were
prepared, including two as the experimental group and two as the control group (replacing enzyme
solution with buffer). Prepared reaction solution was added to the four test tubes and mixed evenly.
One control test tube was kept in darkness, while the remaining 3 test tubes were reacted for 10 min
under a fluorescent lamp. At the end of the reaction, the three test tubes were placed in darkness for 5
min to terminate the reaction. The test tube that remained in darkness was used as the blank control.
OD values of the other three test tubes at 560 nm were tested to calculate SOD activity.
MDA content in pea leaves was analyzed through TBA method. First, 0.2 g pea leaves were
rinsed in distilled water, wiped dry, and placed in a pot. Next, 5 ml distilled water was collected by a
measuring cylinder before grinding the pea leaf. About 2 ml distilled water was added to the pot for
grinding. The ground mixture was transferred to centrifugal tubes (10 ml range). The remaining 3 ml
distilled water in the measuring cylinder was used to rinse the pot three times, and 5 ml 0.5% TBA
was added to all centrifugal tubes, for a final volume of 10 ml solution. All samples were treated with
a 10 min boiling water bath, followed by 10 min centrifuging at 4000 g after cooling. Absorbance
values of the supernate at 450 nm, 532 nm, and 600 nm were measured to calculate MDA content.
Reducing sugar content in leaves was analyzed by DNS method. First, glucose standard solution
with a known concentration was collected to react with 3,5-dinitrosalicylic acid reagent.
Spectrophotometry was measured to draw a standard curve. The experimental steps of the standard
curve are detailed in the Reference [32]. Second, 0.5 g pea leaves and 2 to 3 ml distilled water were
mixed in a pot to grind the leaves completely. The pot was rinsed with 2 to 3 ml distilled water three
times (overall volume <10 ml) and the material was transferred to test tubes. All test tubes were
placed in a 50℃ water bath for 20 min, then cooled, and then centrifuged for 5 min at 4000 g.
Supernate was collected and transferred to new test tubes, then dissolved to a constant volume of 20
ml in distilled water. These are reducing sugar testing solutions. Next, 2 ml of reducing sugar testing

solution was collected and operated according to the methodology for making glucose standard
curves. Finally, reducing sugar content was calculated according to the standard curve.
Chlorophyll relative content in the leaves was measured directly with a SPAD-502 Chlorophyll
meter.
2.4 Data analysis methods
The emergence rate was defined as the percentage of the number of emergent peas divided by
the number of seeding peas, and the seedling formation rate was defined as the percentage of the
number of peas developing to five pairs of stipules or more divided by the number of seeding peas.
One-way ANOVA and LSD multiple comparisons were conducted in SPSS Statistics 17.0
software (SPSS Inc., Chicago, IL, USA) for analysis of experimental data. Standard errors for all
experimental groups were calculated and relevant graphs were drawn by using Excel 2007 software.
3. Results and discussion
3.1 Analysis of seedling and growth characteristics
Growth of pea plants during the seedling stage was recorded comprehensively. Statistical analysis
of emergence rate was conducted every six days from the initial seedling stage, for a total of six
statistical analyses. Data processing results are shown in Fig.2a. The emergence rates of the three
groups were generally similar in the first statistical analysis. However, the emergence rate of Leaf-
M1 was higher than that of the control group at the second statistical analysis and the emergence rate
of MZ-1 was higher than that of Leaf-M2. Moreover, there were significant differences between
Leaf-M1 and Leaf-M2. This relationship among the three groups was also present in the third
statistical analysis, with the exception of the significant difference between Leaf-M1 and Leaf-M2.
The relationship among the three groups remained stable at the fourth, fifth, and sixth statistical
analyses: the emergence rate of Leaf-M1 was higher than that of Leaf-M2 and the emergence rate of
Leaf-M2 was higher than that of MZ-1. As the plants developed, the differences among the three
groups gradually decreased, and the emergence rates of three groups were very similar at the sixth
analysis. These findings demonstrate that seedling emergence of Leaf-M1 occurs quickly, and the
development trend for Leaf-M2 is similar to that of the control. Finally, the emergence rates of three
groups effectively converge at the sixth statistical time point.

Fig.2 Emergence rates and seedling rates of two mutant peas and control peas at different statistical analyses.
Experiments were performed at least five times. Values are the mean ± SD (n = 5), and bars indicate the SD.
Different lowercase letters indicate significant differences (P 0.05)
A statistical analysis of seedling formation rates was conducted every six days from the early
days of seedling formation, and three statistical analyses were conducted. Results are shown in
Fig.2b. On May 6th, the seedling formation rate of Leaf-M2 was higher than that of the control group
and the seedling formation rate of the control group was higher than that of Leaf-M1. In addition,
there were significant differences in seedling formation rate between Leaf-M2 and Leaf-M1. The
data from May 12th showed that the seedling formation rates of Leaf-M2 and the control group were
similar, and both were slightly higher than that of Leaf-M1. By May 18th, the seedling formation
rates of the three groups were approximately consistent. Leaf-M1 seedling morphology developed
slowly, while the seedling morphology of Leaf-M2 and MZ-1 developed at similar rates. At the end
of the trial, the seedling formation rates of the three groups were approximately equivalent.
3.2 Comparison of branch development of three groups
Pea plants generally develop a branching habit. Growth time and quantity of branch
development affect the relevant biomass of peas, including yields. Branches of all three groups were
measured during the late initial seedling stage, growth stage, and harvest stage. Results of statistical
analysis are shown in Fig.3a. As shown in that figure, during the late initial seedling stage (sampling
date: April 29th), Leaf-M2 showed the greatest branch number per plant (0.82), followed by 0.47 in
the control group, with the lowest number of branches per plant (0.13) belonging to Leaf-M1. The
differences in branch number per plant were extremely significant between the three groups. At the
growth stage (on May 13th), the size relationship among the three groups was concurrent with that
measured in the late initial seedling stage, and the branch numbers per plant for Leaf-M2, the control
group, and Leaf-M1 were 0.89, 0.76, and 0.32, respectively. However, no significant difference
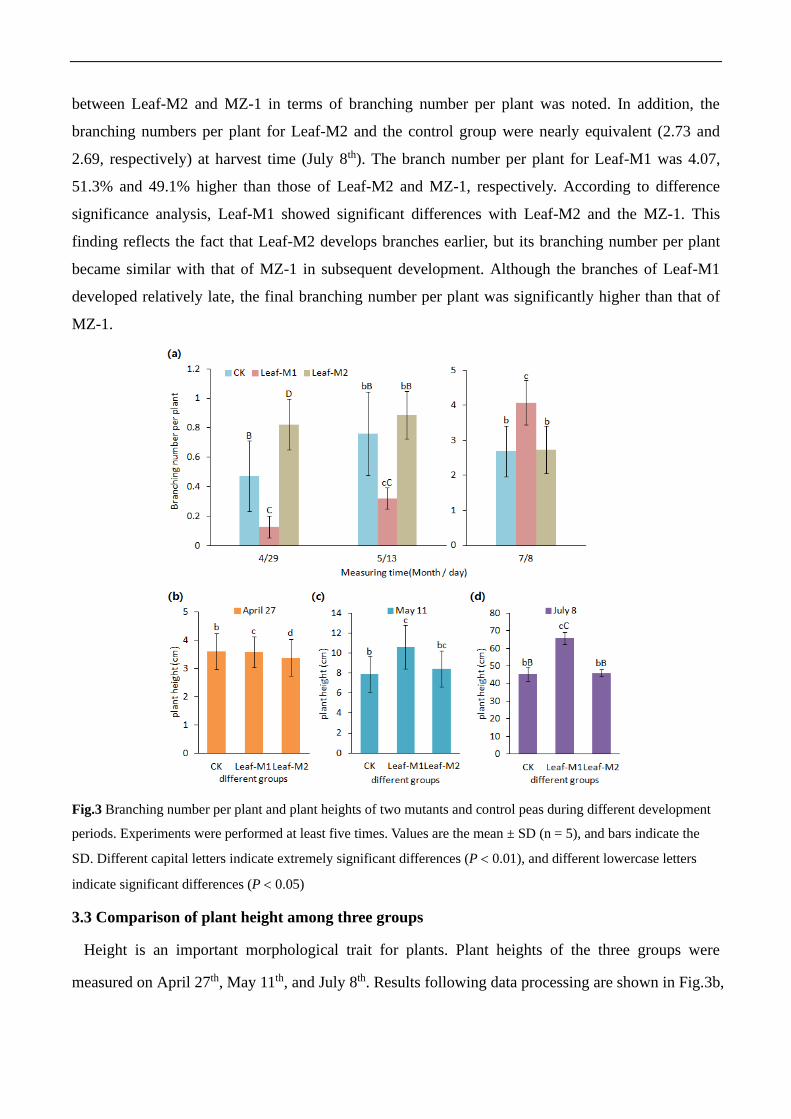
between Leaf-M2 and MZ-1 in terms of branching number per plant was noted. In addition, the
branching numbers per plant for Leaf-M2 and the control group were nearly equivalent (2.73 and
2.69, respectively) at harvest time (July 8th). The branch number per plant for Leaf-M1 was 4.07,
51.3% and 49.1% higher than those of Leaf-M2 and MZ-1, respectively. According to difference
significance analysis, Leaf-M1 showed significant differences with Leaf-M2 and the MZ-1. This
finding reflects the fact that Leaf-M2 develops branches earlier, but its branching number per plant
became similar with that of MZ-1 in subsequent development. Although the branches of Leaf-M1
developed relatively late, the final branching number per plant was significantly higher than that of
MZ-1.
Fig.3 Branching number per plant and plant heights of two mutants and control peas during different development
periods. Experiments were performed at least five times. Values are the mean ± SD (n = 5), and bars indicate the
SD. Different capital letters indicate extremely significant differences (P 0.01), and different lowercase letters
indicate significant differences (P 0.05)
3.3 Comparison of plant height among three groups
Height is an important morphological trait for plants. Plant heights of the three groups were
measured on April 27th, May 11th, and July 8th. Results following data processing are shown in Fig.3b,

Fig.3c, and Fig.3d, respectively. As shown in Fig. 3b, on April 27th, the plant height of MZ-1 was the
highest, and the plant height of Leaf-M2 was the lowest. However, no significant difference was
observed. On May 11th, the plant height of Leaf-M1 became the highest, and it was significantly
higher than that of MZ-1. Meanwhile, the plant height of Leaf-M2 was similar to that of MZ-1, and
the plant height of Leaf-M2 was 6.5% higher than that of MZ-1. At harvest time on July 8th, Leaf-M2
and the control group were very similar in plant height, with Leaf-M2 only 1.1% taller than MZ-1.
On the other hand, the plant height of Leaf-M1 increased to approximately 45.0% higher than that of
MZ-1, an extremely significant difference from MZ-1 and Leaf-M2. This finding illustrates that the
plant height of Leaf-M1 develops slowly in the seedling stage, then increases quickly and
significantly exceeds the plant height of MZ-1 at harvest time. The plant height of Leaf-M2 has the
slowest rate of development during the seedling stage, but its growth rate following the seedling
stage approaches that of MZ-1, reaching approximate equivalence.
3.4 Analysis of physiological and biochemical traits among the three groups
SOD (superoxide dismutase) is ubiquitous in the bodies of animals and plants. It can react with
free radicals produced in the process of metabolism and is an important antioxidase in living tissues.
SOD activity analysis results for the three groups at the late stage of seedling formation are shown in
Table 1. SOD activities for Leaf-M1 and Leaf-M2 were significantly lower (about 16.6% and 30.1%)
than that of the control group. Specifically, there were significant differences between Leaf-M1 and
the control group, and extremely significant differences between Leaf-M2 and the control group. In
addition, SOD activity of Leaf-M2 was lower than that of Leaf-M1 and there was a significant
difference between the two.
During aging of plant organs or under adverse conditions, membrane lipid peroxidation induced
by accumulation of reactive oxygen species can occur. MDA is one of the most important products of
membrane lipid peroxidation. MDA content analysis results for the three groups at the late stage of
seedling formation are listed in Table 1. The MDA content of Leaf-M1 was about 10.2% lower than
that of the control group, a significant difference. The MDA content for Leaf-M2 was about 6.5%
higher than that of the control group, also achieving significance. Leaf-M2 showed the highest MDA
content, and Leaf-M1 showed the lowest MDA content. The differences in MDA content between
Leaf-M1 and Leaf-M2 were significant.
Sugar is both the product of photosynthesis and the substrate of respiration, and it plays an
important role in plant growth, development, and metabolism. Reducing sugar has important

biological significance because it is the primary energy substance and intermediate metabolite of
plants. Results of analysis of reducing sugar content are listed in Table 1. The reducing sugar content
of the control group was the highest, while the reducing sugar content of Leaf-M1 and Leaf-M2 was
7.4% and 4.9% lower, respectively. The lowest reducing sugar content was found in the leaves of
Leaf-M2. According to difference significance analysis, there were no significant differences among
any two of the three groups.
Chlorophyll is an important physiological activator in higher plants and other photosynthetic
organisms. Results of the analysis of relative chlorophyll content for the three groups during the late
stage of seedling formation are presented in Table 1. Leaf-M2 showed the highest chlorophyll
relative content, followed by the control group. Leaf-M1 had the lowest relative chlorophyll content.
The relative chlorophyll content of Leaf-M2 was 19.1% higher than that of the control group, while
the chlorophyll relative content of Leaf-M1 was 11.3% lower. According to difference significance
analysis, there were extremely significant differences between all pairs within the three groups. The
high relative chlorophyll content of Leaf-M2 is mainly attributed to changes in surface color.
Table 1 Physiological and biochemical traits of two mutants and control group
Groups SOD activity
(U/g)
MDA content
(µmol/g)
Reducing sugar content
(mg/g)
Chlorophyll
relative
content
MZ-1(CK) 664±16aA 78.6±3.5a 12.2±2.3a 33.5±0.4A Leaf-M1 554±39bB 70.6±7.8b 11.3±0.5a 29.7±0.2B Leaf-M2 464±43cB 83.7±2.3c 11.6±1.3a 39.9±1.2C
Note: Different capital letters (B, C) at the superscript indicate extremely significant differences (P 0.01), and
different lowercase letters (b, c) at the superscript indicate significant differences (P 0.05), mean SD.
3.5 Comparison of biomass among three groups at harvest
Processing results of various biomass data for the three groups at harvest time are listed in Table
2. Yield per plant of Leaf-M1 was about 50.9% higher than that of the control group, a significant
difference between the two groups. The yield per plant of Leaf-M2 was about 7.8% higher than that
of control group, showing no significant difference. Leaf-M2 had an approximately equivalent
effective pod number per plant to the control group, whereas the effective pod number per plant for
Leaf-M1 was about 43.2% and 45.2% higher than those of the control group and Leaf-M2,
respectively, demonstrating extremely significant differences. In terms of yield per pod, the three
groups yielded similar means, with no significant differences. Leaf-M2 had the largest pod number
per branch, 1.8% higher than that of the control group. The pod number per branch of Leaf-M1 was
the lowest, 4.8% lower than that of the control group. The three groups did not vary significantly in
terms of mean pod number per branch. Together, these results indicate that the yield per plant of
Leaf-M1 was significantly higher than that of control group, which can be attributed to the greater
number of pods per plant.
Table 2 Biomass data of two mutants and MZ-1 at harvest time
Groups
Effective pod
number per plant
Yield per pod
(g)
Pod number per
branch
Yield per plant
(g)
MZ-1(CK) 14.8±2.1bB 0.78±0.08b 5.43±0.80b 11.6±2.6b
Leaf-M1 21.2±4.5cC 0.83±0.06b 5.17±0.35b 17.5±3.6c
Leaf-M2 14.6±2.5bB 0.84±0.11b 5.53±1.11b 12.5±3.6b Note: Different capital letters (B, C) at the superscript indicate extremely significant differences (P 0.01), and
different lowercase letters (b, c) at the superscript indicate significant differences (P 0.05), mean SD.
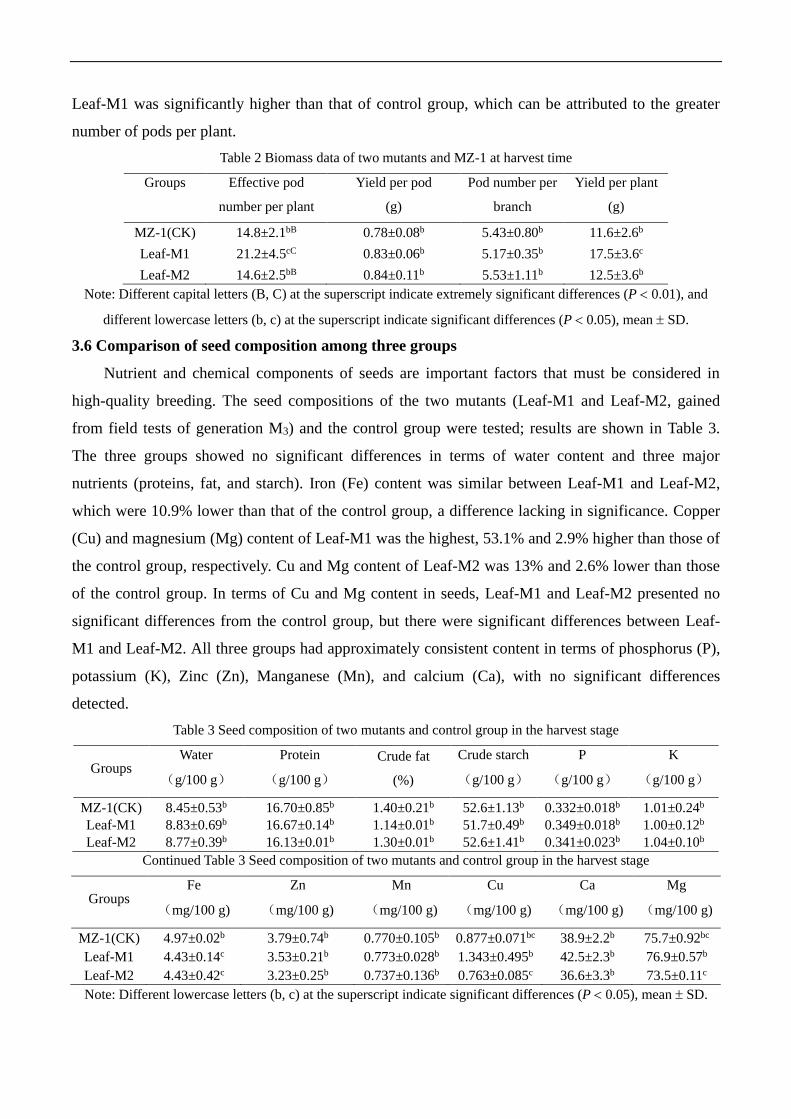
3.6 Comparison of seed composition among three groups
Nutrient and chemical components of seeds are important factors that must be considered in
high-quality breeding. The seed compositions of the two mutants (Leaf-M1 and Leaf-M2, gained
from field tests of generation M3) and the control group were tested; results are shown in Table 3.
The three groups showed no significant differences in terms of water content and three major
nutrients (proteins, fat, and starch). Iron (Fe) content was similar between Leaf-M1 and Leaf-M2,
which were 10.9% lower than that of the control group, a difference lacking in significance. Copper
(Cu) and magnesium (Mg) content of Leaf-M1 was the highest, 53.1% and 2.9% higher than those of
the control group, respectively. Cu and Mg content of Leaf-M2 was 13% and 2.6% lower than those
of the control group. In terms of Cu and Mg content in seeds, Leaf-M1 and Leaf-M2 presented no
significant differences from the control group, but there were significant differences between Leaf-
M1 and Leaf-M2. All three groups had approximately consistent content in terms of phosphorus (P),
potassium (K), Zinc (Zn), Manganese (Mn), and calcium (Ca), with no significant differences
detected.
Table 3 Seed composition of two mutants and control group in the harvest stage
Groups Water
(g/100 g)
Protein
(g/100 g)
Crude fat
(%)
Crude starch
(g/100 g)
P
(g/100 g)
K
(g/100 g)
MZ-1(CK) 8.45±0.53b 16.70±0.85b 1.40±0.21b 52.6±1.13b 0.332±0.018b 1.01±0.24b Leaf-M1 8.83±0.69b 16.67±0.14b 1.14±0.01b 51.7±0.49b 0.349±0.018b 1.00±0.12b Leaf-M2 8.77±0.39b 16.13±0.01b 1.30±0.01b 52.6±1.41b 0.341±0.023b 1.04±0.10b
Continued Table 3 Seed composition of two mutants and control group in the harvest stage
Groups Fe
(mg/100 g)
Zn
(mg/100 g)
Mn
(mg/100 g)
Cu
(mg/100 g)
Ca
(mg/100 g)
Mg
(mg/100 g)
MZ-1(CK) 4.97±0.02b 3.79±0.74b 0.770±0.105b 0.877±0.071bc 38.9±2.2b 75.7±0.92bc Leaf-M1 4.43±0.14c 3.53±0.21b 0.773±0.028b 1.343±0.495b 42.5±2.3b 76.9±0.57b Leaf-M2 4.43±0.42c 3.23±0.25b 0.737±0.136b 0.763±0.085c 36.6±3.3b 73.5±0.11c Note: Different lowercase letters (b, c) at the superscript indicate significant differences (P 0.05), mean SD.
4. Conclusion
In the field of radiation mutation breeding, few studies have comprehensively investigated the
important agronomic traits and the physiological and biochemical traits of mutants throughout the
entire life cycle; the relationship between traits and yields also lacks significant study. To meet the
needs of breeding studies and other biological studies, a field experiment of the M3 generation of two
mutants derived from early neutron radiation of pea seeds was carried out. The results indicated that
as compared to the control group, the Leaf-M1 mutant developed significant changes in growth and
other physiological and biochemical traits. In particular, the yield per plant of Leaf-M1 was
significantly higher than that of the control group. Analytical results indicated that this increase in
yield per plant must be related to the increase in pod number per plant, and the increase in pod
number per plant was attributed to the increase of branch number per plant. Moreover, the
chlorophyll content in the leaves of Leaf-M1 was significantly lower than that of the control group;
however, this did not significantly impact its yield. This could be explained by the mutation of the
leaves of Leaf-M1 from needle-shaped leaves to broad leaves, with a corresponding increase of leaf
area. Similar morphological mutation was not observed in Leaf-M2, but the color of its leaves
changed. The change was primarily caused by the increased chlorophyll content in the leaves, which
was the primary reason for the increase in yield per plant.
This study proved the breeding value of Leaf-M1 and Leaf-M2. Leaf-M1 was superior to Leaf-
M2 in terms of yield, while Leaf-M2 had certain landscape values. Moreover, the two mutants could
be used as materials for molecular biological studies, such as those exploring the functional genes of
plants. In addition, differences in morphological characteristics between the two mutants and the
control group as well as between Leaf-M1 and Leaf-M2 must be related to their physiological
characteristics. Further studies on such relationships are still needed in the future.
Acknowledgements
This work is Supported by the National Natural Science Foundation of China (No. 11675069)
and the Fundamental Research Funds for the Central Universities of China (No. lzujbky-2019-kb09).
References
[1] The State of Food Security and Nutrition in the World (2019). http://www.fao.org/home/digital-reports/en/
[2] L. J. Stadler, Mutations in barley induced by X-rays and radium. science 68, 186-187 (1928).
https://doi.org/10.1126/science.68.1756.186
[3] Y. Kazama, T. Hirano, H. Saito, Y. Liu, S. Ohbu, Y. Hayashi,T. Abe, Characterization of highly efficient
heavy-ion mutagenesis in Arabidopsis thaliana. BMC Plant Biology 11, 161 (2011).
https://doi.org/10.1186/1471–2229-11-161
[4] J. Si, H. Zhang, Z. Wu, Applications and research progress of plant breeding with ion implantation technique.
Journal of Radiation Research and Radiation Processing 30(6), 321–327 (2012).
https://doi.org/10.11889/j.1000-3436.2012.rrj.30.120601
[5] J. S. Wang, L. X. Qiao, L. S. Zhao, P. Wang, B. T. Guo, L. X. Liu, J. M. Sui, Performance of peanut mutants
and their offspring generated from mixed high-energy particle field radiation and tissue culture. Genetics and
Molecular Research 14(3), 10837–10848 (2015). https://doi.org/10.4238/2015.September.9.22
[6] L. Yu , W. Li, Y. Du, G. Chen, S. Luo, R. Liu, H. Feng, L. Zhou, Flower color mutants induced by carbon ion
beam irradiation of geranium (Pelargonium 3 hortorum, Bailey). Nuclear Science and Techniques 27(5), 112
(2016). https://doi.org/10.1007/s41365-016-0117-3
[7] X. Bian, A. Tian, J. Geng, L. Ding, J. Gong, J. Hu, T. Cao, The M2 Morphological Variation and RAPD
Analysis of Maize Irradiated by Proton. Journal of Anhui Agricultural Sciences 45(33), 149-152 (2017).
https://doi.org/10.3969/j.issn.0517-6611.2017.33.050
[8] Y. Zhang, L. Zhou, S. Wang, B.Mao, Study on Selection of a New Strawberry Strain of Benihoppe Developed
by 60Co-γ Irradiation Induced Mutation Breeding. Journal of Nuclear Agricultural Sciences 32(8), 1457–1465
(2018). https://doi.org/10.11869/j.issn.100-8551.2018.08.1457
[9] W. Gu, L. Zhou, R. Liu, W. Jin, Y. Qu, X. Dong, W. Li, Synergistic responses of NHX, AKT1, and SOS1 in
the control of Na+ homeostasis in sweet sorghum mutants induced by 12C6+-ion irradiation. Nuclear Science
and Techniques 29, 10 (2018). https://doi.org/10.1007/s41365-017-0341-5
[10] W. Yuan, Y. Wang, Y. Xi, L. Sun, Y. Tu, Human respiratory tract model of uranium-containing compounds and
calculation of pulmonary retention under single inhalation. Nuclear Techniques 42(11), 110302 (2019).
https://doi.org/10.11889/j.0253-3219.2019.hjs.42.110302
[11] F. Wang, J. Yang, Q. Xie, S. Zhai, Z. Yang, Analysis and optimization of production conditions for 18F
production using a medical cyclotron. Nuclear Techniques 41(2), 20301 (2018). https://doi.org/
10.11889/j.0253-3219.2018.hjs.41.020301
[12] FAO/IAEA Mutant Variety Database. http//mvgs.iaea.org/
[13] Z. Liu, Y. Yang, L. Zheng, R. Liu, C. Yang, M. Wang, Measurement and analysis of the 232Th(n,2n) reaction
rate in a polyethylene shell with DT neutrons. Nuclear Techniques 41(6), 60502 (2018).
https://doi.org/10.11889/j.0253-3219.2018.hjs.41.060502
[14] W. Zhang, L. Jiao, M. Hoshi, Relative Biological Effectiveness of Induced Micronuclei in Root-tip Cells of
Onion Seedlings Irradiated with 0.8 Mev Neutrons. Radiation Protection 26(3), 162-165 (2006).
https://doi.org/10.3321/j.issn:1000-8187.2006.03.006
[15] D. Xu, Z. Yao, H. Feng, Y. Yin, Effects of different dosages of neutron radiation on seed germination and
seedling growth of needle leaf pea. Chinese Agricultural Science Bulletin 31(12), 200-204 (2015).
https://doi.org/10.11924/j.issn.1000-6850.casb14100118
[16] A. Marshak, W. S. Malloch, The Effect of Fast Neutrons on Chromosomes in Meiosis and Its Bearing upon
Pachytene Pairing. Genetics 27(6), 576-583 (1942). https://doi.org/10.1007/BF02982833
[17] S. O. Lochlainn, R. G. Fray, J. P. Hammond, G. J. King, P. J. White, S. D. Young, M. R. Broadley, Generation
of nonvernal-obligate, faster-cycling Noccaea caerulescens lines through fast neutron mutagenesis. New
Phytologist 189(2), 409–414 (2011). https://doi.org/10.2307/40983842
[18] Y. Bolon, W. J. Haun, W. W. Xu, D. Grant, M. G. Stacey, R. T. Nelson, D. J. Gerhardt, J. A. Jeddeloh, G.
Stacey, G. J. Muehlbauer, J. H. Orf, S. L. Naeve, R. M. Stupar, C. P. Vance, Phenotypic and Genomic Analyses
of a Fast Neutron Mutant Population Resource in Soybean. Plant Physiology 156(1), 240–253 (2011).
https://doi.org/10.1104/pp.110.170811

[19] E. J. Belfield, X. Gan, A. Mithan, C. Brown, C. Jiang, K. Franklin, E. Alvey, A. Wibowo, M. Jung, K. Bailey,
S. Kalwan, J. Ragoussis, R. Mott, N. P. Harberd, Genome-wide analysis of mutations in mutant lineages
selected following fast-neutron irradiation mutagenesis of Arabidopsis thaliana. Genome Research 22(7),
1306–1315 (2012). https://doi.org/10.1101/gr.131474.111
[20] J. Wang, J. Sui, Y. Xie, H. Guo, L. Qiao, L. Zhao, S. Yu, L. Liu, Generation of peanut mutants by fast neutron
irradiation combined with in vitro culture. Journal of Radiation Research 56(3), 437–445 (2015).
https://doi.org/10.1093/jrr/rru121
[21] D. Xu, Z. Yao, Y. Yin, H. Feng, Study on M1 and M2 generation effect of different dosages of neutron radiation
on flax seed. Nuclear Techniques 40(2), 020203 (2017). https://doi.org/10.11889/j.0253–
3219.2017.hjs.40.020203
[22] Y. Chen, X. Wang, S. Lu, H. Wang, S. Li, R. Chen, An Array-based Comparative Genomic Hybridization
Platform for Efficient Detection of Copy Number Variations in Fast Neutron-induced Medicago truncatula
Mutants. Jove-Journal of Visualized Experiments 129, e56470 (2017). https://doi.org/10.3791/56470
[23] Z. Liu, D. Xu, X. Lian, W. Zhou, S. Kou, Z. Yao, Effects of fast neutron irradiation on seed germination and
seedling growth of maize. Journal of Radiation Research and Radiation Processing 36(2), 020401 (2018).
https://doi.org/10.11889/j.1000-3436.2018.rrj.36.020401
[24] X. Yang, R. Ren, Progress of Pea Production and Breeding in oVersea and Inland. Gansu Agricultural Science
and Technology (8), 3-5 (2005). https://doi.org/10.3969/j.issn.1001–1463.2005.08.001
[25] P. Gepts, W. D. Beavis, E. C. Brummer, R. C. Shoemaker, H. T.Stalker, N. F. Weeden, N. D. Young, Legumes
as a model plant family: genomics for food and feed Report of the Crosslegume Advances through Genomics
( ACTG) Conference. Plant Physiology 137(4), 1228–1235 (2005). https://doi.org/10.1104/pp.105.060871
[26] Y. Qu, Y. Wang, H. Feng, J. Cheng, W. Li, L. An, Effects of UV-B radiation on stems elongation and cell wall
polysaccharides of pea seedlings. Journal of Radiation Research and Radiation Processing 30(5), 303–308
(2012). https://doi.org/10.11889/j.1000-3436.2012.rrj.30.120509
[27] M. Bourgault, J. Brandb, M. Tauszc, G. J. Fitzgeraldb, Yield, growth and grain nitrogen response to elevated
CO2 of five field pea (Pisum sativum L.) cultivars in a low rainfall environment. Field Crops Research 196, 1–
9 (2016). https://doi.org/10.1016/j.fcr.2016.04.011
[28] S. N. Innes, L. E. Arve, B. Zimmermann, L. Nybakken, T. I. Melby, K. A. Solhaug, J. E. Olsena, S. Torre,
Elevated air humidity increases UV mediated leaf and DNA damage in pea (Pisum sativum) due to reduced
flavonoid content and antioxidant power. Photochemical & Photobiological Sciences 18(4), 387–399 (2019).
https://doi.org/10.1039/c8pp00401c
[29] Y. Jiang, D. L. Lindsay, A. R. Davis, Z. Wang, D. E. MacLean, T. D. Warkentin, R. A. Bueckert, Impact of
heat stress on pod‐based yield components in field pea (Pisum sativum L.). Journal of Agronomy and Crop
Science 206(1), 76–89 (2019). https://doi.org/10.1111/jac.12365
[30] P. Wang, P. Sun, Evaluation of radiation effects on peripheral organs of 252Cf cervical carcinoma under close
cavity radiotherapy. Nuclear Techniques 41(5), 50301 (2018). https://doi.org/10.11889/j.0253-
3219.2018.hjs.41.050301
[31] L. Zhang, Z. Wang, S. Xu, J. Yang, C. Lian, Study on Drought-resistance of A New Pea Cultivar with Needle
Leaves MZ-1. Gansu Agricultural Science and Technology (12), 13-16 (2009).
https://doi.org/10.3969/j.issn.1001-1463.2009.12.005
[32] J. Yin, H. Lu, Q. Xie, J. Ding, N. Li, A Study on Rapid Colorimetric Determination of Water Soluble Total
Sugar, Reducing Sugar and Starch in Tobacco with 3,5-dinitrosalicylic Acid. Journal of Yunnan Agricultural
University 22(6), 829–838 (2007). https://doi.org/10.3969/j.issn.1004-390X.2007.06.011