STUDY ON THE LOW UPTAKE OF CAPITAL MARKETS PRODUCTS …
100
i STUDY ON THE LOW UPTAKE OF CAPITAL MARKETS PRODUCTS IN KENYA RESEARCH PAPER JUNE 2018
Transcript of STUDY ON THE LOW UPTAKE OF CAPITAL MARKETS PRODUCTS …

i
STUDY ON THE LOW UPTAKE OF CAPITAL MARKETS PRODUCTS IN KENYA
RESEARCH PAPER
JUNE 2018

ii
CMA Market Development Department ©
Table of Contents
1 Executive Summary ........................................................................................................................ 2
1.1 Collective Investment Schemes (CIS) ....................................................................................... 5
1.2 Equity listings .......................................................................................................................... 6
1.2.1 Privatization Effect ........................................................................................................ 11
1.3 Debt listings........................................................................................................................... 14
1.4 Other Capital Markets Products ............................................................................................ 18
1.5 Overall product uptake performance ..................................................................................... 19
1.6 Methodology ......................................................................................................................... 19
1.7 Findings ................................................................................................................................. 20
1.8 New approach ....................................................................................................................... 21
2 Introduction and Background ........................................................................................................ 28
2.1 Measures to mobilize savings and enhance liquidity .............................................................. 30
3 Research Problem ......................................................................................................................... 37
4 Structure and state of development of Kenyan Capital Markets .................................................... 42
4.1 The Capital Markets and Stock Markets Performance ........................................................... 43
4.2 Capital Markets Products – The Role of the Capital Markets Authority .................................. 46
4.3 Existing Product Development Procedures ............................................................................ 46
4.4 Review of Prior Studies .......................................................................................................... 50
4.4.1 CMA Study to determine impediments to new listings – 2005 ....................................... 50
4.4.2 CMA Study on Capital Markets Fees, Levies and Commissions – 2013 ........................... 53
4.4.3 Survey by Africa/Middle-East Regional Committee (AMERC) working group on listings – 2017 54
4.5 Capital Markets Incentives on New Products ......................................................................... 57
5 Key Constraints to the uptake of Capital Markets Products ........................................................... 62
5.1 Low liquidity levels ................................................................................................................ 62
5.2 Regulatory obstacles ............................................................................................................. 62
5.3 Macroeconomic factors ......................................................................................................... 63
5.4 Competition from other sectors/instruments ........................................................................ 63
5.5 Lack of a coordinated market strategy towards introduction of new products and services .. 65
5.6 Supply Side; Reluctance of Market Intermediaries................................................................. 65
5.7 Demand Side; Structural problems from demand side .......................................................... 65
6 Jurisdictional Review ..................................................................................................................... 65

iii
6.1 Asia........................................................................................................................................ 65
6.3 Regional Review .....................................................................................................................71
6.4 Global Performance of the Capital Markets by Product ......................................................... 74
7 Lessons from other Jurisdictions ................................................................................................... 78
7.1 Foreigners accessing domestic markets ................................................................................ 78
7.2 Privatization .......................................................................................................................... 78
7.2.1 Kenya’s Experience with Privatization ............................................................................ 80
7.2.2 Lessons from privatization exercises in different countries ............................................ 80
7.3 Emphasized Role of Financial Intermediaries ......................................................................... 82
7.4 Tax Incentives ........................................................................................................................ 82
7.5 Legal Framework ................................................................................................................... 82
7.6 Mandatory listing requirements............................................................................................. 83
8 Other Evidence on Low Uptake - Resistance towards implementation of block trading ................ 84
9 Recommendations ........................................................................................................................ 86
10 Conclusion ..................................................................................................................................... 93
11 References .................................................................................................................................... 95

iv
List of Tables
Table 1 : Assets under Management CIS Filings to CMA .......................................................................... 5 Table 2 : Net Assets of Collective Investment Funds (2017/16) ................................................................ 6 Table 3 : Kenya's Primary and Secondary Equities Performance Vs Macro Economic Trends (2002-2017)................................................................................................................................................................ 7 Table 4 : Kenya’s ranking on Ease of Doing Business (2013 – 2017) .......................................................... 8 Table 5 : Companies Delisted/Suspended from the Nairobi Securities Exchange between 2011 and 2017................................................................................................................................................................ 9 Table 6 : Profit Warnings and Losses by Listed Equities Companies (2013/14 - 2016/17) ........................ 11 Table 7: Statistics on Primary Bonds Market - Treasury and Corporate Bonds ...................................... 15 Table 8: Snapshot of Bond Market Reforms in Kenya (Prior to development of the Capital Markets Master Plan) .......................................................................................................................................... 16 Table 9: State of Activity on other Capital Markets products and services ............................................ 18 Table 10: Key Findings and Recommendations relating to Listings and Product uptake) ...................... 22 Table 11: Summary on Development and Evolution of Kenya's Capital Markets ................................... 32 Table 12: New Capital Markets Products/Services Launch (2012-2017) ................................................. 38 Table 13 : Performance of Capital Markets licensees as at December 20115/16 in Kshs Mns ................. 45 Table 14 : Equity Turnover, Market Capitalization and Liquidity Ratio of top 10 listed firms at the NSE 45 Table 15: Review of Recommendations from New Listings Study (2005) conducted by the CMA.......... 50 Table 16: Capital Markets Specific Incentives ........................................................................................ 57 Table 17: Comparative performance rates of 10 Year Government Bond Yield and Total Equity Risk Premium of various countries ............................................................................................................... 64 Table 18: Largest 20 IPOs in Asia between 1990 – 2016 ........................................................................ 67 Table 19 : Key Statistics of Stock Exchanges in the Asian Region .......................................................... 69 Table 20 : Key Findings and Recommendations relating to Listings and Product uptake) ..................... 86
List of Figures
Figure 1: Survey Findings on number of Listings by Countries in the last five years ................................. 4 Figure 2 : Comparison between Banking Lending Rates and Cost of Listing (IPO .................................... 8 Figure 3 : Comparison between 5-Year Treasury bond Rate and End year bank lending rate .................. 9 Figure 4 : Kenya's Gross Domestic Savings Rate between 2006 and 2016 ............................................. 29 Figure 5 : Financial Benefits of Listing ................................................................................................... 31 Figure 6 : Non-Financial Benefits of Listing ........................................................................................... 32 Figure 7 : Financial Markets Functionalities ........................................................................................... 42 Figure 8 : Graphical representation of financial sector contribution to Kenya's GDP (2008-2017) .......... 43 Figure 9: Equity Market Capitalization at the NSE as a % of Nominal GDP for Kenya ........................... 44 Figure 10 : Product Development Flowchart for the Authority .............................................................. 47 Figure 11 : Flowchart depicting the process of a no objection/In Principle approval ............................... 48 Figure 12 : Current Structure of Capital Markets products in Kenya ...................................................... 49 Figure 13 : AMERC 2017 Survey Findings on number of listings in the last five years ............................. 54 Figure 14 : AMERC 2017 Survey Response on Capital Raising Options for Small and Medium Enterprises.............................................................................................................................................................. 54

v
Figure 15 : AMERC 2017 Survey Results on Listing Requirements that deter potential issuers from listing.............................................................................................................................................................. 55 Figure 16 : IPOs by Asian Companies in local market and other markets ............................................... 66 Figure 17 : Top Country Scorers in Pan-African Corporate Credit Rating ............................................... 72

1
LIST OF ABBREVIATIONS
ABS - Asset Backed Securities
CBK - Central Bank of Kenya
CMA - Capital Markets Authority
CMMP - Capital Markets Master Plan
ETF - Exchange Traded Funds
GDP - Gross Domestic Product
GDR/N - Global Depositary Receipt/Note
IFC - International Finance Corporation
IPO - Initial Public Offering
MTP - Medium Term Plan
NSE - Nairobi Securities Exchange
OMFIF - Official Monetary and Financial Institutions Forum
REIT - Real Estate Investment Trust
SOE - State Owned Enterprises
SPO - Secondary Public Offerings
KASIB – Kenya Association of Stockbrokers and Investment Banks
KAA - Kenya Airports Authority
CDSC - Central Depository and Settlement Corporation
SOE - State Owned Enterprise
SIP - Share Issue Privatization

2
1 Executive Summary
The significance and role of the Capital Markets in the development of economies can be best
emphasized by the intensity of reforms undertaken in the industry in the last half a century especially in
emerging and frontier markets. The Capital Markets in these countries mainly operated traditionally, as
can be traced back to most countries currently with well-developed and functioning Capital Markets.
In the Sub-Saharan countries, deliberate activity and efforts towards formalizing the establishment and
operationalization of Capital Markets actively started in the 1980’s and 90’s. In most of these countries,
this was pioneered by Development Finance Institutions such as the World Bank and IFC amongst others,
with support from respective jurisdictional Central Banks as well as Ministries of Finance.
At the time, economists and policymakers had high expectations about the prospects for domestic
capital market growth and development in emerging economies.
So why the push for developed capital markets? Key expected benefits of capital markets to economies
include; providing long-term capital through mobilization of savings; facilitating broader ownership of
productive assets; diffusing stresses away from the banking system by matching long-term investments
with long term capital; promoting public-private partnerships (PPPs); acting as a gateway for Foreign
Direct Investments (FDI); leveraging Government financing sources essential for socio-economic
development; and improving efficiency of capital allocation through competitive price discovery and
valuation of entities
Back home, Kenya’s journey towards the development of its capital markets can be dated back to the
1950s where trading in shares was based on a gentleman’s agreement. Kenya’s reforms were based on
recommendations from the – IFC/CBK (1984) study through Sessional Paper No.1 of 1986 which
proposed the establishment of a Capital Markets Authority, subsequently established in 1990 through
the Capital Market Authority Act (Cap 485A) with the main role of promoting and facilitating the
development of an orderly and efficient capital market in Kenya.
It is therefore of no surprise that Kenya, as a pacesetter in the East African region, prioritized the
development of the financial markets as a key enabler under the economic pillar of its Vision 2030
aspirations of attaining a GDP level of at least 10% annually with the overall goal of transforming Kenya
into a middle-income country by the year 2030.

3
However, since the launch of Vision 2030 in 2008, the country has not attained the envisioned 10%
growth in GDP with the highest recorded in the ten years being 7.0% recorded in 2007, 3% shy of the
10%. During the rest of the ten years GDP growth has oscillated at 5%.
The Authority has remained alive to its envisioned contribution towards increasing Kenya’s overall GDP.
As such, it has made significant steps towards expanding the functioning of Kenya’s capital markets as
evidenced by the (i) development of supporting regulations, (ii) incentives to promote capital markets
instruments, (iii) licensing of intermediaries, (iv) introduction of new capital markets products, and (iv)
implementing a comprehensive investor education and public awareness strategy, amongst other
reforms.
While this paper aims to diagnose the reasons behind the low uptake of capital markets products in
Kenya, it is important to note that other jurisdictions have equally seen it apt to assess the progress in
their markets, particularly in primary issuances with the most recent being; (i) the Financial Conduct
Authority of the United Kingdom(UK) and (ii) the Africa/Middle-East Regional Committee(AMERC)
working committee on listings with a representation of 25 ordinary and 12 associated members ,
including Kenya.
In February 2017, the Financial Conduct Authority (FCA) published Discussion Paper 17/2: Review of the
Effectiveness of Primary Markets: The UK Primary Markets Landscape. The purpose of the discussion
paper was to prompt a broad debate about the effectiveness of UK primary capital markets and how they
serve their purpose of providing access to capital for issuers, and investment opportunities for investors.
The paper presented four areas for discussion including; a) The split between standard and premium
listing with a focus on an international segment; b) how to support the growth of science and technology
companies; c) the listing of debt securities and debt multilateral trading facilities; and d) retail investor
access to debt markets. The paper was subjected to stakeholder engagement with industry players such
as investor groups, listed companies, advisers to listed companies and other wholesale financial markets
groups and the outcome of the consultations summarized in a policy statement, referenced as FCA PS
17/221. The new rules are reported to have been effected starting 1st January 2018.
1 https://www.fca.org.uk/publications/policy-statements/review-effectiveness-primary-markets

4
In March 2017, the Africa/Middle-East Regional Committee (AMERC) working group on listings
conducted a survey whose overall purpose was to address challenges that continue to impede listings on
the various exchanges in the AMERC region.
Figure 1: Survey Findings on number of Listings by Countries in the last five years
Source: AMERC
An excerpt of the AMERC survey (March 2017) findings indicates that 27% of respondents only managed
to have over 25 new listings in the last five years while the majority (37%) only had between 1 and 5 listings
in the last five years. Banking sector was equally ranked as the most preferred capital raising option for
small and medium enterprises across respondents. This is however not the case in the Kenyan scene, at
least in the recent past since the dawn of the interest rate cap law in September 2016.
These examples confirm that the issue of uptake of capital markets products, be it through equity, debt
or other structured instruments remains a concern for regulators across different jurisdictions as markets
seek to establish themselves as global financial centers.
Thus, Kenya is amongst many other countries grappling with the challenge of low uptake, hence seeking
domesticated solutions to increase capital markets participation in terms of product uptake, investor
involvement and its overall contribution to the country’s overall economic growth.
37%
18% 18%
27%
0%
5%
10%
15%
20%
25%
30%
35%
40%
Between 1 and 5 Between 6 and 10 Between 11 and 25 over 25
Re
spo
nse
Ra
te
Classification of Attained Listings in the Last 5 years
Survey Findings on number of listings by countries in the last five years

5
1.1 Collective Investment Schemes (CIS)
While the low uptake of products spans across almost all capital markets products, it needs to be
emphasized that the growth of collective investment schemes in the industry remains promising.
Assets under Management (AUM) in the CIS market have been registering significant positive growth,
from Kes. 20 billion in 2013 to Kes. 57 billion as of end of December 2017, with money market funds the
most popular asset class among fund managers, accounting for an average of 78 per cent of the total
value of portfolios.
Table 1 : Assets under Management CIS Filings to CMA
Year AUM (Kes billion) % increase
2013 20.38 74.97
2014 34.99 71.69
2015 43.10 23.18
2016 57.09 32.46
2017 57.22 0.23
Source: CIS Filings to CMA (various)
However there was a marked loss in momentum in 2017, attributable largely to prolonged political
uncertainty in Kenya, on the back of challenges of heavy investment by fund managers on Chase Bank
and Imperial Bank bond offerings and their subsequent lock-in following their placement under statutory
management. Further, commercial papers issued by Nakumatt and Athi River Mining Cement Company
both of whom have faced challenging financial times in the recent past was another asset classes
adversely affected.
On the other hand, the net profit of the funds increased from Kes. 1.3 billion in 2016 to Kes 3 billion in
2017, representing a 120% increase. In 2017, only two (2) firms, Genghis and Stanlib, made losses of Kes.
144 million and Kes. 409 million respectively.
Net assets of the funds have also been on the rise with an average growth level of 52.30% in 2017 from
2016.

6
Table 2 : Net Assets of Collective Investment Funds (2017/16)
Fund 2017 2016 Growth
African Alliance 2,248,658 2,104,897 6.83%
Amana -1,955,985 -2,096,184 -6.69%
Stanlib 819,637 132,514 518.53%
CBA 4,086,099 2,915,277 40.16%
CIC 14,868,784 12,628,595 17.74%
Old Mutual 1,539,215 1,392,412 10.54%
Sanlam 4,074,895 3,810,424 6.94%
Nabo 827,297 572,500 44.51%
Britam 8,016,915 9,381,529 -14.55%
Genghis 545,356 700,023 -22.09%
ICEA Lion 5,949,887 5,292,337 12.42%
Apollo 162,836 73,787 120.68%
Dry Associates 550,218 186,863 194.45%
Equity 1,270,865 2,971,848 -57.24%
Madison 794,709 888,781 -10.58%
Zimele 847,704 704,756 20.28%
Total 44,647,090 41,660,359 7.17%
Average Growth in Net Assets (2016/17) 52.30%
Source: CMA
1.2 Equity listings
Statistics on Kenya’s capital markets growth trajectory point towards some direct or inverse correlations
between macro-economic indicators trends and primary/secondary markets performance.
In one instance, new IPOs/listings, have been observed to occur most frequently when lending rates have
been on an upward trend as seen in the table below; as witnessed separately in 2005 to 2007 (7 listings);
and subsequently 2011-2012 (6 listings). This inverse correlation reflects a higher appetite for cheaper
cost of financing through the capital markets by business entities, when lending costs become higher.
During the two periods under review the secondary market also recorded significant rises in NSE Index
levels, market capitalization and equities turnover, even as GDP grew modestly pointing to a direct
correlation.

7
Table 3 : Kenya's Primary and Secondary Equities Performance Vs Macro Economic Trends (2002-2017)
However, this trend was not replicated from 2012 to 2017, with an average of 1 delisting per year, despite
stable GDP growth level averaging 5% and low inflation rates. Further, the stagnant listing levels do not
resonate with Kenya’s global Ease of Doing Business ranking that has improved tremendously from 129th
in 2013 to 80th in 2017

8
Table 4 : Kenya’s ranking on Ease of Doing Business (2013 – 2017)
Year 2013 2014 2015 2016 2017
Ranking 129/185 129/189 113/189 92/189 80/190
Source: World Doing Business Report (various)
It has further been observed that during this spell, commercial bank lending rates were so high that the
Government had to intervene through introduction of interest rate caps. This is despite capital markets
being a much cheaper cost of financing as demonstrated overleaf:
Figure 2 : Comparison between Banking Lending Rates and Cost of Listing (IPO
Source: CMA Issuer Prospectus Submissions
As may be observed above IPO costs have ranged from 1.85% to 10.62% of amounts raised compared to
bank lending rates of 13%-16%, noting that the former is a one-off cost while the latter is an annual cost
over the tenure of the relevant loans. This is similarly observed for medium-term Treasury bonds costs
compared to bank lending rate as shown in the diagram overleaf:
2.91%
10.62%
5.00%
2.20%
4.61%
9.10%
6.51%
1.85%
13.33% 13.93% 13.33%14.06% 14.12% 14.14%
15.99%
13.87%
0.00%
2.00%
4.00%
6.00%
8.00%
10.00%
12.00%
14.00%
16.00%
18.00%
KenGen Eveready Access Kenya Safaricom Co-op Bank Britam NSE DeaconsKenya
Apr-06 Aug-06 Mar-07 Jun-08 Oct-08 Sep-11 Jul-14 Jul-16
Ba
nk
Le
nd
ing
Ra
te/C
ost
of
off
er
(%
)
Month/Year of IPO by Company
Comparison between Banking Lending Rates and Cost of Listing (IPO)
% Cost of offer Bank lending rate as at December

9
Figure 3 : Comparison between 5-Year Treasury bond Rate and End year bank lending rate
Source: CBK CMA, Issuers Information Memoranda
Since the launch of its Capital Markets Master Plan (CMMP) in 2013, the Authority has only overseen five
(5) listings on the GEMS and tw0 (2) listings, post IPO in the other segments of the NSE.
While the number of listed companies in Kenya increased by 33% in 2005 to sixty-four (64) compared
with the forty-eight (48) in 20o5, the market has also been characterized by suspension and delisting of
listed companies, especially from 2013, summary of which is captured in the table overleaf:
Table 5 : Companies Delisted/Suspended from the Nairobi Securities Exchange between 2011 and 2017
Company Status Year Given Reasons CMA Regulations Breached
Unilever Tea Kenya (UTK)
Delisted 2009 - Minority buyout by Brooke Bond, the main shareholder.
- Not Applicable
Access Kenya Delisted 2013 - Buy out by SA firm, Dimension Data
- Not Applicable
Atlas Africa Industries
Suspended 2017 - Suspension from LSE following resignation of NOMAD, Stifel Nicolaus Europe Limited.
- Not Applicable
CMC Holdings
Delisted 2015 - Successful buyout of the company by Dubai based Al-Futtaim Group
- Under Determination
Hutchings Biemer
Suspended 2001
- Takeover of the company by a subsidiary of the United Arab Emirates’ largest operating conglomerate, the Al Futtaim Group.
- Failure to prepare and submit financial reports (interim and final) for the years 1999-2001,
- Failure to convene an annual general meeting for five
11.63 11.51 12.4413.44 12.24
16.9815.99
18.3
13.66 13.64
0
5
10
15
20
2013 2014 2015 2016 2017
Rat
e (
%)
Year
A Comparison between 5-year Treasury Bond Rate and End Year Bank Lending Rate
Average 5 year Treasury Bond Rate End Year Bank Lending Rate

10
consecutive years from 1997 to 2001,
- Disregard of requisite shareholders approvals in seeking substantial loans/overdrafts, major contracts and transactions with related parties and
- Failure to submit details of its shareholders and directors to the Authority.
A Baumann Suspended 2008
- Failure to increase its paid-up share capital to the minimum required of Kshs 20 million for listing under the Alternative Investment Market Segment,
- Failure to produce audited and interim accounts,
- Failure to lodge monthly shareholding returns to the Authority within stipulated timelines,
- Failure to disclose material information,
- Failure to pay market development fees and
- Failure to hold an Annual General Meeting within the stipulated timelines.
Rea Vipingo Delisted 2014 Buyout by Centum - Not Applicable
City Trust Ltd Delisted 2013 Buyout by I&M Bank - Not Applicable
Marshalls Delisted 2017 Buyout by majority shareholder occasioned by financial challenges in the company.
- Late submission of half and full year financial statements within regulatory timelines between 2012 and 2016.
- Operating under a negative working capital eg Kshs (186) Mn as at end March 2016.
- History of loss making. In four consecutive years.
- Late submission of shareholding report.
Source: CMA
Additional internal research by the Authority has further established a correlation between low listings
and corporate financial performance. To further explain the limited listing activity between 2014 and

11
2017, an analysis on the number of profit warnings issued by listed equities companies returned the
findings as in Table 3 below:
Table 6 : Profit Warnings and Losses by Listed Equities Companies (2013/14 - 2016/17)
Year No of companies that issued profit warnings
No. of companies that made losses
2013/2014 10 11
2014/2015 14 18
2015/2016 16 13
2016/2017 20 14
Source: CMA
The most common reason provided by companies for the profit warnings and losses in 2013/2014,
2014/2015 and 2015/2016 was tough macro-economic conditions and especially, the impact of the
depreciation of the Kenyan shilling and high interest rates on their respective businesses. This may be
one of the reasons for potential issuers keeping away from listing, as going to market when prices of
affected listed companies were on a decline, would not have been prudent. This was aggravated by
uncertainties around the Presidential elections in Kenya during the second half of 2017, as well as
prolonged drought that was experienced in the country earlier in 2017, which led to increased inflationary
pressure and a reduction in disposable income. This led to the conclusion that macro-economic factors
may have partially contributed to the low listings in Kenya.
1.2.1 Privatization Effect
Privatization often brings into the market new industries such as Energy, Fast Moving Consumer Goods
(FMCG) and sports, in the case of Kenya; thus, potentially increasing domestic investor’s diversification
opportunities, which in turn affects liquidity.
A feature of major privatization sales is the cross-listing of stocks, that is, the floating of a company both
in the domestic and international exchanges. This privatization strategy may enlarge the participation of
foreign investors and overcome informational barriers to foreign investment (Chiesa and Nicodano,
2003). Thus, it is considered that floating State-Owned Enterprises (SOEs) on foreign markets could

12
boost liquidity in home markets. The Government of Kenya (GoK) has shown leadership in this as shown
by the planned dual listing of the National Oil Corporation, a state corporation.
Further, historical analysis of Kenya’s performance on the privatization front represents a positive picture
in terms of the market impact and perception. An analysis of 47 new IPOs and subsequent listings on the
Nairobi Securities Exchange between 1984 and 2007 that raised Kshs 50 billion, reveals that successful
(oversubscribed) IPOs by State Owned Enterprises, generated significant interest in the market, thus
attracting a good number of private companies. Kenya Commercial Bank (KCB)’s 327% subscription in
1988 immediately brought on board companies like Total Oil Company (106%), Nation Printers (113%)
and Standard Chartered Bank (233%).
Housing Finance Corporation of Kenya (HFCK) IPO of 1992 which was 303% subscribed, similarly
attracted new companies like Crown Berger, East African oxygen (BOC), NIC, Firestone, Rea Vipingo and
East African Portland Cement to the stock market over the following five years.
Additional issues by KCB in 1999 and 2004 brought in companies like Athi River Mining, Pan African
Insurance, African Lakes, Standard Newspapers, Diamond Trust, Scan Group and Eveready. Without
doubt, therefore, privatizations through the NSE was a catalyst for capital raising and listing by private
enterprises. This trend has similarly been observed in several other jurisdictions notably India, China,
New Zealand, South Africa and Egypt.

13
Source: CMA Research
More recently in 2017, the Brazilian government announced its largest privatization package since the
1990s to bolster investment in order to revive the economy. A total of 57 companies have been
earmarked in the package, including the Brazilian Mint which prints the country's currency and passports,
14 airports, 15 port terminals, and the largest energy company in Latin America, Eletrobras with most
auctions expected to take place in 2018.The Brazilian Government aims to raise some 44 billion reals (14
billion U.S. dollars). This is considered part of its policy towards addressing persistent budget deficit
which had since soared to $17.8 Billion as at the first half of 2017.
Experience from other countries such as Guinea further show that privatization is more likely to result in
increased efficiency and improved equity outcomes if it is embedded in a set of conceptually appropriate,
functioning legal and economic institutions that support and guide market operations. These include:
the definition and protection of property rights; contract enforcement and commercial dispute
settlement through lawful, peaceful means, or, more broadly, court decisions that are timely and based

14
on the law, not payments; a degree of regulatory capacity; functioning bankruptcy/insolvency regimes;
and a public administration that meets modicum standards of predictability, competence and probity
and thus lowers transactions costs. If these institutions are not in place and working, privatization will
produce sub-optimal, perhaps negative outcomes.
1.3 Debt listings
Activity in the primary Treasury bond market has grown steadily over the years as Government has over
time increased its proportionate share of domestic debt through issuance of bonds, with infrastructure
bonds attracting even more interest, being risk and tax free. On the other hand, activity in the corporate
bond market in the years leading to 2015 was fairly active until two issuances, again Chase Bank and
Imperial Bank brought an unexpected drought in this market following a combination of governance and
financial resource challenges, resulting in their placement under receivership.

15
Table 7: Statistics on Primary Bonds Market - Treasury and Corporate Bonds

16
Table 8: Snapshot of Bond Market Reforms in Kenya (Prior to development of the Capital Markets
Master Plan)
Year Reform
1997 Treasury Bonds listed at the NSE for the first time (Approved by CMA as capital
markets instruments)
1998 First Corporate Bond listed (EADB) at the NSE (Also approved by the NSE)
2008 Introduction of Benchmark Treasury Bonds of 2yr, 5yr, 10yr, 15yr and 20yr tenors-
aimed at generating a stable Bond Yield Curve
2009 Establishment of Bond Market Steering Committee (BMSC) by The National
Treasury
Modernization of market infrastructure and practices- Automation of Bond
clearing and settlement between NSE and CBK
Issuance of Fungible Infrastructure Treasury Bonds
Lowering of minimum Subscription from Ksh 100,000 to Ksh 50,000
Approval by the National Treasury on the development of a Hybrid Bond Market
2010 Tax Exemption to all Infrastructure Bonds with more than 3 years of maturity
2013 Introduction of Capital Markets regulatory provision allowing off-exchange(OTC)
trading of securities
Scope of Authorized Securities Dealers expanded to include Investment Banks and
Fund Managers
Source: CMA

17
The Capital Markets Master Plan (CMMP) 2014-2023 observed that there were already rules and
regulations in place to allow for trading of bonds between Authorized Securities Dealers and
recommended the introduction of a dedicated bond trading platform as soon as possible to enhance
trading. This was to be informed by a consultancy that only commenced in March 2018. The
establishment of an Over the Counter (OTC) platform to supplement in- exchange listing and trading of
bonds however a more secondary trade focus as compared to capital raising.
While the Central Bank of Kenya in conjunction with key stakeholders have worked at resolving issues
surrounding the Chase and Imperial Bank bond issuances, the market seems to have taken a back step in
active issuance of corporate bonds as investors who invested in the two bonds still seek recourse on their
investments, save for East African Breweries Limited (EABL) which braved the storm to issue and list a
successful medium term note in March 2017. It is worth noting that the KenGen Public Infrastructure
Bond issue was one of the most celebrated bond offerings and listing, raising Kshs 25 billion in 2009.To
a less extent but also worthy of note, commercial banks and financial institutions which have
traditionally been the most popular issuers of corporate bonds have been able to comply with Basel II
financial resource requirements, through capital markets funding, with a good number previously
indicating that they would apply their issue proceeds towards meeting core capital requirements as
prescribed by the Central Bank of Kenya (CBK).

18
1.4 Other Capital Markets Products
Table 9: State of Activity on other Capital Markets products and services
Source: CMA

19
1.5 Overall product uptake performance
The Authority has recently undertaken a comprehensive study to determine key factors inhibiting the
uptake of capital markets products ranging from issuance and listing of traditional vanilla instruments
such as equities and corporate bonds, to sophisticated ones such as exchange traded funds,
securitization, real estate investment trusts, global depositary notes and receipts, securities lending and
borrowing, despite the existence of a supportive globally competitive policy, regulatory and institutional
framework for each. The study therefore aimed to find answers to the following questions;
i. Why Kenya has been unable to achieve its projected targets as articulated in its Capital Markets
Master Plan, that envisions at least four listings on the NSE every year;
ii. What the contributing factors towards the stagnation of growth in the corporate debt market
are;
iii. Whether there are global and domestic macro-economic factors that could have adversely
affected product uptake;
iv. Whether, besides macroeconomic conditions and policies to facilitate investment in capital
markets products and services there could be other critical factors determining participation
levels of both investors and issuers in the growth of Capital Markets.
1.6 Methodology
The methodology used in conducting the study included; desktop research, review of past findings,
interviews with key market players, the Authority’s interdepartmental engagements as well as feedback
received from stakeholder engagements conducted over time.
It is important to note that this is not the first study of this kind conducted by the Authority on low uptake.
In 2005, for example, CMA conducted a study aimed at identifying impediments to new listings and
recommended practical solutions to attract more companies to list at the NSE. At that time there were
fifty-five (55) companies listed compared to the current sixty-six (66). The study was mainly based on
feedback from market intermediaries whose responses were captured through a detailed questionnaire.
Other scholars in the field have equally conducted research on similar areas covering aspects relating to
increasing market liquidity, increasing market size as well as investor participation, all of which have
some connection with low listings and uptake of Capital Markets products and services, albeit indirectly.

20
1.7 Findings
1.8.1 Past findings
As such, past research work unearthed a myriad of reasons that can be attributed to the low uptake of
capital markets products and services (detailed in Annexure II). These include: low liquidity levels;
perceived high regulatory costs; legal and regulatory gaps and restrictions; unfavorable
macroeconomic conditions; limited capacity on capital markets instruments from both demand and
supply side; sub-optimal utilization/commitment of market intermediaries licenses; lack of a
coordinated market approach towards the introduction of new capital markets instruments; delay
of privatization programs to facilitate listing of strategically positioned, profit making entities;
competition from other industries; pricing and valuation challenges, amongst others.
1.8.2 Limitations of key past findings
Further analysis of findings from previous research by CMA management has however unearthed a
number of limitations to the previous approaches used in conducting research on the subject which has
led to identical findings and solutions over the years that have not been impactful. These include;
(i) Lack of establishment of a clear direct/causal relationship between key external
fundamental macro-economic factors contributing to the low uptake of products as well
as listing of new products;
(ii) Past-overreliance on desk-based benchmarking research and failure to identify and/or
involve the right set of customer facing stakeholders (such as market analysts) or
conduct independent research to obtain informed and live reasons behind low uptake
and equity market listings;
(iii) Absence of empirical consumer and potential issuer behavioral assessments within the
capital markets;
(iv) Limitations in identification of a clearly defined research problem; and
(v) Failure to map findings to the actual research problems leading to mix-up of findings
relating to liquidity, behavioral, listing and market efficiency solutions.

21
1.8 New approach
Further in-depth analysis and additional engagement with relevant stakeholders has resulted in more
specifically problem driven findings and recommendations for further consideration in addressing the
problem on low uptake of capital markets products and services as outlined overleaf:

22
Table 10: Key Findings and Recommendations relating to Listings and Product uptake)
Finding Recommendation Lead Implementing
Agency
1. Reluctance to identify and implement bold, innovative measures to genuinely attract large private and public potential issuers to list at the Nairobi Securities Exchange
Identify and adopt business unusual approach to attract fund raising and listing. One such approach would be by encouraging new capital market local content policy that enjoins companies operating in critical sectors of the economy that will drive the National Development agenda (Big 4 Agenda) such as agricultural, energy, oil and gas, financial services, manufacturing telecommunications, and mining sectors to list a minimum percentage of their shares on exchanges within 5 years of commencement of operations.
Fully leverage Kenya’s prime-mover position globally in innovation through implementation of principles-based regulation and a regulatory sandbox to support use of FinTechs to enhance financial inclusion and mobilize savings across the continent.
CMA/National Treasury
CMA
2. While empirical data demonstrates the obviously lower relative cost of financing in the capital markets compared to bank lending rates, there has been random, un-sustained and unstructured engagement with stakeholders by the Authority and intermediaries who are often an unrepresentative focus group of the market. Historical analysis of primary market activity equally indicates
Step up structured sustained outcome based on face-to-face engagements with potential issuers on the listing experience to appreciate the benefits accruing to capital raising and subsequent listing on the Nairobi Securities Exchange, such as low financing costs and increased profile and debunk the perception of high regulatory listing costs.
CMA

23
higher activity in the primary equities market when interest rates were on a rising trend, but the opportunity has not been taken and there remains a perception that regulatory costs are high.
Continue implementing CMMP reforms/recommendations meant at spurring market activity and creating sufficient interest/excitement in the market to attract potential issuers
CMA
3. Empirical data illustrates that new listings have traditionally been catalyzed by a well performing secondary market driven by a similar rise in general economic growth as well as rising GDP growth rates and Government policy announcements such as privatizations through the capital markets. This also affects timings for capital raising and listing
Reintroduce and re-energize a structured, feasible and time-bound privatization programme through the Nairobi Securities Exchange targeting few eligible large cap State Owned Enterprises (SoEs) in key sectors, to catalyze (generate excitement) in the market, provide new impetus to and guide on perfect timing for capital raising and listing by equally large private firms. This will be done by engaging State Corporation Advisory Committee (SCAC) and other relevant institutions to determine options relating to amendment of respective ACTS establishing the stated organizations to allow the entities to raise funds through the capital markets.
Review scope of licensing of intermediaries to ensure they play their role in arranging and attracting new products/listings in the market
National Treasury/CMA
CMA

24
4. Potential issuers are discouraged from raising capital and listing by restrictive traditional provisions in the Law that prescribe specific minimum quantitative requirements that have no evidence-based rationale on ownership by anchor investors as well as minimum number of investors that are unattractive;
Amend the requirements for minimum free float, profitability track records, paid up capital and number of investors as required from time as a prerequisite for listing approvals especially where they are unjustified (Details of specific recommendations under discussions with stakeholders)
Introduce creative alternative policies aimed at addressing concerns around loss of control by anchor investors such as new classes of shares with non-voting rights;
Further review costs of participation in the primary and secondary capital markets in terms of global competitiveness in light of stakeholder perception;
Continuously review, identify and amend restrictive provisions in the capital markets and related Laws that are unattractive to capital raising and listing;
Resubmit previous pending policy proposals to the CS for the National Treasury aimed at promoting equity and debt capital raising and listings directly or indirectly for re-consideration.
CMA
CMA
CMA
CMA
CMA
5. Unstructured and consequently unsuccessful product roll out due to absence of a product development,
Require all issuers of new products to develop and submit elaborate product launch strategy, with
CMA
25
launch and subscription strategy for newer sophisticated products like ETFs, GDRs, REITs by issuers
elements such as product sensitization, customer journey/experience and marketing strategy.
Simplify products during stakeholder sensitizations
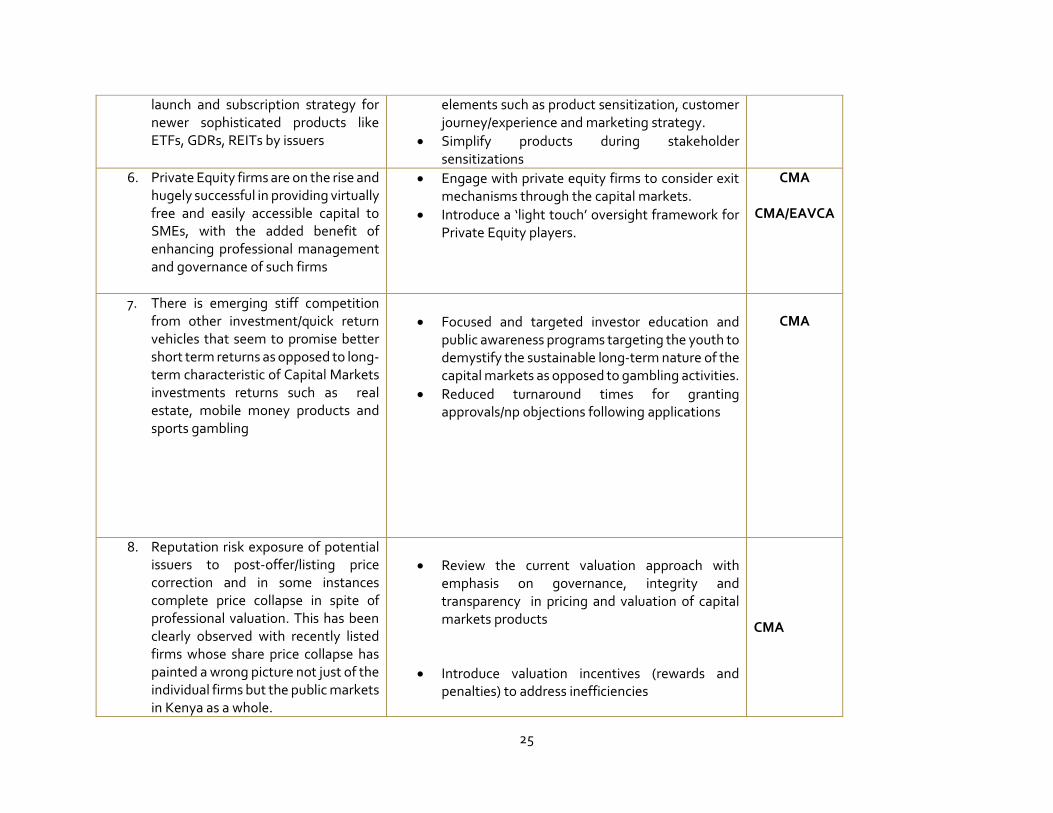
6. Private Equity firms are on the rise and hugely successful in providing virtually free and easily accessible capital to SMEs, with the added benefit of enhancing professional management and governance of such firms
Engage with private equity firms to consider exit mechanisms through the capital markets.
Introduce a ‘light touch’ oversight framework for Private Equity players.
CMA
CMA/EAVCA
7. There is emerging stiff competition from other investment/quick return vehicles that seem to promise better short term returns as opposed to long-term characteristic of Capital Markets investments returns such as real estate, mobile money products and sports gambling
Focused and targeted investor education and public awareness programs targeting the youth to demystify the sustainable long-term nature of the capital markets as opposed to gambling activities.
Reduced turnaround times for granting approvals/np objections following applications
CMA
8. Reputation risk exposure of potential issuers to post-offer/listing price correction and in some instances complete price collapse in spite of professional valuation. This has been clearly observed with recently listed firms whose share price collapse has painted a wrong picture not just of the individual firms but the public markets in Kenya as a whole.
Review the current valuation approach with emphasis on governance, integrity and transparency in pricing and valuation of capital markets products
Introduce valuation incentives (rewards and penalties) to address inefficiencies
CMA

26
9. The absence of a clear policy and action plan towards compensation/restitution of bond investors whose funds remained locked in and inaccessible from Chase and Imperial Banks has resulted in a bonds currently being an unpopular capital markets product. This has been exacerbated by failure by the KDIC and CBK to implement Section 39 of the KDIC Act to the letter leading to high likelihood that they will be treated as ordinary depositors upon resolution of the banks
Speedy implementation of section 39 of the KDIC Act in line with the segregation of client accounts to the letter required to ensure funds of depositors is protected from interference by corporations.
Policy pronouncement followed by expedient repayment of Chase and Imperial Bank bond holders key to restoring confidence and resumption of vibrant activity in the corporate bond primary market
National Treasury
10. Lack of certainty of and complexity of implementing tax incentives granted for capital markets products such as Asset Backed Securities, Real Estate Investment Trusts and Sukuks
Step up policy advocacy by petitioning the Kenya Revenue Authority to expediently issue notices/guidelines to ease implementation of tax incentives granted for mew products
CMA/The National Treasury
Source: CMA/KASIB/NSE/CDSC

27
While the Authority believes in the significance and necessity of the proposed recommendations above, the need to subject the same to extensive
public participation cannot be overruled. As a result, the above will be subjected to external stakeholder engagement and refined accordingly
These engagements will also assist in ensuring that the overall recommendations are owned by the industry.

28
2 Introduction and Background
In the early 1990s, economists and policymakers had high expectations about the prospects for domestic
capital market growth and development in emerging economies. However, despite substantial reforms
in policy to stimulate the development of the sector, growth has been slower than expected, with equity
and bond markets in most emerging economies remaining relatively illiquid and segmented, with trading
and capitalization concentrated in few firms2. Debt has tended to be concentrated at the short end of the
maturity spectrum, with some of it denominated in foreign currency, exposing affected countries to
maturity-liquidity mismatches and currency risks. Moreover, Government debt has been crowding out
corporate debt markets in many of these countries. A phenomenon experienced in Kenya through its two
Eurobond issues as well as increased investment by market players, including banks in treasury bills and
bonds following the introduction of interest rate caps effective September 2016.
Despite, a well-developed and efficient financial markets play an important role in determining the
health and efficiency of an economy by increasing credit access as well as alternative channels through
which savings can be redirected to productive sectors of the economy. There is a significant positive
correlation between financial market development and the economic growth of a country.3
Cognizant of this fact, Kenya, through its Vision 2030 economic blueprint included the development of
the financial sector as a means towards attainment of the ten percent annual GDP growth as the country
works towards attaining a middle-income level economic stature.
The Capital Markets Master Plan (2014-2023) was specifically developed with this in mind as it aims to
make Kenya the heart of the Capital markets in Africa.
Although formally set up in 1954, Kenya’s securities market has largely remained narrow and shallow,
particularly when compared to other top African markets such as Egypt, South Africa and Nigeria,
characterized by low liquidity levels, small market size dominated by few large companies such as
Safaricom, EABL, EQUITY,KCB and CO-OP, most of which are considered ‘too big to fail’; a phenomenon
that was disqualified during the global financial crisis that saw the demise of companies such as the
demise of Bear Stearns, Lehman Brothers and other financial institutions previously thought too big to
fail.
2 Emerging Capital Markets and Globalization: The Latin American Experience by Augusto de la Torre and Sergio L. Schmukler 3http://erepository.uonbi.ac.ke/bitstream/handle/11295/75144/Olonje%2CEvans%20O_The%20relationship%20between%20financial%20market%20development%20and%20economic%20growth%20in%20east%20african%20community.pdf?sequence=3&isAllowed=y

29
In addition to favorable liquidity positions, studies show that one of the major indicators of market
vibrancy is market diversity as manifested by the array of products and services that make up an
investor’s choice set.
Cognizant of these market challenges, the Authority, with support from the National Treasury developed
the 10-year Capital Markets Masterplan (CMMP) effective 2014, with the Capital Markets Authority
embarking on implementing the ambitious plan with the aim of making Kenya the “Heart of African
Capital Markets”. This capital markets blueprint guides the implementation of the broader National
Vision (2030), targeted at achieving a 10 per cent average annual GDP growth as a prerequisite for
attainment of a Middle-income economy status. This has been clearly articulated in the Vision 2030
Medium Term Plan I (MTP), Medium Term Plan II (MTPII), most recently the draft Medium Term III
(MTPIII) and to a very large extent implied in the Presidential Big 4 Agenda and manifesto.
Figure 4 : Kenya's Gross Domestic Savings Rate between 2006 and 2016
Source: CEIC Data
The capital markets are determined to play a key role in driving this growth target by mobilizing savings
through facilitating new capital markets products and services, more specifically by stimulating Gross
National Savings as a ration of GDP from the current estimated 12% to 30% by the year 2030. However,
statistics show a decline in the country’s Gross National Savings Rate as the country grows into a net
consumer.
10.6311.66
10.119.59 9.62
8.07 8.29
6.017.02 7.35 7.27
2006 2007 2008 2009 2010 2011 2012 2013 2014 2015 2016
Gro
ss D
om
est
ic S
avi
ng
s R
ate
(%
)
Year
Kenya's Annual Gross Domestic Savings Rate (2006 - 2016)

30
Pillar II of the CMMP states that whereas Kenya has a well –developed and liquid Government bond
market, the equities market is characterized by relatively low listings which are skewed towards financial
companies, and low liquidity. It further advocates for increased overall product supply and trading
activity of existing markets, introduction of new markets and products and bringing infrastructure up to
international best practice standards to improve the security and risk management of the markets, as
well as to attract more international players.
2.1 Measures to mobilize savings and enhance liquidity
The global financial crisis highlighted the importance of liquidity in functioning financial markets. Pre-
2008, market participants received easy access to readily available funding and were ill-prepared for
events that transpired during the credit crisis. Failure to adequately assess and manage liquidity
underpinned major market turmoil, triggering unprecedented liquidity events and the ultimate demise
of Bear Stearns, Lehman Brothers and other financial institutions previously thought too big to fail4.
Cognizant of the dangers posed to market operations and stability by low liquidity levels that have
averaged between seven percent and nine percent for Kenya over the years, the CMMP identified policies
and strategies aimed at improving market activity whose resulting contagion effect is enhanced savings
levels, increased liquidity levels, with the most prominent feature being the introduction of new Capital
Markets instruments as efficient channels through which capital mobilization can be achieved, further
positioning Kenya as an investment destination of choice globally.
This was equally envisioned to attract more issuers in the market hence increase in number of licensed
entities by the Authority as well as revenues from fees and commissions levied on licensees.
In its structured approach to implement Pillar II of the CMMP, the Authority embarked on a rigorous
program targeted at reviewing and developing supporting regulation for new products and services. This
saw the introduction of regulations of several Capital Markets instruments such as Real Estate
Investment Trusts in 2013, Exchange Traded Funds in 2015, Asset Backed Securities in 2017, Derivatives
Markets in 2015, Global Depositary Receipts and Notes in 2017 as well as Online forex trading in 2017,
Securities Lending and Borrowing in 2017 adding onto already existing Capital Markets investment
structures such as bonds, equities, collective investment schemes amongst others, earning the Authority
international recognition as an innovative Capital Markets regulator for three consecutive years; 2015,
2016 and 2017.
4 https://www.quantifisolutions.com/importance-of-liquidity-for-functioning-of-financial-markets-blog

31
Figure 5 : Financial Benefits of Listing
Source: NSE
However, despite very elaborate strategies to introduce new products and services in the Capital
Markets, uptake has remained low and a few existing market intermediaries have applied for revocation
of granted CMA licensees with investment advisers bearing the bulk of the revocations. Number of
listings equally remains low except for ten companies that have recently listed by introduction in the
recent past between 2011 and 2017.
Raisingcapital tofinancegrowth
GainingAcquisition capital
Optimization of balancesheetthroughequity anddebtfinancing
Unlock valueforshareholdersthroughenhancedliquidity fromsecondarytrading
CorporateTransactionssuch asmergers andacquisitions
Access to tax breaks and incentives
Efficient price discovery

32
Figure 6 : Non-Financial Benefits of Listing
Source: NSE
It is against the foregoing background that the Authority embarked on this study to establish factors
behind the poor performance and low uptake of Capital Markets products and services in Kenya as well
as the underlying factors behind license revocation, despite efforts made from various fronts to grow the
market, in line with provisions of the ten-year Capital Markets Master Plan (2013- 2023) anchored on the
Vision 2030.
Table 11: Summary on Development and Evolution of Kenya's Capital Markets
Stage 1 (1920s – 1953)
Stage 2 (1954 – 1963)
Stage 3 (1964 – 1970)
Stage 4 (1971 – 1989)
Stage 4 Post 1989
Inception Stage Formalization of Share Trading
Political Environment and
Kenyanization Policy
Capital Issue Committee and Taxation Policy
Revitalization Process
Characterized by informal share trading with no formal rules or regulations to govern trading activities.
Establishment of the NSEmarking the formalization of share trading. Initiated by stockbrokers as well as Ministry for Finance who desired to have a market that
Government adopts the Kenyanization policy with a primary goal of transferring economic and social control to citizens by ensuring that majority of businesses were in
Tight taxation policies were implemented to reduce repatriation of funds by foreigners and to raise Government revenue.
Implementation of recommendations from the – IFC/CBK (1984) study and development of Sessional Paper No.1 of 1986 developed as a basis
Help Develop a succession plan
Attracting and retaining top
talent in a company eg
through ESOPs
Promote a brand profile
Entry strategy in new regions through cross listings, dual
listings etc
Improved Corporate
Governance and operational
efficiency

33
facilitated floating of locally-registered Government loans,which would be unattractive without a stock exchange
the hands of citizens except where some overriding national advantage was otherwise demonstrated
for reform implementation.
Trading in shares based on a gentleman’s agreement where standard commissions were charged and clients were obliged to honor.
Constitution of the NSE in 1954 as a voluntary association of stockbrokers registered under the Societies Act (NSE, 1997a).
Kenyanisation of businesses involved transfer of existing firms to citizens and the creation of new enterprises in the hands of citizens. - Kenyans able to take over such businesses were provided with loan assistance by the Government.
Government made a first attempt to regulate the stock market with the establishment of the Capital Issue Committee (CIC) in 1971.
Key responsibility of the committee was to advise the Ministry of Finance on terms, priority and timing of all new public issues of equity, rights issues to existing shareholders in publicly-traded companies, debentures and loan issues.
Recommendations emphasized the need to develop money and capital markets by diversifying money market instruments and removing taxation differences between the debt and equity finance in order to achieve diversity in the sector.
No physical trading floor or specialized stockbrokers.
Although the formal market opened its doors in 1954, it had no physical trading floor and no specialist thus Business was transacted by telephone and prices determined through negotiation
Government passed the Foreign Investment Protection Act (1964)
No major change in the composition/range of securities issued in the stock market.
However, there was a rise in the proportion of Government stocks listed in the NSE. The ratio
Increased from 5.4% in 1954 to 13% in 1959, while in 1969 all Government securities were listed in the NSE.
Need to establish
a regulatory authority with the powers to provide regulatory measures for improvement and proper functioning of a fair and orderly market.

34
Share trading was a part time job for accountants, auctioneers, estate agents and lawyers who met to exchange prices over a cup of coffee
Brokers were free to buy or sell shares of their customers without consulting each other, provided such transactions were affected at the best possible price
By 1968, the number of listed public-sector stocks was 66 of which 45% were for Kenya Government, 23% Tanzania Government and 11% Uganda Government.
Reform process was implemented simultaneously with the overall financial sector reforms aimed at enhancing efficiency in the price discovery process, reducing transaction costs, facilitating competitiveness and increasing liquidity.
Foreign investors dominated share trading as they had the know-how of operating organized capital markets and had high income sufficiently permitted them to accumulate savings and investment in securities
Securities traded in the NSE during the period mainly included Government stocks, loan stocks, preferential and common share.
Uganda imposed exchange controls on Tanzania
and Kenya in 1970, meaning payment to residents required authorization from the Bank of Uganda and Uganda notes were not to be exported. This hindered intra-trade in East Africa and when the EAC finally collapsed in 1975, the Uganda Government compulsorily nationalized companies which were either quoted or subsidiaries of listed companies.
To establish a regulatory body, a legislation was adopted to facilitate formulation of rules and enhancing the effectiveness and efficiency of the operations of the Capital Market Authority (CMA).
Participation of local citizens
was very limited, accounting for about 5%, mainly because of their low-income and statutory restrictions during
CMA established in 1990 through the Capital Market Authority Act (Cap 485A). – purpose was to have a body specifically charged with the responsibility of

35
the pre-independence period
promoting and facilitating the development of an orderly and efficient capital market in Kenya.
Source: Classification of the stages based on KIPPRA discussion paper No.27 of March 2003 titled
“Development of the Nairobi Stock Exchange: A Historical Perspective

36
As mentioned in the chronology of the development of Kenya’s Capital Markets captured in table 3
above, the 1984 IFC study report on “Development of Money and Capital Markets in Kenya" conducted
by IFC/CBK made significant recommendations on the structure of regulation of Kenya’s financial
markets through which the Capital Markets Authority was established and continues to operate as a body
corporate, discharging its duties in line with the Capital Markets Act which has undergone a number of
amendments over the years in a bid to increase efficiencies in the Authority’s operations.
As such, Kenya’s Capital Markets has witnessed gradual reforms that have resulted to the current
environment within which long term investments and capital can be mobilized to spur economic growth.
Thus, established regulatory bodies in emerging markets are charged with the responsibility of
regulating and developing the stock market as a dual mandate. In her paper, “Development of the Nairobi
Stock Exchange” of March 2003, Dr. Rose Ngugi, states that, in developing the market, regulatory
authorities are charged with the responsibility of improving the regulatory environment to provide
adequate return on equity investment and assuring its comparability with other savings’ instruments.
She further states that such bodies are also responsible for ensuring sustainability of market liquidity by
enhancing supply and demand for securities and encouraging the development of securities’
intermediaries such as stockbrokers and underwriters/merchant banks. The authorities are also charged
with the responsibility of enhancing diversity of financial assets by encouraging issue of a broader range
of securities.
It is therefore no surprise that CMA, unlike other regulators in developed markets purposes to execute
its dual mandate of regulation and market development.

37
3 Research Problem
Augusto de la Torre and Sergio L. Schmukler, in their book titled, “Emerging Capital Markets and
Globalization – The Latin American Experience,” states; “The contrast between the large number of policy
initiatives and reforms and the poor performance of capital markets raises several questions. Are capital
markets in emerging countries truly “underdeveloped” or are they rather where they would be expected
to be, given these countries’ macroeconomic and institutional fundamentals? To what extent have
capital markets responded to reforms? Were the reforms misconceived? Were expectations too
optimistic? Are there other factors affecting domestic stock markets and driving out the impact of
reforms? Is more time needed to see the full fruits of reforms? Does the reform agenda need to be
rethought?”
These questions are relevant to the Kenya capital market as she seeks to identify the underlying causes
for the low uptake of Capital Markets products.
The study therefore seeks to address several questions that come into play, such as;
i. Why have we been unable to achieve projected number of equity listings at the NSE as
articulated in our CMMP that envisions at least four listings per year.
ii. What are the contributing factors towards the stagnation of growth in the corporate bond
market as well as in commercial paper issues?
iii. Is the low uptake of capital markets products and services a universal problem for world capital
markets or is it a peculiar occurrence for Kenya?
iv. What would be the average number of years within which an aspiring middle-income country like
Kenya can invest for considerable growth in capital markets to be felt and observed?
v. In the presence of favorable macroeconomic conditions and favorable policies to facilitate
investment in capital markets products and services, what other critical factors determine
participation levels of both investors and issuers in the growth of Capital Markets?
These remain crucial question that the Authority continues to battle answering in its day to day
operations and in continuously improving its strategies aimed at broadening and deepening Kenya’s
Capital Markets. For clarity on level of activity in each of the existing capital markets products, the table
below is referenced

38
Table 12: New Capital Markets Products/Services Launch (2012-2017)
Product Year Current Activity Potential Issuers CMA has engaged /
Engaging
Licensing of
Investment Banks
2002 14 No activity
Convertible Bonds 0 0 No activity
Equity or Credit
Linked Notes
2014 2 i. The Authority has approved two Credit
Linked Notes; an Equity Linked Note
for Centum in 2015 and a Credit Linked
Note for Stanbic Bank in 2014.
ii. ARM has issued a Credit Linked Note
before but as a private offer hence not
under the purview of the Authority
Collective
Investment
Schemes
2001 23 No Activity
Real Estate
Investment Trusts
June 2013 1 public issuance and
listing at the NSE by
Stanlib
i. Cytonn Investments
ii. Green Park
Exchange Traded
Funds
September
2015
1 listing at the NSE by
New Gold ETF issuer
characterized by minimal
trading.
Not Applicable
Asset Backed
Securities
February 2017 No official application
received yet
i.Kenya Pooled Water Fund ii.Stratagem
iii.Wholesale Leasing iv.Umati Capital
v.Coulson Honey – Trefi Scheme ;vi.CBA
Capital

39
Derivatives
Market
October 2015 Preparations for live tests
in preparations market go
live on going with all
stakeholders.
i. Listed single stock and index futures by
NSE
Global Depositary
Receipts/Notes
July 2017 No issue i. Afrexim Bank
ii. CitiBank Group
Online Forex
Trading
August 2017 1 application by
Execution Point Limited
under review
i. Windsor Brokers
ii. Upesi Money Transfer (Directed to
CMA by the CBK)
GEMS Listings 5 listed companies
namely (Atlas, Flame
Tree, Home
Afrika,Kurwitu and
Nairobi Business
Ventures) with Atlas
already facing challenges.
Reorganization in the
presentation of GEMS
listed companies in NSE
price lists by classifying
the companies based on
sectors rather than as
separate segment at the
bottom of the price list.
i. 30 identified companies with potential
to list through the Authority’s Business
Incubation and Acceleration forum
held in May 2017.
Initial Public
Offerings
Last IPO was in
2014 through
the
demutualization
of the Nairobi
There is minimal activity
in the IPO space.
However, the market is
expecting the dual listing
of the National Oil

40
Securities
Exchange.
Corporation on both the
NSE and LSE in the near
future.
Source: Capital Markets Authority
Other products and services that are at various stages of development include;
i. Direct Market Access;
ii. Securities Lending and Borrowing ;
iii. County Government Financing Products ;
iv. Islamic Finance Products;
v. Derivatives;
vi. Regulatory Sandbox ;
vii. Green Bonds (market led initiative)
Product Institutions Engaged Agenda
1. Islamic Finance Gulf African Bank – interested in the issuance of a sukuk Do not have a governance structure
to support the issuance of Capital
Markets Islamic Finance products.
2. Regulatory
Sandbox
Nailab,; MyCenti, ;Point50 Capital, Partnership for Urban
Innovation; Cambridge Center of Alternative Finance;
Bitpesa ; FMO(Netherlands Development Finance
Company);Lendahand ;Renovation Capital ; CENFRI
(Center for Financial Regulation and Inclusion).
Inquiry into CMA’s proposed
concept of establishing a regulatory
sandbox platform in Kenya
3. County Financing Kiambu, Kericho, Mombasa, Bomet and Kisii, Kisumu,
Meru, Kilifi, Mombasa, Uasin Gishu, Migori, Nakuru,
Laikipia, Isiolo, Kakamega and Bungoma County
Governments.
Assessing potential of raising
development capital through the
capital markets.
Source: CMA – Market Development Department

41
The regulatory sandbox remains a distinct concept that has attracted considerable interest from fintech
companies, both local and international. As a concept still under development, the Authority has an
opportunity to use the regulatory sandbox as a platform to fix the gaps that have been missing in the
implementation of new Capital Markets products as identified in the next chapters of the concept paper.
A diagnostic study is to be conducted on the same that is expected to unearth the potential that lies with
fintech companies in Kenya thus an opportunity to understand market needs as a prerequisite to further
development and implementation of the concept. Below is a table summarizing the institutions that have
been in touch with the Authority in discussing opportunities that lie ahead in Capital Markets products
that are still under development in one form or another.
There has therefore been an on-going debate by stakeholders (market players, the media, potential
investors, within the Authority etc.) on the possible reasons behind this apparent low uptake, and
possible strategies to reverse the situation. Low uptake remains a significant challenge to the Authority’s
planned activities and affects the planned roll-out of new products and services, in line with the CMMP.
Strategic focus should thus be modelled to offer lasting solutions to this trend.

42
4 Structure and state of development of Kenyan Capital Markets
Kenya’s financial system is multi-regulated and comprises of Banking, Insurance, Pensions, Saccos,
Financial Markets Infrastructure and the Capital Markets industry. Banking industry is the largest, with
about 60 percent of total assets excluding market capitalization as at end year 20165.
Figure 7 : Financial Markets Functionalities
The system has grown significantly, becoming more complex and highly integrated. It has developed
more cross-sector linkages and cross-border operations. Interactions in the system are therefore
potential sources of risks spillovers. So far, the financial system remains stable and robust, albeit
instances of vulnerabilities that have been managed well through enhanced supervision, improved
regulatory frameworks, and better coordination in policy making and implementation.
Historically, the contribution of the financial services sector to Kenya's economic growth has been on an
upward trend from 3.7% of GDP in 2009 to 9.2% of GDP in 2013. Over the same period, the sector grew
faster than the economy. The financial sector grew by 9.3% in 2013 as compared to the economy which
grew by 5.7%. This was an improvement from 4.9% growth by the sector in 2008 compared to the GDP
growth of 0.2%. As a result, the financial services sector is one of the main drivers of Kenya's economic
growth.6
However, following the passing of the interest rate capping law in September 2016, performance in the
financial sector has been on a relative decline. The financial sector posted the slowest growth since 2012
to stand at 6.9 per cent in 2016 compared to 9.4 per cent in 2015. The relatively depressed performance
was mainly because of a decelerated growth of 6.7 per cent in earnings from banking institutions partly
due to uncertainty associated with the capping of interest rates that came into effect in September 2016.
5 Kenya Financial Sector Stability Report 2016 6 Kenya Financial Sector Stability Report 2016

43
The sector’s performance was mirrored by the growth in broad money supply (M3) from 14.1 per cent in
2015 to 3.6 per cent in 2016. Similarly, expansion of domestic credit slowed notably from 20.8 per cent in
2015 to 6.4 per cent in 2016. Nonetheless, the sector’s growth was somewhat supported by the insurance
sub-sector that posted a growth rate of 5.3 per cent in 2016 compared to 5.0 per cent in 2015.The
underperformance in the financial sector was also manifest in the growth of credit to both the public
sector and private enterprises. In 2016, growth of credit to the public sector plummeted from 24.5 per
cent in 2015 to 9.1 per cent in 20167
Figure 8 : Graphical representation of financial sector contribution to Kenya's GDP (2008-2017)
As reflected in the figure 3 above, non-banking financial markets under which the Capital Markets are
classified contribute a minimal proportion of Kenya’s overall GDP levels as compared to other countries
that have well established Capital Markets. It is under this background that the Government of Kenya
identified development of the financial services sector as a flagship project in the Vision 2030 as a factor
to boost the country’s economic growth as measured by Gross Domestic Product.
4.1 The Capital Markets and Stock Markets Performance
Stock exchanges, apart from being a hub of primary and secondary market, have a very important role
to play in the economy of a country including acting as platforms through which companies can raise
capital for business, mobilization of savings for investment, facilitating company growth, enhanced
7 Kenya National Bureau of Statistics Economic Survey Report 2016

44
corporate governance, creating investment opportunities for small investors, Government capital raising
for development projects 8as well as acting as a barometer for an economy as characterized by the stock
indices and metrics such as market capitalization.
Kenya currently has one licensed exchange as the Nairobi Securities Exchange which plays a vital role in
the growth of Kenya’s economy. To measure the contribution of the Nairobi Securities Exchange to
general GDP of Kenya, market capitalization as a proportion of GDP levels as illustrated in the figure
below.
Figure 9: Equity Market Capitalization at the NSE as a % of Nominal GDP for Kenya
Source: CEIC Data According to the Financial Sector Stability Report 2016, the Capital Markets remained resilient despite
liquidity squeeze. This was characterized by inactive corporate debt segment, absence of new Initial
Public Offerings (IPOs), high concentration risk, and reduced profitability among listed firms leading to
fewer companies declaring dividends in 2016 compared to 2015.
Companies could also not raise capital either through debt or equities listing, thus limiting growth and
expansion of corporate sector. The decline in profitability of listed firms not only denied the companies’
liquidity to reinvest and expand, but also reduced share premia and valuation, impacting on their ability
to borrow or attract capital injection for growth.
8 http://www.stock-trading-infocentre.com/role-of-stock-exchanges.html
23.43
29.85
40.4842.57
32.74
26.98
2011 2012 2013 2014 2015 2016% M
ark
et
Ca
p t
o N
om
ina
l GD
P
Year
NSE % Market Cap to Nominal GDP (2011 - 2016)

45
The relatively low market activity saw market intermediaries, which rely on transactions and advisory
fees and commissions realize reduced profits and/or even turn into losses. The NSE, fund managers,
investment banks and brokers recorded huge losses in 2016 compared to their performance in 2015
providing an inference point on license revocation witnessed by the Authority in recent years.9
Table 13 : Performance of Capital Markets licensees as at December 20115/16 in Kshs Mns
Table 14 : Equity Turnover, Market Capitalization and Liquidity Ratio of top 10 listed firms at the NSE
9 Kenya Financial Sector Stability Report 2016

46
Further, Kenya’s stock market performance is characterized by predominance of blue chip companies
with the top five companies by market capitalization accounting for 66.69% of total market
capitalization as at February 2018.The companies include Safaricom, Equity, Kenya Commercial Bank
(KCB), East Africa Breweries Limited (EABL) and Cooperative Bank 0f Kenya with three out of the five
being banking institutions, confirming the vulnerability of the market.
4.2 Capital Markets Products – The Role of the Capital Markets Authority
CMA, unlike a majority of Capital Markets regulators in other jurisdictions has a dual mandate of both
Regulation and Market Development which may seem competing but are complimentary given the
relatively small size of Kenya’s Capital Markets as measured by the Nairobi Stock Exchange performance
indicators like market capitalization, number of listed companies and turnover levels.
Emerging and developed capital markets around the world are increasingly advancing their
sophistication in both depth and diversity of their product and service offerings as investment
professionals continue to demand for products that meet their investment choices as well as to expand
their scope of products.
4.3 Existing Product Development Procedures
In line with its internal structures, the Authority’s market and product development role is executed by
the Directorate of Regulatory, Strategy and Policy with the aim of introducing new Capital Markets
instruments/products and services in line with the Capital Markets Plan. This is executed under the
background that through new products, more issuances are likely to come to market thus increased
number of licensees across board ranging from investment advisors, fund managers and investment
banks alike.
Though driven by the Directorate of Regulatory, Policy and Strategy, the process involves
interdepartmental input with the Market Development Department spearheading research on new
products.
The research findings are then used as an input by the Strategy and Policy Department in developing the
necessary policy framework. The Regulatory Framework Department then uses both the developed
policy framework and research in developing regulations. This iterative process is summarized using a
product development flow chart summarized in figure 9 below.

47
Figure 10 : Product Development Flowchart for the Authority
Key: CNF refers to the Compliance and Facilitation Committee of the Capital Markets Authority; the
main technical committee that advises on all technical matters.
NT refers to the National Treasury ;CE refers to the Chief Executive of the Capital Markets Authority

48
II: FLOW-CHART FOR ISSUANCE OF NO OBJECTION/IN PRINCIPLE APPROVALS
In principle approvals, also known as no objection are usually conducted through cross departmental
engagements under the stewardship of the Corporate Approvals Department.
They are mostly issued for new service delivery interventions and not products or licenses since issuance
of new Capital Markets products and licenses is based primarily upon the development of supporting
regulatory framework.
Figure 11 : Flowchart depicting the process of a no objection/In Principle approval

49
Figure 12 : Current Structure of Capital Markets products in Kenya
** - In the pipeline; ** - Regulation launched but no issuance yet
Source: CMA
Capital Market Products in Kenya
Equity Markets
i. Ordinary shares
ii. Collective Investment Schemes (REITs, Unit Trusts)
iii. **Islamic Products
iv. Exchange Traded Funds
iv. **Global Depository Receipts
Debt Markets
i. Treasury bonds
ii. Corporate bonds
iii. Preference shares
iv. Infrastructure bonds
v. Commercial papers
vi. CISs(Fixed Income Funds)
vii. **County bonds
viii. **Asset Backed Securities
ix. ** Sukuk
x. **Global Depository Notes
Derivatives Market
i. **Futures
ii. **Swaps
iii. **Options
iv. **Swaptions
v. Online Forex Trading
vi. **Commodities Market

50
4.4 Review of Prior Studies
4.4.1 CMA Study to determine impediments to new listings – 2005
In line with its market development function, the Authority has been conducting studies every fortnight
to determine market activities in terms of listings, issuance and uptake of capital markets products and
maintenance of an active database of licensed entities, key personnel in each of the entities as well as
conducting continuous supervision and inspection of the licensees as a proactive measure in identifying
gaps existing in the market to identify required intervention measures.
In 2005 for example, CMA conducted a study aimed at identifying impediments to new listings with a
view to recommending practical solutions to attract more companies to list at the NSE, the time at which
only 55 companies had been listed compared to the current 66.
The study was mainly based on feedback from market intermediaries whose responses were captured
through a detailed questionnaire that was administered and registered a responsive rate of 29%.
As a preliminary step to analyzing the Authority’s efforts towards solving gaps in the market, table 9 gives
a brief analysis of the implementation status of the recommendations forwarded in the 2005 New
Listings Paper.
Table 15: Review of Recommendations from New Listings Study (2005) conducted by the CMA
Recommendation Implementation Status as at June 2018
1 Aggressive investor education and awareness programmes focusing on potential issuers of securities and the investing public.
i. In subsequent years post the study, the Authority set up a unit responsible for market development and investor education.
ii. However, following internal changes, a fully-fledged investor education and public awareness department was created in 2011 to meet this objective.
iii. A lot of activity has since been done by the department through hosting investor education initiatives across the country.
2 Privatization of state enterprises through the securities
exchange is as a major source of listing, a characteristic
of merging markets.
i. Since 2005, the Authority was able to oversee
successful privatization and listing of Kengen
whose Initial Public Offering was
oversubscribed
3 Introduction of new financial products and new trading
infrastructure like OTC constitutes viable initiatives to
increase listings at NSE.
i. The Authority has developed regulations for the
issuance of REITs, ABS, ETF, GDR/N, SLB as
channels through which issuers can gain access
to listing at the NSE.

51
4 The legal and regulatory framework should be
enhanced. The present legal framework, although
comprehensive was developed in piecemeal and there
are a number of overlaps and gaps.
i. CMA Act has been amended a number of times
following stakeholder consultations to provide
an efficient environment for CMA licensees to
thrive eg in 2007, 2008, 2010, 2011, 2012, 2013
and 2016.
ii. CIS regulations currently being considered for
review.
iii. ABS regulations 2007 revoked and new ones
developed in 2016
5 Expedite development of capital markets infrastructure
and institutions.
i. Authority working with CDSC to upgrade the
trading systems to facilitate securities lending
and borrowing (SLB).
6 Enhance the capacity of market institutions and
intermediaries to encourage greater intermediation.
i. Authority has continuously held trainings for
market intermediaries in line with new Capital
Markets products eg ETFs, ABSs and REITs.
7 Continue to identify, research and develop new
products. The introduction of more financial products
would enable investors diversify risks and issuers would
design instruments appropriate to the nature of their
businesses. These include convertible corporate bonds,
index funds for listed equity and bond funds, tradable
depository receipts, special social bonds, mortgage
securitization, municipal bonds, futures and
derivatives, Real Estate Investment Trusts swaps and
options.
i. Research on Index funds for listed equity (ETFs)
conducted and one ETF Gold listing done in
2016.
ii. Regulation on tradeable depositary receipts
and notes developed. However, no issuance yet
but discussions with potential issuers such as
Citi, Stanbic Bank and Afrexim have been
conducted.
iii. Research done on special social bonds eg green
bonds and diaspora bonds though policy and
supporting regulations still under review.
iv. Research paper on Asset Backed Securitization
done, Policy Guidance Note developed but no
issuance yet.Potential issuers have engaged the
Authority eg Kenya Roads Board and the Kenya
Pooled Water Fund
v. Research on municipal/county bonds and
potential of issuance of the same in the Country
currently under review through the funding gap
consultancy project spearheaded by Working
Group 1 of the Capital Markets Master Plan.
vi. Research on derivatives, swaps and options
done – activity towards implementation of the
same still ongoing with soft launch expected by
June 2018.

52
8 Continue to identify, research and develop new
products
i. Is continuously being done through the Market
Development Department eg new research
topics on Separate Trading of Registered
Interest and Principal of Securities (STRIPS),
Algorithmic Trading, Islamic Finance
9 Encourage a savings culture through reduction of
inflation rates, stabilizing interest rates and restraining
fiscal excesses.
i. Introduction of the interest rate capping regime
whose effects resulted to reduction in access to
private credit by small business enterprises.
10 Stimulate supply of securities through fiscal incentives
such as instituting preferential tax treatment of
corporate profits for listed companies and enacting past
tax amnesty for listing companies.
i. Incentives issued to promote listings as
identified in tables 2 and 3 above
11 Stimulate demand for securities through fiscal
incentives for example abolishing withholding tax on
dividend income, capital flight return amnesty and
treating all EAC citizens or firms as local investors.
12 Strengthen the NSE as a self-regulatory organization
and pursue demutualization. The introduction of
automated trading system should be accelerated to
improve efficiency and enhance objective price
formation.
i. NSE demutualized in 2014 and licensed to
operate as an SRO
13 Address regional initiatives more aggressively through;
Sensitization of all market players on the
concept, operations and benefits of cross-
border listing and trading.
Harmonization of rules and regulations within
the three East African capital markets.
Harmonization of capital market development
policy initiatives.
Harmonize trading, clearing and settlement
systems.
Domestication of East African investors
i. The Authority is an active member and
participant of EASRA meetings as well as other
regional working groups.
ii. On the domestication of East African investors,
this was done by recognizing East African
investors as local investors under the Capital
Markets (Foreign Investor) Regulations, 2002
iii.
Source: Capital Markets Authority

53
4.4.2 CMA Study on Capital Markets Fees, Levies and Commissions – 2013
Further, in 2013, the Authority commissioned a study on capital markets fees, levies, and commissions
and its recommendations put on public exposure from 30th September to 30th October 2013.
The review of the fees, levies, and commissions was underpinned by the need to ensure financial
sustainability of the capital markets sector; alignment of our structure to global practice where trading
participants are primary contributors to the Investor Compensation Fund; raising levies collected by the
CDSC given its national importance to market stability and for improved systems and operational
oversight associated with the dematerialization and initiatives on the consolidation of national central
securities depositories.
The study made the following key findings:
• That fee caps must take into account the current and long-term financing requirements of the
Authority to ensure sustainability and to ensure mandate delivery is not compromised;
• That changes in fees charged should be implemented in the short to medium term but
substantial impact should be addressed through an industry wide strategic shift focusing on
growing the size of the market on which fees are to be levied which will call for institutionally
driven changes;
• That CMA should spearhead institutional reforms that goes beyond revision of the fees, levies
and commissions;
• That capital investment in systems infrastructure by the core market infrastructure participants
(Exchange and Central Securities Depository) should not be pegged to market levies to ensure
timely and sufficient investment in the systems needed for market growth and deepening; and
• One of the most critical regulatory costs to be managed relates to processing time and the
attendant uncertainty for purposes of structuring transactions therefore greater emphasis and
resources should be placed on improving the approval process turnaround time.
As the first step towards the implementation of the recommendations from the study and the
consensus reached with the stakeholders, a number of fees were adopted and revised under the CMA
regulations that has gone through several amendments over the years.

54
4.4.3 Survey by Africa/Middle-East Regional Committee (AMERC) working group on listings
– 2017
In March 2017, the AMERC working group on listings carried a survey whose overall purpose was to
address challenges that continue to impede listings on the various exchanges in the AMERC region.
Specifically, the survey sought to:
1) Establish the state of listings in the AMERC region;
2) Establish impediments to listing in the AMERC region;
3) Identify policy and fiscal incentives for listings across the AMERC region;
4) Make recommendations to increase listings across the AMERC region.
The survey was conducted through questionnaires whose response rate was 32%, with 12 responses
(Kenya included) received from a total of 37.
Some of the key findings are summarized in the figures below.
Figure 13 : AMERC 2017 Survey Findings on number of listings in the last five years
Figure 14 : AMERC 2017 Survey Response on Capital Raising Options for Small and Medium Enterprises
37%
18% 18%
27%
0%
5%
10%
15%
20%
25%
30%
35%
40%
Between 1 and 5 Between 6 and 10 Between 11 and 25 over 25
Re
spo
nse
Ra
te
Classification of Attained Listings in the Last 5 years
Survey Findings on number of listings by countries in the last five years

55
Source: AMERC
Figure 15 : AMERC 2017 Survey Results on Listing Requirements that deter potential issuers from
listing
Source: AMERC
75%
42%
42%
42%
33%
33%
25%
17%
8%
8%
8%
0% 20% 40% 60% 80%
Minimum float requirements and number of shareholders post IPO
Evidence of past profitability prior to listing
Audited financial statements for a few years prior to listing
Suitability of directors and management experience
Minimum fully paid up capital requirements
Continuous reporting obligations
Controlling shareholder issues and resultant conflicts of interest
Minimum level of net assets
Payment of listing fees
Lock up period for substantial shareholders
Providing information in connection with their projects for the 5 coming…
Survey Response Rate
List
ing
Req
uir
emen
t
Survey Results on listing requirements that deter potential issuers
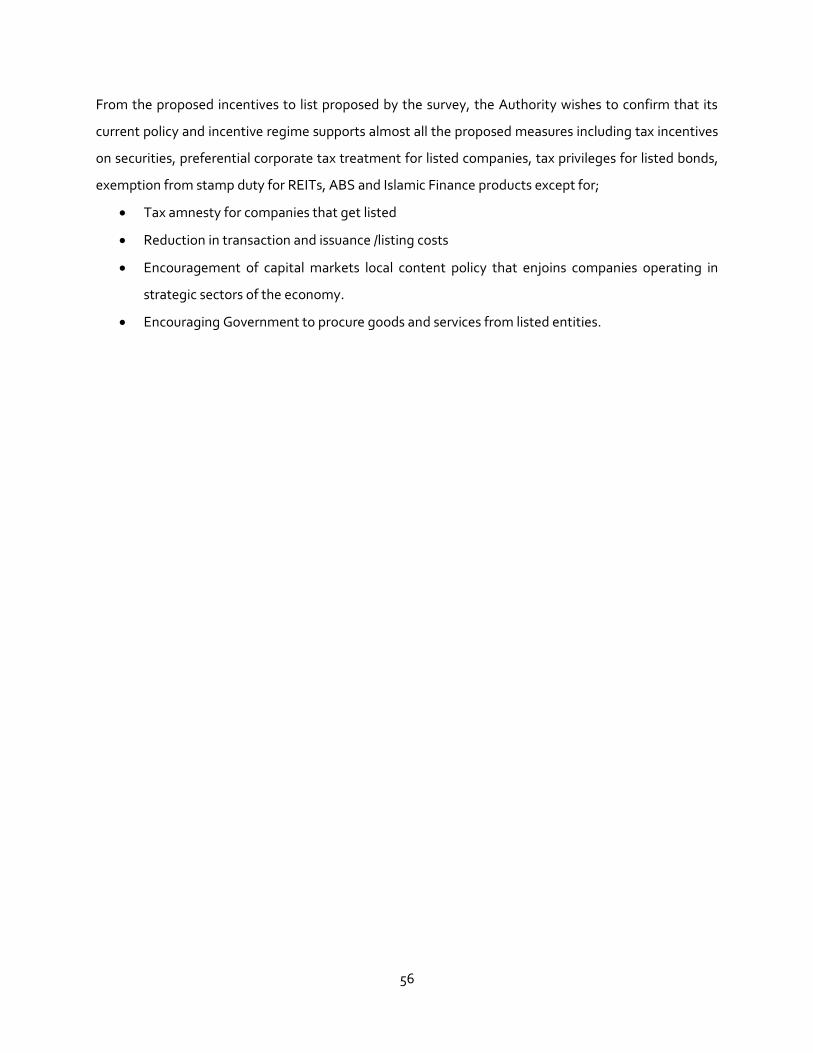
56
From the proposed incentives to list proposed by the survey, the Authority wishes to confirm that its
current policy and incentive regime supports almost all the proposed measures including tax incentives
on securities, preferential corporate tax treatment for listed companies, tax privileges for listed bonds,
exemption from stamp duty for REITs, ABS and Islamic Finance products except for;
Tax amnesty for companies that get listed
Reduction in transaction and issuance /listing costs
Encouragement of capital markets local content policy that enjoins companies operating in
strategic sectors of the economy.
Encouraging Government to procure goods and services from listed entities.

57
4.5 Capital Markets Incentives on New Products
The Authority, through the National Treasury has been able to make proposals (with input from market
players and policy makers) on Capital Markets incentives as a way of spurring developments within the
Capital Markets since 1995.
However, monitoring of effects and impact of such incentives indicate a low correlation between Capital
Markets incentives and actual performance of incentivized products as sampled by the Venture Capital
Regulations that were developed in 2008 but has only attracted one Venture Capital firm (Acacia Fund)
which has since seceded its Capital Markets operating license following changes in its strategic focus,
about ten years on.
In a study conducted by the Authority’s Strategy and Policy Department in 2010, a number of reasons
were given to answer the question on the extent of impact of policy incentives for the Capital Markets.
One of the responses given then was on the limiting opportunities in the economy since equities and
bonds were the primary Capital Markets investments available for investors.
Following this, the Authority adopted the Capital Markets Master Plan which envisioned the expansion
of the universe of Capital Markets products available to investors hence the Authority’s efforts towards
launching new Capital Markets products.
This resulted to accelerated introduction of new products to broaden the opportunities for investment.
Some of the products in the pipeline or already introduced include Asset Backed Securities, Real Estate
Investment Trusts (REITs), Derivatives, Exchange Traded Funds, Global Depositary Notes/Receipts,
Shariah compliant products among others. With the new products, a number of incentives have also been
offered to investors as indicated in table 8 below.
Table 16: Capital Markets Specific Incentives

58
Product Year Grante
d
Incentive Activity as at June 2018
Sukuk
2016 Exemption from Payment of Stamp Duty on Transfer of title relating to Sukuk arrangement
i. If at the beginning of the arrangement, the title shall be transferred from the original owner of the asset to the entity representing the interests of the Sukuk holders (2017/18 budget)
No Sukuk issued yet. The National Treasury is however considering issuing a Sukuk in the near future and is working closely with the Islamic Finance Project Management Office. However, the issuance is also clouded by discussions around Kenya’s ballooning public debt following the issuance of two Eurobonds by the Government in the last four years.
Islamic
Finance
Products
VAT Exemption of Islamic Finance products:
i. The issue, transfer, receipt or any other dealing
with Sukuk and any financial service structured in
conformity with Islamic Finance is exempt from
VAT.
There is not much activity within
the Islamic Capital Markets
sphere.
However, Islamic finance
products have been issued in the
banking sector.
REITs and
ABSs
2015 VAT exemption of new Capital Markets Products:
i. Asset transfers and other transactions related to
the transfer of assets into Real Estates Investment
Trusts and Asset Backed Securities are exempt
from VAT (2017/18 budget)
No ABS issued yet. However, 13
infrastructure bonds issued by
Kenya Government to date raising
over Kshs 370 billion.
Tax exemption for infrastructure securities (ABS and
Infrastructure Bonds):
i. Listed bonds with a maturity of at least three
years. for social and infrastructure purposes are
exempt from income tax.
Collective
Investment
Schemes
2006 Tax exemption on investment income from Collective
Investment Schemes, REITs:
i. Investment income of a pooled fund or other kind
of investment consisting of retirement schemes
registered by the Commissioner is tax exempt.
ii. Investment income of a pooled fund or other kind
of investment consisting of retirement schemes,
Currently, they are 23 CISs
with total Net Asset Value of Kshs
55.5 billion as at June 2017.There is
one listed REIT (Stanlib I-REIT)

59
provided that it is registered by the Commissioner
is tax exempt. (First Schedule of the Income Tax
Act Cap 470, Section 13&14, Part I (50) Finance Act
2006)
Exchange
Traded
Derivatives
Applie
d to
KRA in
2017
Income tax payment exemption(s)with respect to the
NSE Derivatives Investor Protection Fund Trust(IPF) and
the NSE Derivatives Settlement Guarantee Fund
Trust(SGF)
i. This is pursuant to section 13(1) of the Income Tax
Act and paragraph 13 of the First Schedule of the
same Act.
Not Applicable
Initial Public
Offerings
2000/2
001
Preferential Corporate Tax Treatment:
i. For any Newly listed Co. and approved under the
Capital Markets Act with at least 20% of its issued
share capital listed, the tax shall be 27% for 3 years
commencing immediately after the year of
income following the date of such listing. (Third
Schedule of the Income Tax Act, Cap 470 Head B
2(bb), Finance Act 2001)
ii. A Company that applies and is listed shall get a tax
amnesty on its past omitted income, provided it
makes a full disclosure of its assets and liabilities
and undertakes to pay all its future due taxes.
iii. In the case of a newly listed company on any
securities exchange approved under the Capital
Markets Act with at least 30% of its issued share
capital listed, the tax rate shall be 25% for the
period of five years commencing immediately
after the year of income following the date of such
listing (Third Schedule of the Income Tax Act, Cap
470 Head B 2(d), Finance Act 2002)
iv. For a newly listed company which has at least 40%
of its issued share capital listed, the tax rate will
be 20% for five years commencing immediately
after the year of income following the date of such
listing. (Third Schedule of the Income Tax Act,
Cap. 470, Head B 2(e) Finance Act 2005)
10 IPOs recorded between
2006 and 2017 with the last
offering in 2014 by the
Nairobi Securities Exchange
(NSE) following its
demutualization.
11 companies have also
listed by introduction
between 2006 and 2017
namely Equity Bank, Liberty
Holdings, TransCentury,
Longhorn, CIC Insurance,
Umeme, Home Afrika,
Flame Tree, Kurwitu
Ventures, Nairobi Business
Ventures, Barclays New
Gold ETF

60
2009/1
0
Reduction of issuance and listing:
i. Law Amended to reduce the listing fees by 50%
i.e. from 0.3% to 0.15% for offers of equity.
1995/9
6 and
2005/0
6
Tax Deductibility on Issuance and Listing Costs:
i. Exemption of stamp duty and value added tax on
the transfer of listed securities.
ii. Reduction of withholding tax applicable to
dividend income arising from investment on listed
securities for both local and foreign investors.
Foreign 15% to 10%; local 5% (Third Schedule of
the Income Tax Act, Head B 5(e) Finance Act 1995)
iii. Expenditure of a capital nature incurred in that
year of income by a person on legal costs and
other incidental expenses relating to the
authorization and issue of shares, debentures or
similar securities offered for purchase by the
public were all made tax deductible expenses;
(Income Tax, Act Cap 470, Part IV, Section15
(2)(s))
iv. Expenditure of a capital nature incurred in that
year of income by a person, on legal costs and
other incidental expenses, for the purposes of
listing on any securities exchange operating in
Kenya, without raising additional capital is tax
deductible. (Income Tax, Act Cap 470 Part IV,
Section 15 (2) (Finance Act 2006)
1996/9
7
Tax deductibility for credit rating companies:
i. Cost of rating made tax deductible to encourage
credit rating (Income Tax, Act Cap 470, Part IV,
Section 15 (2)(u) Finance Act 1997)
1 issuance
1995/9
6
Stamp duty and Value Added Tax (VAT) exemption on
share capital:
i. Exemption of stamp duty and value added tax on
the transfer of listed securities.

61
2000/0
1
Amnesty on past omitted Income:
i. Companies that apply and are listed shall get a tax
amnesty on their past omitted income, provided
they make a full disclosure undertake to pay all
their future due taxes.
Venture
Capital
Companies
1996/9
7
Tax exemption for Venture Capital Companies (VCC):
i. Gain arising from trade in shares of a venture
company earned by a registered venture capital
company, within the first ten years from the date
of first investment in that venture company by the
venture capital company, is tax exempt: provided
that the venture company, has not been listed in
any securities Exchange operating in Kenya for a
period of more than two years. (First Schedule of
the Income Tax Act Cap 470, Section 13&14, Part I
(47))
Only one licensed venture
capital firm that has since
revoked its license.
Others 2009/1
0
Increased capitalization levels for market
intermediaries:
i. Increase of the share capital for stockbrokers and
Investment Banks from Kshs. 5m and Kshs. 30m
to Kshs. 50m and Kshs. 250m respectively.
FinTech No incentives given so far on fintech as it is still a concept
under development
Source: CMA – Strategy and Policy Department

62
5 Key Constraints to the uptake of Capital Markets Products and Services
The study identifies several constraints that have contributed towards the low uptake of capital
markets products and services in Kenya.
5.1 Low liquidity levels
The global financial crisis highlighted the importance of liquidity in functioning financial markets. Pre-
2008, market participants received easy access to readily available funding and were ill-prepared for
events that transpired during the credit crisis. Failure to adequately assess and manage liquidity
underpinned major market turmoil, triggering unprecedented liquidity events and the ultimate demise
of Bear Stearns, Lehman Brothers and other financial institutions previously thought too big to fail.
Kenya’s investment landscape is characterized by institutional investors, mainly pension funds as well as
retail investors with the former taking a bigger share. However, their participation in the secondary
market remains limited as most of them take the buy and hold investment approach thus limiting the
frequency of activity in the market. A liquid market is one where there are many bids and offers and
participants can easily enter and exit it for minimal transaction cost, the absence of which results to high
transactional costs as bid offers are likely to be unmatched by offers.
This has resulted to limited activity in secondary trading except for a few active counters such as
Safaricom, EABL and some listed banking counters such as EQUITY, KCB and CO-OPERATIVE BANK.
5.2 Regulatory obstacles
As feedback from some of the engagements had with market players, regulation was partially attributed
towards contributing to the low uptake. This was assessed from different points;
i. Cost of compliance in line with the Corporate Governance framework requirements.
ii. Restrictive regulatory requirements inhibiting participation of investors for example,
The minimum amount an investor can put in a DREIT is Kshs. 5 Million. This is considered a key
hindrance to the uptake of the product as the target investors are not willing to put in this
minimum investment, due to comparisons with direct investment in real estate;
Tax Approval and REIT approval being treated separately in terms of tax liability as KRA considers
that the tax benefits for REITs accrue to the REIT and does initial set up costs for REITs were
considered too high especially with regards to listing the same.

63
Analysis of reasons behind the suspension and delisting of companies from the Nairobi Securities
Exchange indicate that while some companies such as Access Kenya and Rea Vipingo delisted following
successful buyout processes from strategic investors, some companies have resulted to delisting as a
measure of relinquishing regulatory costs to other investors able to meet the costs of the same.
Hutchings Biemer, A Baumann and Marshalls remain good examples of companies that after breaching
a number of regulatory requirements such as filing of annual returns, failing to meet minimum capital
requirements, failure to meet audit requirements as well as failure to meet board composition and
reporting obligations opted to delist.
In addition, procedures towards actual delisting also remain questionable as companies such as
Hutchings Biemer and A Baumann have remained suspended for sixteen and nine years respectively,
raising questions on efficiency of delisting procedures as effected by the Authority and the Nairobi
Securities Exchange.
5.3 Macroeconomic factors
While the significance of macroeconomic factors in determining the success of business within the
country cannot be overemphasized, questions have been raised on the nature of relationship between
macroeconomic indicators and actual performance of capital markets, particularly equities.
Given that capital markets activity in Kenya is mainly characterized by foreign investors and the fact that
trading is only done in the local currency, Kshs, adverse changes in macroeconomic factors such as GDP,
inflation and interest rates pose exchange rate risks to foreigners depending on whether the currency
depreciates and appreciates.
While the Central Bank of Kenya has continued to ensure that the Kenya shilling remains stable overtime
it would be naïve to ignore the impact that favorable macroeconomic factors have on market activity.
5.4 Competition from other sectors/instruments
Kenya, like many emerging markets offer a favorable return on certain instruments such as infrastructure
bonds that offer a double-digit return compared to other products considered high risk such as equities.
Given the commercial nature of capital markets players, return earned from investments play a
significant role in determining where to put their monies.
Additionally, the recent betting craze in the country has equally redirected savings of most youth towards
bets as the returns promised look more attractive as opposed to capital markets investments that are
characteristically long-term.

64
Table 17: Comparative performance rates of 10 Year Government Bond Yield and Total Equity Risk
Premium of various countries
Country 10-Year Government Bond Yield10
Total Equity Risk Premium11
United States 2.96% 5.08%
United Kingdom 1.51% 5.65%
Germany 0.62% 5.08%
France 0.84% 5.65%
Japan 0.05% 5.89%
Spain 1.31% 7.27%
Italy 1.78% 7.27%
Portugal 1.69% 7.96%
Greece 4.04% 15.46%
Ireland 1.00% 6.06%
Australia 2.84% 5.08%
Austria 0.80% 5.54%
Belgium 0.87% 5.78%
Canada 2.34% 5.08%
Denmark 0.63% 5.08%
Finland 0.75% 5.54%
India 7.67% 7.27%
Mexico 7.59% 6.46%
Netherlands 0.76% 5.08%
New Zealand 2.91% 5.08%
Norway 1.90% 5.08%
Sweden 0.77% 5.08%
Switzerland 0.12% 5.08%
Kenya 13.1512 10.27%
Source; World Bank; Countryeconomy.com13
10 As at 24/04/18 11 As at Jan 2018 12 As at 23/04/18 13 https://countryeconomy.com/bonds

65
5.5 Lack of a coordinated market strategy towards introduction of new products and services
Response from interviews with market players have also questioned the current approach towards the
introduction and launch of new capital markets instruments. The argument has been that introduction
of new products should informed by prior research findings with respect to respective product to
determine the demand of the instruments prior to launch as well as promotion of investor awareness on
the said products and services. The question remains as to whether it is the potential issuers who should
be conducting assessment of their products, or the Authority or this should be a joint-stakeholders
approach
5.6 Supply Side; Reluctance of Market Intermediaries
Licensed intermediaries within the Kenyan market space are observed to be reluctant in developing their
respective niche. They remain complacent with earning commissions, fees and levies earned from
intermediating traditional instruments coupled with their general risk averseness towards innovations,
given limited financial resources.
The Kenyan Capital Markets have an array of intermediaries licensed by the Capital Markets Authority
including stockbrokers, investment advisers, and investment banks amongst others. The Authority
currently has 90 licensees.
5.7 Demand Side; Structural problems from demand side
As a key challenge faced by most Capital Markets in sub Saharan African, the Authority outlines limited
capacity of investors (both institutional and retail) in the understanding of capital markets products and
services in terms of their functionality and expected returns.
Most investors make conclusions on the complexity of investing in capital markets instruments from a
point of ignorance thus calling for increased education and capacity building of various players such as
trustees of pension and insurance firms, retail as well as fund managers investing on behalf of clients.
6 Jurisdictional Review
6.1 Asia
According to analysis and review done by the OECD Equity Markets Review Asia 2017, Asian companies
have used public stock markets to raise a total of USD 4 trillion in equity capital since the turn of the
millennium. This is equivalent to the combined size of the entire Indian and Korean economies in 2016.
Today, Asian companies are the world’s largest users of public stock markets, with initial and secondary
public offerings (IPOs and SPOs) accounting for 47% of all public equity capital raised in the world. As a

66
result, stock exchanges in Asia have emerged as the world’s fastest growing trading venues for listed
stocks and several domestic investment banks in the region have started to establish themselves as
global actors.
Local banks have increased their market shares in almost all Asian markets; not only in terms of equity
transactions, but also in other capital market activities, including corporate bond issuance. The rapid
growth in Asian capital markets has been underpinned by the extensive use of public equity markets by
Chinese companies. In fact, since 2009, Chinese companies have also come to dominate the global scene
for initial public offerings.
Companies from other Asian emerging markets such as Malaysia and Indonesia have also increased their
use of public equity markets. While a striking feature of many advanced markets around the world is the
structural decline in IPOs by growth companies, growth companies still represent an important share of
public equity offerings in advanced Asian markets such as Korea and Japan from 1997 to 2004, at least
80% of all equity capital raised by Asian companies was through offerings in the company’s local market.
In five of the years between 2005 and 2016, however, offerings in other markets exceeded 40% and
reached almost 60% in 2005 and 2014.
Figure 16 : IPOs by Asian Companies in local market and other markets
Source: OECD Equity Markets Review: Asia 2017 dataset

67
Every year since 2005, when the share of other markets started to increase, Hong Kong, China has been
the single largest recipient of Asian company listings outside the local market. The only exception is 2014
when a very large Chinese technology company (Alibaba) listed in the US. The US has always been the
main market for Asian company offerings outside the region. In some years before 2008, there were also
a considerable amount of transactions in European markets but this has largely come to a halt. It should
be noted that nearly all proceeds raised by Asian companies in Hong Kong, China were raised by Chinese
companies. During these years (2005-2016), China recorded high GDP growth rates averaging 9.5% with
the peak witnessed in 2007 when its GDP growth rate hit 14.2%.
One important consequence of the increased use of public equity financing by Asian companies and their
reliance either on local markets or other Asian stock markets has been an increasing share of the Asian
stock market in global public equity offerings. The share of Asian markets has grown steadily during the
last 20 years and reached 46% of global volume of IPOs in 2016.
Table 18: Largest 20 IPOs in Asia between 1990 – 2016

68

69
Table 19 : Key Statistics of Stock Exchanges in the Asian Region
The OECD report further summarizes nine points as findings from the review of the Asian public equities
market. These include:
1. That since 2000, Asian companies have raised USD 1.2 trillion through initial public offerings and
USD 2.6 trillion through secondary public offerings. Companies from the People’s Republic of
China (China) have been the largest issuers, raising 43% of all public equity in the region, followed
by companies from Japan (17%); Hong Kong, China (11%); Korea (8%) and India (7%).
2. That nearly three quarters of all equity capital raised in Asia since 2000 went to non-financial
companies. The largest share of the capital raised through IPOs went to industrial firms, while
consumer product firms accounted for the largest share of funds raised through SPOs. In three

70
out of the five largest Asian markets, the share of public equity raised by high technology firms
has declined since 2008.
3. That while growth company IPOs (below USD 50M) have almost disappeared in the European
Union and the United States during the last ten years, equity markets for growth companies
remained strong in several Asian countries, including Japan, Korea and Hong Kong, China. Over
the last three years, Japanese growth companies have on average raised almost USD 1 billion per
year.
4. That a limited number of sectors account for the majority of Asian growth company IPOs. In
Japan, for example, companies from the technology and healthcare sectors have accounted for
40% of all growth company IPOs between 2013 and 2017. The share of technology sector IPOs
was also high in China and Korea. On average they accounted for 17% of all public equity capital
raised in these two countries.
5. That during the last decade, Asian companies have increased their listings outside their local
market. The most common destination for Asian companies that list outside the local market has
been Hong Kong, China. Apart from some high-profile exceptions, relatively few IPOs by Asian
companies are made outside the region. As a consequence, stock markets in the region have
steadily grown their share of global public equity offerings (IPOs and SPOs) over the last 20 years
from 16% in 1997 to 46% in 2016. Outside of Asia, the US has been the most popular destination
for Asian companies that choose a foreign market for their listing.
6. That a look at the 100 largest listed companies in 12 of Asia’s largest stock markets reveals a
relatively high degree of ownership concentration at company level. In more than half of the 12
markets, the three largest shareholders on average hold the absolute majority of the company’s
capital. Japanese and Chinese Taipei corporations have the lowest levels of ownership
concentration, with the three largest owners holding 24% and 27%, respectively.
7. That there is a high degree of government ownership in large listed companies in Asia. An
analysis of a simple binary classification of the 100 largest listed companies indicates that, in nine
out of 12 markets, higher Government ownership is associated with lower company
performance. In 10 of the 12 markets, larger average government ownership also tends to be
associated with higher corporate leverage.
8. That developments in Asian capital markets have not been limited to the surge in public equity
markets. Asia’s global share of corporate bonds, syndicated loans as well as mergers and
acquisitions, has also grown significantly. Asia’s share of the global corporate bond market has

71
more than tripled from 10% a decade ago to almost 35% in 2016 and the share of global Merger
&Acquisition activity has increased from 10% to 30%.
9. Bolstered by this increase in capital market activities, banks from China, India and Korea have
on average between 2011 and 2017 gained more than 20 percentage points in their domestic
market shares of investment banking activities. Another effect of the surge in Asian capital
market activity is that several Asian banks now have emerged as important global actors.
6.3 Regional Review
According to a working paper by the International Monetary Fund titled “Stock Market Development on
Sub Saharan Africa,” authored by Charles Amo Yartey and Charles Kemia Adjusi, there has been a
considerable development in the African Capital Markets since the early 1990s. Prior to 1989, there were
just five stock markets in Sub-Saharan Africa and three in North Africa.
Today there are 19 stock exchanges ranging from startups like Uganda and Mozambique stock
exchanges to the Nigeria and Johannesburg stock exchanges. Apart from South Africa, most African
stock markets doubled their market capitalization between 1992 and 2002.
The rapid development of stock markets in Africa does not mean that even the most advanced African
stock markets are mature. In most of these stock markets, trading occurs in only a few stocks which
account for a considerable part of the total market capitalization. Beyond these actively traded shares,
there are serious informational and disclosure deficiencies for other stocks.
Indicators of stock market development such as number of listed companies, market capitalization, value
traded and turnover show that African markets are small with few listed companies and low market
capitalization.
African stock markets suffer from the problem of low liquidity. Liquidity as measured by the turnover
ratio is as low as 0.02 percent in Swaziland compared with about 29 percent in Mexico. Low liquidity
means that it will be harder to support a local market with its own trading system, market analysis,
brokers and the like because the business column would simply be too low
According to Barclays Africa Group Financial Markets Index Report 2017, South Africa was ranked the
highest scorer across all indicators, reflecting its highly developed market infrastructure and deep
connections with other countries in the region, as well as its role as an intermediary for financial market
participants from countries outside Africa to access the continent. The market capitalization of listed

72
companies in South Africa stood at over 350% of GDP at end-2016, with turnover (the ratio of equities
traded to total market capitalization) at 41%.
On the turnover ratio, Egypt had the highest equity turnover ratio, at more than 54%, though its total
market capitalization is just under 11% of GDP. Across other countries tracked as part of the index,
market capitalization averages 27% of GDP, when excluding Botswana and South Africa. Kenya remains
slightly above the average at 28% of GDP.
Bond markets show a similar pattern. Except for South Africa and Kenya, low trade volumes are the
norm, despite high nominal figures for bonds outstanding in many countries. This partly reflects the
nature of domestic investors, which tend to be large buy-and-hold institutions. While low market activity
is reflected in the low score for liquidity indicators across the index countries, except for South Africa and
Egypt, the situation is gradually improving.
According to respondents to the Official Monetary and Financial Institutions Forum (OMFIF) survey of
African financial institutions (2017), there have been increases in liquidity conditions in Botswana, Ivory
Coast, Mauritius and Nigeria, reflecting progress on the speed of transactions as well as the cost of listing
or accessing assets.14
On market transparency, tax and regulatory environment, the Barclays report equally finds that South
Africa ranks highest in terms of availability of external credit rating as its sovereign debt is rated by all
three main international agencies and it has the highest number of corporate ratings of any of the index
countries. This factor could have resulted in increased activity by foreigners as credit ratings remain a key
consideration by foreign investors in determining where to put their money.
Figure 17 : Top Country Scorers in Pan-African Corporate Credit Rating
14 https://www.omfif.org/media/3677495/barclays-africa-group-financial-markets-index-2017.pdf

73
Source: Barclays Africa Group Financial Markets Index Report 2017
South African corporates combine a total 85 ratings by S&P, Moody’s and Fitch, against 28 in Mauritius,
the next highest-scoring country. Nine countries in the index have no corporate credit ratings at all.
Although Egypt and Kenya have a low number of corporate ratings, they have relatively high liquidity
scores for equity and bond turnover. This suggests that an increase in the number of ratings by
international agencies and the development of domestic ratings agencies could lead to a significant catch
up with South Africa’s dominant liquidity position.
Further, regulatory coordination and harmonization are important for reducing the costs of compliance
and accelerating market development. This is an important consideration not just for attracting foreign
investors but also for boosting the participation of local investors, including pension funds and insurance
companies. This is a primary concern for many securities exchanges seeking to increase market activity
and raise liquidity.
Development of domestic assets that are attractive to local investors, and the creation of a regulatory
environment that helps increase local investor capacity, are fundamental to boosting local financial
markets.
On the capacity of local investors, the survey finds that on average, 50% of institutional investors in Africa
allocate a portion of their portfolios to assets outside their own market, although their investments
remain largely within their own regional bloc.15
15 https://www.omfif.org/media/3677495/barclays-africa-group-financial-markets-index-2017.pdf

74
As examples, Namibian investors are active in South African markets and Kenya is active in the Mauritian
market, reflecting the high liquidity of these locations.
A key consideration for developing local markets is to increase the range of product offerings attractive
to domestic investors. A fundamental question for Kenya as a jurisdiction would be, are the newly
introduced capital markets products attractive and favorable to domestic investors? If not, what
measures can be taken to make them attractive to domestic institutional and domestic retail investors
the former of which hold significant assets under management for placing in capital markets
instruments.
Some identified solutions to solve this include; developing exchange traded funds and improving brokers’
marketing of these products. Additional ways of increasing attractiveness include ‘enticing listed
companies to increase free float’, and persuading non-listed companies to seek a stock market listing.
Growth in the capacity of local investors, as well as the size of listed assets, depend, in part, on the
prospects for economic growth and stability in the coming years.
Despite the problems of small size and low liquidity, African stock markets continue to perform
remarkably well in terms of return on investments.
Developing countries have tried in different ways to attract new capital available in international
markets. One way to attract this capital was through financial liberalization, which mostly took place in
the late 1980s and early 1990s in developing countries, some years after developed countries had
liberalized their financial systems.16 Financial liberalization took many forms including allowing for the
following;
6.4 Global Performance of the Capital Markets by Product
6.4.1.1 Bond markets performance
Bond markets constitute a significant asset class in Capital Markets investments, with Treasury bonds
accounting for one of the highly invested asset class due to its risk-free characteristics nature. Maturity
structure of government debt has been a key discussion point for investors. A broad concern is related to
the risks associated with excessive reliance on short-term borrowing, an aspect usually associated to the
recurrent financial crises in developing countries. But why do emerging markets borrow short term in
spite of the associated risks? One answer could be that short-term debt reflects an optimal risk allocation
between lenders and borrowers, which arises from the balancing decision between the higher cost of
borrowing long term and the higher risks associated with short-term debt. In particular, the cost of long-
16 Handbook of research on stock market globalization

75
term issuance is normally much higher than short-term one, and the larger this excess the higher the
incentives for countries to rely on short-term debt.
6.4.1.2 Building blocks of local debt markets
The development of new domestic debt markets depends on a number of factors. First, the market
requires domestic savings. Institutional investors play a significant role in facilitating mobilization of
domestic savings through structured collective investment schemes which offer affordable Capital
Markets instruments for investment, mainly by retail investors under professional management. Such
investors range from pension funds, insurance companies, and mutual funds, to banks. Second, there
needs to be a sufficient number of borrowers including the sovereign, quasi-sovereigns, corporates,
financial institutions, project companies, municipalities, small and medium sized businesses,
homeowners, and consumers. Third, a proper legal and regulatory framework for bankruptcy, tax, and
corporate governance issues needs to be in place. Fourth, the market requires an infrastructure of
arrangers, clearing agents, exchanges, and market makers in order to function properly. Fifth,
professional credit rating agencies are needed to establish standards for risk measurement in the local
market. With these conditions in place, national scale credit ratings offered by international and
domestic credit rating agencies begin to play a major role.17
6.4.1.3 Stock Market Performance
The performance of stock markets in many emerging economies has also been disappointing. While
stock market activity increased in most of these countries, this increase has differed substantially across
regions. Market activity in Latin America has grown at a slower pace, with markets being much smaller
than those in East Asia. For example, stock market capitalization relative to GDP was just under 42
percent in Latin America at the end of 2004, compared to 94 percent in G-7 countries and 146 percent in
East Asia. Regional differences are more striking when comparing trading activity, a good proxy of
liquidity. Value traded relative to GDP in Latin American stock markets was only six percent during 2004.
On the other hand, the value traded in East Asian and G-7 stock exchanges over the same period reached
105 and 92 percent of GDP, respectively. Another feature of the poor development of stock markets in
many countries is the high concentration of trading and capitalization in very few firms. This lagging
17https://www.ifc.org/wps/wcm/connect/a6862500495ce9db9d13bd19583b6d16/Euromoney%2BGlobal%2BSecuritisation%2BReview%2B-%2BStructured%2BFinance%2Bin%2BEmerging%2BMarkets.pdf?MOD=AJPERES

76
development in Latin stock markets has also been manifested in the de-listing of firms and migration of
large companies to major international stock exchanges, as described below.18 These latter trends have
been pronounced in Latin America and Eastern Europe; in contrast, several East Asian countries have
seen an increase in the number of companies listed in their domestic stock markets.
6.4.1.4 Structured Finance Transactions
Structured financing is an extension of asset securitization, which adds a degree of complexity to the
basic process. In structured financing, the traded securities created by the securitization process are
structured into several classes of derivative securities with different characteristics and sold to investors
with investing needs matching those characteristics. Structured financing has added value to the basic
asset securitization process and has served to further develop the growth of asset backed financial
markets.
The development of structured finance transactions, which help to convert illiquid assets into tradable
securities, has been an important financial innovation of the last decades. In the case of emerging
economies, the development of this type of transactions started relatively slowly in the early 1990s and
was hampered by the lack of an adequate legal structure. The volume of transactions has increased
significantly in recent years, but structured finance markets in most emerging economies are still
relatively small.
6.4.1.5 Cross-Border Debt Financing
Local borrowers in the emerging markets have often incurred a significant asset and liability mismatch
in currency and maturity. This mismatch, coupled with the currency devaluation that generally occurs
during an economic crisis, has often led to a ballooning of corporate liabilities and the virtual evaporation
of new and existing financing. Effects on the corporate and financial sectors have usually been crippling.
As a consequence, yield and supply for debt issues in the emerging markets have shown high volatility.19
18http://siteresources.worldbank.org/DEC/Resources/DelaTorreandSchmuklerEmergingCapitalMarketsandGlobalization.pdf 19https://www.ifc.org/wps/wcm/connect/a6862500495ce9db9d13bd19583b6d16/Euromoney%2BGlobal%2BSecuritisation%2BReview%2B-%2BStructured%2BFinance%2Bin%2BEmerging%2BMarkets.pdf?MOD=AJPERES

77
6.4.1.6 Asset Securitization
Asset securitization has been recognized by eminent academics as the most important engine of reform
in our financial systems. (Greenbaum and Thakor 1995). and is viewed as a revolution in the banking and
financial services industry by industry practitioners.
In its simplest form, it is a process where illiquid assets owned by a financial institution, are pooled and
sold in the legal or economic sense to a third party referred to as a Special Purpose Vehicle(SPV). The
SPV in turn issues securities backed by these asset pools in financial markets to the general public, usually
after obtaining some form of credit quality enhancement to the securities. Securities marketed in this
manner are referred to as Asset Backed Securities.
In its traditional form asset securitization was adopted by financial institutions to achieve one or more of
the following objectives:
To reduce the regulatory capital requirements required to be maintained under the 1988 Basel
accord.
As a means of access to sources of financing under more favorable terms.
To rectify mismatches in the maturity of their financial assets and liabilities and for liquidity
management; and
To balance the exposure of their balance sheet assets to different economic and geographical
sectors.

78
7 Lessons from other Jurisdictions
Several countries have adopted different approaches towards increasing activity within their capital
markets. Some of the initiatives undertaken include;
7.1 Foreigners accessing domestic markets
As part of the liberalization process, governments and firms actively raised capital in international
financial markets and foreigners could invest in domestic markets. Financial liberalization also implied
that international financial institutions could enter developing countries through a number of
mechanisms including, purchasing local banks and establishing local branches or subsidiaries.
It is important to note that Kenya has made significant progress on this front following the removal of
the requirement for companies to institute local ownership as per an initial requirement of 75% foreign
ownership.
7.2 Privatization
According to the Handbook of research and stock market globalization, 2011 by Y. Cassis, A. de la Torre
et al, another way to attract foreign capital was through the privatization process.
Privatization directly shifts the focus from political goals to economic goals, which leads to development
of the market economy (Poole, 1996). Arguments for privatization include, that the public sector is not
highly motivated to maximize production and allocate resources effectively, causing the government to
run high cost, low-income enterprises.
Privatization has served as a vehicle for promoting the development of the equity market in countries
where the capital market is not well-developed.20
A remarkable wealth of evidence shows the correlation between financial market development and
privatization. For instance, stock market capitalization (trading volume) in developed countries outside
the US grew from a little over $US 1.5 trillion ($ 460 billion) in 1983 to more than $US 18 trillion ($ 17
trillion) in 1998, while massive privatization plans were in progress (Boutchkova and Megginson, 2000).
Yet stock markets develop also in the absence of privatization.
Privatization often brings into the market new industries (such as telecommunication and utilities) thus
potentially increasing domestic investor’s diversification opportunities, which in turn affects liquidity.
20https://www.dse.co.tz/sites/default/files/dsefiles/6.%20Privatization%20as%20a%20vehicle%20for%20promoting%20capital%20market%20development%20and%20financial%20inclusion%20%28II%29_0.pdf

79
Another feature of major privatization sales is the cross-listing of stocks, i.e. the floating of the company
both in the domestic and international exchanges. This privatization strategy may enlarge the
participation of foreign investors and overcome informational barriers to foreign investment (Chiesa and
Nicodano, 2003). Thus, floating State-Owned Enterprises(SOEs) on foreign markets could boost liquidity
in home markets. The Government has set the stage for this through the planned dual listing of the
National Oil Corporation.
Improved diversification opportunities and information trading – leading to deeper and more liquid
markets – can stem from any private IPO. But the IPO of privatized SOEs should in principle have an even
larger effect, as often Share Issue Privatization (SIP) involves the floating of companies in industries that
were not previously traded. Indeed, in most European countries, telecommunications, energy, and
utilities were entirely under state ownership before privatization.
For a privatization program to gain momentum, early sales have to succeed. This suggests privatizing
the easy candidates first. Unfortunately, the pressures on governments mean that they are often
tempted to pass on the headaches first: the loss-makers, the indebted, the already-closed-down, and so
on. In many ways achieving a sale represents success in privatization-the mere fact that private investors
have been found who are prepared to risk their own money on the company indicates that they believe
they can make it work, and creates an incentive for them to do so. The slow pace of sales, the reluctance
to place the highest-potential assets on the market, the failure to sell all shares, poor business and legal
environments, and the deficiencies of government regulation and administration— —all combine to
place African states in a dead heat with Middle Eastern and North African countries for the title of “region
with the least foreign investment in infrastructure privatization.
Experience such as Guinea’s shows that privatization is more likely to result in increased efficiency and
improved equity outcomes if it is embedded in a set of conceptually appropriate, functioning legal and
economic institutions that support and guide market operations. These include: The definition and
protection of property rights; contract enforcement and commercial dispute settlement through lawful,
peaceful means, or, more broadly, court decisions that are timely and based on the rule of law; a degree
of regulatory capacity; functioning bankruptcy/insolvency regimes; and a public administration that
meets modicum standards of predictability, competence and probity and thus lowers transactions costs.
If these institutions are not in place and working, privatization will produce sub-optimal, perhaps
negative outcomes.21
21 https://ageconsearch.umn.edu/bitstream/12200/1/wp050127.pdf

80
7.2.1 Kenya’s Experience with Privatization
In Kenya, a positive story is also told of the privatization effect. An analysis of 47 new IPOs and
subsequent listings on the Nairobi Securities Exchange between 1984 and 2007 that raised Kshs 50
billion, reveals that successful (oversubscribed) IPOs by State Owned Enterprises, generated significant
interest in the market, thus attracting a good number of private companies. Kenya Commercial Bank
(KCB)’s 327% subscription in 1988 immediately brought onboard companies like Total Oil Company
(106%), Nation Printers (113%) and Standard Chartered Bank (233%).
Housing Finance Corporation of Kenya (HFCK) IPO of 1992 which was 303% subscribed, similarly
attracted new companies like Crown Berger, East African oxygen (BOC), NIC, Firestone, Rea Vipingo and
East African Portland Cement to the stock market over the following five years.
Additional issues by KCB in 1999 and 2004 brought in companies like Athi River Mining, Pan African
Insurance, African Lakes, Standard Newspapers, Diamond Trust, Scan Group and Eveready Without
doubt, therefore, privatizations through the NSE was a catalyst for capital raising and listing by private
enterprises.
This trend has similarly been observed in several other jurisdictions notably India, China, New Zealand,
South Africa and Egypt.
7.2.2 Lessons from privatization exercises in different countries
1. Outsourcing institutional provision, for example by contracting regulatory conception and
monitoring activities from skilled outsiders. This was successfully carried out (prior to the
escalation of violence) in the case of the Palestinian Water Authority in Gaza, in a situation of
extraordinary institutional and political difficulty.
2. Use private firms to carry out administrative functions that impede investment and
privatization, and harm the general business environment. For example, British Crown Agents
have been contracted to handle procurement on a range of government contracts in a number
of low-income countries, including Bolivia and Mozambique. This should speed the contracting
process and save money by lowering transaction costs and side payments.

81
3. Promote offshore commercial arbitration mechanisms; e.g.; several small island states in the
Caribbean use British courts to arbitrate contractual disputes between governments and private
providers.
4. Use respected NGOs, such as Transparency International, to vet transactions and certify the
probity of the sales process, as has been done for example in a telecommunications license
auction in Slovakia.
5. Use International Financial Institution guarantees to give comfort to investors regarding
regulatory and contractual risk. For example, the World Bank offers investors partial risk
guarantees insuring against sovereign, political and regulatory risks; e.g., state failure to meet
payment obligations, disallowance of stipulated tariff hikes, expropriation, legal changes with
adverse material effects on the investor, availability and convertibility of foreign exchange, etc.
Partial risk guarantees in Ivory Coast and Uganda infrastructure privatizations have helped to
mobilize financing and co-financing, lengthened maturities far beyond prevailing market terms,
and significantly reduced interest spreads. Since the guarantee backstops only the contractual
agreements states make with investors, governments incur no additional contingent liabilities.27
Fees for the guarantee are born by the investors. (Gupta et al., 2002).
6. To address the problem of small or deficient equity markets, the use of regional exchanges
should be encouraged.22
In terms of growth, private firms are found to be more efficient than state enterprises, especially in
competitive industries. A range of policy variables—fiscal discipline, price and trade liberalization,
deregulation, privatization, clarification of property rights—are important for determining growth.
Taken individually, they may have only a limited effect on growth, but together they are strongly
associated with rapid expansion.
More recently in 2017, the Brazilian government announced its largest privatization package since the
1990s to bolster investment in order to revive the economy. A total of 57 companies have been
earmarked in the package, including the Brazilian Mint which prints the country's currency and passports,
14 airports, 15 port terminals, and the largest energy company in Latin America, Eletrobras with most
auctions expected to take place in 2018.
22 https://ageconsearch.umn.edu/bitstream/12200/1/wp050127.pdf

82
The Brazilian Government aims to raise some 44 billion reals (14 billion U.S. dollars). This is considered
part of its policy towards addressing persistent budget deficit which had since soared to $17.8 Billion as
at the first half of 2017.23
Thus privatization, if conducted under minimal political interference and under transparent transactional
advisory services can result to increased efficiencies; a key prerequisite towards increasing profitability
of companies.
7.3 Emphasized Role of Financial Intermediaries
Efforts have also been made towards investing in the role of financial intermediaries as they may reduce
the costs of acquiring and processing information, improving resource allocation and fostering growth.
Without intermediaries, each investor would face the large and (mostly) fixed costs of evaluating
business conditions, firms, managers, etc. in order to allocate her savings. Financial intermediaries arise
to undertake the task of researching investment opportunities and sell this information to investors.24
7.4 Tax Incentives
Tax incentives remain an important tool to attract Foreign Direct Investment into jurisdictions. Kenya
adopted the use of tax incentives that facilitate investments in Capital Markets instruments such as ABSs,
REITs, and Islamic Finance instruments amongst others since 1995. Though there lies a positive
correlation between the availability of tax incentives and attraction of Foreign Direct Investment, the
actual impact in terms of resulting number of Capital Markets products issuance continues to be debated
in different policy forums.
7.5 Legal Framework
Legal framework remains a primary requirement for Capital Markets operations globally hence the
importance attached to regulation of Capital Markets globally as a way of protecting investors as well as
offering rules of operation for investors. However, to attract more capital for investments in their
jurisdictions, countries have revised their legal frameworks to expand the scope of qualified Capital
Markets investors. Most countries, both developed and developing have reviewed their legal framework
to include alternative listing boards on their exchanges offering fewer legal requirements and reduced
23 http://www.xinhuanet.com/english/2017-08/24/c_136551721.htm 24 Emerging Capital Markets and Globalization – The Latin American Experience by Augusto de la Torre and Sergio L. Schmuker

83
costs to listing with SMEs being the greatest beneficiaries. The impact has been increased number of
listings on exchanges as majority of businesses, especially in the African continent are structured as Small
and Medium Enterprises.
7.6 Mandatory listing requirements
This is an approach that has been adopted by other countries such as Croatia. The adoption of the Law
on Securities Market in mid-2002 marked the turning point in the Croatian capital market development.
The listing of shares became mandatory not only for privatized companies, but for all companies
regardless of their ownership structure. The law obliged established Croatian companies having more
than 30 million kuna shareholders’ capital, equivalent to Kshs 495 Million or more than 100 shareholders
to list their shares in the capital market by mid-2003. More recently, Tanzania through its Finance Act,
2016 introduced amendments to the Electronic and Postal Communication Act (EPOCA), 2010 requiring
telecommunication companies to list their shares to the stock exchange market with a deadline of
January 2017. The move was intended to enhance local ownership of the telecommunication companies
as well as enhancing transparency in financial accounting and ultimately facilitate revenue
accountability.
Kenya does not intend to use the Mandatory Listing option.

84
8 Other Evidence on Low Uptake - Resistance towards implementation of block trading
Block trading is the trading of large blocks of shares which is often undertaken at a price different from
that currently available in the market. Exposing such large orders to the market can impact that price.
The CMMP recommends that a facility should be provided so that large blocks of stock can be traded
directly between brokers and then reported after the fact to the exchange. To achieve this the Authority
has to develop rules to determine what size of transaction constitutes a block trade, what deviation from
market prices is allowed and to ensure that such trades are reported to the market (and the prices
distributed) within a reasonable time frame (which may depend on the size of the block traded). Such
rules are needed in order to prevent liquidity moving to a dark pool of trading that is not seen by other
investors.
Block trading is a short-term activity in the master plan under working group two. The authority
developed a research paper on block trading in 2017 which was put through stakeholder engagement at
the working group level. Some of the key recommendations and proposals to the market by the
Authority regarding the re-introduction of block trading included;
i. Only institutional investors and high net worth individuals trading on the minimum threshold
for a block trade should participate;
ii. In order to encourage Block trading in Kenya, the values can be revised downwards. For
instance; instead of KShs 50 million, the threshold can be revised to KShs 25 million;
iii. The price for the blocks be negotiated between the counterparties and be subject to floor
and cap price of ± 1 % of the ruling market price/ previous day closing price;
iv. Engagements with the Nairobi Securities Exchange to appraise the Authority on the existent
block trading rules, procedures, frameworks and strategies at the NSE;
v. A sensitization of the existing licensees by internationally experienced block house/broker
on how to block trade without upsetting the market;
vi. A training session with other stakeholders to create awareness of block trades and the
minimum thresholds for the same; and
vii. The setting up of a separate market where block trading would take place. This market could
operate independently but be overseen by an Exchange.
The authority faced road blocks in the implementation of the re-introduction of block trading after
engagements with stakeholders at the working group level where two joint working group 2 and 3
meetings were held. The stakeholders engaged in the consultations involved NSE, CDSC, KASIB and
FMA.

85
Details of feedback received from each of the stakeholders engaged, namely NSE, CDSC , KASIB and
FMA are captured in Annex 1 below.

86
9 Recommendations
It is determined that there is a significant correlation between the increased voluntary license revocation and the low uptake of capital markets
products.
To address the challenges identified to ensure successful rollout, issuance and increased activity and participation in the capital markets industry,
the following recommendations are made.
Table 20 : Key Findings and Recommendations relating to Listings and Product uptake)
Finding Recommendation
1. Reluctance to identify and implement bold,
innovative measures to genuinely attract large
private and public potential issuers to list at the
Nairobi Securities Exchange
Encourage a capital market local content policy that enjoins companies
operating in critical sectors of the economy such as energy, oil and gas, financial
services, telecommunications, and mining sectors to list a minimum percentage
of their shares on exchanges within 5 years of commencement of operations.
This has been adopted in several countries with the most recent being
neighboring Tanzania. Through its Finance Act, 2016 Tanzania introduced
amendments to its Electronic and Postal Communication Act (EPOCA), 2010
requiring telecommunication companies to list their shares to the stock
exchange market with a deadline of January 2017 with the aim of enhancing local
ownership of the telecommunication companies as well as enhancing
transparency in financial accounting and ultimately facilitate revenue
accountability. This creates room for transparent pricing mechanisms with the
public being the ultimate beneficiaries of favorable market prices. Kenya is home
to a good number of corporate entities in strategic sectors of the economy that
can be considered in effecting this policy. These include Fast Moving Consumer

87
Goods entities such as Bidco, KENAFRIC, Tuskys, Brookside and Unilever who
enjoy relatively high profit margins. Others include Airtel.
Additionally, fully leverage Kenya’s prime-mover position globally in innovation
through implementation of principles-based regulation to support use of
FinTechs to enhance financial inclusion and mobilize savings across the
continent.
Step up structured sustained outcome based on face-to-face engagements with
potential issuers on the listing experience to appreciate the benefits accruing to
capital raising and subsequent listing on the Nairobi Securities Exchange, such
as low financing costs and increased profile and debunk the perception of high
regulatory listing costs.
2. While empirical data demonstrates the
obviously lower relative cost of financing in the
capital markets compared to bank lending
rates, there has been random, un-sustained
and unstructured engagement with
stakeholders by the Authority and
intermediaries who are often an
unrepresentative focus group of the market.
Without question the capital markets is a
cheaper option for obtaining finance compared
to bank lending rates as demonstrated in
higher activity in the primary equities market
Step up structured sustained outcome based on face-to-face engagements with
potential issuers to appreciate the benefits accruing to capital raising and
subsequent listing on the Nairobi Securities Exchange, such as low financing
costs and increased profile and debunk the perception of high regulatory listing
costs. In the long term, the Authority could consider establishing a training
institute that offers training on capital markets related subjects to grow the
knowledge base as well as ensure improved research and development in line
with the ever-dynamic innovations in the industry.
Fully implement the regulatory sandbox model to support use of FinTech’s to
support capital markets access. The role of financial technology in transforming
business operations cannot be overemphasized as innovations continue to flood
the financial services industry. Adoption of new technologies by both businesses

88
when interest rates were on a rising trend, but
the opportunity has not been taken and there
remains a perception that regulatory costs are
high.
and regulators will improve efficiencies in engagements and could result in
reduced turnaround times for operations. CMA’s approach to incorporating
technology in both its internal processes and encouraging innovations is through
its regulatory sandbox model that aims to establish a framework that will
support technological innovations aimed at improving operations within the
capital markets under a laxed regulatory environment as products are
developed, tested and eventually rolled out to the larger population of
consumers.
Continue implementing CMMP reforms/recommendations meant at spurring
market activity and creating sufficient interest/excitement in the market to
attract potential issuers.
3. Empirical data illustrates that new listings have
traditionally been catalyzed by a well
performing secondary market driven by a
similar rise in general economic growth as well
as rising GDP growth rates and Government
policy announcements such as privatizations
through the capital markets.
The Government of Kenya remains the largest economic player in the Kenyan
market with a rich number of state owned enterprises from a diverse mix of
sectors and industries such as the oil and energy sectors amongst others. A key
principle followed by investment managers in determining where to put their
monies is based on the concept of diversification as a measure towards ensuring
returns are maximized. Participation of Government SOEs on the NSE through
privatization would give the much-needed impetus to secondary market trading
as investors are given a wider choice set to work with in determining their
investments. In this regard, it is proposed that the Government reintroduces and
re-energizes a structured time-bound privatization programme through the
Nairobi Securities Exchange targeting few eligible large cap State Owned
Enterprises (SoEs) in key sectors such to catalyze (generate excitement) in the

89
market, and to provide a new impetus to and guide on perfect timing for capital
raising and listing by equally large private firms
4. Potential issuers are discouraged from raising
capital and listing by restrictive traditional
provisions in the Law that prescribe specific
minimum requirements on ownership by
anchor investors as well as minimum number of
investors that are unattractive;
Literature review from countries with well-developed markets indicate that
frequent review of laws and regulations is considered best practice for
regulators as a method of ensuring live changes in business environment and
operations by businesses are considered in the regulations to ensure
facilitation rather than deterrence towards active participation in the markets.
To this end, we recommend that regulators be engaged in continuously
reviewing, identifying and amending restrictive provisions in the capital
markets and related Laws that are unattractive to capital raising and listing. As
a starting point to this exercise, the Authority has identified the need to work
on two key areas;
Amend the requirements for minimum free float, profitability track records,
paid up capital and number of investors as a prerequisite for listing approvals
especially where they are unjustified;
i. Introduce creative alternative policies aimed at addressing concerns
around loss of control by anchor investors such as new classes of shares
with non-voting rights;
(Details on the exact proposals towards change in regulatory
requirements is captured in a table below)
5. Private Equity firms are on the rise and hugely
successful in providing virtually free and easily
accessible capital to SMEs, with the added
It is no secret that the size of the private equity market space in Africa, and more
so in Kenya has grown significantly in the recent past. The WB/IFC is particularly

90
benefit of enhancing professional management
and governance of such firms;
largely involved in financing small businesses showing great potential in the
market with a good example being the Goodlife chain of pharmacies amongst
others. While we wish to view private equity investments as complementary to
the capital markets activities, it is important to state that this can only be
referenced with certainty when private equity firms consider exiting through
initial public offers. Thus, to ensure the public equally benefits in the profits of
well performing businesses, the Authority will be engaging with private equity
firms to consider exit mechanisms through the capital markets.
6. There is emerging stiff competition from other
investment/quick return vehicles that seem to
promise better short term returns as opposed
to long-term characteristic of Capital Markets
investments returns e.g. real estate, mobile
money products, gambling etc. as betting firms
like Sport pesa have attracted a huge youth
following promising “jackpots” in the short
term.
Focused and targeted investor education and public awareness programs
targeting the youth to demystify the sustainable long-term nature of the capital
markets as opposed to gambling activities.

91
7. Reputation risk exposure of potential issuers to
post-offer/listing price correction and in some
instances complete price collapse despite
professional valuation. This has been clearly
observed with recently listed firms whose share
price collapse has painted a wrong picture not
just of the individual firms but the public
markets in Kenya as a whole.
8. The absence of a clear policy and action plan
towards compensation/restitution of bond
investors whose funds remained locked in and
inaccessible from Chase and Imperial Banks has
resulted in a bonds currently being an
unpopular capital markets product. This has
been exacerbated by failure by the KDIC and
CBK to implement Section 39 of the KDIC Act to
the letter leading to high likelihood that they
will be treated as ordinary depositors upon
resolution of the banks.
Despite successful IPOs in the past, such as Safaricom, Kengen, EABL amongst
others, questions abound on the credibility of valuations of shares pre-listing
given an observed trend of considerable fall in share prices post listing. A good
example given historically is the Safaricom share whose listing price was valued
at Kshs 5 but suffered loss in value post listing leading to the company’s share
trading at a low of Kshs 2. This has raised questions on the ethical standing of
both issuers and lead transaction advisors in the book building process. To
address this, the Authority recommends to reevaluate the current securities
valuation approach to introduce requirements around its governance integrity
and transparency the introduction of valuation incentives (rewards and
penalties) to addressing inefficiencies. This will play a significant role in
ensuring public trust is earned.
Further, the CMA to consider oversight of Lead Transaction Advisors through
licensing as a way of making them accountable for significant divergence in
pre- and post-listing prices.
Speedy implementation of section 39 of the KDIC Act in line with the
segregation of client accounts to the letter required to ensure funds of
depositors is protected from interference by corporations.
Policy pronouncement followed by expedient repayment of Chase and
Imperial Bank bond holders key to restoring confidence and resumption of
vibrant activity in the corporate bond primary market
Source: CMA/KASIB/NSE/CDSC

92

93
10 Conclusion
The Capital Markets Authority is a respected institution within the financial services industry and
continues to play a central role in shaping the investment landscape in Kenya. In its efforts to grow the
depth and liquidity of the market, the Authority is committed to ensure that newly introduced and
existing Capital Markets products and services thrive and create opportunities for meeting capital
requirements by both the private and public sector in financing their development projects in line with
its mandate of market development and innovative regulation.
Through the five key identified recommendations, the Authority believes that the recovery path towards
increasing uptake of capital markets products as well as activity across different players is nigh.
However, effecting and implementing the recommendations require good will and support from multiple
institutions including the National Treasury. Capital Markets have a significant role to play towards the
realization of Kenya’s Vision 2030, specifically the big 4 agenda that aims to spur economic development
in the country.
Capital raising by both private and public enterprises towards financing projects contributing towards
the implementation of the big 4 agenda remains centrally placed within the capital markets realm.

94

95
11 References
1. Lieberman, I.W. and Fergusson, R. (1998), Privatization and Emerging Equity Markets, World
Bank and Flemings, Washington D.C.
2. Amihud, Y. (2002), Illiquidity and Stock Returns: Cross-Section and Time-Series Effects, Journal
of Financial Markets, 5, 31-56. Bekaert, G. and Harvey, C.G. (2000),
3. Time-Varying World Market Integration, Journal of Finance, 50, 403-444. Bhattacharya, U. and
Daouk. H. (2002),
4. The World Price of Insider Trading, Journal of Finance 57, 75-108 Biais, B. (1993),
5. Price Formation and Equilibrium Liquidity in Fragmented and Centralized Markets, Journal of
Finance, 48, 157-185. Biais, B., Perotti, E. (2002)
6. Machiavellian Privatization, American Economic Review, 92, 240-258. Bortolotti, B., D’Souza, J.,
Fantini, M., Megginson, W.L. (2002),
7. Privatization and the Sources of Performance Improvements in the Global Telecommunications
Industry, Telecommunications Policy 26, 243-268.
8. Boutchkova, M.K. and Megginson W.L. (2000), Privatization and the Rise of Global Capital
Markets, Financial Management, 29, 67-77.
9. Calvet L., M. Gonzales-Eiras and P. Sodini, Financial Inno vation, Market Participation and Asset
Prices, Harvard University, 2002. Chiesa, G. and Nicodano, G. (2003),
10. Privatization and Financial Market Development: Theoretical Issues, FEEM Note di Lavoro .
11. Economic Research Online Journal (2015) Mandatory shares listing effect on further capital
raising in the Croatian capital market from 2002–2010 by Mihaela Grubišić Šeba
12. Impact of Privatization on Economic Growth - Illinois Wesleyan University, Undergraduate
Economic Review (2005) by Adnan Filipovic, Furman University