Study on the Effect of Variation of Flow in Sequencing...
19
Journal of Geoscience and Environment Protection, 2017, 5, 56-74 http://www.scirp.org/journal/gep ISSN Online: 2327-4344 ISSN Print: 2327-4336 DOI: 10.4236/gep.2017.54006 April 19, 2017 Study on the Effect of Variation of Flow in Sequencing Batch Reactor Using PCA and ANOVA Govindasamy Vijayan 1 , R. Saravanane 2 , T. Sundararajan 2 1 Public Works Department, Puducherry, India 2 Department of Civil Engineering, Pondicherry Engineering College, Puducherry, India Abstract Wastewater treatment using Sequencing Batch Reactor (SBR) technology is one of the state-of-the art wastewater management systems. In this technology equalization, biological treatment and secondary clarification are performed in a single reactor in a time control sequence. SBR system is idler for the areas where the available land is limited, since it operates in less space and very cost effective even on small scales. The control of the operational parameters dur- ing the process of biological wastewater treatment is often complicated due to the dynamic change in the composition and characteristics of the raw waste- water, flow rates and other parameters influencing the complex nature of the treatment process and the process in SBR has a unique cyclic batch operation. The performance of the SBR was studied using pilot and real plant at Puducherry. The parameters considered in this study are flow, Mixed Liquor Suspended Solids (MLSS), pH, temperature, influent and effluent of Total Suspended Solids (TSS), Biochemical Oxygen Demand (BOD) and Chemical Oxygen Demand (COD). As a part of the study, the effect of constant flow and varying flow on the organic loading of the influent TSS, BOD and COD and their influence on the organic load of the effluent parameters were examined to identify the level of significance of the parameters in relation to the flow. The impact of flow on other parameters was also examined. The experimental data obtained from pilot and real plants were analyzed using multi variate sta- tistical analyses like correlation analysis, Principal Component Analysis (PCA) and Analysis of variance (ANOVA). The statistical analysis revealed that con- stant flow had no significant role and the influent parameters alone had the critical role, whereas varying flow as well as the influent parameters had the significant role on the performance of SBR. Keywords Sequencing Batch Reactor (SBR), Mixed Liquor Suspended Solids (MLSS), How to cite this paper: Vijayan, G., Sara- vanane, R. and Sundararajan, T. (2017) Study on the Effect of Variation of Flow in Sequencing Batch Reactor Using PCA and ANOVA. Journal of Geoscience and Envi- ronment Protection, 5, 56-74. https://doi.org/10.4236/gep.2017.54006 Received: February 17, 2017 Accepted: April 16, 2017 Published: April 19, 2017 Copyright © 2017 by authors and Scientific Research Publishing Inc. This work is licensed under the Creative Commons Attribution International License (CC BY 4.0). http://creativecommons.org/licenses/by/4.0/ Open Access
Transcript of Study on the Effect of Variation of Flow in Sequencing...
Journal of Geoscience and Environment Protection, 2017, 5, 56-74 http://www.scirp.org/journal/gep
ISSN Online: 2327-4344 ISSN Print: 2327-4336
DOI: 10.4236/gep.2017.54006 April 19, 2017
Study on the Effect of Variation of Flow in Sequencing Batch Reactor Using PCA and ANOVA
Govindasamy Vijayan1, R. Saravanane2, T. Sundararajan2
1Public Works Department, Puducherry, India 2Department of Civil Engineering, Pondicherry Engineering College, Puducherry, India
Abstract Wastewater treatment using Sequencing Batch Reactor (SBR) technology is one of the state-of-the art wastewater management systems. In this technology equalization, biological treatment and secondary clarification are performed in a single reactor in a time control sequence. SBR system is idler for the areas where the available land is limited, since it operates in less space and very cost effective even on small scales. The control of the operational parameters dur-ing the process of biological wastewater treatment is often complicated due to the dynamic change in the composition and characteristics of the raw waste-water, flow rates and other parameters influencing the complex nature of the treatment process and the process in SBR has a unique cyclic batch operation. The performance of the SBR was studied using pilot and real plant at Puducherry. The parameters considered in this study are flow, Mixed Liquor Suspended Solids (MLSS), pH, temperature, influent and effluent of Total Suspended Solids (TSS), Biochemical Oxygen Demand (BOD) and Chemical Oxygen Demand (COD). As a part of the study, the effect of constant flow and varying flow on the organic loading of the influent TSS, BOD and COD and their influence on the organic load of the effluent parameters were examined to identify the level of significance of the parameters in relation to the flow. The impact of flow on other parameters was also examined. The experimental data obtained from pilot and real plants were analyzed using multi variate sta-tistical analyses like correlation analysis, Principal Component Analysis (PCA) and Analysis of variance (ANOVA). The statistical analysis revealed that con-stant flow had no significant role and the influent parameters alone had the critical role, whereas varying flow as well as the influent parameters had the significant role on the performance of SBR.
Keywords Sequencing Batch Reactor (SBR), Mixed Liquor Suspended Solids (MLSS),
How to cite this paper: Vijayan, G., Sara-vanane, R. and Sundararajan, T. (2017) Study on the Effect of Variation of Flow in Sequencing Batch Reactor Using PCA and ANOVA. Journal of Geoscience and Envi-ronment Protection, 5, 56-74. https://doi.org/10.4236/gep.2017.54006 Received: February 17, 2017 Accepted: April 16, 2017 Published: April 19, 2017 Copyright © 2017 by authors and Scientific Research Publishing Inc. This work is licensed under the Creative Commons Attribution International License (CC BY 4.0). http://creativecommons.org/licenses/by/4.0/
Open Access

G. Vijayan et al.
57
Principal Component Analysis (PCA), Analysis of Variance (ANOVA)
1. Introduction 1.1. SBR Technology
Wastewater treatment using Sequencing Batch Reactor (SBR) Technology is one of the state-of-the art wastewater management systems. The SBR technology is known to be the pioneer of all activated sludge systems, which was originally developed as fill-and-draw batch process. It is stated that “SBR is no more than an activated sludge system which operates in time rather than in space” [1]. In this system, the processes such as equalization, biological treatment and second-ary clarification are performed in a single tank with a time controlled sequence, whereas in conventional activated sludge system, these unit processes are ac-complished by using separate tanks. The SBR is also known as inter-air SBR, since the aeration is intermittent [2].
The SBR system is more ideal in the areas where the available land is limited, since it operates in less space and it is very cost effective even on small scales. Even though this system requires less space, the reduction in size is not only the ad-vantage, but the inherent flexibility of operation offered by the SBR during the treatment process is much more important. The metabolic reactions, sedimenta-tion and solid-liquid separation are carried out in one tank and in a well-defined and continuously repeated time sequence. The operation involves five important modes namely, Fill, React, Settle, Decant and Idle and is generally presented as “cycle” [3] [4] [5]. The typical SBR operation during one cycle is shown in Fig-ure 1. The alternating periods of “air on” and “air off” can be incorporated dur-ing reaction period to develop aerobic/anoxic/anaerobic conditions to promote nitrification/denitrification and phosphorous removal. Simultaneous Nitrogen and Phosphorous removal could also be achieved by altering the operating cycle. It is advantageous in many aspects, as the duration of the process phases can be adjusted easily to any actual conditions without any need to structurally retrofit the existing tanks.
The control of the operational parameters during the process of wastewater is often complicated due to the dynamic change in the composition and character-istics of the raw wastewater, flow rates and the other parameters influencing the complex nature of the treatment process. A sequencing batch reactor (SBR) pro- cess has a unique cyclic batch operation for biological wastewater treatment [6] [7]. The main advantage of SBR processes may be attributed to the flexibility of operation to meet many different treatment objectives.
1.2. Characteristics of Influent and Effluent
The municipal wastewater contains organic and inorganic matter in suspended, colloidal and dissolved forms and its concentration depends on the original con- centration in the water supply, and the purpose for which it is used. The concen-

G. Vijayan et al.
58
tration of the wastewater is also affected by the climate, the per capita water sup-ply, the wealth and habits of the people. The parameters of the influent wastewa-ter include design flow, maximum daily flow, wastewater temperature and pH. The raw sewage characteristics of importance as far as the biologicaltreatment is concerned are BOD, COD, Suspended solids (SS), Total Nitrogen (TN) and To-tal Phosphorous (TP) [8]. The effluent discharge parameters typically permitted for municipal systems are BOD5, TSS, COD and Fecal Coliform. Once the influ-ent and effluent characteristics of the system are determined, the site specific parameters such as temperature, key design parameters are selected for the treat- ment system.
1.3. Principles of the Process
The SBR operates in cyclic process and in a time sequenced manner. It acts as equalisation tank during filling mode, as aeration tank during react mode, and also as sedimentation tank, where the solids, liquid separation occurs during set-tle mode. The supernatant liquid is drawn from the reactor through the decanter at the time of decant mode. The process of wastewater treatment in SBR consists of complete–mix reactors, in which all the processes occur in the same reactor by way of establishment of operational cycles with defined duration. The SBR basin already has stabilized supernatant in it with the aerobic micro-organisms in the form of compact granules [9]. The biomass is retained in the reactor during all the cycles, thus eliminating the need for separate sedimentation tanks and sludge recirculation pumping stations and thereby the sludge age becomes higher than the hydraulic detention time. The usual duration of each operational cycle may be altered depending upon the variations of the influent flow, the treatment requirements and the characteristics of the sewage and biomass in the system. Normally two or more SBRs run in parallel operations, each one in different stages of the operational cycle so that when a reactor in the sedimentation stage is unable to receive influent, the flow may be directed to the other reactor which is in the fill stage. In a flow-paced batch system, a plant receives the same volumetric loading and approximately the same organic loading, whereas in a time-paced mode, each basin receives different volumetric and organic loading during every cycle [10]. Depending on the diurnal variations of the influent flows to the system, which can sometimes increase or decrease the reactor fill time, the operational cycles can have durations longer than those recommended [11] [12]. The automation level of the system also interferes with the duration of the operational cycles.
The effect of constant and varying flow on the organic loading of TSS, BOD and COD, pH, MLSS, temperature in the SBR was studied with a pilot and real plant. The experimental data were statistically analysed and tested for the significance.
2. Study Area and Present Scenario
Puducherry is a coastal city, located at 11˚58'12''N, 79˚48'40''E and it is at 162 Km south of Chennai, India. The urban population of Puducherry as per 2011 census is 6.54 lakhs. Puducherry town has been provided with underground se-

G. Vijayan et al.
59
werage facilities partially as early as 1980 and the municipal wastewater has been treated with an oxidation pond of 2.9 MLD capacity at Karuvadikuppam, in the north western part of the Puducherry. Later on, three more oxidation ponds with treatment capacities of 2.9, 2.2, 4.8 MLD and two Upflow Anaerobic Sludge Blanket (UASB) reactors each having a capacity of 2.5 MLD were added. The in-stalled capacity of all the existing STPs is 17.8 MLD. The BOD removal efficien-cy of the oxidation ponds and UASBs are about 60% only. Rapid urbanization and limitation of available space have necessitated adopting modern treatment methods. Accordingly, three Sequencing Batch Reactors (SBR), each one having a capacity of 17 MLD have been provided at Karuvadikuppam, Dubrayapet and Kanakaneri. The performance of a pilot SBR and a real plant of 17 Mldcapacity, commissioned recently at Karuvadikuppam, Puducherry were considered for stu- dy purpose. The real plant, which was operating at different flow ranges were ca-tegorized and the performances were compared.
3. Methodology 3.1. SBR (Pilot Scale)
A pilot-scale SBR was installed at the treatment plant site in Dubrayapet, Pu- ducherry to study and compare the performance of both pilot and real plant. The municipal wastewater generated in the Puducherry town and collected for treat-ment in the existing treatment plant was used in this study. A rectangular aerobic sequential batch reactor was designed and fabricated with a working volume of 60 L for this pilot study. The size of rectangular shaped acrylic sheet pilot reactor was 50 cm × 30 cm × 40 cm with a suspended growth system. The pumps, inlet and outlet pipelines were connected with the solenoid valves and an aquarium blower with air flow controller was used for aeration. The pumps, blower and the solenoid valves were controlled by time controllers. Automatic time control units were used in this pilot plant for proper operation and controlling of fill, react, settle and draw periods in the reactor. The reactor was filled with raw sewage and seeded with the sludge collected from the existing oxidation pond at Karuvadikuppam. Digested cow dung was also mixed and aeration was done intermittently in order to ensure that sufficient quantity of active biomass was developed. The pilot plant was oper-ated as a flow-paced or continuous inflow system. The level of the MLSS was also maintained by periodically drawing the sludge.
3.2. SBR Plant at Karuvadikuppam, Puducherry
In the SBR plant at Karuvadikuppam, two operating basins have been provided. The size of each basin of the SBR in this location is 48 m × 24 m × 5 m. These basins are operated in sequence and the influent flow is distributed using auto-matic gates provided at the inlet chamber of the basins. The basins are equipped with air blowers, diffusers, Return Activated Sludge (RAS) pumps, Surplus Acti-vated Sludge (SAS) pumps, decanters and auto valve. All cycles are automatically controlled using Programmable Logic Controller (PLC).
During the period of fill-aeration, the liquid volume inside the reactor in-

G. Vijayan et al.
60
creases from a set operating low water level up to the high water level. Mixed liquor from the aeration zone is also recycled into the selector during the Fill- Aeration sequence. The aeration system in this SBR can be considered as the heart of the treatment system. The system uses high quality fine bubble mem-brane diffusers for aeration, having very high oxygen transfer efficiency. Aera-tion ends at a predetermined period of the cycle to allow the biomass to floccu-late and settle under quiescent conditions. After a predetermined settling period, the treated supernatant is decanted using a moving weir electro mechanical stainless steel decanter.
The moving weir decanter is motor driven and travels slowly from its “park” position to a designated bottom water level. Variable Frequency Drives (VFD) is provided to control the rate of movement of the decanters. After the required level of supernatant is removed, the decanter is returned to its “park” position through reversal of the drive. The basin is then ready for the next cycle to begin. After decanting, the liquid level in the Reactor is returned to the bottom water level after which the cycle is repeated. Solids are wasted from the reactor during the decanting phase. In its simplest form, the sequences of fill, aeration, settling and decant are consecutively and continuously operated all in the same tank.
3.3. Sample Collection and Testing
The pilot plant was put into continuous operation for 27 months, since August 2014. The samples of both the influent and effluent were collected three days in a week and were tested as per the standard testing methods [13]. The physio- chemical and biological parameters like pH, temperature, TDS, TSS, BOD, COD, N as NO3 and P as PO4 were tested for both the influent and effluent. Similarly, samples were collected from the real plant in which the flow varied from 4 to 12 Mld during the study period. However in this study the flow, pH, temperature, MLSS, the organic loading of influent and effluent TSS, BOD and COD have been considered.
3.4. Statistical Analysis
The modelling used in bioprocesses is normally based on balance equations to-
Figure 1. SBR Operation during one complete cycle.

G. Vijayan et al.
61
gether with rate equations for microbial growth, substratum consumption and formation of products. As the microbial reactions coupled with environmental interactions are nonlinear, time-variable and of a complex nature, statistical ana- lysis is a handy tool to test the validity of the experimental data and to analyse to derive conclusions based on hypothesis.
The statistical analyses of the volumetric and organic loading of influent and effluent parameters TSS, BOD and COD and the effect of flow variation during a part of the study period were carried out. The parameters used in the statistical analysis of this study are flow in cum/day, MLSS in mg/L, pH in numeric scale, temperature in ˚C, influent and effluent loading of TSS, BOD and COD (TSSi, BODi, CODi, TSSe, BODe, and CODe) in Kg/day.
The pilot plant was operated with constant flow rate and it was designated as Reactor 1 (R1). The real plant of 17 Mld capacity was operated with varying flow and the actual flow realised in the real plant during the study period ranged from 4 to 12 Mld and it was designated as Reactor 2 (R2). The real plant was again categorised as Reactor 3 (R3), when the flow realised was between 4 and 8 Mld and when the flow was varying from 8 to 12 Mld and the same was designated as Reactor 4 (R4).
The multi variate statistical analyses [14] [15] [16] in this study include the descriptive statistical analyses for the determination of mean, minimum, maxi-mum, median, standard deviation, kurtosis and skewness and the correlation coefficients for various parameters of the influent and the effluent. In correlation analysis the extent of correlation between the parameters were assessed with the correlation coefficients categorized as perfect (0.9-1.0), very good (0.8 - 0.9), good (0.6 - 0.8) and medium (0.5 - 0.6).
The study also includes Principal Component Analysis, which is a statistical method used to identify the patterns in large data matrices [17] [18] [19]. In this analysis various parameters are considered as vectors in a multi-dimensional space and the vector (direction) in which the largest variance is identified as principal component vector and the vectors are numbered as PC1, PC2 and so on in the order of significance. Normally, the variance in the parameter set is modelled within the first few PCs, depending on the nature and complexity of the sample matrix. This analysis will reduce the number of vectors needed to describe the variance in the matrix and the maximum variance of the original space is retained in minimum number of dimensions. The measured process variables are normally correlated to each other. In a nutshell, the PCA can be de-fined as a linear transformation of set of original correlated process variables in a new set of uncorrelated variables that explain the trend of the process. The Scree plot is a graphical presentation in which a plot of eigenvalues in descending or-der is made to identify the knee in the curve for identifying the components be-tween the knee and the high component.
The study also includes Analysis of Variance (ANOVA), which is also a statis-tical tool used for comparing three or more groups of data sets or variables for testing the statistical significance [20] [21] [22]. The basic assumption in ANO- VA is each set of data is from a large normally distributed sample. The analysis
G. Vijayan et al.
62
of variance is used to establish that the set of data is from a population of equal variances and determines whether the means of several variables are equal, or not.
In ANOVA, the null hypothesis Ho is said to be rejected, when there is statis-tically no significant difference between the test result and the sample of data i.e. the test samples are simply random samples of the same population. The alter-nate hypothesis H1 is said to be accepted when there is significant difference among the test result and the samples. The tests for significance are used to de-termine the significance of a factor. But the tests do not explain how the levels of a factor differ. However, the post hoc tests explain the differences in the means for each pair of factor levels.
4. Results and Discussion
In this study, the characteristics of the influent and effluent of the pilot plant (Reactor R1) and the 17 Mld real plant (Reactor R2) were studied through ex-perimental data and the effect of flow variation on the performance of the SBR was analysed. The pilot plant R1 was operated in a flow paced mode in which the flow in the reactor was equal in each cycle of operation and the real plant R2 was operated in a time paced mode, in which the flow was varying from time to time. The flow in the Reactor R2 was varying from 4 to 12 Mld. The pH and tempera-ture are the average values of influent and effluent of the reactors. TSSi, BODi,CODi, TSSe, BODe and CODe are the organic loading i.e., with respective flow and parameter of influent and effluent TSS, BOD and COD. The real plant was designated as Reactor R3 when the plant was in operation with a flow range from 4 to 8 Mld and while the flow varied from 8 to 12 Mld, the same was re-ferred as reactor R4. The effect of the variation of flow on the organic load and other parameters in the SBR was studied at different flow rangesby designating the reactors as R2, R3 and R4.
4.1. Descriptive Statistical Analysis
Descriptive statistical analysis were carried out and the values of minimum, ma- ximum, mean, std. deviation, skewness and kurtosis of the influent and effluent of the plants R1, and R2 are shown in Table 1 and Table 2. The units of flow is in cum/day, MLSS in mg/L, temperature in ˚C, pH is unit less specified in nu-meric scale and TSSi, BODi, CODi, TSSe, BODe and CODe are in Kg/day.
4.2. Correlation Analysis
Correlation analysis of the pilot plant (R1) and real plant operating with differ-ent flow ranges, referred as reactors R2, R3 and R4, were carried out in this study. The correlation coefficients between the various parameters such as flow, MLSS, pH, temperature, TSS, BOD and COD of influent and effluent are listed in Tables 3-6.
4.2.1. Pilot Plant R1 In this pilot plant, the flow was maintained constant without any variation.

G. Vijayan et al.
63
Table 1. Descriptive statistical analysis of parameters in Pilot Plant R1.
Minimum Maximum Mean Std. Deviation Skewness Kurtosis
Flow (cum/day) 0.18 0.18 0.18 0.000 - -
MLSS (mg/L) 2513 3478 2949.68 295.144 0.099 −1.191
pH 7.1 8.1 7.606 0.2870 −0.267 −1.050
Temperature (˚C) 29 33 31.22 1.074 −0.901 0.824
TSSi (Kg/day) 0.0184 0.0869 0.04683 0.018422 0.195 −0.988
BODi (Kg/day) 0.0184 0.0454 0.02779 0.006066 0.866 0.660
CODi (Kg/day) 0.0230 0.0956 0.04637 0.014599 1.383 2.875
TSSe (Kg/day) 0.0018 0.0117 0.00392 0.002126 1.918 4.383
BODe (Kg/day) 0.0042 0.0114 0.00766 0.002029 0.217 −0.904
CODe (Kg/day) 0.0076 0.0178 0.01257 0.002856 0.251 −0.969
Table 2. Descriptive statistical analysis of parameters in Reactor R2.
Minimum Maximum Mean Std. Deviation Skewness Kurtosis
Flow (cum/day) 4185 11815 7340.71 2054.37 0.539 −0.691
MLSS (mg/L) 2726 4422 3615.17 484.27 −0.063 −0.966
pH 6.7 7.3 6.98 0.126 0.014 0.583
Temp (˚C) 27 33 29.18 1.56 0.687 0.121
TSSi (Kg/day) 451 2254 1104.24 488.95 0.565 −0.555
BODi (Kg/day) 589 3366 1602.00 744.37 0.649 −0.596
CODi (Kg/day) 1230 5399 2601.63 1094.08 0.777 −0.392
TSSe (Kg/day) 38 119 75.29 20.46 0.434 −0.601
BODe (Kg/day) 42 357 181.41 80.03 0.580 −0.586
CODe (Kg/day) 137 799 312.78 145.81 1.346 1.882
Table 3. Correlation Coefficients of parametersin Reactor R1.
Flow MLSS pH Temp TSSi BODi CODi TSSe BODe CODe
Flow 1.000
MLSS 0.000 1.000
pH 0.000 −0.067 1.000
Temp 0.000 −0.040 0.293 1.000
TSSi 0.000 −0.145 −0.307 −0.247 1.000
BODi 0.000 0.334 −0.137 −0.183 0.039 1.000
CODi 0.000 −0.097 −0.266 −0.162 0.173 0.407 1.000
TSSe 0.000 −0.296 −0.480 −0.206 0.467 −0.099 0.274 1.000
BODe 0.000 −0.511 −0.043 −0.262 0.160 0.590 0.467 0.167 1.000
CODe 0.000 −0.345 −0.085 −0.225 0.132 0.642 0.650 0.132 0.909 1.000
From Table 3, it is observed that there is good correlation among influent BOD and effluent BOD and COD. There is perfect correlation between BODeand CODe and good correlation among BODi, BODe and CODe. There is medium

G. Vijayan et al.
64
Table 4. Correlation Coefficients of parameters in reactor R2 (4-12 Mld).
Flow MLSS pH Temp TSSi BODi CODi TSSe BODe CODe
Flow 1
MLSS 0.236 1
pH −0.177 0.022 1
Temp 0.257 0.397 −0.052 1
TSSi 0.800 0.363 −0.351 0.255 1
BODi 0.851 0.448 −0.075 0.374 0.841 1
CODi 0.826 0.415 −0.003 0.380 0.681 0.813 1
TSSe 0.975 0.269 −0.144 0.320 0.776 0.850 0.809 1
BODe 0.793 −0.093 −0.149 0.213 0.726 0.800 0.548 0.787 1
CODe 0.785 0.168 −0.111 0.438 0.562 0.631 0.693 0.811 0.660 1
Table 5. Correlation Coefficients of parametersin reactor R3.
Flow MLSS pH Temp TSSi BODi CODi TSSe BODe CODe
Flow 1
MLSS 0.371 1
pH −0.037 −0.001 1
Temp −0.053 0.376 −0.019 1
TSSi 0.677 0.599 −0.249 0.052 1
BODi 0.728 0.561 0.038 0.194 0.815 1
CODi 0.649 0.508 0.179 0.171 0.519 0.674 1
TSSe 0.945 0.413 −0.042 0.079 0.666 0.724 0.645 1
BODe 0.458 −0.231 −0.065 −0.028 0.403 0.605 0.081 0.433 1
CODe 0.439 0.317 −0.122 0.456 0.339 0.364 0.335 0.554 0.193 1
Table 6. Correlation Coefficients in reactor R4.
Flow MLSS pH Temp TSSi BODi CODi TSSe BODe CODe
Flow 1
MLSS 0.137 1
pH 0.291 0.290 1
Temp 0.225 0.527 0.301 1
TSSi −0.193 −0.023 −0.476 −0.010 1
BODi 0.287 0.731 0.518 0.499 0.220 1
CODi 0.766 0.463 0.268 0.702 0.096 0.585 1
TSSe 0.794 0.175 0.634 0.439 −0.411 0.289 0.623 1
BODe 0.157 −0.377 0.435 −0.098 0.148 0.308 0.064 0.231 1
CODe 0.668 −0.155 0.474 0.201 −0.291 0.052 0.550 0.715 0.385 1
correlation between TSSi and Tsse. There is no correlation between flow and other parameters, since there is no variation of flow. In this context it is also observed that only the influent and effluent BOD and COD played a crucial role

G. Vijayan et al.
65
in the pilot plant. All other parameters like MLSS, pH, temperature are less sig-nificant when compared to other parameters.
4.2.2. ReactorR2 In this reactor, the variation of flow range was from 4 to 12 Mld. The correlation coefficients of various parameters in R2 are given in Table 4. It is observed that the flow is in perfect correlation with TSSe and in very good correlation with TSSi, BODi and CODi. There is also good correlation among flow, BODe and CODe. Similarly, there is very good correlation among BODi, TSSi, TSSe and CODe. As the flow is a constituent of organic load, it played a significant role.
4.2.3. Reactor R3 In the reactor R3 there was flow variation from 4 to 8 Mld. The correlation coef-ficients among different parameters in R3 is summarised in Table 5. There is perfect correlation among flow and TSSe. Also there is good correlation between flow and TSSi, BODi, and CODi. The MLSS was in good correlation with TSSi. Similarly, there is good correlation among BODi, CODi, TSSe and BODe. In this flow range, the parameters viz, flow, TSSe, TSSi, BODi, and CODiare significant and the flow which influenced the organic loading of TSSi, BODi, CODi and TSSeplayed a critical role.
4.2.4. ReactorR4 The flow variation in this reactor R4 was from 8 to 12 Mld. The correlation coef-ficients between various parameters in R4 are shown in Table 6. There is good correlation between flow and TSSe, CODi and CODe.
Here temperature also played a part as it is correlated with CODi and simi-larly pH is in good correlation with TSSe and the TSSe is in good correlation with CODe.
On making a relative comparison between pilot plant R1 and different catego-ries of real plant based on flow, it is observed that BOD and COD are significant in pilot plant and the flow had no role in the reactor, since there was no varia-tion of flow, whereas in the reactor R2, the flow played a critical role and the TSSi, BODi, CODi, TSSe, BODe and CODe had significant influence. In R3, the flow, TSSi, BODi, CODi, TSSe, BODe, and CODe played a part and in R4, flow, pH and temperature played a role. The flow had a very significant role in the re-actors R2, R3 and R4.
4.3. Principal Component Analysis (PCA)
Principal component analysis (PCA) has been used to determine the interde-pendence among different sets of biological and physio-chemical data and for identifying different parameters which are responsible for the performance of the reactors and to condense the data with a minimum loss of information. The vectors in which the variances are the largest are identified as principal compo-nent vectors viz, PCA1, PCA2, PCA3 and PCA4. PCA was done using the statis-tical software package SPSS version 21. The details of variance explained in the real plant R2 is tabulated in Table 7. Also the details of variance explained in re-

G. Vijayan et al.
66
actors R3 and R4 are shown in Table 8. Similarly the rotated component matrix of R2, showing the factor loading of the parameters is shown in Table 9.
4.3.1. Reactor R2 In the real plant R2, the total variance of 82.64% was explained by the first three components as shown in Table 7. Out of the total 10 components, three compo-nents having Eigen values more than 1.0 have explained 82.64% of total variance. The first component alone has explained 58.9% of variance, followed by the sec-ond and third component explaining 13.5% and 10.3% respectively. The Scree plot of the principal components explaining the variance in the reactor R2 and the ro-tated component plot in rotated space are shown in Figure 2 and Figure 3. Table 7. Total Variance Explained by PCA in Reactor R2.
Component
Initial Eigenvalues
Extraction Sums of Squared Loadings
Total % of Variance Cumulative % Total % of Variance Cumulative %
1 5.892 58.918 58.918 5.892 58.918 58.918
2 1.346 13.460 72.378 1.346 13.460 72.378
3 1.026 10.262 82.640 1.026 10.262 82.640
4 0.774 7.739 90.379
5 0.439 4.390 94.769
6 0.233 2.333 97.102
7 0.138 1.378 98.480
8 0.115 1.155 99.635
9 0.020 0.196 99.830
10 0.017 0.170 100.000
Table 8. Total Variance Explained by PCA in reactor R3 and R4.
Component Initial Eigenvalues for R3 Extraction sum of
squared loading for R3
Initial Eigenvalues for R4 Extraction sum of
squared loading for R4
Total
% of Variance
Cumulative %
Cumulative %
Total % of
Variance Cumulative
% Cumulative
%
1 4.695 46.95 46.95 46.95 4.202 42.02 42.02 42.02
2 1.561 15.61 62.56 62.56 2.123 21.23 63.25 63.25
3 1.203 12.03 74.60 74.60 1.388 13.88 77.13 77.13
4 1.004 10.04 84.64 84.64 1.216 12.16 89.29 89.29
5 0.720 7.20 91.84
0.567 5.68 94.96
6 0.385 3.85 95.69
0.250 2.49 97.46
7 0.260 2.60 98.28
0.178 1.78 99.24
8 0.116 1.16 99.45
0.068 0.677 99.91
9 0.042 0.422 99.87
0.008 0.078 99.99
10 0.013 0.132 100.00
0.001 0.010 100.00

G. Vijayan et al.
67
Figure 2. Scree Plot showing the components in PCA in reactor R2.
Figure 3. Component Plot in Rotated Space in reactor R2.
In the first vary factor PCA1 the parameters flow, TSSi, BODi, CODi, TSSe, BODe and CODe are heavily loaded (>0.75) and shown in Table 9. In PCA2, the MLSS is heavily loaded and the temperature is with moderate loading (0.6 – 0.75) and the loading of pH is heavy in PCA3.
4.3.2. ReactorR3 The total variances of the reactor R3 are shown in Table 8. In R3, the first 4 components explained 84.64% of total variances. The first component has ex-plained 46.9% of the total variance, followed by the second, third and fourth components explaining 15.6%, 12.0% and 10.0% of the variances respectively.
From Table 10, it may be seen that in R3, the factors flow, TSSi, BODi, CODi and TSSe are heavily loaded in the first vary factor PCA1. The PCA2 is heavily loaded by the temperature and CODe and moderately loaded by the MLSS. The PCA3 and PCA4 are heavily loaded by BODe and pH respectively.

G. Vijayan et al.
68
Table 9. Rotated Component Matrix of PCA in Reactor R2.
Parameters Vary Factors
PCA1 PCA2 PCA3
Flow 0.952 0.146 −0.093
MLSS 0.078 0.911 −0.006
pH −0.082 0.009 0.981
Temp 0.226 0.691 −0.012
TSSi 0.788 0.264 −0.362
BODi 0.866 0.360 −0.035
CODi 0.793 0.413 0.096
TSSe 0.943 0.193 −0.058
BODe 0.910 −0.158 −0.099
CODe 0.809 0.187 0.007
Table 10. Rotated Component Matrix of PCA in reactor R3 and R4.
Vary factors in reactor R3 Vary factor in reactor R4
PCA1 PCA2 PCA3 PCA4 PCA1 PCA2 PCA3 PCA4
Flow 0.903 0.032 0.204 −0.006 0.907 0.133 0.035 0.055
MLSS 0.297 0.591 −0.670 −0.057 −0.043 0.923 −0.224 0.115
pH −0.001 −0.044 −0.023 0.968 0.224 0.391 0.565 0.657
Temp −0.023 0.910 −0.166 0.033 0.356 0.715 −0.121 0.009
TSSi 0.857 0.044 −0.045 −0.327 −0.152 0.114 0.156 −0.936
BODi 0.894 0.184 0.133 0.034 0.097 0.869 0.424 −0.098
CODi 0.774 0.144 −0.230 0.295 0.781 0.571 −0.015 −0.189
TSSe 0.878 0.188 0.188 −0.009 0.799 0.224 0.169 0.412
BODe 0.415 0.053 0.843 −0.067 0.170 −0.136 0.953 −0.084
CODe 0.368 0.751 0.136 −0.105 0.834 −0.121 0.286 0.232
4.3.3. Reactor R4 Similarly, in the reactor R4, the total variance of 89.3% was explained by the first four components, which is listed in Table 8. The first component alone has ex-plained 42.0% of total variance and the other components viz., second, third and fourth components have explained 21.2%, 13.9% and 12.2% of total variances respectively.
Table 10 illustrates that in R4, the PCA1 is heavily loaded by flow, CODi, TSSe, and CODe. In PCA2, the loading of MLSS and BODiare heavy and that of temperature is moderate. Similarly pH is with heavy loading in PCA3 and in PCA4 the pH is with moderate loading.
The percentages of variances explained by the various components in all the three reactors are shown in Table 11. It can be inferred that more than 42% of

G. Vijayan et al.
69
the total variance has been explained by the first component in all the reactors. On an average more than 13% of the total variance has been explained by the second component and similarly third component has explained more than 10% of total variance. Thus about 74% of total variance has been explained by the first three components in all the reactors.
The factor/parameters which are responsible for the performance of the reac-tors are furnished in Table 12. It is inferred that the first vary factor is repre-sented by the flow in all the three reactors and biological parameters of BOD, COD and TSS are represented by the first three factors. The flow being a de-pendent component of organic load plays a vital role in the performance of the reactor.
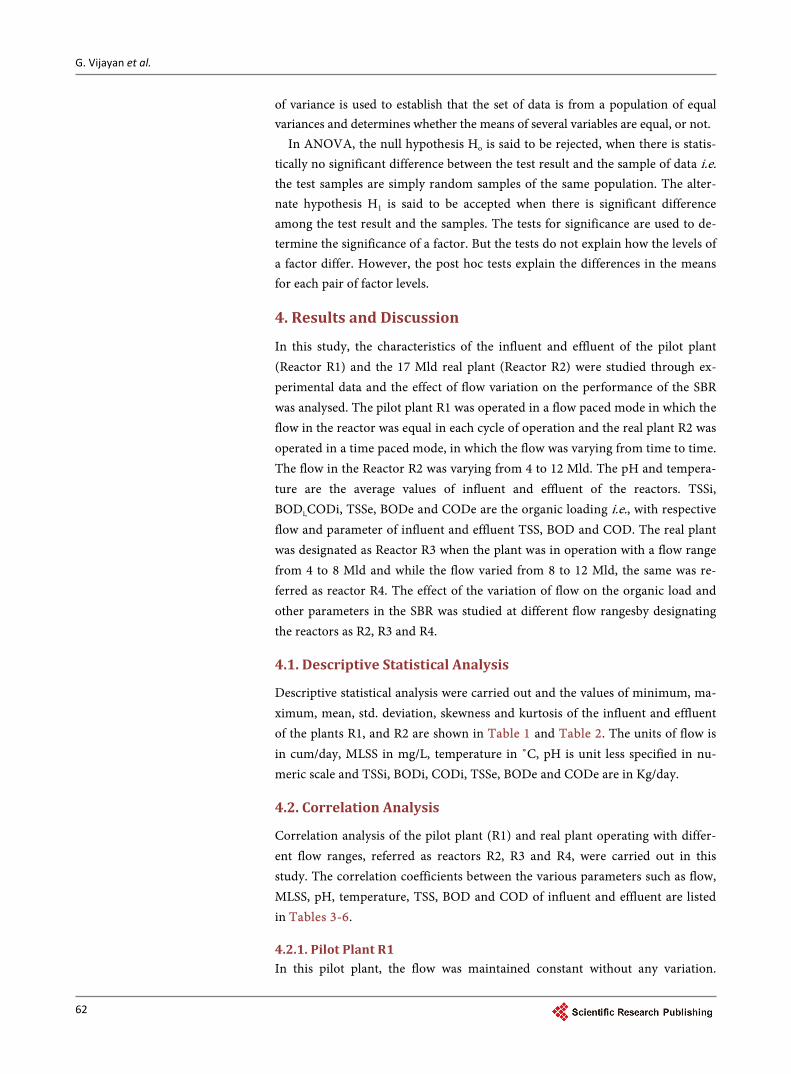
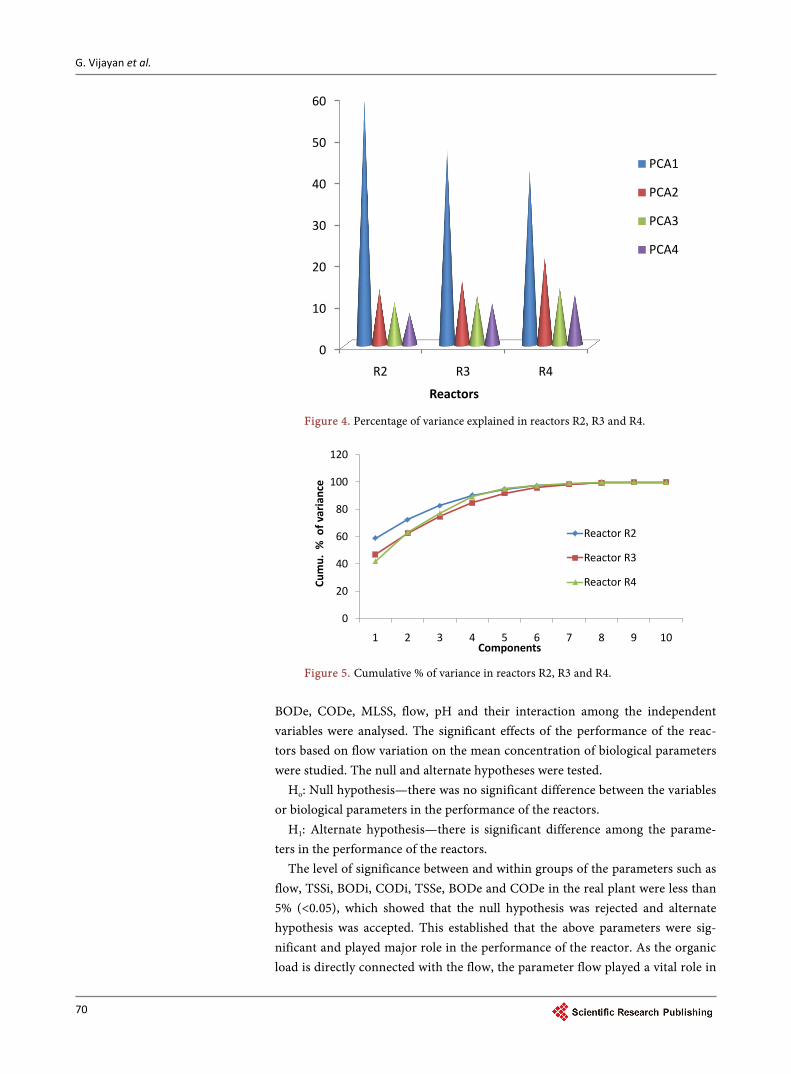
The percentage of variance explained by the first four components and the cumulative % of all the components in reactors R2, R3 and R4 are shown in Figure 4 and Figure 5.
From Figure 4 and Figure 5, it may be seen that in all the reactors the vari-ance of all the parameters have been explained by the first four components among the all the parameters flow plays a major role.
4.4. Analysis of Variance (ANOVA) 4.4.1. Reactors R2, R3 andR4 The reactor R1 was operated as flow paced reactor having constant flow. The re-actors R2, R3 and R4 were operated with varying flow. Analysis of variance was performed for the reactors R2, R3 and R4 and the significance of the means of variance among the various parameters are determined and summarized in Ta-ble 13.
The effect of independent variable (Reactors) on dependent variable, i.e., mean concentration of organic biological parameters TSSi, BODi, CODi, TSSe, Table 11. PCA variance in Reactors R2, R3 and R4.
Reactor % Variance Explained
R2 R3 R4
First Component 58.92 46.95 42.02
Second Component 13.46 15.61 21.23
Third Component 10.26 12.03 13.88
Fourth Component - 10.04 12.16
Total 82.64 84.64 89.29
Table 12. Factors in Reactors R2, R3 and R4.
Reactor Flow MLSS pH Temp TSSi BODi CODi TSSe BODe CODe
R2 1 2 3 2 1 1 1 1 1 1
R3 1 2 4 2 1 1 1 1 3 2
R4 1 2 4 2 3 2 1 1 3 1
G. Vijayan et al.
70
Figure 4. Percentage of variance explained in reactors R2, R3 and R4.
Figure 5. Cumulative % of variance in reactors R2, R3 and R4.
BODe, CODe, MLSS, flow, pH and their interaction among the independent variables were analysed. The significant effects of the performance of the reac-tors based on flow variation on the mean concentration of biological parameters were studied. The null and alternate hypotheses were tested.
Ho: Null hypothesis—there was no significant difference between the variables or biological parameters in the performance of the reactors.
H1: Alternate hypothesis—there is significant difference among the parame-ters in the performance of the reactors.
The level of significance between and within groups of the parameters such as flow, TSSi, BODi, CODi, TSSe, BODe and CODe in the real plant were less than 5% (<0.05), which showed that the null hypothesis was rejected and alternate hypothesis was accepted. This established that the above parameters were sig-nificant and played major role in the performance of the reactor. As the organic load is directly connected with the flow, the parameter flow played a vital role in
0
10
20
30
40
50
60
R2 R3 R4
Reactors
PCA1
PCA2
PCA3
PCA4
0
20
40
60
80
100
120
1 2 3 4 5 6 7 8 9 10
Cum
u. %
of v
aria
nce
Components
Reactor R2
Reactor R3
Reactor R4

G. Vijayan et al.
71
the performance of the SBR. On the other hand the significance of the parame-ters MLSS, pH and temperature were more than 5% (>0.05) and this resulted the acceptance of null hypothesis and rejection of alternate hypothesis. This revealed that the above three parameters were less significant in the performance of reac-tor. As these parameters were less significant post hoc analysis was carried out to identify the group which was more responsible for the acceptance of null hy-pothesis. In continuation to Anova, post hoc analysis was carried out to identify the parameters which contributed more for the acceptance of null hypothesis. The post hoc analysis (Tukey analysis) between the reactors and MLSS, tem-perature and pH are shown in Table 14.
The Tukey analysis which is based on the assumption of equal variance was performed and the level of significances for MLSS, pH and temperature were more than 0.05. The analysis showed that the parameters MLSS, pH and tem-perature have less significant in the performance of the reactors and thus the above parameters are less performing when compared to flow.
5. Conclusions
In this study, the effect of variation of flow in the SBR was analyzed using corre- lation analysis, principal component analysis and analysis of variance in pilot and real plants.
The correlation analysis shows that in pilot plant, the flow doesn’t have a role on the organic loading in the reactor, since there is no variation of flow. When the flow was constant, only the organic loads of BODi, CODi, BODe and CODe were critical and all other parameters were less performing. In respect of real plant, the flow is in very good correlation with TSSi, BODi, CODi, TSSe, BODe and CODe. The flow and the organic load of BOD, COD and TSS influence the performance of all the reactors.
The PCA established that in reactors R2, R3 and R4 more than 42 % of total variance had been explained by the first component and the varying factor PCA1 Table 13. ANOVA in reactor R2, R3 and R4.
Parameters Sum of Squares df Mean Square F Sig.
Flow Between Groups 127343296.6 2 63671648.3 23.919 0.000
MLSS Between Groups 51994.3 2 25997.1 0.156 0.855
pH Between Groups 0.0 2 0.0 0.965 0.385
Temp Between Groups 8.8 2 4.4 1.896 0.157
TSSi Between Groups 5518663.3 2 2759331.7 16.020 0.000
BODi Between Groups 12730738.6 2 6365369.3 15.915 0.000
CODi Between Groups 20813515.1 2 10406757.5 10.969 0.000
TSSe Between Groups 12025.8 2 6012.9 22.132 0.000
BODe Between Groups 155006.5 2 77503.3 17.134 0.000
CODe Between Groups 413594.0 2 206797.0 12.691 0.000

G. Vijayan et al.
72
Table 14. Post Hoc Analysis between reactor (flow variation) effects.
Dependent Variable Mean Difference (I-J) Std. Error Sig. 95% Confidence Interval
Lower Bound Upper Bound
MLSS
2 3 22.9075 98.9191 0.971 −213.378 259.193
4 −55.3598 133.8066 0.910 −374.980 264.261
3 2 −22.9075 98.9191 0.971 −259.193 213.378
4 −78.2672 139.9344 0.842 −412.525 255.990
4 2 55.3598 133.8066 0.910 −264.261 374.980
3 78.2672 139.9344 0.842 −255.990 412.525
pH
2 3 −0.0175 0.0304 0.834 −0.090 0.055
4 0.0423 0.0411 0.562 −0.056 0.141
3 2 0.0175 0.0304 0.834 −0.055 0.090
4 0.0598 0.0430 0.351 −0.043 0.163
4 2 −0.0423 0.0411 0.562 −0.141 0.056
3 −0.0598 0.0430 0.351 −0.163 0.043
Temp
2 3 0.2986 0.3703 0.700 −0.586 1.183
4 −0.7215 0.5010 0.325 −1.918 0.475
3 2 −0.2986 0.3703 0.700 −1.183 0.586
4 −1.0201 0.5239 0.132 −2.272 0.231
4 2 0.7215 0.5010 0.325 −0.475 1.918
3 1.0201 0.5239 0.132 −0.231 2.272
was heavily loaded by the flow and the organic loading. The overall principal component analysis revealed that flow and the organic load were the main con-tributing factors in all the reactors R2, R3 and R4. MLSS, temperature and pH also had the significant role but less performing when compared with flow.
The ANOVA of the reactors R2, R3 and R4 revealed that the level of signifi-cance of the parameters flow, TSSi, BODi, CODi, TSSe, BODe and CODe was less than 0.05. The analysis established the acceptance of alternate hypothesis that there was the significant difference in the performance of the reactors by flow and organic load of biological parameters. Further, the post hoc analysis has showed that MLSS, temperature and pH are less performing when compared with flow.
The multivariate statistical analyses showed that when the flow was constant, only the influent parameters played the significant role, whereas when the flow varied, the flow and the influent parameters played a critical role in the per-formance of the SBR.
References [1] U.S.EPA (1983) An Emerging Technology. Sequencing Batch Reactors. A Project
Assessment. U.S. Environmental Protection Agency.
[2] Arceivala, S.J. and Asolekakar, S.R. (2008) Wastewater Treatment for Pollution Control and Reuse. 3rd Edition, McGraw-Hill, USA.
G. Vijayan et al.
73
[3] U.S.EPA (1986) Design Manual, Summary Report Sequencing Batch Reactors. EPA/ 625/8-86/011.
[4] U.S.EPA (1999) Wastewater Technology Fact Sheet Sequencing Batch Reactors. U.S. Environmental Protection Agency, EPA 832-F-99-073.
[5] U.S. EPA (2000) Wastewater Technology Fact Sheet Package Plants. U.S. Environ-mental Protection Agency, EPA, 832-F-00-016.
[6] Demuynck, C., Vanrolleghem, P.A., Mingneau, C., Liessens, J. and Verstraete, W. (1994) NDBEPR Process Optimization in SBRs: Reduction of External Carbon Source and Oxygen Supply. Water Science and Technology, 30, 169-179.
[7] Lee, D.S. and Park, J.M. (1998) Neural Network Modeling for On-Line Estimation of Nutrient Dynamics in a Sequentially-Operated Batch Reactor. Journal of Biotech- nology, 75, 229-239.
[8] Manual on Sewerage and Sewage Treatment Systems—Part A: Engineering (2013) Ministry of Urban Development, New Delhi, published by CPHEEO, in collabora-tion with Japan International Cooperation Agency.
[9] Morgenroth, E., Sherden, T., Van Loosdrecht, M.C.M., Heijnen, J.J. and Wilderer, P.A. (1997) Aerobic Granular Sludge in a Sequencing Batch Reactor. Water Re-search, 31, 3191-3194.
[10] The New England Interstate Water Pollution Control Commission (2005) Manual for Sequencing Batch Reactor Design and Operational Considerations.
[11] von Sperling, M. (2007) Biological Wastewater Treatment Series. Vol. 2: Basic Prin-ciples of Wastewater Treatment. IWA Publishing, London.
[12] von Sperling, M. (2007) Biological Wastewater Treatment Series. Vol. 5: Activated Sludge and Aerobic Biofilm Reactors. IWA Publishing, London.
[13] American Public Health Association (APHA) (2003) Standard Method for the Ex-amination of Water and Wastewaters. 21st Edition, Washington DC.
[14] Bakshi, B.R. (1998) Multiscale PCA with Application to Multivariate Statistical Pro- cess Monitoring. AIChE Journal, 44, 1596-1610. https://doi.org/10.1002/aic.690440712
[15] Rosen, C. and Lennox, J.A. (2001) Multivariate and Multiscale Monitoring of Wastewater Treatment Operation. Water Research, 35, 3402-3410.
[16] Aguado, D., Ferrer, A., Ferrer, J. and Seco, A. (2007) Multivariate SPC of a Sequenc- ing Batch Reactor for Wastewater Treatment. Chemometrics and Intelligent Labo-ratory Systems, 85, 82-93.
[17] Oliveira-Esquerre, K.P., Mori, M. and Bruns, R.E. (2002) Simulation of an Indus-trial Wastewater Treatment Plant Using Artificial Neural Networks and Principal Components Analysis. Brazilian Journal of Chemical Engineering, 19, 365-370. https://doi.org/10.1590/S0104-66322002000400002
[18] Lee, D.S. and Vanrolleghem, P.A. (2004) Adaptive Consensus Principal Component Analysis for On-Line Batch Process Monitoring. Environmental Monitoring and Assessment, 92, 119-135. https://doi.org/10.1023/B:EMAS.0000014498.72455.18
[19] Dias, A.M.A. and Paulo, A. (2008) Multivariate Monitoring of an Activated Sludge Process for Biological Treatment of a Synthetic Wastewater Effluent. 10th Interna-tional Chemical and Biological Engineering Conference, CHEMPOR 2008 [PCA].
[20] Debik, E. and Manav, N. (2010) Sequence Optimization in a Sequencing Batch Re-actor for Biological Nutrient Removal from Domestic Wastewater. Bioprocess and Biosystems Engineering, 33, 533-540. https://doi.org/10.1007/s00449-009-0366-1
[21] Asadi, A. and Ziantizadeh Iranica, A.A.L. (2011) Statistical Analysis and Optimiza-tion of an Aerobic SBR Treating an Industrial Estate Wastewater Using Response

G. Vijayan et al.
74
Surface Methodology (RSM). Iranica Journal of Energy & Environment, 2, 356-365. https://doi.org/10.5829/idosi.ijee.2011.02.04.3424
[22] Elmolla, E.S., et al. (2012) Optimization of Sequencing Batch Reactor Operating Conditions for Treatment of High Strength Pharmaceutical Wastewater. Journal of Environmental Science and Technology, 5, 452-459.
Submit or recommend next manuscript to SCIRP and we will provide best service for you:
Accepting pre-submission inquiries through Email, Facebook, LinkedIn, Twitter, etc. A wide selection of journals (inclusive of 9 subjects, more than 200 journals) Providing 24-hour high-quality service User-friendly online submission system Fair and swift peer-review system Efficient typesetting and proofreading procedure Display of the result of downloads and visits, as well as the number of cited articles Maximum dissemination of your research work
Submit your manuscript at: http://papersubmission.scirp.org/ Or contact [email protected]