STUDY ON POST HARVEST LOSSES OF GUAVA AT DIFFERENT STAGES ...ijaer.in/uploads/ijaer_02__104.pdf ·...
13
International Journal of Agriculture and Environmental Research ISSN: 2455-6939 Volume:02, Issue:05 www.ijaer.in Copyright © IJAER 2016, All right reserved Page 1494 STUDY ON POST HARVEST LOSSES OF GUAVA AT DIFFERENT STAGES OF MARKETING IN ALLAHABAD DISTRICT, U.P. Dr. Ameesh John Stephen 1 , Rohin John 2 , Nitin Barker 3 1,3 Assistant Professor, Department of Agricultural Economics & Agribusiness management SHIATS, Allahabad, India 2 Research Scholar, Dept. of Agricultural Economics & Agribusiness Management, SHIATS, Allahabad, India ABSTRACT Guava (Pisidium guajava L) is one of the common and important fruit crop in India which occuipies third place after citrus and mango in terms of area and production. Allahabad and kaushambi dstricts of Uttar Pradesh have been very famous for producing best quality of guava in the world. Post harvest losses and speedy quality detoration are the serious problem of guava fruit which not only pulls the producer ‘s price down but also decreases the farmer gain The present work entitled “Study on post harvest losses of Guava at different stages of marketing in Allahabad District, U.P” was carried out in Allahabad district of Uttar Pradesh. Using multistage sampling technique 100 farmers from the three categories of the marginal, small and large farmers; five operators each from the different market functionaries. Here in this study, it was estimated till the produce remains in the hands of producers/ PHCs. Physical loss was estimated to be 8.92 percent of the total harvest while that in economic terms was 6.04 percent. Both were maximum at marginal farms and depicted a decreasing trend as the size of farm increased. Economic loss was less than physical losses because the damaged fruits which were partially degraded fetch some price when sold to poor class people or local processors. Of the total harvested product 99.04 percent was marketable surplus whereas the marketed surplus was only 98.43 percent. Marketable surplus as percentage to total fruits harvested was 90.20 and the total physical losses was 9.47. Here again it was found that proportion of marketable surplus increased as the size of farm and output, and the losses depicted a decreasing trend. Keywords: Post harvest losses, Marketable surplus, Marketed Surplus
Transcript of STUDY ON POST HARVEST LOSSES OF GUAVA AT DIFFERENT STAGES ...ijaer.in/uploads/ijaer_02__104.pdf ·...
International Journal of Agriculture and Environmental Research
ISSN: 2455-6939
Volume:02, Issue:05
www.ijaer.in Copyright © IJAER 2016, All right reserved Page 1494
STUDY ON POST HARVEST LOSSES OF GUAVA AT DIFFERENT STAGES OF MARKETING IN ALLAHABAD DISTRICT, U.P.
Dr. Ameesh John Stephen1, Rohin John2, Nitin Barker3
1,3 Assistant Professor,
Department of Agricultural Economics & Agribusiness management SHIATS, Allahabad, India
2Research Scholar,
Dept. of Agricultural Economics & Agribusiness Management, SHIATS, Allahabad, India
ABSTRACT
Guava (Pisidium guajava L) is one of the common and important fruit crop in India which occuipies third place after citrus and mango in terms of area and production. Allahabad and kaushambi dstricts of Uttar Pradesh have been very famous for producing best quality of guava in the world. Post harvest losses and speedy quality detoration are the serious problem of guava fruit which not only pulls the producer ‘s price down but also decreases the farmer gain The
present work entitled “Study on post harvest losses of Guava at different stages of marketing in Allahabad District, U.P” was carried out in Allahabad district of Uttar Pradesh. Using multistage sampling technique 100 farmers from the three categories of the marginal, small and large farmers; five operators each from the different market functionaries. Here in this study, it was estimated till the produce remains in the hands of producers/ PHCs. Physical loss was estimated to be 8.92 percent of the total harvest while that in economic terms was 6.04 percent. Both were maximum at marginal farms and depicted a decreasing trend as the size of farm increased. Economic loss was less than physical losses because the damaged fruits which were partially degraded fetch some price when sold to poor class people or local processors. Of the total harvested product 99.04 percent was marketable surplus whereas the marketed surplus was only 98.43 percent. Marketable surplus as percentage to total fruits harvested was 90.20 and the total physical losses was 9.47. Here again it was found that proportion of marketable surplus increased as the size of farm and output, and the losses depicted a decreasing trend.
Keywords: Post harvest losses, Marketable surplus, Marketed Surplus
International Journal of Agriculture and Environmental Research
ISSN: 2455-6939
Volume:02, Issue:05
www.ijaer.in Copyright © IJAER 2016, All right reserved Page 1495
1. INTRODUCTION
India is the leading producer of guava with approximately 40% of guava production in the world. Guava is the fourth most important fruit in India which occupies approximately 6.5% of the area under fruit cultivation. Uttar Pradesh, Bihar, Maharashtra, Madhya Pradesh, Andhra Pradesh and Gujarat are the major guava producing states in India. Uttar Pradesh is the 3rd highest guava producing state after Maharashtra and Bihar (Indian Horticulture Database, Ministry of Agriculture, Government of India, 2011). Allahabad and Kaushambi districts of Uttar Pradesh are well known for producing best quality of guava fruit in India. Apart from several guava varieties, Allahabad safeda and apple guava are the best quality of guava varieties which are well known in India. Post-harvest technologies greatly influence the level of postharvest losses and the quality of produce. These technologies are; grading, packaging, precooling, storage and transportation (detailed references are well documented; Ryall and Lipton (1979), Ryall and Pentzer (1982), and Hardenburg et al. (1986). In fruits and vegetables the quality of produce deteriorates after some time of their harvest. There are no generally accepted methods for evaluating post-harvest losses of fresh produce. In the appraisal of an existing marketing operation, the accurate evaluation of losses occurring is a problem. It may be suspected that losses are too great.
Many studies have been conducted on post harvest losses of fruits and vegetables based on small scale experiments but do not reflect the real situations. (Ratnam and Neema,1967; Biswas,1969; FAO,1981; Waheed et al., 1986;Government of India,1985;Madan and Ullasa,1993). A few studies also estimated losses at each stage of marketing but had not estimated the total value of losses at the macro level which could have provided scientific basis for valuation (Krishna,1976; Senthilinathan and Srinivasan, 1994; Srinivas et al., 1997; Gajanana et.al.,2002; Sreenivasa Murthy et.al.,2004)
The post harvest losses not only reduce the availability of fruits but also result in increase in per unit cost of transport and marketing (Subrahmanayam,1986). An efficient marketing system is essential for sustained agricultural development. It affects both producer’s income (through
prices producers receive for their products) and consumer welfare (through prices consumers pay for agricultural commodities).
This study was conducted with the objectives to the post harvest losses in guava both in physical and economic terms at different stages of handling and to develop strategies to reduce the losses.

International Journal of Agriculture and Environmental Research
ISSN: 2455-6939
Volume:02, Issue:05
www.ijaer.in Copyright © IJAER 2016, All right reserved Page 1496
2. METHODOLOGY
2.1 Sampling procedure -The study was conducted in the district of Allahabad. It is situated in the south eastern part of the state of Uttar Pradesh which touches the boundary of neighboring state Madhya Pradesh. There are 20 community development blocks in the district. List of all the 20 community development blocks of Allahabad district along with total area under guava for the 2008-2009 year was procured from current official records available in the District Horticulture office, Allahabad. Three blocks namely Kaurihaar, Dhanupur and Saidabad with maximum guava area were selected. From the offices of sample blocks, list of village was procured and such villages were sorted out which have at least one guava orchard. A sample of 20 percent such villages from each sample block were selected randomly. A village-wise list of all the farmers, having guava orchards in the sample villages, was prepared along with the size of their operational holdings. Further, these farmers orchardists were stratified on the basis of their holding sizes as :
Marginal farmers with a holding size below 1.00 ha Small farmers with a holding size between 1.00 and 2.00 ha. Large farmers with a holding size 2.00 ha. and above.
2.2 Selection of the Market and Market Functionaries
Mundera mandi, the main market for fruits and vegetables in of Allahabad, where fruits and vegetables produce are assembled for sale, was selected purposively. The retail outlets operating in the surrounding area were also canvassed for identification of marketing channels and other pertinent information. List of major market functionaries operating in the sample market and villages was prepared. Five operators from each of them were selected randomly.
Secondary data- secondary data with respect to area, production and yield of guava orchards, pertaining to the period from 1998-99 to 2008-09 onwards were collected from various published and unpublished documents available in different offices and libraries were cross-examined for their reliability
Primary data- Primary data, keeping in view the time and money constraint with respect to canvass a large number of farmers unevenly distributed throughout the district, it has been decided to adopt sample survey method of enquiry. Specifically prepared and pre-tested survey schedule was used to collect such data generated through personal interview of the respondents.
2.3 Analytical tools
International Journal of Agriculture and Environmental Research
ISSN: 2455-6939
Volume:02, Issue:05
www.ijaer.in Copyright © IJAER 2016, All right reserved Page 1497
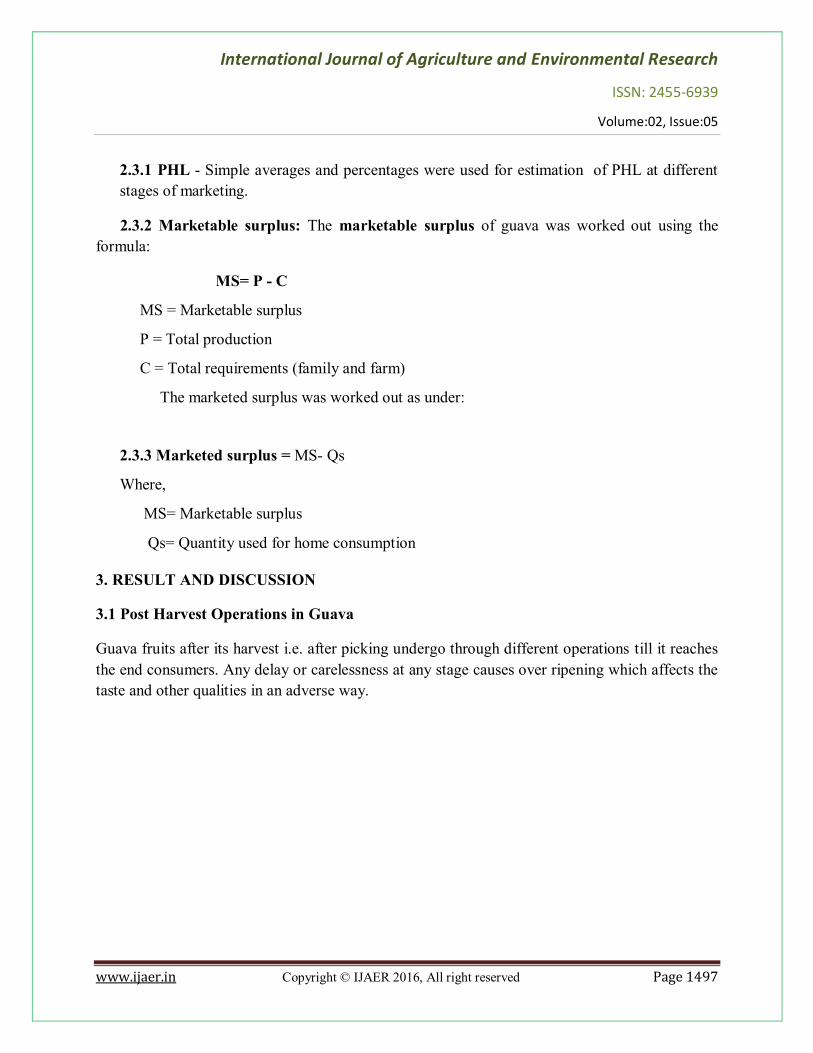
2.3.1 PHL - Simple averages and percentages were used for estimation of PHL at different stages of marketing.
2.3.2 Marketable surplus: The marketable surplus of guava was worked out using the formula:
MS= P - C
MS = Marketable surplus
P = Total production
C = Total requirements (family and farm)
The marketed surplus was worked out as under:
2.3.3 Marketed surplus = MS- Qs
Where,
MS= Marketable surplus
Qs= Quantity used for home consumption
3. RESULT AND DISCUSSION
3.1 Post Harvest Operations in Guava
Guava fruits after its harvest i.e. after picking undergo through different operations till it reaches the end consumers. Any delay or carelessness at any stage causes over ripening which affects the taste and other qualities in an adverse way.

International Journal of Agriculture and Environmental Research
ISSN: 2455-6939
Volume:02, Issue:05
www.ijaer.in Copyright © IJAER 2016, All right reserved Page 1498
Assembling processing
Grading
Packaging
Storage
Market
(Domestic/ International)
3.2 Physical Losses
Just after picking the first operation undertaken by the orchardists or pre harvest contractors was to sort out the degraded/damaged fruits. This damage is either due the over ripening, wounding or caused by insect pests or birds. Over damaged fruits are thrown away but a part of it which are partially damaged i.e. degraded below the standard limit are kept. Such fruits are usually consumed either at farm level or sold at very low prices to the consumers of very low grade or even to local processors. Average physical loss suffered due to such damages by the sample farmers at farm level are given in table 1 and 2

International Journal of Agriculture and Environmental Research
ISSN: 2455-6939
Volume:02, Issue:05
www.ijaer.in Copyright © IJAER 2016, All right reserved Page 1499
Table 3.2.1 Average Post Harvest Physical Losses at Farm Level (quintals / farm)
Size Group Total Fruits
Drawn
Raw Fruits (Good Quality)
Degraded / Damaged Fruits
Partially * Fully Total
Marginal
Small
Large
35.34
(100.00)
111.32
(100.00)
150.70
(100.00)
31.72
(89.76)
100.33
(90.13)
138.25
(91.74)
2.38
(6.74)
6.78
(6.09)
8.10
(5.37)
1.24
(3.50)
4.21
(3.78)
4.35
(2.89)
3.62
(10.24)
10.99
(9.87)
12.45
(8.26)
All Farms 114.24
(100.00)
104.05
(91.08)
6.51
(5.70)
3.68
(3.22)
10.19
(8.92)
Note - Figures in parentheses are percentage to total fruits drawn.
*Degraded but still usable.
Table- 3.2.1 depicts the average physical loss under the column “Damaged Fruits” on per farm
basis while table 6.15 indicates the same on per hectare basis. On an average, farmers suffer a physical loss of 8.92 percent which vary from farm to farm. Farm-wise distribution of physical losses reveal that a marginal farmer lost 10.24 percent of his output which was maximum among the considered farm size groups while a large farmer lost 8.26 percent which was minimum. Thus it can be concluded that larger is the of orchard size larger will be the output and lower will be the proportion of loss.

International Journal of Agriculture and Environmental Research
ISSN: 2455-6939
Volume:02, Issue:05
www.ijaer.in Copyright © IJAER 2016, All right reserved Page 1500
Table no. 3.2.2 Average Post Harvest Physical Losses at Farm Level
(Quintals/hectare)
Size Group Total Fruits
Drawn
Raw Fruits (Good Quality)
Degraded / Damaged Fruits
Partially * Fully Total
Marginal
Small
Large
145.67
148.21
158.73
130.75
133.58
145.62
9.81
9.03
8.53
5.11
5.60
4.58
14.92
14.63
13.11
All Farms 154.25 140.49 8.79 4.97 13.76
*Degraded but still usable.
3.3 Economic Losses
Price of guava fruits varied from season to season; beginning, peak harvesting, and end of the season; day to day; morning to evening or person to person. Prices received by the sample farmers were averaged by their groups for two grades i.e. good quality fruits and partially damaged fruits. Table- 3..3.1 gives the estimated value of total output and the actual returns. Difference between the two returns given the magnitudes of economic loss in rupee terms on per farm as well as per hectare basis

International Journal of Agriculture and Environmental Research
ISSN: 2455-6939
Volume:02, Issue:05
www.ijaer.in Copyright © IJAER 2016, All right reserved Page 1501
Table no. 3 .3.1- Average Post Harvest Economic Losses at Farm Level
Particulars Marginal Farms
Small Farms Large Farms All Farms
I. Average Price Realized for (Rs. per quintal)
(i) good quality fruits
(ii) partially damaged fruits
472
265
444
247
471
212
461
233
II. Per Farm; (in Rs.)
1. Average Return
(a) Estimated from total output *
(b) Actual from
(i) good quality fruits
(ii) partially damaged fruit
(iii) total return
[ b (i) + b (ii)]
2. Economic Loss
[a-b (iii)]
16,680.48
14,971.84
630.70
15,602.54
1,077.94
(6.46)
49426.08
44546.52
1674.66
46221.18
3204.90
(6.48)
70,979.70
65115.75
1,717.20
66.832.95
4,146.75
(5.84)
52,664.64
47,967.05
1516.83
49483.88
3180.76
(6.04)
III. Per Hectare (in Rs.)
1. Average Return
(a) Estimated from total output*
(b) Actual from
(i) good quality fruits
(ii) partially damaged fruits
68.756.24
61719.00
2,599.65
64318.65
65805.24
59331.95
2230.41
61562.36
74761.83
68625.79
180836
70434.15
71109.25
64765.89
2338.79
67104.68
International Journal of Agriculture and Environmental Research
ISSN: 2455-6939
Volume:02, Issue:05
www.ijaer.in Copyright © IJAER 2016, All right reserved Page 1502
(iii) total return
[b(i) + b (ii)]
2. Economic Loss
[a-b (iii)]
4437.59
4242.88
4327.68
4004.57
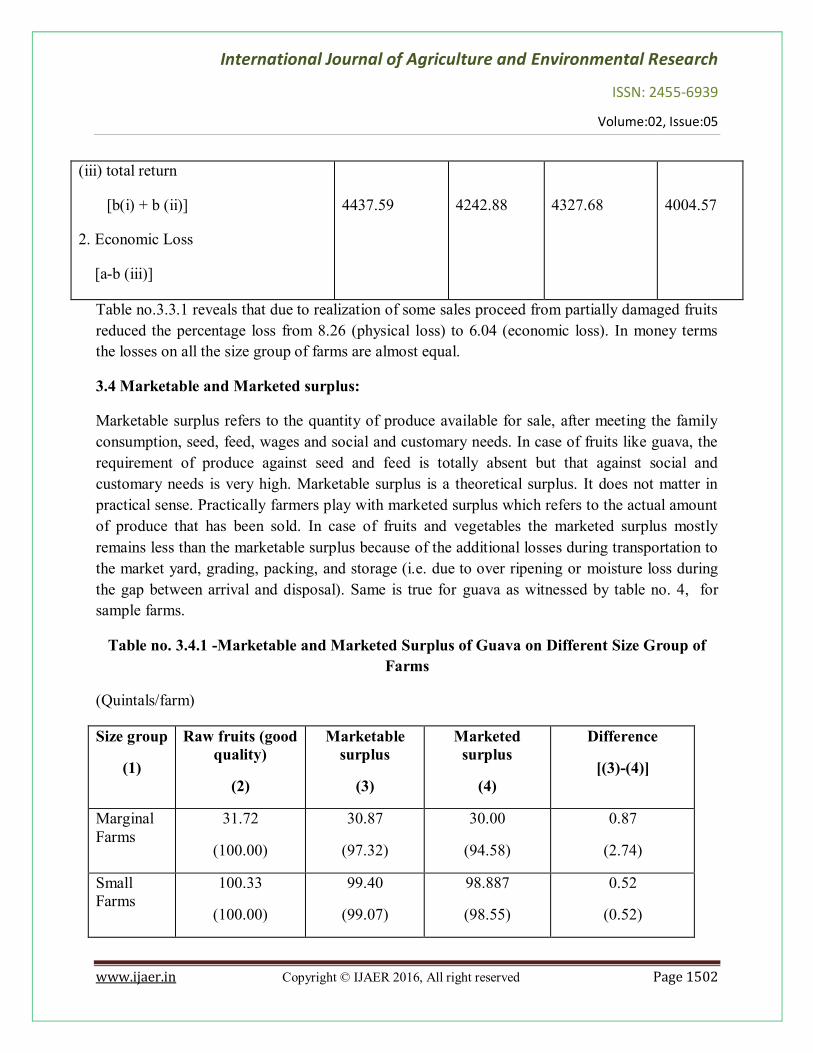
Table no.3.3.1 reveals that due to realization of some sales proceed from partially damaged fruits reduced the percentage loss from 8.26 (physical loss) to 6.04 (economic loss). In money terms the losses on all the size group of farms are almost equal.
3.4 Marketable and Marketed surplus:
Marketable surplus refers to the quantity of produce available for sale, after meeting the family consumption, seed, feed, wages and social and customary needs. In case of fruits like guava, the requirement of produce against seed and feed is totally absent but that against social and customary needs is very high. Marketable surplus is a theoretical surplus. It does not matter in practical sense. Practically farmers play with marketed surplus which refers to the actual amount of produce that has been sold. In case of fruits and vegetables the marketed surplus mostly remains less than the marketable surplus because of the additional losses during transportation to the market yard, grading, packing, and storage (i.e. due to over ripening or moisture loss during the gap between arrival and disposal). Same is true for guava as witnessed by table no. 4, for sample farms.
Table no. 3.4.1 -Marketable and Marketed Surplus of Guava on Different Size Group of Farms
(Quintals/farm)
Size group
(1)
Raw fruits (good quality)
(2)
Marketable surplus
(3)
Marketed surplus
(4)
Difference
[(3)-(4)]
Marginal Farms
31.72
(100.00)
30.87
(97.32)
30.00
(94.58)
0.87
(2.74)
Small Farms
100.33
(100.00)
99.40
(99.07)
98.887
(98.55)
0.52
(0.52)
International Journal of Agriculture and Environmental Research
ISSN: 2455-6939
Volume:02, Issue:05
www.ijaer.in Copyright © IJAER 2016, All right reserved Page 1503
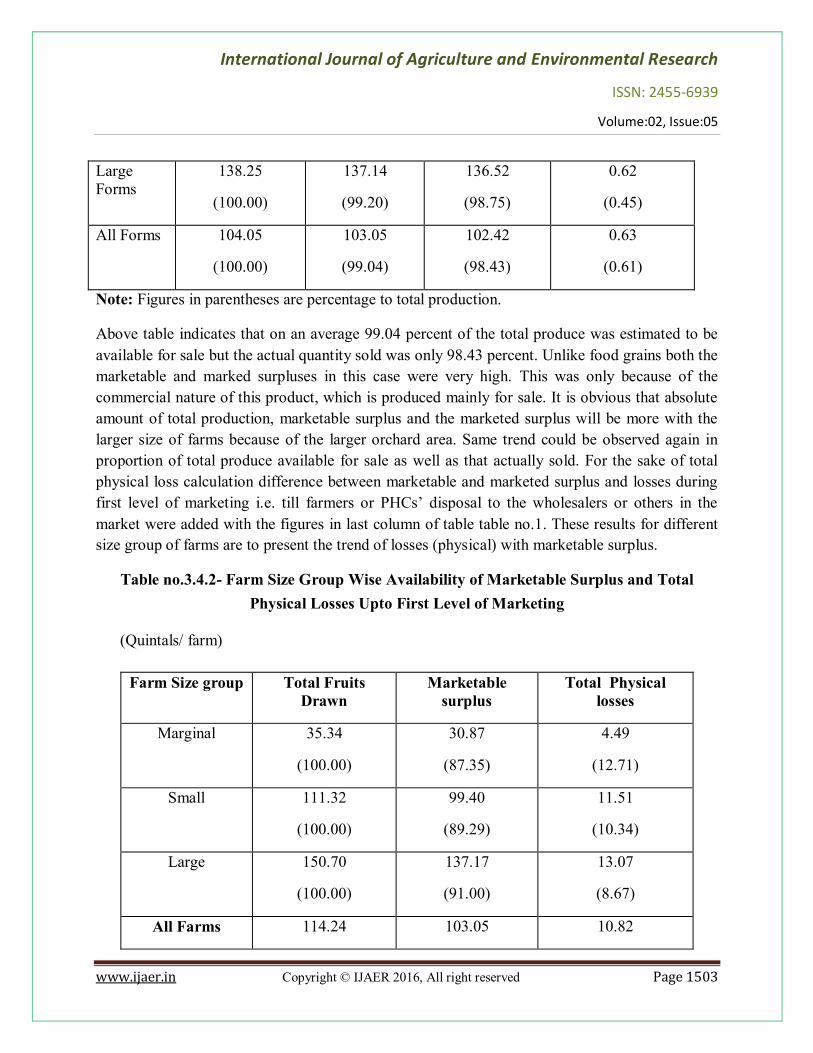
Large Forms
138.25
(100.00)
137.14
(99.20)
136.52
(98.75)
0.62
(0.45)
All Forms 104.05
(100.00)
103.05
(99.04)
102.42
(98.43)
0.63
(0.61)
Note: Figures in parentheses are percentage to total production.
Above table indicates that on an average 99.04 percent of the total produce was estimated to be available for sale but the actual quantity sold was only 98.43 percent. Unlike food grains both the marketable and marked surpluses in this case were very high. This was only because of the commercial nature of this product, which is produced mainly for sale. It is obvious that absolute amount of total production, marketable surplus and the marketed surplus will be more with the larger size of farms because of the larger orchard area. Same trend could be observed again in proportion of total produce available for sale as well as that actually sold. For the sake of total physical loss calculation difference between marketable and marketed surplus and losses during first level of marketing i.e. till farmers or PHCs’ disposal to the wholesalers or others in the
market were added with the figures in last column of table table no.1. These results for different size group of farms are to present the trend of losses (physical) with marketable surplus.
Table no.3.4.2- Farm Size Group Wise Availability of Marketable Surplus and Total Physical Losses Upto First Level of Marketing
(Quintals/ farm)
Farm Size group Total Fruits Drawn
Marketable surplus
Total Physical losses
Marginal 35.34
(100.00)
30.87
(87.35)
4.49
(12.71)
Small 111.32
(100.00)
99.40
(89.29)
11.51
(10.34)
Large 150.70
(100.00)
137.17
(91.00)
13.07
(8.67)
All Farms 114.24 103.05 10.82

International Journal of Agriculture and Environmental Research
ISSN: 2455-6939
Volume:02, Issue:05
www.ijaer.in Copyright © IJAER 2016, All right reserved Page 1504
(100.00) (90.20) (9.47)
Note: Figures in parentheses show the percentage to total fruits drawn form the Orchard.
Total physical losses born by the farmers / PHCs up to first level of marketing came to 9.47 percent of the total fruits drawn. And the real figure against marketable surplus was 90.20 percent. Farm size-group wise decomposition shows that the proportion of marketable surplus in total fruits harvested goes on increasing with the size of farm while that of total physical losses goes on decreasing. Thus, it can be concluded that higher the marketable surplus, lower is the loss on per unit of guava production.
4. Reasons for Post Harvest Losses and Its Preventive Measures
(i) Maximum losses at harvesting stage are mainly because of the use of traditional methods. To prevent it, it is advisable to adopt some improved methods such as net picking in proper stage of ripening i.e. when fruits start yellowing.
(ii) Owing to tender texture and high moisture content, guava fruits are highly susceptible to mechanical injury. Careful picking and handling of fruits may reduce such losses to some extent.
(iii) Traditionally, fruits are kept in open after harvest. Such places are highly prone to insects and fungal attacks. But, some of the progressive formers store them under cover or in sheds. This practice minimized the loss and hence recommended to all farmers.
(iv) Post harvest losses occur also because of the non use of proper scientific methods of grading and packing. Fruits are either packed in proper cartons or wooden baskets in unscientific manner. But, now days farmers started realizing their fault and trying to correct them.
(v) For transportation, generally ordinary trucks, tractors tempos and even traditional carts are used. Also, irresponsible way of loading, unloading, driving, rough roads, unsuitable transport containers, overloading of mixed fruits and vegetable etc., cause significant injuries. Link roads from villages to the main roads are mostly graveled type which also causes considerable damages to the fruits. Use of proper methods and means of transportation may reduce the quantum of losses caused during the transportation.
(vi) Although guava is a winter season crop, even it requires, low temperature while transport and storage to check its speed of degradation. For this it needs insulated containers with refrigeration facility for transport. Also for storage it needs properly ventilated stores. In

International Journal of Agriculture and Environmental Research
ISSN: 2455-6939
Volume:02, Issue:05
www.ijaer.in Copyright © IJAER 2016, All right reserved Page 1505
absence of such facilities farmers are bound to sell their produce as soon as possible, otherwise they would suffer a huge loss.
(vii) Virtually, there is no storage specifically meant for guava in Allahabad. Farmers sell it as soon as it is harvested. It may be kept overnight and then sold in the market. Usually, fruits are harvested in early morning and then sent to the market. Arrangement of cold storage facility in the area may increase the bargaining power of farmers as they may retain their produce for relatively longer period, if not sold at remunerative pries.
(viii) Retailers too do not have any proper storage facility but they minimize their loss by averaging their prices and sell the degraded guava at very low prices either to the poor consumers or to the local processors, who make its jelly, nector, jam, pulp, powder, pills, tophee etc. at small scale.
(ix) Farmer’s negligent attitude towards post harvest losses, lack of quality consciousness and absence of fruit processing units in the area are responsible for huge post harvest losses. Lack of quality consciousness on the part of producers increases post harvest losses on one hand and on the other lack of the hygienic awareness among the lower class consumer, save many produce from complete wastage. It reduces quantitative loss of horticulture produce, though it is hazardous for human health.
REFERENCES
Biswas, M.K (1969), “Wastage of orange in transit to Varanasi,” Agricultural marketing, vol.12, no.4, pp 11-16. Hardenburg, R.E., A.E. Watada, and C.Y. Wang. The Commercial Storage of Fruits, Vegetables, and Florist and Nursery Stocks. U.S. Dept. of Agriculture, Agricultural Handbook No 66 130 pp. 1986 FAO (1981), Food loss prevention in perishable crop, Agricultural service Bulletin, 43, Rome Gajanana, T.M, D. Sreenivasan Murthy and Suddha (2002) “Marketing practices & post harvest
loss assessment of banana varieties Poovan in Tamil Nadu”, Agricultural Economics Research
Review, Vol.15 no.1 pp-56-65

International Journal of Agriculture and Environmental Research
ISSN: 2455-6939
Volume:02, Issue:05
www.ijaer.in Copyright © IJAER 2016, All right reserved Page 1506
Krishna, P.V (1976), “Marketing of fruits through cooperative society-A case study”. Indian
journal of Agricultural Marketing, Vol.7 no.1 pp2.27-32 Madan, M.S and B. A Ullasa (1993), “Post harvest loses in fruit”, in K.L Chadha and O.P Pareek (EDS) (1995) Advances in horticulture, Fruits crops part IV, Malhotra publishing house, New Delhi. Ratnam C.V & K.G Neema (1967), “Studies on market diseases of fruits & vegetables”, Andhra
Agricultural Journal, vol.14, pp-66-65
Ryall, A.L. and W.T. Pentzer. Handling, Transportation, and Storage of Fruits and Vegetables. Vol. 2. Fruits and Tree Nuts (2nd ed.) AVI Pub. Co., Westport, Connecticut, USA. 610 pp. 1982
Ryall, A.L. and W.J. Lipton(1979) “ Handling, Transportation, and Storge of Fruits and Vegetables”. Vol.1. Vegetables and Melons. (2nd ed.) AVI Pub. Co., Westport, Connecticut, USA, 587 pp. 1979. Sreenivas Murthy, D, T.M Gajanna & M. Sudha (2004) “ Post harvest loss estimation &its
impact on marketing cost, margin & efficiency- A study in grapes in Karnataka”, Indian
Agricultural Economics, vol.54 no.4 Oct-Dec, pp-772-786 Subhrahmanayam, K.V(1986) “Post harvest losses in horticultural crops: An appraisal.”
Agricultural Situation in India, Vol.41 August, pp.339-343 Waheed, A.M.Z Iqubal & F.H Shah (1986) “Post Harvest loses in vegetable”, Pakistan Journal
of scientific & Industrial Research, Vol.29, pp268-273 -