SAN FRANCISCO BAY REGION WORKPLAN MONITORING SPRING PHYTOPLANKTON
Copyright # 2004 John Wiley & Sons, Ltd. Received 19 March 2003Accepted 25 January 2004
AQUATIC CONSERVATION: MARINE AND FRESHWATER ECOSYSTEMS
Aquatic Conserv: Mar. Freshw. Ecosyst. 14: 551–574 (2004)
Published online 15 October 2004 in Wiley InterScience(www.interscience.wiley.com). DOI: 10.1002/aqc.625
Study on limiting nutrients and phytoplankton at long-line-culture areas in Laizhou Bay and Sanggou Bay,
northeastern China
HUI LIUa, JIANGUANG FANGa,*, JIANXIN ZHUa, SHUANGLIN DONGb, FANG WANGb,XINGMING LIANGa, JIHONG ZHANGa, YAN LIANc, LICHAO WANGc and WEIWEI JIANGd
aYellow Sea Fisheries Research Institute, Chinese Academy of Fishery Sciences, Qingdao 266071,
People’s Republic of ChinabDepartment of Fisheries Sciences, Fishery College, Ocean University of China, Qingdao 266003,
People’s Republic of ChinacRongcheng Fishery Research Institue, Rongcheng, Shandong Province, People’s Republic of China
dFishery Management Bureau of Jincheng Town, Laizhou, Shandong Province, People’s Republic of China
ABSTRACT
1. Concentrations of major nutrients (NH4+-N, NO3
�-N, NO2�-N, HPO4
�-P, Si(OH)4-Si) weremeasured, nutrient enrichment experiments (oxygen-production bioassay) were conducted andphytoplankton were analysed at typical long-line-culture areas in Laizhou Bay and Sanggou Bay,northeastern China, from March 2001 to March 2002.2. Generally, much variation of nutrient indices was detected among the sampling stations,
between the two bays and in different seasons: the concentration of dissolved inorganic nitrogen(DIN) fluctuated more violently and ranged much more widely in Sanggou Bay. N-limitation wasusually found in both bays, and the ranking of limiting potentials of major nutrients wasN>Fe>P=Si in Laizhou Bay and N>P>Fe>Si in Sanggou Bay. Diatoms dominated thephytoplankton community in Sanggou Bay, but only dominated in eight months (with flagellatesdominant in four months) in Laizhou Bay.3. Linear and nonparametric correlation analyses suggested that a large number of the nutrient
and phytoplankton variables measured have intrinsic relationships within themselves. Much morecomplicated correlations between phytoplankton and nutrient indices were found in Laizhou Baythan in Sanggou Bay. This, together with the violent fluctuations of DIN concentrations, indicated amore fragile ecosystem stability in Sanggou Bay.4. The relatively exposed locations and less crowded settings of the rafts in the long-line-culture
areas in Laizhou Bay allowed for a better water exchange, and the effect of aquaculture activityon the environment was not significant. Because of the intensity of aquaculture activities inSanggou Bay, the biological, chemical and physical characteristics in the bay are greatly affected; a
*Correspondence to: J.-G. Fang, Yellow Sea Fisheries Research Institute, Chinese Academy of Fishery Sciences, Qingdao 266071,People’s Republic of China. E-mail: [email protected]
reduced cultivation density based on more comprehensive studies of carrying capacity of the bayis suggested.Copyright # 2004 John Wiley & Sons, Ltd.
KEY WORDS: Laizhou Bay; Sanggou Bay; China; limiting nutrient; phytoplankton; long-line-culture
INTRODUCTION
Research on limiting nutrients has been carried out worldwide since the 1920s. Redfield (1934) deduced thatan N/P ratio of 16:1 was the most widely occurring nutrient ratio in oceanic water bodies and the mostappropriate ratio for phytoplankton metabolism. Most of the subsequent work has been based on thefoundation of this theory. Similar methods have been used in identifying limiting nutrients, with resultsvarying throughout global water bodies. It is widely accepted that N is the limiting nutrient in oceanic waters(Thomas, 1970a,b; Goldman et al., 1979), that P is more often limiting in fresh waters (Schindler, 1971, 1974,1977; Vollenweider, 1976) and that N and P limit primary production alternatively in estuarine waters (Linand Schelske, 1981; Fisher et al., 1992; Maestrini et al., 1997). As more and more water bodies around theworld have been investigated and as the methodology has improved, antitheses have also emerged, with N-limited net production found in freshwater lakes (Smith, 1982), as well as P-limited (Redfield, 1958;Thingstad et al., 1998; Sanudo-Wilhelmy et al., 2001) and other element-limited oceanic waters (Martin andFitzwater, 1988; Landry et al., 1997; Dugdale and Wilkerson, 1998; Hutchins and Bruland, 1998).
Nutrients are important indicators of the chemical characteristics for a water body. When nutrients existin a state of shortage in concentration or imbalance in ratio, they can become limiting to primaryproduction (Lobban et al., 1985). Nutrients may impose positive or negative effects on aquaculture speciesthrough the food chain; however, aquaculture can also affect water quality by changing the status oflimiting nutrients, causing these nutrients to exhibit greater unevenness and variability.
Although aquaculture is widely practised in coastal waters around the world, the impact of aquacultureon the environment has not been sufficiently investigated and little is known about the interactions betweenphytoplankton and aquaculture species (Chen et al., 1996; Boyd and Tucker, 1998; Ogilvie et al., 2000;Delesalle et al., 2001). Taking this into consideration, and with the aim of better protecting the marineenvironment of mariculture areas, the Chinese Ministry of Science and Technology funded the programmeof Fundamental Research on Disease Occurrence and Disease Resistance of Major Mariculture Species.The project ‘Mechanisms of Mutual Benefits between Species and the Environmental Effects of Polyculture’is part of this programme, and involved the study on limiting nutrients of Laizhou Bay and Sanggou Bay inShandong Peninsula, northeastern China. In this study, annual succession of phytoplankton, annualvariation of major nutrients, and the limiting effect of these nutrients were examined in order to investigatethe impact of raft-culture on the marine environment.
Laizhou Bay is located in the south of Bohai Sea (378000–388300N, 1188450–1208300E; Figure 1) with atotal area of 6966.93 km2 (Compilation Committee of Chinese Bays, 1991). The bottom of the bay is ratherflat, with an average depth of only 9m. Many rivers, including the Yellow River, run into Laizhou Bay. It ishistorically a spawning ground for a large number of fish species. Since 1980, aquaculture has been a fast-growing enterprise in Laizhou Bay coastal waters. With shrimp and finfish farms spread all along theshoreline and long-line rafts in the coastal area of the bay, it has become one of the most importantaquaculture areas in northern China. The bay scallop (Argopecten irradians) is the major long-line-culturespecies in Laizhou Bay. Since its initiation in 1987, the practice of long-line-culture in the bay reached apeak capacity in 1994, with a total culture area of 15 000 mu, and then slowly decreased to 8000 mu in 2001.The ‘mu’ is a density-related unit widely used in aquaculture in China, but different actual sea areas aretaken by a single mu in different localities. A brief definition of ‘mu’ and the present production levels ofbivalves in Laizhou Bay and Sanggou Bay are given in Table 1.
H. LIU ET AL.552
Copyright # 2004 John Wiley & Sons, Ltd. Aquatic Conserv: Mar. Freshw. Ecosyst. 14: 551–574 (2004)
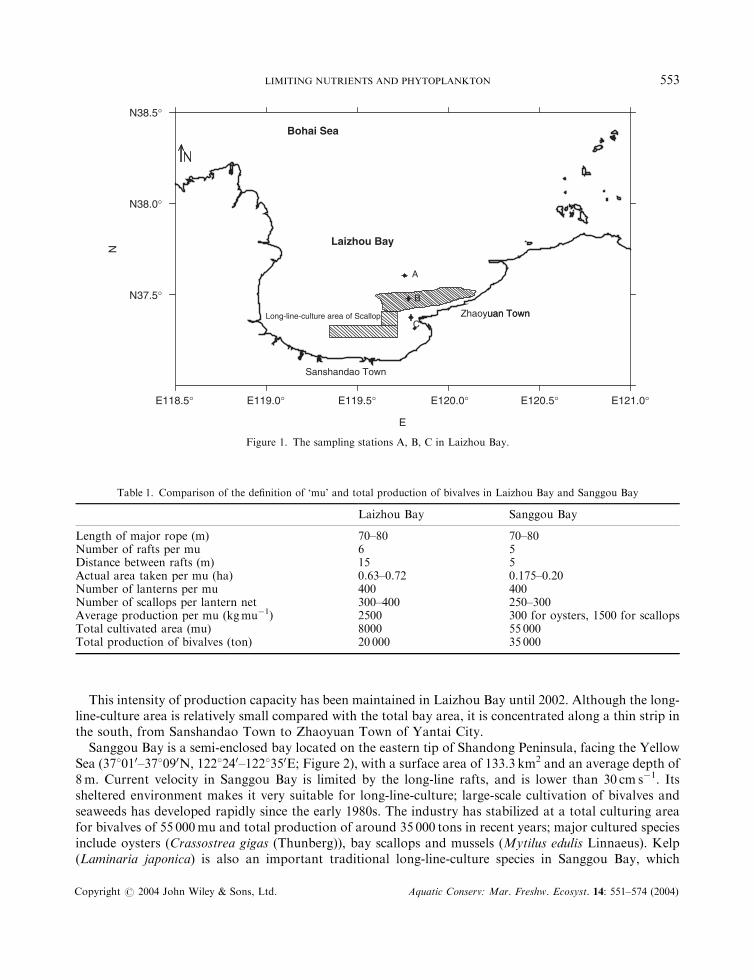
This intensity of production capacity has been maintained in Laizhou Bay until 2002. Although the long-line-culture area is relatively small compared with the total bay area, it is concentrated along a thin strip inthe south, from Sanshandao Town to Zhaoyuan Town of Yantai City.
Sanggou Bay is a semi-enclosed bay located on the eastern tip of Shandong Peninsula, facing the YellowSea (378010–378090N, 1228240–1228350E; Figure 2), with a surface area of 133.3 km2 and an average depth of8m. Current velocity in Sanggou Bay is limited by the long-line rafts, and is lower than 30 cm s�1. Itssheltered environment makes it very suitable for long-line-culture; large-scale cultivation of bivalves andseaweeds has developed rapidly since the early 1980s. The industry has stabilized at a total culturing areafor bivalves of 55 000mu and total production of around 35 000 tons in recent years; major cultured speciesinclude oysters (Crassostrea gigas (Thunberg)), bay scallops and mussels (Mytilus edulis Linnaeus). Kelp(Laminaria japonica) is also an important traditional long-line-culture species in Sanggou Bay, which
E118.5° E119.0° E119.5° E120.0° E120.5° E121.0°
E
N38.5°
N38.0°
N37.5°
N
Long-line-culture area of Scallop
Bohai Sea
Sanshandao Town
Zhaoyuan Townuan Town
Laizhou Bay
B
C
A
Figure 1. The sampling stations A, B, C in Laizhou Bay.
Table 1. Comparison of the definition of ‘mu’ and total production of bivalves in Laizhou Bay and Sanggou Bay
Laizhou Bay Sanggou Bay
Length of major rope (m) 70–80 70–80Number of rafts per mu 6 5Distance between rafts (m) 15 5Actual area taken per mu (ha) 0.63–0.72 0.175–0.20Number of lanterns per mu 400 400Number of scallops per lantern net 300–400 250–300Average production per mu (kgmu�1) 2500 300 for oysters, 1500 for scallopsTotal cultivated area (mu) 8000 55 000Total production of bivalves (ton) 20 000 35 000
LIMITING NUTRIENTS AND PHYTOPLANKTON 553
Copyright # 2004 John Wiley & Sons, Ltd. Aquatic Conserv: Mar. Freshw. Ecosyst. 14: 551–574 (2004)

achieved a production of 40 000 tons (dry weight) from a cultivation area of 80 000mu in 2001. The kelpcultivation area has now reached far out of the bay.
SAMPLING AND METHODS
Sampling
Twelve experiments were conducted, at approximately monthly intervals, from March 2001 to March 2002in both Laizhou Bay and Sanggou Bay.
Surface-water samples containing natural phytoplankton were collected from all three stations in bothLaizhou Bay and Sanggou Bay (Figures 1 and 2, Table 2). In Laizhou Bay, water samples were taken froma speedboat, mostly between 9:00 and 10:00 a.m., from N37830.8640, E119845.5070 (station A, ‘mouth of thebay’), N37829.2640, E119845.4050 (station B, ‘middle part of the bay and scallop-culture area’) andN37828.4540, E119845.1570 (station C, ‘shoreline of the bay’). In Sanggou Bay, water samples were taken bya ship of the Fisheries Bureau of Rongcheng City, mostly between 9:00 and 12:00 a.m., from N37807.0140,E122834.1400 (station A, ‘mouth of the bay, long-line-culture area for kelp’), N37804.9790, E122830.4980
N37°0'
N37°5'
N37°10'
Rongcheng City
C
A
B
shellfish
kelp
E122°25' E122°30' E122°35'
Sanggou Bay
Figure 2. The sampling stations A, B, C in Sanggou Bay.
Table 2. Sampling stations in Laizhou Bay and Sanggou Bay
Location Station A Station B Station C
Mouth of the bay Middle part of the bay Shoreline of the bay
Laizhou Bay N37830.8640, E119845.5070 N37829.2640, E119845.4050 N37828.4540, E119845.1570
Sanggou Bay N37807.0140, E122834.1400 N37804.9790, E122830.4980 N37808.3480, E122830.1180
H. LIU ET AL.554
Copyright # 2004 John Wiley & Sons, Ltd. Aquatic Conserv: Mar. Freshw. Ecosyst. 14: 551–574 (2004)
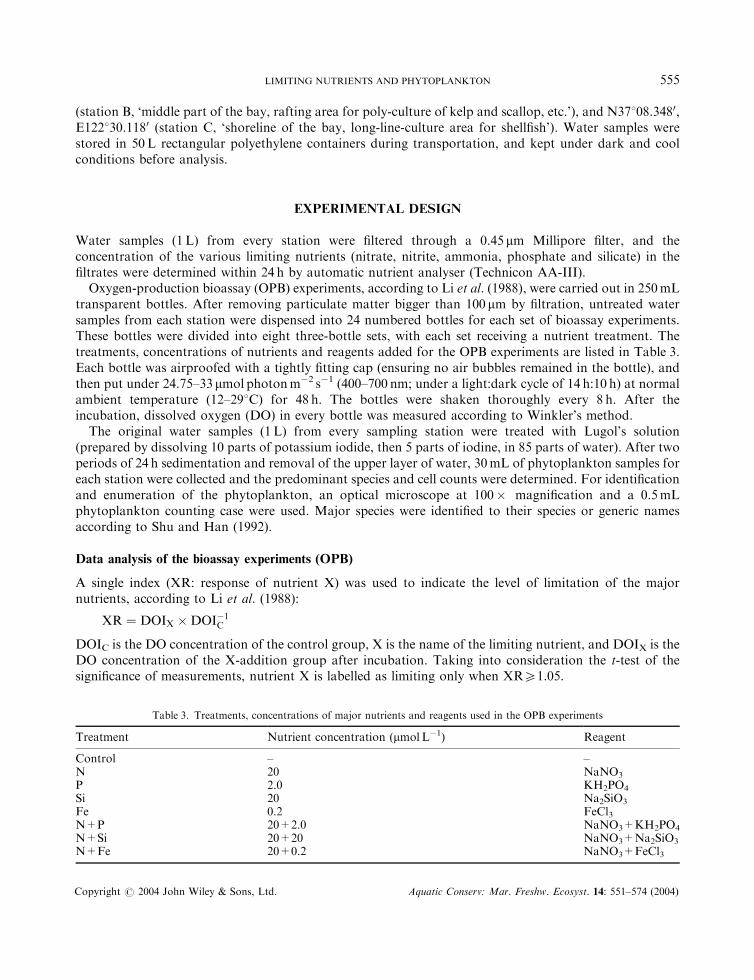
(station B, ‘middle part of the bay, rafting area for poly-culture of kelp and scallop, etc.’), and N37808.3480,E122830.1180 (station C, ‘shoreline of the bay, long-line-culture area for shellfish’). Water samples werestored in 50L rectangular polyethylene containers during transportation, and kept under dark and coolconditions before analysis.
EXPERIMENTAL DESIGN
Water samples (1 L) from every station were filtered through a 0.45 mm Millipore filter, and theconcentration of the various limiting nutrients (nitrate, nitrite, ammonia, phosphate and silicate) in thefiltrates were determined within 24 h by automatic nutrient analyser (Technicon AA-III).
Oxygen-production bioassay (OPB) experiments, according to Li et al. (1988), were carried out in 250mLtransparent bottles. After removing particulate matter bigger than 100 mm by filtration, untreated watersamples from each station were dispensed into 24 numbered bottles for each set of bioassay experiments.These bottles were divided into eight three-bottle sets, with each set receiving a nutrient treatment. Thetreatments, concentrations of nutrients and reagents added for the OPB experiments are listed in Table 3.Each bottle was airproofed with a tightly fitting cap (ensuring no air bubbles remained in the bottle), andthen put under 24.75–33 mmol photonm�2 s�1 (400–700 nm; under a light:dark cycle of 14 h:10 h) at normalambient temperature (12–298C) for 48 h. The bottles were shaken thoroughly every 8 h. After theincubation, dissolved oxygen (DO) in every bottle was measured according to Winkler’s method.
The original water samples (1 L) from every sampling station were treated with Lugol’s solution(prepared by dissolving 10 parts of potassium iodide, then 5 parts of iodine, in 85 parts of water). After twoperiods of 24 h sedimentation and removal of the upper layer of water, 30mL of phytoplankton samples foreach station were collected and the predominant species and cell counts were determined. For identificationand enumeration of the phytoplankton, an optical microscope at 100� magnification and a 0.5mLphytoplankton counting case were used. Major species were identified to their species or generic namesaccording to Shu and Han (1992).
Data analysis of the bioassay experiments (OPB)
A single index (XR: response of nutrient X) was used to indicate the level of limitation of the majornutrients, according to Li et al. (1988):
XR ¼ DOIX �DOI�1C
DOIC is the DO concentration of the control group, X is the name of the limiting nutrient, and DOIX is theDO concentration of the X-addition group after incubation. Taking into consideration the t-test of thesignificance of measurements, nutrient X is labelled as limiting only when XR51.05.
Table 3. Treatments, concentrations of major nutrients and reagents used in the OPB experiments
Treatment Nutrient concentration (mmolL�1) Reagent
Control – –N 20 NaNO3
P 2.0 KH2PO4
Si 20 Na2SiO3
Fe 0.2 FeCl3N+P 20+2.0 NaNO3+KH2PO4
N+Si 20+20 NaNO3+Na2SiO3
N+Fe 20+0.2 NaNO3+FeCl3
LIMITING NUTRIENTS AND PHYTOPLANKTON 555
Copyright # 2004 John Wiley & Sons, Ltd. Aquatic Conserv: Mar. Freshw. Ecosyst. 14: 551–574 (2004)

Simpson’s diversity index
Simpson’s diversity index (D value) was used to calculate the diversity of phytoplankton:
D ¼ 1�XS
i¼1
P2i
where Pi is the ratio of the number of cells of species i to the total number of cells of all the phytoplanktonspecies.
Statistical analysis
The statistics software package SPSS (Statistical Package for the Social Sciences) version 10.0 (from SPSSInc. 1989–1999) was used for all the data analysis. For bivariate statistical analysis, the Pearson andSpearman correlation coefficients were used to measure the degree of association between the variables.
RESULTS
All chemical, physical, biological and biochemical factors measured in this study are presented inFigures 3–6 and listed in Table 4. True values are indicated in the figures, but only means and standarddeviations of the true values are given in Table 4.
Nutrient enrichment experiments (OPB)
The limiting effect of nutrients varied greatly with the seasons and between sampling stations in LaizhouBay (Table 4 and Figure 3). The experimental results for all the 12 months showed significant nutrientlimitation at all three stations. N limitation occurred in 66.7% of all experiments, a greater frequency thanFe>P=Si limitation. Seasonally, spring and summer had seen more nutrient limitation than winter andautumn. The sequence of limitation potential of the major nutrients is P>Si>N>Fe in spring, andN>Fe>Si>P in summer, when strong limitation of the four major nutrients was found. Although ‘nosignificant limitation’ (especially of Si, Fe, or P) was detected in a large proportion of the experimentsduring autumn and winter surveys, small variations signified some difference between the two seasons, inthat P showed more inclination to limitation than Fe or Si in autumn, whereas the ratio nearly reversed inwinter. Among all the limiting nutrients studied, the potency of N limitation (29.2–31.3%) varied the leastbetween the stations. At station A, ranking of limiting potential of the nutrients is N=Fe>Si>P. At bothstations B and C, ranking of limiting elements is N>P>Si = Fe.
In Sanggou Bay, 13.9% of the annual surveys detected ‘no significant limitation’. However, N limitationoccurred more frequently (69.4%) than P>Fe>Si limitation, which was the case during more than half ofthe surveys. Nutrient limitation in springtime was the most potent, and it declined all through summer,autumn, and winter. In spring, N limitation occurred in all surveys, and Si limitation occurred in 88.9% ofall surveys, more frequently than Si or Fe limitation. In summer and autumn, P limitation was moresignificant, when both Fe and N also showed strong limiting potential. N limitation was the most potent atstation A and C; whereas at station B, P limitation was the most potent. The ranking of limiting potential ofthe nutrients is N>P=Si=Fe at station A, P>N>Fe>Si at station B, and N>Si>P=Fe at station C.
Phytoplankton analysis
The phytoplankton species in both bays varied greatly in different months (Table 4 and Figure 4). Diatomsand flagellates occurred in Laizhou Bay, whereas only diatoms dominated in Sanggou Bay for most of thetime. The dominant phytoplankton species found in Laizhou Bay and Sanggou Bay are given in Table 5;
H. LIU ET AL.556
Copyright # 2004 John Wiley & Sons, Ltd. Aquatic Conserv: Mar. Freshw. Ecosyst. 14: 551–574 (2004)

OPB experiment results in Laizhou BayStation A
OPB experiment results in Laizhou BayStation B
OPB experiment results in Sanggou BayStation B
OPB experiment results in Sanggou BayStation C
OPB experiment results in Sanggou BayStation A
OPB experiment results in Laizhou BayStation C
Figure 3. Annual variation of OPB experiment results (NR, PR, SiR and FeR) in Laizhou Bay and Sanggou Bay, March 2001–March2002.
LIMITING NUTRIENTS AND PHYTOPLANKTON 557
Copyright # 2004 John Wiley & Sons, Ltd. Aquatic Conserv: Mar. Freshw. Ecosyst. 14: 551–574 (2004)
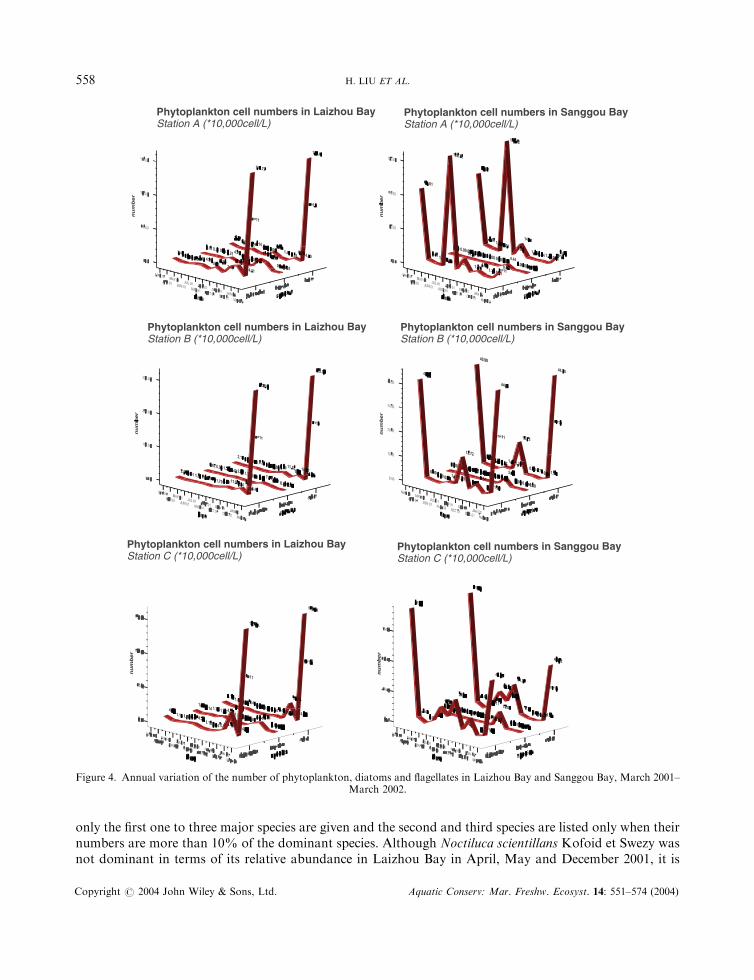
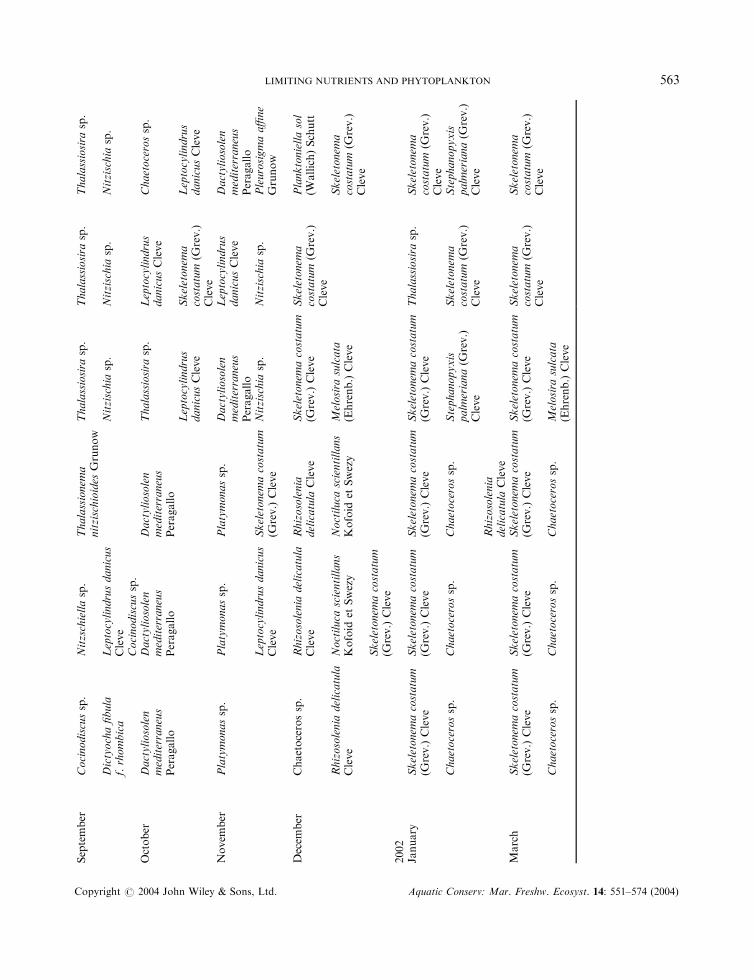
only the first one to three major species are given and the second and third species are listed only when theirnumbers are more than 10% of the dominant species. Although Noctiluca scientillans Kofoid et Swezy wasnot dominant in terms of its relative abundance in Laizhou Bay in April, May and December 2001, it is
Phytoplankton cell numbers in Laizhou BayStation A (*10,000cell/L)
Phytoplankton cell numbers in Laizhou BayStation B (*10,000cell/L)
Phytoplankton cell numbers in Laizhou BayStation C (*10,000cell/L)
Phytoplankton cell numbers in Sanggou BayStation A (*10,000cell/L)
Phytoplankton cell numbers in Sanggou BayStation B (*10,000cell/L)
Phytoplankton cell numbers in Sanggou BayStation C (*10,000cell/L)
Figure 4. Annual variation of the number of phytoplankton, diatoms and flagellates in Laizhou Bay and Sanggou Bay, March 2001–March 2002.
H. LIU ET AL.558
Copyright # 2004 John Wiley & Sons, Ltd. Aquatic Conserv: Mar. Freshw. Ecosyst. 14: 551–574 (2004)
Concentration of limiting nutrients in Laizhou BayStation A (�mol/L)
Concentration of limiting nutrients in Laizhou Bay
Station B (�mol/L)
Concentration of limiting nutrients in Laizhou BayStation C (�mol/L)
Concentration of limiting nutrients in Sanggou Bay
Station B (�mol/L)
Concentration of limiting nutrients in Sanggou BayStation C (�mol/L)
Concentration of limiting nutrients in Sanggou BayStation A (�mol/L)
Co
nce
ntr
atio
nC
on
cen
trat
ion
Co
nce
ntr
atio
n
Co
nce
ntr
atio
nC
on
cen
trat
ion
Co
nce
ntr
atio
n
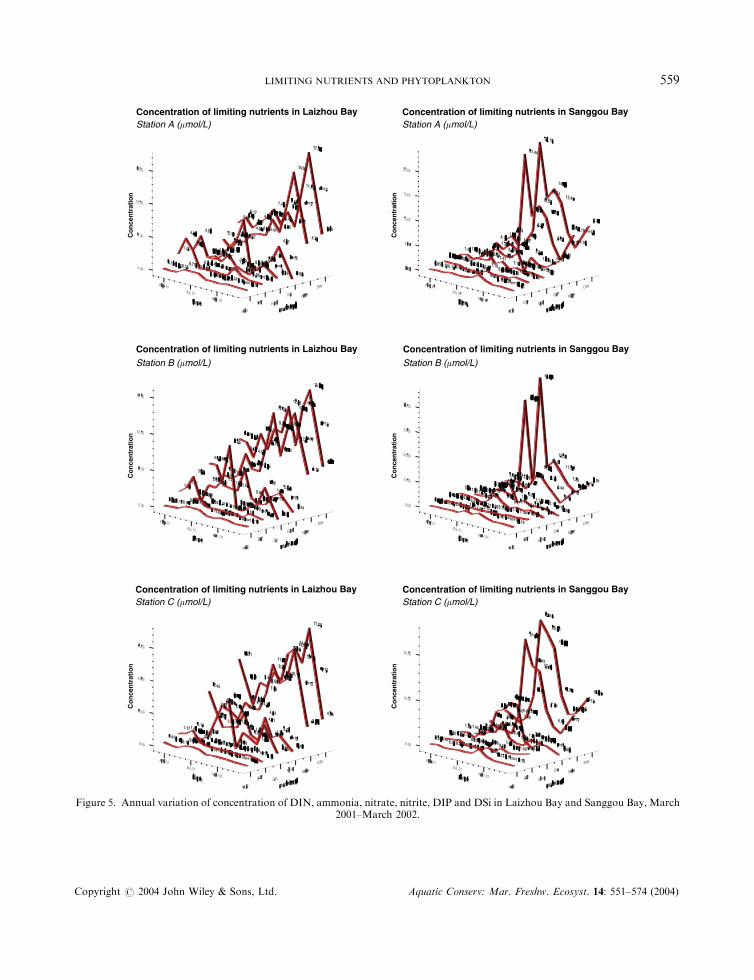
Figure 5. Annual variation of concentration of DIN, ammonia, nitrate, nitrite, DIP and DSi in Laizhou Bay and Sanggou Bay, March2001–March 2002.
LIMITING NUTRIENTS AND PHYTOPLANKTON 559
Copyright # 2004 John Wiley & Sons, Ltd. Aquatic Conserv: Mar. Freshw. Ecosyst. 14: 551–574 (2004)
Physical factors and Simpson's Diversity Index in Laizhou Bay
Station A
Physical factors and Simpson's Diversity Index in Laizhou Bay
Station A
Physical factors and Simpson's Diversity Index in Laizhou Bay
Station C
Physical factors and Simpson's Diversity Index in Laizhou Bay
Station B
Physical factors and Simpson's Diversity Index in Laizhou BayStation B
Physical factors and Simpson's Diversity Index in Laizhou Bay
Station C
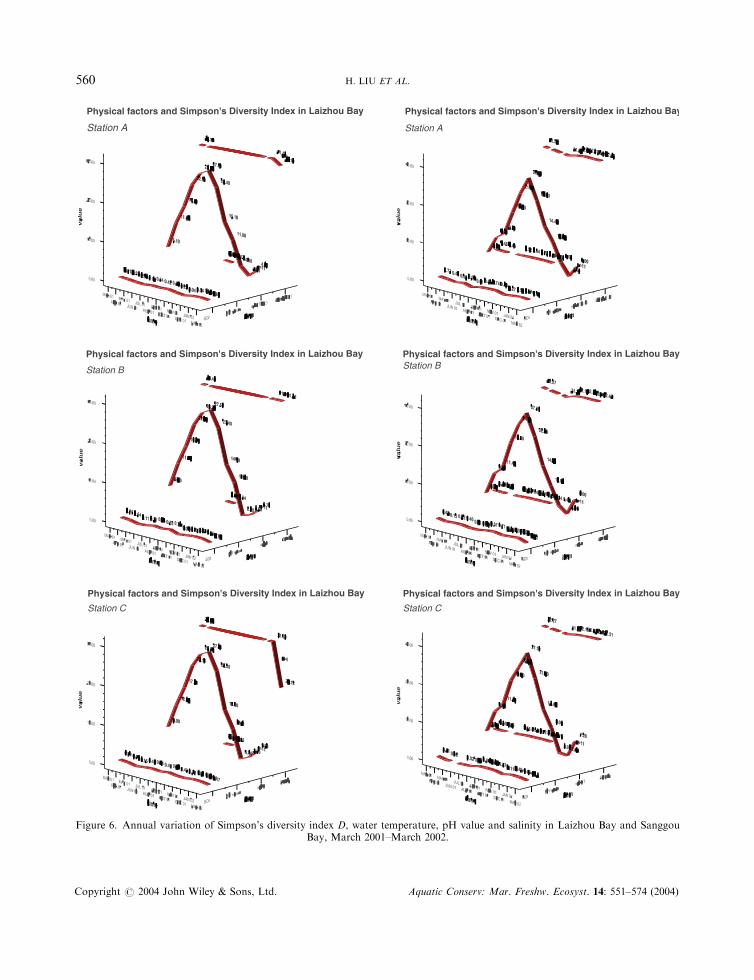
Figure 6. Annual variation of Simpson’s diversity index D, water temperature, pH value and salinity in Laizhou Bay and SanggouBay, March 2001–March 2002.
H. LIU ET AL.560
Copyright # 2004 John Wiley & Sons, Ltd. Aquatic Conserv: Mar. Freshw. Ecosyst. 14: 551–574 (2004)
listed in Table 5 because of the significant volume of cells present, such that the water took on a light pinkcolour.
In both Laizhou Bay and Sanggou Bay, the cell numbers of phytoplankton reached the highest point inspring, when blooms of diatoms occurred. But there was an exception in Sanggou Bay, where a diatombloom also happened at station A in July (Figure 4).
The D values (Simpson’s diversity index) fluctuated in a similar manner among the three samplingstations in Laizhou Bay; in Sanggou Bay, however, the D values for the three sampling stations showed asimilar pattern only after the harvest of raft-cultured kelp in August (Figure 6).
Variation of nutrient factors
In Laizhou Bay, concentrations of nitrate, nitrite, ammonia and dissolved inorganic nitrogen(DIN=nitrate+nitrite+ammonia) ranged between 1.03 and 14.93 mmolL�1, between 0.02 and0.78mmolL�1, between 0.30 and 6.44mmolL�1 and between 3.68 and 17.55mmolL�1, respectively (Figure 5).Concentrations of DIP and DSi ranged between 0.10 and 4.33 mmolL�1 and between 0.00 and 8.25 mmolL�1
respectively. Ratios of P:N, Si:N and Si:P ranged between 1.15 and 128.61, between 0.00 and 0.92 andbetween 0.00 and 26.87 respectively. According to the annual means, the highest concentrations of DIN andTSi and ratios of N:P and Si:N were found at station C; the highest DIP was found at station B, and thehighest ratio of Si:P was found at station A.
In Sanggou Bay, concentrations of DIN ranged from 1.36 to 45.88 mmolL�1, and the concentrations ofnitrate, nitrite and ammonia ranged between 0.20 and 38.69 mmolL�1, between 0.05 and 2.12 mmolL�1 andbetween 0.59 and 5.63 mmolL�1. The ranges of DIP and DSi were 0.21–1.90 mmolL�1 and 0.00–8.68 mmolL�1 respectively. Ratios of N:P, Si:N and Si:P ranged from 1.48 to 149.94, from 0.00 to 2.84 and
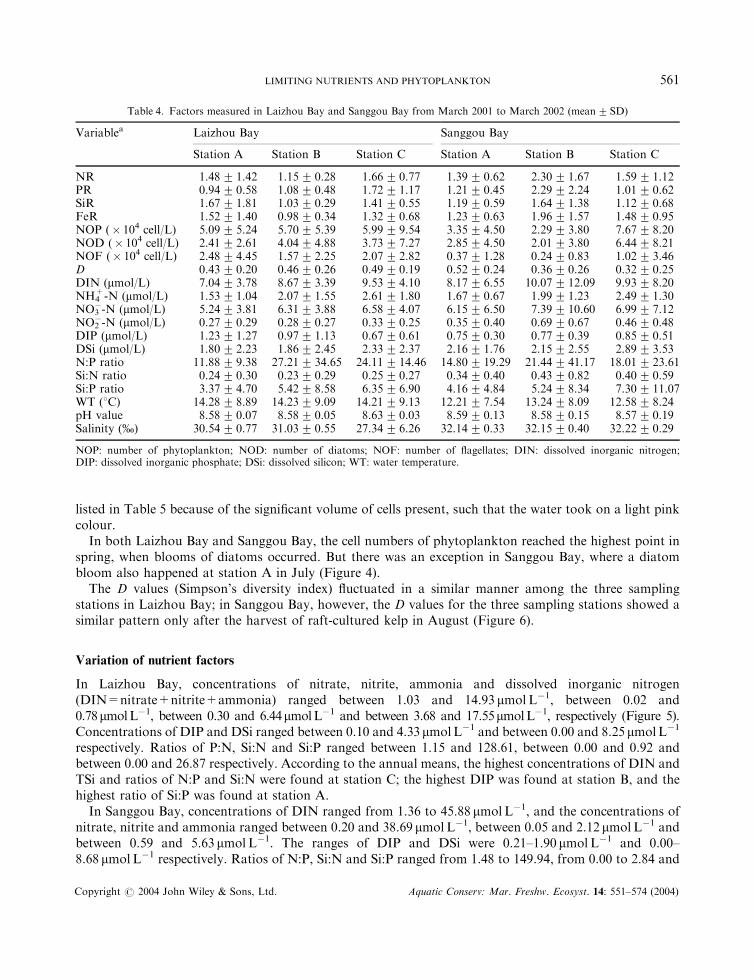
Table 4. Factors measured in Laizhou Bay and Sanggou Bay from March 2001 to March 2002 (mean�SD)
Variablea Laizhou Bay Sanggou Bay
Station A Station B Station C Station A Station B Station C
NR 1.48� 1.42 1.15� 0.28 1.66� 0.77 1.39� 0.62 2.30� 1.67 1.59� 1.12PR 0.94� 0.58 1.08� 0.48 1.72� 1.17 1.21� 0.45 2.29� 2.24 1.01� 0.62SiR 1.67� 1.81 1.03� 0.29 1.41� 0.55 1.19� 0.59 1.64� 1.38 1.12� 0.68FeR 1.52� 1.40 0.98� 0.34 1.32� 0.68 1.23� 0.63 1.96� 1.57 1.48� 0.95NOP (� 104 cell/L) 5.09� 5.24 5.70� 5.39 5.99� 9.54 3.35� 4.50 2.29� 3.80 7.67� 8.20NOD (� 104 cell/L) 2.41� 2.61 4.04� 4.88 3.73� 7.27 2.85� 4.50 2.01� 3.80 6.44� 8.21NOF (� 104 cell/L) 2.48� 4.45 1.57� 2.25 2.07� 2.82 0.37� 1.28 0.24� 0.83 1.02� 3.46D 0.43� 0.20 0.46� 0.26 0.49� 0.19 0.52� 0.24 0.36� 0.26 0.32� 0.25DIN (mmol/L) 7.04� 3.78 8.67� 3.39 9.53� 4.10 8.17� 6.55 10.07� 12.09 9.93� 8.20NH4
+-N (mmol/L) 1.53� 1.04 2.07� 1.55 2.61� 1.80 1.67� 0.67 1.99� 1.23 2.49� 1.30NO3
�-N (mmol/L) 5.24� 3.81 6.31� 3.88 6.58� 4.07 6.15� 6.50 7.39� 10.60 6.99� 7.12NO2
�-N (mmol/L) 0.27� 0.29 0.28� 0.27 0.33� 0.25 0.35� 0.40 0.69� 0.67 0.46� 0.48DIP (mmol/L) 1.23� 1.27 0.97� 1.13 0.67� 0.61 0.75� 0.30 0.77� 0.39 0.85� 0.51DSi (mmol/L) 1.80� 2.23 1.86� 2.45 2.33� 2.37 2.16� 1.76 2.15� 2.55 2.89� 3.53N:P ratio 11.88� 9.38 27.21� 34.65 24.11� 14.46 14.80� 19.29 21.44� 41.17 18.01� 23.61Si:N ratio 0.24� 0.30 0.23� 0.29 0.25� 0.27 0.34� 0.40 0.43� 0.82 0.40� 0.59Si:P ratio 3.37� 4.70 5.42� 8.58 6.35� 6.90 4.16� 4.84 5.24� 8.34 7.30� 11.07WT (8C) 14.28� 8.89 14.23� 9.09 14.21� 9.13 12.21� 7.54 13.24� 8.09 12.58� 8.24pH value 8.58� 0.07 8.58� 0.05 8.63� 0.03 8.59� 0.13 8.58� 0.15 8.57� 0.19Salinity (%) 30.54� 0.77 31.03� 0.55 27.34� 6.26 32.14� 0.33 32.15� 0.40 32.22� 0.29
NOP: number of phytoplankton; NOD: number of diatoms; NOF: number of flagellates; DIN: dissolved inorganic nitrogen;DIP: dissolved inorganic phosphate; DSi: dissolved silicon; WT: water temperature.
LIMITING NUTRIENTS AND PHYTOPLANKTON 561
Copyright # 2004 John Wiley & Sons, Ltd. Aquatic Conserv: Mar. Freshw. Ecosyst. 14: 551–574 (2004)

Table5.Majorphytoplanktonspeciesidentified
inLaizhouBayandSanggouBayduringMarch2001–March2002
Month
LaizhouBay
SanggouBay
StationA
StationB
StationC
StationA
StationB
StationC
2001
March
Rhizosolenia
stoltorfothiiPeragallo
Rhizosolenia
stoltorfothiiPeragallo
Rhizosolenia
stoltorfothiiPeragallo
Thalassiosira
sp.
Thalassiosira
sp.
Thalassiosira
sp.
Chaetocerossp.
Chaetocerossp.
Gonoaulaxpolyedra
Stein
Nizschia
sp.
Skeletonem
acostatum
Cleve
Skeletonem
acostatum
Cleve
Thalassiothrix
frauenfeldiiGrunow
April
Noctiluca
scientillans
Kofoid
etSwezy
Noctiluca
scientillans
Kofoid
etSwezy
Noctiluca
scientillans
Kofoid
etSwezy
Melosira
sulcata
(Ehrenb.)Cleve
Coscinodiscussp.
Melosira
sulcata
(Ehrenb.)Cleve
Dicrateriasp.
Chaetocerossp.
Chaetocerossp.
Asterionella
japonica
Cleve
Chaetocerossp.
Dicrateriasp.
Dicrateriasp.
Coscinodiscussp.
May
Noctiluca
scientillans
Kofoid
etSwezy
Noctiluca
scientillans
Kofoid
etSwezy
Noctiluca
scientillans
Kofoid
etSwezy
Coscinodiscussp.
Coscinodiscussp.
Dicrateriasp.
Dicrateriasp.
Dicrateriasp.
Melosira
sulcata
(Ehrenb.)Cleve
Rhizosolenia
sp.
June
Rhizosolenia
stoltorfothiiPeragallo
Rhizosolenia
stoltorfothiiPeragallo
Rhizosolenia
stoltorfothiiPeragallo
Skeletonem
acostatum
(Grev.)Cleve
Skeletonem
acostatum
(Grev.)
Cleve
Skeletonem
acostatum
(Grev.)
Cleve
Prorocentrum
micans
Ehrenb
Prorocentrum
micans
Ehrenb
Prorocentrum
micans
Ehrenb
Melosira
sulcata
(Ehrenb.)Cleve
Nitzschiellasp.
July
Dicrateriasp.
Chlorellasp.
Platymonassp.
Chaetocerossp.
Chaetocerossp.
Chaetocerossp.
Chlorellasp.
Dicrateriasp.
Dicrateriasp.
Platymonassp.
August
Chlorellasp.
Chlorellasp.
Chlorellasp.
Dactyliosolen
mediterraneus
Peragallo
Skeletonem
acostatum
(Grev.)
Cleve
Leptocylindrus
danicusCleve
Dicrateriasp.
Dicrateriasp.
Dicrateriasp.
Skeletonem
acostatum
(Grev.)Cleve
Thalassiosira
sp.
Thalassionem
anitzchioides
Grunow
Skeletonem
acostatum
(Grev.)
Cleve
H. LIU ET AL.562
Copyright # 2004 John Wiley & Sons, Ltd. Aquatic Conserv: Mar. Freshw. Ecosyst. 14: 551–574 (2004)
September
Cocinodiscussp.
Nitzschiellasp.
Thalassionem
anitzischioides
Grunow
Thalassiosira
sp.
Thalassiosira
sp.
Thalassiosira
sp.
Dictyochafibula
f.rhombica
Leptocylindrusdanicus
Cleve
Nitzischia
sp.
Nitzischia
sp.
Nitzischia
sp.
Cocinodiscussp.
October
Dactyliosolen
mediterraneus
Peragallo
Dactyliosolen
mediterraneus
Peragallo
Dactyliosolen
mediterraneus
Peragallo
Thalassiosira
sp.
Leptocylindrus
danicusCleve
Chaetocerossp.
Leptocylindrus
danicusCleve
Skeletonem
acostatum
(Grev.)
Cleve
Leptocylindrus
danicusCleve
Novem
ber
Platymonassp.
Platymonassp.
Platymonassp.
Dactyliosolen
mediterraneus
Peragallo
Leptocylindrus
danicusCleve
Dactyliosolen
mediterraneus
Peragallo
Leptocylindrusdanicus
Cleve
Skeletonem
acostatum
(Grev.)Cleve
Nitzischia
sp.
Nitzischia
sp.
Pleurosigmaaffine
Grunow
Decem
ber
Chaetocerossp.
Rhizosolenia
delicatula
Cleve
Rhizosolenia
delicatula
Cleve
Skeletonem
acostatum
(Grev.)Cleve
Skeletonem
acostatum
(Grev.)
Cleve
Planktoniellasol
(Wallich)Schutt
Rhizosolenia
delicatula
Cleve
Noctiluca
scientillans
Kofoid
etSwezy
Noctiluca
scientillans
Kofoid
etSwezy
Melosira
sulcata
(Ehrenb.)Cleve
Skeletonem
acostatum
(Grev.)
Cleve
Skeletonem
acostatum
(Grev.)Cleve
2002
January
Skeletonem
acostatum
(Grev.)Cleve
Skeletonem
acostatum
(Grev.)Cleve
Skeletonem
acostatum
(Grev.)Cleve
Skeletonem
acostatum
(Grev.)Cleve
Thalassiosira
sp.
Skeletonem
acostatum
(Grev.)
Cleve
Chaetocerossp.
Chaetocerossp.
Chaetocerossp.
Stephanopyxis
palm
eriana(G
rev.)
Cleve
Skeletonem
acostatum
(Grev.)
Cleve
Stephanopyxis
palm
eriana(G
rev.)
Cleve
Rhizosolenia
delicatula
Cleve
March
Skeletonem
acostatum
(Grev.)Cleve
Skeletonem
acostatum
(Grev.)Cleve
Skeletonem
acostatum
(Grev.)Cleve
Skeletonem
acostatum
(Grev.)Cleve
Skeletonem
acostatum
(Grev.)
Cleve
Skeletonem
acostatum
(Grev.)
Cleve
Chaetocerossp.
Chaetocerossp.
Chaetocerossp.
Melosira
sulcata
(Ehrenb.)Cleve
LIMITING NUTRIENTS AND PHYTOPLANKTON 563
Copyright # 2004 John Wiley & Sons, Ltd. Aquatic Conserv: Mar. Freshw. Ecosyst. 14: 551–574 (2004)
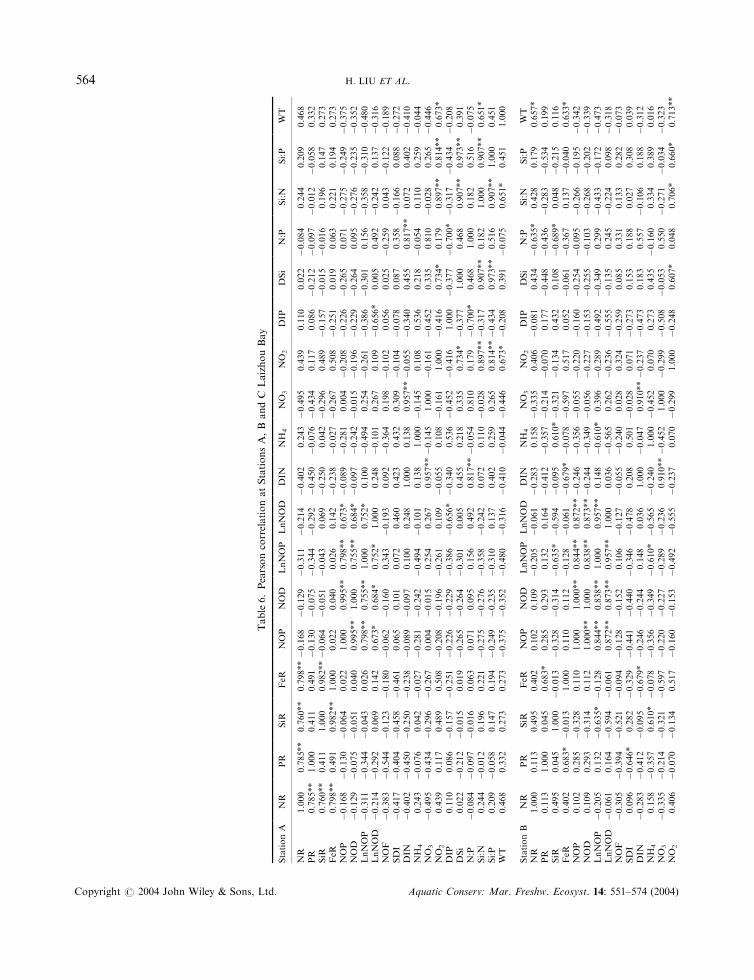
Table6.PearsoncorrelationatStationsA,BandC
LaizhouBay
StationA
NR
PR
SiR
FeR
NOP
NOD
LnNOP
LnNOD
DIN
NH
4NO
3NO
2DIP
DSi
N:P
Si:N
Si:P
WT
NR
1.000
0.785**
0.760**
0.798**�0.168
�0.129
�0.311
�0.214
�0.402
0.243
�0.495
0.439
0.110
0.022
�0.084
0.244
0.209
0.468
PR
0.785**
1.000
0.411
0.491
�0.130
�0.075
�0.344
�0.292
�0.450
�0.076
�0.434
0.117
0.086
�0.212
�0.097
�0.012
�0.058
0.332
SiR
0.760**
0.411
1.000
0.982**�0.064
�0.051
�0.043
0.069
�0.250
0.042
�0.296
0.489
�0.157
�0.015
�0.016
0.196
0.147
0.273
FeR
0.798**
0.491
0.982**
1.000
0.022
0.040
0.026
0.142
�0.238
�0.027
�0.267
0.508
�0.251
0.019
0.063
0.221
0.194
0.273
NOP
�0.168
�0.130
�0.064
0.022
1.000
0.995**
0.798**
0.673*
�0.089
�0.281
0.004
�0.208
�0.226
�0.265
0.071
�0.275
�0.249
�0.375
NOD
�0.129
�0.075
�0.051
0.040
0.995**
1.000
0.755**
0.684*
�0.097
�0.242
�0.015
�0.196
�0.229
�0.264
0.095
�0.276
�0.235
�0.352
LnNOP
�0.311
�0.344
�0.043
0.026
0.798**
0.755**
1.000
0.752*
0.100
�0.494
0.254
�0.261
�0.386
�0.301
0.156
�0.358
�0.310
�0.480
LnNOD
�0.214
�0.292
0.069
0.142
0.673*
0.684*
0.752*
1.000
0.248
�0.101
0.267
0.109
�0.656*
0.005
0.492
�0.242
0.137
�0.316
NOF
�0.383
�0.544
�0.123
�0.180
�0.062
�0.160
0.343
�0.193
0.092
�0.364
0.198
�0.102
0.056
0.025
�0.259
0.043
�0.122
�0.189
SDI
�0.417
�0.404
�0.458
�0.461
0.065
0.101
0.072
0.460
0.423
0.432
0.309
�0.104
�0.078
0.087
0.358
�0.166
0.088
�0.272
DIN
�0.402
�0.450
�0.250
�0.238
�0.089
�0.097
0.100
0.248
1.000
0.138
0.957**�0.055
�0.340
0.455
0.817**
0.072
0.402
�0.410
NH
40.243
�0.076
0.042
�0.027
�0.281
�0.242
�0.494
�0.101
0.138
1.000
�0.145
0.108
0.536
0.218
�0.054
0.110
0.259
�0.044
NO
3�0.495
�0.434
�0.296
�0.267
0.004
�0.015
0.254
0.267
0.957**�0.145
1.000
�0.161
�0.452
0.335
0.810
�0.028
0.265
�0.446
NO
20.439
0.117
0.489
0.508
�0.208
�0.196
�0.261
0.109
�0.055
0.108
�0.161
1.000
�0.416
0.734*
0.179
0.897**
0.814**
0.673*
DIP
0.110
0.086
�0.157
�0.251
�0.226
�0.229
�0.386
�0.656*
�0.340
0.536
�0.452
�0.416
1.000
�0.377
�0.700*
�0.317
�0.434
�0.208
DSi
0.022
�0.212
�0.015
0.019
�0.265
�0.264
�0.301
0.005
0.455
0.218
0.335
0.734*
�0.377
1.000
0.468
0.907**
0.973**
0.391
N:P
�0.084
�0.097
�0.016
0.063
0.071
0.095
0.156
0.492
0.817**�0.054
0.810
0.179
�0.700*
0.468
1.000
0.182
0.516
�0.075
Si:N
0.244
�0.012
0.196
0.221
�0.275
�0.276
�0.358
�0.242
0.072
0.110
�0.028
0.897**�0.317
0.907**
0.182
1.000
0.907**
0.651*
Si:P
0.209
�0.058
0.147
0.194
�0.249
�0.235
�0.310
0.137
0.402
0.259
0.265
0.814**�0.434
0.973**
0.516
0.907**
1.000
0.451
WT
0.468
0.332
0.273
0.273
�0.375
�0.352
�0.480
�0.316
�0.410
�0.044
�0.446
0.673*
�0.208
0.391
�0.075
0.651*
0.451
1.000
StationB
NR
PR
SiR
FeR
NOP
NOD
LnNOP
LnNOD
DIN
NH
4NO
3NO
2DIP
DSi
N:P
Si:N
Si:P
WT
NR
1.000
0.113
0.495
0.402
0.102
0.109
�0.205
�0.061
�0.283
0.158
�0.335
0.406
�0.081
0.434
�0.635*
0.428
0.179
0.657*
PR
0.113
1.000
0.045
0.683*
0.285
0.293
0.132
0.164
�0.412
�0.357
�0.214
�0.070
0.177
�0.448
�0.436
�0.283
�0.534
0.199
SiR
0.495
0.045
1.000
�0.013
�0.328
�0.314
�0.635*
�0.594
�0.095
0.610*�0.321
�0.134
0.432
0.108
�0.689*
0.048
�0.215
0.116
FeR
0.402
0.683*
�0.013
1.000
0.110
0.112
�0.128
�0.061
�0.679*
�0.078
�0.597
0.517
0.052
�0.061
�0.367
0.137
�0.040
0.633*
NOP
0.102
0.285
�0.328
0.110
1.000
1.000**
0.844**
0.872**�0.246
�0.356
�0.055
�0.220
�0.160
�0.254
�0.095
�0.266
�0.195
�0.342
NOD
0.109
0.293
�0.314
0.112
1.000**
1.000
0.838**
0.873**�0.244
�0.349
�0.056
�0.227
�0.153
�0.255
�0.103
�0.268
�0.202
�0.339
LnNOP
�0.205
0.132
�0.635*
�0.128
0.844**
0.838**
1.000
0.957**
0.148
�0.610*
0.396
�0.289
�0.492
�0.349
0.299
�0.433
�0.172
�0.473
LnNOD
�0.061
0.164
�0.594
�0.061
0.872**
0.873**
0.957**
1.000
0.036
�0.565
0.262
�0.236
�0.555
�0.135
0.245
�0.224
0.098
�0.318
NOF
�0.305
�0.394
�0.521
�0.094
�0.128
�0.152
0.106
�0.127
�0.055
�0.240
0.028
0.324
�0.259
0.085
0.331
0.133
0.282
�0.073
SDI
0.096
�0.646*
0.282
�0.329
�0.441
�0.440
�0.346
�0.478
0.208
0.501
�0.028
0.071
�0.273
0.153
0.188
0.027
0.308
0.039
DIN
�0.283
�0.412
�0.095
�0.679*
�0.246
�0.244
0.148
0.036
1.000
�0.047
0.910**�0.237
�0.473
0.183
0.557
�0.106
0.188
�0.312
NH
40.158
�0.357
0.610*
�0.078
�0.356
�0.349
�0.610*
�0.565
�0.240
1.000
�0.452
0.070
0.273
0.435
�0.160
0.334
0.389
0.016
NO
3�0.335
�0.214
�0.321
�0.597
�0.220
�0.227
�0.289
�0.236
0.910**�0.452
1.000
�0.299
�0.508
�0.053
0.550
�0.271
�0.034
�0.323
NO
20.406
�0.070
�0.134
0.517
�0.160
�0.153
�0.492
�0.555
�0.237
0.070
�0.299
1.000
�0.248
0.607*
0.048
0.706*
0.660*
0.713**
H. LIU ET AL.564
Copyright # 2004 John Wiley & Sons, Ltd. Aquatic Conserv: Mar. Freshw. Ecosyst. 14: 551–574 (2004)
DIP
�0.081
0.177
0.432
0.052
�0.160
�0.153
�0.492
�0.555
�0.473
0.273
�0.508
�0.248
1.000
�0.103
�0.493
0.088
�0.381
�0.057
DSi
0.434
�0.448
0.108
�0.061
�0.254
�0.255
�0.349
�0.135
0.183
0.435
�0.053
0.607*
�0.103
1.000
0.018
0.930**
0.845**
0.465
N:P
�0.635*
�0.436
�0.689*
�0.367
�0.095
�0.103
0.299
0.245
0.557
�0.160
0.550
0.048
�0.493
0.018
1.000
�0.077
0.421
�0.238
Si:N
0.428
�0.283
0.048
0.137
�0.266
�0.268
�0.433
�0.224
�0.106
0.334
�0.271
0.706*
0.088
0.930**�0.077
1.000
0.783**
0.619*
Si:P
0.179
�0.534
�0.215
�0.040
�0.195
�0.202
�0.172
0.098
0.188
0.389
�0.034
0.660*
�0.381
0.845**
0.421
0.783**
1.000
0.389
WT
0.657*
0.199
0.116
0.633*
�0.342
�0.339
�0.473
�0.318
�0.312
0.016
�0.323
0.713**�0.057
0.465
�0.238
0.619*
0.389
1.000
StationC
NR
PR
SiR
FeR
NOP
NOD
LnNOP
LnNOD
DIN
NH
4NO
3NO
2DIP
DSi
N:P
Si:N
Si:P
WT
NR
1.000
0.482
0.740**
0.925**
0.147
0.123
0.426
0.194
0.164
0.080
0.115
0.234
�0.312
0.161
0.263
0.166
0.092
�0.109
PR
0.482
1.000
0.623*
0.657*
�0.202
�0.202
�0.091
�0.416
0.117
0.195
0.032
�0.016
0.074
�0.223
0.070
�0.238
�0.264
�0.021
SiR
0.740**
0.623*
1.000
0.841**�0.273
�0.278
�0.004
�0.263
0.345
0.200
0.257
0.037
0.068
0.052
�0.085
�0.075
�0.178
�0.165
FeR
0.925**
0.657*
0.841**
1.000
�0.111
�0.124
0.128
�0.096
0.123
0.058
0.081
0.266
�0.116
0.144
0.072
0.143
0.000
0.078
NOP
0.147
�0.202
�0.273
�0.111
1.000
0.998**
0.809**
0.857**�0.346
�0.386
�0.156
�0.342
�0.335
�0.227
0.436
�0.113
0.031
�0.395
NOD
0.123
�0.202
�0.278
�0.124
0.998**
1.000
0.782**
0.839**�0.356
�0.390
�0.164
�0.347
�0.323
�0.229
0.421
�0.117
0.026
�0.380
LnNOP
0.426
�0.091
�0.004
0.128
0.809**
0.782**
1.000
0.963**�0.012
�0.210
0.094
�0.201
�0.320
�0.089
0.416
�0.042
0.059
�0.625*
LnNOD
0.194
�0.416
�0.263
�0.096
0.857**
0.839**
0.963**
1.000
�0.198
�0.329
�0.032
�0.242
�0.366
0.076
0.349
0.239
0.507
�0.646*
NOF
0.379
0.030
0.115
0.238
�0.064
�0.125
0.374
0.223
0.206
0.105
0.153
0.124
�0.158
0.052
0.211
0.085
0.078
�0.209
SDI
�0.147
�0.245
0.018
�0.195
�0.491
�0.494
�0.356
�0.563
0.386
0.451
0.451
0.172
0.276
�0.160
0.051
�0.175
�0.032
�0.061
DIN
0.164
0.117
0.345
0.123
�0.346
�0.356
�0.012
�0.198
1.000
0.265
0.894**�0.102
�0.361
0.285
0.437
�0.082
0.091
�0.403
NH
40.080
0.195
0.200
0.058
�0.386
�0.390
�0.210
�0.329
0.265
1.000
�0.192
0.264
0.193
0.037
�0.191
�0.053
0.047
�0.096
NO
30.115
0.032
0.257
0.081
�0.156
�0.164
0.094
�0.032
0.894**�0.192
1.000
�0.280
�0.434
0.227
0.534
�0.110
0.028
�0.404
NO
20.234
�0.016
0.037
0.266
�0.342
�0.347
�0.201
�0.242
�0.102
0.264
�0.280
1.000
�0.222
0.700*
�0.170
0.828**
0.675*
0.684*
DIP
�0.312
0.074
0.068
�0.116
�0.335
�0.323
�0.320
�0.366
�0.361
0.193
�0.434
�0.222
1.000
�0.403
�0.840**�0.330
�0.511
�0.062
DSi
0.161
�0.223
0.052
0.144
�0.227
�0.229
�0.089
0.076
0.285
0.037
0.227
0.700*
�0.403
1.000
0.213
0.916**
0.920**
0.472
N:P
0.263
0.070
�0.085
0.072
0.436
0.421
0.416
0.349
0.437
�0.191
0.534
�0.170
�0.840**
0.213
1.000
0.073
0.362
�0.199
Si:N
0.166
�0.238
�0.075
0.143
�0.113
�0.117
�0.042
0.239
�0.082
�0.053
�0.110
0.828**�0.330
0.916**
0.073
1.000
0.915**
0.646*
Si:P
0.092
�0.264
�0.178
0.000
0.031
0.026
0.059
0.507
0.091
0.047
0.028
0.675*
�0.511
0.920**
0.362
0.915**
1.000
0.477
WT
�0.109
�0.021
�0.165
0.078
�0.395
�0.380
�0.625*
�0.646*
�0.403
�0.096
�0.404
0.684*
�0.062
0.472
�0.199
0.646*
0.477
1.000
*Correlationissignificantatthe0.05level
(two-tailed).
**Correlationissignificantatthe0.01level
(two-tailed).
LIMITING NUTRIENTS AND PHYTOPLANKTON 565
Copyright # 2004 John Wiley & Sons, Ltd. Aquatic Conserv: Mar. Freshw. Ecosyst. 14: 551–574 (2004)

Table7.PearsoncorrelationsatStationsA,BandC
SanggouBay
NR
PR
SiR
FeR
DIN
NH
4NO
3NO
2DIP
DSI
N:P
Si:N
Si:P
WT
StationA
NR
1.000
�0.365
0.196
0.395
�0.393
0.359
�0.434
0.004
�0.320
�0.339
�0.274
0.043
�0.097
0.104
PR
�0.365
1.000
0.675*
0.338
�0.191
�0.133
�0.201
0.355
0.490
�0.360
�0.304
�0.054
�0.423
�0.391
SiR
0.196
0.675*
1.000
0.827**�0.619*
�0.009
�0.624*
0.019
0.223
�0.609*
�0.469
0.048
�0.383
�0.492
FeR
0.395
0.338
0.827**
1.000
�0.618*
�0.024
�0.610*
�0.181
0.117
�0.595*
�0.428
�0.012
�0.344
�0.571
NOP
0.321
0.049
0.182
0.112
�0.271
0.663*
�0.328
�0.224
�0.233
�0.039
�0.138
0.011
0.075
0.157
NOD
0.325
0.051
0.184
0.114
�0.276
0.661*
�0.333
�0.227
�0.233
�0.043
�0.137
0.013
0.076
0.158
ln(N
OP)
0.320
�0.080
�0.073
�0.069
�0.152
0.520
�0.192
�0.244
0.028
�0.021
�0.196
�0.216
�0.114
0.070
ln(N
OD)
0.358
�0.049
�0.045
�0.039
�0.207
0.506
�0.244
�0.274
0.011
�0.061
�0.194
�0.188
�0.102
0.084
NOF
�0.166
�0.100
�0.087
�0.096
�0.331
0.206
�0.010
0.200
0.131
0.056
0.141
0.013
�0.075
�0.031
SDI
�0.190
0.503
0.182
0.081
0.194
�0.502
0.228
0.315
0.415
�0.135
0.041
�0.149
�0.241
�0.244
DIN
�0.393
�0.191
�0.619*
�0.618*
1.000
�0.134
0.993**
0.463
�0.280
0.478
0.879
�0.237
0.441
0.617*
NH
40.359
�0.133
�0.009
�0.024
�0.134
1.000
�0.235
�0.056
�0.315
0.367
�0.062
0.429
0.394
0.527
NO
3�0.434
�0.201
�0.624*
�0.610*
0.993**�0.235
1.000
0.411
�0.238
0.452
0.878
�0.277
0.409
0.547
NO
20.004
0.355
0.019
�0.181
0.463
�0.056
0.411
1.000
�0.175
�0.120
0.241
�0.086
�0.082
0.332
DIP
�0.320
0.490
0.223
0.117
�0.280
�0.315
�0.238
�0.175
1.000
�0.322
�0.543
�0.371
�0.709**�0.623*
DSi
�0.339
�0.360
�0.609*
�0.595*
0.478
0.367
0.452
�0.120
�0.322
1.000
0.475
0.591*
0.835**
0.595*
N:P
�0.274
�0.304
�0.469
�0.428
0.879
�0.062
0.878
0.241
�0.543
0.475
1.000
�0.111
0.669*
0.690*
Si:N
0.043
�0.054
0.048
�0.012
�0.237
0.429
�0.277
�0.086
�0.371
0.591*
�0.111
1.000
0.612*
0.237
Si:P
�0.097
�0.423
�0.383
�0.344
0.441
0.394
0.409
�0.082
�0.709**
0.835**
0.669*
0.612*
1.000
0.729**
WT
0.104
�0.391
�0.492
�0.571
0.617*
0.527
0.547
0.332
�0.623*
0.595*
0.690*
0.237
0.729**
1.000
StationB
NR
1.000
0.551
0.831**
0.672*
�0.553
�0.293
�0.563
�0.535
�0.184
�0.377
�0.400
0.254
�0.316
�0.282
PR
0.551
1.000
0.378
0.744**�0.319
�0.406
�0.303
�0.213
�0.228
0.097
�0.209
0.855**
0.052
0.098
SiR
0.831**
0.378
1.000
0.761**�0.376
�0.137
�0.386
�0.427
�0.202
�0.272
�0.248
0.077
�0.203
�0.346
FeR
0.672*
0.744**
0.761**
1.000
�0.347
�0.209
�0.351
�0.320
�0.318
�0.057
�0.223
0.549
�0.055
�0.067
NOP
0.193
�0.007
0.454
0.323
�0.145
�0.198
�0.119
�0.365
0.389
�0.422
�0.178
�0.291
�0.315
�0.345
NOD
0.204
0.002
0.459
0.330
�0.145
�0.198
�0.120
�0.367
0.390
�0.413
�0.175
�0.283
�0.306
�0.337
ln(N
OP)�0.070
�0.423
0.245
0.038
0.063
0.124
0.065
�0.128
0.209
�0.339
0.001
�0.567
�0.217
�0.182
ln(N
OD)�0.032
�0.418
0.265
0.049
0.065
0.132
0.068
�0.138
0.229
�0.313
0.016
�0.569
�0.189
�0.160
H. LIU ET AL.566
Copyright # 2004 John Wiley & Sons, Ltd. Aquatic Conserv: Mar. Freshw. Ecosyst. 14: 551–574 (2004)
NOF
�0.243
�0.174
�0.155
�0.187
0.030
0.028
0.026
0.081
�0.059
�0.125
�0.042
�0.120
�0.136
�0.125
SDI
�0.061
0.021
0.005
0.193
�0.203
�0.150
�0.228
0.215
0.124
�0.316
�0.289
�0.060
�0.448
�0.358
DIN
�0.553
�0.319
�0.376
�0.347
1.000
0.829**
0.998**
0.744**�0.306
0.672*
0.972**�0.235
0.711**
0.579*
NH
4�0.293
�0.406
�0.137
�0.209
0.829**
1.000
0.799**
0.480
�0.446
0.558
0.881**�0.330
0.638*
0.480
NO
3�0.563
�0.303
�0.386
�0.351
0.998**
0.799**
1.000
0.730
�0.270
0.670*
0.966**�0.224
0.709**
0.569
NO
2�0.535
�0.213
�0.427
�0.320
0.744**
0.480
0.730
1.000
�0.425
0.517
0.652*
�0.094
0.456
0.563
DIP
�0.184
�0.228
�0.202
�0.318
�0.306
�0.446
�0.270
�0.425
1.000
�0.621*
�0.432
�0.399
�0.623*
�0.734**
DSi
�0.377
0.097
�0.272
�0.057
0.672*
0.558
0.670*
0.517
�0.621*
1.000
0.752**
0.408
0.980**
0.814**
N:P
�0.400
�0.209
�0.248
�0.223
0.972**
0.881**
0.966**
0.652*
�0.432
0.752**
1.000
�0.125
0.808**
0.640*
Si:N
0.254
0.855**
0.077
0.549
�0.235
�0.330
�0.224
�0.094
�0.399
0.408
�0.125
1.000
0.326
0.372
Si:P
�0.316
0.052
�0.203
�0.055
0.711**
0.638*
0.709*
0.456
�0.623*
0.980**
0.808**
0.326
1.000
0.819**
WT
�0.282
0.098
�0.346
�0.067
0.579*
0.480
0.569
0.563
�0.734**
0.814**
0.640*
0.372
0.819**
1.000
StationC
NR
1.000
0.216
0.845**
0.896**�0.359
�0.372
�0.345
�0.009
0.211
�0.356
�0.380
�0.062
�0.221
�0.249
PR
0.216
1.000
0.409
0.400
0.202
0.301
0.150
0.407
�0.319
0.474
0.176
0.672*
0.518
0.562
SiR
0.845**
0.409
1.000
0.747**�0.168
�0.189
�0.174
0.220
0.129
�0.170
�0.222
�0.011
�0.165
�0.001
FeR
0.896**
0.400
0.747**
1.000
�0.303
�0.263
�0.303
0.018
0.134
�0.188
�0.333
0.179
�0.023
�0.136
NOP
�0.203
�0.428
�0.583*
�0.301
�0.060
�0.027
�0.052
�0.187
0.144
�0.174
�0.148
�0.294
�0.210
�0.237
NOD
�0.291
�0.453
�0.655*
�0.387
�0.059
�0.008
�0.054
�0.197
0.083
�0.141
�0.126
�0.263
�0.181
�0.217
ln(N
OP)�0.171
�0.079
�0.345
�0.304
0.157
0.192
0.152
�0.100
0.199
0.120
0.026
�0.126
0.007
0.199
ln(N
OD)�0.527
�0.200
�0.652*
�0.649*
0.162
0.287
0.144
�0.137
�0.065
0.251
0.119
�0.012
0.124
0.254
NOF
0.725**
0.252
0.645*
0.727**
0.004
�0.145
0.023
0.109
0.468
�0.248
�0.157
�0.213
�0.207
�0.131
SDI
�0.455
�0.203
�0.417
�0.487
0.613*
0.317
0.623*
0.258
�0.195
0.175
0.494
�0.380
�0.051
�0.009
DIN
�0.359
0.202
�0.168
�0.303
1.000
0.682*
0.992**
0.513
�0.107
0.562
0.819**�0.244
0.339
0.569
NH
4�0.372
0.301
�0.189
�0.263
0.682*
1.000
0.594*
0.132
�0.010
0.682*
0.365
0.049
0.334
0.472
NO
3�0.345
0.150
�0.174
�0.303
0.992**
0.594*
1.000
0.500
�0.104
0.521
0.851**�0.277
0.332
0.552
NO
2�0.009
0.407
0.220
0.018
0.513
0.132
0.500
1.000
�0.259
0.013
0.381
�0.192
�0.045
0.242
DIP
0.211
�0.319
0.129
0.134
�0.107
�0.010
�0.104
�0.259
1.000
�0.539
�0.487
�0.496
�0.644*
�0.537
DSi
�0.356
0.474
�0.170
�0.188
0.562
0.682*
0.521
0.013
�0.539
1.000
0.637*
0.511
0.838**
0.892**
N:P
�0.380
0.176
�0.222
�0.333
0.819**
0.365
0.851**
0.381
�0.487
0.637*
1.000
0.008
0.652*
0.703*
Si:N
�0.062
0.672*
�0.011
0.179
�0.244
0.049
�0.277
�0.192
�0.496
0.511
0.008
1.000
0.705*
0.483
Si:P
�0.221
0.518
�0.165
�0.023
0.339
0.334
0.332
�0.045
�0.644*
0.838**
0.652*
0.705*
1.000
0.816**
WT
�0.249
0.562
�0.001
�0.136
0.569
0.472
0.552
0.242
�0.537
0.892**
0.703*
0.483
0.816**
1.000
**Correlationissignificantatthe0.01level
(two-tailed).
*Correlationissignificantatthe0.05level
(two-tailed).
LIMITING NUTRIENTS AND PHYTOPLANKTON 567
Copyright # 2004 John Wiley & Sons, Ltd. Aquatic Conserv: Mar. Freshw. Ecosyst. 14: 551–574 (2004)
from 0.00 to 29.05 respectively. Concentrations of DIN and DIP and the ratio of N:P were the highest atstation C; DSi and the Si:N and Si:P ratios were the highest at station B, also according to their annualmeans.
PHYSICAL FACTORS
Water temperature ranged between 2.6 and 27.68C in Laizhou Bay, and the range was slightly wider atstation C than at station B, which in turn was greater than at station A. The pH value ranged between 8.53and 8.65 and salinity ranged between 20.12 and 31.43% (Figure 6).
Water temperature ranged between 3.5 and 27.58C in Sanggou Bay; the range was slightly narrower atstation A and similar between stations B and C. The pH value was between 8.30 and 8.77, and the rangewas significantly wider at station C than at station B, which in turn was greater than at station A. Salinitywas between 31.38 and 32.51%, with relatively higher values found at station C and a slightly wider rangeat station B.
The wider range of salinity values in Laizhou Bay indicated the greater influence of freshwater runoffs inthis area. However, pH and salinity values were not included in statistical analysis because only limited setsof data were properly obtained in Laizhou Bay.
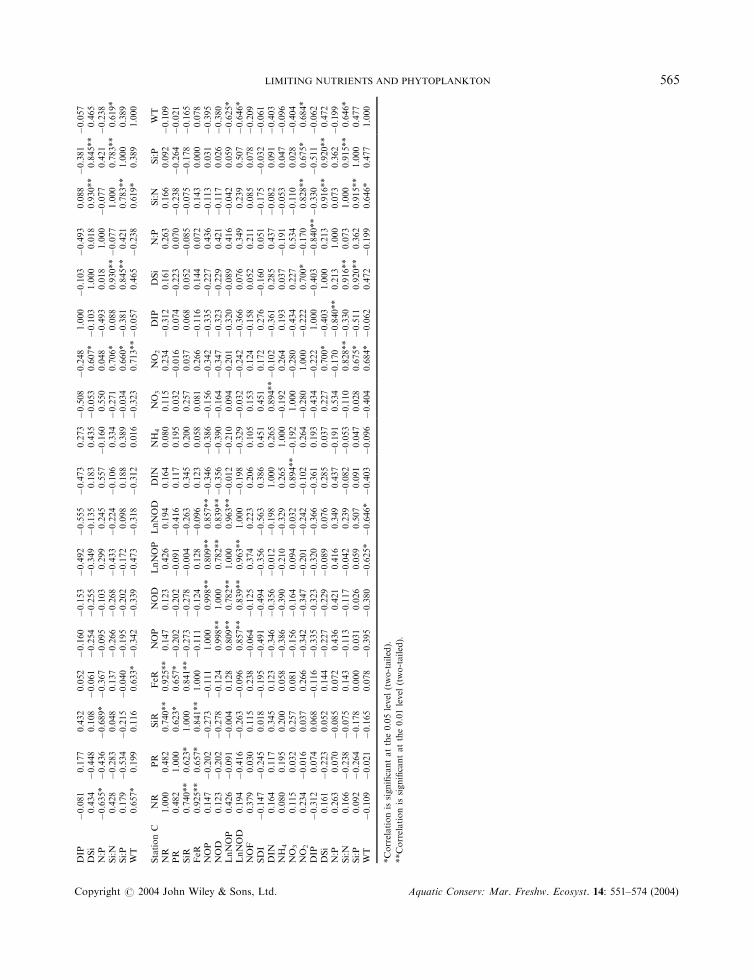
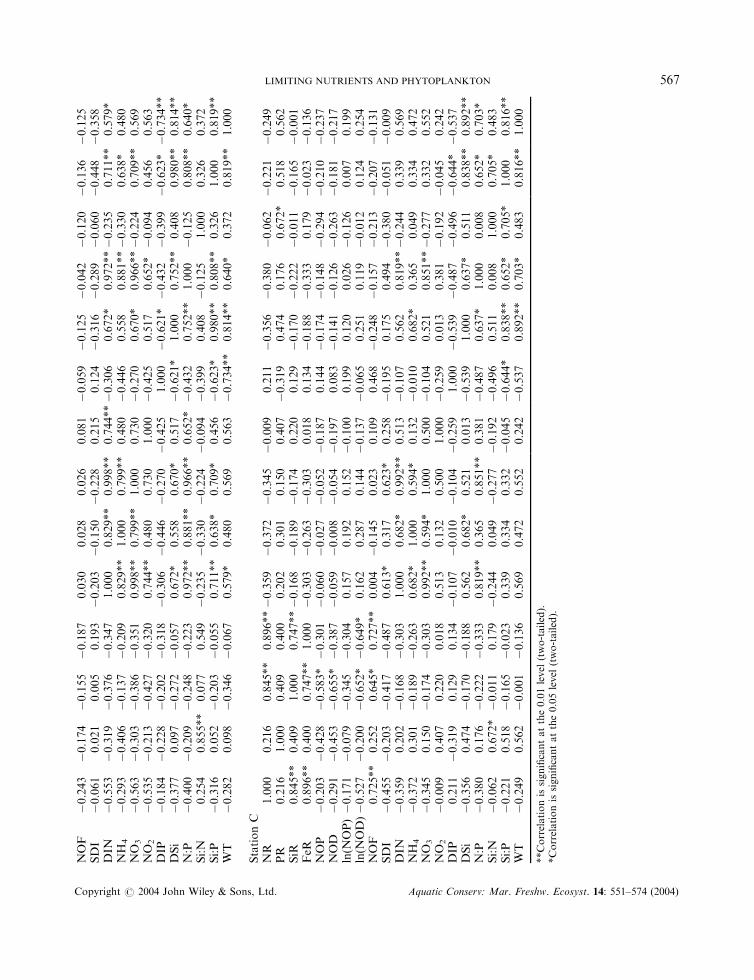
Correlations between major biological, chemical and physical factors
Bivariate correlations between phytoplankton indices and major chemical, biochemical and physicalparameters were calculated for stations A, B and C at both Laizhou Bay (Table 6) and Sanggou Bay(Table 7). Pearson correlation coefficients are given with relevant significance indices. Because the numbersof phytoplankton and diatoms were very skewed during some of the months, their natural logarithms werealso used for factor analyses.
Significant linear correlations were found between the nutrient response indices, between the nutrientconcentration indices, and between the nutrient concentration indices and water temperature, thusindicating relatively close interactions or relationships between these parameters. Significant correlationswere also found between phytoplankton and diatom number indices at all six stations, which stronglyindicated for diatom domination of the phytoplankton communities.
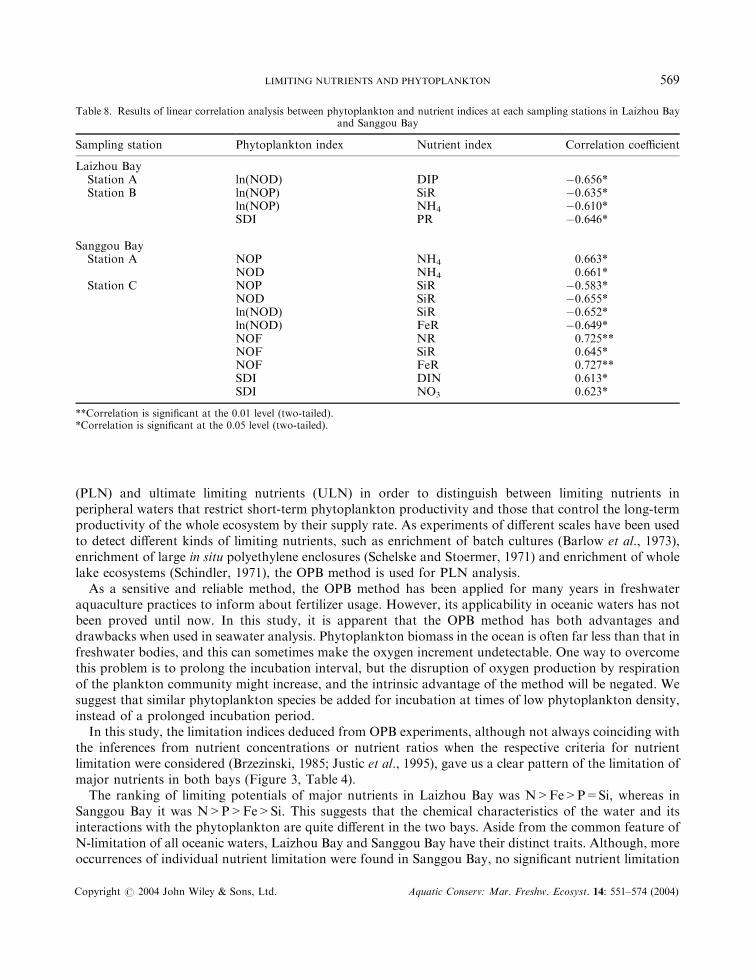
Table 8 lists all relationships between phytoplankton and nutrients where significant correlationcoefficients were recorded. The number of phytoplankton and Simpson’s diversity index D at stations Aand B in Laizhou Bay, and stations A and C in Sanggou Bay, showed positive or negative correlations withvarious nutrient response indices or nutrient concentration indices; however, at station C in Laizhou Bayand station B in Sanggou Bay, no linear correlations were found. Because the phytoplankton indices arevery skewed, and the relationships between nutrients and phytoplankton are complicated, Spearman’snonparametric correlation was calculated for these indices (including water temperature) in the two bays(Table 9). Various nonparametric correlations were found between phytoplankton and nutrient indices ateach sampling station except station A in Sanggou Bay.
DISCUSSION
The method of OPB, first introduced by Li et al. (1988), is used to measure the growth response ofphytoplankton by oxygen produced during the nutrient enriched incubation. In evaluating the short-termeffect of nutrient enrichment on photosynthesis, the theoretical basis of the OPB method is the same as the14C bioassay (Goldman, 1972). Tyrrell (1999) has proposed the concept of proximate limiting nutrients
H. LIU ET AL.568
Copyright # 2004 John Wiley & Sons, Ltd. Aquatic Conserv: Mar. Freshw. Ecosyst. 14: 551–574 (2004)
(PLN) and ultimate limiting nutrients (ULN) in order to distinguish between limiting nutrients inperipheral waters that restrict short-term phytoplankton productivity and those that control the long-termproductivity of the whole ecosystem by their supply rate. As experiments of different scales have been usedto detect different kinds of limiting nutrients, such as enrichment of batch cultures (Barlow et al., 1973),enrichment of large in situ polyethylene enclosures (Schelske and Stoermer, 1971) and enrichment of wholelake ecosystems (Schindler, 1971), the OPB method is used for PLN analysis.
As a sensitive and reliable method, the OPB method has been applied for many years in freshwateraquaculture practices to inform about fertilizer usage. However, its applicability in oceanic waters has notbeen proved until now. In this study, it is apparent that the OPB method has both advantages anddrawbacks when used in seawater analysis. Phytoplankton biomass in the ocean is often far less than that infreshwater bodies, and this can sometimes make the oxygen increment undetectable. One way to overcomethis problem is to prolong the incubation interval, but the disruption of oxygen production by respirationof the plankton community might increase, and the intrinsic advantage of the method will be negated. Wesuggest that similar phytoplankton species be added for incubation at times of low phytoplankton density,instead of a prolonged incubation period.
In this study, the limitation indices deduced from OPB experiments, although not always coinciding withthe inferences from nutrient concentrations or nutrient ratios when the respective criteria for nutrientlimitation were considered (Brzezinski, 1985; Justic et al., 1995), gave us a clear pattern of the limitation ofmajor nutrients in both bays (Figure 3, Table 4).
The ranking of limiting potentials of major nutrients in Laizhou Bay was N>Fe>P=Si, whereas inSanggou Bay it was N>P>Fe>Si. This suggests that the chemical characteristics of the water and itsinteractions with the phytoplankton are quite different in the two bays. Aside from the common feature ofN-limitation of all oceanic waters, Laizhou Bay and Sanggou Bay have their distinct traits. Although, moreoccurrences of individual nutrient limitation were found in Sanggou Bay, no significant nutrient limitation
Table 8. Results of linear correlation analysis between phytoplankton and nutrient indices at each sampling stations in Laizhou Bayand Sanggou Bay
Sampling station Phytoplankton index Nutrient index Correlation coefficient
Laizhou BayStation A ln(NOD) DIP �0.656*Station B ln(NOP) SiR �0.635*
ln(NOP) NH4 �0.610*SDI PR �0.646*
Sanggou BayStation A NOP NH4 0.663*
NOD NH4 0.661*Station C NOP SiR �0.583*
NOD SiR �0.655*ln(NOD) SiR �0.652*ln(NOD) FeR �0.649*NOF NR 0.725**NOF SiR 0.645*NOF FeR 0.727**SDI DIN 0.613*SDI NO3 0.623*
**Correlation is significant at the 0.01 level (two-tailed).*Correlation is significant at the 0.05 level (two-tailed).
LIMITING NUTRIENTS AND PHYTOPLANKTON 569
Copyright # 2004 John Wiley & Sons, Ltd. Aquatic Conserv: Mar. Freshw. Ecosyst. 14: 551–574 (2004)
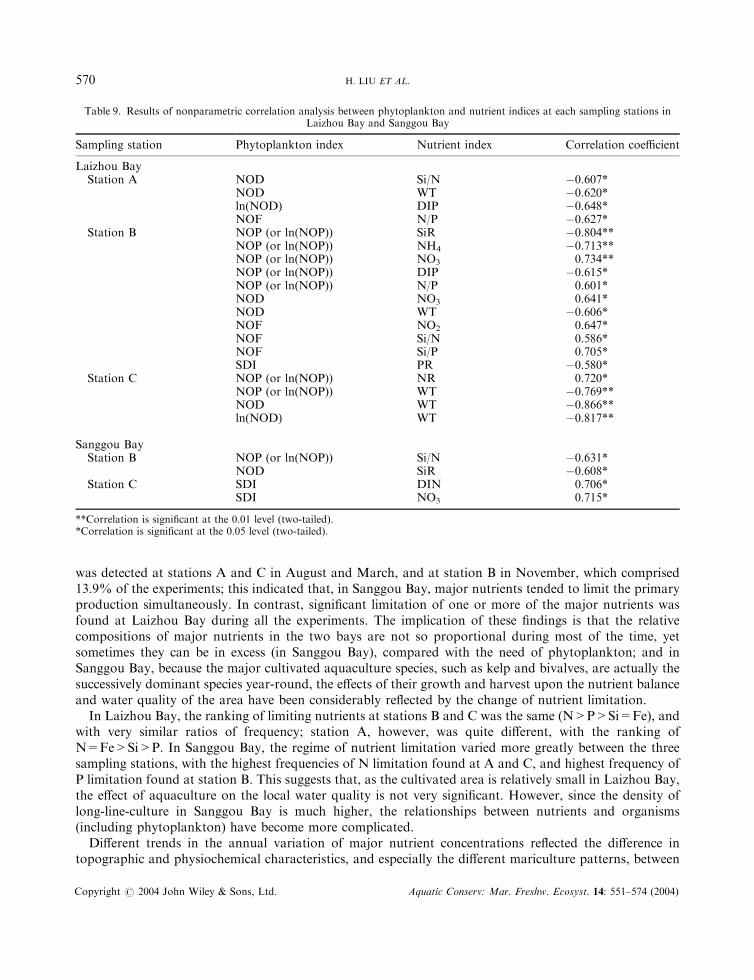
was detected at stations A and C in August and March, and at station B in November, which comprised13.9% of the experiments; this indicated that, in Sanggou Bay, major nutrients tended to limit the primaryproduction simultaneously. In contrast, significant limitation of one or more of the major nutrients wasfound at Laizhou Bay during all the experiments. The implication of these findings is that the relativecompositions of major nutrients in the two bays are not so proportional during most of the time, yetsometimes they can be in excess (in Sanggou Bay), compared with the need of phytoplankton; and inSanggou Bay, because the major cultivated aquaculture species, such as kelp and bivalves, are actually thesuccessively dominant species year-round, the effects of their growth and harvest upon the nutrient balanceand water quality of the area have been considerably reflected by the change of nutrient limitation.
In Laizhou Bay, the ranking of limiting nutrients at stations B and C was the same (N>P>Si=Fe), andwith very similar ratios of frequency; station A, however, was quite different, with the ranking ofN=Fe>Si>P. In Sanggou Bay, the regime of nutrient limitation varied more greatly between the threesampling stations, with the highest frequencies of N limitation found at A and C, and highest frequency ofP limitation found at station B. This suggests that, as the cultivated area is relatively small in Laizhou Bay,the effect of aquaculture on the local water quality is not very significant. However, since the density oflong-line-culture in Sanggou Bay is much higher, the relationships between nutrients and organisms(including phytoplankton) have become more complicated.
Different trends in the annual variation of major nutrient concentrations reflected the difference intopographic and physiochemical characteristics, and especially the different mariculture patterns, between
Table 9. Results of nonparametric correlation analysis between phytoplankton and nutrient indices at each sampling stations inLaizhou Bay and Sanggou Bay
Sampling station Phytoplankton index Nutrient index Correlation coefficient
Laizhou BayStation A NOD Si/N �0.607*
NOD WT �0.620*ln(NOD) DIP �0.648*NOF N/P �0.627*
Station B NOP (or ln(NOP)) SiR �0.804**NOP (or ln(NOP)) NH4 �0.713**NOP (or ln(NOP)) NO3 0.734**NOP (or ln(NOP)) DIP �0.615*NOP (or ln(NOP)) N/P 0.601*NOD NO3 0.641*NOD WT �0.606*NOF NO2 0.647*NOF Si/N 0.586*NOF Si/P 0.705*SDI PR �0.580*
Station C NOP (or ln(NOP)) NR 0.720*NOP (or ln(NOP)) WT �0.769**NOD WT �0.866**ln(NOD) WT �0.817**
Sanggou BayStation B NOP (or ln(NOP)) Si/N �0.631*
NOD SiR �0.608*Station C SDI DIN 0.706*
SDI NO3 0.715*
**Correlation is significant at the 0.01 level (two-tailed).*Correlation is significant at the 0.05 level (two-tailed).
H. LIU ET AL.570
Copyright # 2004 John Wiley & Sons, Ltd. Aquatic Conserv: Mar. Freshw. Ecosyst. 14: 551–574 (2004)
the two bays and among the sampling stations (Figure 4, Table 4). For example, the concentration of DINin Laizhou Bay showed much less variation with time and between the three stations, compared withSanggou Bay, for which the difference of DIN concentrations at the three stations clearly indicated for astrong effect of aquaculture on the quality of ambient water. The concentration of DIN went through aslow variable increasing trend in Laizhou Bay all through the year, until the diatom bloom occurred inMarch. However, the concentration of DIN showed a sharp increase at all three stations in Sanggou Bay inAugust. This can be reasonably attributed to two factors: regeneration of the benthic nutrients and theharvesting of kelp during July and August. Although harvesting of the 80 000mu (40 000 tons, dry weight)of kelp significantly decreased DIN absorption, shreds of kelp produced during the harvesting process arerapidly decomposed at the high water temperature and become an additional source of DIN. Generally, therecycling of nutrients in Sanggou Bay lead to violent fluctuations and a much higher maximum DINconcentration; no equivalent effect was found in Laizhou Bay.
It can be inferred from the diatom-dominated phytoplankton community in both bays that the samplingareas are representative of cleaner coastal waters (Yung et al., 2001), yet phytoplankton did exhibit differentsuccessions in the two bays (Figure 4, Tables 4 and 5). It is noteworthy that flagellates demonstrated severalmaxima and minima during the annual cycle, and dominated the phytoplankton community in 4 months inLaizhou Bay (including the noxious dinoflagellate Noctiluca scintillans (Kofoid et Swezy) bloom thatoccurred through April to May, which gave a light pink colour to the surface water of the sampling area).In Sanggou Bay, flagellates never exceeded 1% of total phytoplankton cell numbers during the survey, anddiatoms always dominated the phytoplankton community, peaking during March and July, when bloomsof Thalassiosira sp. and Chaetoceros sp. occurred respectively. The occurrence of algal blooms can beattributed to a number of factors, but the sharp increase of the concentration in the most potentiallylimiting nutrient (N) showed obvious relationships with diatom blooms in both bays.
A large number of significant correlation relationships (linear or nonparametric) were found among thenutrient, phytoplankton and physical factors at all sampling stations in both bays (Tables 6, 7, 8 & 9). Thisis an indication that all these factors, including the limiting index of the OPB experiments, have complicatedrelationships with each other.
In order to investigate any differences between the bays and the sampling stations, the results oflinear and nonparametric correlation analyses between phytoplankton and nutrient factors wereexamined (Tables 8 and 9). It is interesting to note that more nutrient indices were involved in significantcorrelations of nonparametric analysis, which suggests that nonparametric correlation relationshipsare more common between these factors. At the same time, much more significant nonparametriccorrelations were found for Laizhou Bay, and the significant linear correlations are all reflected in therespective nonparametric correlations, which is almost in direct contrast with Sanggou Bay. It can beinferred from this finding that the chemical and biological environment is widely different for the twobays, and much more intricate relationships between them are expected to be encountered in LaizhouBay. This complex of relationships may well indicate a dynamic stability of the natural water environmentthat is not heavily affected by aquaculture activities, in which nearly all biological and chemical factorsare restricted by each other. Phytoplankton numbers are always correlated with N, Si, and P indices,which suggests a direct influence of these limiting nutrients on phytoplankton volume in LaizhouBay. Phytoplankton and/or diatom number indices always showed negative correlations with watertemperature at all stations in Laizhou Bay, adding further support to the hypothesis that the phytoplanktoncommunity in the sampling area is more significantly influenced by the natural environment than byaquaculture activities.
However, the variations of correlation relationships of phytoplankton and nutrient indices between thesampling stations in Laizhou Bay do indicate changes in biochemical processes in ambient waters as a resultof long-line-culture; the change is not significant, and only longer term monitoring could lead to a clearerunderstanding of it.
LIMITING NUTRIENTS AND PHYTOPLANKTON 571
Copyright # 2004 John Wiley & Sons, Ltd. Aquatic Conserv: Mar. Freshw. Ecosyst. 14: 551–574 (2004)
In Sanggou Bay, phytoplankton indices are correlated with more limited nutrient indices (such asSi and N) in both linear and nonparametric analyses, and no relationships were found betweenphytoplankton and water temperature. This may indicate that primary production in Sanggou Bay ismodulated more effectively by mechanisms other than the natural conditions, which can be attributed,more or less, to the confined environment of the bay. The intensive long-line-culture contributes to theconfinement of this area; this is corroborated by the model calculations, which show that suspendedaquaculture in Sanggou Bay results in a 20% reduction in current speed in the main navigation channel anda 54% reduction in speed in the midst of a culture area (Bacher et al., 2001). In this study, relatively simpleand linear relationships between phytoplankton and nutrient factors are to be found at intensive long-line-culture areas.
Diatom (and phytoplankton) abundance at station A in Sanggou Bay is linearly correlated with N(NH4), reflecting the severe N limitation of primary production. This is confirmed by the OPB experimentresults, which demonstrate that the intensive cultivated kelp (a robust N absorber) has posed a strongcompetition for nutrients, thus controlling the phytoplankton biomass through the chain of nutrients. Atstation B, negative nonparametric correlations were found between phytoplankton numbers and Si:N ratio,and between diatom numbers and SiR. Though not the most potentially limiting nutrients for this area, Siand N govern the phytoplankton biomass through more complicated mechanisms. This is an area oftransition between the dominance of N limitation and Si limitation of primary production. At station C, itis Si and Fe limitation that directly control diatom production, as negative linear correlations were foundbetween the number of diatoms (phytoplankton) and SiR, and between its natural logarithm and SiR aswell as FeR. When the available Si and other major nutrients (such as N) are depleted by diatoms, thefloristic composition will change (Conley and Malone, 1992); this is reflected by the positive correlationsbetween flagellates and NR, SiR, and FeR. Furthermore, as the most potentially limiting nutrient, Ngoverns not the phytoplankton biomass, but its diversity at station C, which is reflected by the correlationbetween D and N (DIN and NO3).
The relatively unsophisticated correlations between phytoplankton and nutrient factors found inSanggou Bay may also be regarded as a characteristic of intensively cultivated areas. In a confinedenvironment with very slow current velocity (maximum 30 cm s�1), interaction between cultivated speciesand the chemical and biological environment governs the primary production through the food chain. Theresult of this competition tends to push the ecological balance towards one end.
It is proposed that, compared with the OPB method (Li et al., 1988), nutrient availability criteria(Brzezinski, 1985), and nutrient ratio criteria (Justic et al., 1995) for the detection of PLN (Tyrrell, 1999),monitoring of long-term correlation relationships between phytoplankton and nutrient indices may be asound approach to reveal the ULN.
CONCLUSIONS
Water quality at long-line-culture areas in Laizhou Bay remained effectively ‘pristine’ during this study. Thefluctuation of nutrient concentrations, and the convoluted relationships between phytoplankton andlimiting nutrients, generally reflected the natural characteristics of the marine environment.
Compared with the relatively higher productivity and moderate growth rates of cultivated scallops inLaizhou Bay, the cultivation density in Sanggou Bay clearly had a net effect on growth of bivalves, withlower growth rates, smaller dry-weight, and greater liability for disease occurrences. Even the long-line-cultured kelp inside the bay has a tendency to decay earlier during the summer time. A reduced cultivationdensity regime based on the results of more rigorous study on carrying capacity would help solve theseproblems.
H. LIU ET AL.572
Copyright # 2004 John Wiley & Sons, Ltd. Aquatic Conserv: Mar. Freshw. Ecosyst. 14: 551–574 (2004)
Being semi-enclosed and more densely populated with aquaculture species, Sanggou Bayenjoyed much higher DIN concentrations, which indicated that the accumulation of aquaculturewastes (e.g. faeces of the cultivated species) in the bottom layers has already imposed strong effectson the water quality. With no kelp cultivation to balance the nutrients in the water, this resultsin poorer water quality. There is no evidence that the diatom bloom of Chaetoceros sp. in July washarmful, yet the instability of nutrients (not necessarily confined to the limiting nutrients) is alreadyan indication for the vulnerability of the ecosystem of Sanggou Bay. The calculation of carryingcapacity based on total supply and demand of inorganic nutrient (Fang et al., 2001) must be treatedwith caution; if we consider that carrying capacity is an integrated concept of factors includingthe environment, ecology, and economy (Dong et al., 1998), and that sustainability should be highlighted inall studies on carrying capacity, then the existing aquaculture pattern in Sanggou Bay should deserve moreconsideration.
ACKNOWLEDGEMENTS
This study is supported by the Chinese National Fundamental Research Development Plan (project number:G1999012011) and the National Natural Science Foundation project ‘Study on Interactions between Large-scaleMariculture of Bivalves and the Environment’ (No. 30271021). Thanks to the crewmembers of Rongcheng FisheryBureau and Fishery Management Bureau of Jincheng Town for their effort in the sampling. We are grateful toProfessor Li Deshang for his advice on experiment design and suggestion of important references.
REFERENCES
Bacher C, Hawkins T, Duarte P. 2001. Synthesis of EU project: carrying capacity and impact of aquaculture on theenvironment in Chinese bays. (Unpublished report.)
Barlow JP, Schaffner WR, de Noyelles Jr F, Peterson BJ. 1973. Continuous flow nutrient bioassays with naturalphytoplankton populations. In Bioassay Techniques and Environmental Chemistry, Glass G (ed). Ann Arbor Science:299–319.
Boyd CE, Tucker CS. 1998. Pond Aquaculture Water Quality Management. Kluwer: Boston; 8–86.Brzezinski MA. 1985. The Si:C:N ratio of marine diatoms: interspecific variability and the effect of some environmentalvariables. Journal of Phycology 21: 347–357.
Chen CM, Zheng AR, Zhang CY. 1996. Ecological impacts of maricultural discharge on phytoplankton in Xiamenharbour (west). Collected Oceanic Works/Haiyang Wenji, Tianjin 19 (1): 67–78.
Compilation Committee of Chinese Bays. 1991. Records of Chinese Bays, Third Fascicule. Ocean Press: Beijing; 2–3 (inChinese).
Conley DJ, Malone TC. 1992. Annual cycle of dissolved silicate in Chesapeake Bay: implications for the productionand fate of phytoplankton biomass. Marine Ecology Progress Series 81: 121–128.
Delesalle B, Sakka A, Legendre L, Pages J, Charpy L, Loret P. 2001. The phytoplankton of Takapoto Atoll (TuamotuArchipelago, French Polynesia): time and space variability of biomass, primary production and composition over 24years. Aquatic Living Resources 14: 175–182.
Dong SL, Li DS, Pan KH. 1998. Discussions on carrying capacity. Journal of Ocean University of Qingdao 28(2):253–257 (in Chinese).
Dugdale RC, Wilkerson FP. 1998. Silicate regulation of new production in the equatorial Pacific upwelling. Nature 391:270–273.
Fang JG, Strand O, Liang XM, Zhang JH. 2001. Carrying capacity and optimizing measures for mariculture in SangoBay. Marine Fisheries Research 22(4): 57–63.
Fisher TR, Peele ER, Ammerman JW, Harding Jr LW. 1992. Nutrient limitation of phytoplankton in Chesapeake Bay.Marine Ecology Progress Series 82: 51–63.
Goldman CR. 1972. The role of minor nutrients in limiting the productivity of aquatic ecosystems, In Nutrients andEutrophication. American Society of Limnology and Oceanography Special Symposium 1, Likens GE (ed.); 21–33.
LIMITING NUTRIENTS AND PHYTOPLANKTON 573
Copyright # 2004 John Wiley & Sons, Ltd. Aquatic Conserv: Mar. Freshw. Ecosyst. 14: 551–574 (2004)

Goldman JC, McCarthy JJ, Peavy DG. 1979. Growth rate influence on the chemical composition of phytoplankton inoceanic waters. Nature 279: 210–215.
Hutchins DA, Bruland KW. 1998. Iron-limited diatom growth and Si:N uptake ratios in a coastal upwelling regime.Nature 393: 561–564.
Justic D, Rabalais NN, Turner RE, Dortch Q. 1995. Changes in nutrient structure of river-dominated coastal waters:stoichiometric nutrient balance and its consequences. Estuarine, Coastal and Shelf Sciences 40: 339–356.
Landry MR, Barber RT, Bidigare RR, Chai F, Coale KH, Dam HG, Lewis MR, Lindley ST, McCarthy JJ, RomanMR, Stoecker DK, Verity PG, White JR. 1997. Iron and grazing constraints on primary production in the centralequatorial Pacific: an EqPac synthesis. Limnology and Oceanography 42(3): 405–418.
Li DS, Zhang MZ, Zhao MH, Xu YS. 1988. Study on oxygen production bioassay methods as a guidance for fertilizinglarge water bodies. Oceanologia et Limnologia Sinica 19(6): 539–546 (in Chinese).
Lin CK, Schelske CL. 1981. Seasonal variation of potential nutrent limitation to chlorophyll production in southernLake Huron. Canadian Journal of Fisheries and Aquatic Sciences 38(1): 1–9.
Lobban CS, Harrison PJ, Jo Duncan MJ. 1985. The Physiological Ecology of Seaweeds. Cambridge University Press.Maestrini SY, Berland BR, Breret M, Poletti R. 1997. Nutrient limiting the algal growth potential (AGP) in the PoRiver plume and an adjacent area, northeast Adriatic Sea: enrichment bioassays with the test algae Nizschiaclosterium and Thalassiosira pseudonana. Estuaries 20(2): 416–429.
Martin JH, Fitzwater SE. 1988. Iron deficiency limits phytoplankton growth in the north-east Pacific subarctic. Nature331: 341–343.
Ogilvie SC, Ross AH, Schiel DR. 2000. Phytoplankton biomass associated with mussel farms in Beatrix Bay,New Zealand. Aquaculture 181: 71–80.
Redfield AC. 1934. On the proportions of organic derivatives in the sea water and their relation to the composition ofplankton. In James Johnstone Memorial Volume, Daniel RJ (ed.). Liverpool University Press: Liverpool; 176–192.
Redfield AC. 1958. The biological control of chemical factors in the environment. American Scientist 46: 205–222.Sanudo-Wilhelmy SA, Kustka AB, Gobler CJ, Huchins DA, Yang M, Lwiza K, Burns J, Capone DG, Raven JA,Carpenter EJ. 2001. Phosphorus limitation of nitrogen fixation by Trichodesmium in the central Atlantic Ocean.Nature 411(3): 66–69.
Schelske CL, Stoermer EF. 1971. Eutrophication, silica and predicted changes in algal quality in Lake Michigan.Science 173: 423–424.
Schindler DW. 1971. Carbon, nitrogen, and phosphorus and the eutrophication of freshwater lakes. Journal ofPhycology 7: 321–329.
Schindler DW. 1974. Eutrophication and recovery in experimental lakes: implications for lake management. Science184: 897–899.
Schindler DW. 1977. The evolution of phosphorus limitation in lakes. Science 195: 260–262.Shu YF, Han MS. 1992. Illustration of Marine Plankton in China Seas. Marin Publishing Company: Beijing.Smith VH. 1982. The nitrogen and phosphorus ratios favor dominance by blue–green algae in lake phytoplankton.Science 221: 669–671.
Thingstad TF, Zweifel UL, Rassoulzadegan F. 1998. P limitation of heterotrophic bacteria and phytoplankton in thenorthwest Mediterranean. Limnology and Oceanography 43(1): 88–94.
Thomas WH. 1970a. On nitrogen deficiency in tropical Pacific oceanic phytoplankton: photosynthetic parameters inpoor and rich water. Limnology and Oceanography 15: 380–385.
Thomas WH. 1970b. Effect of ammonium and nitrate concentration on chlorophyll increases in natural tropical Pacificphytoplankton populations. Limnology and Oceanography 15: 386–394.
Tyrrell T. 1999. The relative influence of nitrogen and phosphorus on oceanic primary production. Nature 400:525–530.
Vollenweider RA. 1976. Advances in defining critical loading levels of phosphorus in lake eutrophication. Memoriedell’Istituto Italiano di Idrobiologia 33: 53–83.
Yung YK, Wong CK, Yau K, Qian PY. 2001. Long-term changes in water quality and phytoplankton characteristics inPort Shelter, Hong Kong, from 1988–1998. Marine Pollution Bulletin 42(10): 981–992.
H. LIU ET AL.574
Copyright # 2004 John Wiley & Sons, Ltd. Aquatic Conserv: Mar. Freshw. Ecosyst. 14: 551–574 (2004)