Study on Improving the Worker Safety at Roadway Worksites ...
18
(7,473 Words: 4,223 texts, 10 figures, 3 tables) Study on Improving the Worker Safety at Roadway Worksites in Japan Submitted by Masayuki Hirasawa Senior Researcher Traffic Engineering Research Team, Civil Engineering Research Institute for Cold Region, PWRI 1-3 Hiragishi, Toyohira-ku, Sapporo, 062-8602, Japan Tel: +81-11-841-1738 Fax: +81-11-841-9747 E-mail: [email protected] Azuma Takemoto Researcher Traffic Engineering Research Team, Civil Engineering Research Institute for Cold Region, PWRI 1-3 Hiragishi, Toyohira-ku, Sapporo, 062-8602, Japan Tel: +81-11-841-1738 Fax: +81-11-841-9747 E-mail: [email protected] Motoki Asano Team Leader Traffic Engineering Research Team, Civil Engineering Research Institute for Cold Region, PWRI 1-3 Hiragishi, Toyohira-ku, Sapporo, 062-8602, Japan Tel: +81-11-841-1116 Fax: +81-11-841-9747 E-mail: [email protected] Tetsuya Takada Sapporo Development and Construction Department, Hokkaido Regional Development Bureau, Ministry of Land, Infrastructure and Transport 1-1-2 Suishamachi, Toyohira-ku, Sapporo, 062-0912, Japan Tel: +81-11-811-2264 Fax: +81-11-811-7033 E-mail: [email protected] Submission Date: August 1, 2006 TRB 2007 Annual Meeting CD-ROM Paper revised from original submittal.
Transcript of Study on Improving the Worker Safety at Roadway Worksites ...

(7,473 Words: 4,223 texts, 10 figures, 3 tables) Study on Improving the Worker Safety at Roadway Worksites in Japan Submitted by Masayuki Hirasawa Senior Researcher Traffic Engineering Research Team, Civil Engineering Research Institute for Cold Region, PWRI 1-3 Hiragishi, Toyohira-ku, Sapporo, 062-8602, Japan Tel: +81-11-841-1738 Fax: +81-11-841-9747 E-mail: [email protected] Azuma Takemoto Researcher Traffic Engineering Research Team, Civil Engineering Research Institute for Cold Region, PWRI 1-3 Hiragishi, Toyohira-ku, Sapporo, 062-8602, Japan Tel: +81-11-841-1738 Fax: +81-11-841-9747 E-mail: [email protected] Motoki Asano Team Leader Traffic Engineering Research Team, Civil Engineering Research Institute for Cold Region, PWRI 1-3 Hiragishi, Toyohira-ku, Sapporo, 062-8602, Japan Tel: +81-11-841-1116 Fax: +81-11-841-9747 E-mail: [email protected] Tetsuya Takada Sapporo Development and Construction Department, Hokkaido Regional Development Bureau, Ministry of Land, Infrastructure and Transport 1-1-2 Suishamachi, Toyohira-ku, Sapporo, 062-0912, Japan Tel: +81-11-811-2264 Fax: +81-11-811-7033 E-mail: [email protected] Submission Date: August 1, 2006
TRB 2007 Annual Meeting CD-ROM Paper revised from original submittal.

Hirasawa et al. 1
ABSTRACT Work-related accidents at construction sites in Japan resulted in 1,001 fatalities and 44,886 injuries in 1996, but by 2005 these had fallen to 487 fatalities and 27,193 injuries. Among accidents at roadway worksites recorded between 1996 and 2000, traffic accidents rank third. Since 2001, the Ministry of Land, Infrastructure and Transport has been seeking to protect workers by mandating comprehensive improvements to uniforms of traffic control personnel, replacement of traffic control personnel with robots, more appropriate positioning of traffic control personnel, and placement of delta cushions.
This paper aims to contribute to safety at roadway worksites. Toward this, trucking companies and traffic safety contractors in Hokkaido were surveyed on their satisfaction with road safety measures. Additionally, experiments were done at the Tomakomai Winter Test Track to evaluate the visibility of traffic control uniforms. For safety measures at roadway worksites, traffic safety contractors responded that the items involving the upstream end of the worksite (i.e., traffic control personnel placement and delta cushions) would most greatly influence their satisfaction. Trucking companies responded that ways of controlling traffic would most greatly influence their satisfaction. CS portfolio analysis found that, for both traffic safety contractors and trucking companies, “ease of understandability of displayed construction information signs” and “nighttime visibility of traffic control personnel” require priority improvement. Experiments on visual recognition of traffic control personnel found the greatest recognition distances for fluorescent orange and yellow, and AHP analysis found the same result.
TRB 2007 Annual Meeting CD-ROM Paper revised from original submittal.
Hirasawa et al. 2
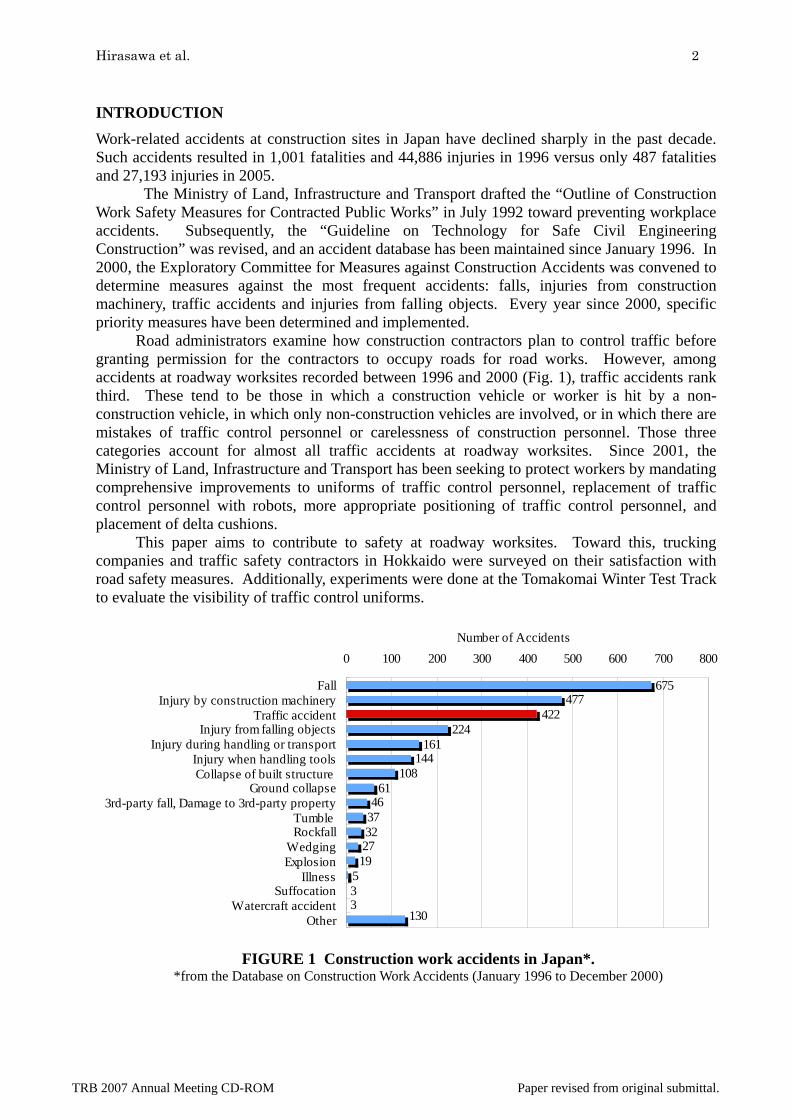
INTRODUCTION Work-related accidents at construction sites in Japan have declined sharply in the past decade. Such accidents resulted in 1,001 fatalities and 44,886 injuries in 1996 versus only 487 fatalities and 27,193 injuries in 2005.
The Ministry of Land, Infrastructure and Transport drafted the “Outline of Construction Work Safety Measures for Contracted Public Works” in July 1992 toward preventing workplace accidents. Subsequently, the “Guideline on Technology for Safe Civil Engineering Construction” was revised, and an accident database has been maintained since January 1996. In 2000, the Exploratory Committee for Measures against Construction Accidents was convened to determine measures against the most frequent accidents: falls, injuries from construction machinery, traffic accidents and injuries from falling objects. Every year since 2000, specific priority measures have been determined and implemented.
Road administrators examine how construction contractors plan to control traffic before granting permission for the contractors to occupy roads for road works. However, among accidents at roadway worksites recorded between 1996 and 2000 (Fig. 1), traffic accidents rank third. These tend to be those in which a construction vehicle or worker is hit by a non-construction vehicle, in which only non-construction vehicles are involved, or in which there are mistakes of traffic control personnel or carelessness of construction personnel. Those three categories account for almost all traffic accidents at roadway worksites. Since 2001, the Ministry of Land, Infrastructure and Transport has been seeking to protect workers by mandating comprehensive improvements to uniforms of traffic control personnel, replacement of traffic control personnel with robots, more appropriate positioning of traffic control personnel, and placement of delta cushions.
This paper aims to contribute to safety at roadway worksites. Toward this, trucking companies and traffic safety contractors in Hokkaido were surveyed on their satisfaction with road safety measures. Additionally, experiments were done at the Tomakomai Winter Test Track to evaluate the visibility of traffic control uniforms.
675477
224161
144108
6146
37322719
533
130
422
0 100 200 300 400 500 600 700 800
FallInjury by construction machinery
Traffic accidentInjury from falling objects
Injury during handling or transportInjury when handling toolsCollapse of built structure
Ground collapse3rd-party fall, Damage to 3rd-party property
Tumble Rockfall
WedgingExplosion
IllnessSuffocation
Watercraft accidentOther
Number of Accidents
FIGURE 1 Construction work accidents in Japan*. *from the Database on Construction Work Accidents (January 1996 to December 2000)
TRB 2007 Annual Meeting CD-ROM Paper revised from original submittal.
Hirasawa et al. 3
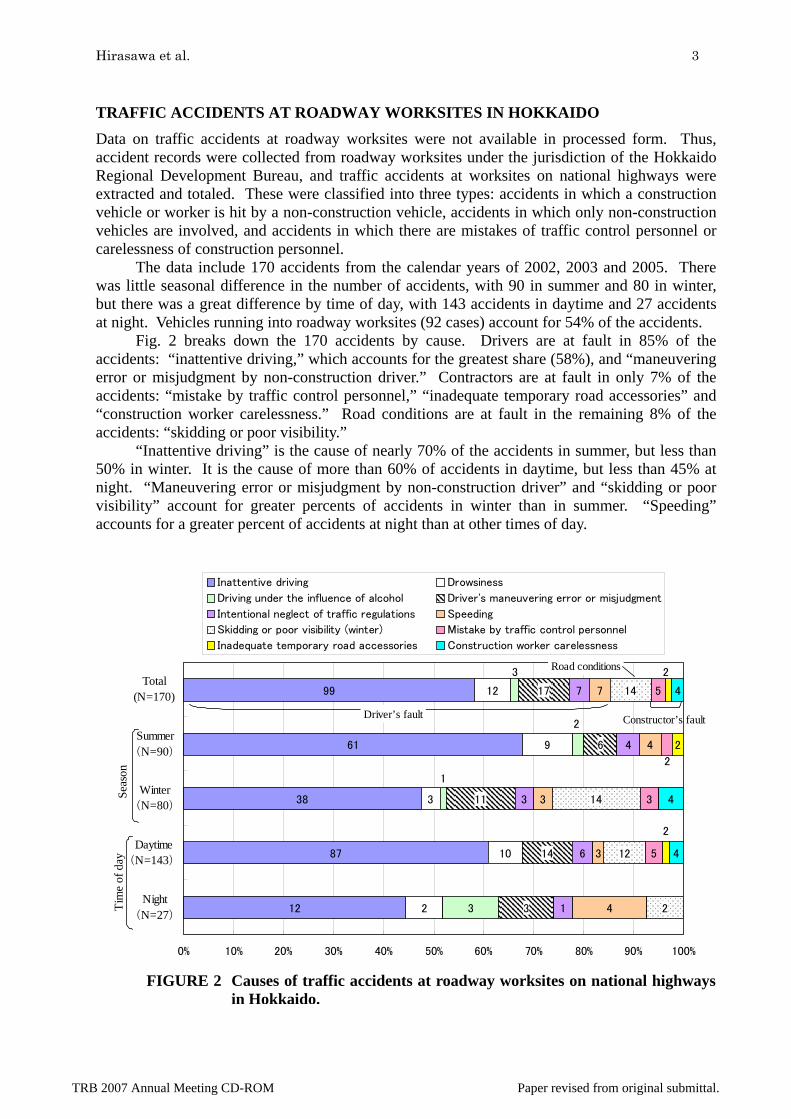
TRAFFIC ACCIDENTS AT ROADWAY WORKSITES IN HOKKAIDO Data on traffic accidents at roadway worksites were not available in processed form. Thus, accident records were collected from roadway worksites under the jurisdiction of the Hokkaido Regional Development Bureau, and traffic accidents at worksites on national highways were extracted and totaled. These were classified into three types: accidents in which a construction vehicle or worker is hit by a non-construction vehicle, accidents in which only non-construction vehicles are involved, and accidents in which there are mistakes of traffic control personnel or carelessness of construction personnel.
The data include 170 accidents from the calendar years of 2002, 2003 and 2005. There was little seasonal difference in the number of accidents, with 90 in summer and 80 in winter, but there was a great difference by time of day, with 143 accidents in daytime and 27 accidents at night. Vehicles running into roadway worksites (92 cases) account for 54% of the accidents.
Fig. 2 breaks down the 170 accidents by cause. Drivers are at fault in 85% of the accidents: “inattentive driving,” which accounts for the greatest share (58%), and “maneuvering error or misjudgment by non-construction driver.” Contractors are at fault in only 7% of the accidents: “mistake by traffic control personnel,” “inadequate temporary road accessories” and “construction worker carelessness.” Road conditions are at fault in the remaining 8% of the accidents: “skidding or poor visibility.”
“Inattentive driving” is the cause of nearly 70% of the accidents in summer, but less than 50% in winter. It is the cause of more than 60% of accidents in daytime, but less than 45% at night. “Maneuvering error or misjudgment by non-construction driver” and “skidding or poor visibility” account for greater percents of accidents in winter than in summer. “Speeding” accounts for a greater percent of accidents at night than at other times of day.
12
87
38
61
99
2
10
3
9
12
3 3
14
11
6
17
1
6
3
4
7
4
3
3
4
7
2
12
14
14
4
4
4
2
3
1
2
5
5
3
2
2
2
0% 10% 20% 30% 40% 50% 60% 70% 80% 90% 100%
Night(N=27)
Daytime(N=143)
Winter(N=80)
Summer(N=90)
Total(N=170)
Inattentive driving Drowsiness
Driving under the influence of alcohol Driver's maneuvering error or misjudgment
Intentional neglect of traffic regulations Speeding
Skidding or poor visibility (winter) Mistake by traffic control personnel
Inadequate temporary road accessories Construction worker carelessness
Seas
on
Driver’s fault
Road conditions
Constructor’s fault
Tim
e of
day
FIGURE 2 Causes of traffic accidents at roadway worksites on national highways in Hokkaido.
TRB 2007 Annual Meeting CD-ROM Paper revised from original submittal.
Hirasawa et al. 4
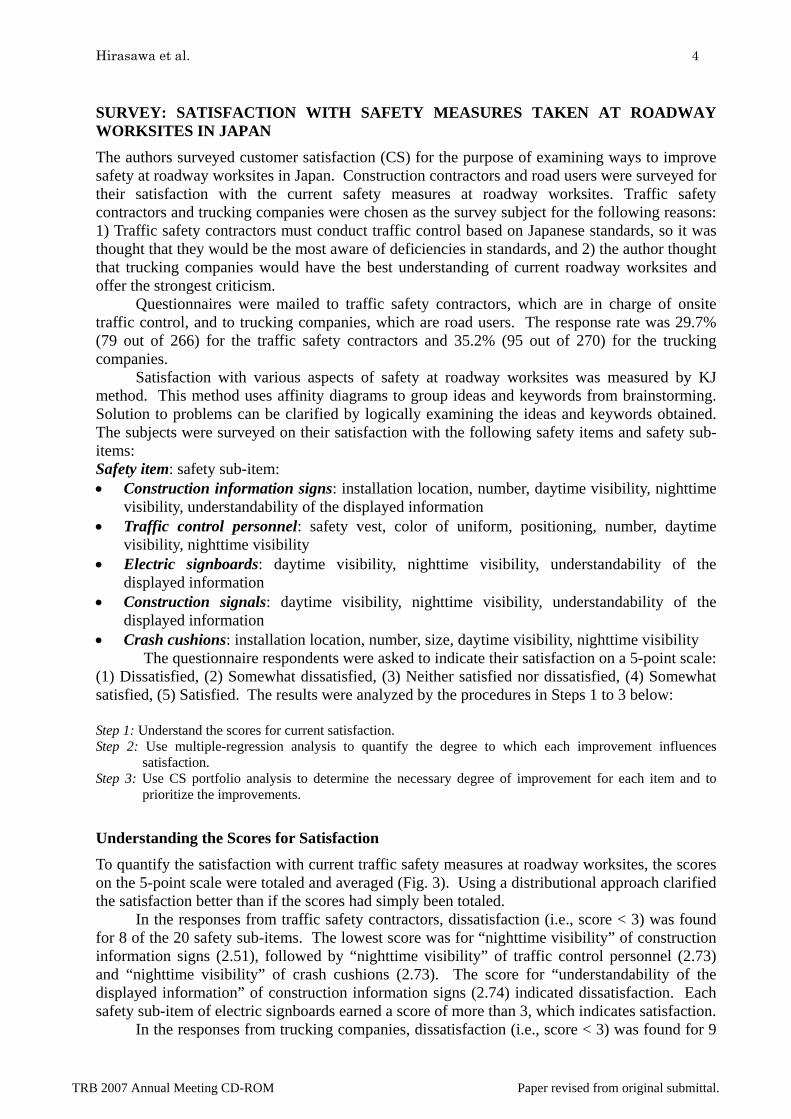
SURVEY: SATISFACTION WITH SAFETY MEASURES TAKEN AT ROADWAY WORKSITES IN JAPAN The authors surveyed customer satisfaction (CS) for the purpose of examining ways to improve safety at roadway worksites in Japan. Construction contractors and road users were surveyed for their satisfaction with the current safety measures at roadway worksites. Traffic safety contractors and trucking companies were chosen as the survey subject for the following reasons: 1) Traffic safety contractors must conduct traffic control based on Japanese standards, so it was thought that they would be the most aware of deficiencies in standards, and 2) the author thought that trucking companies would have the best understanding of current roadway worksites and offer the strongest criticism.
Questionnaires were mailed to traffic safety contractors, which are in charge of onsite traffic control, and to trucking companies, which are road users. The response rate was 29.7% (79 out of 266) for the traffic safety contractors and 35.2% (95 out of 270) for the trucking companies.
Satisfaction with various aspects of safety at roadway worksites was measured by KJ method. This method uses affinity diagrams to group ideas and keywords from brainstorming. Solution to problems can be clarified by logically examining the ideas and keywords obtained. The subjects were surveyed on their satisfaction with the following safety items and safety sub-items: Safety item: safety sub-item: • Construction information signs: installation location, number, daytime visibility, nighttime
visibility, understandability of the displayed information • Traffic control personnel: safety vest, color of uniform, positioning, number, daytime
visibility, nighttime visibility • Electric signboards: daytime visibility, nighttime visibility, understandability of the
displayed information • Construction signals: daytime visibility, nighttime visibility, understandability of the
displayed information • Crash cushions: installation location, number, size, daytime visibility, nighttime visibility
The questionnaire respondents were asked to indicate their satisfaction on a 5-point scale: (1) Dissatisfied, (2) Somewhat dissatisfied, (3) Neither satisfied nor dissatisfied, (4) Somewhat satisfied, (5) Satisfied. The results were analyzed by the procedures in Steps 1 to 3 below: Step 1: Understand the scores for current satisfaction. Step 2: Use multiple-regression analysis to quantify the degree to which each improvement influences
satisfaction. Step 3: Use CS portfolio analysis to determine the necessary degree of improvement for each item and to
prioritize the improvements.
Understanding the Scores for Satisfaction To quantify the satisfaction with current traffic safety measures at roadway worksites, the scores on the 5-point scale were totaled and averaged (Fig. 3). Using a distributional approach clarified the satisfaction better than if the scores had simply been totaled.
In the responses from traffic safety contractors, dissatisfaction (i.e., score < 3) was found for 8 of the 20 safety sub-items. The lowest score was for “nighttime visibility” of construction information signs (2.51), followed by “nighttime visibility” of traffic control personnel (2.73) and “nighttime visibility” of crash cushions (2.73). The score for “understandability of the displayed information” of construction information signs (2.74) indicated dissatisfaction. Each safety sub-item of electric signboards earned a score of more than 3, which indicates satisfaction.
In the responses from trucking companies, dissatisfaction (i.e., score < 3) was found for 9
TRB 2007 Annual Meeting CD-ROM Paper revised from original submittal.

Hirasawa et al. 5
of the 20 safety sub-items. The lowest mark was for “nighttime visibility” of construction information signs (2.42), followed by “nighttime visibility” of traffic control personnel (2.61). The score for “understandability of the displayed information” of construction information signs (2.64) indicated dissatisfaction. Each safety sub-item of traffic control personnel earned a score of less than 3, indicating dissatisfaction. Each safety sub-item of electric signboards and of construction signals earned a score of more than 3, indicating satisfaction.
(a) Traffic safety contractors
3.263.043.09
2.512.74
3.413.323.35
2.733.29
3.433.25
2.863.09
2.932.93
2.843.11
3.192.73
3.04
1.00 1.50 2.00 2.50 3.00 3.50 4.00 4.50 5.00
Installation locationNumber
Daytime visibilityNighttime visibility
UnderstandabilitySafety vest
Color of uniformDaytime visibility
Nighttime visibilityDaytime visibility
Nighttime visibilityUnderstandabilityDaytime visibility
Nighttime visibilityUnderstandability
Installation locationNumber
SizeDaytime visibility
Nighttime visibility
Constructioninformationsigns
Mean
Traffic controlpersonnel
Electronicsignboards
Constructionsignals
Crash cushions
(b) Trucking companies
3.103.053.05
2.422.64
2.782.82
2.982.61
3.243.33
3.173.04
3.163.01
2.932.89
2.993.00
2.762.96
1.00 1.50 2.00 2.50 3.00 3.50 4.00 4.50 5.00
Installation locationNumber
Daytime visibilityNighttime visibility
UnderstandabilityPositioning
NumberDaytime visibility
Nighttime visibilityDaytime visibility
Nighttime visibilityUnderstandabilityDaytime visibility
Nighttime visibilityUnderstandability
Installation locationNumber
SizeDaytime visibility
Nighttime visibility
Constructioninformationsigns
Mean
Traffic controlpersonnel
Electronicsignboards
Constructionsignals
Crash cushions
FIGURE 3 Satisfaction scores for roadway worksite safety measures.
TRB 2007 Annual Meeting CD-ROM Paper revised from original submittal.
Hirasawa et al. 6
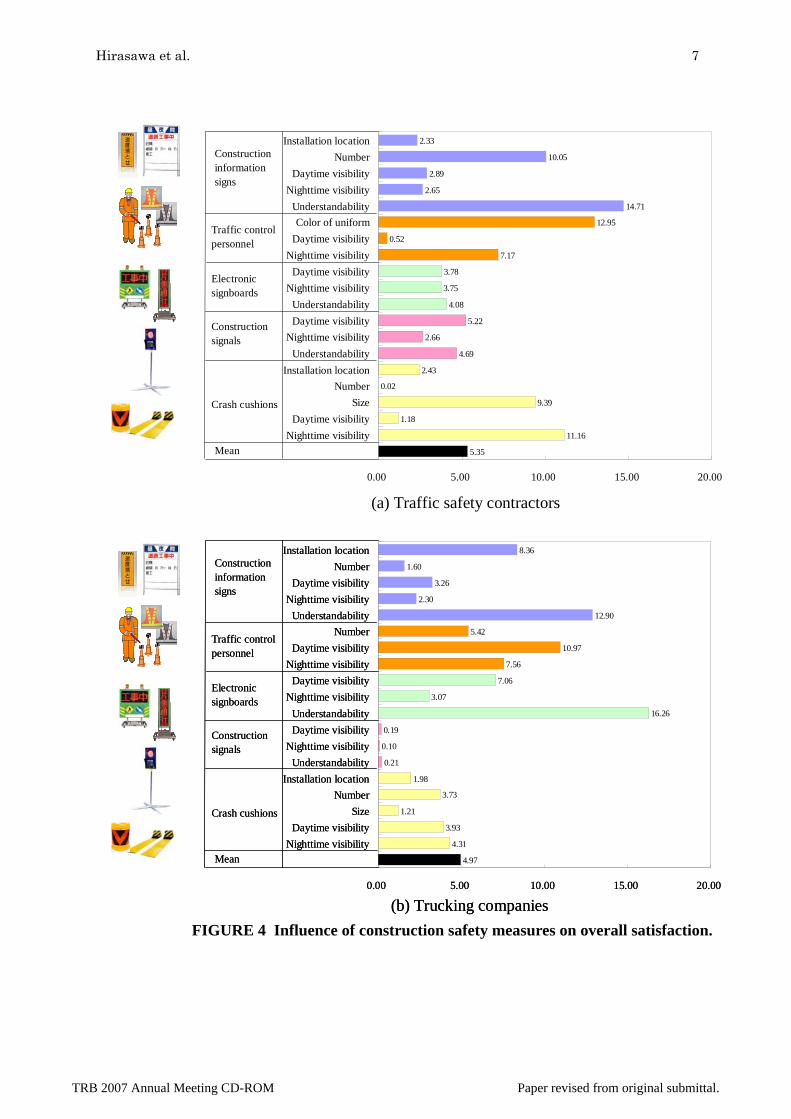
Quantifying the Degree to Which Each Improvement Influences Satisfaction To quantify the degree to which each improvement influences overall satisfaction, the overall satisfaction was used as an objective variable and the satisfaction with each safety sub-item was used as an explanatory variable for multiple-regression analysis. A partial regression coefficient was obtained for each safety sub-item (Fig. 4.)
The safety sub-item with the greatest effect on overall satisfaction according to the responses from the traffic safety contractors is “understandability of the displayed information” of construction information signs, followed by “color of uniform” of traffic control personnel, “nighttime visibility” of crash cushions, and “number” of construction information signs. The safety sub-item having the least effect on overall satisfaction is “number” of crash cushions, followed by “daytime visibility” of traffic control personnel and crash cushions.
The safety sub-item with the greatest effect on overall satisfaction according to the responses from the trucking companies is “understandability of the displayed information” of electric signboards, followed by “understandability of the displayed information” of construction information signs, “daytime visibility” of traffic control personnel, and “installation location” of construction information signs. The safety sub-item having the least effect is “nighttime visibility” of traffic signals. None of the safety sub-items of traffic signals greatly influence the overall satisfaction.
The responses of the traffic safety contractors and the trucking companies are compared. The traffic safety contractors responded that items involving the upstream end of the worksite (i.e., traffic control personnel placement and delta cushions), which are exposed to high risk of impact by oncoming vehicles, would most strongly influence their satisfaction. The trucking companies responded that items involving traffic control (i.e., the daytime visibility of traffic control personnel and the understandability of information displayed on electric sign boards and construction information signs) would most strongly influence their satisfaction.
TRB 2007 Annual Meeting CD-ROM Paper revised from original submittal.
Hirasawa et al. 7
(a) Traffic safety contractors
2.33
10.05
2.89
2.65
14.71
12.95
0.52
7.17
3.78
3.75
4.08
5.22
2.66
4.69
2.43
0.02
9.39
1.18
11.16
5.35
0.00 5.00 10.00 15.00 20.00
Installation locationNumber
Daytime visibilityNighttime visibility
UnderstandabilityColor of uniform
Daytime visibilityNighttime visibility
Daytime visibilityNighttime visibility
UnderstandabilityDaytime visibility
Nighttime visibilityUnderstandability
Installation locationNumber
SizeDaytime visibility
Nighttime visibility
Constructioninformationsigns
Mean
Traffic controlpersonnel
Electronicsignboards
Constructionsignals
Crash cushions
(b) Trucking companies
8.36
1.60
3.26
2.30
12.90
5.42
10.97
7.56
7.06
3.07
16.26
0.19
0.10
0.21
1.98
3.73
1.21
3.93
4.31
4.97
0.00 5.00 10.00 15.00 20.00
Installation locationNumber
Daytime visibilityNighttime visibility
UnderstandabilityNumber
Daytime visibilityNighttime visibility
Daytime visibilityNighttime visibility
UnderstandabilityDaytime visibility
Nighttime visibilityUnderstandability
Installation locationNumber
SizeDaytime visibility
Nighttime visibility
Constructioninformationsigns
Mean
Traffic controlpersonnel
Electronicsignboards
Constructionsignals
Crash cushions
FIGURE 4 Influence of construction safety measures on overall satisfaction.
TRB 2007 Annual Meeting CD-ROM Paper revised from original submittal.

Hirasawa et al. 8
Determining the Necessary Degree of Improvement and Prioritizing the Improvements An “improvement necessity factor,” which expresses the necessary degree of improvement, was calculated for each safety sub-item, for determination of the safety sub-item that would most contribute to improvement in overall safety at roadway worksites. For this purpose, CS portfolio analysis was conducted for satisfaction with each safety sub-item and the degree to which each improvement influences satisfaction as obtained by multiple-regression analysis.
In CS portfolio analysis, normalization is applied to both the scores of satisfaction and the degree to which each improvement influences satisfaction. The deviation of each item is plotted on the vertical axis (= satisfaction) and the degree to which each improvement influences satisfaction is plotted on the horizontal axis (= influence on satisfaction) (Fig. 5.) The four quadrants show items for which the current satisfaction must be maintained (maintenance items), items not requiring improvement (non-improvement items), items requiring improvement (improvement items) and items requiring the most urgent improvement (priority improvement items). The “priority improvement” quadrant contains items that are regarded as important by users but do not satisfy their expectations. The first step in effective improvement of overall satisfaction is the improvement of the items in this quadrant.
A line drawn from the coordinates of the mean value (50, 50) to the coordinates (80, 20) where the influence on satisfaction is the greatest and the satisfaction is the lowest can be used as a basic axis to determine the necessity of improvements. The distance between the coordinates (50, 50) and the coordinates of each safety sub-item, and the angle between the basic axis and the line connecting the coordinates (50, 50) with the coordinates of each safety sub-item is used to calculate the improvement necessity factor (1). Improvement of safety sub-items whose improvement necessity factors are relatively large will most effectively improve overall satisfaction.
22 )50- valuecoordinate 50- valuecoordinate 90
lineboundary thefrom Angle-9050) (50, scoordinate from Distance exponent Modified factor necessity t Improvemen
yx ()( +×⎟⎠⎞
⎜⎝⎛=
×= (1)
20.0
30.0
40.0
50.0
60.0
70.0
80.0
20.0 30.0 40.0 50.0 60.0 70.0 80.0Influence on satisfaction
Satisfaction
Items requiring priority improvementItems requiring improvement
Items not requiring improvement Items for which the currentsatisfaction must be maintained
Basic axis for improvement
Satis
fact
ion
Expectation HighLow
Items with very low satisfaction and expectation need to be improved.
Immediate improvement is necessary, because expectation is high but satisfaction is low.
Expectations are low but satisfaction is high.
It is important to maintain these items at their present satisfaction.
θAngle from the basic axis for improvement
Distance from the mean coordinate value
Eval
uatio
n of
indi
vidu
al sa
tisfa
ctio
n fa
ctor
s (m
ean
scor
es)
Correlation with overall satisfaction (partial correlation coefficient)
Low
(Dis
satis
fied)
Hig
h (S
atis
fied)
FIGURE 5 CS Portfolio analysis based on CS survey.
TRB 2007 Annual Meeting CD-ROM Paper revised from original submittal.
Hirasawa et al. 9
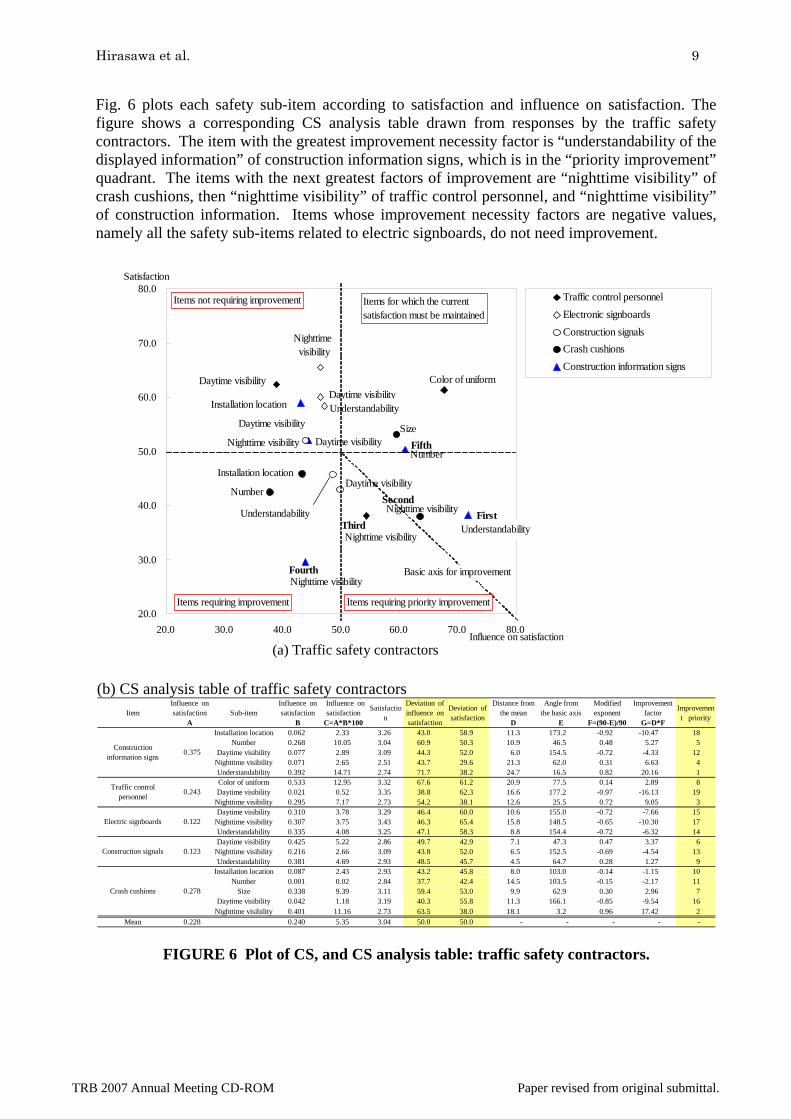
Fig. 6 plots each safety sub-item according to satisfaction and influence on satisfaction. The figure shows a corresponding CS analysis table drawn from responses by the traffic safety contractors. The item with the greatest improvement necessity factor is “understandability of the displayed information” of construction information signs, which is in the “priority improvement” quadrant. The items with the next greatest factors of improvement are “nighttime visibility” of crash cushions, then “nighttime visibility” of traffic control personnel, and “nighttime visibility” of construction information. Items whose improvement necessity factors are negative values, namely all the safety sub-items related to electric signboards, do not need improvement.
(a) Traffic safety contractors
Daytime visibilityNumber
Size
Daytime visibility
Nighttime visibility
Nighttime visibility
Daytime visibilityInstallation location Understandability
Daytime visibility
Nighttime visibility
Nighttime visibility
Daytime visibility
Understandability
Nighttime visibilityUnderstandability
Color of uniform
Number
Installation location
20.0
30.0
40.0
50.0
60.0
70.0
80.0
20.0 30.0 40.0 50.0 60.0 70.0 80.0
Items requiring priority improvementItems requiring improvement
Items not requiring improvement Items for which the currentsatisfaction must be maintained
First
Fifth
Second
Third
Fourth
Influence on satisfaction
Satisfaction
Basic axis for improvement
Traffic control personnelElectronic signboardsConstruction signalsCrash cushionsConstruction information signs
(b) CS analysis table of traffic safety contractors
ItemInfluence onsatisfaction
ASub-item
Influence onsatisfaction
B
Influence onsatisfaction
C=A*B*100
Satisfaction
Deviation ofinfluence onsatisfaction
Deviation ofsatisfaction
Distance fromthe mean
D
Angle fromthe basic axis
E
Modifiedexponent
F=(90-E)/90
Improvementfactor
G=D*F
Improvement priority
Installation location 0.062 2.33 3.26 43.0 58.9 11.3 173.2 -0.92 -10.47 18Number 0.268 10.05 3.04 60.9 50.3 10.9 46.5 0.48 5.27 5
Daytime visibility 0.077 2.89 3.09 44.3 52.0 6.0 154.5 -0.72 -4.33 12Nighttime visibility 0.071 2.65 2.51 43.7 29.6 21.3 62.0 0.31 6.63 4Understandability 0.392 14.71 2.74 71.7 38.2 24.7 16.5 0.82 20.16 1Color of uniform 0.533 12.95 3.32 67.6 61.2 20.9 77.5 0.14 2.89 8Daytime visibility 0.021 0.52 3.35 38.8 62.3 16.6 177.2 -0.97 -16.13 19
Nighttime visibility 0.295 7.17 2.73 54.2 38.1 12.6 25.5 0.72 9.05 3Daytime visibility 0.310 3.78 3.29 46.4 60.0 10.6 155.0 -0.72 -7.66 15
Nighttime visibility 0.307 3.75 3.43 46.3 65.4 15.8 148.5 -0.65 -10.30 17Understandability 0.335 4.08 3.25 47.1 58.3 8.8 154.4 -0.72 -6.32 14Daytime visibility 0.425 5.22 2.86 49.7 42.9 7.1 47.3 0.47 3.37 6
Nighttime visibility 0.216 2.66 3.09 43.8 52.0 6.5 152.5 -0.69 -4.54 13Understandability 0.381 4.69 2.93 48.5 45.7 4.5 64.7 0.28 1.27 9
Installation location 0.087 2.43 2.93 43.2 45.8 8.0 103.0 -0.14 -1.15 10Number 0.001 0.02 2.84 37.7 42.4 14.5 103.5 -0.15 -2.17 11
Size 0.338 9.39 3.11 59.4 53.0 9.9 62.9 0.30 2.96 7Daytime visibility 0.042 1.18 3.19 40.3 55.8 11.3 166.1 -0.85 -9.54 16
Nighttime visibility 0.401 11.16 2.73 63.5 38.0 18.1 3.2 0.96 17.42 2Mean 0.228 0.240 5.35 3.04 50.0 50.0 - - - - -
Constructioninformation signs
0.375
Traffic controlpersonnel 0.243
Electric signboards 0.122
Construction signals 0.123
Crash cushions 0.278
FIGURE 6 Plot of CS, and CS analysis table: traffic safety contractors.
TRB 2007 Annual Meeting CD-ROM Paper revised from original submittal.

Hirasawa et al. 10
Fig. 7 plots each safety sub-item according to satisfaction and influence on satisfaction. The figure shows a corresponding CS analysis table drawn from responses by the trucking companies. The safety sub-item with the greatest improvement necessity factor is “understandability of the displayed information” of construction information signs, which is in the “priority improvement” quadrant. The items with the next greatest improvement necessity factors are “nighttime visibility” of traffic control personnel and then “nighttime visibility” of construction information signs. Again, the safety sub-items whose of improvement necessity factors are negative values, namely each safety sub-item of electric signboards, do not need improvement.
(a) Trucking companies
Installation locationNumber
Number
Understandability
Nighttime visibility
Understandability
Daytime visibility
Nighttime visibility
Nighttime visibility
Daytime visibility
Understandability
Installation location
Daytime visibility
Nighttime visibility
Nighttime visibility
Daytime visibility
Size
Number
Daytime visibility
20.0
30.0
40.0
50.0
60.0
70.0
80.0
20.0 30.0 40.0 50.0 60.0 70.0 80.0
Items requiring priority improvementItems requiring improvement
Items not requiring improvement Items for which the currentsatisfaction must be maintained
First
Fifth
Second
Third
Fourth
Influence on satisfaction
Satisfaction
Basic axis for improvement
Traffic control personnelElectronic signboardsConstruction signalsCrash cushionsConstruction information signs
(b) CS analysis table of trucking companies
ItemInfluence onsatisfaction
ASub-item
Influence onsatisfaction
B
Influence onsatisfaction
C=A*B*100
Satisfaction
Deviation ofinfluence onsatisfaction
Deviation ofsatisfaction
Distance fromthe mean
D
Angle fromthe basic axis
E
Modifiedexponent
F=(90-E)/90
Improvementfactor
G=D*F
Improvement priority
Installation location 0.259 8.36 3.10 57.7 56.3 10.0 84.4 0.06 0.62 8Number 0.050 1.60 3.05 42.4 54.3 8.8 164.6 -0.83 -7.29 16
Daytime visibility 0.101 3.26 3.05 46.1 54.3 5.8 176.7 -0.96 -5.61 14Nighttime visibility 0.071 2.30 2.42 43.9 25.8 24.9 59.1 0.34 8.56 3Understandability 0.400 12.90 2.64 68.0 35.7 23.0 6.4 0.93 21.35 1
Number 0.217 5.42 2.82 51.0 43.6 6.5 36.0 0.60 3.88 6Daytime visibility 0.439 10.97 2.98 63.6 50.9 13.6 48.9 0.46 6.23 5
Nighttime visibility 0.302 7.56 2.61 55.9 34.4 16.7 24.4 0.73 12.16 2Daytime visibility 0.261 7.06 3.24 54.8 63.2 14.0 115.2 -0.28 -3.93 12
Nighttime visibility 0.114 3.07 3.33 45.7 66.8 17.3 149.3 -0.66 -11.43 18Understandability 0.601 16.26 3.17 75.6 59.6 27.3 65.5 0.27 7.44 4Daytime visibility 0.353 0.19 3.04 39.2 53.8 11.5 154.5 -0.72 -8.24 17
Nighttime visibility 0.178 0.10 3.16 39.0 59.2 14.4 174.7 -0.94 -13.53 19Understandability 0.399 0.21 3.01 39.2 52.4 11.0 147.4 -0.64 -7.04 15
Installation location 0.109 1.98 2.93 43.2 48.9 6.9 125.6 -0.40 -2.72 10Number 0.206 3.73 2.89 47.2 46.9 4.2 86.9 0.03 0.14 9
Size 0.067 1.21 2.99 41.5 51.4 8.6 144.2 -0.60 -5.20 13Daytime visibility 0.217 3.93 3.00 47.8 51.9 2.9 175.6 -0.95 -2.76 11
Nighttime visibility 0.238 4.31 2.76 48.5 40.8 9.3 54.3 0.40 3.69 7Mean 0.206 0.241 4.97 2.96 50.0 50.0 - - - - -
Constructioninformation signs
0.323
Traffic controlpersonnel 0.250
Electric signboards 0.270
Construction signals 0.005
Crash cushions 0.181
FIGURE 7 Plot of CS, and CS analysis table: trucking companies.
TRB 2007 Annual Meeting CD-ROM Paper revised from original submittal.
Hirasawa et al. 11
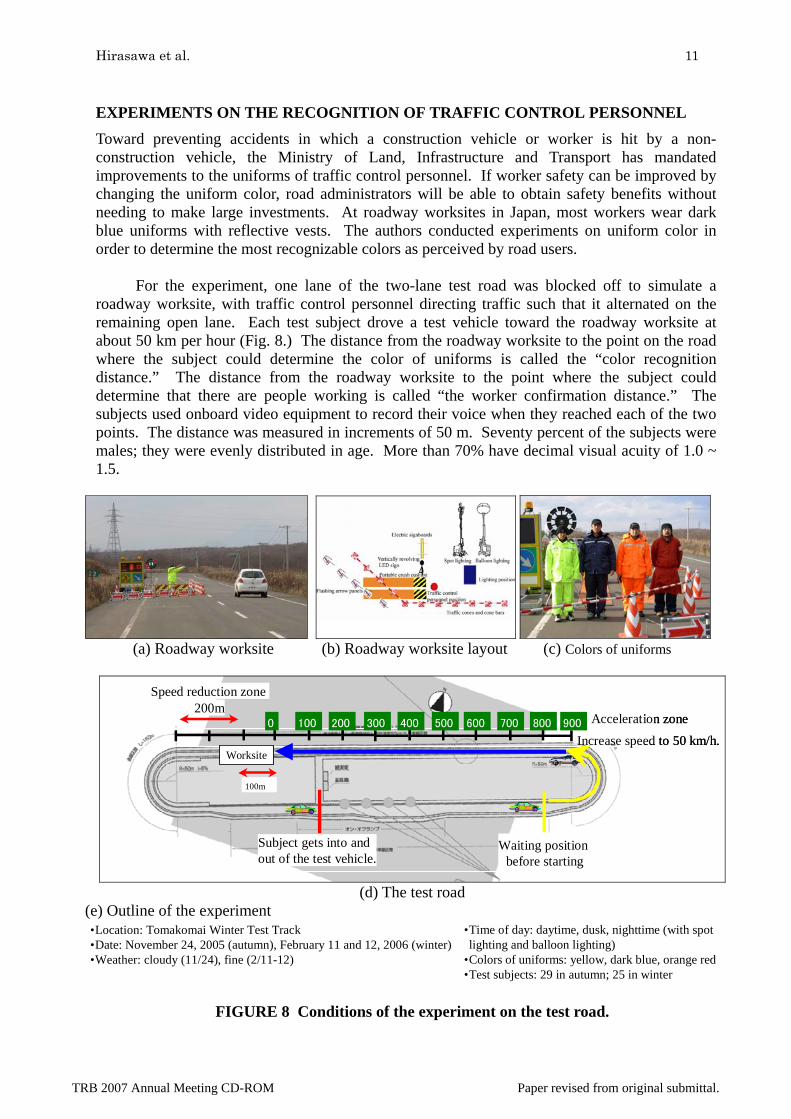
EXPERIMENTS ON THE RECOGNITION OF TRAFFIC CONTROL PERSONNEL Toward preventing accidents in which a construction vehicle or worker is hit by a non-construction vehicle, the Ministry of Land, Infrastructure and Transport has mandated improvements to the uniforms of traffic control personnel. If worker safety can be improved by changing the uniform color, road administrators will be able to obtain safety benefits without needing to make large investments. At roadway worksites in Japan, most workers wear dark blue uniforms with reflective vests. The authors conducted experiments on uniform color in order to determine the most recognizable colors as perceived by road users.
For the experiment, one lane of the two-lane test road was blocked off to simulate a roadway worksite, with traffic control personnel directing traffic such that it alternated on the remaining open lane. Each test subject drove a test vehicle toward the roadway worksite at about 50 km per hour (Fig. 8.) The distance from the roadway worksite to the point on the road where the subject could determine the color of uniforms is called the “color recognition distance.” The distance from the roadway worksite to the point where the subject could determine that there are people working is called “the worker confirmation distance.” The subjects used onboard video equipment to record their voice when they reached each of the two points. The distance was measured in increments of 50 m. Seventy percent of the subjects were males; they were evenly distributed in age. More than 70% have decimal visual acuity of 1.0 ~ 1.5.
(a) Roadway worksite (b) Roadway worksite layout (c) Colors of uniforms
Worksite
100 200 300 400 500 600 700 8000
Subject gets into andout of the test vehicle.
Speed reduction zone
Acceleration zoneIncrease speed to 50 km/h.
100m
200m900
Waiting position before starting
Worksite
100 200 300 400 500 600 700 8000
Subject gets into andout of the test vehicle.
Speed reduction zone
Acceleration zoneIncrease speed to 50 km/h.
100m
200m900
Waiting position before starting
(d) The test road
(e) Outline of the experiment •Location: Tomakomai Winter Test Track•Date: November 24, 2005 (autumn), February 11 and 12, 2006 (winter)•Weather: cloudy (11/24), fine (2/11-12)
•Time of day: daytime, dusk, nighttime (with spot lighting and balloon lighting)
•Colors of uniforms: yellow, dark blue, orange red•Test subjects: 29 in autumn; 25 in winter
FIGURE 8 Conditions of the experiment on the test road.
TRB 2007 Annual Meeting CD-ROM Paper revised from original submittal.
Hirasawa et al. 12
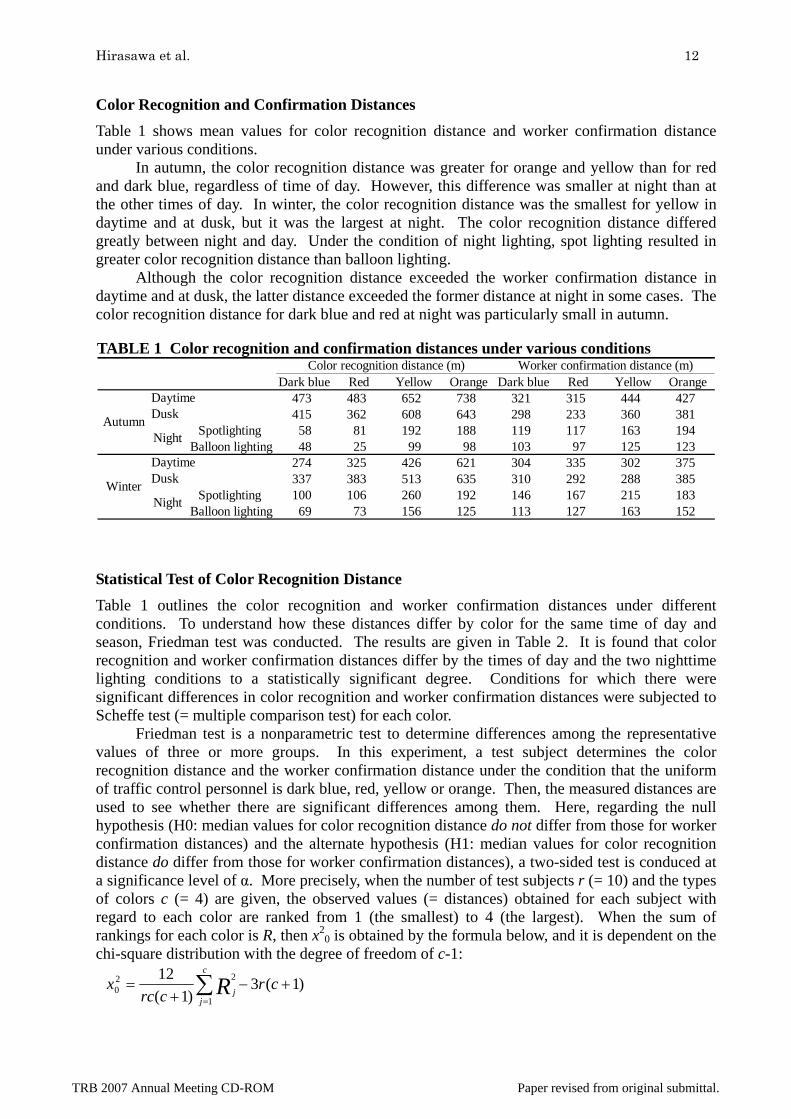
Color Recognition and Confirmation Distances Table 1 shows mean values for color recognition distance and worker confirmation distance under various conditions.
In autumn, the color recognition distance was greater for orange and yellow than for red and dark blue, regardless of time of day. However, this difference was smaller at night than at the other times of day. In winter, the color recognition distance was the smallest for yellow in daytime and at dusk, but it was the largest at night. The color recognition distance differed greatly between night and day. Under the condition of night lighting, spot lighting resulted in greater color recognition distance than balloon lighting.
Although the color recognition distance exceeded the worker confirmation distance in daytime and at dusk, the latter distance exceeded the former distance at night in some cases. The color recognition distance for dark blue and red at night was particularly small in autumn.
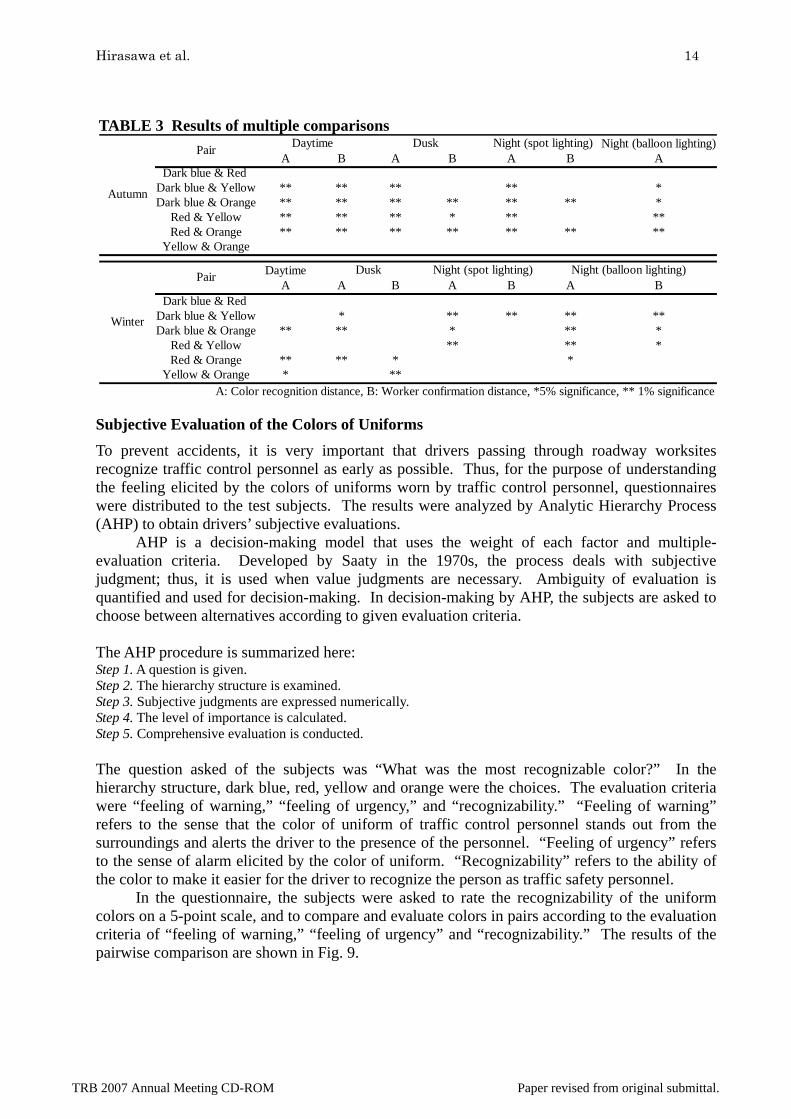
Statistical Test of Color Recognition Distance Table 1 outlines the color recognition and worker confirmation distances under different conditions. To understand how these distances differ by color for the same time of day and season, Friedman test was conducted. The results are given in Table 2. It is found that color recognition and worker confirmation distances differ by the times of day and the two nighttime lighting conditions to a statistically significant degree. Conditions for which there were significant differences in color recognition and worker confirmation distances were subjected to Scheffe test (= multiple comparison test) for each color.
Friedman test is a nonparametric test to determine differences among the representative values of three or more groups. In this experiment, a test subject determines the color recognition distance and the worker confirmation distance under the condition that the uniform of traffic control personnel is dark blue, red, yellow or orange. Then, the measured distances are used to see whether there are significant differences among them. Here, regarding the null hypothesis (H0: median values for color recognition distance do not differ from those for worker confirmation distances) and the alternate hypothesis (H1: median values for color recognition distance do differ from those for worker confirmation distances), a two-sided test is conduced at a significance level of α. More precisely, when the number of test subjects r (= 10) and the types of colors c (= 4) are given, the observed values (= distances) obtained for each subject with regard to each color are ranked from 1 (the smallest) to 4 (the largest). When the sum of rankings for each color is R, then x2
0 is obtained by the formula below, and it is dependent on the chi-square distribution with the degree of freedom of c-1:
)1(3)1(
121
220 +−
+= ∑
=
crcrc
xc
jjR
TABLE 1 Color recognition and confirmation distances under various conditions
Dark blue Red Yellow Orange Dark blue Red Yellow Orange473 483 652 738 321 315 444 427415 362 608 643 298 233 360 381
Spotlighting 58 81 192 188 119 117 163 194Balloon lighting 48 25 99 98 103 97 125 123
274 325 426 621 304 335 302 375337 383 513 635 310 292 288 385
Spotlighting 100 106 260 192 146 167 215 183Balloon lighting 69 73 156 125 113 127 163 152
Worker confirmation distance (m)
Daytime Dusk
Daytime Dusk
Color recognition distance (m)
Autumn
Winter
Night
Night
TRB 2007 Annual Meeting CD-ROM Paper revised from original submittal.
Hirasawa et al. 13
In the chi-square distribution with the degree of freedom of 3, when the significance level is 5% and x2
0 ≥ 7.81, and when the significance level is 1% and x20 ≥ 11.34, then the null hypothesis is
rejected. In other words, there are significant differences among the color recognition distances depending on colors. The results of the Friedman test under each condition are shown in Table 2. Except for the worker confirmation distance under the condition of balloon lighting in autumn, significant differences are found. In winter, there are significant differences except for the worker confirmation distance in daytime. Next, for the times of day and the color recognition/confirmation distances, Scheffe test (= multiple-comparison test) was conducted to identify differences in the color recognition/confirmation distances for each pair of colors. The Scheffe test was conducted for the color recognition/confirmation distances that showed statistically significant differences by Friedman test. Here, regarding the null hypothesis (H0: median values of color recognition distance for the color pairs do not differ by time of day or season) and the alternate hypothesis (H1: median values of color recognition distance for the color pairs do differ by time of day and season), a two-sided test is conduced at a significance level of α. When the number of test subjects r (= 10), the types of colors c (= 4), and the variance V (= 50) are given, the observed values (= distances) obtained for each subject with regard to each color are ranked from 1 (the smallest) to 4 (the largest). When the mean value of rankings for each color is R, then x2
0 is obtained by the formula below, and it is dependent on the chi-square distribution with the degree of freedom of c-1:
VRRcr
x ji
2))(1( 22
20
−−=
In the chi-square distribution with the degree of freedom of 3, when the significance level is 5% and x2
0 ≥ 7.81, and when the significance level is 1% and x20 ≥ 11.34, then the null hypothesis is
rejected. In other words, the pairs of colors used in the test differ significantly in terms of color recognition distance. The results of the multiple-comparison test are shown in Table 3. In autumn, for the pairs of “dark blue and red” and “yellow and orange,” no significant difference is shown for any time of day. In winter, for pair of “dark blue and red,” no significant difference is shown for any time of day. In daytime and at dusk in autumn, the pairs of “dark blue and orange” and “red and orange” differ significantly in terms of color recognition distance. Regarding the night in autumn, significant differences in the color recognition distance are found for the pairs of “dark blue and yellow,” “dark blue and orange,” “red and yellow” and “red and orange” under the conditions of both types of lighting.
In general, the pair of “dark blue and red” shows no significant difference in terms of color recognition/confirmation distance. The pair of “yellow and orange” shows significant differences only in the color recognition distance in daytime in winter and in the worker confirmation distance at dusk. Thus, the colors can be grouped into the two pairs of “dark blue and red” and “yellow and orange.”
TABLE 2 Results of Friedman test 0.01
A B A B A B A BChi-square value 42.67 31.99 37.47 19.80 41.91 20.11 34.91 7.59Degree of freedom 3.00 3.00 3.00 3.00 3.00 3.00 3.00 3.00P-value 0.00 0.00 0.00 0.00 0.00 0.00 0.00 0.06Determination ** ** ** ** ** ** **Chi-square value 28.04 2.45 33.04 13.21 35.79 11.26 29.39 14.45Degree of freedom 3.00 3.00 3.00 3.00 3.00 3.00 3.00 3.00P-value 0.00 0.48 0.00 0.00 0.00 0.01 0.00 0.00Determination ** ** ** ** * ** **
A: Color recognition distance, B: Worker confirmation distance, *5% significance, ** 1% significance
Night (spot lighting) Night (balloon lighting)
Autumn
Winter
Daytime Dusk
TRB 2007 Annual Meeting CD-ROM Paper revised from original submittal.
Hirasawa et al. 14
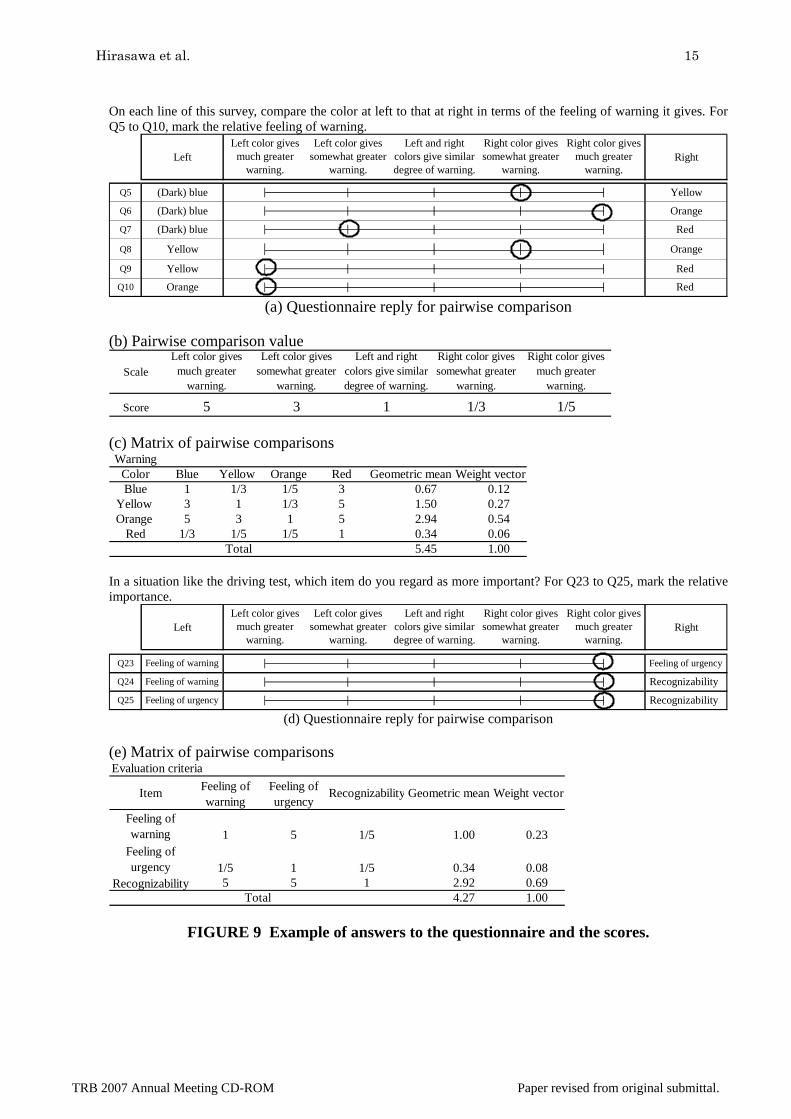
Subjective Evaluation of the Colors of Uniforms To prevent accidents, it is very important that drivers passing through roadway worksites recognize traffic control personnel as early as possible. Thus, for the purpose of understanding the feeling elicited by the colors of uniforms worn by traffic control personnel, questionnaires were distributed to the test subjects. The results were analyzed by Analytic Hierarchy Process (AHP) to obtain drivers’ subjective evaluations.
AHP is a decision-making model that uses the weight of each factor and multiple-evaluation criteria. Developed by Saaty in the 1970s, the process deals with subjective judgment; thus, it is used when value judgments are necessary. Ambiguity of evaluation is quantified and used for decision-making. In decision-making by AHP, the subjects are asked to choose between alternatives according to given evaluation criteria. The AHP procedure is summarized here: Step 1. A question is given. Step 2. The hierarchy structure is examined. Step 3. Subjective judgments are expressed numerically. Step 4. The level of importance is calculated. Step 5. Comprehensive evaluation is conducted. The question asked of the subjects was “What was the most recognizable color?” In the hierarchy structure, dark blue, red, yellow and orange were the choices. The evaluation criteria were “feeling of warning,” “feeling of urgency,” and “recognizability.” “Feeling of warning” refers to the sense that the color of uniform of traffic control personnel stands out from the surroundings and alerts the driver to the presence of the personnel. “Feeling of urgency” refers to the sense of alarm elicited by the color of uniform. “Recognizability” refers to the ability of the color to make it easier for the driver to recognize the person as traffic safety personnel.
In the questionnaire, the subjects were asked to rate the recognizability of the uniform colors on a 5-point scale, and to compare and evaluate colors in pairs according to the evaluation criteria of “feeling of warning,” “feeling of urgency” and “recognizability.” The results of the pairwise comparison are shown in Fig. 9.
TABLE 3 Results of multiple comparisons Night (balloon lighting)
A B A B A B ADark blue & Red
Dark blue & Yellow ** ** ** ** *Dark blue & Orange ** ** ** ** ** ** *
Red & Yellow ** ** ** * ** **Red & Orange ** ** ** ** ** ** **
Yellow & Orange
DaytimeA A B A B A B
Dark blue & Red Dark blue & Yellow * ** ** ** **Dark blue & Orange ** ** * ** *
Red & Yellow ** ** *Red & Orange ** ** * *
Yellow & Orange * **A: Color recognition distance, B: Worker confirmation distance, *5% significance, ** 1% significance
Pair
Pair
Autumn
Winter
Daytime Dusk Night (spot lighting)
Dusk Night (spot lighting) Night (balloon lighting)
TRB 2007 Annual Meeting CD-ROM Paper revised from original submittal.
Hirasawa et al. 15
On each line of this survey, compare the color at left to that at right in terms of the feeling of warning it gives. For Q5 to Q10, mark the relative feeling of warning.
Left RightRight color gives
much greaterwarning.
Left color givesmuch greater
warning.
Left color givessomewhat greater
warning.
Left and rightcolors give similardegree of warning.
Right color givessomewhat greater
warning.
Orange
Yellow
Orange
Red
Orange
Red
Red
(Dark) blue
(Dark) blue
Yellow
Q9 Yellow
(Dark) blue
Q10
Q8
Q5
Q6
Q7
(a) Questionnaire reply for pairwise comparison
(b) Pairwise comparison value
ScaleLeft color gives
much greaterwarning.
Left color givessomewhat greater
warning.
Left and rightcolors give similardegree of warning.
Right color givessomewhat greater
warning.
Right color givesmuch greater
warning.
Score 5 3 1 1/3 1/5 (c) Matrix of pairwise comparisons Warning
Color Blue Yellow Orange Red Geometric mean Weight vectorBlue 1 1/3 1/5 3 0.67 0.12
Yellow 3 1 1/3 5 1.50 0.27Orange 5 3 1 5 2.94 0.54
Red 1/3 1/5 1/5 1 0.34 0.065.45 1.00Total
In a situation like the driving test, which item do you regard as more important? For Q23 to Q25, mark the relative importance.
Left RightLeft color gives
much greaterwarning.
Left color givessomewhat greater
warning.
Left and rightcolors give similardegree of warning.
Right color givessomewhat greater
warning.
Right color givesmuch greater
warning.
Q24 Feeling of warning Recognizability
Q25 Feeling of urgency Recognizability
Q23 Feeling of warning Feeling of urgency
(d) Questionnaire reply for pairwise comparison (e) Matrix of pairwise comparisons Evaluation criteria
Item Feeling ofwarning
Feeling ofurgency
Recognizability Geometric mean Weight vector
Feeling ofwarning 1 5 1/5 1.00 0.23
Feeling ofurgency 1/5 1 1/5 0.34 0.08
Recognizability 5 5 1 2.92 0.694.27 1.00Total
FIGURE 9 Example of answers to the questionnaire and the scores.
TRB 2007 Annual Meeting CD-ROM Paper revised from original submittal.
Hirasawa et al. 16
To quantify the subjective judgments, the subjects were asked to give one of five responses: Left color gives much greater warning (5 points), Left color gives somewhat greater warning (3 points), Left and right colors give similar degree of warning (1 point), Right color gives somewhat greater warning (1/3 point), Right color gives much greater warning (1/5 point). A geometric mean was calculated as the score for each pair of colors. For example, in comparison between dark blue and yellow, a subject who feels that yellow gives a somewhat greater feeling of warning than dark blue, the value of 1/3 is entered in cell (1, 2) of the matrix, and the reciprocal “3” is entered in cell (2, 1) of the matrix. In this way, each pair of colors has a corresponding value (Fig. 9). For “feeling of warning,” the geometric mean for all pairs that include dark blue (a1) is calculated as follows: 67.035/13/1144
141312111 =×××=×××= xxxxa This is repeated for every color. The weight of each geometric mean is calculated such that the sum of all the geometric means is 1.
The result is the matrix of paired comparisons shown in Fig. 9. Paired comparison was also done according to the evaluation criteria (“feeling of urgency” and “recognizability”) to complete a matrix for each criterion.
Finally, the overall importance is calculated. The importance of each alternative, which is calculated according to each evaluation criterion, is multiplied by the importance of each evaluation criterion. The overall importance under each condition is obtained for each subject, and the mean value of all the subjects is determined as the comprehensive evaluation.
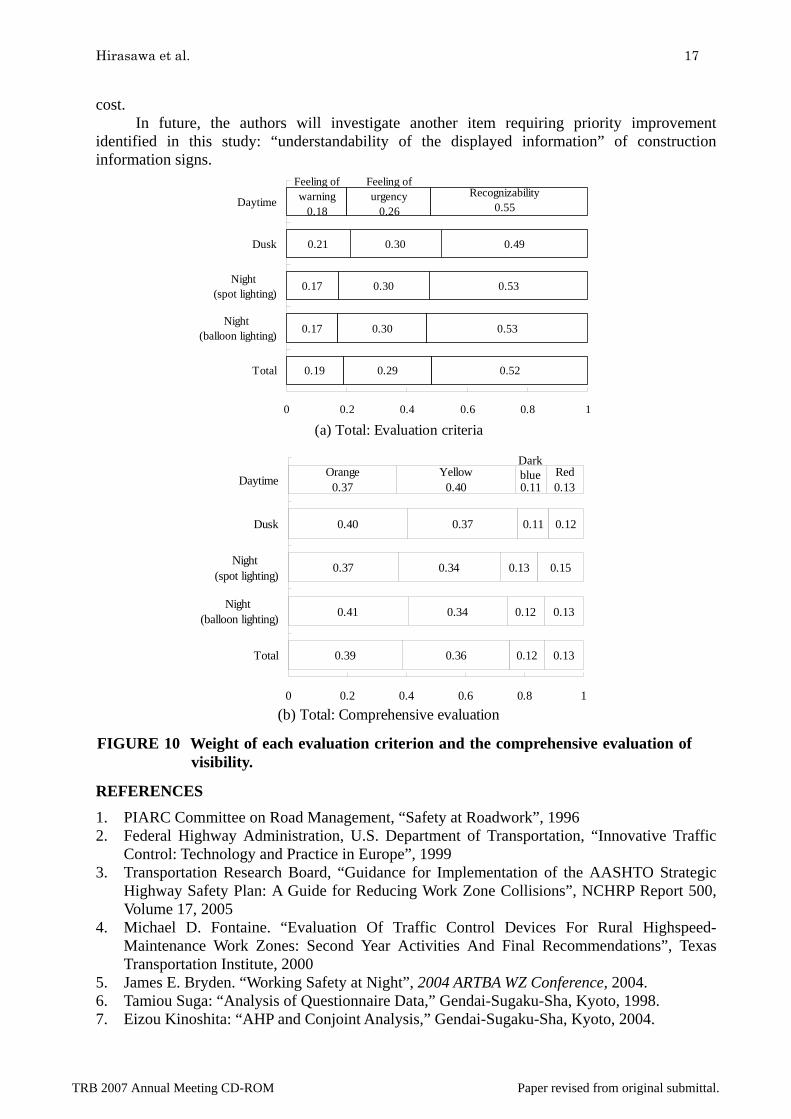
Fig. 10 shows the comprehensive weight of each evaluation criterion for autumn and winter. “Recognizability” has the greatest importance in every time of day, accounting for 50% of the weight for every condition. “Feeling of urgency” and “feeling of warning” are second and third in importance.
Regarding the comprehensive evaluation of visibility in autumn and winter, orange tends to be evaluated as the most recognizable, although yellow is evaluated as slightly more recognizable than orange in daytime. “Red” and “dark blue” are evaluated as having very low visibility. The uniform for traffic control personnel in Japan is usually a combination of dark blue uniform and orange reflective vest. It is possible that traffic safety could be improved by making the uniforms orange or yellow.
CONCLUSIONS Fatal accidents at roadway worksites have drastically decreased in the past ten years in Japan. This is attributed to cooperation between interested parties in analyzing the causes of accidents and to various measures that have been based of such analyses. For the purpose of better preventing accidents, the Ministry of Land, Infrastructure and Transport mandates that regional departments and agencies implement the Ministry’s priority measures every year. With regard to the prevention of traffic accidents at roadway worksites, the Ministry advises: “Analyze the causes of accidents, establish test roadway worksites to determine methods for raising driver awareness of worksites and methods for controlling and stopping vehicles, and determine the conditions necessary for practical application of such methods.”
A survey investigated the satisfaction with traffic safety measures taken at roadway worksites. The results identified “visibility” of the traffic control personnel at night as an item requiring priority improvement. Construction workers and traffic control personnel on the road wear orange vests that are highly visible. The problem seems to be their dark blue uniforms. The recognition evaluation experiments confirm that the distance needed for recognizing traffic control personnel largely depends on uniform color. The results suggest that recognition of the uniform can be improved by changing the color to orange or yellow. Such a change would help to improve the safety of traffic control personnel and can be implemented immediately at low
TRB 2007 Annual Meeting CD-ROM Paper revised from original submittal.
Hirasawa et al. 17
cost. In future, the authors will investigate another item requiring priority improvement
identified in this study: “understandability of the displayed information” of construction information signs.
REFERENCES
1. PIARC Committee on Road Management, “Safety at Roadwork”, 1996 2. Federal Highway Administration, U.S. Department of Transportation, “Innovative Traffic
Control: Technology and Practice in Europe”, 1999 3. Transportation Research Board, “Guidance for Implementation of the AASHTO Strategic
Highway Safety Plan: A Guide for Reducing Work Zone Collisions”, NCHRP Report 500, Volume 17, 2005
4. Michael D. Fontaine. “Evaluation Of Traffic Control Devices For Rural Highspeed-Maintenance Work Zones: Second Year Activities And Final Recommendations”, Texas Transportation Institute, 2000
5. James E. Bryden. “Working Safety at Night”, 2004 ARTBA WZ Conference, 2004. 6. Tamiou Suga: “Analysis of Questionnaire Data,” Gendai-Sugaku-Sha, Kyoto, 1998. 7. Eizou Kinoshita: “AHP and Conjoint Analysis,” Gendai-Sugaku-Sha, Kyoto, 2004.
0.21
0.17
0.17
0.19
0.30
0.30
0.30
0.29
0.49
0.53
0.53
0.52
Feeling ofwarning
0.18
Feeling ofurgency
0.26Recognizability
0.55
0 0.2 0.4 0.6 0.8 1
Daytime
Dusk
Night (spot lighting)
Night (balloon lighting)
Total
(a) Total: Evaluation criteria
0.40
0.37
0.41
0.39
0.37
0.34
0.34
0.36
0.11
0.13
0.12
0.12
0.12
0.15
0.13
0.13
Orange0.37
Yellow0.40 0.11
Red0.13
0 0.2 0.4 0.6 0.8 1
Daytime
Dusk
Night (spot lighting)
Night (balloon lighting)
Total
(b) Total: Comprehensive evaluation
Darkblue
0.40
0.37
0.41
0.39
0.37
0.34
0.34
0.36
0.11
0.13
0.12
0.12
0.12
0.15
0.13
0.13
Orange0.37
Yellow0.40 0.11
Red0.13
0 0.2 0.4 0.6 0.8 1
Daytime
Dusk
Night (spot lighting)
Night (balloon lighting)
Total
(b) Total: Comprehensive evaluation
Darkblue
FIGURE 10 Weight of each evaluation criterion and the comprehensive evaluation of
visibility.
TRB 2007 Annual Meeting CD-ROM Paper revised from original submittal.