Study on impacts on resource efficiency of future EU...
46
mmmll Study on impacts on resource efficiency of future EU demand for bioenergy (ReceBio) Final report
Transcript of Study on impacts on resource efficiency of future EU...

mmmll
Study on impacts on resource efficiency of future EU demand
for bioenergy (ReceBio)
Final report
LEGAL NOTICE
This document has been prepared for the European Commission however it reflects the views only of the authors and the Commission cannot be held responsible for any use which may be made of the information contained therein
More information on the European Union is available on the Internet (httpwwweuropaeu)
Luxembourg Publications Office of the European Union 2016
ISBN 978-92-79-58757-3 doi102779968246
copy European Union 2016
Reproduction is authorised provided the source is acknowledged
Europe Direct is a service to help you find answers
to your questions about the European Union
Freephone number ()
00 800 6 7 8 9 10 11
() The information given is free as are most calls (though some operators phone boxes or hotels may charge you)
CONSORTIUM LEADER Nicklas Forsell International Institute for Applied Systems Analysis (IIASA) Austria E-Mailforselliiasaacat CONSORTIUM MEMBERS International Institute for Applied Systems Analysis (IIASA) Austria Oumlko-Institut eV Germany Indufor Oy Finland Institute for European Environmental Policy (IEEP) United Kingdom European Forest Institute (EFI) Finland AUTHORS IIASA N Forsell A Korosuo P Havliacutek H Valin P Lauri M Gusti G Kindermann M Obersteiner Oumlko-Institut H Boumlttcher K Hennenberg K Huumlnecke K Wiegmann Indufor M Pekkanen P Nuolivirta IEEP C Bowyer S Nanni B Allen J Polaacutekovaacute EFI J Fitzgerald M Lindner
DISCLAIMER This document has been prepared for the European Commission however it reflects the views only of the authors and the Commission cannot be held responsible for any use which may be made of the information contained therein
PROJECT MATERIAL httpeceuropaeuenvironmentintegrationenergystudies_enhtm CITATION OF THE FINAL REPORT Forsell N et al 2016 Study on impacts on resource efficiency of future EU demand for bioenergy (ReceBio) Final report Project ENVF1ETU20130033 Luxembourg Publications Office of the European Union 2016 43 p CITATIONS OF THE TASK REPORTS Task 1 Pekkanen M Bowyer C Forsell N Huumlnecke K Korosuo A Nanni S Nuolivirta P 2014 Study on impacts on resource efficiency of future EU demand for bioenergy Task 1 EU state of play 121 p Task 2 Hennenberg K Boumlttcher H Wiegmann K Forsell N Korosuo A Obersteiner M Bowyer C Nanni S Allen B Polaacutekovaacute J Pekkanen M Fitzgerald J 2014 Study on impacts on resource efficiency of future EU demand for bioenergy Task 2 Analysis of impacts of biomass production on natural resources and the global environment 61 p Task 3 Forsell N Korosuo A Havliacutek P Valin H Lauri P Gusti M Kindermann G Obersteiner M 2016 Study on impacts on resource efficiency of future EU demand for bioenergy Task 3 Modelling of impacts of an increased EU bioenergy demand on biomass production use and prices 109 p Task 4 Boumlttcher H Hennenberg K Forsell N 2016 Study on impacts on resource efficiency of future EU demand for bioenergy Task 4 Resource efficiency implications of the scenarios 77 p Task 5 Fitzgerald J Bowyer C Nanni S Forsell N Korosuo A Lindner M 2016 Study on impacts on resource efficiency of future EU demand for bioenergy Task 5 Case studies 50 p
CONTENTS
EXECUTIVE SUMMARY 5
Biomass use for material and energy production 5
Sustainability assessment 7
Case studies 8
Conclusions 8
INTRODUCTION 10
MODELLING APPROACH AND FRAMING OF THE STUDY 12
ASSESSING ENVIRONMENTAL IMPACTS - METHODOLOGY 15
THE BASELINE SCENARIO ndash A STARTING POINT FOR ASSESSMENT 17
Key results and trends in the Baseline scenario 18
Changes in wood flows and the use of bioenergy feedstocks 18
Harvest rate and forestry production 20
KEY RESULTS FOR SCENARIOS WITH VARYING EU BIOENERGY DEMAND 21
Key results and trends ndash understanding different patterns of bioenergy demand21
Harvest rate and forestry production 22
The changing profile of biomass feedstocks use 25
LAND USE CHANGE AND ENVIRONMENTAL CONSEQUENCES 28
Land use change 28
Biodiversity 29
GHG emissions 31
CONSEQUENCES OF ENVIRONMENTAL CONSTRAINTS ON BIOMASS SUPPLY 33
Implications for production of biomass in EU 33
Implications for trade of biomass 34
Implications for land use in EU and in the RoW 35
Implications for GHG emissions from the land use sector 36
Implications of combined constraints for biomass resources efficiency 38
RESOURCE AND POLICY ANALYSIS FOR SELECTED CASE STUDY COUNTRIES 40
LIMITATIONS AND VALUE ADDED OF THE ASSESSMENT 42
CONCLUSIONS 43
Study on Impacts on Resource Efficiency of Future Demand for Bioenergy ndash Final Report 5
EXECUTIVE SUMMARY
This project was commissioned to examine the resource efficiency implications of increased EU use of bioenergy for electricity and heat until 2050 Methods of analysis include an extensive literature and statistical review detailed GLOBIOM modelling of cross-sectorial wood biomass production and use and in-depth analysis of the implications on a multitude of sustainability indicators The results for biomass use for material and energy are reported for EU28 while the sustainability indicators are assessed both for the EU and globally In addition country specific assessments were carried out for three case countries (Finland Germany and Italy) to examine the results against country-specific policies and resources
The detailed results of the project are published as five separate task reports that can be found at httpeceuropaeuenvironmentintegrationenergystudies_enhtm Biomass use for material and energy production
To analyse the implications of increasing bioenergy consumption five prospective scenarios were constructed and analysed within the project The Baseline scenario was specified as close as possible to that of the EU Reference Scenario 2013 published by the Commission The Baseline scenario depicts the development of biomass use under bioenergy policies that aim at a 20 reduction of greenhouse gas (GHG) emissions in the EU28 by 2020 whereas the EU proposed climate-energy targets for 2030 are not considered The results show that increased demand for bioenergy will already by 2030 lead to a considerable increase in the EU domestic production of woody biomass (an increase by as much as 10 by 2030 in comparison to 2010 levels) and increased EU reliance on imported biomass feedstock in particular import of wood pellets (an increase by 90 by 2030 in comparison to 2010 levels) From 2030 to 2050 the EU domestic production of biomass stabilizes as a result of slower development of EU bioenergy demand The largest changes in the EU28 production of biomass feedstocks for bioenergy are seen in the development of short rotation coppice (SRC) which together with EU import of wood pellets are foreseen to increase considerably in the future In addition the project results show clear intensification in the use of EU forests as well as an increase in the EU net import of roundwood The increase in EU forest harvest is both driven by the increasing demand for bioenergy and the foreseen increasing demand of woody materials Another important source of bioenergy feedstock are by-products of wood-processing industries half of the total biomass for heat and power production in 2010 was retrieved from industrial by-products of wood material industries (sawdust wood chips bark and black liquor) The high share of by-products as bioenergy feedstocks is foreseen to remain also in the future This development highlights the future importance of sawmills as a provider of by-products both for the bioenergy and material sector through the downstream wood flows
The four other policy scenarios each focus on a particular issue in bioenergy demand and trade of biomass The development seen in the Baseline scenario is found to be accentuated in the EU Emission Reduction scenario which builds on the policy target of decreasing the GHG emissions by 80 by 2050 in the EU In this scenario the development of biomass use follows that of the Baseline scenario until 2030 Thereafter the results show a considerable increase in the EU import of wood pellets and domestic production of SRC The increasing production of SRC in the EU after 2030 is seen to lead to some reductions in cropland and grazing land areas as compared to the Baseline scenario which in turn affect food and feed production Additionally we see also large quantities of roundwood directly used for bioenergy production in small and large-scale conversion facilities especially by 2050 In other words the bioenergy demand increases to an extent where stemwood that is of industrial roundwood quality and could be used for material purposes by the forest-based sector is instead being used directly for energy production The increased use of biomass for energy has a direct impact on forest harvests which are almost 9 higher than in the Baseline results in 2050
Study on Impacts on Resource Efficiency of Future Demand for Bioenergy ndash Final Report 6
Constant EU Bioenergy Demand scenario investigates the effects of policies that increase the EU bioenergy demand similarly until 2020 but stay constant thereafter There are only small differences between this scenario and the Baseline on the overall aggregate material production sector However compared to the Baseline scenario there is more particleboard production and less sawnwood production in this scenario driven by decreased demand for industrial by-products from sawmills (wood chips and sawdust) for bioenergy production A clear difference is also seen in the composition of feedstocks used for energy production Most importantly the sourcing of domestically produced SRC and import of pellets is smaller than in the Baseline scenario Pellet imports increase until 2020 but remain almost constant thereafter
The third policy scenario Increased Rest of the World (RoW) Bioenergy Demand scenario investigates a future increase in the bioenergy demand in the RoW together with an increase in the EU as in the EU Emission Reduction scenario Most importantly countries outside of EU are more reliant on their own biomass sources to fulfil their own increasing bioenergy demand Consequently this scenario depicts a situation where EU may not be able to import as much of the biomass feedstocks as in the previous scenarios Indeed the results show that with an increased RoW bioenergy demand net EU imports of wood pellets are 25 lower than in the EU Emission Reduction scenario in 2050 In addition also EU roundwood imports decrease by more than 20 in 2050 This requires EU to source more biomass from domestic SRC production in this scenario the production of SRC in the EU28 is the highest of all scenarios Material production levels stay at almost the same level as in the EU Emission Reduction scenario However as EU roundwood imports decrease the domestic EU forest harvest level increases slightly more than in the EU Emission reduction scenario
The fourth scenario Increased EU Biomass Import scenario investigates the impact of increasing EU reliance on imported biomass resources and domestic production triggered by decreased trade costs Consequently EU net import of roundwood grows 22 more by 2050 compared to the EU Emission Reduction scenario and EU net import of wood pellets grows to more than four times the amount foreseen in the EU Emission Reduction scenario Here Latin America and South-East Asia grow into important pellet suppliers alongside with Canada and the former Soviet Union Following the increased dependency of imported feedstocks for bioenergy domestic harvests in the EU will only increase modestly over time in this scenario The harvest level in 2050 is 11 lower than in the EU Emission Reduction scenario and 37 lower than in the Baseline scenario The decreased competition for woody biomass feedstocks also leads to a slight increase in the EU material production level (especially particleboard and chemical pulp production)
In addition to the analysis of the various scenarios the effects of the variation of central modelling assumptions were assessed based on the EU Emission Reduction scenario In particular th sensitivity analysis highlighted the substitution potential between domestic SRC production and pellets import In other words it is expected that if the increase in SRC production does not materialize as expected in the EU Emission Reduction scenario then a large share of the resulting gap of feedstock needed for energy purposes will be fulfilled by pellet imports and vice versa At the same time it was seen that in the scenarios with increasing bioenergy demand the cascading and multiple use of wood through the value chains of the forest-based industries and bioenergy sector will increase from 2010 until 2030 but decrease afterwards The decrease in the cascading use of wood after 2030 results mainly from the large quantities of roundwood directly used for bioenergy production as seen in the Emission Reduction scenario After 2030 demand for woody biomass in the bioenergy sector is projected to increase more than the intensification in the use of industrial by-products for material and energy purposes Two potential policies for increase the cascading use of wood were evaluated The analysis shows that an increasing use of recycled wood for material production has the additional benefit of decreasing the production of SRC in the EU28 as well as EU imports of wood pellets from RoW (see Box 3 for further information concerning the analysis) On the other hand while an economic disincentive for the direct energy use of virgin wood would increase the cascading use of wood it would also
Study on Impacts on Resource Efficiency of Future Demand for Bioenergy ndash Final Report 7
lead to an increasing amount of land dedicated to the production of SRC within the EU28 and an increasing import of pellets from the RoW
Sustainability assessment
Sustainability implications of the scenarios were assessed using two approaches comparing direct impacts of the policies on a number of environmental indicators across the scenarios and through introducing constraints into the model that aim at reducing specific environmental impacts
When comparing Baseline and policy scenarios for EU28 the chosen indicators for assessing environmental impacts related to biodiversity GHG and land use tend to be affected the most In general for most environmental aspects deviations from the Baseline scenario are of similar percentage change or smaller for the RoW compared to impacts on EU28 except for the scenario simulating an increased demand for bioenergy in RoW
Land use in the Baseline scenario in EU28 is characterized by an increase of cropland (including SRC) and total forest area at the expense of other natural land (abandoned cropland unused grassland etc) Also for the land use pattern in the RoW a clear increase of cropland and a decrease of other natural land can be observed Outside EU28 the grazing land area increases while the area of unused forest decreases The reasons for the loss differ and can either be the conversion to used forests as well as conversion to cropland or grazing land The dynamics of forest area change differ for world regions The conversion of forest in certain regions of the world is contrasted by the expansion of forest area through afforestation in other parts of the world
Compared to the Baseline scenario the Constant EU bioenergy demand scenario leads to a lower amount of cropland area and higher amounts of other natural land in EU28 which is related to a considerably reduced area of SRC The area of grazing land is also slightly higher as compared to the Baseline scenario While the total forest area does not differ between the two scenarios too much there are comparably large shifts within the forest from used forest to unused As expected the land use patterns in the Increased RoW bioenergy demand scenario differ most from the Baseline scenario when looking outside EU28 especially in 2050 Changes in the other three policy scenarios seem to be almost not significant in this comparison The impacts are related to the conversion of more unused forest to used forest and conversion of other natural land to cropland which is directly related to an increase in the bioenergy demand in RoW
In order to limit the most significant environmental impacts specific constraints are imposed on key indicators Forest area available for wood production can be used as a proxy for the intensity of forest management If forests in EU are protected from further intensification (ie through constrained conversion of forests available for wood production) an increased production of SRC can be observed globally (comparably less SRC develops if constraints are put on the conversion of other natural land in EU) In addition there is a significant intensification of forest management in forests of the RoW associated with such a constraint This area is slightly exceeding the area being excluded by the constraint in EU28 so globally in total more forest area is converted if the constraint is applied to EU forests
The development of areas of high biodiversity value (HBV) is a key indicator for assessing impacts on biodiversity The conversion of these areas is very likely related to a loss of biodiversity Already in the Baseline scenario in many regions of the world a significant conversion of areas of HBV (including forest grazing land cropland and other natural land) is likely to occur until 2050 Impacts of the policy scenarios on HBV land in the EU28 are comparably low due to the fact that only small areas fall into the category of high biodiversity value From a global perspective the conversion of HBV land is more relevant as the relative share of land classified as HBV is larger Unused forests form the largest share followed by other natural land and grazing land
Study on Impacts on Resource Efficiency of Future Demand for Bioenergy ndash Final Report 8
If land of HBV is protected from being converted in the model more pressure for biomass production can be observed for the areas that are not protected associated with more land conversion Constraining the conversion of land with high biodiversity value worldwide has implications for biomass production in EU28 leading to more domestic wood harvest (used for the production of Harvested Wood Products (HWP) to be exported to the RoW) and decreased EU net-imports of sawlogs pulpwood and wood pellets in 2050
The Baseline scenario describes overall net GHG emissions from LULUCF as a relatively stable net sink in the EU The forest sink however is projected to decline in the EU This is compensated by a decrease in deforestation emissions and an increase in afforestation removals The decrease of the forest sink is found to be even stronger in the two policy scenarios with increased domestic biomass production which is in-line with other reports and scientific publications The effects on afforestation GHG removals between policy scenarios are comparatively small The scenarios are also affecting non-CO2 emissions Looking at total net LULUCF and Agriculture sector emissions it is striking that compared to the Baseline all scenarios reduce net emissions from LULUCF in the EU Agriculture emissions are higher for the Constant EU bioenergy scenario but fully compensated by LULUCF CO2 emission reductions Looking at RoW the net LULUCF and Agriculture emissions are projected to increase in the Increased RoW bioenergy demand scenario but also the EU emissions reduction scenario This implies that some emissions are ldquoexportedrdquo from EU to RoW when mitigation measures are applied within the EU
When adding restrictions on resource use to the scenarios discussed above all scenarios with constraints result in global net land use GHG emission reductions compared to the EU Emission reduction scenario This means that there are clear synergies between protecting biodiversity avoiding the intensification of unused forests the conversion of other natural land and global net GHG emissions from the land use sector However the effects are different for EU and RoW as reduced production in EU is pushed abroad
Case studies
Three case study countries Finland Germany and Italy were analysed in more detail in terms of their current and projected biomass use and availability as well as their existing national policies affecting the use of biomass resources The three case study countries were found to vary considerably with respect to the resource availability existing wood-based industries and the scope of the use of biomass for material and energy purposes In terms of future development in the Baseline scenario intensification of forest use was seen especially in Finland while the development of SRC was prominent in Germany and Italy In addition especially Finland and Italy were seen to increase their wood biomass imports in the future Overall the case study analysis supported the modelling approach finding the projected biomass use over time to 2050 to be plausible with regards to the current resources and policies in place
Conclusions
This project examined the resource efficiency implications of increased EU use of bioenergy for electricity and heat until 2050 The chosen approach of integrating the modelling of trade biomass harvest material production and competition for biomass resources between sectors was found essential in examining the complex question of resource efficiency of increased bioenergy demand within the EU and globally
The results show that increased bioenergy demand leads to a stronger pressure on the forests in the EU ie higher harvest levels and more intensive use of forests throughout the EU In addition the results show that high future bioenergy demand levels are likely to lead to increased EU biomass imports especially wood pellets High bioenergy demand levels are also seen to counteract cascading use of wood and even lead to increased combustion of roundwood to energy While on the aggregate level it is seen that the total
Study on Impacts on Resource Efficiency of Future Demand for Bioenergy ndash Final Report 9
production of wood for material use is not largely impacted by increasing bioenergy consumption there are large sectorial differences Some material-producing industries (esp sawmill industries) are projected to increase their profitability driven by increased demand for their by-products to be used to energy some industries will face increased competition for feedstocks (esp particleboard production) The project also shows that without the additional biomass produced from fast-growing plantations such as short rotation coppice the pressure to use roundwood directly for energy and EU biomass imports will heavily increase
The modelling results point to significant implications for land use and GHG emissions especially in scenarios assuming high imports or strong development of the bioenergy sector in RoW If constraints of land conversion are introduced into the model important synergies between biodiversity protection and GHG mitigation can be identified
Study on Impacts on Resource Efficiency of Future Demand for Bioenergy ndash Final Report 10
INTRODUCTION
In the European Union biomass use for electricity and heat production is expanding This is happening within a context of increased use of renewable energy intended to reduce greenhouse gas emissions and increase energy security In general the impact of increased bioenergy use on resources and on other biomass-using sectors is not sufficiently well understood The ReceBio study therefore seeks to develop understanding of the various interactions and impacts that can arise as a result of different levels of EU demand in bioenergy and their implications for resource efficiency
The aim of the ldquoResource efficiency impacts of future EU bioenergy demandrdquo (ReceBio) project is to help better understand the potential interactions and impacts resulting from increased EU demand for bioenergy and specifically the implications for resource efficiency To achieve this the study as a whole builds on the best available data and understanding of biomass resource at present and models projected use of biomass for energy and materials up to 2050 The intention is to understand the consequences on resource efficiency and the environment of pursuing different bioenergy pathways To this end analysis has been undertaken to understand the consequences of fulfilling different levels of bioenergy demand up to 2050 and the impacts on the utilisation of different biomass feedstocks land use land management GHG emission and biodiversity consequences The starting point for the study is the EU 2020 climate and energy targets and the proposed EU 2030 package In this context the scenarios and the basis for determining the level of bioenergy demand to be assessed up to 2050 are specified building on the lsquoEU Reference Scenariorsquo1 as described in the 2014 EU Impact Assessment2 (hereafter ldquo2014 IA reportrdquo) The project team has conducted detailed analysis of the availability of biomass resources and current use of biomass in the EU In parallel a detailed assessment of literature reviewing the impacts of biomass use on natural resources and the global environment has been made The outputs of these assessments provided key inputs to the model-based assessment of the implications of biomass resource use
The starting point for the analysis under ReceBio is the EU 2020 climate and energy targets and the proposed EU 2030 package In this context the baseline and GHG emission reduction scenarios are based on the EU Reference Scenario used in the 2014 EU Impact Assessment The analysis focuses on biomass use for heat and electricity hence excluding biofuels3
The study has used The Global Biosphere Management Model GLOBIOM4 to assess the potential impacts of policy scenarios that each addresses issues of key importance as to the future bioenergy demand The project has built up the analysis in a number of steps including
bull an assessment of the state of play and availability of biomass for energy in the EU to understand trends and use patterns (task 1)
bull a review of literature relating to the impact of bioenergy on the environment to understand critical issues and potential indicators (task 2)
bull modelling of policy scenarios and supporting analysis of model assumptions to assess the consequences in terms of feedstocks use and competition between their uses land use and land management of different bioenergy use patterns (task 3)
bull assessment of the impacts of these patterns against key environmental parameters (task 4)
1 European Commission EU Energy transport and GHG emissions trends to 2050 Reference scenario 2013 (2013) 2 European Commission Impact Assessment Accompanying the Communication A policy framework for climate and energy in the period from 2020 up to 2030 (2014) httpeceuropaeusmart-regulationimpactia_carried_outdocsia_2014swd_2014_0015_enpdf - see p 24 for details of reference scenario and p 62 for details of biomass for energy purposes 3 The consideration of changes in biofuel demand is outside the scope of ReceBio and as such has not been specifically analysed within the study However feedstock used for the production of biofuels for the transport sector is included in the model in accordance to the levels stemming from the relevant scenarios of the 2014 IA Report 4 httpwwwglobiomorg
Study on Impacts on Resource Efficiency of Future Demand for Bioenergy ndash Final Report 11
bull analysis of three country case examples to understand the emerging trends in policy and use of biomass and how these compare with model outputs (task 5)
This final report gives an overview of the scenario modelling results and topics that have been produced and analysed during the project Reports for each Task are published as individual reports and can be found at httpeceuropaeuenvironmentintegrationenergystudies_enhtm
Study on Impacts on Resource Efficiency of Future Demand for Bioenergy ndash Final Report 12
MODELLING APPROACH AND FRAMING OF THE STUDY
GLOBIOM is a global model of the forest and agricultural sectors where the supply side of the model is built-up from the bottom (land cover land use management systems) to the top (productionmarkets) The GLOBIOM model has a long history of publication5 and has previously been used in several European assessments6 The model computes market equilibrium for agricultural and forest products by allocating land use among production activities to maximise the sum of producer and consumer surplus subject to resource technological and policy constraints The level of production in a given area is determined by the agricultural or forestry productivity in that area (dependent on suitability and management) by market prices (reflecting the level of supply and demand) and by the conditions and cost associated to conversion of the land to expansion of the production and when relevant to international market access Trade flows are computed endogenously in GLOBIOM following a spatial equilibrium approach so that bilateral trade flows between individual regions can be traced for the whole range of the traded commodities For further information concerning the biomass feedstock and end use categories as considered within the GLOBIOM model see Box 1
The following modelling features are reflected in the GLOBIOM integrated framework used for this particular project
bull As the focus of the project is to assess the potential impact of increasing bioenergy demand the project makes no attempt to estimate future bioenergy demand levels and all bioenergy demand projections are exogenously defined They stem from PRIMES and POLES modelling results developed for previous Commission work GLOBIOM uses these bioenergy demand projections as exogenous inputs they always have to be fulfilled even if it reduces the availability of biomass resources for other purposes
bull The PRIMES estimates of bioenergy demand related to the use of wood from forests SRC and industrial by-products is within the ReceBio modelling expressed as a single total demand (and not as feedstock specific demands) Where technically feasible full substitution between the use of wood SRC and forest based industrial by-products is considered While this demand must be fulfilled the model decides based on the assumptions applied concerning costs and potentials which feedstocks are the most appropriate to be used to fulfil the overall bioenergy As a result further disaggregation regarding the sources feedstocks and land use impacts is possible as compared to previous work
bull There is no feedback from price signals of feedstocks upon total bioenergy demand ie increases in bioenergy use may well push up prices for feedstocks however this will not feedback to reduce demand for bioenergy (over other energy technologies) The demand of food and feed commodities is on the other hand price elastic and therefore changes depending on consumersrsquo willingness to pay Indeed in this exercise we are interested in the consequences of delivering a given bioenergy level and this is therefore fixed at a certain level for each scenario
bull During the modelling change in GHG emissions and removals due to increased or reduced biomass demand linked to land use and land use change (LULUCF) is not accounted for in the efforts needed for reaching an overall EU GHG emission reduction target for each scenario Therefore increasing or decreasing forest carbon stocks in relation to the forest management levels are not reflected back to the bioenergy demand however GHG consequences are analysed as outputs of the study
5 See Havliacutek P Valin H Herrero M Obersteiner M Schmid E Rufino MC Mosnier A Thornton PK Boumlttcher H Conant RT Frank S Fritz S Fuss S Kraxner F Notenbaert A 2014 Climate change mitigation through livestock system transitions Proc Natl Acad Sci 111 3709ndash3714 6 See EC (2013) EU Energy Transport and GHG Emissions Trends to 2050 Reference Scenario 2013 European Commission Directorate-General for Energy DG Climate Action and DG Mobility and Transport Brussels p 168 and EC (2014) A policy framework for climate and energy in the period from 2020 to 2030 Communication from the Commission to the European Parliament the Council the European Economic and Social Committee and the Committee of the Regions European Commission Brussels p 18
Study on Impacts on Resource Efficiency of Future Demand for Bioenergy ndash Final Report 13
bull The starting year of the assessment is that of the year 2000 and the potential impact of bioenergy demand is being assessed until 2050 Bioenergy demand and model outcome are presented on a ten-year basis
The results of the scenarios are analysed in terms of feedstocks use and competition between their uses focusing on the observed results for the time period from 2010 to 2030 and further to 2050 The main interest is on the wood biomass used for heat and electricity production and the competition between the material and energy use of wood within the EU More specifically the results assess changes and impacts on
bull EU land use development
bull Forest harvest levels within the EU
bull Development of short rotation coppices for energy production in the EU
bull Use of wood biomass for material and energy production and production of semi-finished forest products (sawnwood plywood fiber- and particleboards wood pulp)
Study on Impacts on Resource Efficiency of Future Demand for Bioenergy ndash Final Report 14
Box 1 ndash Introduction to the feedstock and end use categories used within ReceBio
This box gives a short description of the central feedstocks and end use categories considered in the project This is not an exhaustive list of the biomass types considered within the project but instead gives an overview of the main categories where central project results are reflected
Forest based industries ndash the project covers production of chemical and mechanical pulp sawnwood plywood fibre- and particleboard (both referred to as particleboard) and wood pellets The initial production of commodities within GLOBIOM is based on the production quantities in the year 2000 as of FAOSTAT In terms of the representation of the paper industrial sector the GLOBIOM model stops at the representation of the production and consumption of chemical and mechanical pulp The full variety of paper grades are as such not represented or individually analysed within this study
Firewood ndash wood used as fuel for cooking heating and power production in a non-industrial scale (as household fuelwood) This type of wood use for energy is a large driver for forest harvests within the EU as well as globally However the statistics are highly uncertain In this project FAOSTAT estimates of firewood within the EU were refined using data from national statistics and Joint Wood Energy Enquiry (JWEE) For rest of the world FAOSTAT statistics were used
Roundwood for energy ndash in this project we differentiate direct combustion of industrial-quality roundwood from firewood Roundwood for energy is defined in this project as roundwood of sufficient quality and dimension to be used for material production but is instead used directly for energy production in small or large conversion facilities In GLOBIOM direct competition is modelled between roundwood used for energy and material production (mostly for pulp and particleboard production) Initially (as of 2010) it is assumed that no roundwood is being used directly for energy in EU28
Wood pellets - Wood pellets are refined wood fuels that are mostly made of industrial by-products such as wood chips sawdust andor shavings In the ReceBio project wood pellets produced within the EU are included within industrial residues EU imports of wood pellets however are differentiated as a separate feedstock to facilitate trade analysis EU trade of wood pellets as of 2010 is based on EUROSTAT and Indufor data
Industrial by-products ndash By-products and residues of the mechanical wood-processing industry including chips sawdust shavings trimmings and bark They are an important raw materials for pulp panel and pellet production and used also as such for bioenergy
Recycled wood ndash all kinds of wood material which at the end of its life cycle is made available for re-use or recycling Re-use can be either for material purposes or energy production This group mainly includes used packaging materials wood from demolition projects and unused or scrap building wood The availability and consumption estimates for 2010 are based on collected data from JWEE EPF COST 31 Wood Recyclersrsquo Association UK BAV Germany and Indufor data
Short rotation coppice (SRC) ndash tree plantations (mostly poplar and willow) established and managed under an intensive short rotation regime on agricultural land In ReceBio the land availability for SRC and other ligno-cellulosic biomass (miscanthus reed canary grass) is based on CORINEPELCOM (2000) land cover estimates and the same as in the 2014 IA report
Harvests ndash in the ReceBio project harvests refer to removal of biomass from forests or SRC
Forest residues ndash leftover branches stumps and stem tops from logging operations that can be used for bioenergy In this project the estimated levels for forest residue harvests are based on a compilation of national statistics and JWEE reporting
Study on Impacts on Resource Efficiency of Future Demand for Bioenergy ndash Final Report 15
ASSESSING ENVIRONMENTAL IMPACTS - METHODOLOGY
In earlier tasks of the project a list of potential indicators had been defined that can be used to assess environmental impacts of increased biomass use Selected indicators related to GHG emissions and removals potential environmental impacts on biodiversity soil and water were translated into GLOBIOM model variables The indicators are used to assess model output and to detect potential impacts of changes in biomass use between different scenarios in EU28 and Rest of the World (RoW) The changes in scenario assumptions are expected to affect indicators differently For further information concerning methodology used for the assessing the impact of environmental constraints see Box 8
The main indicators for assessing environmental impacts of biomass use in EU28 in different policy scenarios are derived from the following model output variables
bull Land use (addressing the model variables Forest area including the categories Afforestation Used Forest Unused Forest Area of Deforestation Area of Cropland including the category Short Rotation Coppice Area of Grazing land Area of other natural land) (see Box 2 for further information concerning the various land use categories)
bull Biodiversity (addressing the model variables Unused forest area Unused forest converted to other land use Land with high biodiversity value (HBV) Forest rotation period
bull Greenhouse Gases (addressing the model variables Emissions from agriculture and livestock Emissions from forest activities and Harvested Wood Products Total net land use emissions) (see Box 7 for further information concerning the emission categories as covered by the assessment)
bull Water and soil (addressing the model variables Water used for agriculture Irrigation area Forest area with steep slopes)
Study on Impacts on Resource Efficiency of Future Demand for Bioenergy ndash Final Report 16
Box 2 ndash Introduction to land use categories used in ReceBio
Within this box some land use categories and their features under the models GLOBIOMG4M are defined These serve as the basis for establishing environmental indicators
Forest - The FAO FRA 20107 definition is used when classifying land as forest Forest that is not protected is considered as potential production forest The model allocates harvests to this area so that the projected demand for wood for material and energy purposes will be satisfied These forests include natural and semi-natural forests as well as forest plantations
Used forest - Forests that are used in a certain period to meet the wood demand are modelled to be managed for woody biomass production This implies a certain rotation time thinning events and final harvest Examples of used forests are - A forest that is actively managed (through thinning or clearcut activities etc) on a regular basis and the wood is collected for subsistence use or to be sold on markets - A forest used on a regular basis for collection of firewood for subsistence use or to be sold on markets - A forest concession or community forest used for collection of wood for export andor domestic markets
Unused forest ndash Forests that currently do not contribute to wood supply (for economic reasons) as determined by the model However these forests may still be a source for collection and production of non-wood goods (eg food wild game ornimental plants)
Area classified as afforestation - Land that has been converted to forest after the year 2000 (the start of the model run) All new forests established through afforestation are considered to be used for wood supply
Agricultural land ndash Includes cropland grazing land short rotation coppice and other natural land
Cropland - Land used for crop production This also includes set-aside areas declared as cropland but not currently used for crop harvesting (eg fallow land) This land category also includes annual and perennial lignocellulosic plants (eg miscanthus and switchgrass) that are increasingly used for biofuel production as well as Short Rotation Coppice
Grazing land ndash Pasture lands used for ruminant grazing It does not include unused natural grasslands
Other natural vegetation or other natural land ndash Other natural land is a residual land use category used in the modelling to represent land that does not fall under the other used land use categories It contains a mixture of herbaceous vegetation abandoned cropland (if not fallow) grassland not being used natural grassland and marginal land However the category does not include settlements wetlands bare and artificial areas
Protected forest areas - Protected forest areas (as defined by WDPA Consortium 2004) are delineated outside from the analysis and no conversion or use is assumed Other conservation initiatives (eg Natura 2000 which are often not reserves but where sustainable management is allowed) and local protection initiatives are not considered within the analysis
Areas of high biodiversity value (HBV) ndash Within the model we consider HBV areas based on the Carbon and Biodiversity Atlas by WCMC8 This atlas presents a set of maps of different biodiversity hot spots In this study we assume that where at least three maps of biodiversity hot spots of species groups (eg birds mammals) overlap land is considered to be of high biodiversity value These areas are then overlaid with the land use information in GLOBIOM HBV areas can be found on cropland grazing land used and unused forests and other natural land
7 FAO 2010 Global Forest Resources Assessment 2010 Main report United Nations Food and Agriculture Organisation Rome p 378 httpwwwfaoorgdocrep013i1757ei1757epdf 8 httpwwwuneporgpdfcarbon_biodiversitypdf
Study on Impacts on Resource Efficiency of Future Demand for Bioenergy ndash Final Report 17
THE BASELINE SCENARIO ndash A STARTING POINT FOR ASSESSMENT
The basis for the baseline scenario examined in ReceBio is lsquoEU Reference Scenariorsquo of the 2014 IA Report The goal of the baseline scenario is to depict a future with continued increasing global population intermediate economic developments including consideration to EUrsquos economic downturn and an overall long term increase of fossil fuel import prices to EU More specifically it is assumed that import prices of fossil fuels will increase by 50 or more in the period of 2010-2030 in line with projections from world energy system modelling exercises Moreover the scenario portrays a future in which consumption patterns of food fibre and fuels continue to evolve over time following current trends
The baseline scenario also considers the same range of policy targets as assumed for the lsquoEU Reference Scenariorsquo It takes into account a broad range of policy commitments currently implemented policies legislations and targets that have been announced by countries and adopted by late spring 2012 Key policies for the EU that are considered include the EU ETS Directive (200929EC) the Renewable Energy Directive (200928EC) Energy Efficiency Directive (200127EU) and GHG Effort Sharing decision (No 4062009EC) From 2020 onwards no changes in policies are assumed and no new policies are considered
Resulting from these policies and as estimated for the lsquoEU Reference Scenariorsquo renewable energy share (RES) in the EU28 would account for a 244 of gross final energy consumption by 2030 and 287 in 2050 Bioenergy plays an important role in this trend and total bioenergy production from biomass and waste increases from 85 Mtoe in 2005 to 124 Mtoe in 2010 150 Mtoe in 2020 date after which bioenergy production increases at a slower pace until 2050 (to 153 Mtoe to 2030 and 164 Mtoe as in 2050)1
The ReceBio Baseline Scenario is based on the same underlying assumptions concerning socio-economic growth statistical data and policy targets as for the lsquoEU Reference Scenariorsquo It assumed the same total bioenergy demand as that for the lsquoEU Reference Scenariorsquo However under the ReceBio Baseline Scenario certain assumptions made in the lsquoEU Reference Scenariorsquo have been further developed to take account of additional information identified and assessed within the project and to enable more effective assessment of bioenergy demand The key differences are set out below
Data concerning wood-based industries as collected in the state of play assessment (Task 1) has been integrated within the modelling framework This allows for more accurate representation of these industries as well as the biomass sources being used for the production of the various woody commodities
Collection and consumption of particular wood biomass resources has also been updated taking into account latest available data as collected with Task 1 In particular firewood (household fuelwood) consumption collecting of forest residues (eg leftover branches stumps and stem tops from logging operations) and recycled wood (eg wood from used packaging material scrap timber from building sites wood from demolition projects) used for production of wood based panels andor energy purposes
International trade of primary woody products namely chips for material use pellets and roundwood has also been updated within the project based on data as available and collected within the framework of the project
Study on Impacts on Resource Efficiency of Future Demand for Bioenergy ndash Final Report 18
Key results and trends in the Baseline scenario
The baseline scenario shows a clear increase in the use of wood up to 2050 for both material and energy purposes in the EU The increased demand for wood biomass is seen to lead to an intensification in the use of forests in the EU28 There is an expansion in the area of used forest in Europe There is also a significant expansion in the use of SRC both in terms of volume consumed and area of land devoted to production These expansions in used forestry and land devoted to SRC lead to a decline in the area of unused forest (most notably leading up to 2050) and a more significant decline in the area of lsquoother natural landrsquo These trends of intensification of land use and land use change are also observed in the rest of the world (outside the EU)
Key results and trends identified in the baseline analysis are set out below
Changes in wood flows and the use of bioenergy feedstocks
The baseline scenario projects a clear increase in the use of wood for both material and energy from the 2010 levels Material use of wood is increasing over time driven by socio-economic development and export of semi-finished wood products The overall consumption of wood for energy is estimated to expand from 306 million m3 in 2010 to 419 million m3 in 2050 This includes black liquor and other industrial by-products used for energy as well as firewood forest residues recycled wood imported wood pellets and SRC produced for energy In terms of the comparative uses of wood the proportion of total wood consumption going to energy use increases between 2010 (36) and 2050 (38) It should be noted however that the consumption level for material use of wood also grows over the same period (from 535 to 686 million m3 some of which will become residues and by-products and be used for energy) although not as sharply as the wood to energy consumption (as indicated by the shift in proportions)
Figure 1 illustrates the flow of wood biomass between the different wood using industries in the EU The figure provides an overview of the flow of wood in the Baseline scenario for the years 2010 2030 and 2050 Analysis of these figures shows clear growth in the forest-based industries producing materials driven by increasing population and GDP development This growth is seen in all material production (sawnwood wood-based panels and pulp production) The increased material production also leads to an increased production of industrial residues and by-products used for energy purposes
The flow charts highlight that a significant amount of wood will be required for meeting the bioenergy demand A large part of this is sourced from SRC which increases from a negligible amount in 2010 to 60 million m3 in 2050 By-products of the material-producing industries are also a notable source of biomass for energy In addition the net-import of wood pellets is expected to increase from 10 Mm3 in 2010 to 23 Mm3 by 2050 USA and Canada are still foreseen as major trading partners for pellets but Latin America the former USSR and South-East Asia are also expected to develop into major players on this front Contrary to other sources of wood biomass for energy the amount of firewood is estimated to decrease within EU28 driven by an expected shift from domestic to district heating (this development is modelled in line with estimates from PRIMES)
Agricultural residues and biogenic waste are an important source of bioenergy The increasing use of these feedstocks for energy purposes is within this project fully in line with that of the 2014 IA report
Study on Impacts on Resource Efficiency of Future Demand for Bioenergy ndash Final Report 19
Figure 1 Flow of wood in the EU in the Baseline scenario in million m3 woodsolid wood equivalent Note that the volumes of particleboard mechanical and chemical pulp and black liquor reflect the amount of wood in the products not the actual material yield
Study on Impacts on Resource Efficiency of Future Demand for Bioenergy ndash Final Report 20
Harvest rate and forestry production
In the baseline scenario the total forest harvest level in EU increases clearly from 556 million m3 in 2010 to 616 million m3 in 2030 and 648 million m3 in 2050 In particular harvests for material production especially sawlogs show a steadily increasing trend and this expanding trend appears to drive overall harvest level Harvests for energy stay on a more stable level until 2030 After 2030 harvest levels for energy actually decrease (from 158 to 143 million m3) The key driver for this decrease is the decreasing use of firewood In addition increasing import of wood pellets and the expansion in SRC for energy purposes replace harvested wood from forests for energy Overall this draws also the total harvest level downwards causing a slightly slower increase of the total harvest level after 2030 than in the prior two decades
As shown in Table 1 the baseline results for 2010 are on the same overall level as the corresponding levels reported by the EUWood study9 and by Indufor10 Discrepancies between the different studies can largely be attributed to uncertaintylack of reliable EU statistics relating to household fuelwood use
Table 1 Comparison of the project results and reference literature on wood consumption in the EU28 divided into material and energy uses
Study EUWood Indufor ReceBio Baseline 2010 2011 2010 2030 2050
Million m3 Total Wood Consumption 825 942 841 1004 1106 Total Material Use 457 649 535 613 686 Wood Products Industry 314 308 367 436 498 Pulp and Paper 341 Pulp 143 162 172 182 Total Energy Use excl SRC 368 293 306 346 359 Wood products industry side streams
150 155 188 216
Wood used primarily for energy
143 151 158 143
Energy Biomass from SRC 0 44 60 Energy use 45 31 36 39 38 Material use 55 69 64 61 62 Note that this table describes the input volumes for wood-using industries This means that some of the wood biomass is counted both within ldquoTotal Material Userdquo and ldquoTotal Energy Userdquo because by-products of the material industries can be used in the production of other materials (pulp andor particleboards) or for energy This is a common way of accounting for wood use found in the literature but partial double-counting makes it impossible to compare these numbers with actual harvest volumes The flowcharts used in this report (eg Figure 4) bypass this problem by showing the actual wood biomass flows through the industries In ReceBio Sawmill and board industries pulp production and recycled wood used for material In ReceBio Sawmill and board industries In ReceBio Sawdust wood chips bark and black liquor used for energy and recycled wood In ReceBio fuelwood forest residues industrial-quality roundwood used directly for energy imported pellets
9 See Mantau et al 2010 Real potential for changes in growth and use of EU forests EUWood final report Project Call for tenders No TREND2491-2008 10 See Indufor 2011 Study on the Wood Raw Material Supply and Demand for the EU Wood-processing Industries Final report European Commission Enterprise and Industry Directorate General
Study on Impacts on Resource Efficiency of Future Demand for Bioenergy ndash Final Report 21
KEY RESULTS FOR SCENARIOS WITH VARYING EU BIOENERGY DEMAND
The baseline selected for this study forms a point of comparison in terms of understanding different evolutions in bioenergy use Within ReceBio in addition to the baseline four scenarios modelling different potential evolutions in the bioenergy demand profiles and trade were set out These scenarios are
bull the EU Emission Reduction scenario ndash that GHG40EE scenario from the 2014 IA Report This scenario delivers 40 GHG emissions reduction in the EU by 2030 as compared to 1990 together with a 264 share of renewable sources in total energy consumption and total energy savings of 293 by 2030 (as compared to 2007 projection for 2030) The scenario also delivers a 2050 GHG emission reduction target of 80 reduction of emissions with respect to the 1990 emission level Further energy savings are estimated to develop in line with the GHG40EE scenario and are -293 in 2030 compared to the 2007 baseline projections leading to lower demand for biomass for energy as of 2030 than that of the ReceBio baseline scenario
bull the Constant Bioenergy Scenario ndash that uses the GHG40EE as a basis but fixes levels of bioenergy demand for the EU at 2020 between 2020 and 2050 ie demonstrating consequences of a stabilised bioenergy demand Bioenergy demand as of 2020 for the Constant Bioenergy Scenarios is lower than that in the baseline scenario for 2020 as a result of the implementation of energy efficiency measures that follow the development of the GHG40EE scenario until 2020
bull the Increased Rest of the World Demand scenario ndash that assumes the GHG40EE pattern of bioenergy demand for the EU plus increased demand for bioenergy in the rest of the world based on the GECO Global Mitigation Scenario11 recently published by the European Commission and
bull the Increased EU Biomass Import Scenario ndash that assumes the GHG40EE levels of bioenergy demand for the EU but an enhanced level of biomass imports modelled through decreased trade costs between the EU and Rest of the World for feedstocks for energy and material use
This section of the final report will primarily focus on the results for the EU Emission Reduction scenario and associated consequences the most important results from other scenarios under ReceBio are also presented here (see Box 4 5 and 6) The full project results are published as five individual task reports and can be retrieved at httpeceuropaeuenvironmentintegrationenergystudies_enhtm It should also be noted that absolute energy consumption from renewable sources in 2030 is slightly lower in the EU Emission Reduction scenario than in the EU Reference Scenario This is due to energy efficiency policies that contribute to reducing overall energy demand in the GHG40EE scenario Total bioenergy demand in the EU follows a similar pattern reaching a level of 166 Mtoe in 2030 under the GHG40EE as compared to 178 Mtoe in the EU Reference Scenario After 2030 however bioenergy demand increases in the GHG40EE scenario at a much higher rate than in the EU Reference Scenario The increase in bioenergy demand after 2030 in the GHG40EE scenario is mainly driven by the imposed 80 GHG reduction target by 2050 with respect to the 1990 emission level
Key results and trends ndash understanding different patterns of bioenergy demand
The development seen in the Baseline scenario is found to be accentuated in the EU Emission Reduction scenario up to 2050 In this scenario the development of biomass use follows a trend to a large extent similar to that of the baseline scenario until 2030 Thereafter the results show a considerable increase in the use of imported pellets (52
11 This scenario depicts a development wherein joint global efforts are taken to reduce GHG emissions beyond 2020 in line with ambitions to keep global warming below 2degC Globally the current use of biomass in the energy sector represents about 50 EJyr which develops in 2050 to more than double in the Baseline Scenario and triples to 150 EJyr in the Global Mitigation Scenario
Study on Impacts on Resource Efficiency of Future Demand for Bioenergy ndash Final Report 22
Mm3 in 2050 double to that in the Baseline) SRC (161 Mm3 in 2050 almost triple compared to Baseline) and additionally we see also large quantities of roundwood (of pulpwood quality and dimensions) directly being used for bioenergy production (78 million m3 in 2050) The increased use of biomass for energy has a direct impact on forest harvests which are more than 700 million m3 in the EU Emission Reduction scenario in 2050 almost a 9 increase when compared to the Baseline results for that year (Figure 2)
Figure 2 The wood flows in the EU28 in 2050 in the baseline and EU Emission Reduction scenarios in Mm3 solid wood equivalent Note that the volumes of particleboard mechanical and chemical pulp and black liquor reflect the amount of wood in the products not the actual material yield
Harvest rate and forestry production
The forest harvests in the EU Emission Reduction scenario increase over time Until 2030 harvest levels are slightly lower than those seen in the baseline associated with the
Study on Impacts on Resource Efficiency of Future Demand for Bioenergy ndash Final Report 23
reduced demand for energy resulting from higher effort in terms of energy efficiency from 2030 onwards harvest levels increase above and beyond the Baseline
Up until 2030 use of wood for material purposes is expected to be the major driver for the increasing forest harvests in the EU (Figure 3) This development has its roots partly in the strong interrelationship between material and energy uses of wood increasing material use of wood also provides more biomass for energy through industrial by-products The increase in material production and associated by-products is almost enough to satisfy the bioenergy demand until 2030 (together with increasing SRC and pellet imports)
Beyond 2030 high bioenergy demand under the Emission Reduction Scenario has a clear impact on the overall forest harvest level After 2030 the increasing harvests of wood for direct energy production is expected to become the main driving force for the increasing forest harvests in the EU This development affects especially the harvest of wood that is of pulpwood-quality and a sufficient dimension to be used for material purposes but that is used directly for energy production Figure 3 highlights the changing patterns of harvest and the associated drivers comparing the results from the Baseline and EU Emission Reduction Scenarios
Figure 3 Forest harvests in the baseline and the EU Emission Reduction scenario The category ldquoHarvests for direct energy userdquo combines harvests of forest residues fuelwood and pulpwood that are used for energy as such or after chipping andor pelletization ldquoHarvests for material userdquo shows the harvested amount of wood that is used for material production in the forest industries and production of other wood products (part of this volume will eventually become industrial residue and be used as energy as well) Total harvests is the aggregate of forest harvests for energy and material use
Study on Impacts on Resource Efficiency of Future Demand for Bioenergy ndash Final Report 24
Box 3 ndash Examining the role of recycled wood and its relationship with forest harvests
Using more recycled wood for material production represents a potential opportunity to increase the resource efficiency of biomass consumption in the EU Potential future amounts of recycled wood are however difficult to model due to data availability Information on current and historical amounts and prices are not fully available or based on rough estimates The level of recycled wood assumed in ReceBio is therefore based on the statistics collected in the Task 1 of the project and assumed to stay constant throughout the projection period
To investigate the impacts of the assumptions made for the level of recycled wood available for material use the EU Emission Reduction scenario was run with varying levels of recycled wood The amounts of recycled wood were increased by 20 40 100 and 200 by year 2050 from the amounts as assumed in the EU Emission Reduction scenario The displacement impacts in material wood use and consequences for energy use of wood are elaborated in Figure 4
The results show that when recycled wood was increased it released industrial by-products from material (left-hand side of Figure 4) which consequently are used for energy purposes and in turn decreased the use of pellets roundwood and SRC for energy (right-hand side of Figure 4) In other words the increasing use of recycled wood for material purposes leads to a decreasing use of pellets roundwood and SRC for energy
Increased wood recycling also increases the use of pulpwood in the material sectors the majority of recycled wood is used for particleboard production and a certain amount of virgin wood is needed in the production process alongside with recycled wood Most of the industrial residues replaced by recycled wood in material production will instead be used for energy production Nevertheless even when increased by 200 the amount of recycled wood for material production is only 3 of the total wood biomass used for material and energy As a result the changes modelled in the level of wood recycling were found not to have a notable impact on the forest harvest levels in the EU
Figure 4 Effect of increasing the amount of recycled wood used for material production on the types of woody biomass used for material and energy in 2050 Positive values represent an increase in the use of the biomass feedstock for material or energy use while negative values represent a decreasing use of biomass feedstock for material or energy use
Study on Impacts on Resource Efficiency of Future Demand for Bioenergy ndash Final Report 25
The changing profile of biomass feedstocks use
Analysis of the Emission Reduction scenario identifies several key trends in terms of the type and origins of biomass being used for energy production This includes the rising use of roundwood (specifically pulpwood) for energy production increasing levels of pellet imports and expanding use of SRC These trends were all originally noted in the baseline but are exacerbated by the increasing bioenergy demand seen to 2050 under the Emission Reduction Scenario When considering the changes in feedstock use we found important to understand better both the nature of the feedstocks being used and what happens if a particular feedstock is not forthcoming as anticipated by the model
The results from the model for both the Baseline Scenario and to an even greater extent under the Emission Reduction Scenario show a highly significant expansion in the EU in the use of SRC towards 2030 and 2050 rising both in volume and in surface area (from 04 in 2010 to 66 million m3 by 2050 and from 10 000 ha in 2010 to 34 million ha in 2050 under the Baseline and to 161 million m3 and 89 million ha in 2050 in the EU Emission Reduction scenario) Rapid development of SRC in both scenarios indicates that satisfying a high demand of biomass for energy will rely increasingly on the development of SRC
Evidence from other studies and from discussions with experts has suggested that SRC is often difficult to gain acceptance of in terms of promoting its expansion There are barriers to farmers establishing SRC which are perhaps not totally reflected in a purely economic model This includes the loss of flexibility in terms of crop rotationresponse to the market and the lack of income over the establishment period of the crop As a consequence the assumptions regarding feedstock availability were investigated further to better understand what would occur in the absence of the SRC expansion (Figure 5) The results show that if SRC would not develop as estimated in the model a majority of the lsquogaprsquo would be taken up by increasing use of roundwood for direct combustion and by imported pellets A similar analysis for other feedstocks also shows the importance of SRC expansion in providing for any lsquogaprsquo in supply were for example forest residues or pellet imports to be restricted (available in the Task 3 report)
Figure 5 The effects of a reduction in one type of feedstock on the use of other wood biomass for energy in 2050 In this analysis the levels of each feedstock category seen in 2050 under the Emission Reduction Scenario were progressively reduced by between 5 and 40 per cent to understand the consequences of reducing a specific feedstock stream and the feedstocks that might plug the lsquogaprsquo in supply generated
Study on Impacts on Resource Efficiency of Future Demand for Bioenergy ndash Final Report 26
Box 4 ndash What is the Impact on Feedstock Use of Increased Imports of Biomass
The increased EU Biomass Import scenario investigated the impact of increasing the EU reliance on imported biomass feedstocks to EU from the Rest of the World The scenario as such assesses how the pressure on domestic production would react to increasing EU reliance on imported biomass In this scenario the trade cost of biomass feedstocks for energy and material purposes was decreased by roughly 12 for the year 2030 and 3212 for 2050 Under the EU Biomass Import Scenario the EU net import of pellets grows to 218 Mm3 in 2050 (more than four times the amount foreseen in the EU Emission Reduction scenario) and the net import of roundwood grows to 71 Mm3 by 2050 (a 22 increase when compared to the EU Emission Reduction scenario)
Recently EU imports of wood pellets from North America especially the USA have increased considerably This development is seen to continue in the ReceBio scenarios but further expansion in pellet demand seen under the EU Biomass Import scenario suggests increasing EU pellet imports also from other parts of the world especially from Canada Latin America and South-East Asia Following the growth of pellets into a major biomass feedstock for energy domestic harvests in the EU will only increase modestly over time in this scenario As a direct effect of the increased pellet imports the EU forest harvest level decreases and is only 624 Mm3 in 2050 an 11 decrease from the EU Emission Reduction scenario and a 37 decrease from the Baseline scenario A further consequence is that the material production level in the EU also grows slightly (especially particleboard and chemical pulp production)
Box 5 ndash What if the bioenergy demand stabilises after 2020
To investigate development where no further action for promoting the development of the bioenergy sector comes into play after 2020 a scenario referred to as the Constant Bioenergy Demand scenario was constructed In this scenario the bioenergy demand in EU28 follows the same trend as the other scenarios until 2020 and stays constant thereafter This implies that the total energy production from biomass and waste for EU28 stays constant after 2020 at the approximate level of 150 Mtoe
As the population and GDP development is still projected to continue under the Constant Scenario as in Baseline the main driver for the consumption of woody products is the same between the scenarios and there are only small differences between this scenario and the Baseline on the material production side There is however a clear difference in the composition of feedstocks used for energy production Most importantly pressure to produce SRC for energy is significantly reduced Meeting bioenergy demand up to 2020 requires an increase in the production of SRC thereafter the bioenergy demand can be increasingly satisfied through other feedstocks As for SRC pellet imports also increase until 2020 but remain almost constant thereafter In this scenario no roundwood of sufficient quality and dimensions to be used for material production is projected to be used directly for bio-energy purposes
The stagnation in the heat and power sector in terms of bioenergy use under Constant Bioenergy Demand scenario results in a higher level of fuelwood used for domestic heating than in the Baseline Overall the harvest level in the EU in 2050 is 15 million m3 (23) lower than in the Baseline When compared to the Baseline scenario under the Constant Bioenergy Demand scenario there is more particleboard production and less sawnwood production This can be explained as follows
bull the demand for industrial by-products from sawmills (chips and sawdust) for bioenergy production is lower reducing sawmill profitability and leading to lower levels of production
bull the drop in bioenergy demand for the chip and sawdust by-products causes prices to drop making particleboard production utilising these feedstocks more profitable
12 The levels were chosen so that they incur a notable change in trade patterns compared to the Baseline scenario while still representing a plausible change in costs
Study on Impacts on Resource Efficiency of Future Demand for Bioenergy ndash Final Report 27
Box 6 ndash The impact of expanding global demand for bioenergy
In the EU Emission Reduction scenario EU imports of both roundwood and wood pellets increase notably From this follows that the availability of imported feedstocks is increasingly dependent also on the demand for biomass outside of the EU The imports may not materialize if countries outside of EU are increasingly reliant on their own biomass sources to fulfil their own increasing bioenergy demand This development was assessed in the Increased Rest of the World (RoW) Bioenergy Demand scenario wherein joint global efforts to reduce GHG emissions beyond 2020 were assumed thereby enhancing the development of the bioenergy sector for the RoW In the EU the bioenergy increase was modelled similarly to the EU Emission Reduction scenario Consequently this scenario depicts a situation where EU may not be able to import as much of the biomass feedstocks as in the other scenarios
The results show that with an increased RoW bioenergy demand net EU import of wood pellets is only 39 million m3 in 2050 25 less than in the EU Emission Reduction scenario In addition also EU roundwood imports decrease by more than 20 This puts more pressure to the development of the SRC sector in the EU in this scenario the production of SRC in the EU28 is the highest of all scenarios at 172 million m3 in 2050 (a 7 increase to the EU Emission Reduction scenario) Material production levels stay at almost the same level as in the EU Emission Reduction scenario However as EU roundwood imports decrease the domestic forest harvest level increases to 718 million m3 in 2050 (14 Mm3 higher than in the EU Emission reduction scenario and 162 Mm3 or 29 higher than in 2010)
There are significant impacts on land use and environmental factors as a consequence of expanding rest of the world demand for bioenergy in combination with that of the EU28 These impacts on land use change and environmental indicators are discussed below and in more detail in the Task 4 report
Study on Impacts on Resource Efficiency of Future Demand for Bioenergy ndash Final Report 28
LAND USE CHANGE AND ENVIRONMENTAL CONSEQUENCES
Land use change
The key changes in land use already under the Baseline scenario are an increase in the area of cropland and used forest in the EU driven to some degree by the increased demand for SRC and increased forest harvest level respectively (Figure 6) Following this development we see a decline in the area of unused forest and most significantly other natural land These trends are seen to be enhanced further under the Emission Reduction scenario with by 2050 higher amount of land being used in the EU for SRC and lower amounts of other cropland and other natural land (including abandoned cropland and grazing land) and grazing land (2030 and 2050) When comparing the Baseline and Emission Reduction Scenario the total forest area (sum of used and unused forest) does not differ significantly however there are comparably large shifts within the forest converting unused forest to used forest
Land use change in the rest of the world ie outside the EU 28 is seen to change under the Baseline Scenario with again other natural land and unused forest being converted into cropland grazing land and used forest (Figure 7) However there is an additional impact in terms of land use change in the rest of the world associated with the EU Emission reduction scenario if only EU increases its bioenergy demand leading to relatively more cropland and SRC area in 2050 and less other natural and unused forests For 2030 similarly to the development in EU28 the reverse effect can be observed due to efficiency increases reducing biomass demand
Figure 6 Land use in EU28 in the Baseline a) and differences in the EU Emission reduction scenario (REDU) between 2010 and 20302050 b)
Study on Impacts on Resource Efficiency of Future Demand for Bioenergy ndash Final Report 29
Figure 7 Land use in RoW in the Baseline a) and differences in the EU Emission reduction scenario (REDU) b)
Biodiversity
Under both the baseline and the EU emission reduction scenario the impacts in the EU28 on land classified as high biodiversity value are comparably low This is due to the fact that less than 1 of the area considered in the model in the EU28 is categorized as area of high biodiversity value according to the global biodiversity data set from IUCN-WCMC Looking at the rest of the world the conversion of land with high biodiversity value is more important because 20 of the global land area considered by the model is highly biodiverse Unused forests form the largest share of the areas impacted followed by other natural land and grazing land It should be noted that as for land use change the Baseline results already show a significant impact on highly biodiverse areas in the rest of the world Under the EU emission reduction scenario these impacts are further increased but rather limited compared to the Baseline
Study on Impacts on Resource Efficiency of Future Demand for Bioenergy ndash Final Report 30
Box 7 ndash Introduction to LULUCF and Agriculture GHG emissions and removal categories used in ReceBio
This box gives a short description of the various GHG categories reported in this project This is not an exclusive list of all the sources and sinks that are accounted for within the project but instead gives an overview of the main categories where central project results are reflected
Afforestation ndash the category includes emissions and removals related to afforestation and accounts for changes in biomass soil and dead organic matter Deforestation ndash the category includes emissions and removals related to deforestation related to changes in biomass soil and dead organic matter Forest Management ndash the category includes emissions and removals related to change in the above and below ground forest carbon stock The change in the forest carbon stock mainly relates to changes in the thinning intensity and choice of forest rotation length HWP ndash the category accounts for emissions and removals related to changes in the Harvested Wood Products (HWP) following the Durban Accords (Decision 2CMP7) and respective Tier 2 IPCC guidelines The pool is initialized in the year 2000 and as such assumed to be in stable state at that time period Net Forestry emissions ndash total net emissions and removals from Afforestation Deforestation Forest Management and HWP LULUCF ndash the category represents the total net emissions and removals from Land use Land use Change and Forestry (LULUCF) In addition to the net forestry emissions the category accounts for emissionsremovals from land use change in terms of biomass stocks and soils and CO2 emissionsremovals from cropland management Soil carbon emissions are reported using a Tier 1 approach based on GHG accounting IPCC guidelines Emissionsremovals from wetlands settlements and other land use are not considered in this project Agriculture ndash the category represents the total net emissions from the agriculture and livestock sectors This includes soil N2O emissions from fertilizer application (mineral and organic) CH4 emissions from rice cultivation N2O and CH4 emissions from the livestock sector (enteric fermentation manure management and manure dropped on pastures) AFOLU ndash the total net of emissions and removals from LULUCF and Agriculture
Study on Impacts on Resource Efficiency of Future Demand for Bioenergy ndash Final Report 31
GHG emissions
Land use change has a number of important associated environmental impacts and consequences Under ReceBio specifically besides biodiversity impacts GHG emission balance implications have been investigated GHG emissions effects primarily stem from changing patterns of forest use patterns of afforestation and deforestation the decline in other natural land and the changes in the use of agricultural land ie cropland and grassland
When considering the GHG emissions there are a number of aspects that were analysed Compared to the Baseline the forest management carbon sink is seen to decline more strongly by 2050 in the EU under the EU Emission reduction scenario (see Figure 8) demonstrating a more intensive use of the forests In 2050 the EU emission reduction scenario shows decreased EU deforestation emissions that are compensating for the loss of the forest sink to a large degree Under the EU Emission reduction scenario sequestration into harvested wood products in 2050 is 6 Mt CO2eq higher compared to the Baseline More products are being produced causing the stock of carbon stored in wood products to increase Under the Baseline there is already a strong increase in afforestation GHG removals over time and comparatively there is only a small effect on afforestation GHG removals in the EU Emission reduction scenario In total compared to the Baseline the EU emission reduction scenario is reducing net annual emissions from LULUCF and Agriculture for the EU28 in 2030 and 2050 (see Figure 9) Agriculture emission reductions are mainly caused by reduced livestock production that is shifted outside EU while demand for livestock products remains more or less unchanged
Under the EU Emission reduction scenario both CO2 and non-CO2 annual GHG emissions increased in the rest of the world in 2050 when compared to the baseline (see Figure 10) This implies that the EU exports emissions to the rest of the world as a consequence of increasing land used for bioenergy in the EU but also reduction of livestock production and increased imports of such products
Figure 8 LULUCF GHG emissions in EU28 in the Baseline a) and differences in the EU Emission reduction scenario (REDU) b) Net LULUCF emissions represent the change in net annual emissions and removals from Land use Land use Change and Forestry
Study on Impacts on Resource Efficiency of Future Demand for Bioenergy ndash Final Report 32
Figure 9 Total annual land use GHG emissions (LULUCF plus agriculture) in EU28 in the Baseline a) and differences in total net annual emissions for the EU Emission reduction scenario (REDU) b)
Figure 10 Total land use GHG emissions in RoW in the Baseline a) and differences in total net annual emissions for the EU Emission reduction scenario (REDU) b)
Study on Impacts on Resource Efficiency of Future Demand for Bioenergy ndash Final Report 33
CONSEQUENCES OF ENVIRONMENTAL CONSTRAINTS ON BIOMASS SUPPLY
The analysis of environmental impacts revealed that a number of indicators show significant changes across scenarios However only a very limited number of indicators can technically be converted into environmental constraints In the following we summarize the performance of three selected indicators across scenarios and their use as environmental constraints
bull Conversion of areas of High Biodiversity Value (HBV) Areas defined worldwide as HBV (all areas where three or more high biodiversity hotspots are overlapping) are excluded from any land conversion above the developments seen in the baseline The initial land use of such areas (in the year 2010) is not allowed to change through land conversion However the land might still contribute to production For example HBV forest area will remain forest and (if actively managed) supply biomass but cannot be converted to cropland The constraint is to be applied globally It has to be noted that only a small amount of areas are classified as HBV within EU28
bull Area of unused EU forest converted to used forest The indicator is a good proxy for assessing changes in the intensity of forest management due to increased biomass demand For the constrained scenario the model will not be allowed to convert unused forest to used forest above the level observed in the Baseline scenario in EU The constraint is applied for each MS within the EU No such constraint is applied for the RoW
bull Conversion of other natural land in EU no conversion of other natural land to any other land use is allowed beyond EU baseline levels One exception from this rule is that the land can be afforested The constraint is applied to EU28
Box 8 ndash Methodology for assessing the impact of environmental constraints of EU biomass resource efficiency
After the assessment of environmental impacts a set of environmental constraints were introduced into the model These constraints are based on key environmental indicators such as Conversion of areas of HBV Area of unused EU forest converted to used forest and Conversion of other natural land in EU These indicators showed significant impacts across the policy scenarios In a second stage the respective model variables are constrained to not exceed a certain threshold (eg no conversion of highly biodiverse grazing land beyond Baseline levels) The result of combination of individual constraints for the EU Emission reduction scenario and analysis where all constraints are combined are implemented and assessed for each of the four policy scenarios Indicators looked at in the constrained scenarios are
- Production of biomass in the EU by biomass type (ie round wood forest and agricultural harvest residues energy crops industrial-by products)
- Import and export of biomass to (and from) EU with breakdown by type and exportimport region
- Land use of the various classes of land being accounted for (forest energy plantations cropland grazing land other natural land)
- Total GHG emissions from the land use sector
Implications for production of biomass in EU
As stated earlier land of HBV is mostly located outside EU Nevertheless there are implications for biomass production for EU28 when a constraint on HBV is implemented Five million m3 more harvest of sawlogs can be observed in EU in 2030 20 Mm3 in 2050 (see Figure 11) in the constrained scenario compared to the unconstrained EU Emission reduction scenario where 272 million m3 and 315 million m3 of sawlogs are harvested respectively At the same time less pulpwood is harvested in EU28
Study on Impacts on Resource Efficiency of Future Demand for Bioenergy ndash Final Report 34
If forests in EU are protected from further intensification (ie prohibiting the conversion of unused forest into used forest) in 2050 both harvests of sawlogs and pulpwood are significantly reduced by in total almost 60 million m3 A relatively large share (about 30) is compensated by the increased production of wood from SRC for pulp and energy production
An opposite effect can be observed if other natural land in EU is protected from conversion There is less SRC biomass production that would be typically established on these lands (abandoned cropland and grazing land) At the same time a small increase in the harvest of pulpwood occurs compensating for the decreasing availability of SRC
Figure 11 Change in biomass production in EU across constrained scenarios compared to the unconstrained EU Emission reduction scenario
Implications for trade of biomass
Changes in EU biomass production that can be observed across the three environmental constraints have diverging implications for biomass trade between EU and RoW
The protection of HBV land mostly affects land use outside EU and leads to decreased EU net-imports of pulp logs sawlogs wood pellets and industrial by-products in 2050 (see Figure 12) At the same time this constraint leads to increasing net-export of sawnwood from EU28 to RoW and a small decrease in the net-import of chemical pulp This increase in export of sawnwood from EU28 is directly related to the reduced availability of biomass sources in regions with high shares of HBV areas which in turn decreases the competitiveness of the forest based industries within these regions
Constraining in EU either land use change from unused forest to used forest or the conversion of other natural land to cropland or grazing land leads to increased EU imports of biomass feedstocks in 2050 This is especially true for wood pellets of which more than 16 million m3 (in the case of protection of unused forest) or 3 million m3 (protection of other natural land) additional imports are expected to the 52 million m3 in the case without the environmental constraint The increase in EU28 wood pellets imports would mostly be met by imports from USA Canada and the former Soviet Union
Study on Impacts on Resource Efficiency of Future Demand for Bioenergy ndash Final Report 35
In terms of trade of semi-finished wood products constraining the conversion in EU of other natural land to cropland or grazing land is noted to have a minor impact on the net trade both in 2030 and 2050 On the other hand constraining EU land use change from unused forest to used forest is found to decrease the net-export of sawnwood and slightly increase the net-import of chemical pulp This is directly related to the decrease in availability of raw biomass sources within EU28 which cannot economically be fully compensated by an increase in import of roundwood
Figure 12 Change in EU net trade across constrained scenarios compared to the EU Emission reduction scenario
Implications for land use in EU and in the RoW
If land of HBV is protected from being converted more pressure on the remaining areas is expected This leads to an increased conversion of unused forest to used forest in the EU ie an intensification of forest management on areas that are not considered of HBV (see Figure 13)
A constraint on the conversion of unused forest in EU prevents an intensification compared to the EU Emission reduction scenario But also other land areas are affected in order to compensate for reduced biomass supply from EU forests EU SRC production expands in 2050 at the expenses of grazing land cropland and other natural land
As expected land use in RoW is mostly affected by the constraint that is targeted at areas outside EU (HBV area constraint see Figure 14) Already in 2030 this leads to a relative reduction of cropland area compared to the EU Emission reduction scenario and increases other natural vegetation but also grazing land Unused forests in RoW are not affected in the constrained scenario of HBV conversion In fact the net balance (only this can be assessed here) shows a reduction of unused forest area in the medium-term (in 2030) A likely cause for this is the fact that the HBV forests that are protected in this scenario are also relatively fertile compared to forests with no HBV If these more fertile forests are protected from conversion there is the need for more conversion of unprotected forest to compensate for the loss of yield
Land use in RoW is also noted to be affected by the constraints that are targeted only at areas inside of EU There is a significant conversion of unused forest to used forest in the RoW that is accompanied with constraining forestry intensification within EU The area affected in RoW (more than 5 Mha) is of a similar size compared to the area prevented from conversion in EU (see Figure 13)
Study on Impacts on Resource Efficiency of Future Demand for Bioenergy ndash Final Report 36
Figure 13 Implication of environmental constraints for EU land use (b) compared against the EU emission reduction scenario (a)
Figure 14 Implication of environmental constraints for RoW land use (b) compared against the EU emission reduction scenario (a)
Implications for GHG emissions from the land use sector
Figure 15 describes changes of net GHG emissions from the land use sector in EU28 aggregated to total LULUCF (CO2) and total agriculture (non-CO2) emissions compared to the EU Emission reduction scenario For the EU changes in net LULUCF emissions dominate changes in net Agricultural emissions across all scenarios and in all years On the global level and in the long-term all environmental constraints that were assessed lead to net global GHG emission reductions In 2050 net land use emissions would relatively be reduced by more than 5 Mt CO2 with a constraint on the conversion of HBV land by more than 25 Mt CO2 with a constraint on unused European forests and by more than 10 Mt CO2 with a constraint on the conversion of other natural
Study on Impacts on Resource Efficiency of Future Demand for Bioenergy ndash Final Report 37
land Figure 16 shows that these relative emission reductions are associated with increases in emissions in RoW in 2050 in the case of a scenario where EU forest management is not intensified (unused forest constraint) The increases in emissions in RoW are though lower than the reduction of emissions in the EU mainly related to an overall global reduction of the harvest of wood Other constraints lead to net GHG emission reduction in RoW This is especially true for constraints on HBV areas where large emission reductions compared to the reference can be observed for agricultural emissions This is due to a reduction in global meat and milk production by 8 Mt of meat and 2 Ml of milk (about 1-2 of total production) As the conversion of HBV areas to the most productive grazing land for cattle is limited prices for meat and milk increase compared to the unconstrained scenario Also more grazing land has to be created to compensate for high productive land not being available Therefore the net balance of land use results in more grazing land under constraints This effect is more pronounced in the RoW than in EU28
In the global sum of net land use emissions all environmental constraints result in emission reductions compared to the EU Emission reduction scenario (sum of Figures above not shown) This means that there are positive trade-offs of constraints to protect biodiversity unused forests and other natural land from conversion regarding global net GHG emissions from the land use sector There are regional differences (here we show only EU28 and RoW) and the effect differs for LULUCF and agriculture emissions
Figure 15 Implication of environmental constraints for EU net land use emissions (b) compared against the EU emission reduction scenario (a)
Study on Impacts on Resource Efficiency of Future Demand for Bioenergy ndash Final Report 38
Figure 16 Implication of environmental constraints for RoW net land use emissions (b) compared against the EU emission reduction scenario (a)
Implications of combined constraints for biomass resources efficiency
The environmental constraints were also assessed in terms of their combined effect for each of the four policy scenarios developed in the ReceBio project (EU Emission Reduction scenario Constant EU Bioenergy Demand scenario Increased Rest of the World Bioenergy Demand scenario Increased EU Biomass Import scenario) For this assessment all the environmental constraints were simultaneously applied (protecting HBV land restricting conversion of unused forest into used forest to Baseline level and restricting other natural land conversion to Baseline level)
As for the single scenarios the combination of the environmental constraints also resulted in reductions of net GHG emissions both in the EU28 and in the Rest of the World Figure 17 presents net land use emissions for EU28 as the difference between constrained and unconstrained policy scenarios For the EU changes in net LULUCF emissions dominate changes in net Agricultural emissions across all scenarios and in all years Net EU forestry emissions in 2050 are reduced in all scenarios between 7 Mt CO2 to almost 40 Mt CO2 if the combined constraints are applied The effect of combined environmental constraints is most prominent for the EU emission reduction and Increased RoW bioenergy demand scenarios where the constraints lead to a reduction in forest management intensity which in turn leads to an increased sink in the existing forests In the rest of the world agriculture emissions are more affected by the environment constraints than in EU (Figure 18) The constraint on HBV area conversion contributes most to this effect by a reduction in agricultural and livestock production and reducing the amount of land available to afforestation While the implications for agriculture GHG emissions of constraints are consistent across all scenarios the effect for LULUCF emissions is less straightforward In all four scenarios the combined constraints decrease net LULUCF emissions for RoW in the short run (2030) and increase them in the long run (2050) but with different intensity ranging in 2050 from 16 Mt for the Increased RoW bioenergy demand scenario to almost 60 Mt in the EU emission reduction scenario
On the global level net land use emissions in all scenarios are reduced when jointly combining the environmental constraints due to large reductions of non-CO2 emissions from the agriculture and livestock sectors This is due to increased prices for livestock products Under HBV constraints only less fertile land is available leading to higher costs of conversion and more grazing land to be created to compensate for relative productivity losses
Study on Impacts on Resource Efficiency of Future Demand for Bioenergy ndash Final Report 39
Figure 17 Differences in EU net land use emissions in constrained policy scenarios compared to unconstrained scenarios
Figure 18 Differences in RoW net land use emissions in constrained policy scenarios compared to unconstrained scenarios
Study on Impacts on Resource Efficiency of Future Demand for Bioenergy ndash Final Report 40
RESOURCE AND POLICY ANALYSIS FOR SELECTED CASE STUDY COUNTRIES
Three case study countries Finland Germany and Italy were analysed in more detail in terms of their current biomass use and availability as well as their existing national policies affecting the use of biomass resources These case study countries represent EU Member States of different climatic zones from Northern Central and Southern parts of Europe and also showcase countries with a different emphasis and intensity in their wood use The aim of the case studies was to acknowledge the heterogeneity of the Member States requiring in-depth analysis of the effects of possible future bioenergy development in different parts of the EU while also exploring the modelling results on a Member State level to highlight issues that are significant for individual countries but maybe not shown on a larger scale analysis For more detailed results of the case study analysis please refer to the Task 5 report
The boreal forests of Finland are mostly privately-owned and managed more intensively than in Germany or Italy However the timber harvest volumes remain lower than in Germany due to lower increment rates There is a well-established pulp and paper industry and sawnwood production is also an important sector in Finland The energy use of woody biomass especially industrial by-products and forest residues is large In Germany a large proportion of the forests are under public ownership The forest increment is the largest of the studied case study countries and Germany has also the highest harvested volume Material production is focused particularly on sawnwood and board production Germany has the largest rate of biomass recovery and recycling among the three case study countries and is at the forefront of recycling also on the European scale In Italy by contrast to the other two case study countries the forests are less actively managed and the forest industry plays a smaller role in the national economy As the domestic harvest volume is relatively low the forest industry in Italy is largely reliant on imported biomass feedstock
With respect to policy in the case study countries those targets included in the EU Renewable Energy Directive (RED) are the main drivers for current renewable energy production and it is in this context that efforts to promote bioenergy are framed These targets are in all cases supported by incentives to promote production of bioenergy and the expansion of bioenergy infrastructure largely for heat or CHP However the nature of the bioenergy use and feedstock production varies Finland is almost exclusively focused on forestry woody biomass use and associated waste and residues while by comparison Italyrsquos focus is around the expansion of agro-forestry short rotation coppice and use of general residues and wastes Germany shows a broader focus reflecting the potential availability of a wider range of feedstocks This difference impacts on the nature of policy support and the consequences of increasing demand for biomass ie increased intensity of forest use compared to expansion in the agro-forestry area
The model results for the Baseline scenario were analysed for the three countries to evaluate developments in land and resource use over time from the period 2010-2050 For Finland the Baseline scenario estimates almost negligible change in land use over time until 2050 However the increase in demand for bioenergy and woody material results in some unused forest being taken into use and the overall land use structure of the country remains dominated by actively managed forests used for wood harvests There is not much change across the timeline in terms of the wood flows except for some small changes in the imports of roundwood There are increases in sawnwood outputs and industrial by-products increased energy demand creates more demand for sawmill by-products and hence makes sawnwood production more profitable On the supply side the most noticeable trend is the doubling of imported wood chip from 22 to 46 Mm3 between 2010 and 2050 Otherwise this already well-evolved wood production market does not change much over the simulated timeline
For Germany the most notable trend is the emergence of short rotation coppice (SRC) as a feedstock over the 2010 to 2030 time horizon A relatively small increase in the harvest and use of wood for material purposes is seen within the country
Study on Impacts on Resource Efficiency of Future Demand for Bioenergy ndash Final Report 41
For Italy as for Germany there is significant expansion in SRC use for energy Within the Italian model outputs there are significant domestic impacts in terms of land use change in Italy ndash most noticeably with conversion of other natural land to forest - and also significant rises in roundwood imports and pellet imports
All in all the three case study countries were found to vary considerably with respect to the resource availability existing wood-based industries and the scope of the use of biomass for material and energy purposes Nevertheless the emergence of an emphasis on the bioeconomy is evident in all three countries which is reflected in the policy analysis and shown also in the model results Overall the case study analysis supported the modelling approach finding the projected biomass use over time to 2050 to be in line with the current resources and policies in place
Study on Impacts on Resource Efficiency of Future Demand for Bioenergy ndash Final Report 42
VALUE ADDED AND LIMITATIONS OF THE ASSESSMENT
In this study we have used an integrated modelling approach The key assets of this study include
bull A cross sectorial approach was used covering the forest agriculture and livestock sectors This made it possible to assess the potential direct implications of increasing bioenergy and also enabled the analysis of indirect and displacement effects
bull A global approach made it possible to assess the implications of a policy focusing on the EU but also having implications for the Rest of the World
bull The study provides an assessment of potential impacts across a multitude of indicators including environmental consequences greenhouse gas emissions impacts land use change harvest of wood as well as the use of biomass and wood across sectors
bull Environmental constraints on biomass supply were applied to assess the cross sectorial benefits of policies focusing on enhancing key environmental indicators
However like for all modeling studies there are limitations for this project and its conclusions These limitations include
bull As always in scenario analysis the study results critically depend on the assumptions and constraints of the modelling framework
bull There are limitations to the data sources available for modelling environmental indicators and the assessment is restricted to only considering a subset of all potential environmental implications of biomass use
bull Some feature are challenging to capture within a modelling framework For instance how land owners and biomass producers react to changes in policies and prices and the institutional and infrastructural barriers to the mobilization of biomass feedstocks
bull There are inevitable uncertainties in projecting the development of new goods new markets new trade routes new technologies and changes in end-consumer consumption patterns These are all aspects where large changes may occur in the future that influence future developments
More specifically to this project which uses an integrated modelling approach a number of limitations should also be considered when interpreting the results of the assessment
bull The scenarios only represent cases where the bioenergy demand for heat electricity and transport is exogenously defined and not sensitive to changes in feedstock prices Interactions between different energy options for reaching policy targets were out of the scope of this study
bull The analysis accounts for the impact of GHG emissions from land use land use change and forestry (LULUCF) However no feedback from LULUCF emissions to policy targets is considered within the study
bull There are limitations to data available for modelling GHG emissions on a global level In particular consistent datasets of forest age structure location of management as well as local forest treatment regimens are challenging to collect
bull The data sources underlying the study for representing land classes vegetation cover and the management of land types carry uncertainties This creates challenges in representing aspects such as ownership structures typical size of an ownership status of protection and local regulations
Study on Impacts on Resource Efficiency of Future Demand for Bioenergy ndash Final Report 43
CONCLUSIONS
This project examined the resource efficiency implications of increased EU use of bioenergy for electricity and heat until 2050 Methods of analysis include an extensive literature and statistical review detailed modelling of wood biomass production and use and in-depth analysis of the implications on a multitude of sustainability indicators In addition three case studies were carried out to examine the results against country-specific policies and resources The chosen approach of integrating trade land use biomass harvest material production food and feed production and competition for biomass resources between sectors was found essential in examining the complex question of resource efficiency of increased bioenergy demand within the EU and globally
The results show that increased bioenergy demand leads to a stronger pressure on the forests in the EU resulting in higher harvest levels and more extensive use of forests throughout the EU In addition the results show that high future bioenergy demand levels are likely to lead to increased EU biomass imports especially wood pellets High bioenergy demand levels are also seen to counteract cascading use of wood and even lead to increased combustion of roundwood to energy While on the aggregate level it is seen that the total production of wood material is not largely impacted by increasing bioenergy consumption there are large sectorial differences Some material-producing industries (esp sawmill industries) are projected to increase their profitability driven by increased demand for their by-products to be used to energy some industries will face increased competition for feedstocks (esp particleboard production) The project also shows that without the additional biomass produced from fast-growing plantations such as short rotation coppice the pressure to use roundwood directly for energy and increase EU biomass imports will heavily increase
HOW TO OBTAIN EU PUBLICATIONS
Free publications
bull one copy
via EU Bookshop (httpbookshopeuropaeu)
bull more than one copy or postersmaps
from the European Unionrsquos representations (httpeceuropaeurepresent_enhtm)
from the delegations in non-EU countries
(httpeeaseuropaeudelegationsindex_enhtm)
by contacting the Europe Direct service (httpeuropaeueuropedirectindex_enhtm)
or calling 00 800 6 7 8 9 10 11 (freephone number from anywhere in the EU) () () The information given is free as are most calls (though some operators phone boxes or hotels may charge you)
Priced publications
bull via EU Bookshop (httpbookshopeuropaeu)
Priced subscriptions
bull via one of the sales agents of the Publications Office of the European Union
(httppublicationseuropaeuothersagentsindex_enhtm)
doi102779968246
KH
-02-1
6-5
05-E
N-N
[Ca
talo
gu
e n
um
be
r]
- Summary reportpdf
-
- cover page
- Final report_final2
-
- Blank Page
- Annex to task 5 - Finland case studypdf
-
- Annex 1 Table of Key Policies FINLAND
-
- Annex to task 5 - Germany case studypdf
-
- Annex 2 Table of Key Policies GERMANY
-
- Blank Page
- Annex to task 5 - Italy case studypdf
-
- Annex 3 Table of Key Policies ITALY
-
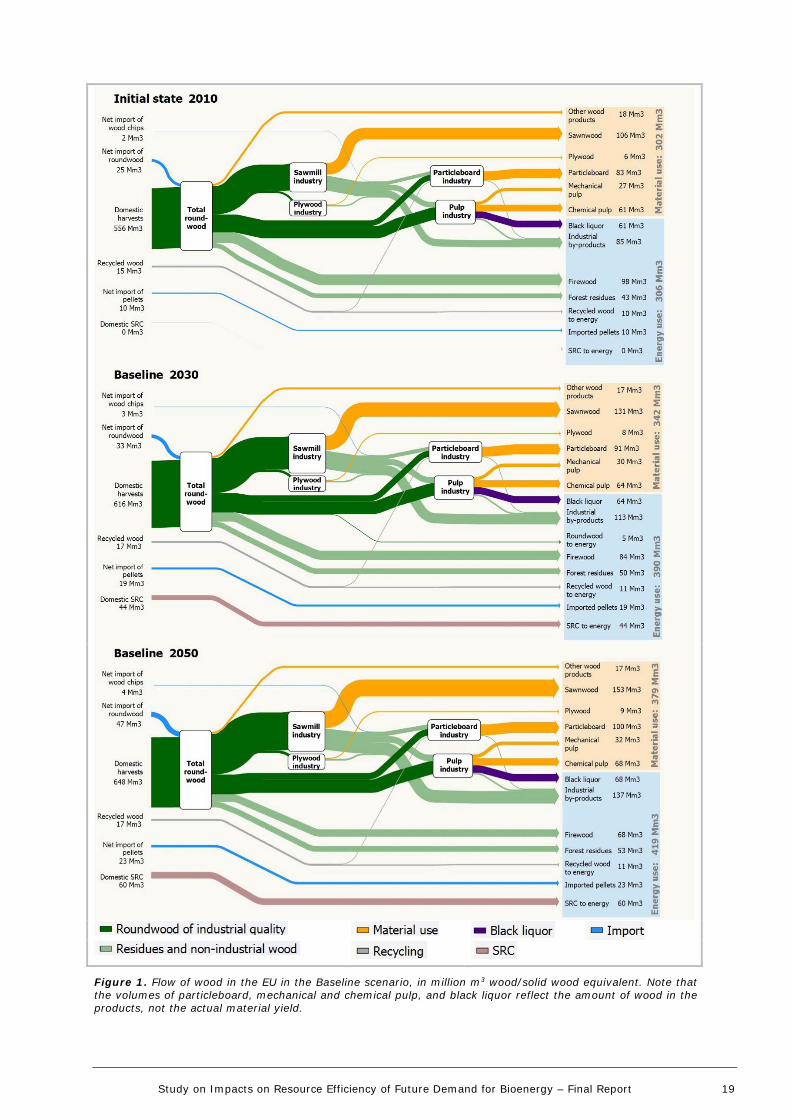
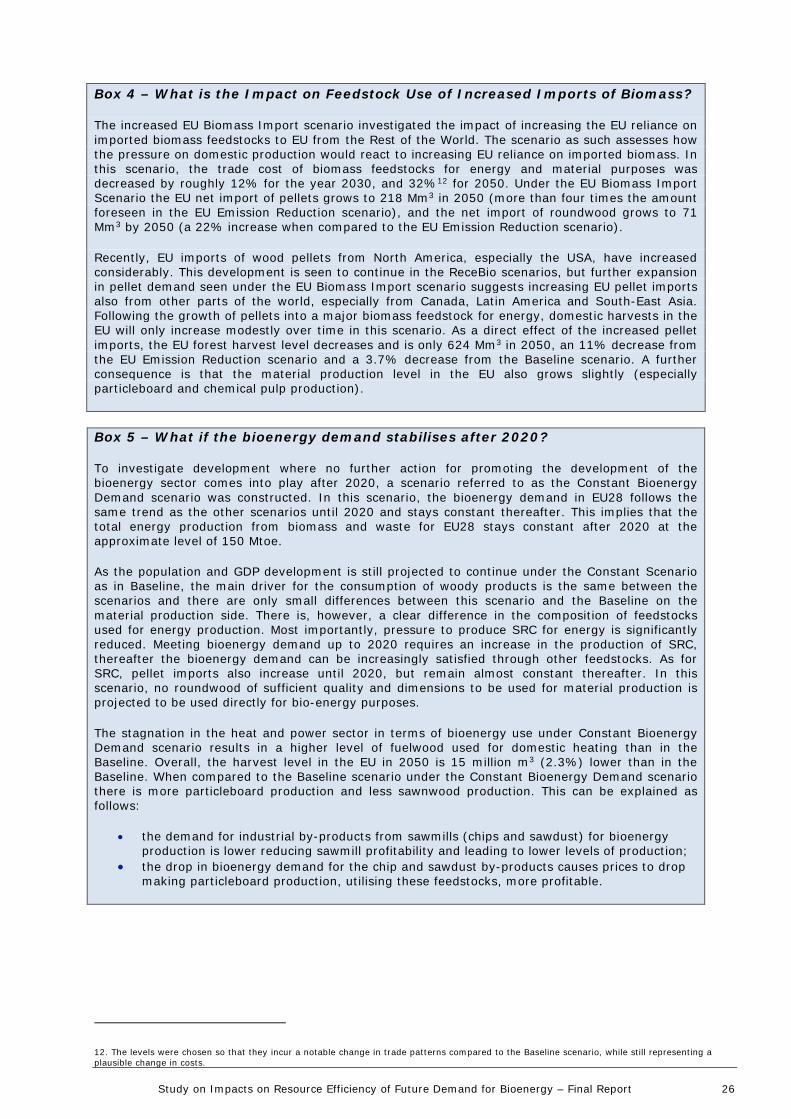