Study on Compound Mode Crack Propagation Law of Semi ...
32
Study on Compound Mode Crack Propagation Law of Semi Circular Arch Roadway Under Impact Load Chengxiao Li ( [email protected] ) https://orcid.org/0000-0002-9260-4404 Renshu Yang University of Science and Technology Beijing Yuantong Zhang China University of Mining and Technology - Beijing Campus Chen An China University of Mining and Technology - Beijing Campus Research Keywords: Defect location, Dynamic caustics, SHPB, ABAQUS, Semi-circular arch roadway Posted Date: February 23rd, 2021 DOI: https://doi.org/10.21203/rs.3.rs-228555/v1 License: This work is licensed under a Creative Commons Attribution 4.0 International License. Read Full License Version of Record: A version of this preprint was published at International Journal of Coal Science & Technology on July 14th, 2021. See the published version at https://doi.org/10.1007/s40789-021-00450- 4.
Transcript of Study on Compound Mode Crack Propagation Law of Semi ...

Study on Compound Mode Crack Propagation Lawof Semi Circular Arch Roadway Under Impact LoadChengxiao Li ( [email protected] ) https://orcid.org/0000-0002-9260-4404
Renshu Yang University of Science and Technology Beijing
Yuantong Zhang China University of Mining and Technology - Beijing Campus
Chen An China University of Mining and Technology - Beijing Campus
Research
Keywords: Defect location, Dynamic caustics, SHPB, ABAQUS, Semi-circular arch roadway
Posted Date: February 23rd, 2021
DOI: https://doi.org/10.21203/rs.3.rs-228555/v1
License: This work is licensed under a Creative Commons Attribution 4.0 International License. Read Full License
Version of Record: A version of this preprint was published at International Journal of Coal Science &Technology on July 14th, 2021. See the published version at https://doi.org/10.1007/s40789-021-00450-4.

Study on compound mode crack propagation law of semi circular
arch roadway under impact load
Chengxiao Lia, , Renshu Yanga,b , Yuantong Zhanga, Chen Ana
Abstract Various kinds of defects are usually contained in the underground roadway. When the roadway is
impacted by external load, the location of defects will influence the roadway with different degrees. In
order to study the effect of the location of defects on crack propagation in roadway, in this paper, the stress
wave produced by the bullet impacting the incident rod was used as the impact load. Meanwhile, the
variations of speed, displacement and dynamic stress intensity factor (DSIF) of cracks, during crack
propagation, were obtained by using the experimental system of digital laser dynamic caustics (DLDC).
And the extended finite element software ABAQUS is used for numerical simulation. Based on the method
of experimental-numerical simulation, the crack propagation path is verified and the impact fracture
behavior of semi-circular arch roadway with different defect positions is presented. It can be concluded
that when the prefabricated crack is located at the central axis of sample, the crack propagation belongs to
pure mode I; when the prefabricated crack is 5mm away from the central axis, the crack propagation
appears between mode I and I-II mixed mode alternately; when the prefabricated crack is at the edge of
semi-circular arch roadway, the crack propagation follows I-II mixed mode
.Keywords Defect location; Dynamic caustics, SHPB, ABAQUS, Semi-circular arch roadway
1 Introduction
Due to the increasing consumption of shallow coal in today's social development, the mining
of coal resources has gradually shifted to deeper underground. As an important part of coal
mining, semi-circular arch roadway surrounding rock defects such as cracks and holes will
affect the stability of roadway structure in the process of excavation or structural maintenance.
When the surrounding rock with defects is subjected to external dynamic load, such as
blasting, roof collapse, rock burst, etc., the shock wave will cause further cracking and
expansion of the original defects of the rock mass. It even penetrates with other defects
around the rock mass, which will destroy the local stability of the rock mass and, in serious
cases, cause the destruction of the roadway. Under the action of impact dynamic load, the
crack propagation track, propagation speed and stress intensity in the process of crack
propagation will be affected by the crack location. Therefore, it is of great practical
significance to study different crack locations for crack propagation process and related
parameters in semi-circular arch roadway.
The influence of defects on dynamic fracture of media has always been a hot issue in
fracture mechanics research. Yang RS1 studied the influence of different angles of
prefabricated crack on crack propagation by using drop hammer to impact medium
containing prefabricated crack. Yue ZW2 conducted a three-point bending experiment and
studied the crack propagation under impact load when the loading direction and crack angle
Corresponding author. E-mail: [email protected]
a School of Mechanics & Civil Engineering , China University of Mining & Technology, Beijing 100083, China
b School of Civil and Resource Engineering, University of Science and Technology Beijing, Beijing 100083, China

of the drop hammer were different. Wang YB3 studied the effect of empty hole on the crack
movement of PMMA specimen under impact loading. Li ZC4 studied the influence of fracture
dip angle in three-dimensional space on dynamic fracture of rock-like medium. Liu W5
studied the effect of external impact on PMMA specimen multi-crack propagation. Yao XF6-7
studied the interaction and propagation of two parallel precast cracks under dynamic tensile
loading.
The development of numerical simulation provides a convenient and effective met-hod
for studying the influence of defects on dynamic fracture of media,Especially f-or the
prediction of mixed mode crack propagation process. At present, the commonly used
numerical simulation methods mainly include finite element method (FEM)8、finite difference
method (FDM)9、extended finite element method (XFEM)
10 and discrete element method
(DEM)11
et al. Many scholars have explored the concrete situation of crack propagation in the
roadway through numerical simulation and experiment, and have achieved many important
results12-19
. Guo DM20-21
studied the influence of explosion load on crack propagation behavior
in roadway, and obtained the evolution law of dynamic stress intensity factor of crack tip by
comparing the numerical simulation results. Zhu ZM 22-24
carried out the test of rock tunnel
under heavy hammer impact, and studied the variation of crack propagation velocity, path
and other parameters in the tunnel by using numerical simulation and strain gauge method.
However, the methods used in the above researches are usually SHPB combined with
numerical simulation, explosion combined with caustics and impact combined with caustics.
There are few researches on the dynamic propagation of crack and its process under uniform
stress wave by caustic method.
PMMA has good brittle fracture performance under dynamic loading and excellent
optical performance. Therefore, it is often used as rock-like materials to study the dynamic
fracture process of brittle materials25
. In this paper, we combine the caustics system (DLDC)
with stress wave loading system, and use PMMA as the material medium to study the
propagation of prefabricated cracks in different positions under stress wave loading. At the
same time, the extended finite element method (EFEM) of commercial software ABAQUS is
used to simulate the crack growth process, and the test results are compared with the
simulation results.
2 Test principle and system
2.1 Principle of caustics test method
In 1964, Manogg26
first proposed the experimental method of caustics to solve the problem of
singularity in the experiment, and used this method to carry out the experiment of crack
propagation in a plate with micro holes. It is then extended to dynamic fracture problems
under different loads by Theocari27 and Kalthoff
28. Guan DC
29 and Wu X
30 first introduced the
method of using caustics to study static fracture in China. Yang LY and Yang RS31 developed
a new digital laser dynamic caustic experiment system by combining high-speed photography
system and laser system.On this basis, the caustics method is widely used in the dynamic
fracture process of rocks32-33.
The solid model has a uniform thickness before it is deformed. It deforms when
subjected to an external load,and the thickness of the region near the internal singularity will

no longer remain uniform. Because the thickness of the model changes, when parallel light is
incident perpendicular to the surface of the specimen, its refractive index will also change. As
a result, the reflected light and refracted light on the back surface of the model will no longer
be parallel, and a three-dimensional caustic surface will be formed in the air. As shown in
figure 1, these reflected and refracted rays are projected on a parallel reference plane within a
certain range from the model, and the cross section of the caustic surface will be obtained.
The red curves shown in figure 2(a) and figure 2(b) are respectively the caustics diagrams of
type I and I-II mixed cracks formed under the reflected tensile stress of the specimen . The
black area enclosed in the middle is the caustic spots.
Fig.1 Caustic principle
(a)mode I caustic spots (b)mixed mode I-II caustic spots
Fig.2 Two kinds of caustic images
When there is a point T(x,y) on the specimen, there will be a corresponding point T ' (x',y ')
on the reference surface, and their relationship can be expressed as34:
wxX (1)
Where w is the vector of the specimen deflected to the reference plane by the distance Z0,
which can be expressed as:
),(,r0 yxsgradZw t (2)
tr ,s refers to the variation of light passing through the specimen, which can be expressed
as:
)]()[(cs 21,21,, trtrtr d (3)
Where is a constant, usually 1,2; d is the thickness of the specimen; tr , is the light
anisotropy coefficient of the material; tr ,c is the stress optical constant;
If the growth of crack length after time t is set as z , the z at any time ti can be expressed
as:
)()()z(t 22
i ii tytx (4)
Where )( itx and )( ity are the displacements in the x and y directions at time ti during
the crack propagation process. The crack growth rate can be obtained by the differential of
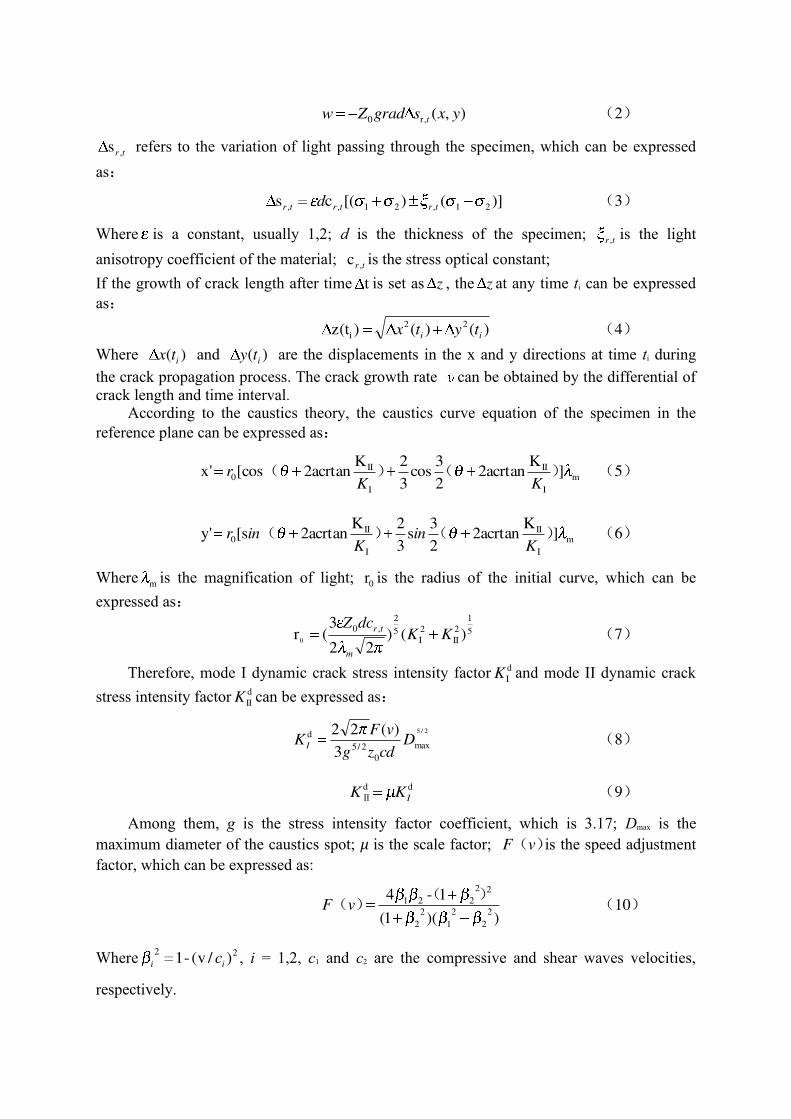
crack length and time interval. According to the caustics theory, the caustics curve equation of the specimen in the
reference plane can be expressed as:
m
I
II
I
II0 ]
K2acrtan
2
3cos
3
2K2acrtancos['x )()(
KKr (5)
m
I
II
I
II0 ]
K2acrtan
2
3s
3
2K2acrtans['y )()(
Kin
Kinr (6)
Where m is the magnification of light; 0r is the radius of the initial curve, which can be
expressed as:
5
1
2
II
2
I5
2
,0)()
22
3(r
0KK
dcZ
m
tr (7)
Therefore, mode I dynamic crack stress intensity factor d
IK and mode II dynamic crack
stress intensity factor d
IIK can be expressed as:
2/5
max
0
2/5
d
3
)(22D
cdzg
vFK I (8)
dd
Ⅱ IKK (9)
Among them, g is the stress intensity factor coefficient, which is 3.17; Dmax is the
maximum diameter of the caustics spot; μ is the scale factor; )(vF is the speed adjustment
factor, which can be expressed as:
))(1(
1-42
2
2
1
2
2
22
221 )()(vF (10)
Where 22)/v(-1 ii c , i = 1,2, c1 and c2 are the compressive and shear waves velocities,
respectively.

2.2 Testing system
The test combines a new digital laser dynamic caustics(DLDC) system with stress wave
loading system(see in fig.3). The DLDC system mainly consisted of a high-speed digital
camera(Fastcan-SA5(16G):Photron Company, Japan), two convex lenses(focal length
1500mm and diameter 300mm), a expander (LCht-3X-532 nm: Edmund Optics Company,
USA), and a green laser(LWGL300-1500mW:50mW). When the system works, the laser is
emitted by the laser, diffuses after passing through the beam expander, and then passes
through the convex lenses 1, PMMA specimen and convex lenses 2 respectively, and finally
the image presented enters the high-speed camera.
SHPB experimental system is composed of a pneumatic power device, a bullet, an
infrared velocimeter, an incident bar, and a damper. Compared with the traditional split
Hopkinson bar, the stress wave loading system in this paper has no transmitted bar. The
reason was that the wave impedance matching between the steel rod and the plexiglass is
poor, and the stress wave transmission part is less, so the system is only used as a means of
dynamic loading. The bullet and incident bar used in the experiment are cylindrical steel rods
with length of 400mm and 2000mm respectively.The elastic modulus Eb of the bar is 206
GPa, and the measured longitudinal wave velocity is 5123m/s.
Fig.3 Testing system
Because of the movement difference between the contact surface of the bar and the
specimen in the transverse direction, there is friction force in the test process. It will prevent
the transverse deformation at the contact surface of the specimen and destroy the
one-dimensional stress state of the test piece, causing abnormal damage to the test piece, as
shown in Fig. 4. Therefore, during the impact experiment, it is necessary to lubricate the bars
in contact with both ends of the test piece, such as applying vaseline.

Fig.4 An abnormal failure caused by friction
3 Experimental setup
3.1 Specimen design
Figure 5 shows the geometric dimensions of the semi-circular arch roadway specimen.
According to the actual engineering background, it is assumed that the width of the roadway
is 8m, the height is 10m, and the radius of the semi-circular arch is 4m. According to the
above conditions, similar simulation experiments were carried out, and the roadway size was
reduced according to the similarity ratio of 400:1, and the test piece roadway width was
20mm, the height was 25mm, and the radius of the semi-circular arch was 10mm. At the
same time, the length of the entire test piece is 140mm, the width is 70mm, and the thickness
is 10mm. Prefabricated cracks with a length of 15 mm and a crack width of 0.5 mm are set at
different positions on the top of the semi-circular arch. The material of the test piece is
PMMA, and the relevant parameters of PMMA35 are shown in Table 1.
Specimen A Specimen B Specimen C
Fig.5 Specimen geometry
Table 1 Mechanical properties of PMMA35

Mechanical properties Symbols (Units) PMMA
Density (kg/m3) 1180
Dynamic Young’s modulus Ed (GPa) 6.1
Poisson’s ratio Vd (-) 0.31
Velocity of compressive
waves Cp (m/s) 2320
Velocity of shear waves Cs (m/s) 1260
Stress optical constant C (m2/N) 0.88×10⁻¹⁰
Shear modulus G (GPa) 1.28
In order to make the crack propagate smoothly, an initial crack was machined at
different positions on the top of the semi-circular arch. Due to the influence of incident bar
size, the specimen size is difficult to reach infinity. At the same time, it is necessary to ensure
that the semi-circular arch tunnel in the middle of the specimen has a certain size. In order to
reduce the influence of the boundary of the test piece on the propagation of cracks, when
designing the size of the test piece, the width of the test piece is slightly larger than the
diameter of the incident bar (50mm). This can ensure that when the stress wave is transmitted
to the specimen, all cracks within the purple dotted line are affected by stress waves(Figure
6).In this way, the interference of the upper and lower boundaries on the crack propagation is
reduced. The principle of specimen length selection is as long as possible. Due to the
influence of the elastic modulus, shear modulus and thickness of the test piece itself, in order
to prevent the test piece from longitudinally breaking from the middle part during the impact
process, the better size obtained through repeated experiments is 140mm in length. In many
sets of tests, the propagation of cracks is usually in the purple area, and very few tests show
that the cracks propagate to the red area.,When the crack propagates to the red region, the
crack propagation is affected by the left boundary and deflects suddenly, as shown in Figure
7. Therefore, the scope of the study of crack propagation in this paper is within the purple
dash.
Fig.6 Schematic diagram of specimen

Fig.7 Subject to boundary effects
3.2 Test Operation
To set up a DLDC system, it is important to place all equipment in a suitable horizontal
position to ensure that the laser can be perpendicular to the surface of the specimen. The
resolution of high-speed camera is 65100fps and the pixel is 448 × 224. During the test, the
experimenter Li was responsible for adjusting the incident pressure of the bullet. In order to
control the loading rate as same as possible, the air pressure should be between 0.2 ±
0.01Mpa. When experimenter Zhang heard the impact sound, he immediately pressed the
video button. In this experiment, the high-speed camera adopts post trigger mode, which can
record the picture within 2s before pressing the button, so as to ensure that the test process
can be completely recorded. After the test, according to the velocity measured by infrared
velocimeter, the test records of three groups of specimens (with different crack positions)
were randomly selected as the test results. The results are shown in Table 2. It can be found
that the emission pressure and velocity of specimen A, B and C are almost the same.
Table 2 The bullet velocity and pressure corresponding to different specimens
Air pressure
(MPa) 0.2 0.2 0.21
Bullet velocities
(m/s) 4.53 4.51 4.52
Specimen Specimen A Specimen B Specimen C
4 Results and Discussion
4.1 Crack propagation path of specimen
Figure 8 shows the crack propagation path of three groups of semi-circular arch roadway specimens with different crack positions. The prefabricated crack of specimen A is located on the central axis of the specimen, and after being impacted, it expands approximately in a straight line along the central axis, and fluctuates up and down in a small range. The

prefabricated crack of specimen B is 5mm away from the central axis, and the specimen will bend downward to form an approximate circular arc after being impacted. When it extends near the central axis, it almost does not expand in the vertical direction. The prefabricated
crack of specimen C is located at the edge of semi-circular arch roadway,and the crack
propagation is similar to that of specimen B. However, the degree of circular extension of specimen C is more obvious than that of specimen B. Similarly, specimen C does not continue to expand downward after extending to the central axis, but moves horizontally along the central axis.
(a)Specimen A (b)Specimen B (c)Specimen C
Fig.8 Crack growth trace
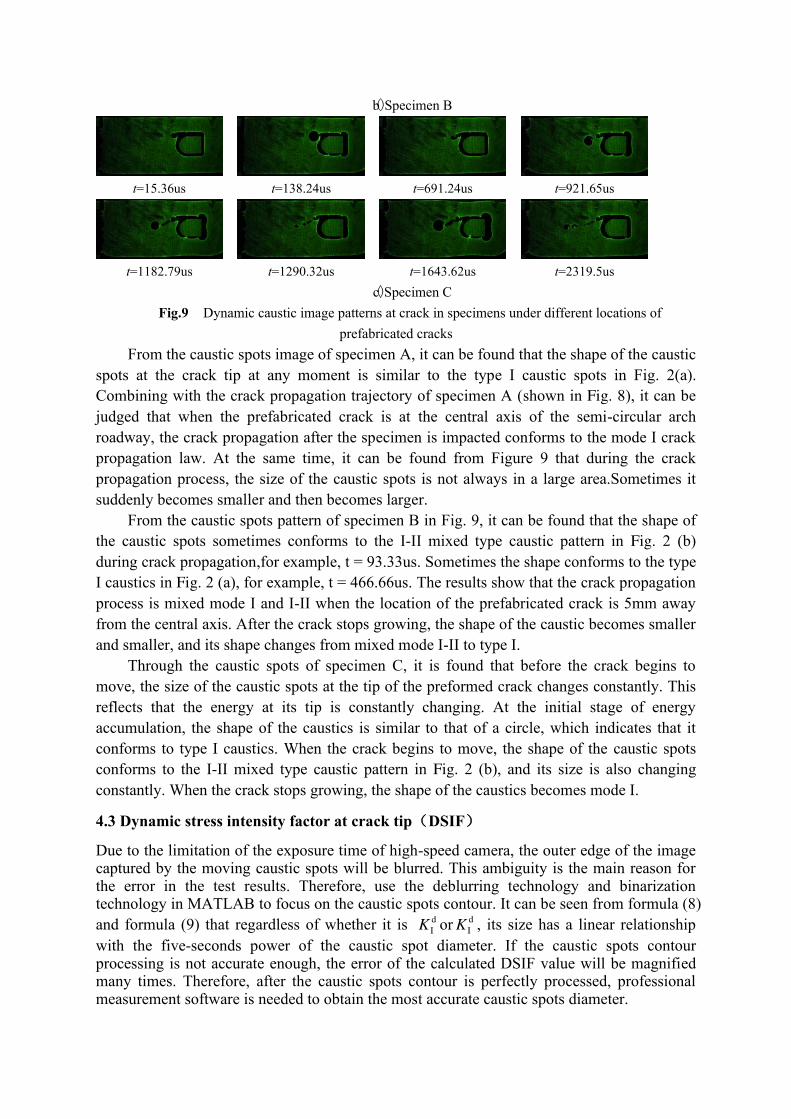
4.2 Dynamic caustics diagram at typical moments
Due to space limitations, Figure 9 shows the partial caustics diagrams of specimens A, B, and C at different moments with prefabricated cracks in different positions. It should be noted that the time regulation in this article is that the moment before the caustic spots changes is 0. It can be found that even if the prefabricated cracks positions are different, the caustics spot area of the prefabricated cracks tip has undergone a process of change from small to large at the initial stage of impact on the three sets of specimens. It shows that the increase of caustic spots at this stage is only caused by the impact load acting on the crack tip to cause energy concentration. When the energy accumulated at the crack tip reaches a certain level, the crack begins to expand, that is, the caustic spots moves.
t=46.08us t=276.49us t=829.49us t=1182.79us
t=1520.73us t=2457.75us t=2749.61us t=2903.22us
(a)Specimen A
t=13.33us t=93.33us t=466.66us t=920us
t=973.33us t=1213.33us t=1466.66us t=1840us
(b)Specimen B
t=15.36us t=138.24us t=691.24us t=921.65us
t=1182.79us t=1290.32us t=1643.62us t=2319.5us
(c)Specimen C
Fig.9 Dynamic caustic image patterns at crack in specimens under different locations of
prefabricated cracks
From the caustic spots image of specimen A, it can be found that the shape of the caustic
spots at the crack tip at any moment is similar to the type I caustic spots in Fig. 2(a).
Combining with the crack propagation trajectory of specimen A (shown in Fig. 8), it can be
judged that when the prefabricated crack is at the central axis of the semi-circular arch
roadway, the crack propagation after the specimen is impacted conforms to the mode I crack
propagation law. At the same time, it can be found from Figure 9 that during the crack
propagation process, the size of the caustic spots is not always in a large area.Sometimes it
suddenly becomes smaller and then becomes larger.
From the caustic spots pattern of specimen B in Fig. 9, it can be found that the shape of
the caustic spots sometimes conforms to the I-II mixed type caustic pattern in Fig. 2 (b)
during crack propagation,for example, t = 93.33us. Sometimes the shape conforms to the type
I caustics in Fig. 2 (a), for example, t = 466.66us. The results show that the crack propagation
process is mixed mode I and I-II when the location of the prefabricated crack is 5mm away
from the central axis. After the crack stops growing, the shape of the caustic becomes smaller
and smaller, and its shape changes from mixed mode I-II to type I.
Through the caustic spots of specimen C, it is found that before the crack begins to
move, the size of the caustic spots at the tip of the preformed crack changes constantly. This
reflects that the energy at its tip is constantly changing. At the initial stage of energy
accumulation, the shape of the caustics is similar to that of a circle, which indicates that it
conforms to type I caustics. When the crack begins to move, the shape of the caustic spots
conforms to the I-II mixed type caustic pattern in Fig. 2 (b), and its size is also changing
constantly. When the crack stops growing, the shape of the caustics becomes mode I.
4.3 Dynamic stress intensity factor at crack tip(DSIF)
Due to the limitation of the exposure time of high-speed camera, the outer edge of the image captured by the moving caustic spots will be blurred. This ambiguity is the main reason for the error in the test results. Therefore, use the deblurring technology and binarization technology in MATLAB to focus on the caustic spots contour. It can be seen from formula (8)
and formula (9) that regardless of whether it is d
IK or d
IK , its size has a linear relationship
with the five-seconds power of the caustic spot diameter. If the caustic spots contour processing is not accurate enough, the error of the calculated DSIF value will be magnified many times. Therefore, after the caustic spots contour is perfectly processed, professional measurement software is needed to obtain the most accurate caustic spots diameter.

Since the fracture process of the specimen is the result of multiple actions after the internal stress wave is reflected, the entire fracture process takes a long time. Through data processing, it is found that the DSIF change law of the whole process is roughly similar, and the change curve is almost the same in multiple time periods. Therefore, the change of DSIF during the first half of the fracture process is selected for analysis. Through the caustics method, the curve of the dynamic stress intensity factor at the crack tip of different specimens can be calculated with time(shown in Fig.10). Here, the period from the moment before the crack tip caustic speckles starts to appear to the movement of the caustic spots is defined as
the initial energy accumulation stage(IEAS). The IEAS time of specimens A, B and C are
261.13us, 120us, and 122.88us respectively. When the prefabricated crack is on the central axis, the energy accumulation takes longer, and when the prefabricated crack shifts to the edge of the semi-circular arch, the IEAS time becomes shorter.
0 200 400 600 800 1000 1200 1400
0.0
0.5
1.0
1.5
2.0
2.5
Kd (Mpa·
m1/2)
t (us)
KdIInitial energy accumulation stage
0 200 400 600 800 1000 1200 1400 1600
0.0
0.5
1.0
1.5
2.0
2.5
Type I crack stageInitial energy accumulation stage
Kd (
Mpa·
m1/2)
t (us)
KdI
KdII
(a)Specimen A (b)Specimen B
0 200 400 600 800 1000 1200 1400
0
2
4
6
8
Initial energy accumulation stage
Kd (Mpa·
m1/2)
t (us)
KdI
KdII
(c)Specimen C
Fig.10 The DSIF-time curve under different specimen
The prefabricated crack of the specimen is on the central axis. When the specimen is impacted, the crack tip energy starts to converge. In Figure 9(a), the correspondingly shows
that the size of the caustic spots changes. When d
IK = 1.81 MPa·m1/2
, the crack begins to move.
The results show that the mode I fracture toughness of the specimen is 1.81 MPa·m1/2
when the prefabricated crack is on the central axis. After the end of energy accumulation stage, the value of dynamic stress intensity factor is constantly changing, reaching the maximum value of 2.40 MPa·m
1/2. From the impact of the crack until the caustic spots no longer changes,

only d
IK exists in the whole process, which is a pure type I crack propagation.
From Figure 10(b), it can be found that when d
IK = 0.83MPa·m1/2
, d
IIK = 0.50MPa·m1/2
the crack starts to move. It shows that when the prefabricated crack is 5mm away from the central axis, the fracture toughness of type I is 0.83MPa·m
1/2, and the fracture toughness of
type II is 0.50MPa·m1/2
. In the process of crack growth, it is not simply a type I crack growth or a mixed type I-II growth, but a type I and a mixed type I-II appear alternately. When
t=150us-266.66us, DSIF only has d
IK . When t=266.66us-320us, d
IK and d
IIK exist at the same
time. When t=320us-866.66us, the DSIF value is re-stored to only d
IK . From
t=866.66us-1413.33us, DSIF shows a mixed I-II type.
For specimen C, when t=0us-61.44us, there was only as dIK , and the pattern of caustic
speckle was pure I type. After 61.44us, I-II mixed type caustic speckle appeared. When t = 122.88us, the crack tip completed the energy accumulation stage and then began to propagate. The fracture toughness of type I is 1.70MPa·m
1/2, and the fracture toughness of type II is
1.53MPa·m1/2
. The maximum value of d
IK is 3.59MPa·m1/2
, and the maximum value of d
IIK is
7.80MPa·m1/2
. But the maximum value of d
IK and d
IIK is not reached at the same time.
4.4 Influence of the location of prefabricated crack on crack propagation
In order to be able to see the concrete situation of the crack in the process of motion intuitively, the moving image of caustic spot is processed. Taking the tip of the prefabricated crack as the origin O, the horizontal left direction is the positive direction of X, and the vertical downward direction is the positive direction of Y. The curves of the displacement of the crack tip in the X direction and Y direction with time are drawn, and also take the crack change in the first half of the fracture process for analysis(shown in Fig. 11).
0 200 400 600 800 1000 1200 1400
0
2
4
6
8
10
12
Displacement in X direction Displacement in Y direction
t (us)
Crack tip displacement-X (mm)
-1.4
-1.2
-1.0
-0.8
-0.6
-0.4
-0.2
0.0
Crack tip displacement-Y (mm)
0 200 400 600 800 1000 1200 1400 1600
0
5
10
15
20
Displacement in X direction Displacement in Y direction
t (us)
Crack tip displacement-X (mm)
-0.5
0.0
0.5
1.0
1.5
2.0
2.5
3.0
3.5
4.0
Crack tip displacement-Y (mm)
(a)Specimen A (b)Specimen B

0 200 400 600 800 1000 1200 1400
0
5
10
15
20
25
Displacement in X direction Displacement in Y direction
t (us)
Crack tip displacement-X (mm)
0
2
4
6
8
10
Crack tip displacement-Y (mm)
(c)Specimen C
Fig.11 Crack tip propagation time history curve
From Figure 11, it can be intuitively found that the displacement-time diagrams
of the crack tips of the three groups of specimens in the X and Y directions all pre-
sent a stepped curve. Explain that under the action of impact load, crack propagation
is not completed at once. Instead, it pauses after extending a certain distance, and t-
hen expands again when the energy accumulates to a certain value. The continuous
change of DSIF in Figure 10 can prove this phenomenon from the side. Due to the
energy consumption of crack growth, the DSIF of the crack tip becomes smaller duri-
ng movement. When the value drops below the crack fracture toughness, the crack st-
ops expanding. After waiting for the energy to accumulate and exceed the fracture to
ughness again, the crack continues to grow. In Figure 11(a), when the crack expands
along the central axis, the crack floats upward in a small range, so that its displace-
ment in the Y direction will be negative. However, according to the change of causti-
c spots in Figure 9(a), it is believed that the crack propagation of specimen A confor
-ms to the pure type I law. Figure 11(b) shows that the displacement of the cracks i
n the X and Y directions are almost synchronous. At the end of the crack propagatio
n trajectory, it can be found that specimen B still has a small range of displacement
in the Y direction, which is consistent with the actual specimen fracture trajectory in
Figure 8(b). It can be found that the displacement time in Y direction is relatively c-
oncentrated(shown in Fig. 11(c)), and it is almost completed in t = 860.21us-1075.26u
s. In other time periods, there is only a small range of Y-direction displacement.
When the preformed crack is in the central axis, the crack growth belongs to p-
ure mode I. The energy of impact load mainly makes the crack move in X direction.
When the prefabricated crack moves upward, the mixed mode of I-II appears. With
the increase of displacement of prefabricated crack, the displacement of crack in Y
direction increases.

0 500 1000 1500 2000 2500 3000
0
50
100
150
200
250
300
350
Vz (m/s)
t (us)
Specimen A Specimen B Specimen C
Fig. 12 The Vz velocity of crack growth varies with time
According to formula (4), the displacement of the crack in the X direction and
the Y direction is combined vector to obtain the actual displacement z . Then calcu-
late the derivative of the displacement z with respect to time, and get the crack gr-
owth rate Vz with time (as shown in Fig. 12). It can be found that when the prefab
ricated crack is 5mm away from the central axis, its speed reaches the maximum tim
e is the earli-est, followed by the prefabricated crack at the edge of the semi-circular
arch roadway, and the prefabricated crack at the central axis reaches the maximum
at the latest. As the prefabricated crack shifts upward from the central axis, the ma
ximum speed reached during the crack propagation process gradually increases. The f
irst time the stress acts on the crack tip is mainly to make the crack tip energy conv
erge. When the fracture toughness of the specimen is reached, the crack movement
has speed. With t-he disappearance of the tip stress, the crack velocity decreases grad
ually, and when the reflection stress acts on the crack tip again, the crack speed incr
eases again.
0 10 20 30 40 50 60
0
2
4
6
8
Specimen A-KdI
Specimen B-KdI
Specimen B-KdII
Specimen C-KdI
Specimen C-KdII
Kd (MPa·
m1/2)
X-direction displacement (mm)
Fig.13 Crack propagation DSIF varies with displacement in X direction
Figure 13 is a scatter plot of DSIF varying with the displacement length in the X dir
ection during the crack propagation process when the pre-crack positions are different.
It could be found that when the cracks of the three groups of specimens extend to t

he same length, the d
IK and d
IIK of specimen C were larger. It shows that when a sing
le pre-formed crack is at the edge of a semi-circular arched roadway, more energy wi
ll be collected at the crack tip during the crack propagation process after impact. The
d
IK and d
IIK of specimen B were the smallest when the crack propagates to the sa
me position, indicating that the crack propagation was relatively simple when the pref
abricated crack is in the middle of the roadway edge and the central axis. According
to Figure 10, it could be known that the time of the energy collection phase of spe
cimen B was the shortest, and the initial fracture toughness was also the lowest.
4.5 Crack growth process analysis
The reason for the suspension of crack growth and the dramatic change of DSIF is t-
hat when the specimen is subjected to stress wave, a part of the stress wave acts on
the crack tip, and a part of the stress wave is transmitted to the damper along the s
pecimen. So that the energy can-not be completely applied to the crack tip, so the cr
ack will stop after a period of propagation. It can be seen from literature 36
that when
the contact surface between the test piece and the bar is smaller, the specific gravity
of the reflected wave is larger, and the specific gravity of the transmitted wave is s
maller. Therefore, part of the stress wave transmitted to the right side of test piece
will be reflected back to the specimen, and transmitted back and forth inside the spec
imen, causing the DSIF of the crack tip to continuously change. When the DSIF of t
he crack tip again exceeds the fracture toughness of the material, the crack continues
to grow.
Fig. 14 Effect of stress wave on crack
Fig. 15 is a simplified schematic diagram of the effect of reflected stress wave
on crack. When there is energy accumulation at the tip of the prefabricated crack fort
he first time, due to the existence of semicircular arch roadway, the stress wave will
attenuate to form Pd when it is transmitted to the nearby area. However, the stre-ss
wave Pi on both sides of the semicircular arch roadway does not pass through t-he r
oadway, so Pi will be greater than Pd. Therefore, the displacement of the crack t-ip af
ter the energy accumulation is completed will deflect downward rather than upw-ard.
In t-he process of crack motion, it is still under the action of stress wave. Since the
crack motion trajectory is an arc, the stress wave is decomposed in the normal and t
angential directions of the arc to obtain Pr and Pt, which can be expressed as:

sin,cos
sin,cos
sin,cos
2222
1111
mmtmmr
tr
tr
PPPP
PPPP
PPPP
(12)
As α increases, the normal component of the stress wave gradually decreases, w-
hile the tangential component gradually increases.When α=90°, the normal component
of the stress wave is 0, and the crack no longer moves in a curve. The tangential
component reaches the maximum, which is equal to the magnitude of the stress wave
at this time.
5 Numerical simulation
In order to better verify the crack propagation law of the semi-circular arch roadway
under impact, the commercial software ABAQUS is used to simulate the crack fractu-
re process .The extended finite element method (XFEM) in ABAQUS is widely used
to study the deformation and fracture of solid materials under force.
5.1 Numerical model of specimen
In the simulation, it is assumed that the change of the material is completely caused
by the crack propagation. In order to ensure that both the experimental and simulated
impact loads are subjected to uniform one-dimensional loads, the output terminal co-
mposed of the bullet and the incident bar is used for modeling (the output terminal
load is the same as the test). The shear modulus of bullet and incident rod G2=81G-P
a, Poisson's ratio Vd2=0.26, material density 7900kg/m3. The bullet model and the in-ci
dent bar model are composed of 412 and 1326 elements respectively, and the grid s
ize is 10 mm(Figure 15). The shear modulus of PMMA is G1=1.28GPa, Poisson's rati
o Vd1 = 0.31, and material density is 1180kg/m3. The specimen is modeled by CPS4R
solid elements, composed of 45706 elements, and the grid size is 0.05mm. The grid
of the typical specimen is shown in Figure 16.
Fig.15 Case of a meshed output bar

Fig.16 Typical mesh in ABAQUS
5.2 Simulation results and discussion
Figure 17 shows the simulated crack propagation trajectory of the specimen after frac-
ture. The crack propagation track of the specimen obtained by test and simulation is
compared, and Figure 18 is obtained. It can be found that the simulation result of sp
eci-men A is a straight line extending along the central axis, and the actual test resul
t will have a small expansion in the Y direction. The simulation results of specimen
s B and C are roughly the same as the actual test results, but the expansion path obt
a-ined by the simulation results is smoother, while the path obtained by the actual tes
t will fluctuate up and down in a few cases. This is related to the machining accurac
y of the test material and the nature of the material itself. In the simulation, it is co
ns-idered that both ends of the specimen are completely flat and smooth, and the spe
ci-men material is completely uniform. However, it is difficult to achieve this conditio
n in practice, so it may result in the actual test that the crack growth path will fluc
tua-te up and down in a small range.
Specimen A (b) Specimen B (c) Specimen C
Fig.17 Simulation of crack propagation for three types of specimens under
0102030405060-10
0
10
20
30
40
50
60
Y-direction displacement of crack tip (mm)
X-direction displacement of crack tip (mm)
Numerical Experimental
0102030405060
0
5
10
15
20
25
30
35
40
45
50
55
60
Y-direction displacement of crack tip (mm)
X-direction displacement of crack tip (mm) Numerical Experimental
(a)Specimen A (b)Specimen B

0102030405060
0
10
20
30
40
50
60
Y-direction displacement of crack tip (mm)
X-direction displacement of crack tip (mm) Numerical Experimental
(c)Specimen C
Fig.18 Comparison of crack paths
6 Conclusions
When the defect is at different positions of the semi-circular arch roadway, the crack
propagation condition will be different after the external impact load. Therefore, it is very
important to study the impact of the defect location on the roadway. The DLDC system and
the SHPB system can be used to study the propagation of cracks under one-dimensional
stress. Combined with ABAQUS software for numerical simulation, the following
conclusions are obtained:
(1)When the prefabricated crack is at the central axis, the crack propagation is pure
I type. When the prefabricated crack is located at a distance of 5mm from the central axis, the
crack growth is alternately type I and mixed type I-II. When the prefabricated crack is at the
edge of the roadway, the crack propagation follows the I-II mixed type.
(2)When the prefabricated crack is on the central axis, the crack expands along the
central axis after being impacted. When the prefabricated crack deviates from the central axis
and moves upwards, the crack's propagation trajectory is first a circular arc, and then moves
horizontally when approaching the central axis, but will not cross the central axis.
(3)When the crack is on the central axis, the displacement of the crack in the X
direction is the largest. When the prefabricated crack is 5mm away from the central axis, the
energy accumulation stage has the shortest time and the initial crack initiation toughness is
the lowest. When the prefabricated crack is at the edge of the roadway, the peak crack growth
velocity Vzmax is the largest. As the prefabricated crack shifts upward, the displacement of
the crack in the Y direction increases.
(4)The ABAQUS extended finite element method can better predict the crack
propagation after impact when the semicircular arch roadway contains prefabricated cracks.
The simulation results are basically similar to the test results.
Conflicts of interest
There are no conflicts to declare.
Acknowledgments

This work is financed by the State Key Development Program for Basic Research of China
(2016YFC0600903) and the National Natural Science Foundation of China(51774287).
References
1 R. S. Yang, Y. B. Wang , L. D. Hou , et al, Chinese Journal of Rock Mechanics and
Engineering., 2014, 33, 10.
2 Z. W. Yue , R. S. Yang, Z. H. Sun , et al, Journal of China coal society., 2010, 35, 9.
3 Y. B. Wang, R. S. Yang, G. F. Zhao, Polymer Testing., 2017, 58, 70.
4 S. C. Li,L. Yang, M. T. Li , et al, Chinese Journal of Rock Mechanics and E
ngineering., 2009, 28, 2.
5 W. Liu, X. F. Yao, R. S. Yang, et al, Optics and Lasers in Engineering,. 2020, 124,
105849
6 X. F. Yao, G. C. Jin, Arakawa K , Takahashi K, Polymer Test,. 2002, 21, 8 .
7 X. F. Yao , W. Xu , M. Q. Xu , Arakawa K , Mada T , Takahashi K, Polymer Test., 2003,
22, 6 .
8 De Frutos, J ; Novo, J, SIAM JOURNAL ON NUMERICAL ANALYSIS., 2002, 40,
3.
9 L. N. Y. Wong, H. Li, International Journal of solids and structures., 2013, 50, 22.
10 Moes, N, Dolbow, J, Belytschko, International Journal for Numerical Methods in
Engineering., 1999, 46, 131.
11 R. L McNearny,J. ABELJR, International Journal of Rock Mechanics and Mining
Sciences., 1993, 30, 93.
12 Lemnitzer,Anne, Keykhosropour,Lohrasb, Kawamata,Yohsuke, Earthquake Spectra.,
2017, 33,1.
13 Tsinidis G, Pitilakis K, Madabhushi G, Engineering structure., 2016, 125, 419.
14 J. Fan, L. Yang, International journal of Impact Engineering., 2017, 106, 217.
15 Z. M. Zhu, B. Mohanty, H. Xie, International Journal of Rock Mechanics and Mining
Sciences., 2007, 44, 3.
16 Z. M. Zhu, H. Xie, B. Mohanty , International Journal of Rock Mechanics and Mining
Sciences., 2008, 45, 2.
17 X. Li, T. Zhou, D. Li, Rock mechanics and rock engineering., 2017, 50, 1.
18 F. Huang, H. Zhu, Q. Xu, et al, Tunnelling and Underground Space Technology.,
2013, 35, 207.
19 Q. Yu, C. Tang, L. Li, G. Cheng, et al, Shock and Vibration., 2015, 1, 1.
20 D. M. Guo,K. Liu,J. X. Hu,et al, Journal of China Coal Society.,2016, 41, 1.
21 D. M. Guo,K. Liu,R. S. Yang, et al, Journal of Mining and Safety Engineering., 2015,
32,1.
22 L. Zhou , Z. M. Zhu, Y. Q. Dong , et al, Tunnelling and Underground Space Technology.,
2019, 84, 11.
23 L. Zhou , Z. M. Zhu, Y. Q. Dong , et al, International Journal of Impact Engineering.,
2019, 125, 134.

24 L. Zhou , Z. M. Zhu, Y. Q. Dong , et al, Theoretical and Applied Fracture Mechanics.,
2020, 109, 102733.
25 R. Goseki , Ishizone T. Poly (methyl methacrylate)(PMMA). 2015.
26 P. Manogg . Anwendung der Schattenoptik zur Untersuchung des Zerreissvorgangs von
Platten (West Germany:University of Freiburg 1964).
27 Theocarism.P.S, Applied Optics., 1972, 10, 240.
28 Kalthoff ,J.F, Winkler,S. and Beinert,J, International Journal of Fracture., 1976, 12,
317.
29 D. C. Guan , Z. H. Yang, Journal of Beijing University of Technology., 1983, 3, 65.
30 X. Wu, H. T. Yang, Journal of Solid Mechanics., 1984, 2, 299.
31 L. Y. Yang , R. S. Yang, P. Xu , Journal of China University of Mining&Technology .,
2013, 2, 31.
32 R. S. Yang , P. Xu, Z. W.Yue, Engineering Fracture Mechanics., 2016, 161, 63.
33 Y. B. Wang , R. S. Yang , G. F. Zhao, Polymer Testing., 2017, 58, 70.
34 Kalthoff, J.F, Proceedings of the Intern-ational Symposium on Photoelasticity., 198
6, 9, 109.
35 T. Karimzada , H. Maigre Journal De Physique IV 1997,. 2000, 2, 13.
36 J.C.L, N.N.Li, H.B.Li, et al. International Journal of Impact Engineering., 2017, 105,
109.

Figures
Figure 1
Caustic principle

Figure 2
Two kinds of caustic images
Figure 3
Testing system

Figure 4
An abnormal failure caused by friction
Figure 5
Specimen geometry
Figure 6
Schematic diagram of specimen

Figure 7
Subject to boundary effects
Figure 8
Crack growth trace

Figure 9
Dynamic caustic image patterns at crack in specimens under different locations of prefabricated cracks

Figure 10
The DSIF-time curve under different specimen

Figure 11
Crack tip propagation time history curve

Figure 12
The Vz velocity of crack growth varies with time

Figure 13
Crack propagation DSIF varies with displacement in X direction

Figure 14
Effect of stress wave on crack
Figure 15
Case of a meshed output bar
Figure 16
Typical mesh in ABAQUS
Figure 17
Simulation of crack propagation for three types of specimens under

Figure 18
Comparison of crack paths