Study on CO2 Rankine Cycles for Low and Medium Temperature Geothermal Sources for ... · ·...
15
Study on CO 2 Rankine Cycles for Low and Medium Temperature Geothermal Sources for Power Production and Cogeneration
Transcript of Study on CO2 Rankine Cycles for Low and Medium Temperature Geothermal Sources for ... · ·...

Study on CO2Rankine Cycles
for Low and Medium
Temperature Geothermal Sources for
Power Production and Cogeneration

Study on Rankine and Heat cyclesfor geothermal plants
using carbon dioxide as working fluid
The study refers at three types of plants, producing:
1. Only electric power
2. Electric power and hot tap water
3. Electric power and district heating

The CO2 pressure-enthalpy diagram used for the study of binary and heat cycles

The initial data The initial data ::a. Temperature of geothermal source 120°Cb. Temperature of cooling source:
10°C – producing only electric power,,40°C – producing electric power and hot tap water,,50-70°C – producing electric power and heating agent for
district heatingc. Working agent CO2
The thermal efficiency of CO2 power cycle was determined using the well-
known formula:
( ) ( )41
32
41
4321
41
3412 1iiii
iiiiii
qll
t −−
−=−
−+−=
+=η
Clausius-Rankine direct cycle
l12 – specific work produced in the turbine
l34 – specific work consumed in the pump
q41 – heat provided by geothermal water

The theoretical global thermal efficiency of CO2 direct cycle,considering cogeneration of power and heat is 100 %
q23 – heat provided by CO2 to hot tap water or district heating agents
( ) ( ) ( ) 141
41
41
324321
41
233412 =−−
=−
−+−+−=
++==
iiii
iiiiiiii
qqll
tη
p
i3 i4 i2 i1
i
4 1
23
CO2 vapour (heat) direct cycle
All cycles are consisting of:
1-2: isentropic expansion
2-3: isobaric cooling
3-4: isentropic compression
4-1: isobaric heating
The power efficiency will be determined for all the cycles with the same formula

All the studied cycles were limited by following curvesAll the studied cycles were limited by following curves::isothermal curve: t = 120°C; isobaric curve: p = 120 bar
isothermal curve: t = 10°C; isobaric curve: p = 45 bar

The studied binary cycles, producing only electrical power were The studied binary cycles, producing only electrical power were limited by following curveslimited by following curves: :
isothermal curve: t = 115°C; isobaric curve: p = 120 barisothermal curve: t = 10°C; isobaric curve: p = 45 bar
The studied parameters was the condensation temperature from 10 to 31 °C, and theupper pressure from 100 to 120 bar

The power efficiency is increasing with the growth of upper pressure (p1=p4) and lowering of condensation temperature (t3=t2)
The maximum efficiency (≈ 12,5%) was provided for upper pressure 120 bar and condensation temperature of 10 °C
10 12 14 16 18 20 22 24 26 28 30 31
0
2
4
6
8
10
12
14
Pow
er e
ffici
ency
η[%
]
Condensation temperature t [°C]
100 105 110 115 120Upper pressure

The studied heat cycles, producing simultaneously electrical powThe studied heat cycles, producing simultaneously electrical power ander and
hot tap water were limited by following curveshot tap water were limited by following curves::
isobaric curve: p1 = p4 = 120 bar; isobaric curve: p2 = p3 = 45 barisothermal curve: t1 = 115°C; isothermal curve: t2 = 60 °C;
The studied parameters were the exit cooling temperature t3 from 20 to 50 °C, and the upper pressure from 100 to 120 bar

The power efficiency is decreasing with the growth of upper pressure (p1=p4) presenting no significant variation with lowest temperature (t3=t2)
The maximum efficiency (≈ 14.43%) was provided for upper pressure 100 barand cooling exit temperature of 25 °C
Power efficiency of CO2 cycles producing electrical power and hot tap water: t1=115°C, t2=60°C
13,6
13,8
14
14,2
14,4
14,6
20 25 30 35 40 45 50
Temperature t3
Pow
er e
ffici
ency
of t
he c
ycle
t [
%]
p1=120 p1=115 p1=110 p1=105 p1=100
Condesationzone
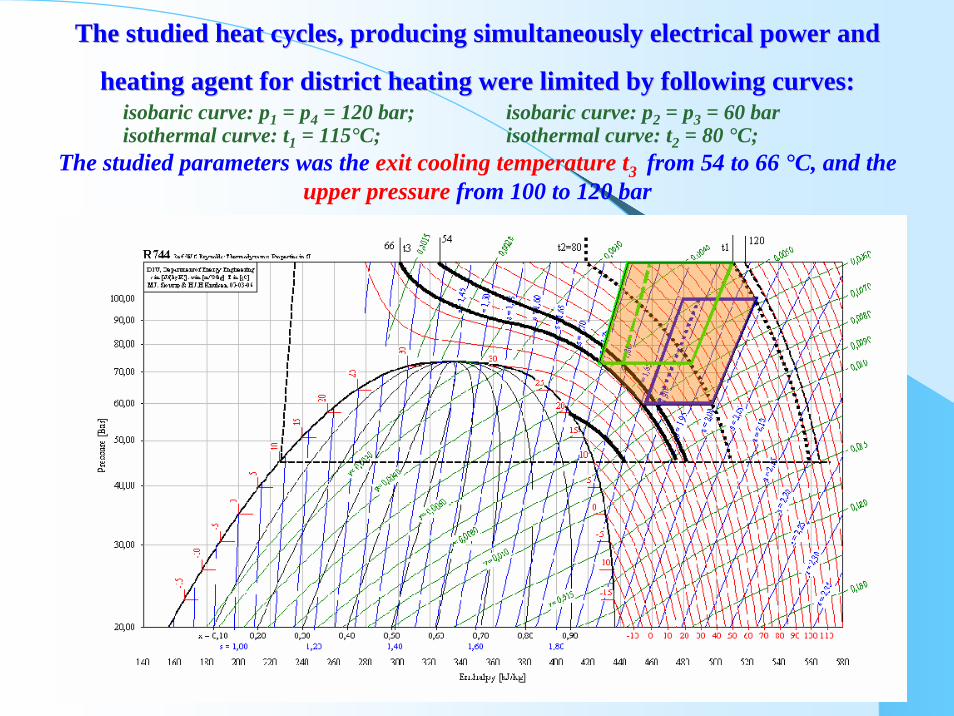
The studied heat cycles, producing simultaneously electrical powThe studied heat cycles, producing simultaneously electrical power ander and
heating agent for district heating were limited by following curheating agent for district heating were limited by following curvesves::isobaric curve: p1 = p4 = 120 bar; isobaric curve: p2 = p3 = 60 barisothermal curve: t1 = 115°C; isothermal curve: t2 = 80 °C;
The studied parameters was the exit cooling temperature t3 from 54 to 66 °C, and theupper pressure from 100 to 120 bar

The power efficiency is decreasing with the growth of upper pressure(p1=p4) and slightly descending with growth of lowest temperature (t3=t2)
The maximum efficiency (≈ 9.13%) was provided for upper pressure 100 bar and cooling lowest temperature of 54 °C
Power efficiency of CO2 cycles producing electrical power and heat agent for district heating: t1=115°C, t2=80°C
9,02
9,04
9,06
9,08
9,1
9,12
9,14
54 56 58 60 62 64 66
Temperature t3 [°C]
Pow
er e
ffici
ency
of t
he c
ycle
t [
%]
p1=120 p1=115 p1=110 p1=105 p1=100

The study was conducted developing Excel spreadsheets using data for CO2 properties provided by:
NATIONAL INSTITUTE OF STANDARDS AND TECHNOLOGY (NIST)
and COOLPACK software
We also developed Interpolation (User Defined) Visual Basic Function to calculate the CO2properties at any given state inside the limited studied field:
-s = s (t, p)
-h= h (p, s)
-h = h (p, t)
-t= t (p) – saturation curve
-p = p (t) – saturation curve

Conclusions (I)Conclusions (I)
We can use CO2 as working fluid in power plants working on the Clausius – Rankine cycle using geothermal water as heat source, but the thermal efficiency is relatively low (≈ 12,5 %),
consisting off power efficiency only.
We can improve the power efficiency of binary cycle by :
- Working with higher upper pressures (more than 120 bar)
- Lowering the temperature of condensation agent (below 10 °C)
- Make sure that points 2 and 3 are on the saturation curve (no cooling before condensation and no overcooling of liquid CO2 are needed)
Conclusions (II)Conclusions (II)
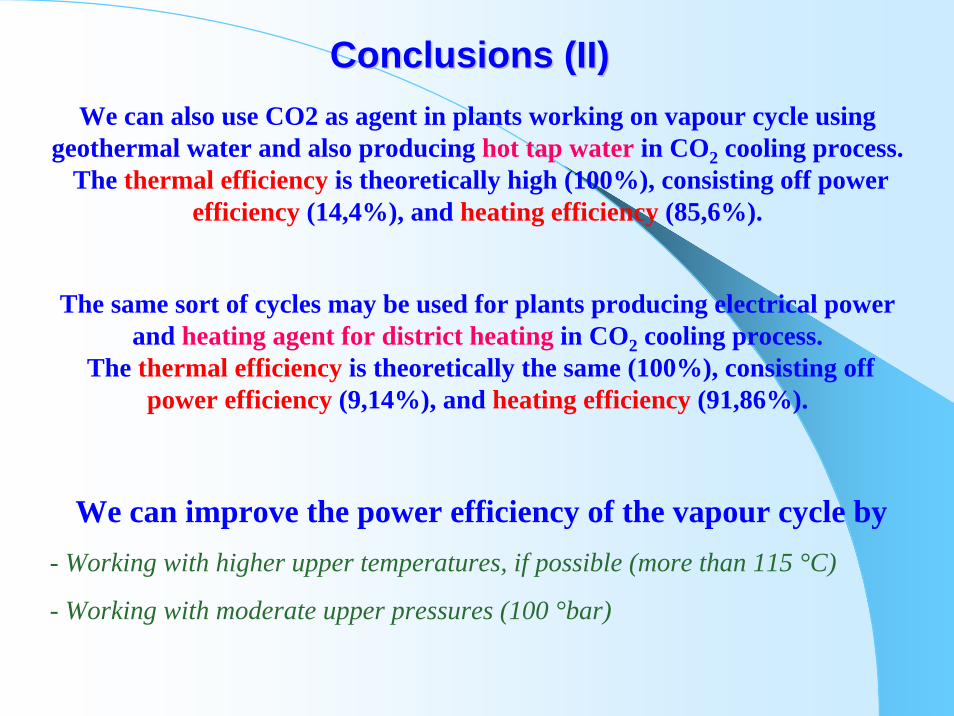
The same sort of cycles may be used for plants producing electrical power and heating agent for district heating in CO2 cooling process.
The thermal efficiency is theoretically the same (100%), consisting offpower efficiency (9,14%), and heating efficiency (91,86%).
We can also use CO2 as agent in plants working on vapour cycle using geothermal water and also producing hot tap water in CO2 cooling process.
The thermal efficiency is theoretically high (100%), consisting off power efficiency (14,4%), and heating efficiency (85,6%).
We can improve the power efficiency of the vapour cycle by- Working with higher upper temperatures, if possible (more than 115 °C)
- Working with moderate upper pressures (100 °bar)