Study on behalf of Interpharma and Novartis The ... · List of tables ... pharmaceutical companies...
29
Final report Tim Wilsdon, Eva Fiz and Hugh Kirkpatrick Study on behalf of Interpharma and Novartis The international impact of Swiss drug regulation
Transcript of Study on behalf of Interpharma and Novartis The ... · List of tables ... pharmaceutical companies...
Final reportTim Wilsdon, Eva Fiz and Hugh Kirkpatrick
Study on behalf of Interpharma and Novartis
The international impact of Swiss drug regulation
Table of contents
Executive summary . . . . . . . . . . . . . . . . . . . . . . . . . . . . . . . . . . . . . . . 4
1 Introduction . . . . . . . . . . . . . . . . . . . . . . . . . . . . . . . . . . . . . . . . . . . 101 .1 International reference pricing (IRP) . . . . . . . . . . . . . . . . . . . . . . . . . . . 101 .2 Existing literature on the impact of IRP . . . . . . . . . . . . . . . . . . . . . . . . 121 .3 Structure of the report . . . . . . . . . . . . . . . . . . . . . . . . . . . . . . . . . . . . . 16
2 The global impact of a Swiss price reduction . . . . . . . . . . . . . . . 172 .1 Countries affected by a Swiss price reduction . . . . . . . . . . . . . . . . . . . 172 .2 Global cost of a hypothetical price reduction in Switzerland . . . . . . . . 202 .2 .1 Taking into account the impact on other countries
with administered prices . . . . . . . . . . . . . . . . . . . . . . . . . . . . . . . . . . . 222 .2 .2 Taking into account the global evolution of IRP . . . . . . . . . . . . . . . . . . 24
3 The impact of a Swiss price reduction on patient access . . . . . . 273 .1 Typical launch sequences . . . . . . . . . . . . . . . . . . . . . . . . . . . . . . . . . . 273 .2 The impact of a change in expectations regarding
the level of Swiss prices . . . . . . . . . . . . . . . . . . . . . . . . . . . . . . . . . . . 30
4 The benefits arising from a faster price and reimbursement system in Switzerland . . . . . . . . . . . . . . . . . . . . . 33
4 .1 The impact of a faster P&R system on international prices . . . . . . . . . . 334 .2 The relationship between price regulation and
the location of clinical trials . . . . . . . . . . . . . . . . . . . . . . . . . . . . . . . . . 354 .3 The relationship between price regulation and
foreign direct investment . . . . . . . . . . . . . . . . . . . . . . . . . . . . . . . . . . . 44
5 Conclusion . . . . . . . . . . . . . . . . . . . . . . . . . . . . . . . . . . . . . . . . . . . . 47 Appendix 1: Current IRP rules used . . . . . . . . . . . . . . . . . . . . . . . . . . . 49 List of tables . . . . . . . . . . . . . . . . . . . . . . . . . . . . . . . . . . . . . . . . . . . . 52 List of figures . . . . . . . . . . . . . . . . . . . . . . . . . . . . . . . . . . . . . . . . . . . 53
Published by: Interpharma, Association of research-based pharmaceutical companies in Switzerland, BaselNovartis International AG, Basel © Interpharma, Novartis /CRA, March 2013 Ordering address:InterpharmaPetersgraben 35, P .O . BoxCH-4003 BaselE-mail: info@interpharma .chWebsite: www .interpharma .ch Layout:Continue AG, Basel Printing:Effingerhof AG, Brugg Disponible en traduction françaiseDeutsche Übersetzung verfügbar
The international impact of Swiss drug regulation 3
Executive summary
Interpharma and Novartis asked Charles River Associates (CRA) to develop a short paper assessing the international impact of Swiss drug regulation . In par-ticular, CRA was asked to quantify the impact of a reduction in the Swiss price due to international price referencing (IRP) through modelling a hypothetical price cut and review the risk that price cuts discourage speedier access . The second task was to contrast this with the evidence that faster reimbursement of medi-cines in Switzerland would bring a series of benefits to different stakeholders .
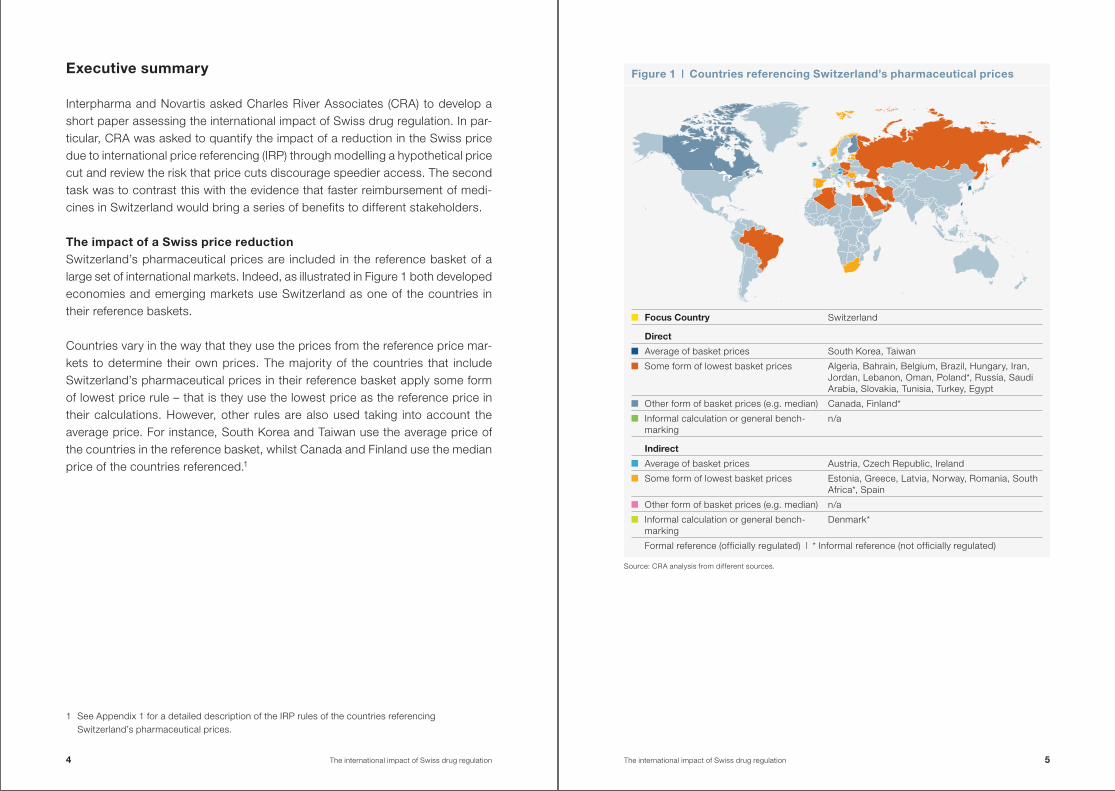
The impact of a Swiss price reductionSwitzerland’s pharmaceutical prices are included in the reference basket of a large set of international markets . Indeed, as illustrated in Figure 1 both de veloped economies and emerging markets use Switzerland as one of the countries in their reference baskets .
Countries vary in the way that they use the prices from the reference price mar-kets to determine their own prices . The majority of the countries that include Switzerland’s pharmaceutical prices in their reference basket apply some form of lowest price rule – that is they use the lowest price as the reference price in their calculations . However, other rules are also used taking into account the average price . For instance, South Korea and Taiwan use the average price of the countries in the reference basket, whilst Canada and Finland use the median price of the countries referenced .1
1 See Appendix 1 for a detailed description of the IRP rules of the countries referencing Switzerland’s pharmaceutical prices .
Figure 1 | Countries referencing Switzerland’s pharmaceutical prices
Source: CRA analysis from different sources .
Focus Country Switzerland
Direct
Average of basket prices South Korea, Taiwan
Some form of lowest basket prices Algeria, Bahrain, Belgium, Brazil, Hungary, Iran, Jordan, Lebanon, Oman, Poland*, Russia, Saudi Arabia, Slovakia, Tunisia, Turkey, Egypt
Other form of basket prices (e .g . median) Canada, Finland*
Informal calculation or general bench-marking
n/a
Indirect
Average of basket prices Austria, Czech Republic, Ireland
Some form of lowest basket prices Estonia, Greece, Latvia, Norway, Romania, South Africa*, Spain
Other form of basket prices (e .g . median) n/a
Informal calculation or general bench-marking
Denmark*
Formal reference (officially regulated) | * Informal reference (not officially regulated)
4 The international impact of Swiss drug regulation The international impact of Swiss drug regulation 5
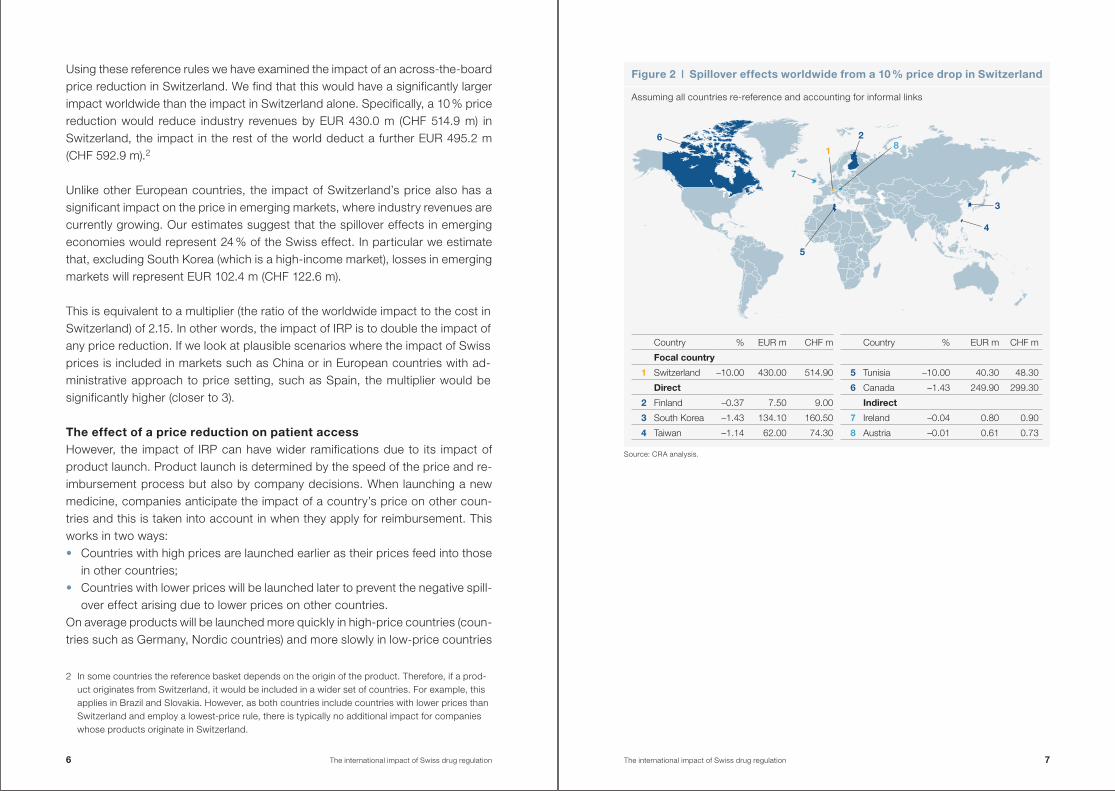
Using these reference rules we have examined the impact of an across-the-board price reduction in Switzerland . We find that this would have a significantly larger impact worldwide than the impact in Switzerland alone . Specifically, a 10 % price reduction would reduce industry revenues by EUR 430 .0 m (CHF 514 .9 m) in Switzerland, the impact in the rest of the world deduct a further EUR 495 .2 m (CHF 592 .9 m) .2
Unlike other European countries, the impact of Switzerland’s price also has a significant impact on the price in emerging markets, where industry revenues are currently growing . Our estimates suggest that the spillover effects in emerging economies would represent 24 % of the Swiss effect . In particular we estimate that, excluding South Korea (which is a high-income market), losses in emerging markets will represent EUR 102 .4 m (CHF 122 .6 m) .
This is equivalent to a multiplier (the ratio of the worldwide impact to the cost in Switzerland) of 2 .15 . In other words, the impact of IRP is to double the impact of any price reduction . If we look at plausible scenarios where the impact of Swiss prices is included in markets such as China or in European countries with ad-ministrative approach to price setting, such as Spain, the multiplier would be significantly higher (closer to 3) .
The effect of a price reduction on patient accessHowever, the impact of IRP can have wider ramifications due to its impact of product launch . Product launch is determined by the speed of the price and re-imbursement process but also by company decisions . When launching a new medicine, companies anticipate the impact of a country’s price on other coun-tries and this is taken into account in when they apply for reimbursement . This works in two ways: • Countries with high prices are launched earlier as their prices feed into those
in other countries; • Countries with lower prices will be launched later to prevent the negative spill-
over effect arising due to lower prices on other countries .On average products will be launched more quickly in high-price countries (coun-tries such as Germany, Nordic countries) and more slowly in low-price countries
2 In some countries the reference basket depends on the origin of the product . Therefore, if a prod-uct originates from Switzerland, it would be included in a wider set of countries . For example, this applies in Brazil and Slovakia . However, as both countries include countries with lower prices than Switzerland and employ a lowest-price rule, there is typically no additional impact for companies whose products originate in Switzerland .
Figure 2 | Spillover effects worldwide from a 10 % price drop in Switzerland
Assuming all countries re-reference and accounting for informal links
7
1
28
3
5
4
6
Source: CRA analysis .
Country % EUR m CHF m
Focal country
1 Switzerland –10 .00 430 .00 514 .90
Direct
2 Finland –0 .37 7 .50 9 .00
3 South Korea –1 .43 134 .10 160 .50
4 Taiwan –1 .14 62 .00 74 .30
Country % EUR m CHF m
5 Tunisia –10 .00 40 .30 48 .30
6 Canada –1 .43 249 .90 299 .30
Indirect
7 Ireland –0 .04 0 .80 0 .90
8 Austria –0 .01 0 .61 0 .73
6 The international impact of Swiss drug regulation The international impact of Swiss drug regulation 7
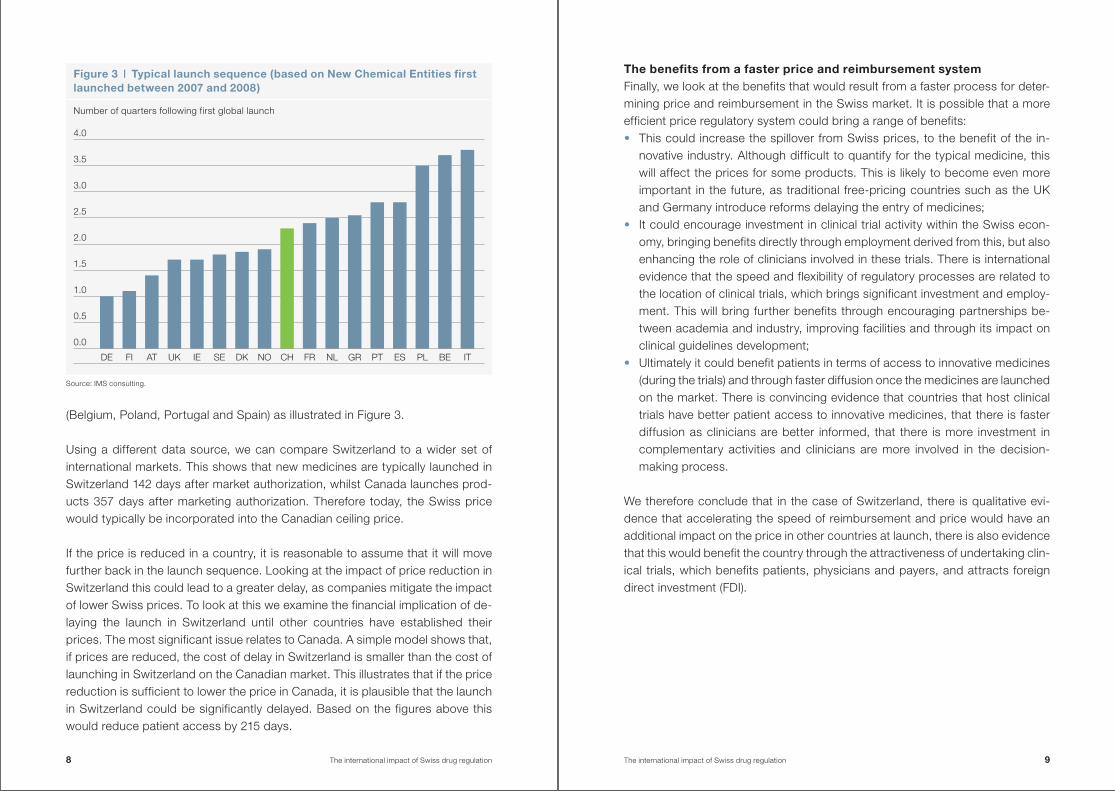
(Belgium, Poland, Portugal and Spain) as illustrated in Figure 3 .
Using a different data source, we can compare Switzerland to a wider set of inter national markets . This shows that new medicines are typically launched in Switzerland 142 days after market authorization, whilst Canada launches prod-ucts 357 days after marketing authorization . Therefore today, the Swiss price would typically be incorporated into the Canadian ceiling price .
If the price is reduced in a country, it is reasonable to assume that it will move further back in the launch sequence . Looking at the impact of price reduction in Switzerland this could lead to a greater delay, as companies mitigate the impact of lower Swiss prices . To look at this we examine the financial implication of de-laying the launch in Switzerland until other countries have established their prices . The most significant issue relates to Canada . A simple model shows that, if prices are reduced, the cost of delay in Switzerland is smaller than the cost of launching in Switzerland on the Canadian market . This illustrates that if the price reduction is sufficient to lower the price in Canada, it is plausible that the launch in Switzerland could be significantly delayed . Based on the figures above this would reduce patient access by 215 days .
The benefits from a faster price and reimbursement systemFinally, we look at the benefits that would result from a faster process for deter-mining price and reimbursement in the Swiss market . It is possible that a more efficient price regulatory system could bring a range of benefits: • This could increase the spillover from Swiss prices, to the benefit of the in-
nova tive industry . Although difficult to quantify for the typical medicine, this will affect the prices for some products . This is likely to become even more important in the future, as traditional free-pricing countries such as the UK and Germany introduce reforms delaying the entry of medicines;
• It could encourage investment in clinical trial activity within the Swiss econ-omy, bringing benefits directly through employment derived from this, but also enhancing the role of clinicians involved in these trials . There is international evidence that the speed and flexibility of regulatory processes are related to the location of clinical trials, which brings significant investment and employ-ment . This will bring further benefits through encouraging partnerships be-tween academia and industry, improving facilities and through its impact on clinical guidelines development;
• Ultimately it could benefit patients in terms of access to innovative medicines (during the trials) and through faster diffusion once the medicines are launched on the market . There is convincing evidence that countries that host clinical trials have better patient access to innovative medicines, that there is faster diffusion as clinicians are better informed, that there is more investment in complementary activities and clinicians are more involved in the decision-making process .
We therefore conclude that in the case of Switzerland, there is qualitative evi-dence that accelerating the speed of reimbursement and price would have an additional impact on the price in other countries at launch, there is also evidence that this would benefit the country through the attractiveness of undertaking clin-ical trials, which benefits patients, physicians and payers, and attracts foreign direct investment (FDI) .
Figure 3 | Typical launch sequence (based on New Chemical Entities first launched between 2007 and 2008)
Number of quarters following first global launch
Source: IMS consulting .
0.0
DE FI AT UK IE SE DK NO CH FR NL GR PT ES PL BE IT
0.5
1.0
1.5
2.0
2.5
3.0
3.5
4.0
8 The international impact of Swiss drug regulation The international impact of Swiss drug regulation 9
1 Introduction
Interpharma and Novartis asked Charles River Associates (CRA) to develop a short paper assessing the international impact of Swiss drug regulation . In par-ticular, CRA was asked to:1 . Quantify the impact of a reduction in the Swiss price due to international ref-
erence pricing (IRP) through modelling a hypothetical price cut . Where IRP is the practice, common in a majority of European countries, of using the prices from a basket of other countries to set national pharmaceutical prices;
2 . Review the risk that price cuts discourage speedier access in Switzerland as Switzerland may move further back in the launch sequence when companies are launching innovative medicines;
3 . Contrast this with the evidence that faster reimbursement of medicines in Switzerland would bring a series of benefits to different stakeholders .
1 .1 International reference pricing (IRP)IRP has been around for a very long time but more and more countries are using IRP-based systems . IRP is the practice, common in a majority of European coun-tries, of using the prices from a basket of other countries to set national pharma-ceutical prices .3 This directly links the price in one pharmaceutical market to those in other pharmaceutical markets . There are a range of different ways that IRP can be applied: • Formal versus informal – where a formal IRP system is defined as a set of rules
by which the prices in a basket of countries are used in a formula to determine prices . In contrast, an informal system where the way prices are used and the inclusion of particular countries are determined on an ad hoc basis .
• At launch versus updated over time – many IRP systems are used when a product is launched onto the market but some of these are subsequently up-dated over time . Over recent years we have seen more systems update their prices . This can occur at regular intervals or at the discretion of the payer . With the benefit of modern computer data systems, it is relatively easy to update the international price comparisons and apply a succession of price cuts country by country for established products .
3 We use the term international reference pricing (IRP) through this report . It is also known as external reference pricing; in both cases this refers to the practice by which a country sets phar-maceutical prices based on a comparison with prices in other countries .
• Used as the primary method or as part of a system of price determination – for example, following reforms in 2011, Germany uses IRP but this is only used if other methods of determining prices are not possible (internal reference pricing or a negotiation with the manufacturer) .
• The pricing rule – even once the reference basket has been determined, the method of calculating the IRP can vary dramatically . This could use the aver-age price of all the countries in the reference basket or the lowest price or al-lowing for some adjustment (for example, an arbitrary difference of 10 %) .
The impact of international reference pricing can work in two ways, firstly, coun-tries might use IRP themselves to determine prices . For example, in Switzerland, IRP is used to determine reimbursement of new drugs . Drug reimbursement is based on the average price in six reference countries (Austria, Denmark, France, Germany, the Netherlands and United Kingdom) . According to the current IRP rules, prices are reviewed every three years . If after the re-evaluation the Swiss price is higher than the reference price, the price is then reduced .4 IRP therefore has a direct effect on the prices in Switzerland when prices in other markets change .
This is complicated by changes in the exchange rate – where it is typical for IRP to be updated when this results in a price reduction but not when it would result in prices rising . When the Swiss authorities use IRP to update drug prices in Switzerland, average exchange rates are taken into consideration using the aver-age rates over the previous 12 months . This has led to substantial price reduc-tions as the Swiss franc has been relatively stronger in recent years .5
Secondly, countries can be affected by being included in the IRP regimes in other countries . This can occur directly or indirectly . A direct effect arises when coun-try X references the prices in country Y . However, country Y can also have an in-direct effect on country Z, as it references country X (which was affected by the prices in country Y) .
4 Global Insight, Healthcare & Pharma – P&R Policy Database, November 2012 .5 The difficulties associated to changes in exchange rates were commented on by the Secretary
General of Interpharma and reported in “Swiss pharma market shrank for first time in 2010”, February 2011, The pharma letter .
10 The international impact of Swiss drug regulation The international impact of Swiss drug regulation 11
This report is not about the impact of IRP on Swiss prices but rather about how the referencing of Switzerland (because other countries use IRP) can propagate the impact of changes in prices in Switzerland .6
1 .2 Existing literature on the impact of IRPThe issues associated to IRP have been examined in many academic, industry and government reports . For example, the OECD (2008) sets out the difficulties that IRP can introduce .7 This identified that IRP reduces the ability to price to market and contributed to convergence of list prices and provides manufactur-ers with incentives to delay launch in lower-priced markets where there is risk of spillover .
There is a growing literature on impact of IRP on the countries that are them-selves being referenced . The most well-known paper is Danzon and Epstein (2008) . This examines the effect of price regulation and competition on launch timing and pricing of new drugs .8 Based on data covering the launch experience in 15 countries for drugs in 12 therapeutic classes they found that launch timing and prices of innovative drugs are influenced by prices of established products . Thus, if price regulation reduces drug prices, it contributes to launch delay in the home country .
The impact of regulation on delaying entry has been further examined by Heuer, Mejer and Neuhaus (2007) . They find international price comparisons have a sig-nificantly negative impact on the timing of new drug launches . Using the IMS data base they identified a total of 132 new product launches in the EU15 coun-tries between January 1995 and December 2005 . The average launch delay in each country ranges from 3 .5 months in Germany to 18 .9 months in Belgium . The maximum delay goes up to 50 months in several countries (Portugal, Italy, Greece, France, Belgium) with the highest observed delay occurring in Sweden (88 months) . In order to estimate impacts on the launch delay of new products, they apply statistical techniques to estimate the probability of launch in a period
6 It is possible that a price change in Switzerland could affect other countries and these could subsequently be referenced by Switzerland . This circularity, although possible, rarely occurs in practice .
7 Docteur, E ., “Value for money and valued innovation: A trade-off or mutually compatible goals?”, Deputy Head of OECD Health Division, OECD High-Level Symposium on Pharmaceutical Pricing
Policy, 27 . October 2008 .8 Danzon, P . M ., Epstein, A . J ., “Effect of regulation on drug launch and pricing in
interdependent markets”, Working Paper 14041, National Bureau Of Economic Research, 2008, http://www .nber .org/papers/w14041 .
of time . Countries using international comparison to determine their prices experi ence a significantly lower probability of launch within the first eight months than countries that do not use it .
Most recently, the Office of Health Economics (OHE) has considered the prob-lem caused by IRP, finding that in the more extreme cases, companies might opt out of, or refuse to negotiate with some national health systems to avoid knock - on effects on prices in other countries .9 Countries with lower prices may lose out when their prices are subject to IRP by other countries as companies mitigate the impact of lower prices on other markets . The OHE concludes from this that differential pricing is win-win that would remove the problem of IRP .
There is therefore evidence IRP leads to a negative spillover effect onto other markets, and impacts the speed of access for a given market . In addition, to an academic literature on the impact of IRP, a number of European Commission re-ports have investigated this .
For example, ECORYS (2009) found that the practice of referring to other coun-tries’ pricing and reimbursement decisions before a country takes its own deci-sion seems to amplify the delays resulting from the process of estimating prices and reimbursement levels in national markets . They estimated the cost of IRP in terms of delayed entry . Based on a small sample they estimated that the benefits of a simultaneous introduction in all 27 Member States, in terms of additional (earlier) revenues for firms alone, could add up to between EUR 35 m and EUR 100 m per product for the products in their sample . They recommended that best practice would be to “progressively move away from the practice of inter-national reference pricing that may delay market entry and create adverse launch incentives, towards greater use of health-assessment-based evaluation of pharmaceuticals” .10
9 Grau, M ., “Pharmaceutical pricing in Europe: is differential pricing a win-win solution?”, Office of Health Economics Occasional Paper 11/01, 11 February 2011 .
10 ECORYS, “Competitiveness of the EU Market and Industry for Pharmaceuticals Volume I: Welfare Implications of Regulation Final report”, a report for DG Enterprise .
12 The international impact of Swiss drug regulation The international impact of Swiss drug regulation 13
The problem of being referenced has been discussed in a recent report for the European Commission . This illustrated that many of the problems are well known but that convincing data remains limited .11 This report argues that IRP has re-sulted in price convergence12 and using IRP where there are currency differ-ences can result in unstable prices with the result that “manufacturers are likely not to launch a product in a certain country if that country’s price influences third countries, or it is likely to be too low and, therefore, encourages parallel exports” .13 The report goes on to assert “In some cases a low price for a new product in one national market can lead manufacturers to refrain from launching the product in other markets, since the low price might jeopardize their pricing prospects else-where due to the wide application of external price referencing .” However, this report provides little actual evidence on the impact of international reference pricing – indeed they conclude “launch delays, due to strategic considerations arising from the knock-on effect of external price referencing ought to be stud-ied, and their extent identified” . They also conclude that the policy implications for this are that best practice IRP should focus on average rather than minimum prices .
Finally, IRP has been examined in a recent paper written on behalf of the Direct-orate-General for Economic and Financial Affairs . They find that although IRP can lead to short-term cost savings there are also significant concerns . There is a risk that too low prices may lead to access problems as companies may post-pone or not introduce pharmaceuticals in lower-price countries . Also, importing prices of other countries implies importing their healthcare priorities, which may not correspond to the health needs of the population at stake .14
11 “Differences in costs and access to pharmaceutical products in the EU”, Directorate-General For Internal Policies 2011 .
12 Kanavos P ., Vandoros S ., “Determinants of price differences in OECD countries”, Health Economics Policy and Law, forthcoming, 2011 .
13 Kanavos P ., Vandoros S ., “Competition in Prescription Drug Markets: Is Parallel Trade the Answer?”, Managerial and Decision Economics, 31(5), 2010 .
14 Carone, G ., Schwierz, C ., Xavier, A ., “Cost-containment policies in public pharmaceutical spending in the EU”, Economic Papers 461, September 2012 .
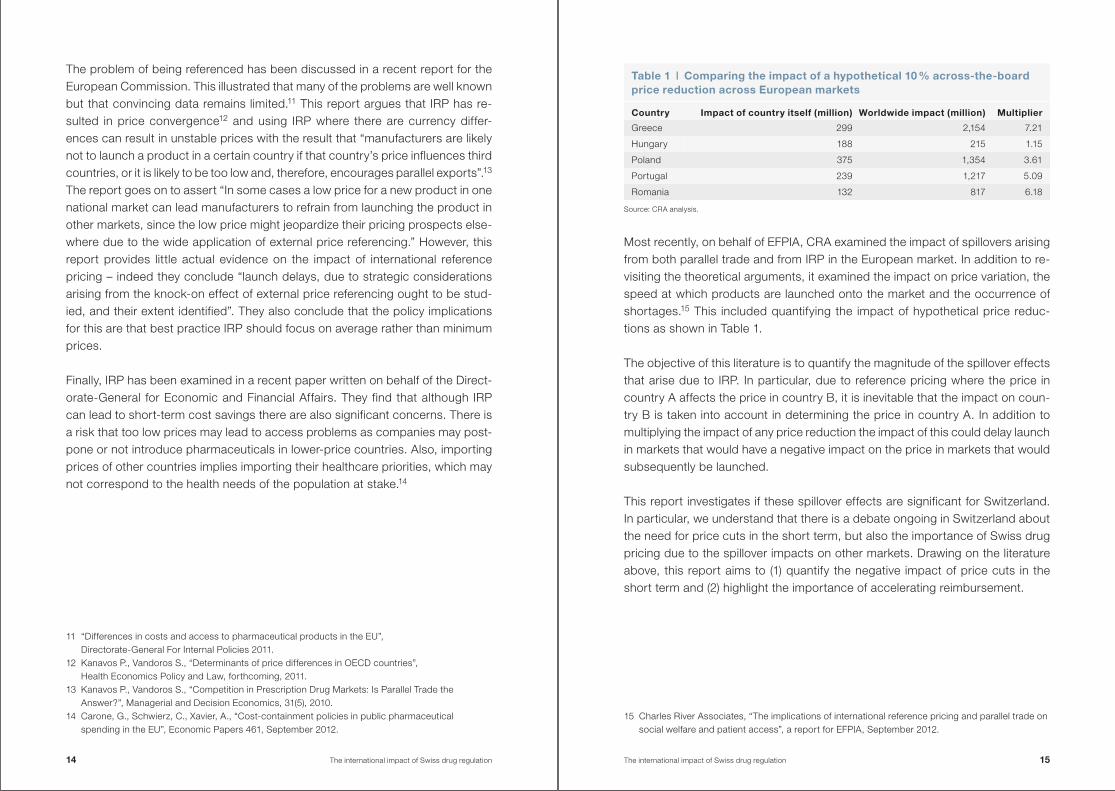
Most recently, on behalf of EFPIA, CRA examined the impact of spillovers arising from both parallel trade and from IRP in the European market . In addition to re-visiting the theoretical arguments, it examined the impact on price variation, the speed at which products are launched onto the market and the occurrence of shortages .15 This included quantifying the impact of hypothetical price reduc-tions as shown in Table 1 .
The objective of this literature is to quantify the magnitude of the spillover effects that arise due to IRP . In particular, due to reference pricing where the price in country A affects the price in country B, it is inevitable that the impact on coun-try B is taken into account in determining the price in country A . In addition to multiplying the impact of any price reduction the impact of this could delay launch in markets that would have a negative impact on the price in markets that would subsequently be launched .
This report investigates if these spillover effects are significant for Switzerland . In particular, we understand that there is a debate ongoing in Switzerland about the need for price cuts in the short term, but also the importance of Swiss drug pricing due to the spillover impacts on other markets . Drawing on the literature above, this report aims to (1) quantify the negative impact of price cuts in the short term and (2) highlight the importance of accelerating reimbursement .
15 Charles River Associates, “The implications of international reference pricing and parallel trade on social welfare and patient access”, a report for EFPIA, September 2012 .
Table 1 | Comparing the impact of a hypothetical 10 % across-the-board price reduction across European markets
Country Impact of country itself (million) Worldwide impact (million) Multiplier
Greece 299 2,154 7 .21
Hungary 188 215 1 .15
Poland 375 1,354 3 .61
Portugal 239 1,217 5 .09
Romania 132 817 6 .18
Source: CRA analysis .
14 The international impact of Swiss drug regulation The international impact of Swiss drug regulation 15
1 .3 Structure of the reportThe rest of the report is structured as follows: • In Chapter 2, we estimate the global impact that a price reduction in Switzer-
land will have in terms of industry revenue by extending the hypothetical model that CRA developed for EFPIA and PhRMA;
• In Chapter 3, we look at the impact that price reductions would have on the launch of new medicines in Switzerland and therefore on patient access;
• In Chapter 4, we explore the benefits that could occur due to a faster price and reimbursement process in Switzerland .
We also include an appendix that summarizes the assumptions we have made regarding the countries that include Switzerland in their IRP systems .
2 The global impact of a Swiss price reduction
In this chapter we investigate the impact a Swiss price cut would have in terms of industry revenue worldwide due to IRP and how this compares to the loss result-ing from the price reduction in Switzerland itself . We first present the list of coun-tries that refer to Switzerland in their IRP rules directly or indirectly (via the impact on another market) in establishing their prices . This draws on a range of sources: • The latest information available in Global Insights; • The published economic literature (including recent European Commission
reviews); • Internal analysis undertaken by an international pharmaceutical company to
check whether the relationships are actually applied in practice .
We then use the IRP rules applied in these markets in order to estimate the im-pact of a hypothetical 10 % across-the-board price reduction in Switzerland .
2 .1 Countries affected by a Swiss price reductionSwitzerland is included directly in the reference basket of twenty different mar-kets, specifically, Algeria, Bahrain, Belgium, Brazil, Canada, Egypt, Finland, Hun-gary, Iran, Jordan, Lebanon, Oman, Poland, Russia, Saudi Arabia, Slovakia, South Korea, Taiwan, Tunisia and Turkey . This includes both developed econ-omies but also emerging markets that use Switzerland as one of the countries in their reference baskets . Countries that include Switzerland in their reference bas-ket are not the only ones potentially affected by a Swiss price cut . In fact, coun-tries that directly reference the markets listed above are indirectly affected by a Swiss price cut .16 Figure 4 illustrates all the countries that directly or indirectly use Swiss prices in their reference basket .
In order to model the impact of a price reduction, we also need to take into ac-count the way that prices are calculated . A variety of price-setting rules are used by countries referencing Switzerland, both directly and indirectly . For instance, countries like Canada and Taiwan always include Swiss prices when using IRP, whereas countries such as Brazil and Slovakia only include Switzerland in their reference basket if it is the medicines country of origin . This means that Switzer-land will only be included when referring to a medicine originating in Switzerland .
16 Eleven countries indirectly reference Switzerland: Austria, Czech Republic, Denmark, Estonia, Greece, Ireland, Latvia, Norway, Romania, South Africa and Spain .
16 The international impact of Swiss drug regulation The international impact of Swiss drug regulation 17
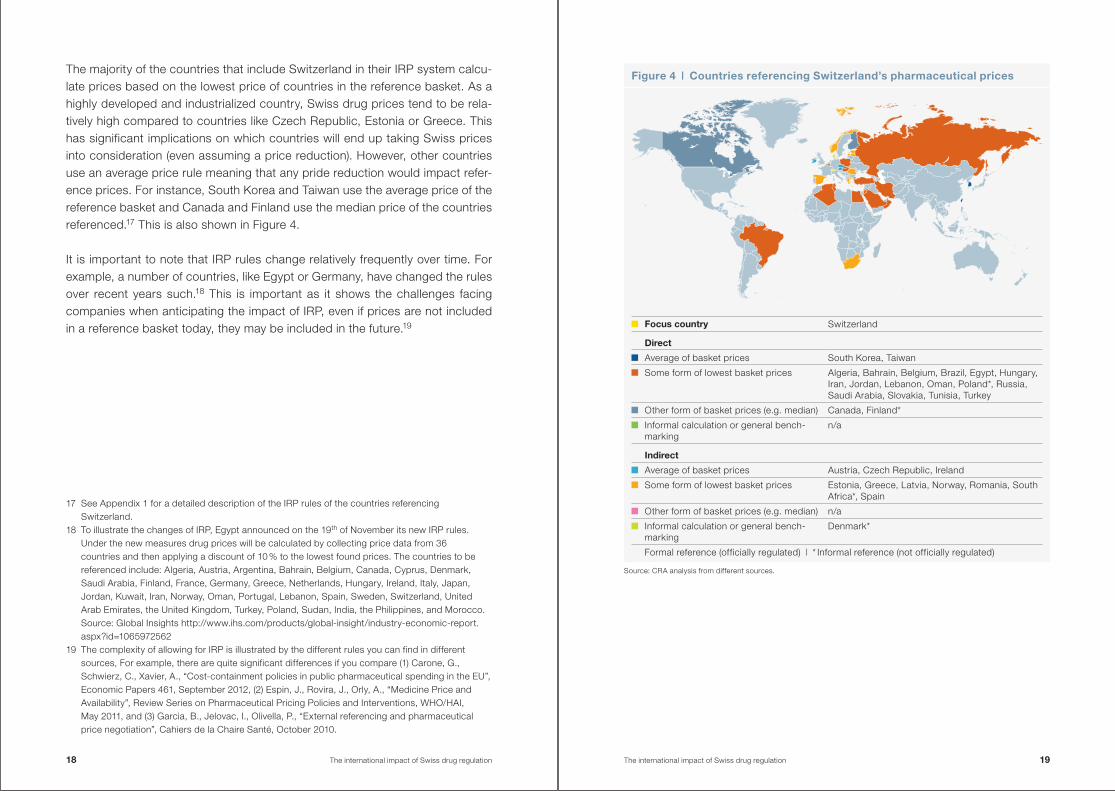
The majority of the countries that include Switzerland in their IRP system calcu-late prices based on the lowest price of countries in the reference basket . As a highly developed and industrialized country, Swiss drug prices tend to be rela-tively high compared to countries like Czech Republic, Estonia or Greece . This has significant implications on which countries will end up taking Swiss prices into consideration (even assuming a price reduction) . However, other countries use an average price rule meaning that any pride reduction would impact refer-ence prices . For instance, South Korea and Taiwan use the average price of the reference basket and Canada and Finland use the median price of the countries referenced .17 This is also shown in Figure 4 .
It is important to note that IRP rules change relatively frequently over time . For example, a number of countries, like Egypt or Germany, have changed the rules over recent years such .18 This is important as it shows the challenges facing companies when anticipating the impact of IRP, even if prices are not included in a reference basket today, they may be included in the future .19
17 See Appendix 1 for a detailed description of the IRP rules of the countries referencing Switzerland .
18 To illustrate the changes of IRP, Egypt announced on the 19th of November its new IRP rules . Under the new measures drug prices will be calculated by collecting price data from 36 countries and then applying a discount of 10 % to the lowest found prices . The countries to be referenced include: Algeria, Austria, Argentina, Bahrain, Belgium, Canada, Cyprus, Denmark, Saudi Arabia, Finland, France, Germany, Greece, Netherlands, Hungary, Ireland, Italy, Japan, Jordan, Kuwait, Iran, Norway, Oman, Portugal, Lebanon, Spain, Sweden, Switzerland, United Arab Emirates, the United Kingdom, Turkey, Poland, Sudan, India, the Philippines, and Morocco . Source: Global Insights http://www .ihs .com/products/global-insight/industry-economic-report .aspx?id=1065972562
19 The complexity of allowing for IRP is illustrated by the different rules you can find in different sources, For example, there are quite significant differences if you compare (1) Carone, G ., Schwierz, C ., Xavier, A ., “Cost-containment policies in public pharmaceutical spending in the EU”, Economic Papers 461, September 2012, (2) Espin, J ., Rovira, J ., Orly, A ., “Medicine Price and Availability”, Review Series on Pharmaceutical Pricing Policies and Interventions, WHO/HAI, May 2011, and (3) Garcia, B ., Jelovac, I ., Olivella, P ., “External referencing and pharmaceutical price negotiation”, Cahiers de la Chaire Santé, October 2010 .
Figure 4 | Countries referencing Switzerland’s pharmaceutical prices
Source: CRA analysis from different sources .
Focus country Switzerland
Direct
Average of basket prices South Korea, Taiwan
Some form of lowest basket prices Algeria, Bahrain, Belgium, Brazil, Egypt, Hungary, Iran, Jordan, Lebanon, Oman, Poland*, Russia, Saudi Arabia, Slovakia, Tunisia, Turkey
Other form of basket prices (e .g . median) Canada, Finland*
Informal calculation or general bench-marking
n/a
Indirect
Average of basket prices Austria, Czech Republic, Ireland
Some form of lowest basket prices Estonia, Greece, Latvia, Norway, Romania, South Africa*, Spain
Other form of basket prices (e .g . median) n/a
Informal calculation or general bench-marking
Denmark*
Formal reference (officially regulated) | * Informal reference (not officially regulated)
18 The international impact of Swiss drug regulation The international impact of Swiss drug regulation 19
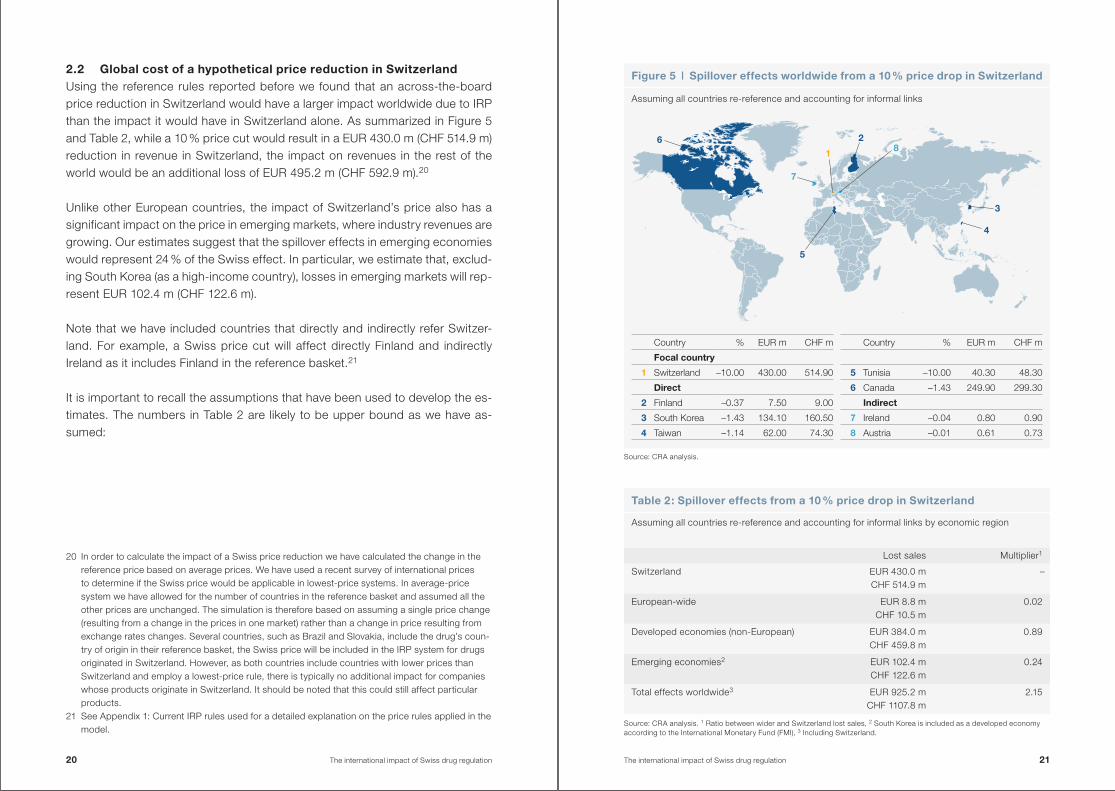
2 .2 Global cost of a hypothetical price reduction in SwitzerlandUsing the reference rules reported before we found that an across-the-board price reduction in Switzerland would have a larger impact worldwide due to IRP than the impact it would have in Switzerland alone . As summarized in Figure 5 and Table 2, while a 10 % price cut would result in a EUR 430 .0 m (CHF 514 .9 m) reduction in revenue in Switzerland, the impact on revenues in the rest of the world would be an additional loss of EUR 495 .2 m (CHF 592 .9 m) .20
Unlike other European countries, the impact of Switzerland’s price also has a significant impact on the price in emerging markets, where industry revenues are growing . Our estimates suggest that the spillover effects in emerging economies would represent 24 % of the Swiss effect . In particular, we estimate that, exclud-ing South Korea (as a high-income country), losses in emerging markets will rep-resent EUR 102 .4 m (CHF 122 .6 m) .
Note that we have included countries that directly and indirectly refer Switzer-land . For example, a Swiss price cut will affect directly Finland and indirectly Ireland as it includes Finland in the reference basket .21
It is important to recall the assumptions that have been used to develop the es-timates . The numbers in Table 2 are likely to be upper bound as we have as-sumed:
20 In order to calculate the impact of a Swiss price reduction we have calculated the change in the reference price based on average prices . We have used a recent survey of international prices to determine if the Swiss price would be applicable in lowest-price systems . In average-price system we have allowed for the number of countries in the reference basket and assumed all the other prices are unchanged . The simulation is therefore based on assuming a single price change (resulting from a change in the prices in one market) rather than a change in price resulting from exchange rates changes . Several countries, such as Brazil and Slovakia, include the drug’s coun-try of origin in their reference basket, the Swiss price will be included in the IRP system for drugs originated in Switzerland . However, as both countries include countries with lower prices than Switzerland and employ a lowest-price rule, there is typically no additional impact for companies whose products originate in Switzerland . It should be noted that this could still affect particular products .
21 See Appendix 1: Current IRP rules used for a detailed explanation on the price rules applied in the model .
Source: CRA analysis . 1 Ratio between wider and Switzerland lost sales, 2 South Korea is included as a developed economy according to the International Monetary Fund (FMI), 3 Including Switzerland .
Table 2: Spillover effects from a 10 % price drop in Switzerland
Assuming all countries re-reference and accounting for informal links by economic region
Lost sales Multiplier1
Switzerland EUR 430 .0 mCHF 514 .9 m
–
European-wide EUR 8 .8 mCHF 10 .5 m
0 .02
Developed economies (non-European) EUR 384 .0 mCHF 459 .8 m
0 .89
Emerging economies2 EUR 102 .4 mCHF 122 .6 m
0 .24
Total effects worldwide3 EUR 925 .2 mCHF 1107 .8 m
2 .15
Figure 5 | Spillover effects worldwide from a 10 % price drop in Switzerland
Assuming all countries re-reference and accounting for informal links
7
1
28
3
5
4
6
Country % EUR m CHF m
Focal country
1 Switzerland –10 .00 430 .00 514 .90
Direct
2 Finland –0 .37 7 .50 9 .00
3 South Korea –1 .43 134 .10 160 .50
4 Taiwan –1 .14 62 .00 74 .30
Country % EUR m CHF m
5 Tunisia –10 .00 40 .30 48 .30
6 Canada –1 .43 249 .90 299 .30
Indirect
7 Ireland –0 .04 0 .80 0 .90
8 Austria –0 .01 0 .61 0 .73
Source: CRA analysis .
20 The international impact of Swiss drug regulation The international impact of Swiss drug regulation 21
• Both formal and informal reference baskets are updated; • Included second round (indirect) effects (i .e . the impact of the country that
references Switzerland and the impact that countries referencing these), so implicitly assumes a round of updating;
• All countries have a comparable product on the market that can be referenced to the Swiss product;
• Simplification of the impact by determining the average changes based on the number of countries in the reference price rules .
2 .2 .1 Taking into account the impact on other countries with administered prices
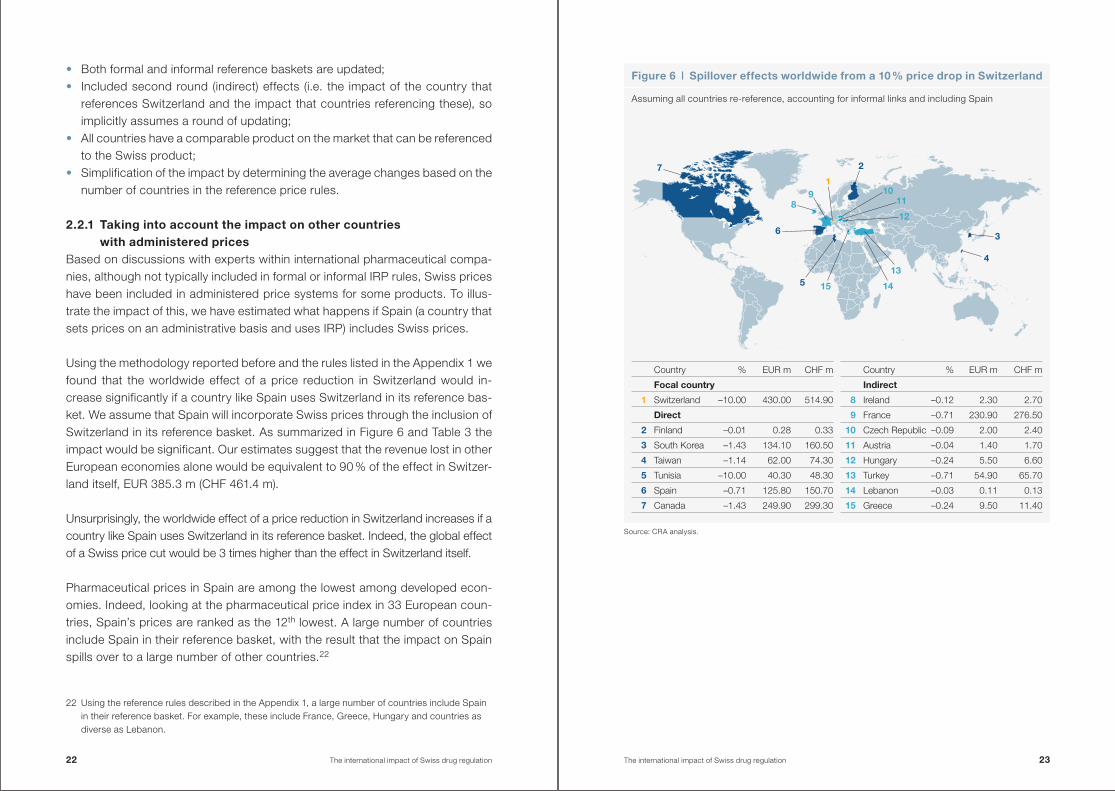
Based on discussions with experts within international pharmaceutical compa-nies, although not typically included in formal or informal IRP rules, Swiss prices have been included in administered price systems for some products . To illus-trate the impact of this, we have estimated what happens if Spain (a country that sets prices on an administrative basis and uses IRP) includes Swiss prices .
Using the methodology reported before and the rules listed in the Appendix 1 we found that the worldwide effect of a price reduction in Switzerland would in-crease significantly if a country like Spain uses Switzerland in its reference bas-ket . We assume that Spain will incorporate Swiss prices through the inclusion of Switzerland in its reference basket . As summarized in Figure 6 and Table 3 the impact would be significant . Our estimates suggest that the revenue lost in other European economies alone would be equivalent to 90 % of the effect in Switzer-land itself, EUR 385 .3 m (CHF 461 .4 m) .
Unsurprisingly, the worldwide effect of a price reduction in Switzerland increases if a country like Spain uses Switzerland in its reference basket . Indeed, the global effect of a Swiss price cut would be 3 times higher than the effect in Switzerland itself .
Pharmaceutical prices in Spain are among the lowest among developed econ-omies . Indeed, looking at the pharmaceutical price index in 33 European coun-tries, Spain’s prices are ranked as the 12th lowest . A large number of countries include Spain in their reference basket, with the result that the impact on Spain spills over to a large number of other countries .22
22 Using the reference rules described in the Appendix 1, a large number of countries include Spain in their reference basket . For example, these include France, Greece, Hungary and countries as diverse as Lebanon .
Figure 6 | Spillover effects worldwide from a 10 % price drop in Switzerland
Assuming all countries re-reference, accounting for informal links and including Spain
89
1
2
1011
12
3
5 15 14
413
7
6
Source: CRA analysis .
Country % EUR m CHF m
Focal country
1 Switzerland –10 .00 430 .00 514 .90
Direct
2 Finland –0 .01 0 .28 0 .33
3 South Korea –1 .43 134 .10 160 .50
4 Taiwan –1 .14 62 .00 74 .30
5 Tunisia –10 .00 40 .30 48 .30
6 Spain –0 .71 125 .80 150 .70
7 Canada –1 .43 249 .90 299 .30
Country % EUR m CHF m
Indirect
8 Ireland –0 .12 2 .30 2 .70
9 France –0 .71 230 .90 276 .50
10 Czech Republic –0 .09 2 .00 2 .40
11 Austria –0 .04 1 .40 1 .70
12 Hungary –0 .24 5 .50 6 .60
13 Turkey –0 .71 54 .90 65 .70
14 Lebanon –0 .03 0 .11 0 .13
15 Greece –0 .24 9 .50 11 .40
22 The international impact of Swiss drug regulation The international impact of Swiss drug regulation 23
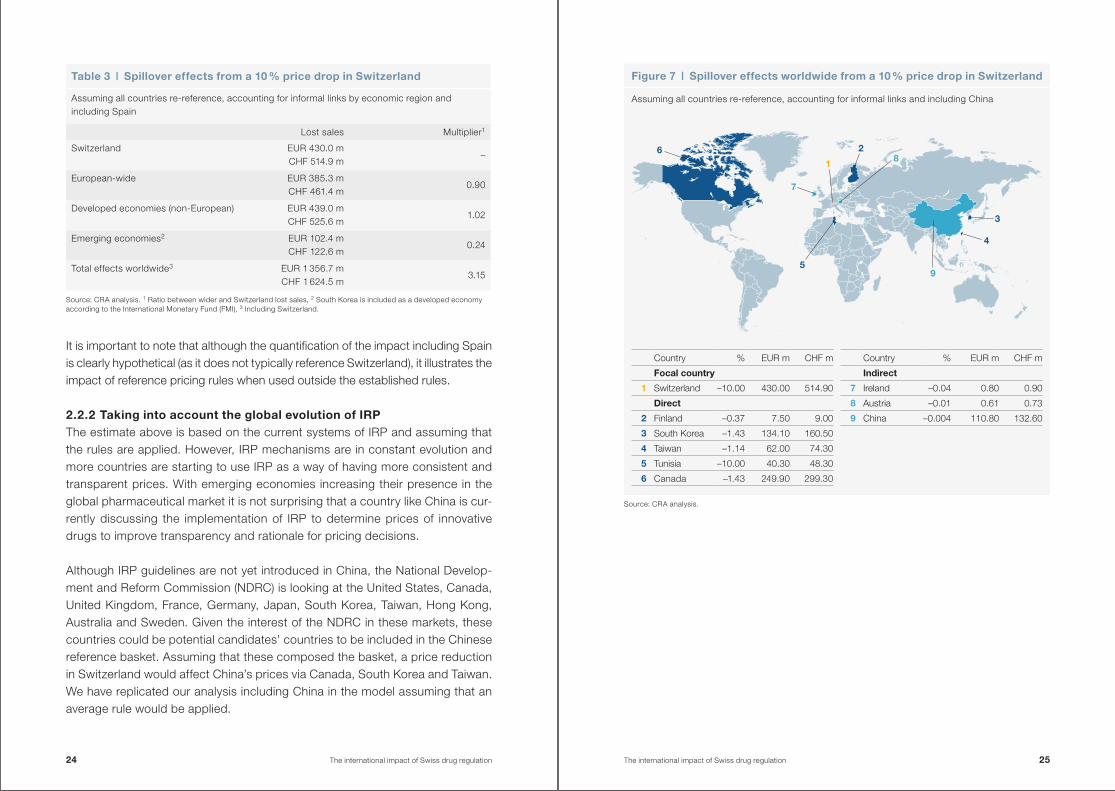
Figure 7 | Spillover effects worldwide from a 10 % price drop in Switzerland
Assuming all countries re-reference, accounting for informal links and including China
It is important to note that although the quantification of the impact including Spain is clearly hypothetical (as it does not typically reference Switzerland), it illustrates the impact of reference pricing rules when used outside the established rules .
2 .2 .2 Taking into account the global evolution of IRPThe estimate above is based on the current systems of IRP and assuming that the rules are applied . However, IRP mechanisms are in constant evolution and more countries are starting to use IRP as a way of having more consistent and transparent prices . With emerging economies increasing their presence in the global pharmaceutical market it is not surprising that a country like China is cur-rently discussing the implementation of IRP to determine prices of innovative drugs to improve transparency and rationale for pricing decisions .
Although IRP guidelines are not yet introduced in China, the National Develop-ment and Reform Commission (NDRC) is looking at the United States, Canada, United Kingdom, France, Germany, Japan, South Korea, Taiwan, Hong Kong, Australia and Sweden . Given the interest of the NDRC in these markets, these countries could be potential candidates’ countries to be included in the Chinese reference basket . Assuming that these composed the basket, a price reduction in Switzerland would affect China’s prices via Canada, South Korea and Taiwan . We have replicated our analysis including China in the model assuming that an average rule would be applied .
Table 3 | Spillover effects from a 10 % price drop in Switzerland
Assuming all countries re-reference, accounting for informal links by economic region and including Spain
Lost sales Multiplier1
Switzerland EUR 430 .0 mCHF 514 .9 m
–
European-wide EUR 385 .3 mCHF 461 .4 m
0 .90
Developed economies (non-European) EUR 439 .0 mCHF 525 .6 m
1 .02
Emerging economies2 EUR 102 .4 mCHF 122 .6 m
0 .24
Total effects worldwide3 EUR 1 356 .7 mCHF 1 624 .5 m
3 .15
Source: CRA analysis . 1 Ratio between wider and Switzerland lost sales, 2 South Korea is included as a developed economy according to the International Monetary Fund (FMI), 3 Including Switzerland .
9
7
1
28
3
5
4
6
Source: CRA analysis .
Country % EUR m CHF m
Focal country
1 Switzerland –10 .00 430 .00 514 .90
Direct
2 Finland –0 .37 7 .50 9 .00
3 South Korea –1 .43 134 .10 160 .50
4 Taiwan –1 .14 62 .00 74 .30
5 Tunisia –10 .00 40 .30 48 .30
6 Canada –1 .43 249 .90 299 .30
Country % EUR m CHF m
Indirect
7 Ireland –0 .04 0 .80 0 .90
8 Austria –0 .01 0 .61 0 .73
9 China –0 .004 110 .80 132 .60
24 The international impact of Swiss drug regulation The international impact of Swiss drug regulation 25
Our estimates show that a 10 % price reduction in the Swiss prices will be trans-ferred into a EUR 110 .8 m (CHF 132 .6 m) revenue loss in China . Taking China into account, the impact in emerging economics would represent a 50 % of the Swiss effect (Figure 7) . Although, the quantification of the impact in China is again hypo-thetical, it illustrates the impact of changes in reference pricing rules, and how this is likely to occur in emerging markets, where pharmaceutical revenues are still growing .
3 The impact of a Swiss price reduction on patient access
In the previous chapter we examined the impact of a price reduction in Switzer-land on the prices in other markets . However, the impact of IRP can have wider ramifications, as anticipating the impact of a country’s price on other countries can affect the launch timing of new medicines .
As companies anticipate the price in a given country would affect prices in other markets, companies use a launch sequence to manage the consequences of IRP . This works through a number of channels: • Countries with high prices are launched early as they feed into other coun-
tries; • Countries with lower prices will be launched later to prevent the spillover
effects on other countries .
Independently, as launching the product in a given market uses scarce corporate resources, it is normal for smaller-value markets to be launched later than other countries – therefore a price reduction that diminishes the value of a given mar-ket will also mean it may be launched later in the launch sequence . In this chap-ter, we look at whether there might be consequences for Switzerland’s position in the launch sequence arising due to a price cut .
It should be noted that the time it takes for products to launch on the market is determined by a number of factors including both the price and reimbursement process and the decision of companies to submit their products into this pro-cess .
3 .1 Typical launch sequencesIn reality the launch sequence will vary from product to product . There are a number of reasons for this: • The potential for the product will vary from country to country and this will be
different for different therapeutic classes; • The speed of the process will depend on external issues such as the com-
plexity of the application, whether clinical trials were conducted in the country, etc .
However, on average we can observe a ‘typical’ launch sequence . To illustrate this Figure 8 shows data from IMS regarding the speed at which products are launched in different countries . This shows that on average products will be
26 The international impact of Swiss drug regulation The international impact of Swiss drug regulation 27
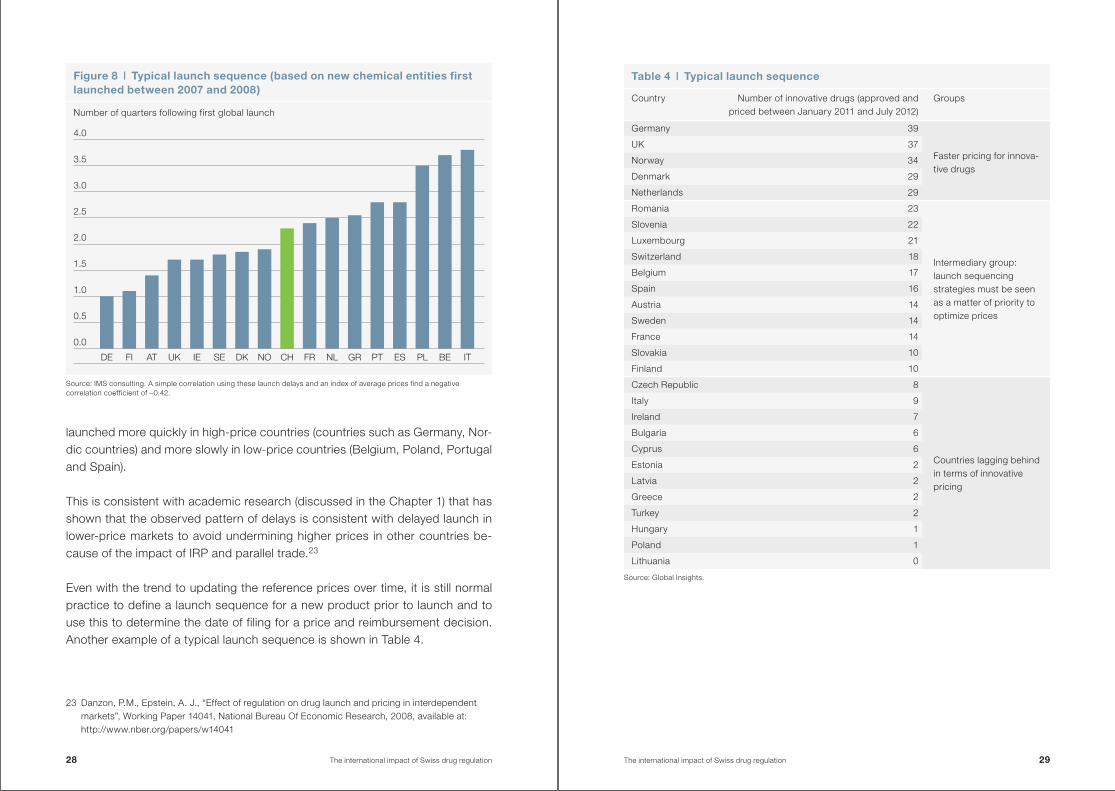
launched more quickly in high-price countries (countries such as Germany, Nor-dic countries) and more slowly in low-price countries (Belgium, Poland, Portugal and Spain) .
This is consistent with academic research (discussed in the Chapter 1) that has shown that the observed pattern of delays is consistent with delayed launch in lower-price markets to avoid undermining higher prices in other countries be-cause of the impact of IRP and parallel trade .23
Even with the trend to updating the reference prices over time, it is still normal practice to define a launch sequence for a new product prior to launch and to use this to determine the date of filing for a price and reimbursement decision . Another example of a typical launch sequence is shown in Table 4 .
23 Danzon, P .M ., Epstein, A . J ., “Effect of regulation on drug launch and pricing in interdependent markets”, Working Paper 14041, National Bureau Of Economic Research, 2008, available at: http://www .nber .org/papers/w14041
Figure 8 | Typical launch sequence (based on new chemical entities first launched between 2007 and 2008)
Number of quarters following first global launch
Source: IMS consulting . A simple correlation using these launch delays and an index of average prices find a negative correlation coefficient of –0 .42 .
0.0
DE FI AT UK IE SE DK NO CH FR NL GR PT ES PL BE IT
0.5
1.0
1.5
2.0
2.5
3.0
3.5
4.0
Source: Global Insights .
Table 4 | Typical launch sequence
Country Number of innovative drugs (approved and priced between January 2011 and July 2012)
Groups
Germany 39
Faster pricing for innova-tive drugs
UK 37
Norway 34
Denmark 29
Netherlands 29
Romania 23
Intermediary group: launch sequencing strategies must be seen as a matter of priority to optimize prices
Slovenia 22
Luxembourg 21
Switzerland 18
Belgium 17
Spain 16
Austria 14
Sweden 14
France 14
Slovakia 10
Finland 10
Czech Republic 8
Countries lagging behind in terms of innovative pricing
Italy 9
Ireland 7
Bulgaria 6
Cyprus 6
Estonia 2
Latvia 2
Greece 2
Turkey 2
Hungary 1
Poland 1
Lithuania 0
28 The international impact of Swiss drug regulation The international impact of Swiss drug regulation 29
So Switzerland is typically launched after the traditional free-pricing countries and countries, such as the Nordic countries, which have paid higher-than-aver-age prices but earlier than many other countries .
It should be noted that historical launch sequences need to be used with cau-tion . In particular, the regimes in Germany and in the UK are in transition . In Ger-many, following the AMNOG reforms, some products are not to be launched as they are unlikely able to negotiate a price premium following the assessment . In the UK, products can launch immediately but will only be used following the as-sessment of NICE . This too is likely to change with the introduction on value-based pricing .
3 .2 The impact of a change in expectations regarding the level of Swiss prices
The launch sequence above is based on the expectation companies have re-garding the price in Switzerland . If the price in Switzerland is expected to be lower in the future, then we should expect this to be taken into account in the planned launch sequences . This will occur if a higher price in another country can be achieved by delaying the launch in Switzerland .
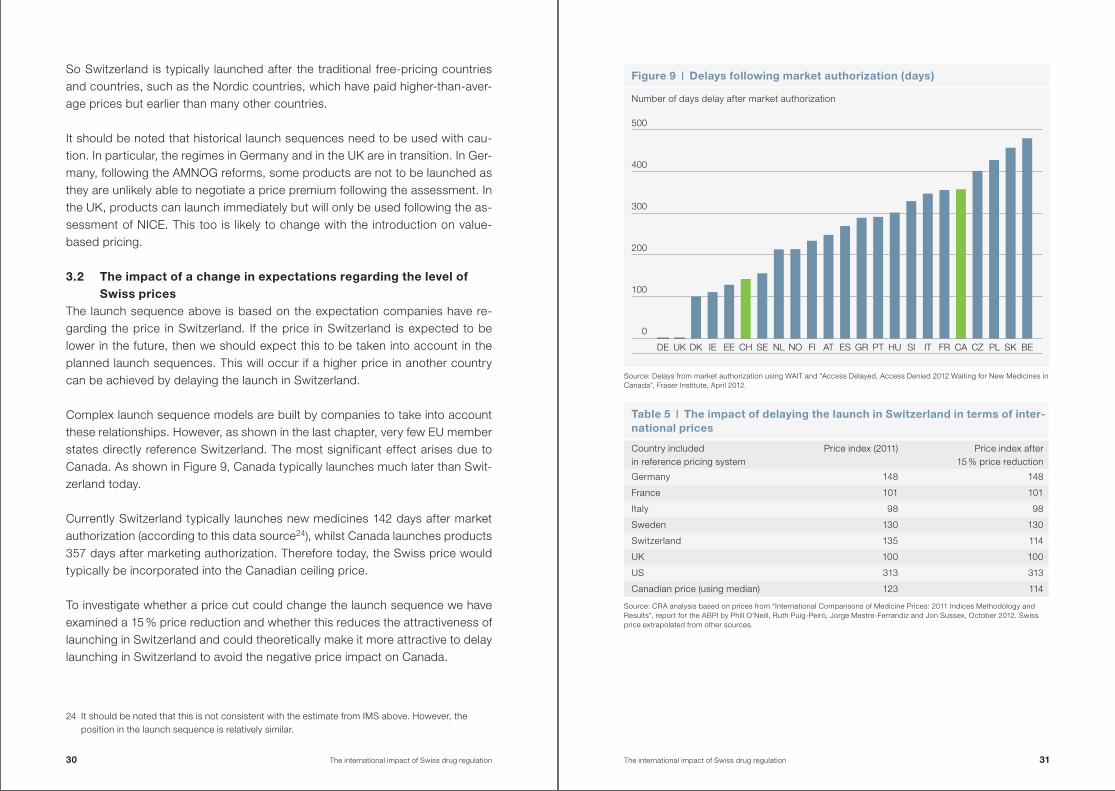
Complex launch sequence models are built by companies to take into account these relationships . However, as shown in the last chapter, very few EU member states directly reference Switzerland . The most significant effect arises due to Canada . As shown in Figure 9, Canada typically launches much later than Swit-zerland today .
Currently Switzerland typically launches new medicines 142 days after market authorization (according to this data source24), whilst Canada launches products 357 days after marketing authorization . Therefore today, the Swiss price would typically be incorporated into the Canadian ceiling price .
To investigate whether a price cut could change the launch sequence we have examined a 15 % price reduction and whether this reduces the attractiveness of launching in Switzerland and could theoretically make it more attractive to delay launching in Switzerland to avoid the negative price impact on Canada .
24 It should be noted that this is not consistent with the estimate from IMS above . However, the position in the launch sequence is relatively similar .
Figure 9 | Delays following market authorization (days)
Number of days delay after market authorization
Source: Delays from market authorization using WAIT and “Access Delayed, Access Denied 2012 Waiting for New Medicines in Canada”, Fraser Institute, April 2012 .
DE FI ATUK IE EE SEDK NOCH FR CA CZNL GR PT HU SIES PL SK BEIT
0
100
200
300
400
500
Table 5 | The impact of delaying the launch in Switzerland in terms of inter-national prices
Country included in reference pricing system
Price index (2011) Price index after 15 % price reduction
Germany 148 148
France 101 101
Italy 98 98
Sweden 130 130
Switzerland 135 114
UK 100 100
US 313 313
Canadian price (using median) 123 114
Source: CRA analysis based on prices from “International Comparisons of Medicine Prices: 2011 Indices Methodology and Results”, report for the ABPI by Phill O’Neill, Ruth Puig-Peiró, Jorge Mestre-Ferrandiz and Jon Sussex, October 2012 . Swiss price extrapolated from other sources .
30 The international impact of Swiss drug regulation The international impact of Swiss drug regulation 31
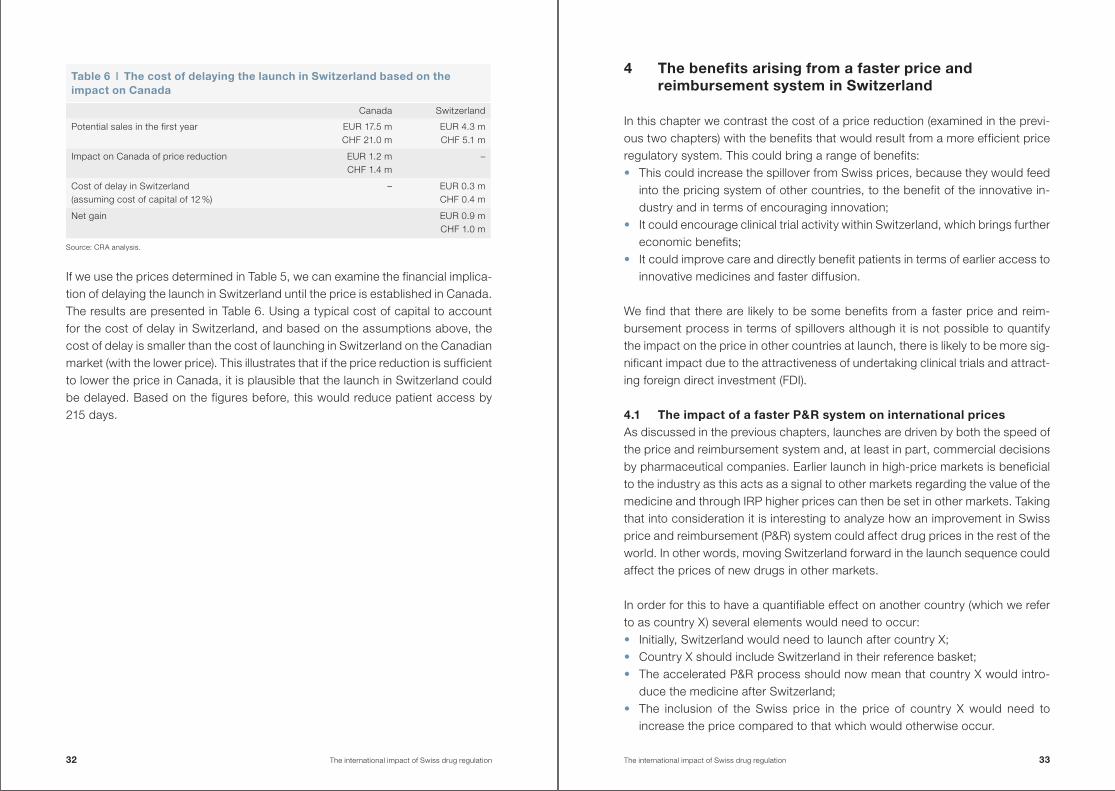
If we use the prices determined in Table 5, we can examine the financial implica-tion of delaying the launch in Switzerland until the price is established in Canada . The results are presented in Table 6 . Using a typical cost of capital to account for the cost of delay in Switzerland, and based on the assumptions above, the cost of delay is smaller than the cost of launching in Switzerland on the Canadian market (with the lower price) . This illustrates that if the price reduction is sufficient to lower the price in Canada, it is plausible that the launch in Switzerland could be delayed . Based on the figures before, this would reduce patient access by 215 days .
4 The benefits arising from a faster price and reimbursement system in Switzerland
In this chapter we contrast the cost of a price reduction (examined in the previ-ous two chapters) with the benefits that would result from a more efficient price regulatory system . This could bring a range of benefits: • This could increase the spillover from Swiss prices, because they would feed
into the pricing system of other countries, to the benefit of the innovative in-dustry and in terms of encouraging innovation;
• It could encourage clinical trial activity within Switzerland, which brings further economic benefits;
• It could improve care and directly benefit patients in terms of earlier access to innovative medicines and faster diffusion .
We find that there are likely to be some benefits from a faster price and reim-bursement process in terms of spillovers although it is not possible to quantify the impact on the price in other countries at launch, there is likely to be more sig-nificant impact due to the attractiveness of undertaking clinical trials and attract-ing foreign direct investment (FDI) .
4 .1 The impact of a faster P&R system on international pricesAs discussed in the previous chapters, launches are driven by both the speed of the price and reimbursement system and, at least in part, commercial decisions by pharmaceutical companies . Earlier launch in high-price markets is beneficial to the industry as this acts as a signal to other markets regarding the value of the medicine and through IRP higher prices can then be set in other markets . Taking that into consideration it is interesting to analyze how an improvement in Swiss price and reimbursement (P&R) system could affect drug prices in the rest of the world . In other words, moving Switzerland forward in the launch sequence could affect the prices of new drugs in other markets .
In order for this to have a quantifiable effect on another country (which we refer to as country X) several elements would need to occur: • Initially, Switzerland would need to launch after country X; • Country X should include Switzerland in their reference basket; • The accelerated P&R process should now mean that country X would intro-
duce the medicine after Switzerland; • The inclusion of the Swiss price in the price of country X would need to
increase the price compared to that which would otherwise occur .
Table 6 | The cost of delaying the launch in Switzerland based on the impact on Canada
Canada Switzerland
Potential sales in the first year EUR 17 .5 mCHF 21 .0 m
EUR 4 .3 mCHF 5 .1 m
Impact on Canada of price reduction EUR 1 .2 mCHF 1 .4 m
–
Cost of delay in Switzerland (assuming cost of capital of 12 %)
– EUR 0 .3 mCHF 0 .4 m
Net gain EUR 0 .9 mCHF 1 .0 m
Source: CRA analysis .
32 The international impact of Swiss drug regulation The international impact of Swiss drug regulation 33
As discussed in the previous chapter and illustrated in Figure 9, in the past medi-cines were launched in Switzerland relatively quickly but more slowly than in a number of other European markets .
Looking at other European countries, a faster P&R system will only move Switz-erland before Denmark, Ireland and Estonia . Given the IRP system used in these countries, this would not have a significant impact on prices . Even if we consider another market with set prices through an administrative process, such as Spain, which normally launches after Switzerland, so the Swiss price is already incor-porated in their prices .
Therefore, the direct impact of faster price and reimbursement in Europe is likely to be small . However, this is underestimating the impact for two reasons: • We actually observe a different launch sequence for every product . So in
some cases, administrative systems such as Spain and Italy would launch be-fore Switzerland . To the extent that a faster price and reimbursement would reduce this occurrence and Swiss prices are taken into account in adminis-trative systems this would have a positive effect .
• We need to take into account that other countries are undergoing reforms, too . Particularly the free-pricing/immediate launch markets of UK and Ger-many are both undergoing change . In Germany, we are observing products delaying launch because of the appraisal system introduced by AMNOG . In the UK, the impact of NICE and the prospect of value-based pricing mean that immediate launch in the UK is becoming less meaningful . It is therefore likely to be increasingly important that markets such as Switzerland value innova-tion and can be used as a reference point .
Looking more widely at international markets, the largest effect is likely to be in Canada, Finland, South Korea, Taiwan and Tunisia who use Switzerland to de-termine their prices . With the exception of Finland, all the markets normally intro-duce innovative drugs after Switzerland . Hence, they typically establish prices once the product exists in the Swiss market thus the effect of faster launch in Switzerland would not be observable . However, again, we need to be cautious, in reality the launch sequence varies from product to product and there will be occasions when these markets launch before Switzerland . Therefore, this would have an impact but it is not quantifiable .
If the faster process also resulted in higher reward for innovative medicines, the impact would be doubled (through IRP) . Using the estimates provided in Figure 3 if products were launched before other countries, any improvement in prices would result in a worldwide impact at least 2 .15 times the impact in Switzerland .
Taking all the above into consideration we can say that a more efficient P&R sys-tem in Switzerland would have an impact on international prices but it is difficult to quantify the magnitude of this effect .
4 .2 The relationship between price regulation and the location of clinical trials
However, we are not only interested in the direct impact on prices but also whether a faster process would bring other benefits . Theoretical evidence sug-gests that a well-designed P&R regulation would encourage innovative activity .25
This seems likely to be particularly important for the locations of clinical trial ac-tivity . The relationship between the regulatory system and the location of clinical trials has been analyzed in a number of studies . However, this has mainly focused on the regulatory barriers to establish clinical trials rather than the P&R mechanisms .26
In order to throw more light to this debate we have analyzed the empirical rela-tionship that exists between the average delay after market authorization and the number of clinical trials located in a country . Using data from European countries we found a negative (although admittedly weak) relationship between the length of entry delay and the number of clinical trials conducted in the country .27 Figure 10 shows these results .
This suggests that the average delay is negatively related to the number of trials but other factors are also important . This is consistent with existing survey evi-dence on the reasons behind the location of clinical trials . The regulatory en-vironment is seen as particularly important when companies need to choose
25 Friederiszick H ., et al, “An economic assessment of the relationship between price regulation and incentives to innovate in the pharmaceutical industry”, ESMT white paper, 2003 .
26 Dubois, P ., de Mouzon, O ., Scott-Morton, F ., Sabright, P ., “Market Size and Pharmaceutical Inno-vation”, Centre for Economic Policy Research, WP . April 2011; Charles River Associates “Policies that encourage innovation in middle-income countries”, a report for EFPIA, October 2012 .
27 We do, of course, need to be mindful of the causality of this relationship . It is possible that markets with a high number of clinical trials exhibit lower delays (as the clinical evidence is more relevant to the country) .
34 The international impact of Swiss drug regulation The international impact of Swiss drug regulation 35
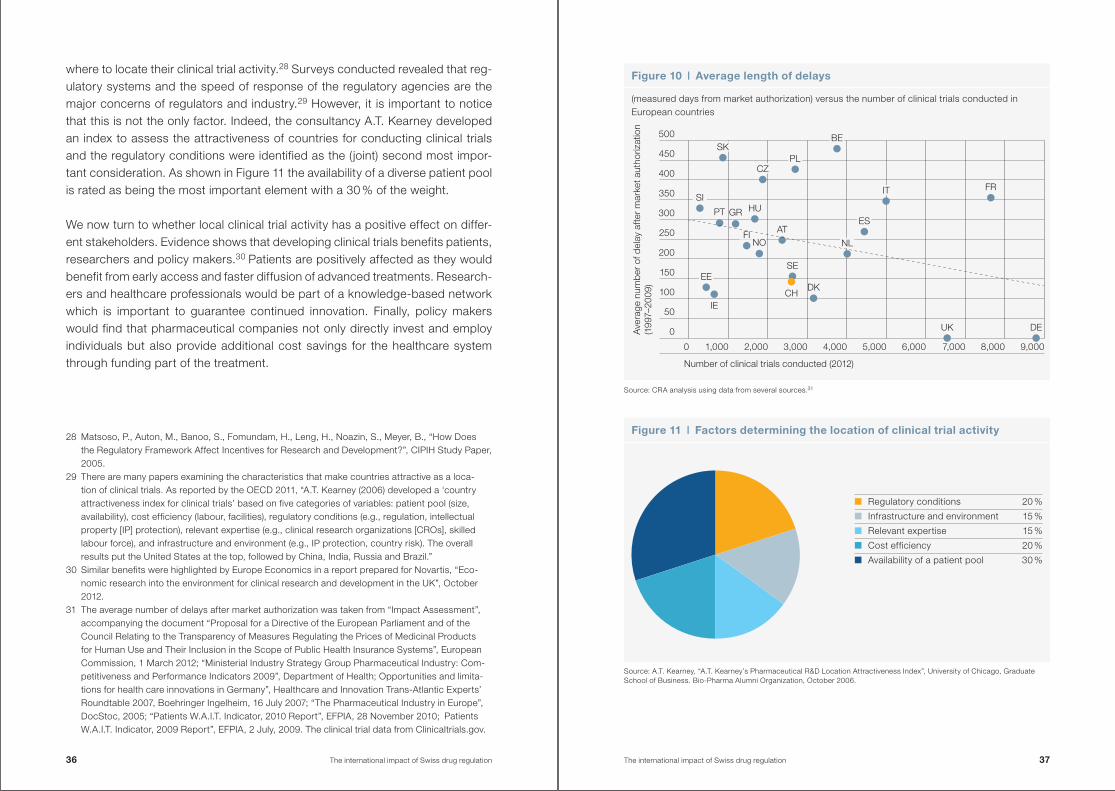
where to locate their clinical trial activity .28 Surveys conducted revealed that reg-ulatory systems and the speed of response of the regulatory agencies are the major concerns of regulators and industry .29 However, it is important to notice that this is not the only factor . Indeed, the consultancy A .T . Kearney developed an index to assess the attractiveness of countries for conducting clinical trials and the regulatory conditions were identified as the (joint) second most impor-tant consideration . As shown in Figure 11 the availability of a diverse patient pool is rated as being the most important element with a 30 % of the weight .
We now turn to whether local clinical trial activity has a positive effect on differ-ent stakeholders . Evidence shows that developing clinical trials benefits patients, researchers and policy makers .3031 Patients are positively affected as they would benefit from early access and faster diffusion of advanced treatments . Research-ers and healthcare professionals would be part of a knowledge-based network which is important to guarantee continued innovation . Finally, policy makers would find that pharmaceutical companies not only directly invest and employ individuals but also provide additional cost savings for the healthcare system through funding part of the treatment .
28 Matsoso, P ., Auton, M ., Banoo, S ., Fomundam, H ., Leng, H ., Noazin, S ., Meyer, B ., “How Does the Regulatory Framework Affect Incentives for Research and Development?”, CIPIH Study Paper, 2005 .
29 There are many papers examining the characteristics that make countries attractive as a loca-tion of clinical trials . As reported by the OECD 2011, “A .T . Kearney (2006) developed a ‘country attractiveness index for clinical trials’ based on five categories of variables: patient pool (size, availability), cost efficiency (labour, facilities), regulatory conditions (e .g ., regulation, intellectual property [IP] protection), relevant expertise (e .g ., clinical research organizations [CROs], skilled labour force), and infrastructure and environment (e .g ., IP protection, country risk) . The overall results put the United States at the top, followed by China, India, Russia and Brazil .”
30 Similar benefits were highlighted by Europe Economics in a report prepared for Novartis, “Eco-nomic research into the environment for clinical research and development in the UK”, October 2012 .
31 The average number of delays after market authorization was taken from “Impact Assessment”, accompanying the document “Proposal for a Directive of the European Parliament and of the Council Relating to the Transparency of Measures Regulating the Prices of Medicinal Products for Human Use and Their Inclusion in the Scope of Public Health Insurance Systems”, European Commission, 1 March 2012; “Ministerial Industry Strategy Group Pharmaceutical Industry: Com-petitiveness and Performance Indicators 2009”, Department of Health; Opportunities and limita-tions for health care innovations in Germany”, Healthcare and Innovation Trans-Atlantic Experts’ Roundtable 2007, Boehringer Ingelheim, 16 July 2007; “The Pharmaceutical Industry in Europe”, DocStoc, 2005; “Patients W .A .I .T . Indicator, 2010 Report”, EFPIA, 28 November 2010; Patients W .A .I .T . Indicator, 2009 Report”, EFPIA, 2 July, 2009 . The clinical trial data from Clinicaltrials .gov .
Figure 10 | Average length of delays
(measured days from market authorization) versus the number of clinical trials conducted in European countries
Source: CRA analysis using data from several sources .31
Figure 11 | Factors determining the location of clinical trial activity
Source: A .T . Kearney, “A .T . Kearney’s Pharmaceutical R&D Location Attractiveness Index”, University of Chicago, Graduate School of Business . Bio-Pharma Alumni Organization, October 2006 .
Regulatory conditions 20 %
Infrastructure and environment 15 %
Relevant expertise 15 %
Cost efficiency 20 %
Availability of a patient pool 30 %
DEUK
FRIT
ES
NL
DK
SE
CH
ATNO
FI
IE
EE
PT HUGR
SI
SK
CZPL
BE
0
50
100
150
200
250
300
350
400
450
500
0 1,000 2,000 3,000 4,000 5,000 6,000 7,000 8,000 9,000
Ave
rage
num
ber
of d
elay
aft
er m
arke
t aut
horiz
atio
n (1
997–
2009
)
Number of clinical trials conducted (2012)
36 The international impact of Swiss drug regulation The international impact of Swiss drug regulation 37
Patients benefit from early access, faster diffusion of advanced treatment and better healthcare outcomes
Undertaking clinical trials locally can bring a range of positive benefits to the pa-tient . This can be through a number of different channels: • Therapeutic benefits to participants in trials; • Diffusion of medicines through take-up and faster adoption; • Medicines could be tailored to the needs and circumstances of the domestic
population resulting in better health outcomes or, indirectly, trials may lead to better patient care as participants are seen more frequently in the healthcare system .
Patients that participate in clinical trials can have access to innovative treatments that are not yet widely available . This is illustrated by Trotta et al ., using 93 clin-ical trials for cancer drugs published between 1997 and 2007 they found that 30 % of the trials were stopped and the drug was given accelerated approval al-lowing quicker access of the new drug to patients .32
This is also supported by survey on patients and physicians . Patients that are currently part of a clinical trial programme report that the major benefit is that they have access to advanced therapy interventions and medicines as well as the potential health benefit that can be achieved .33, 34 Investigators and person-nel involved into clinical trials also agree that industry-funded clinical trials pro-vide high value to the patient . A survey questionnaire given to researchers in Aus-tralia showed how personnel taking part in clinical trial believed that trials benefited patients through providing early access to medications and improving healthcare outcomes through improving the standard of care .35
32 Trotta et al ., “Stopping a trial early in oncology: for patients or for industry?”, Annals of Oncology Advance Access published April 9, 2008 .
33 PwC, “Clinical trials in Poland – Key Challenges”, 2010 .34 ECRI Evidence Report, “Patients’ reasons for participation in clinical trials and effect of trial
participation on patient outcomes”, ECRI Health Technology Assessment Information Service, 74, April 2002 .
35 Bourgeois, C ., “Value of industry sponsored trials in Australia . Industrial survey of investigator perceptions on the value of industry funded clinical research”, 2010 .
Turning to diffusion, clinical trials could result in new medicines being more quickly taken up and used . Several authors have investigated the speed of treat-ment diffusion following clinical trials . They find that a new treatment will be more quickly adopted where the physicians are more proximate to where the clinical trials were located . This results from an information spillover between physicians, but also the skills to administer new medicines are more likely to exist if phys-icians have been involved in the development process .36 This is supported by: • The proportion of prescriptions of new drugs is high for doctors that have con-
ducted clinical trials .37
• A Congressional Budget Office study on the pharmaceutical industry found that doctors who conduct clinical trials sponsored by a drug firm tend to in-crease their prescribing of such sponsored products .38
• The study by Corrigan reports that three months after product launch of a new medicine the number of prescriptions written by the investigators accounted was statistically significant higher than the number of prescriptions written by doctors who did not participate in the trials . The authors also claimed that the difference in prescribing behaviour between the case and control physicians remained over the following 15 months .39
• Europe Economics reports that the impact of clinical trials arises due to greater information about the medicine existing in markets where the trials are conducted . They conclude doctor’s opinion on a new drug may be expected to be greater when the clinical trials have taken place in their country .40
• Finally, Chauhan and Mason examine the factors affecting the diffusion of new medicines and found that clinical trial investigators and physicians who are involved in decision-making bodies have a special influence on the decision to prescribe new medicines, due to their proximity to their research and under standing of the evidence base .41
36 Europe Economics in a report prepared for Novartis, “Economic research into the environment for clinical research and development in the UK”, October 2012 .
37 Cohen, J ., Faden, L ., G ., Kenneth, “Mapping Biopharmaceutical Innovation and Diffusion: How the Second Translational Block (T2) Shapes Drug Diffusion”, The Open Pharmacology Journal, 2, 89, 2008 .
38 Congressional Budget Office, “Research and Development in the Pharmaceutical Industry”, Congress of the United States, October 2006 .
39 Corrigan, M ., et al ., “Physician participation in clinical studies and subsequent prescribing of new drugs”, Pharmacology & Therapeutics, 30, 1, 2005 .
40 Europe Economics in a report prepared for Novartis, “Economic research into the environment for clinical research and development in the UK”, October 2012 .
41 Chauhan, D ., Mason, A ., “Factors affecting the uptake of new medicines in secondarycare – a literature review”, Journal of Clinical Pharmacy and Therapeutics 33 (4): 339-348, 2008 .
38 The international impact of Swiss drug regulation The international impact of Swiss drug regulation 39
Turning to health outcomes, by participating in clinical trials, patients not only have early access to new treatments but also achieve higher healthcare out-comes . Based on the evidence provided by the ECRI Institute in a literature re-view, patients that participated in clinical trials had longer survival rates than those that were not in trials .42 These results are also supported by the Associa-tion of Medical Research Charities (AMRC) in the UK as they reported that patients who receive care in research-active institutions have better health out-comes than patients who are treated in a non-research environment .43, 44
Clinical trials also benefit patients in the long run as the clinical trials developed today would be reflected in new drugs available tomorrow . Indeed, through the development of clinical trials more advanced and more effective drugs would be-come available to the human population .45
Researchers and healthcare professionals benefit from being part of a knowl-edge base network
To run and execute large-scale clinical trials requires highly skilled workers who form clinical trial and research units in the country . The investment and develop-ment of researchers and healthcare professionals developing clinical trials con-tributes to increased scientific and academic research in the country, beyond the trial itself . This accumulation of expertise creates a knowledge base in the coun-try and in the country’s health system that is important for continued innovation and development .
42 ECRI Evidence Report, “Patients’ reasons for participation in clinical trials and effect of trial participation on patient outcomes”, ECRI Health Technology Assessment Information Service, 74, April 2002 .
43 AMRC, “UK public wants NHS to support research”, June 2011 .44 Assessing the relationship between participating in clinical trials and patient’s healthcare out-
comes is not an easy task . Indeed, a bias in both the data collection and data publication has to be taken into consideration as successful trials have a greater likelihood to be published .
45 PwC, “Clinical trials in Poland – Key Challenges”, 2010 .
For instance, the acquisition of new skills or technology as required for some clinical trials may lead to their systematic application and outcome improvements throughout an institution or health system .46 There is evidence that the training and quality assurance associated with a large study in the Netherlands of a new colorectal cancer surgical technique led to rapid improvement in national out-come statistics .47 This may also lead to improved equipment and facilities . For example, in the UK it is reported that clinical research resulted in additional fund-ing for both core clinical and research activities . An example is GlaxoSmithKline’s GBP 72 m investment in Imperial College London’s new Clinical Imaging Centre . McKinsey reported that “In addition to high-profile one-off investments, industry contributes to the delivery of day-to-day NHS care; for example, 2 % of the Royal Marsden’s overall budget comes from industry collaborations that provide infra-structure, part-funding of personnel and other subsidies .”48
Clinical trials also encourage partnership between academic and industry . The Tufts Center for the Study of Drug Development undertook a study investigating academic-industry partnerships for biopharmaceutical research and develop-ment . They reviewed over three thousand grants provided by industry to aca-demic medical centres . Of these, the majority (75 %) related to grants for collab-orations on joint clinical trial . These education grants funded a wide range of activities such as conferences, fellowships and medical outreach centres .49
Furthermore, clinical trials are required to follow established guidelines in order to be approved by the regulatory agency . Therefore, research-active institutions may be faster to uptake new evidence into the practice as they would have more experience . Evidence for acute coronary syndromes shows that compliance with clinical guidelines was better and mortality was lower among patients treated in institutions that participated in clinical trials .50
46 Kzyzanowska, M ., Kaplan, R ., Sullivan, R ., “How many clinical research improve healthcare outcomes?”, Annuals of Oncology, 22, 7, 2011 .
47 van Gijn, W ., Krijnen, P ., Lemmens, VE . et al . “Quality assurance in rectal cancer treatment in the Netherlands: a catch up, compared to colon cancer treatment”, European Journal of Surgery and Oncology, 36, 2010 .
48 McKinsey & Company, “Clinical research in the UK: Towards a single system that reliably delivers distinctive quality and rapid access at reasonable cost”, commissioned by UKCRC, 2005 .
49 Milne, C .-P ., Malins, A ., “Academic-Industry Partnerships for Biopharmaceutical Research & Development: Advancing Medical Science in the U .S .”, Tufts Center for the Study of Drug Devel-opment, Tufts University School of Medicine, Boston, MA ., 2012 . The project was sponsored in part by a grant from the Pharmaceutical Research and Manufacturers of America (PhRMA) .
50 Majumdar, S ., Roe, M ., Peterson, E ., et al ., “Better outcomes for patients treated at hospitals that participate in clinical trials”, Archives of Internal Medicine, 168, 6, 2008 .
40 The international impact of Swiss drug regulation The international impact of Swiss drug regulation 41
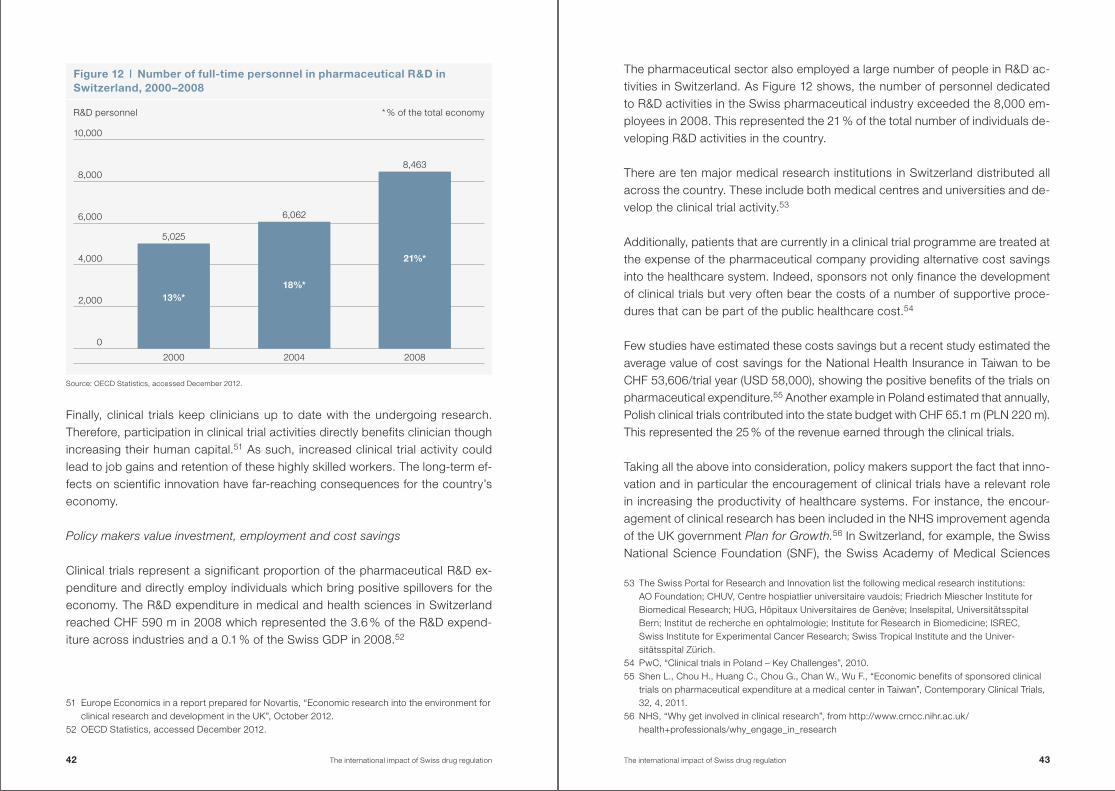
Figure 12 | Number of full-time personnel in pharmaceutical R&D in Switzerland, 2000–2008
13%*18%*
21%*
2000 2004 2008
5,025
6,062
8,463
2,000
4,000
6,000
8,000
10,000
0
Finally, clinical trials keep clinicians up to date with the undergoing research . Therefore, participation in clinical trial activities directly benefits clinician though increasing their human capital .51 As such, increased clinical trial activity could lead to job gains and retention of these highly skilled workers . The long-term ef-fects on scientific innovation have far-reaching consequences for the country’s economy .
Policy makers value investment, employment and cost savings
Clinical trials represent a significant proportion of the pharmaceutical R&D ex-penditure and directly employ individuals which bring positive spillovers for the economy . The R&D expenditure in medical and health sciences in Switzerland reached CHF 590 m in 2008 which represented the 3 .6 % of the R&D expend-iture across industries and a 0 .1 % of the Swiss GDP in 2008 .52
51 Europe Economics in a report prepared for Novartis, “Economic research into the environment for clinical research and development in the UK”, October 2012 .
52 OECD Statistics, accessed December 2012 .
The pharmaceutical sector also employed a large number of people in R&D ac-tivities in Switzerland . As Figure 12 shows, the number of personnel dedicated to R&D activities in the Swiss pharmaceutical industry exceeded the 8,000 em-ployees in 2008 . This represented the 21 % of the total number of individuals de-veloping R&D activities in the country .
There are ten major medical research institutions in Switzerland distributed all across the country . These include both medical centres and universities and de-velop the clinical trial activity .53
Additionally, patients that are currently in a clinical trial programme are treated at the expense of the pharmaceutical company providing alternative cost savings into the healthcare system . Indeed, sponsors not only finance the development of clinical trials but very often bear the costs of a number of supportive proce-dures that can be part of the public healthcare cost .54
Few studies have estimated these costs savings but a recent study estimated the average value of cost savings for the National Health Insurance in Taiwan to be CHF 53,606/trial year (USD 58,000), showing the positive benefits of the trials on pharmaceutical expenditure .55 Another example in Poland estimated that annually, Polish clinical trials contributed into the state budget with CHF 65 .1 m (PLN 220 m) . This represented the 25 % of the revenue earned through the clinical trials .
Taking all the above into consideration, policy makers support the fact that inno-vation and in particular the encouragement of clinical trials have a relevant role in increasing the productivity of healthcare systems . For instance, the encour-agement of clinical research has been included in the NHS improvement agenda of the UK government Plan for Growth.56 In Switzerland, for example, the Swiss National Science Foundation (SNF), the Swiss Academy of Medical Sciences
53 The Swiss Portal for Research and Innovation list the following medical research institutions: AO Foundation; CHUV, Centre hospiatlier universitaire vaudois; Friedrich Miescher Institute for Biomedical Research; HUG, Hôpitaux Universitaires de Genève; Inselspital, Universitätsspital Bern; Institut de recherche en ophtalmologie; Institute for Research in Biomedicine; ISREC, Swiss Institute for Experimental Cancer Research; Swiss Tropical Institute and the Univer-sitätsspital Zürich .
54 PwC, “Clinical trials in Poland – Key Challenges”, 2010 .55 Shen L ., Chou H ., Huang C ., Chou G ., Chan W ., Wu F ., “Economic benefits of sponsored clinical
trials on pharmaceutical expenditure at a medical center in Taiwan”, Contemporary Clinical Trials, 32, 4, 2011 .
56 NHS, “Why get involved in clinical research”, from http://www .crncc .nihr .ac .uk/health+professionals/why_engage_in_research
Source: OECD Statistics, accessed December 2012 .
R&D personnel * % of the total economy
42 The international impact of Swiss drug regulation The international impact of Swiss drug regulation 43
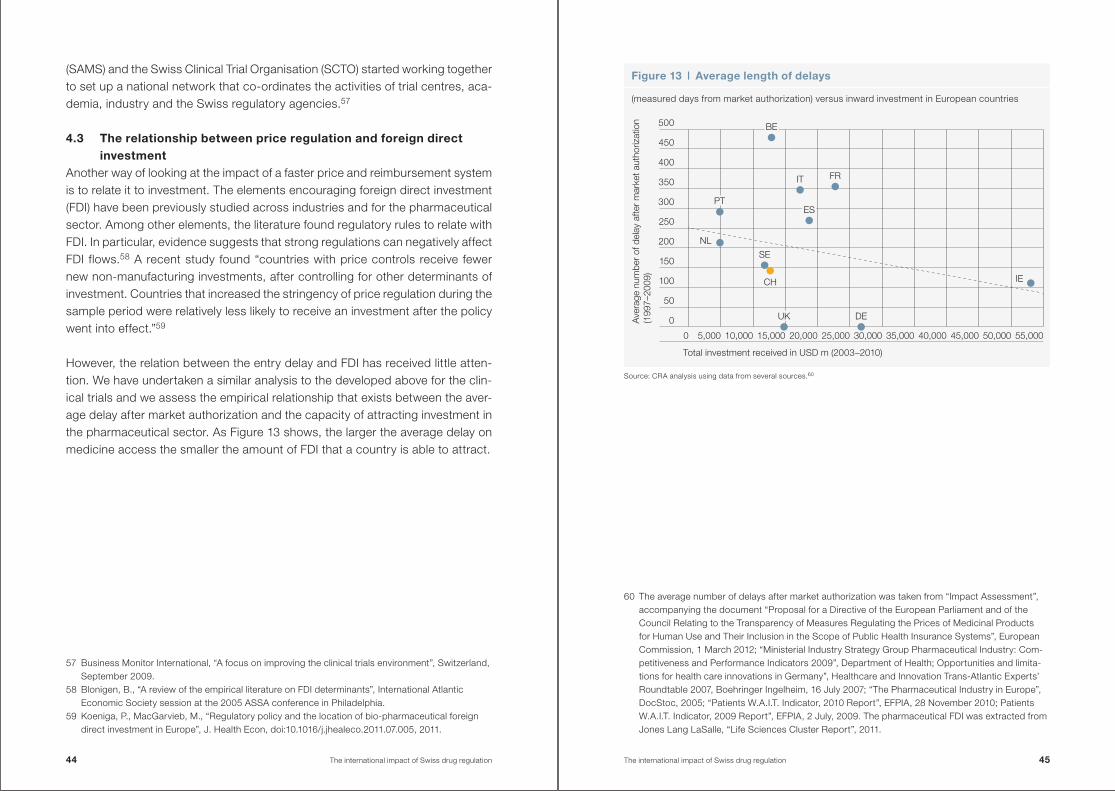
(SAMS) and the Swiss Clinical Trial Organisation (SCTO) started working together to set up a national network that co-ordinates the activities of trial centres, aca-demia, industry and the Swiss regulatory agencies .57
4 .3 The relationship between price regulation and foreign direct investment
Another way of looking at the impact of a faster price and reimbursement system is to relate it to investment . The elements encouraging foreign direct investment (FDI) have been previously studied across industries and for the pharmaceutical sector . Among other elements, the literature found regulatory rules to relate with FDI . In particular, evidence suggests that strong regulations can negatively affect FDI flows .58 A recent study found “countries with price controls receive fewer new non-manufacturing investments, after controlling for other determinants of investment . Countries that increased the stringency of price regulation during the sample period were relatively less likely to receive an investment after the policy went into effect .”59
However, the relation between the entry delay and FDI has received little atten-tion . We have undertaken a similar analysis to the developed above for the clin-ical trials and we assess the empirical relationship that exists between the aver-age delay after market authorization and the capacity of attracting investment in the pharmaceutical sector . As Figure 13 shows, the larger the average delay on medicine access the smaller the amount of FDI that a country is able to attract .
57 Business Monitor International, “A focus on improving the clinical trials environment”, Switzerland, September 2009 .
58 Blonigen, B ., “A review of the empirical literature on FDI determinants”, International Atlantic Economic Society session at the 2005 ASSA conference in Philadelphia .
59 Koeniga, P ., MacGarvieb, M ., “Regulatory policy and the location of bio-pharmaceutical foreign direct investment in Europe”, J . Health Econ, doi:10 .1016/j .jhealeco .2011 .07 .005, 2011 .
Source: CRA analysis using data from several sources .60
60 The average number of delays after market authorization was taken from “Impact Assessment”, accompanying the document “Proposal for a Directive of the European Parliament and of the Council Relating to the Transparency of Measures Regulating the Prices of Medicinal Products for Human Use and Their Inclusion in the Scope of Public Health Insurance Systems”, European Commission, 1 March 2012; “Ministerial Industry Strategy Group Pharmaceutical Industry: Com-petitiveness and Performance Indicators 2009”, Department of Health; Opportunities and limita-tions for health care innovations in Germany”, Healthcare and Innovation Trans-Atlantic Experts’ Roundtable 2007, Boehringer Ingelheim, 16 July 2007; “The Pharmaceutical Industry in Europe”, DocStoc, 2005; “Patients W .A .I .T . Indicator, 2010 Report”, EFPIA, 28 November 2010; Patients W .A .I .T . Indicator, 2009 Report”, EFPIA, 2 July, 2009 . The pharmaceutical FDI was extracted from Jones Lang LaSalle, “Life Sciences Cluster Report”, 2011 .
Figure 13 | Average length of delays
(measured days from market authorization) versus inward investment in European countries
DEUK
FRIT
ES
NL
IE
SE
CH
PT
BE
Total investment received in USD m (2003–2010)
Ave
rage
num
ber
of d
elay
afte
r m
arke
t aut
horiz
atio
n (1
997–
2009
)
0
50
100
150
200
250
300
350
400
450
500
0 5,000 10,000 15,000 20,000 25,000 30,000 35,000 40,000 45,000 50,000 55,000
44 The international impact of Swiss drug regulation The international impact of Swiss drug regulation 45
Pharmaceutical FDI is seen to be beneficial for a country’s economy as it directly affects employment, value added, productivity and exports .
Although, based on relatively little quantitative evidence, there is some evidence that a faster P&R process could contribute to encouraging investment . The bene-fits for investment in the pharmaceutical industry were examined in a recent study analyzing the direct importance of the pharmaceutical industry in Switzer-land and found that it was a key contributor to the Swiss economy as:61
• The pharmaceutical industry has employed an increasing amount of people in the last five years meaning that the industry is developing . The average growth in the number of people employed in the pharmaceutical industry is over 3 % per year . In particular 36,700 people employed in 2010 which repre-sented the 0 .8 % of the total employment .
• The interdependencies between the pharmaceutical and other sectors in terms of jobs in the Swiss economy are also significantly large . For the 36,700 individuals employed in the pharmaceutical sector, there were a further 98,600 working in other sectors that benefited from demand created by the pharma-ceutical industry . This represents a 2 .2 % of the whole economy .
• The pharmaceutical sector in Switzerland is extremely export-oriented as the vast majority of goods manufactured are exported . In 2010, the 31 % of the total Swiss exports were from the pharmaceutical industry .
61 Polynomics, “The importance of the pharmaceutical industry for Switzerland”, a study undertaken on behalf of Interpharma, 2011 .
Conclusion
Any change in Swiss drug prices has an impact significantly beyond its own bor-ders due to IRP . A number of large economies (particularly in emerging markets) include Switzerland in the reference basket or are indirectly affected by Swiss prices through the second-round effects . Therefore a change in Swiss drug prices has a global effect .
We found that the impact of an across-the-board price reduction in Switzerland would be larger worldwide than in Switzerland alone, with significant conse-quences for emerging markets . In particular, we found that a 10 % price reduction would reduce industry revenues by EUR 925 .2 m (CHF 1,107 .8 m) worldwide . From these, EUR 430 m (CHF 514 .9 m) would be lost in Switzerland, EUR 392 .8 m (CHF 470 .3 m) in developed economies and EUR 102 .4 m (CHF 122 .6 m) in emerging markets . In other words, the global impact of IRP is to double the im-pact of any price reduction in Switzerland .
In addition to the impact on price, our results show that IRP can effect company decisions when launching innovative medicines, causing delays in the Swiss market . If the price reduction in Switzerland is significant, it is possible that the launch in Switzerland could be significantly delayed .
On the other hand, a faster price and reimbursement processes would bring benefits to the country . We found that accelerating the speed of price and reim-bursement mechanisms would benefit patients and physicians but also deliver wider benefits in Switzerland by increasing the attractiveness of undertaking clinical trials and attracting foreign direct investment .
46 The international impact of Swiss drug regulation The international impact of Swiss drug regulation 47
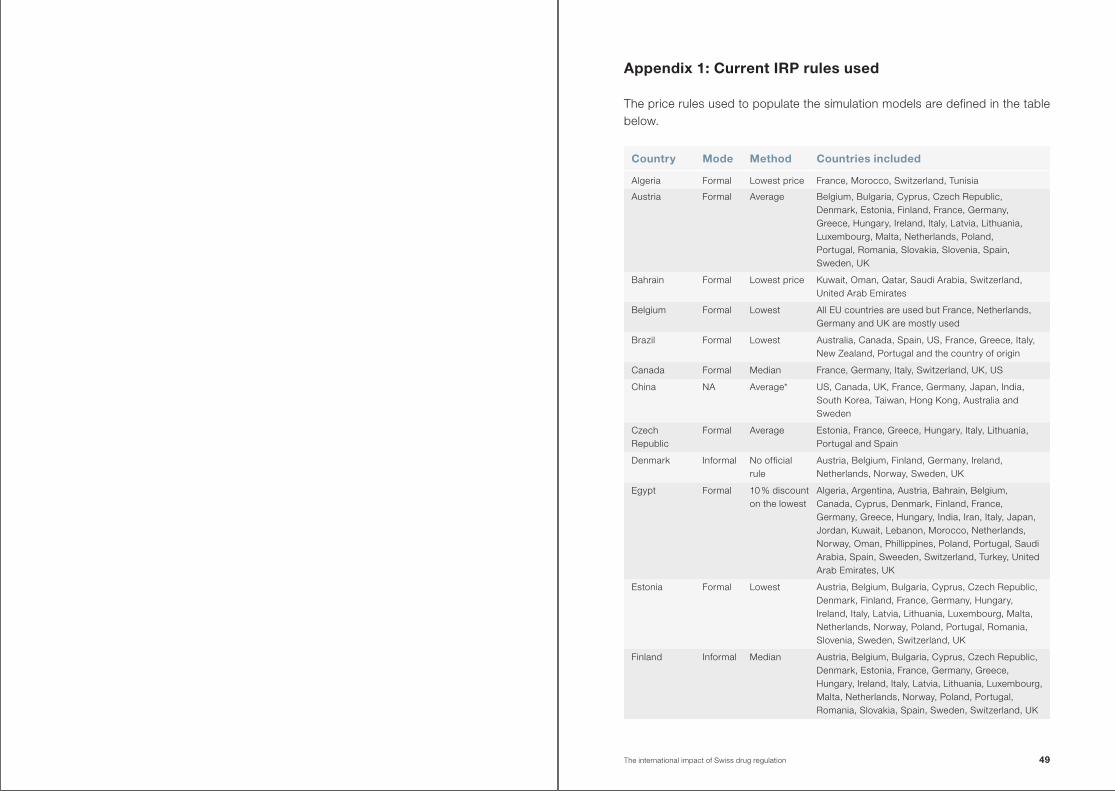
Appendix 1: Current IRP rules used
The price rules used to populate the simulation models are defined in the table below .
Country Mode Method Countries included
Algeria Formal Lowest price France, Morocco, Switzerland, Tunisia
Austria Formal Average Belgium, Bulgaria, Cyprus, Czech Republic, Denmark, Estonia, Finland, France, Germany, Greece, Hungary, Ireland, Italy, Latvia, Lithuania, Luxembourg, Malta, Netherlands, Poland, Portugal, Romania, Slovakia, Slovenia, Spain, Sweden, UK
Bahrain Formal Lowest price Kuwait, Oman, Qatar, Saudi Arabia, Switzerland, United Arab Emirates
Belgium Formal Lowest All EU countries are used but France, Netherlands, Germany and UK are mostly used
Brazil Formal Lowest Australia, Canada, Spain, US, France, Greece, Italy, New Zealand, Portugal and the country of origin
Canada Formal Median France, Germany, Italy, Switzerland, UK, US
China NA Average* US, Canada, UK, France, Germany, Japan, India, South Korea, Taiwan, Hong Kong, Australia and Sweden
Czech Republic
Formal Average Estonia, France, Greece, Hungary, Italy, Lithuania, Portugal and Spain
Denmark Informal No official rule
Austria, Belgium, Finland, Germany, Ireland, Netherlands, Norway, Sweden, UK
Egypt Formal 10 % discount on the lowest
Algeria, Argentina, Austria, Bahrain, Belgium, Canada, Cyprus, Denmark, Finland, France, Germany, Greece, Hungary, India, Iran, Italy, Japan, Jordan, Kuwait, Lebanon, Morocco, Netherlands, Norway, Oman, Phillippines, Poland, Portugal, Saudi Arabia, Spain, Sweeden, Switzerland, Turkey, United Arab Emirates, UK
Estonia Formal Lowest Austria, Belgium, Bulgaria, Cyprus, Czech Republic, Denmark, Finland, France, Germany, Hungary, Ireland, Italy, Latvia, Lithuania, Luxembourg, Malta, Netherlands, Norway, Poland, Portugal, Romania, Slovenia, Sweden, Switzerland, UK
Finland Informal Median Austria, Belgium, Bulgaria, Cyprus, Czech Republic, Denmark, Estonia, France, Germany, Greece, Hungary, Ireland, Italy, Latvia, Lithuania, Luxembourg, Malta, Netherlands, Norway, Poland, Portugal, Romania, Slovakia, Spain, Sweden, Switzerland, UK
The international impact of Swiss drug regulation 49
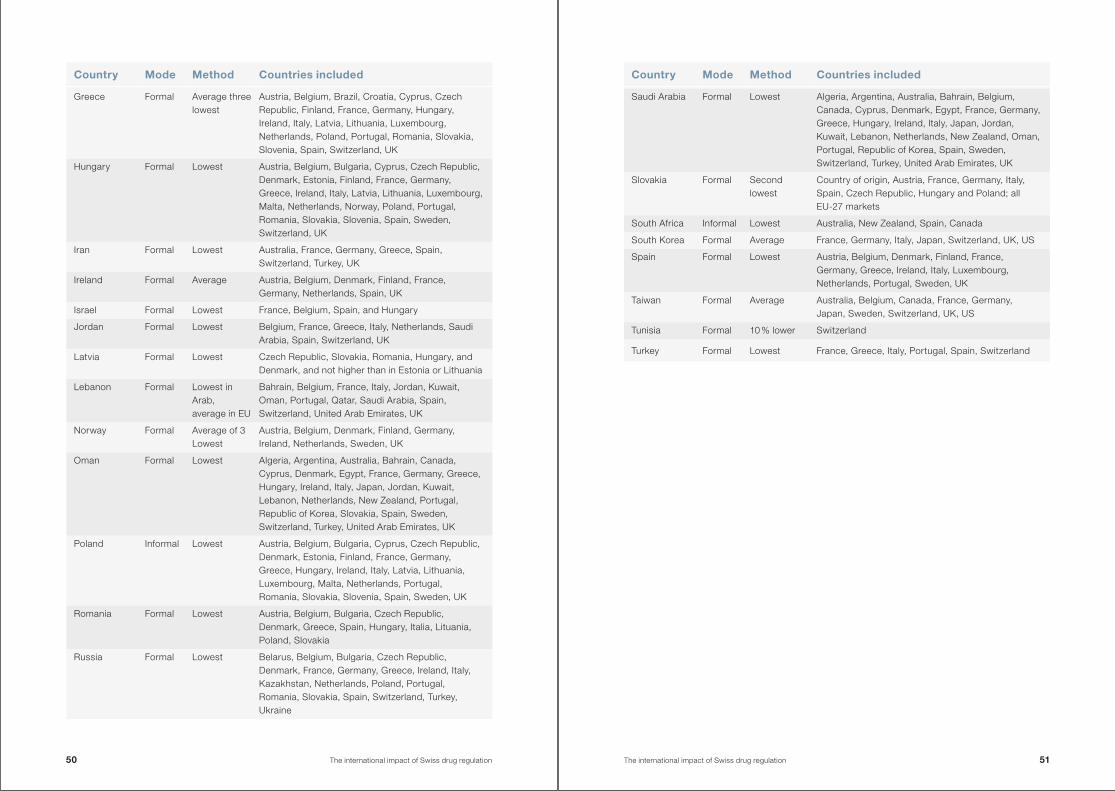
Country Mode Method Countries included
Greece Formal Average three lowest
Austria, Belgium, Brazil, Croatia, Cyprus, Czech Republic, Finland, France, Germany, Hungary, Ireland, Italy, Latvia, Lithuania, Luxembourg, Netherlands, Poland, Portugal, Romania, Slovakia, Slovenia, Spain, Switzerland, UK
Hungary Formal Lowest Austria, Belgium, Bulgaria, Cyprus, Czech Republic, Denmark, Estonia, Finland, France, Germany, Greece, Ireland, Italy, Latvia, Lithuania, Luxembourg, Malta, Netherlands, Norway, Poland, Portugal, Romania, Slovakia, Slovenia, Spain, Sweden, Switzerland, UK
Iran Formal Lowest Australia, France, Germany, Greece, Spain, Switzerland, Turkey, UK
Ireland Formal Average Austria, Belgium, Denmark, Finland, France, Germany, Netherlands, Spain, UK
Israel Formal Lowest France, Belgium, Spain, and Hungary
Jordan Formal Lowest Belgium, France, Greece, Italy, Netherlands, Saudi Arabia, Spain, Switzerland, UK
Latvia Formal Lowest Czech Republic, Slovakia, Romania, Hungary, and Denmark, and not higher than in Estonia or Lithuania
Lebanon Formal Lowest in Arab, average in EU
Bahrain, Belgium, France, Italy, Jordan, Kuwait, Oman, Portugal, Qatar, Saudi Arabia, Spain, Switzerland, United Arab Emirates, UK
Norway Formal Average of 3 Lowest
Austria, Belgium, Denmark, Finland, Germany, Ireland, Netherlands, Sweden, UK
Oman Formal Lowest Algeria, Argentina, Australia, Bahrain, Canada, Cyprus, Denmark, Egypt, France, Germany, Greece, Hungary, Ireland, Italy, Japan, Jordan, Kuwait, Lebanon, Netherlands, New Zealand, Portugal, Republic of Korea, Slovakia, Spain, Sweden, Switzerland, Turkey, United Arab Emirates, UK
Poland Informal Lowest Austria, Belgium, Bulgaria, Cyprus, Czech Republic, Denmark, Estonia, Finland, France, Germany, Greece, Hungary, Ireland, Italy, Latvia, Lithuania, Luxembourg, Malta, Netherlands, Portugal, Romania, Slovakia, Slovenia, Spain, Sweden, UK
Romania Formal Lowest Austria, Belgium, Bulgaria, Czech Republic, Denmark, Greece, Spain, Hungary, Italia, Lituania, Poland, Slovakia
Russia Formal Lowest Belarus, Belgium, Bulgaria, Czech Republic, Denmark, France, Germany, Greece, Ireland, Italy, Kazakhstan, Netherlands, Poland, Portugal, Romania, Slovakia, Spain, Switzerland, Turkey, Ukraine
Country Mode Method Countries included
Saudi Arabia Formal Lowest Algeria, Argentina, Australia, Bahrain, Belgium, Canada, Cyprus, Denmark, Egypt, France, Germany, Greece, Hungary, Ireland, Italy, Japan, Jordan, Kuwait, Lebanon, Netherlands, New Zealand, Oman, Portugal, Republic of Korea, Spain, Sweden, Switzerland, Turkey, United Arab Emirates, UK
Slovakia Formal Second lowest
Country of origin, Austria, France, Germany, Italy, Spain, Czech Republic, Hungary and Poland; all EU-27 markets
South Africa Informal Lowest Australia, New Zealand, Spain, Canada
South Korea Formal Average France, Germany, Italy, Japan, Switzerland, UK, US
Spain Formal Lowest Austria, Belgium, Denmark, Finland, France, Germany, Greece, Ireland, Italy, Luxembourg, Netherlands, Portugal, Sweden, UK
Taiwan Formal Average Australia, Belgium, Canada, France, Germany, Japan, Sweden, Switzerland, UK, US
Tunisia Formal 10 % lower Switzerland
Turkey Formal Lowest France, Greece, Italy, Portugal, Spain, Switzerland
50 The international impact of Swiss drug regulation The international impact of Swiss drug regulation 51
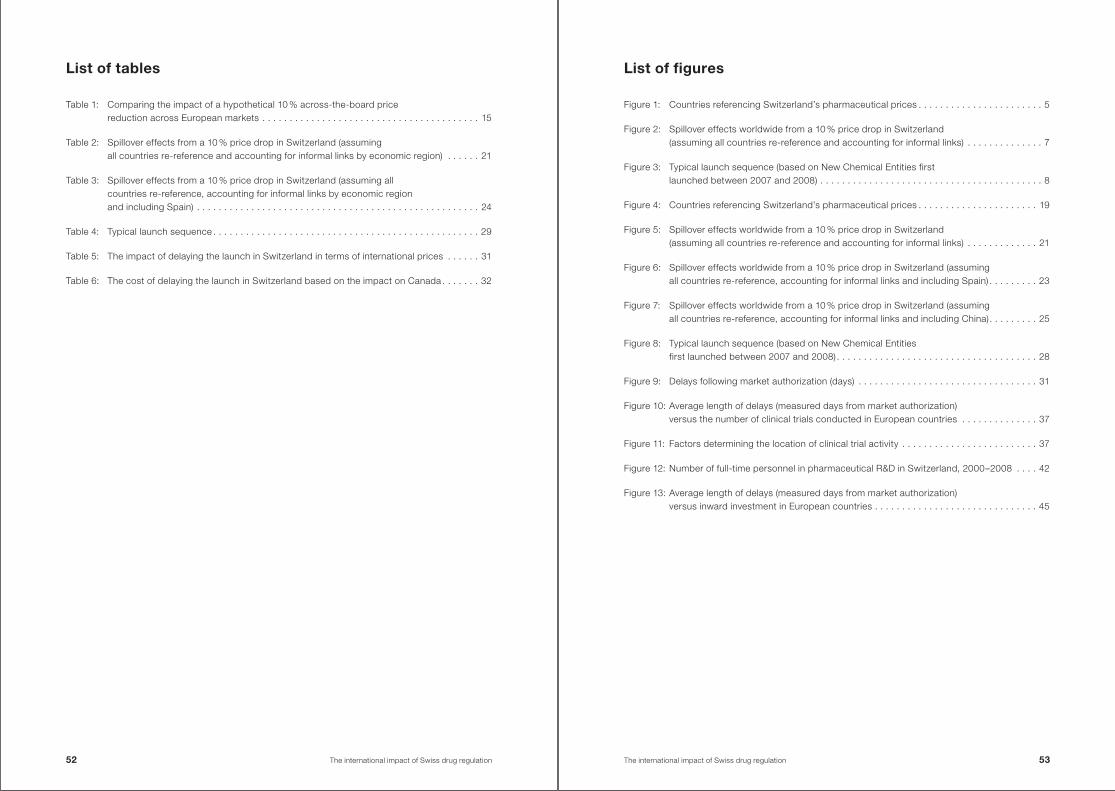
List of figures
Figure 1: Countries referencing Switzerland’s pharmaceutical prices . . . . . . . . . . . . . . . . . . . . . . . 5
Figure 2: Spillover effects worldwide from a 10 % price drop in Switzerland (assuming all countries re-reference and accounting for informal links) . . . . . . . . . . . . . . 7
Figure 3: Typical launch sequence (based on New Chemical Entities first launched between 2007 and 2008) . . . . . . . . . . . . . . . . . . . . . . . . . . . . . . . . . . . . . . . . . 8
Figure 4: Countries referencing Switzerland’s pharmaceutical prices . . . . . . . . . . . . . . . . . . . . . . 19
Figure 5: Spillover effects worldwide from a 10 % price drop in Switzerland (assuming all countries re-reference and accounting for informal links) . . . . . . . . . . . . . 21
Figure 6: Spillover effects worldwide from a 10 % price drop in Switzerland (assuming all countries re-reference, accounting for informal links and including Spain) . . . . . . . . . 23
Figure 7: Spillover effects worldwide from a 10 % price drop in Switzerland (assuming all countries re-reference, accounting for informal links and including China) . . . . . . . . . 25
Figure 8: Typical launch sequence (based on New Chemical Entities first launched between 2007 and 2008) . . . . . . . . . . . . . . . . . . . . . . . . . . . . . . . . . . . . . 28
Figure 9: Delays following market authorization (days) . . . . . . . . . . . . . . . . . . . . . . . . . . . . . . . . . 31
Figure 10: Average length of delays (measured days from market authorization) versus the number of clinical trials conducted in European countries . . . . . . . . . . . . . . 37
Figure 11: Factors determining the location of clinical trial activity . . . . . . . . . . . . . . . . . . . . . . . . . 37
Figure 12: Number of full-time personnel in pharmaceutical R&D in Switzerland, 2000–2008 . . . . 42
Figure 13: Average length of delays (measured days from market authorization) versus inward investment in European countries . . . . . . . . . . . . . . . . . . . . . . . . . . . . . . 45
List of tables
Table 1: Comparing the impact of a hypothetical 10 % across-the-board price reduction across European markets . . . . . . . . . . . . . . . . . . . . . . . . . . . . . . . . . . . . . . . . 15
Table 2: Spillover effects from a 10 % price drop in Switzerland (assuming all countries re-reference and accounting for informal links by economic region) . . . . . . 21
Table 3: Spillover effects from a 10 % price drop in Switzerland (assuming all countries re-reference, accounting for informal links by economic region and including Spain) . . . . . . . . . . . . . . . . . . . . . . . . . . . . . . . . . . . . . . . . . . . . . . . . . . . . 24
Table 4: Typical launch sequence . . . . . . . . . . . . . . . . . . . . . . . . . . . . . . . . . . . . . . . . . . . . . . . . . 29
Table 5: The impact of delaying the launch in Switzerland in terms of international prices . . . . . . 31
Table 6: The cost of delaying the launch in Switzerland based on the impact on Canada . . . . . . . 32
52 The international impact of Swiss drug regulation The international impact of Swiss drug regulation 53

InterpharmaPetersgraben 35, P .O . BoxCH-4003 BaselPhone +41 (0)61 264 34 00Fax +41 (0)61 264 34 01info@interpharma .chwww .interpharma .ch