Study of training and development activities - Home - D. Y. · PDF file ·...
262
i Study of training and development activities A Case study of Sangam Dairy
Transcript of Study of training and development activities - Home - D. Y. · PDF file ·...

i
Study of training and development
activities
A Case study of Sangam Dairy
ii
Study of training and development activities
A Case study of Sangam Dairy
Dissertation Submitted to the
Padmashree Dr. D.Y. Patil University,
Department of Business Management
in partial fulfillment of the requirements for the award of
the Degree of
Master in Philosophy (Business Management)
Submitted by:
Jyothi P (Roll No. DYP-M.Phil-09004)
Research Guide:
Dr. R. Gopal Director, Dean and HOD
Padmashree Dr. D.Y. Patil University, Department of Business Management
Sector 4, Plot No. 10, CBD Belapur, Navi Mumbai. 400 614
March 2011

iii
Declaration
I hereby declare that the dissertation “Study of Training and
development activites - A Case Study of Sangam Dairy” submitted
for the degree of Master in Philosophy (Business Management) at
Padamshree Dr. D.Y. Patil University‘s Department of Business
Management is my original work and the dissertation has not formed the
basis for the award of any degree, associate ship, fellowship or any
other similar titles.
Place: Navi Mumbai (Jyothi P)
Date:

iv
Certificate
This is to certify that the dissertation titled “Study of Training and
development activites - A Case Study of Sangam Dairy‖ is the bona
fide research work carried out by Mrs. Jyothi P, student of Master in
Philosophy (Business Management), at Padamshree Dr. D.Y. Patil
University‘s Department of Business Management during the period
2009-2011, in partial fulfillment of the requirements for the award of the
Degree of ‗Master in Philosophy (Business Management)‘ and that the
dissertation has not formed the basis for the award previously of any
degree, diploma, associate ship, fellowship or any other similar title.
Place: Navi Mumbai (Dr. R. Gopal)
Date:

v
Acknowledgement
It is an honour for me to present this thesis as an MPhil student and
greatly indebted to Padamshree Dr. D.Y. Patil University‘s Department of
Business Management, which has offered me admission to M. Phil.
program and provided me an excellent opportunity to carry out this
research project. I owe my deepest gratitude to Dr. R. Gopal, Director,
Dean and HoD, Department of Business Management of Padamshree
Dr. D.Y. Patil University, whose valuable guidance, encouragement and
support throughout the course of the project which enabled me develop
an understanding of the project. Without his encouragement and
guidance, this project would not have reached this stage.
I would like to thank the management and employees of Sangam Dairy,
Sangam Jagarlamudi, Guntur (dt) for their help and cooperation in
collection of data for this project. I would like to express my deepest
gratitude to my father-in-law Prof D Ramakotaiah, Former Vice-
Chancellor, Nagarjuna University for his help and guidance in analysing
the data and his encouragement which helped me in many ways in
overcoming various hurdles and enhancing my determination to
complete my project. I would like to express my sincere thanks to my
husband Chandra Sekhar for sparing a good amount of his spare in
helping me with the project and my children Yashwanth and Drithi for
supporting me and allowing me to spend my free time on this project
work.
Lastly I offer my regards to all those who directly or indirectly helped and
supported me in completion of this project.
Place: Navi Mumbai (Jyothi P)
Date:

vi
Contents
List of abbreviations ........................................................................................ x
List of Tables ............................................................................................. xii
List of Figures ............................................................................................. xii
Executive Summary ...................................................................................... xiii
1. Introduction ............................................................................................... 1
1.0 Origin and Importance of Training ...................................................... 2
1.1 Meaning and definition of training ...................................................... 5
1.2 Need and importance of training ........................................................ 6
2. Concepts and theories ............................................................................. 8
2.0 Methods of Training ........................................................................... 9
2.0.1 On-the-job training methods ................................................... 9
2.0.2 Job Rotation ......................................................................... 10
2.0.3 Coaching .............................................................................. 10
2.0.4 Job Instruction ...................................................................... 10
2.0.5 Committee Assignments ....................................................... 10
2.1 Off-the-Job Methods ........................................................................ 11
2.1.1 Vestibule training .................................................................. 11
2.1.2 Role Playing ......................................................................... 11
2.1.3 Lecture Method ..................................................................... 11
2.1.4 Conference or Discussion ..................................................... 12
2.1.5 Programmed Instruction ....................................................... 12
2.2 Evaluation of Training ...................................................................... 12
3. Dairy Industry – Introduction ................................................................. 14
3.0 The Dairy Industry ............................................................................ 15
3.1 Dairying Meaning ............................................................................. 16
3.2 History of Dairy Development ........................................................... 16
3.3 Infrastructure: Dairy Industry ............................................................ 17
3.4 White revolution ............................................................................... 19
3.5 Importance of the Dairy Industry ...................................................... 22
3.6 India: World‘s Largest Milk Producer ................................................ 23
3.7 Dairy in India .................................................................................... 26
3.8 Anand Pattern .................................................................................. 30
vii
3.9 National Dairy Development Board (NDDB) ..................................... 33
3.10 Indian Dairy Corporation (IDC) ......................................................... 34
3.11 Operation Flood I, II and III............................................................... 34
3.12 Dairy development in Andhra Pradesh ............................................. 38
3.13 State-Wise Growth of Milk Production under Operation Flood .......... 39
4. Literature review ..................................................................................... 40
4.0 Review of literature on Training and development ............................ 41
4.1 Review of literature on Dairy Industry ............................................... 53
5. Objectives ............................................................................................. 57
6. Research Methodology........................................................................... 59
6.0 Secondary data: ............................................................................... 60
6.1 Primary Data: ................................................................................... 61
6.2 Sample size: .................................................................................... 61
6.3 Sampling Method: ............................................................................ 61
6.4 Data collection method ..................................................................... 61
6.4.1 Questionnaires: .................................................................... 62
6.4.2 Schedules: ............................................................................ 62
6.5 Data Analysis: .................................................................................. 62
7. Sangam Dairy – A case study ................................................................ 63
7.0 Company profile of Sangam Dairy.................................................... 64
7.1 Organisational structure ................................................................... 67
7.2 Market profile of sangam dairy ......................................................... 68
7.3 Some facts about Sangam ............................................................... 69
7.4 Other Services ................................................................................. 70
7.5 Future targets .................................................................................. 70
7.6 Awards and recognitions .................................................................. 71
7.7 Innovations and interventions ........................................................... 71
7.8 Services offebred to the milk producers by Sangam ........................ 72
7.8.1 Milk procurement .................................................................. 72
7.8.2 Animal breeding services ...................................................... 72
7.8.3 Feed and fodder development .............................................. 73
7.8.4 Animal health programme ..................................................... 73
7.8.5 Other activities ...................................................................... 73
7.9 Man power status ............................................................................. 74
viii
7.10 HR Activities in Sangam Diary ......................................................... 74
7.11.1 Recruitment .......................................................................... 75
7.11.2 Recruitment policy ................................................................ 75
7.11.3 Selection ............................................................................... 75
7.12 Industrial relations ............................................................................ 77
7.12.1 Grievance redressal system ................................................. 77
7.12.2 Industial disputes system ...................................................... 77
7.12.3 Works commiittee ................................................................. 77
7.12.4 Safety committee .................................................................. 77
7.13 Wage and salary administration ....................................................... 77
7.13.1 Job Evaluation ...................................................................... 77
7.13.2 Wage and salary components .............................................. 78
7.14 Performance appraisal ..................................................................... 78
7.14.1 Methods of Performance Appraisal ....................................... 78
7.15 Employee welfare and social security .............................................. 79
7.16 Social security .................................................................................. 79
7.17 Training programmes arranged in Sangam Dairy ............................. 79
7.17.1 On the job training ................................................................ 79
7.17.2 Off the job training ................................................................ 80
8. Data Analysis .......................................................................................... 87
8.0 General questions ............................................................................ 88
8.1 Questions specific to Executives ...................................................... 96
8.2 Questions specific to Workers ........................................................ 105
8.3 Questions specific to HR Executives .............................................. 118
9 Conclusions, Suggestions and Limitations ........................................ 129
9.0 Conclusions & findings ................................................................... 130
9.1 Suggestions ................................................................................... 131
9.2 Limitations ...................................................................................... 133
10 Appendix I – Research questionnaire ................................................. 134
10.0 Questionnaire on Training and Development for Managers ........... 135
10.1 Questionnaire on Training and Development For workers .............. 139
10.2 ........................................ 143
10.3 Questionnaire on Training and Development for HR executives .... 146
11 Appendix II – SPSS Output .................................................................. 150

ix
11.0 Responses of Executives ............................................................... 151
11.1 Responses of HR Executives ......................................................... 182
11.2 Responses of workers .................................................................... 206
12. Appendix III – Bibliography .................................................................. 236
12.0 Books ............................................................................................. 237
12.1 Journals ......................................................................................... 238
12.2 Webliography ................................................................................. 240
13 Appendix IV – Copies of Literature ...................................................... 241

x
List of abbreviations
AMUL Anand co-operative Milk producers Union Limited
APDDCF Andhra Pradesh Dairy Development Co-operative
Federation
BPE Bureau of Public Enterprises
ECM Energy Corrected Milk
FAO Food and Agriculture Organisation
GATT General Agreement on Tariffs and Trade
GBMS Greater Bombay Milk Scheme
GDP Gross Domestic Product
HQ Head Quarters
HR Human Resource
HRD Human Resource Department
ICMR Indian Council of Medical Research
IFCN International Farm Comparison Network
IWFP India World Food Programme
MCM Mahila Chetna Manch
MOA Ministry of Agriculture
NCA National Commission on Agriculture
NDDB National Dairy Development Board
OD Operational Development
OF Operation Flood

xi
UNICEF United Nations International Children‘s Emergency Fund
VDC Veterinary Development Council
WFP World Food Programme
WTO World Trade Organization
GOI Government of India
AI Artificial Insemination
xii
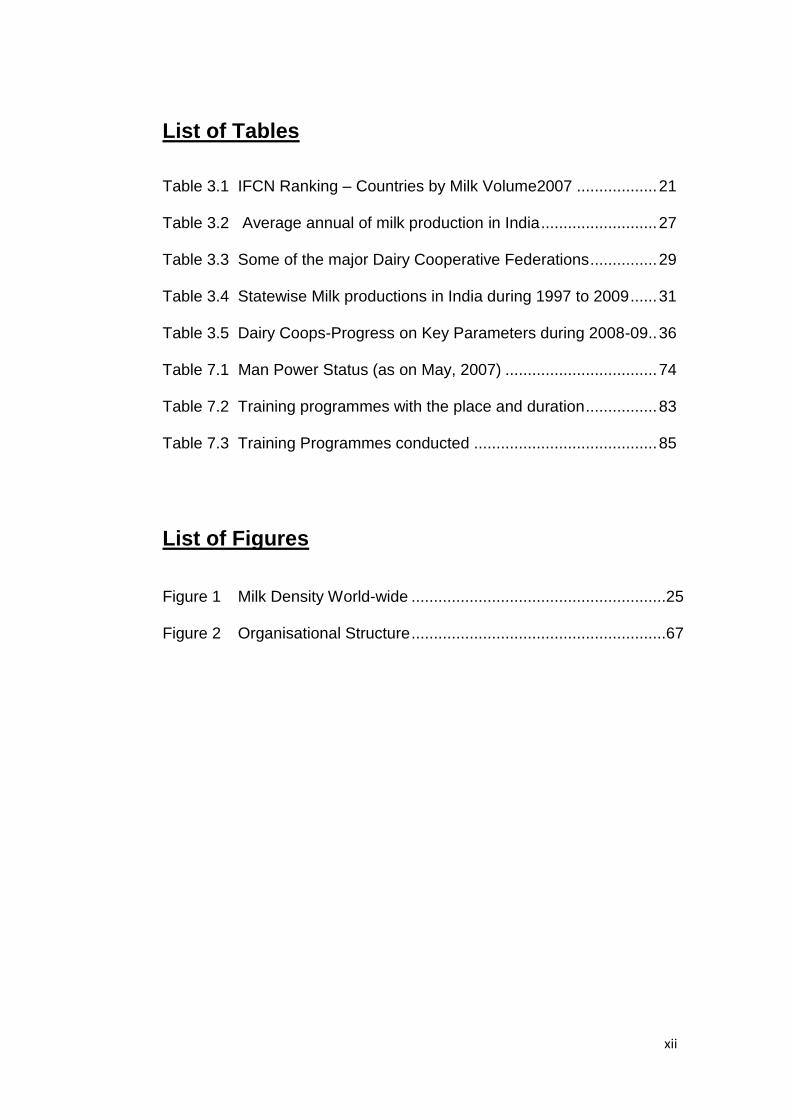
List of Tables
Table 3.1 IFCN Ranking – Countries by Milk Volume2007 .................. 21
Table 3.2 Average annual of milk production in India .......................... 27
Table 3.3 Some of the major Dairy Cooperative Federations ............... 29
Table 3.4 Statewise Milk productions in India during 1997 to 2009 ...... 31
Table 3.5 Dairy Coops-Progress on Key Parameters during 2008-09 .. 36
Table 7.1 Man Power Status (as on May, 2007) .................................. 74
Table 7.2 Training programmes with the place and duration ................ 83
Table 7.3 Training Programmes conducted ......................................... 85
List of Figures
Figure 1 Milk Density World-wide .........................................................25
Figure 2 Organisational Structure .........................................................67

xiii
Executive Summary

xiv
Executive Summary
Introduction:
The beginning of training could be traced to the Stone Age when people
started transferring knowledge through signs and deeds to others.
Vocational training started during the industrial revolution when
apprentices were provided direct instructions in the operation of
machines. Training is an educational process. People can learn new
information, re-learn and reinforce existing knowledge and skills, and
most importantly have time to think and consider what new options can
help them improve their effectiveness at work. Effective trainings convey
relevant and useful information that inform participants and develop skills
and behaviors that can be transferred back to the workplace.
Training can help employees better understand the information they are
given and can encourage them to play a fuller part in the way the
organisation conducts its affairs. Training is one of the most crucial ways
that organizational performance can be improved. Employee training is
the attempt at improving the employee‘s performance, to result in overall
increased organizational performance.
Meaning and definition of training:
The term ―TRAINING‖ is often interpreted as an activity when an expert
and learner work together to effectively transfer information from the
expert to the learner. (To enhance a learner‘s knowledge attitudes or
skills) so the learner can perform a current task as job in a better way.
In simple terms ―Training may be defined as a planned program
designed to improve performance and to bring about measurable
changes in knowledge, skills, attitude and social behavior of employees
for doing a particular job‖. Several leading personalities like FLIPPO,
CAMP BELL, Dale. S. Beach defined the training and gave their
xv
interpretation of training. From these definitions it is clear that every
employee should be given training in order to bring required changes in
his knowledge, skills and attitudes for optimum performance and
contribution to the organization. For this purpose, it is presumed that
every employee should possess formal education. However, a training
program includes an element of education.
Training is aimed at application of knowledge gained, to have job
experience to perform specific tasks. Whereas education is to provide
theoretical orientation through class - room learning and bring
awareness about general concepts and develop broad perspective.
There is a basic distinction between education and training. Training can
be described as a short - term process utilizing a systematic and
organized procedure by which non-managerial personnel acquire
technical knowledge and skills for a definite purpose. It refers to
instructions in technical and mechanical operations and designed
primarily to suit non-managerial personnel to perform specific jobs. As
employees are to be trained according to the changes taking place in the
organization generally training programs have short duration.
Training is a process of increasing knowledge and skill for a specific job.
Training is aimed at improving the behavior and performance of a
person.
Need and importance of training :
There are several reasons for imparting training. They are as follows:
1. To make employees more effective and productive.
2. To match the employee specification with job requirements of
organizational needs.
3. To cope with the technological advancements.
4. To improve the quality of product I service.
5. To reduce wastage.

xvi
6. To minimize industrial accidents.
7. To prevent obsolescence.
8. To deal with human relations.
9. To increase the fair value earning power & job security of
employees.
10. It moulds the employee‘s attitude and helps them to achieve a
better co-operation.
11. To improve organization climate.
12. To reduce grievances and reduce accidents.
13. To reduce grievances and safety of employees.
14. To fulfill the need for additional hands to cope with an
increased production of goods and services.
Dairy Industry:
Majority of rural population are dependent on agriculture and allied
activities. Dairying and animal husbandry are very closely connected
with agriculture in the country constituting over 26 per cent of agricultural
output. Dairy sector alone accounts for about two third of animal
husbandry output. The dairy economy derives its strength of 288 million
(1992) of cattle and buffaloes, accounting 19 per cent of the global and
51 per cent of Asian bovine population. India ranked second in the world
after the United States of America in milk production.
In the narrow sense ‗dairying‘ can he understood as an activity related to
the production and consumption of milk and milk products. cattle and
buffaloes, especially milch animals, with a view to improvising the
productivity and production of milk to be used in the production of milk
products. Dairying can also be construed as that which includes animal
husbandry with the ultimate objective of upgrading the cattle for better
exploitation of drought power. Dairy development consists of many kinds
of changes — changes in milk production (involving changes in milch
animals, their feeding and management), changes in milk handling and
processing (involving changes in transportation. Techniques of milk
xvii
treatment and preservation), and changes in milk marketing (involving
packing. storage. transport and related methods). One common
characteristic of all these kinds of changes is that a tangible set of inputs
and outputs of dairy system must undergo some technical change
The growth of the dairy industry, took place almost entirely in the
cooperative sector under the ―Operation Flood‖ projects I. II and III
between 1970 and 1994. The infrastructure and manpower of the
National Dairy Development Board itself are indeed a part the MoA
(Department of AH&D), but these are limited to the essential physical
facilities for offices in their HQ at Anand and the four regional offices at
Delhi, Calcutta. Bombay. and Bangalore; arid the professional and
supporting staff that oversee the implementation of the Operation Flood
arid Oil Seed Growers Project, the NDDB underwent three rounds of
voluntary retirement schemes for its employees at all levels between
1992 and 2000: and have considerably reduced and reoriented the
workforce to suit the newer challenges during the 21st century. The
NDDB also has in its fold. Several managed units and fully owned
subsidiaries, aiding and supporting the development activities under its
core projects.
Importance of the Dairy Industry:
The number of operational holdings in India is increasing and average
size of holding (about 1.68) is going down. There are about 96 million
small and marginal holdings, owning on an average less than two half
acres of land. In addition, about 30 per cent of the rural households are
landless. There is extreme inequality in the present distribution of land in
India, which emphasizes the basic cause of problem of small
Landholders. In contrast, significantly, the distribution of milk animals in
rural areas is less skewed, as compared to land and the productivity of
animals kept by small farmers doesn‘t compare unfavorably with that of
large farmers.

xviii
HRD in dairy industry :
Development function has to do with increasing of skill, knowledge,
behaviour and infusing the result kind of attitude. HRD function remained
largely a neglected area in initial years of both the units. They were
confined mostly to deputing some higher level to places like Anand,
Erode, Bombay, Bangalore and Hyderabad. These activities were meant
for cattle rearing, increasing the yield in milk, dairy technology aspects
such as preserving milk, aseptic packaging, quality control and
marketing of milk products. There was neither a cogent policy nor
regular training activity in these organizations at the stage.
But during the last decade or so the HRD activity has received
importance. It has been realized that the activities must be organized on
the basis of need and in a systematic way at all levels of employees. In
general HRD is regarded as an integral aspect of the personnel
department and the department is entrusted with the responsibility of
organizing HRD function.
SangamDairy:
The Sangam diary offers and illustration of one of the most successful
dairies sponsored on the Anand pattern. The name and style of the
Sangam dairy is due to presence of ―Sangameswara temple at village
Sangam Jagarlamudi in the immediate vicinity of the dairy plant. The
dairy is located on the Guntur & Tenali highway (via Narakodur) about
16 km from Guntur town.
Andhra Pradesh has permanent place in the dairy map of India. The
cattle wealth of A.P. is estimated at Rs. 220 crores and account of 70
per cent total value. The Sangam dairy, Vadlamudi was commissioned
on 1-8-1978.
The Dairy has provision to mark 8 M.T of butter, 6 M.T of Ghee and 22
M.t of milk powder per day. The surplus milk after meeting the demand
xix
from the public will be converted into products. Sangam Ghee is
consumed pack is being done only from Sangam Dairy, Vadlamudi in the
state. During 1988, trails were successfully conducted on manufacture of
infant milk food, based on the formula, provided by the centre
subsequently. Infant milk food with the brand name of ―Sangam spray‖
was introduced in customer pack of 1kg and ½ kg throughout the
country. The Sangam diary, Vadlamudi had the distinction of being first
public sector organization in the county, which produces milk powder -
skim and whole milk powder. The Ice cream milk powder is also being
manufactured in the dairy.
Objectives of the study:
1. To understand the need and nature of the training
programmes.
2. To understand the organizational infrastructure available to
conduct the employee training programmes.
3. To get a feedback from the employees with respect to the
usefulness of the training programmes.
4. To identify the gap in the training programmes of the sample
organization and make suggestion to improve the same.
5. The study has been done with and special reference to
Sangam Dairy.
Research Methodology:
The sample size for data collection is 125. The type of sampling chosen
is ―Stratified sampling‖ as the population is divided into different
segments on the basis of certain common characteristics and then
selection of items randomly from them to constitute the sample. For the
study the sample is selected randomly from different departments and
different levels in each department. Necessary care was taken so ensure
the sampling remained random. The method used for data collection for
the study is questionnaire and schedules. Data collected from the above

xx
exercise was fed to the SPSS software and an analysis was carried on
the output of the SPSS. The graph and tables that were generated by
the software is enclosed at Annexure II. The analysis was carried out
separately for workers, executives and HR employees engaged in the
process of training employees.
Findings:
1. Majority of the employees are quite satisfied with the training
programmes conducted in Sangam.
2. Mostly in-house training programmes are conducted than
institutional training programmes.
3. Employees participate in determining their training programmes
and orient them to their specific needs.
4. Training programmes are not linked with performance appraisal.
Promotion policy in sangam is mostly based on seniority.
5. Most of the employees are having more than 20-30 years of
experience. But in this period of their service, yearly they are
only 2-4 training programmes some of them have not attended
any training programmes.
6. The training programmes held are mostly of short term training
programme and they are mostly on the job training programmes
and the employees also preferred on the job training
programmes.
7. Most of the employees agreed that training programmes help in
achieving individual as well as organizational goals.
8. In sangam training needs are identified by the need and
suggestions of superiors and the HR people also said the same.
9. In Sangam most of the employees accepted that time duration
given for them is sufficient.
10. In Sangam nearly half of the employees have not been given
induction training programme, most of the employees have
suggested that induction training programmes are essential.

xxi
11. In Sangam more than half of the employees are given more
responsibility after training programmes, very few are getting
promotion or financial incentives. This may be the reason the
employees are not that interested in training programmes.
12. In Sangam, the management is not sending employees to
government aided training programmes. These training
programmes are very helpful for the employees but however no
one is sponsored in the recent past.
13. In Sangam HR people accepted that only some of the training
objectives are met at present but they are making effort to meet
all the objectives.
14. Training programmes held so far gave satisfactory results.
15. In Sangam preference is given to young employees who have
joined recently for training programmes.

1
1. Introduction 1.0 Origin and Importance of Training ................................................. 2
1.1 Meaning and definition of training .................................................. 5
1.2 Need and importance of training .................................................... 6
2
Chapter 1
Introduction
1.0 Origin and Importance of Training
The beginning of training could be traced to the Stone Age when people
started transferring knowledge through signs and deeds to others.
Vocational training started during the industrial revolution when
apprentices were provided direct instructions in the operation of
machines.
For centuries a kind of training in the business has passed from father to
son, changing over so slightly to adjust to the times which continue even
now in many big companies in India.
With the rapid changes in the business environment, the needs of
management development and training are also changing fast. A few
years back, it is left to individual managers themselves to develop their
managerial competencies. There was hardly handful of organisations,
which had put in place a well - articulated management development
programme. However, with the increasing and growing realisation of HR
as a strategic advantage, many trends and experiments are happening,
especially in management development and in training management in
general.
Building an efficient managerial force requires not only proper selection
but also effective training. Industry is frequently compelled particularly
during periods of business expansion to draw people from various
faculties and train them for specific operations. A systematic training
program improves quality and quantity of work in a scientific way,
safeguards machinery, reduces costs, raises employees earnings,
morale and provides a creative means for imparting company‘s policies.

3
In the words of Prof. Lawrence A Appley ―Management is the
development of people to get the things done through them in a
systematic approach. Practical training is a method of importance for a
growing firm to teach the trainee methods and techniques for dealing
with tasks in different departments. The method of skill required for this
purpose by the instructor is great for not only does he need to be able to
give a lucid explanation of the way and also be able to convince his
trainees that the job is important and that it is being done in the best
possible way.
Training can help employees better understand the information they are
given and can encourage them to play a fuller part in the way the
organisation conducts its affairs. Training is one of the most crucial ways
that organisational performance can be improved. Employee training is
the attempt at improving the employee‘s performance, to result in overall
increased organisational performance.
Employees who are insufficiently trained are more susceptible to making
disastrous mistakes that could jeopardise the safety and well being of
both their fellow co-workers and customers
The requirements of training are the combinations of two functions:
1) Technical ability covering both knowledge and experience
2) Personal qualities and administrative ability that consists of
knowledge and understanding of the various policies of the organization.
Whatever may be the process no amount of technical ability is by itself
sufficient for effective supervision unless accompanied by practical
training and experience of the job for a considerable period of time.
Training may be broadly divided into two ways. One is training in with the
industry (TWI) training will be given touch with different departments of

4
the company and they may be attached to training institutes which are
maintained by the industry. For example, the banking industry is having
its own staff training colleges at various places. Similarly one can see
this type of institutes in textile, jute, cement etc.to a maximum extent the
government needs are catered by administrative staff college of india,
Hyderabad. Similarly in Andhra Pradesh govt., has established Marri
Chenna Reddy Institute of Human Resources Development at
Hyderabad to impart training to various state government employees.
On the other hand, professional institutes like Indian institute of
Management, Institute of cost and management accountants (ICMA).
Institute of charted accountants of India (ICAI), Institute of certified
financial analysis of India (ICFAI) have been conducting short term
courses to train the junior/ middle/ senior level executives to meet
specific challenges.
The training called for has to deal with specific objectives of human and
administrative sides of their tasks in general terms as well as in
particular relation to the methods of the individual companies.
Proficiency in these directions requires a two-fold line of training. In the
changing technical conditions training is useful to augment the
manager‘s skill for new environment. Most of the managers are with
technical background and they may have little touch with functional
areas are like personnel management, industrial relations, finance,
industrial psychology, general management and marketing. Training
opens new avenues to present and future managers providing intensive
touch in the most modern skill and techniques.
The training consists of what might be called organised growth providing
systematic assistance in the acquisition of personal qualities making up
leadership and co-operation to achieve the desired objectives. It is
almost inevitable that much of the emphasis in training programs seeks

5
to develop values and attitudes, which are essential ingredients of social
awareness and managerial responsibilities.
Any worthwhile training program aims at improving decision-making
skills in different disciplines. This can be achieved by lectures model
building and role-playing and followed by seminars, Group discussions
and business games. Now-a-days in management, the tools and
techniques drawn from mathematics, economics, behavioral sciences,
computers and statistics are gaining more importance.
The training policy should be based on clear-cut objectives participation
in training emphasizes the importance of trainees responsibilities.
1.1 Meaning and definition of training
The term ―TRAINING‖ is often interpreted as an activity when an expert
and learner work together to effectively transfer information from the
expert to the learner. (To enhance a learner‘s knowledge attitudes or
skills) so the learner can perform a current task as job in a better way.
1. In simple terms ―Training may be defined as a planned program
designed to improve performance and to bring about measurable
changes in knowledge, skills, attitude and social behavior of
employees for doing a particular job‖. According to FLIPPO ―Training
is the act of increasing the knowledge and skills of an employee for
doing a particular job‖.
2. Training is an attempt to improve current of future employee
performance by increasing an employee‘s ability to perform through
learning usually by changing the employee‘s attitude or increasing
his or her skills and knowledge.
3. CAMP BELL defines training as ―Typically designed for a short term,
started set purpose such as the operation of some pieces of
6
machinery, which development involves a broader education for long
term purposes‖.
4. Dale. S. Beach defines the training as ―the organized procedure by
which people learn knowledge and skill for a definite purpose‖.
From the above definitions it is very clear that every employee should be
given training in order to bring required changes in his knowledge, skills
and attitudes for optimum performance and contribution to the
organization. For this purpose, it is presumed that every employee
should possess formal education. However, a training program includes
an element of education.
Training is aimed at application of knowledge gained, to have job
experience to perform specific tasks. Whereas education is to provide
theoretical orientation through class - room learning and bring
awareness about general concepts and develop broad perspective.
There is a basic distinction between education and training. Training can
be described as a short - term process utilizing a systematic and
organized procedure by which non-managerial personnel acquire
technical knowledge and skills for a definite purpose. It refers to
instructions in technical and mechanical operations and designed
primarily to suit non-managerial personnel to perform specific jobs. As
employees are to be trained according to the changes taking place in the
organization generally training programs have short duration.
Training is a process of increasing knowledge and skill for a specific job.
Training is aimed at improving the behavior and performance of a
person.
1.2 Need and importance of training
There are several reasons for imparting training. They are as follows:
7
1. To make employees more effective and productive.
2. To match the employee specification with job requirements of
organizational needs.
3. To cope with the technological advancements.
4. To improve the quality of product I service.
5. To reduce wastage.
6. To minimize industrial accidents.
7. To prevent obsolescence.
8. To deal with human relations.
9. To increase the fair value earning power & job security of
employees.
10. It moulds the employee‘s attitude and helps them to achieve a better
co — operation.
11. To improve organization climate.
12. To reduce grievances and reduce accidents.
13. To reduce grievances and safety of employees.
14. To fulfill the need for additional hands to cope with an increased
production of goods and services.

8
2. Concepts
and theories 2.0 Methods of Training ........................................................................ 9
2.0.1 On-the-job training methods ............................................ 9
2.0.2 Job Rotation ...................................................................10
2.0.3 Coaching ........................................................................10
2.0.4 Job Instruction ................................................................10
2.0.5 Committee Assignments ................................................10
2.1 Off-the-Job Methods ..................................................................... 11
2.1.1 Vestibule training ...........................................................11
2.1.2 Role Playing ...................................................................11
2.1.3 Lecture Method ..............................................................11
2.1.4 Conference or Discussion ..............................................12
2.1.5 Programmed Instruction .................................................12
2.2 Evaluation of Training ................................................................... 12
9
Chapter 2
Concepts and theories
The term ‗training‘ denotes a systematic procedure for training technical
knowhow to the employees so as to increase their knowledge and skills
for doing particular jobs. Training is the act of increasing the knowledge
and skills of an employee for doing a particular job, Training makes
newly appointed workers fully productive in the minimum of time.
Training is equally necessary for the old employees whenever machines
and equipment are introduced and/ or there is a change in the
techniques of doing the things. In fact training is a continuous process. It
does not stop anywhere.
2.0 Methods of Training
As a result of research in the field of training, a number of programmes
are available. Some of these are new methods, while others are
improvements over the traditional methods. The training programmes
commonly used to train operative and supervisory personnel are
discussed below. These programs are classified into on-the-job and off-
the-job training programmes.
2.0.1 On-the-job training methods
This type of training, also known as job instruction training, is the most
commonly used method. Under this method, the individual is placed on a
regular job and taught the skills necessary to perform that job. The
trainee learns under the supervision and guidance of a qualified
instructor. On-the-job training has the advantage of giving firsthand
knowledge and experience under the actual working conditions. On-the-
job training methods include job rotation, coaching, job instruction or
training through step-by-step and committee assignments.

10
2.0.2 Job Rotation
This type of training involves the movement of the trainee from one job
to another. The trainee receives job knowledge and gains experience
from his supervisor or trainer in each of the different job assignments.
Though this method of training is common in training managers for
general management positions, trainees can also be rotated from job to
job in workshop jobs. This method gives an opportunity to the trainee to
understand the problems of employees on their jobs and respect them.
2.0.3 Coaching
The trainee is placed under a particular supervisor who functions as a
coach in training the individual. The supervisor provides feedback to the
trainee on his performance and offers him some suggestions for
improvement. Often the trainee shares some of the duties and
responsibilities of the coach and relieves him of his burden.
2.0.4 Job Instruction
This method is also known as training through step by step. Under this
method, trainer explains the trainee the way of doing the job, job
knowledge and skills and allows him to do the job. The trainer appraises
the performance of the trainee, provides feedback information and
corrects the trainee.
2.0.5 Committee Assignments
Under the committee assignment, group of trainees are given
assignments and asked to solve an actual organizational problem. The
trainees solve the problem jointly. It develops team work.

11
2.1 Off-the-Job Methods
Under this method of training, trainee is separated from the job situation
and his attention is focused upon learning the material related to his
future job performance. Off-the-job training methods are as follows.
2.1.1 Vestibule training
In this method, actual work conditions are simulated in a class room.
Material, files and equipment which are used in actual job performance
are also used in training. This type of training is commonly used for
training personnel for clerical and semi-skilled jobs. The duration of this
training ranges from days to a few weeks.
2.1.2 Role Playing
It is defined as a method of human interaction that involves realistic
behaviour in imaginary situations. This method of training involves
action, doing and practice. The participants play the role of certain
characters, such as the production manager, mechanical engineer,
superintendent, maintenance engineer, quality control inspector,
foreman, worker and the like. This method is mostly used for developing
interpersonal interactions and relations.
2.1.3 Lecture Method
The lecture is a traditional and direct method of instruction. The
instructor organizes the material and gives it to a group of trainees in the
form of a talk. To be effective, the lecture must motivate and create
interest among the trainees. An advantage of lecture method is that it is
direct and can be used for a large group of trainees.
12
2.1.4 Conference or Discussion
It is a method in training the clerical, professional and supervisory
personnel. This method involves a group of people who pose ideas,
examine and share facts, ideas and data, test assumptions, and draw
conclusions, all of which contribute to the improvement of job
performance. Discussion has the distinct advantage over the lecture
method as the discussion involves two-way communication and hence
feedback is provided. The participants feel free to speak in small groups.
The success of this method depends on the leadership qualities of the
person who leads the group.
2.1.5 Programmed Instruction
In recent years this method has become popular. The subject — matter
to be learned is presented in a series of carefully planned sequential
units. These units are arranged from simple to more complex levels of
instruction. The trainee goes through these units by answering questions
or filling the blanks. This method is expensive and time consuming.
2.2 Evaluation of Training
In order to assess the extent to which training programmes have
achieved the purposes for which they are designed, it is necessary to
evaluate various activities that have culminated in the implementation of
the training package. Such an evaluation exercise would provide
relevant information not only about the effectiveness of training but also
about the future design of other training programmes. It is through the
process of evaluation that training specialists can monitor the training
prgorammes and update, modify and innovate in future training
programme. The evaluation of the outcome and consequence of training
also provides useful data on the basis of which relevance of training and
it‘s integration with other functions of management can be established.
13
Employee development, which involves improving and increasing the
abilities of employees, is required for the success of organizations.
Development begins with the orientation programme and continues to
change. When there is a personnel Department, the responsibility for
planning and implementing formal employee development programmes
usually is delegated to it. Otherwise, employee development is
conducted informally by various individuals and groups.
The primary activities involved in employee development are orientation,
training in job skills, and cultivation of managerial skills. Other activities
related to employee development are evaluating performance,
counseling and communicating organizational policies and procedures.
2.3 HRD in dairy industry
Development function has to do with increasing of skill, knowledge,
behaviour and infusing the result kind of attitude. HRD function remained
largely a neglected area in initial years of both the units. They were
confined mostly to deputing some higher level people to places like
Anand, Erode, Bombay, Bangalore and Hyderabad. These activities
were meant for cattle rearing, increasing the yield in milk, dairy
technology aspects such as preserving milk, aseptic packaging, quality
control and marketing of milk products. There was neither a cogent
policy nor regular training activity in these organizations at the stage.
But during the last decade or so the HRD activity has received
importance. It has been realized that the activities must be organized on
the basis of need and in a systematic way at all levels of employees. In
general HRD is regarded as an integral aspect of the personnel
department and the department is entrusted with the responsibility of
organizing HRD function.

14
3. Dairy Industry –
Introduction
3.0 The Dairy Industry ......................................................................... 15
3.1 Dairying Meaning........................................................................... 16
3.2 History of Dairy Development ...................................................... 16
3.3 Infrastructure: Dairy Industry ........................................................ 17
3.4 White revolution ............................................................................. 19
3.5 Importance of the Dairy Industry .................................................. 22
3.6 India: World‘s Largest Milk Producer ........................................... 23
3.7 Dairy in India .................................................................................. 26
3.9 National Dairy Development Board (NDDB) ............................... 33
3.10 Indian Dairy Corporation (IDC) .................................................... 34
3.11 Operation Flood I, II and III ........................................................... 34
3.12 Dairy development in Andhra Pradesh ....................................... 38
3.13 State-Wise Growth of Milk Production under Operation Flood . 39
15
Chapter 3
Dairy Industry – Introduction
3.0 The Dairy Industry
Majority of rural population are dependent on agriculture and allied
activities. Dairying and animal husbandry are very closely
connected with agriculture in the country constituting over 26 per
cent of agricultural output. Dairy sector alone accounts for about
two third of animal husbandry output. The dairy economy derives
its strength of about 288 million of cattle and buffaloes, accounting
19 per cent of the global and 51 per cent of Asian bovine
population. India ranked second in the world after the United States
of America in milk production.
Traditionally milk is the most widely accepted and used animal
product in India. But even the satisfactory growth in dairy sector, it
has only been able to raise the per capita milk availability to a little
over 200 grams per day in 1996-97 against the 220 grams
requirement as recommended by the ICMR and National Institute
of Nutrition. In addition to it, there is also another problem with
regarded to the availability of milk. It has been largely varied across
the regions or States. The main constraint to less availability and
large variation across the regions is not only limited to the
production of milk but also purchasing power of the people as well
as inadequate handling and processing facilities and marketing
infrastructure.
Moreover, milk production at the micro level appears substantial
but the extent of marketable surplus constitutes a small proportion
of the total production. Further, retention of milk depends upon
various parameters like food habits, family needs, and ceremonial
16
diversity vis-à-vis milk utilization pattern at the rural producer‘s level
in the country. In the recent years, no precise information in regard
to ration of milk, family consumption, share of marketable surplus
and utilization pattern at the producers level are available at the
national level. As of now, the information regarding the above are
available only from NCA (1976). Therefore, for milk marketing
agencies and balancing out learn flush milk supply, it Is essential to
have latest comprehensive estimates on milk production, retention
marketing, conversion, price realization through sale of milk and
milk products, utilization of milk etc.
3.1 Dairying Meaning
In the narrow sense ‗dairying‘ can he understood as an activity
related to the production and consumption of milk and milk
products. cattle and buffaloes, especially milch animals, with a view
to improvising the productivity and production of milk to be used in
the production of milk products. Dairying can also be construed as
that which includes animal husbandry with the ultimate objective of
upgrading the cattle for better exploitation of drought power. Dairy
development consists of many kinds of changes — changes in milk
production (involving changes in milch animals, their feeding and
management), changes in milk handling and processing (involving
changes in transportation. Techniques of milk treatment and
preservation), and changes in milk marketing (involving packing.
storage. transport and related methods). One common
characteristic of all these kinds of changes is that a tangible set of
inputs and outputs of dairy system must undergo some technical
change
3.2 History of Dairy Development
The agricultural strategy followed since the mid 1960s have by and
large, left the small farmers behind due to the alleged resource –
non-neutral nature of green revolution. In the light of this

17
experience and in view of the present emphasis on social justice in
the planning documents. Dairy farming is receiving scrupulous
attention. The crucial role of dairying is highlighted by the ever
increasing demand for milk and milk products and the need to
provide a nutrient food to combat the widely prevailing malnutrition
problem.
During the pre-independence period, dairy development was
limited to a few pockets of Calcutta, Madras, Bangalore and
Gujarat. The most notable of this venture was an Anand
cooperative Milk producer Union Limited (AMUL) of Kaira district,
Gujarat. But, after independence, government set up the National
dairy development board in 1965 to make the ambitious project a
success. Besides, the operation flood project was taken up in 1970
to balance the demand and supply of milk through making
additional income by replicating the ANAND pattern
3.3 Infrastructure: Dairy Industry
The growth of the dairy industry, took place almost entirely in the
cooperative sector under the ―Operative Flood‖ projects I. II and III
between 1970 and 1994. The infrastructure and manpower of the
National Dairy Development Board itself are indeed a part the MoA
(Department of AH&D), but these are limited to the essential
physical facilities for offices in their HQ at Anand and the four
regional offices at Delhi, Calcutta. Bombay. and Bangalore; arid the
professional and supporting staff that oversee the implementation
of the Operation Flood arid Oil Seed Growers Project, the NDDB
underwent three rounds of voluntary retirement schemes for its
employees at all levels between 1992 and 2000: and have
considerably reduced and reoriented the workforce to suit the
newer challenges during the 21st century. The NDDB also has in
its fold. Several managed units and fully owned subsidiaries, aiding
and supporting the development activities under its core projects.
18
The dairy industry itself, under the cooperative network established
during the OF project, is a completely decentralised infrastructure
network spread over the length and breadth of the country
comprising some 1,33,349 village level societies (as on March
2009), spread over 177 milk unions encompassing nearly 346
districts in the country, States Cooperative Milk marketing
federations (17) and the National Cooperative Dairy Federation of
India. The rural processing and packaging, infrastructure, the urban
milk plants and a part of the specialized transport fleet of Road Milk
Tankers are state federations, and do not form a part of the ‗Public
Sector Infrastructure‖ owned and managed by the State and
Central Government. The Rail Milk Tankers used for long distance
transport of milk by the National Milk Grid, managed by the NDDB,
are however, the property of the NDDB and are made available to
the user dairies on hire. The total number of road & rail tankers in
the system is some 1229 and has the capacity to move up to 0.5
million liters of milk per day. Some of the urban milk plants however
are and part of the government infrastructure both Central and
State.
The organized dairy industry represents less than 20 per cent of
the total milk produced in the country and is made up of three
distinctly different sectors: the Government, the Cooperative and
the Private. Interim volumes of milk actually handled, installed
processing capacities and marketing infrastructure, the cooperative
sector is by far the largest and the most widely owned. In terms of
installed processing capacities alone though, the cooperative and
private sectors have more or less matching capacities and the
government only a small presence. Together they have the
capacity to process some 33 per cent of the daily average, milk
production in the country, but they actually handle less than 20 per
cent
19
Much of the processing capacities created in the private sector in
the wake of the de-licensing of the Indian dairy industry (Liberation
of the Indian Economy in 1991), is lying idle: only some 60 per cent
of the capacities in the private sector are operated on a day to day
basis. In the government sector too most of the primary processing
facilities installed in rural areas (mainly milk chilling centers) are not
functional, and dairy plants in the smaller towns and cities are
grossly underutilized.
In the cooperative sector all plants are used to their full capacity
and remain underutilized only during the lean production season.
Between 1995 and 2000, many new dairy processing facilities
mostly in the private sector, both urban and rural have been added
to the national infrastructure. These processing capacities include
liquid milk processing and manufacture of products: milk powders,
table butter and white butter, cheese, ghee, condensed milk and
milk sweets
3.4 White revolution
The success of the dairy industry lies in the availability of liquid
milk. In India the production of milk has been increasing steadily.
From 21.2 million tonnes in 1968-69, it increased to 110 million
tonnes in 2008-2009. However, since production has peaked and
the demand has saturated, it is now threatening to depress prices.
According to Dr. Kurien, unlike in 1970 when India faced the
problem of scarcity, India today faces the problem of plenty. The
future of the industry according to him depends on finding new
markets. Unless this is done, the industry would stagnate as supply
would swamp demand.
The ongoing liberalization programme and the excess supply of
milk had led to the Government to throw open the industry to the
private sector. The corporate presence in this industry, though

20
significant, is limited to a few large players and a handful of
products. The profitability of the industry has been good. A large
number of cooperative societies and Indian and multinational
corporations have been producing and marketing milk products
With so many corporates coming into the dairy business, there is
bound to the increased competition in some existing products as
well as an introduction of new value added products.
Amrut Milk Products, the first private dairy set up after the
delicensing, is doing well. The unit was set up in October 1992. For
the period April 1993 to March 1994, 13 companies tapped the
capital market, aggregating Rs. 99.43 crore. Ravileela Dairy
Products started a dairy project in March 1994. The total public
issue was for Rs. 5.19 crore. Thapar Milk products started a dairy
project in March 1994, with a capacity to process 300,000 liters of
raw milk a day. The cost of the project was Rs. 21.04 crore. It
collected Rs. 13.95 crore. Roadmaster Foods of the Roadmaster
group expanded its capacity in Punjab by setting up a second unit
with a capacity of 450,000 litres a day.
There has been a flood of new companies entering the market
even last year. Vadilal Dairy International, diversified from ice
cream into milk products such as butter, cheese, cheese spreads,
flavored cheese and ghee. Its fully integrated Rs.25 crore project is
to be located at Sonnar, Maharashtra.
21
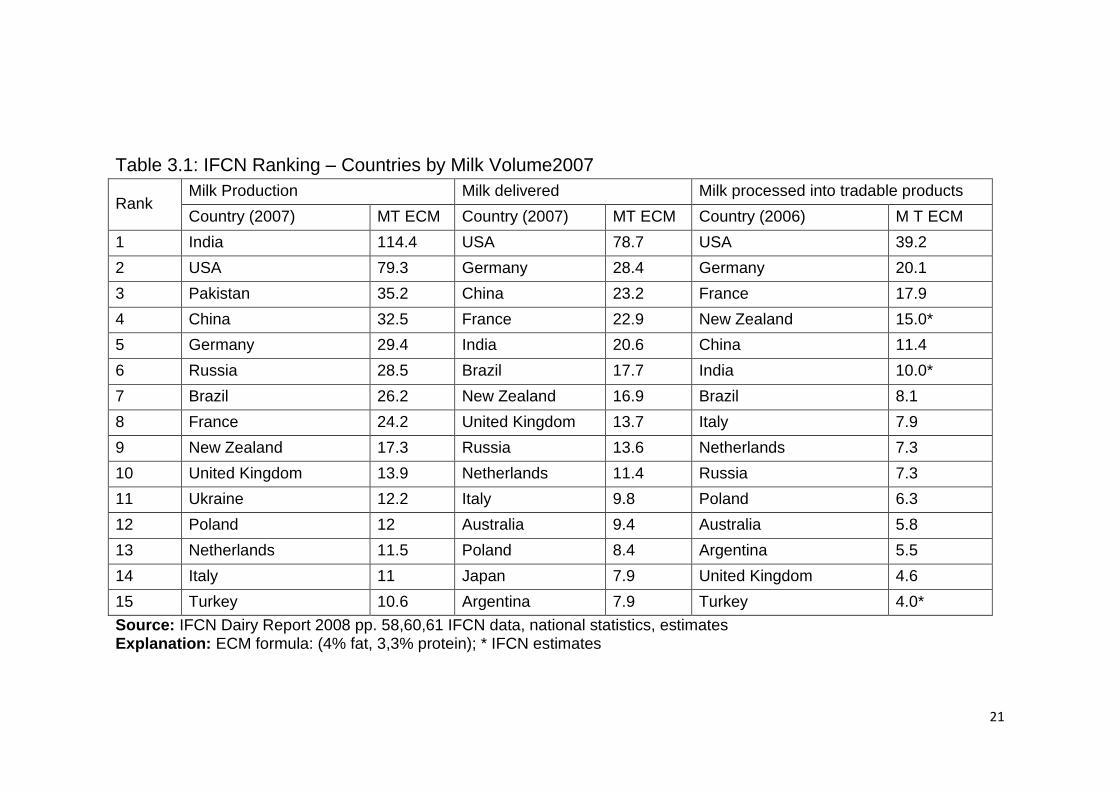
Table 3.1: IFCN Ranking – Countries by Milk Volume2007
Rank Milk Production Milk delivered Milk processed into tradable products
Country (2007) MT ECM Country (2007) MT ECM Country (2006) M T ECM
1 India 114.4 USA 78.7 USA 39.2
2 USA 79.3 Germany 28.4 Germany 20.1
3 Pakistan 35.2 China 23.2 France 17.9
4 China 32.5 France 22.9 New Zealand 15.0*
5 Germany 29.4 India 20.6 China 11.4
6 Russia 28.5 Brazil 17.7 India 10.0*
7 Brazil 26.2 New Zealand 16.9 Brazil 8.1
8 France 24.2 United Kingdom 13.7 Italy 7.9
9 New Zealand 17.3 Russia 13.6 Netherlands 7.3
10 United Kingdom 13.9 Netherlands 11.4 Russia 7.3
11 Ukraine 12.2 Italy 9.8 Poland 6.3
12 Poland 12 Australia 9.4 Australia 5.8
13 Netherlands 11.5 Poland 8.4 Argentina 5.5
14 Italy 11 Japan 7.9 United Kingdom 4.6
15 Turkey 10.6 Argentina 7.9 Turkey 4.0*
Source: IFCN Dairy Report 2008 pp. 58,60,61 IFCN data, national statistics, estimates Explanation: ECM formula: (4% fat, 3,3% protein); * IFCN estimates

22
3.5 Importance of the Dairy Industry
As stated earlier, the number of operational holdings in India is
increasing and average size of holding (about 1.68) is going down.
There are about 96 million small and marginal holdings, owning on
an average less than two half of land. In addition, about 30 per cent
of the rural households are landless. There is extreme inequality in
the present distribution of land in India, which emphasizes the basic
cause of problem of small Landholders. In contrast, significantly, the
distribution of milk animals in rural areas is less skewed, as
compared to land and the productivity of animals kept by small
farmers doesn‘t compare unfavorably with that of large farmers.
Increasing milk production is one way by which we can solve the
problem of marginal and small farmers or even the landless. But to
make this venture a worthwhile proposition provision of a
remunerative market outlet is a must. Rural poor are mostly
powerless. They do not have assets, they are illiterate and
unorganized and do not have sufficient skills.
Since, small farmers are not organized, the middlemen who came
between the producers and the final customer tend to exploit them
and reap the fruits of the big margins available between what the
customers says for the final finished product and what the producers
of the basic material receivers.
The National Dairy Development Board (NDDB) made much needed
interventions and successfully. Conceptualized, designed, organized
and implemented operation flood ensuring a remunerative market
outlet to milk producers round the year through the organization of
Anand pattern milk producers‘ cooperatives and providing regular
supplies of milk to urban customers at reasonable price.

23
3.6 India: World’s Largest Milk Producer
Milk production is an important livestock-sector activity. According to
data gathered by the International Farm Comparison Network
(IFCN), in 2005 around 149 million farm households throughout the
world were engaged in milk production. On average, these
households keep two milking cows (or buffaloes) yielding about 11
liters/day. Assuming a mean household size of five to six, some 750
to 900 million people (or 12-14 percent of the world population) rely
on dairy farming to some extent. As we see from the attached map
which maps the Milk density World-wide, the milk density is one
among the highest in the world.
With an annual production of 108 million tons of ECM, 65 percent of
which is produced by buffaloes, and a national herd of 113 million
head of cattle/ buffaloes, India is the world‘s largest milk-producing
country. Some 75 million dairy farming households, with an average
of 1.5 adult female cows or buffaloes per farm, are engaged in the
sector each producing about 4 liters of milk per farm/day. During the
period under review, production rose by 3 to 4 percent per annum or
approximately 4 million tons, thanks to higher milk yields and more
cows and buffaloes.
The predominant dairy production systems may be classified as low-
input/low-yield systems (956 liters/cow/year). Feeding is based
mainly on crop residues such as straw and green fodder,
supplemented by small quantities of low cost compound feed.
Milking is done by hand and the milk transported to village collection
centers or collected by local milkmen. About 45 percent of the milk
is used by the farming households and only 15 to 20 percent is
delivered to formal milk processors.
24
Annual per capita milk consumption increased by 1.5 to 2.4 percent
per annum from 1990, reaching 98 kg in 2005 and steadily
increasing at the rate of 1.5% thereafter. Previously, rising demand
for milk was mainly driven by population growth whereas increases
in per capita consumption have now become an additional driver.
India has always been 100 percent self-sufficient in milk, with total
imports/exports of only 0.3 million tons per annum; it may thus be
considered as almost unconnected with the world dairy market.
India‘s annual milk production has increased by more than five times
in the last 40 years, rising from 21.2 million tons in 1968 – 69 to
almost 110 million tons in 2008 – 09. This rapid growth and
modernization is largely credited to the contribution of dairy
cooperative, under the Operation Flood Project., assisted by many
multilateral agencies, including the European Union, the World
Bank, FAO and WFP (World Food Program). In the Indian context of
poverty and malnutrition, milk has a special role to play for its many
nutritional advantages as well as providing supplementary income to
farmers in over 5,00,000 remote villages.
The annual value of India's milk production amounts to more than
Rs.1,430 billion in 2008-09. Dairy cooperatives generate
employment opportunities for around 13.9 million farm families.
Livestock contributes about 25.6 per cent to the GDP from
agriculture. About 22.45 million people work in livestock sector,
which is around 5.8% of the total work force in the country. The
annual rate of growth in milk production India is between 5-6 per
cent, against the World‘s at 1 per cent
The steep rise in the growth pattern has been attributed to a
sustained expansion in domestic demand, although the per capita
consumption is modest at 70kg of milk equivalent.

25
Figure 1 Milk Density World-wide
26
3.7 Dairy in India
Indian dairying is emerging as sunrise industry. India represents one
of the world‘s largest and forecast growing markets for milk and milk
products due to the increasing disposable incomes among the 250
million strong middle classes.
The world dairy is zooming on India for its rapidly growing markets
that promise trade pattern, following GATT and the emergence of
the World Trade Organization (WTO), offer to the Indian dairy
industry an opportunity to take its bow as an export. India‘s
enthusiasm to integrate with the world economy is reflected in
technological up gradation, professional excellence and cost-
effective approach. The average annual per capita availability has
increased from 178 gms/day in 1991-92 to 258 gms/day in 2008-
2009. (The below table shows the average annual milk production
and per capita availability in India Table 3.2).
The two main reasons for the world focus on India are
i. the low-cost economy; and
ii. the liberalization process initiated in 1991.
Other important factors include low inflation rate; inexpensive
labour, the presence of the world‘s third largest democracy; an
independent judiciary well established and free from government
interference; and Increase in communications due to widespread
use of the English among the educated and the professional class.
27
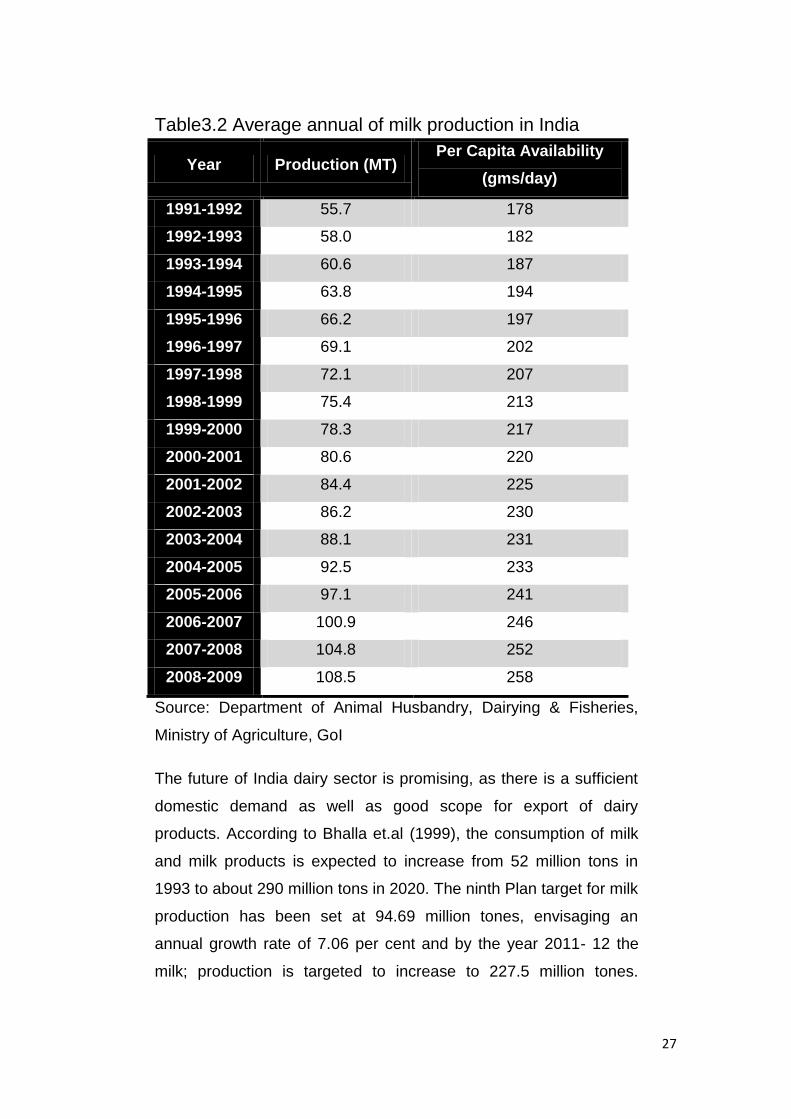
Table3.2 Average annual of milk production in India
Year Production (MT) Per Capita Availability
(gms/day)
1991-1992 55.7 178
1992-1993 58.0 182
1993-1994 60.6 187
1994-1995 63.8 194
1995-1996 66.2 197
1996-1997 69.1 202
1997-1998 72.1 207
1998-1999 75.4 213
1999-2000 78.3 217
2000-2001 80.6 220
2001-2002 84.4 225
2002-2003 86.2 230
2003-2004 88.1 231
2004-2005 92.5 233
2005-2006 97.1 241
2006-2007 100.9 246
2007-2008 104.8 252
2008-2009 108.5 258
Source: Department of Animal Husbandry, Dairying & Fisheries,
Ministry of Agriculture, GoI
The future of India dairy sector is promising, as there is a sufficient
domestic demand as well as good scope for export of dairy
products. According to Bhalla et.al (1999), the consumption of milk
and milk products is expected to increase from 52 million tons in
1993 to about 290 million tons in 2020. The ninth Plan target for milk
production has been set at 94.69 million tones, envisaging an
annual growth rate of 7.06 per cent and by the year 2011- 12 the
milk; production is targeted to increase to 227.5 million tones.

28
Meeting this domestic consumption growth and export demand
poses challenge for the Indian Dairy Industry.
The NDDB, which made a profit of Rs. 75 crores in 1998-99, has set
out to raise milk procurement by cooperatives to 33 percent of the
marketable surplus that is 488 lakhs kg/day by 2010 and the liquid
milk sales 365 lakhs kg/day, from the present level of 75 lakhs
kg/day NDDB cooperative cover 80 per cent of the marketable
farmers in operation flood programme. Mother dairy is wholly owned
subsidiary of the National Dairy Development Board (NDDB). Other
co-operative under the NDDB umbrella
The growth of dairying in this country with the milk production more
than trebling in the last few decades has been a commendable
achievement and well recognized. Nevertheless, one would accept
that we have still a long way to go to achieve the true potential that
the country has a generation of meaningful technologies for the
small livestock owners, the transfer of technologies to the millions of
these rural people and an efficient delivery system of the inputs and
services. Several management aspects do constitute challenges,
which one must successfully face in the years to come. Only then
can one be satisfied that this country with its traditions will seize the
opportunities to have a flourishing and prosperous dairy industry.
The above Table 3.2 shows milk production in India increased from
55.7 m.tones in 1991-92 to 108.5 m.tonnes in 2008-09 The
production figures in India show a continuous increase of milk
production over the years, even though the Indian dairy
development is handicapped by low-yielding, non-descriptive cows
and buffaloes, a little or no land holdings, natural herbage and costly
concentrates.
29
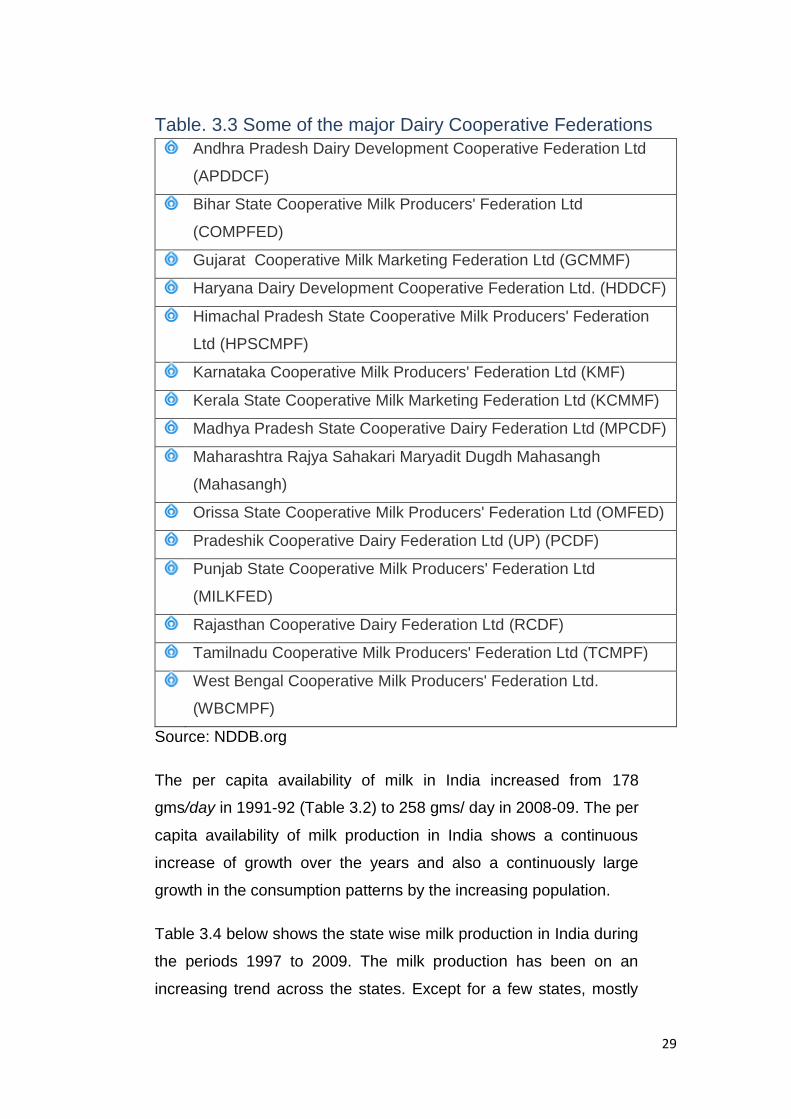
Table. 3.3 Some of the major Dairy Cooperative Federations
Andhra Pradesh Dairy Development Cooperative Federation Ltd
(APDDCF)
Bihar State Cooperative Milk Producers' Federation Ltd
(COMPFED)
Gujarat Cooperative Milk Marketing Federation Ltd (GCMMF)
Haryana Dairy Development Cooperative Federation Ltd. (HDDCF)
Himachal Pradesh State Cooperative Milk Producers' Federation
Ltd (HPSCMPF)
Karnataka Cooperative Milk Producers' Federation Ltd (KMF)
Kerala State Cooperative Milk Marketing Federation Ltd (KCMMF)
Madhya Pradesh State Cooperative Dairy Federation Ltd (MPCDF)
Maharashtra Rajya Sahakari Maryadit Dugdh Mahasangh
(Mahasangh)
Orissa State Cooperative Milk Producers' Federation Ltd (OMFED)
Pradeshik Cooperative Dairy Federation Ltd (UP) (PCDF)
Punjab State Cooperative Milk Producers' Federation Ltd
(MILKFED)
Rajasthan Cooperative Dairy Federation Ltd (RCDF)
Tamilnadu Cooperative Milk Producers' Federation Ltd (TCMPF)
West Bengal Cooperative Milk Producers' Federation Ltd.
(WBCMPF)
Source: NDDB.org
The per capita availability of milk in India increased from 178
gms/day in 1991-92 (Table 3.2) to 258 gms/ day in 2008-09. The per
capita availability of milk production in India shows a continuous
increase of growth over the years and also a continuously large
growth in the consumption patterns by the increasing population.
Table 3.4 below shows the state wise milk production in India during
the periods 1997 to 2009. The milk production has been on an
increasing trend across the states. Except for a few states, mostly
30
small ones, the increase in milk production has been significant. The
states where the governments are more proactive and where they
have taken noticeable steps under the operation flood and where
the people are largely dependent on agriculture the increase in
production has been very significant. Some of the states worth
mentioning are Gujarat, Haryana, Punjab, Andhra Pradesh,
Tamilnadu.
3.8 Anand Pattern
The Anand pattern is a three tier structure consisting of the
producers‘ society at the village level, which collects the milk from
the producers twice daily and pay them on behalf of its member
unions, the federation undertakes the collective marketing of milk
and milk products, besides attending to quality control. The role of
the government is to supervise, guide, encourage and wherever
necessary discipline the erring co-operatives. The Anand pattern
this establishes a direct link between the producers and the
customer.
Kaira District Co-operative Milk Producers Union Limited or
Anand Milk Union Limited (Amul): -
The Arey Milk Colony was established in 1945 by the Bombay
government under Greater Bombay Milk Scheme (GBMS). During
1946, the first Farmer‘s Integrated Dairy Co-operative was
established in Kaira district at Anand, which later came to be known
as Anand Milk Union Limited (AMUL). Thus, after independence,
both AMUL and GBMS together set a faster pace by dairy
development. With emphasis on developing techniques of
processing and marketing under Indian conditions.

31
Table 3.4 Statewise Milk productions in India during 1997 to 2009
State 97-98 98-99 99-00 00-01 01-02 02-03 03-04 04-05 05-06 06-07 07-08 08-09
All India 72128 74513 78286 80607 84406 86159 88082 92484 97066 100869 104840 108463
Andhra Pradesh 4473 4842 5122 5521 5814 6584 6959 7257 7624 7939 8925 9570
Arunachal Pradesh 43 45 46 42 42 46 46 48 48 49 50 24
Assam 719 725 667 683 682 705 727 739 747 751 752 753
Bihar ** 3420 3440 3454 2489 2664 2869 3180 4743 5060 5450 5783 5934
Goa 38 41 44 45 45 46 48 57 56 57 58 59
Gujarat 4913 5059 5269 5312 5862 6089 6421 6745 6960 7533 7911 8386
Haryana 4373 4527 4679 4850 4978 5124 5221 5222 5299 5367 5442 5745
Himachal Pradesh 714 724 742 761 756 773 786 870 869 872 874 884
J & K 1167 1232 1286 1321 1360 1389 1414 1422 1400 1400 1498 1498
Karnataka 3970 4231 4471 4599 4797 4539 3857 3917 4022 4124 4244 4538
Kerala 2343 2420 2532 2605 2718 2419 2111 2025 2063 2119 2253 2441
Madhya Pradesh 5377 5442 5519 4761 5283 5343 5388 5506 6283 6375 6572 6855
Maharashtra 5193 5609 5707 5849 6094 6238 6379 6567 6769 6978 7210 7455
Manipur 62 65 68 66 68 69 71 75 77 77 78 78
Meghalaya 59 61 62 64 66 68 69 71 73 75 77 77
Mizoram 17 20 18 14 14 15 15 16 15 16 17 17
Nagaland 46 48 48 51 57 58 63 69 74 67 45 53
Orissa 672 733 850 876 929 941 997 1283 1342 1431 1625 1672
Punjab 7165 7394 7706 7777 7932 8173 8391 8554 8909 9168 9282 9387
Rajasthan 6487 6923 7280 7455 7758 7789 8054 8310 8713 9375 9536 9491
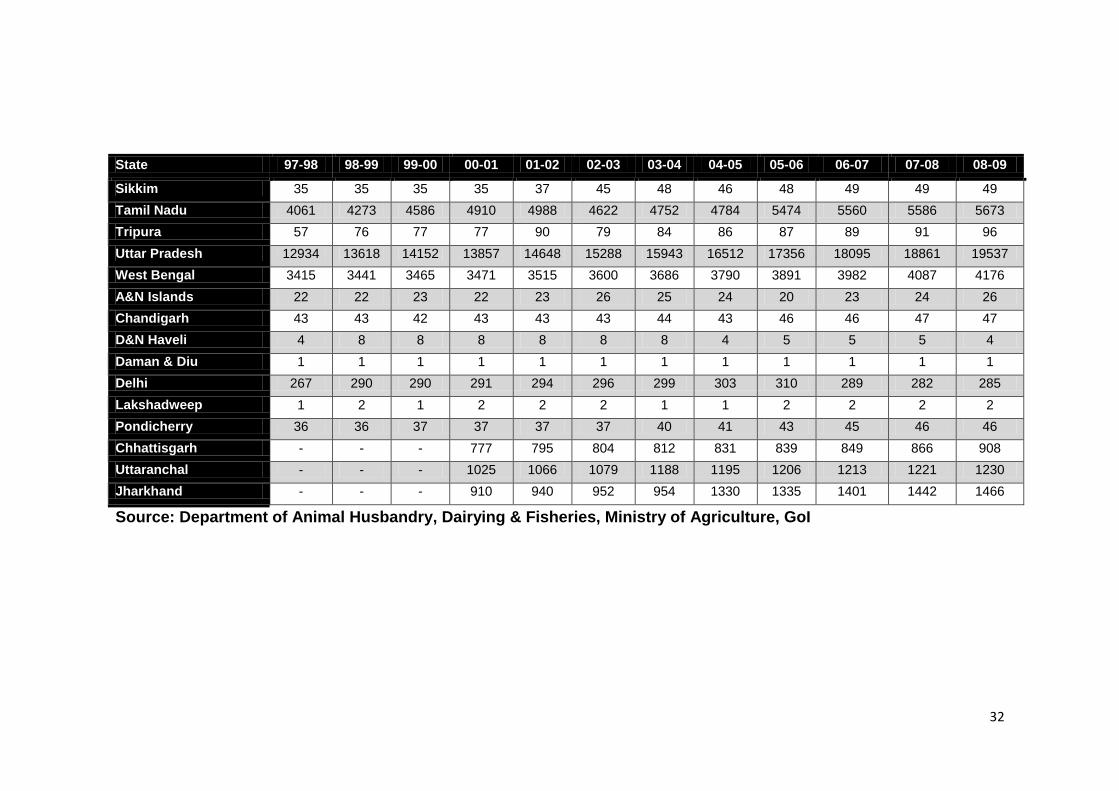
32
State 97-98 98-99 99-00 00-01 01-02 02-03 03-04 04-05 05-06 06-07 07-08 08-09
Sikkim 35 35 35 35 37 45 48 46 48 49 49 49
Tamil Nadu 4061 4273 4586 4910 4988 4622 4752 4784 5474 5560 5586 5673
Tripura 57 76 77 77 90 79 84 86 87 89 91 96
Uttar Pradesh 12934 13618 14152 13857 14648 15288 15943 16512 17356 18095 18861 19537
West Bengal 3415 3441 3465 3471 3515 3600 3686 3790 3891 3982 4087 4176
A&N Islands 22 22 23 22 23 26 25 24 20 23 24 26
Chandigarh 43 43 42 43 43 43 44 43 46 46 47 47
D&N Haveli 4 8 8 8 8 8 8 4 5 5 5 4
Daman & Diu 1 1 1 1 1 1 1 1 1 1 1 1
Delhi 267 290 290 291 294 296 299 303 310 289 282 285
Lakshadweep 1 2 1 2 2 2 1 1 2 2 2 2
Pondicherry 36 36 37 37 37 37 40 41 43 45 46 46
Chhattisgarh - - - 777 795 804 812 831 839 849 866 908
Uttaranchal - - - 1025 1066 1079 1188 1195 1206 1213 1221 1230
Jharkhand - - - 910 940 952 954 1330 1335 1401 1442 1466
Source: Department of Animal Husbandry, Dairying & Fisheries, Ministry of Agriculture, GoI

33
The growing demand for milk in Bombay provided the stimulus for
the milk products in Kaira district to increase production and the
Kaira District Co-operative Milk Producer‘s Union, popularly known
as ‗AMUL‖ came into being starting with just two milk producer
societies with a daily collection of 250 liters in 1948. With 13 district
cooperative milk producers' Union members and No. of Producer
Members of 2.9 million comprised in 15,322 Village Societies AMUL
has a present total Milk handling capacity of 13.07 million liters per
day and Milk collection (Total - 2009-10) 3.32 billion liters Milk
collection (Daily Average 2009-10) 9.10 million liters Milk Drying
Capacity of 647 Mts. per day Cattle feed manufacturing Capacity of
3740 Mts per day
3.9 National Dairy Development Board (NDDB)
The NDDB was set up under the aegis of the ministry of Agriculture
and Irrigation, Government of India in September 1965, under the
Societies Registration Act, 1860. The President of India nominates
its Board of Directors including Chairman. The Secretary of NDDB is
the Chief Executive of the Organization who is supported by
professionals to carry out the board‘s activities. It promoted projects
of general public utility as well as international liaison with other
National Dairy Board and International agencies to facilitate the
exchange of information for conducting research in the field of
dairying and animal husbandry. The package of services, which the
NDDB offers help in the creation of viable Cooperative Farmers
Organizations with facilities for procuring, processing and marketing
of milk and milk products. The NDDB‘s approach towards the
modernization of dairying has been well accepted under India‘s
various Five-year plans and the World Bank aided projects in India
and abroad.

34
3.10 Indian Dairy Corporation (IDC)
The Indian Dairy Corporation was set up under the Company‘s Act
on 13th February 1970. It is a Government of India undertaking. The
immediate need to set up IDC was to handle the commercial and
financial transaction of ―India-World Food Programme (IWFP)
Project-618, popularly known as the ―Operation Flood‖. This has
become mainly a financing-cum-promotional agency of the central
government.
The White Revolution aims at massive dairy development on a co-
operative basis. Impressed by the economic transformation it had
brought about in the life styles of the Gujarat farmers, it was decided
that the ‗AMUL‘ (Anand Pattern) should be replicated nationally.
3.11 Operation Flood I, II and III
Operation Flood phase-I was originally designed to be implemented
over a period of 55 years and launched on July 1970, but it was
extended till March 31, 1981 over 10 states. Operation Flood Phase-
Il was launched on October2, 1979. While Operation Flood Phase-I
was still under way and concluded on- March 31, 1985. Operation
Flood Phase-Ill covered 22 states/Union Territories. OF-Ill was
started on April 1, 1985 to consolidate the extensive milk
procurement; and marketing infrastructure created under Operation
Flood-I and Operation Flood-Il in 23 States/Union Territories and
finally completed in March 31, 1996.
The OF-I project had an initial outlay of Rs. 954 crores, which was
later increased to Rs. 116.40 crores. The OF-II programme had an
outlay of Rs.458.5 crores, where as it was Rs. 1303.1 crores during
OF-Ill programme.
When the third phase was over the following benefits had reached
the small dairy farmers.

35
Sustained increase in production (4-5 per cent growth per
annum) rising the per capital availability of milk to nearly 220
gms/day.
Dependence on commercial imports of milk powder ended.
Marketing mechanism improved providing assured outlet for
milk producers and quality milk for customers.
The quality of milch animals improved National Wide network of
professionally managed co-operatives established.
At the end of OF-Ill 72,744 District Co-operative Societies in 170
milk shed covering 267 districts of country having a total
membership of 93.14 lakhs had been organized. The members of
supply about 10.99 million kg milk per day which is processed by
370 liquid milk processing plants and product factories under the
organized sector in India. The average liquid milk marketed through
milk cooperatives by the end of OF-I was 27.9 lakhs liters/day,
which increased to the level of 100.2 lakhs litres/day by the end of
OFIII.
As per World Bank experts‘ opinion, for an initial investment of Rs.200
crores in OF-Il, the net return/year to the rural economy had been
Rs.24,000 crores. No other major development programme all over the
world has matched this input-output ratio.
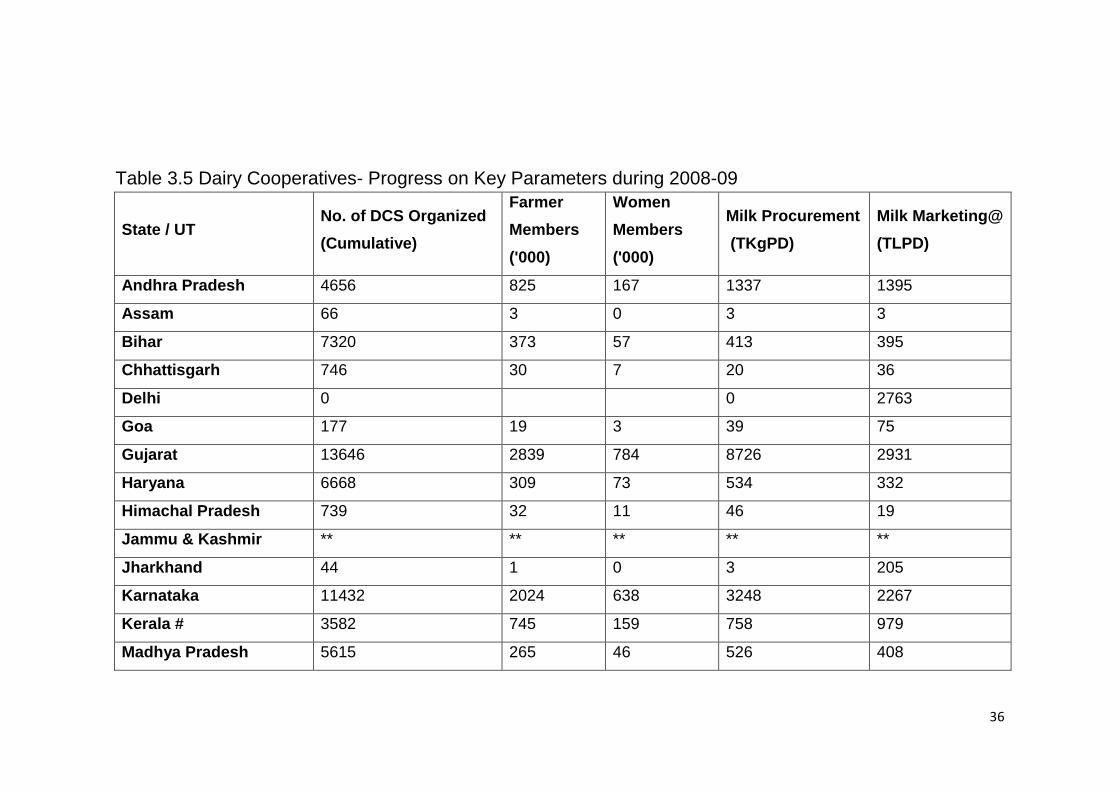
36
Table 3.5 Dairy Cooperatives- Progress on Key Parameters during 2008-09
State / UT No. of DCS Organized
(Cumulative)
Farmer
Members
('000)
Women
Members
('000)
Milk Procurement
(TKgPD)
Milk Marketing@
(TLPD)
Andhra Pradesh 4656 825 167 1337 1395
Assam 66 3 0 3 3
Bihar 7320 373 57 413 395
Chhattisgarh 746 30 7 20 36
Delhi 0 0 2763
Goa 177 19 3 39 75
Gujarat 13646 2839 784 8726 2931
Haryana 6668 309 73 534 332
Himachal Pradesh 739 32 11 46 19
Jammu & Kashmir ** ** ** ** **
Jharkhand 44 1 0 3 205
Karnataka 11432 2024 638 3248 2267
Kerala # 3582 745 159 758 979
Madhya Pradesh 5615 265 46 526 408
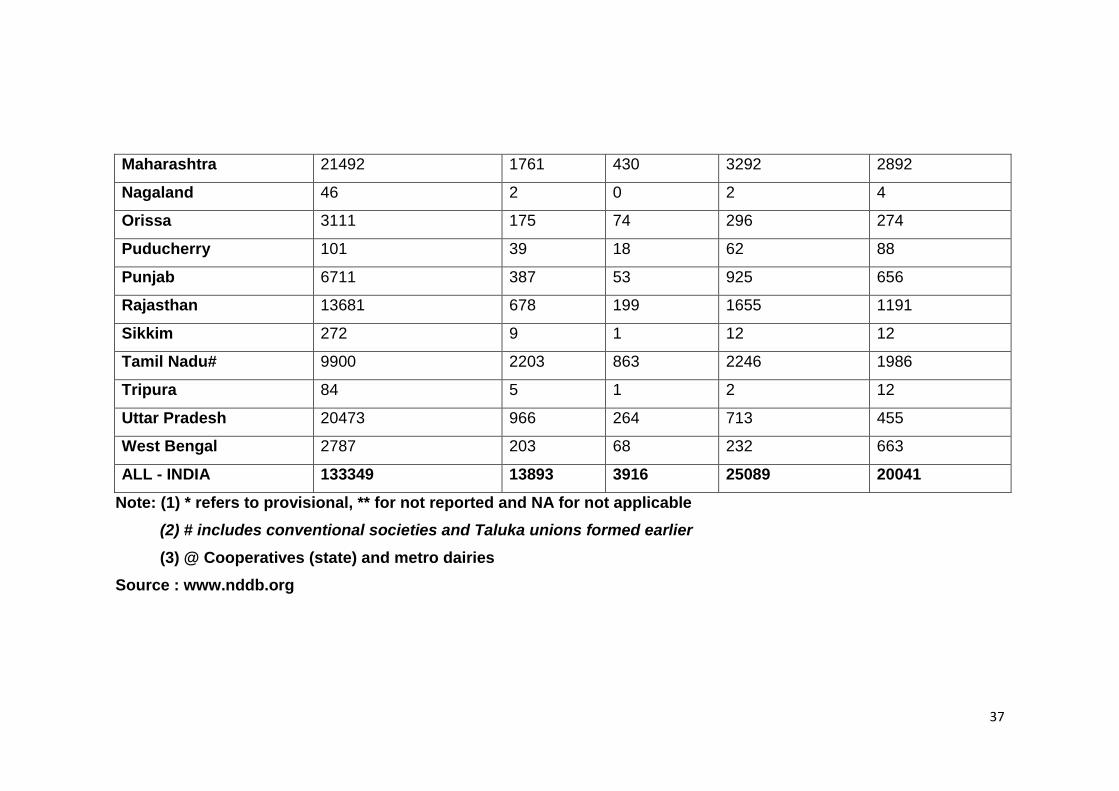
37
Maharashtra 21492 1761 430 3292 2892
Nagaland 46 2 0 2 4
Orissa 3111 175 74 296 274
Puducherry 101 39 18 62 88
Punjab 6711 387 53 925 656
Rajasthan 13681 678 199 1655 1191
Sikkim 272 9 1 12 12
Tamil Nadu# 9900 2203 863 2246 1986
Tripura 84 5 1 2 12
Uttar Pradesh 20473 966 264 713 455
West Bengal 2787 203 68 232 663
ALL - INDIA 133349 13893 3916 25089 20041
Note: (1) * refers to provisional, ** for not reported and NA for not applicable
(2) # includes conventional societies and Taluka unions formed earlier
(3) @ Cooperatives (state) and metro dairies
Source : www.nddb.org
38
3.12 Dairy development in Andhra Pradesh
Andhra Pradesh has an excellent potential for milk production with
progressive formers who are more receptive to the new technology
and scientific practices prior to 1960. Dairy development was not
given importance until 1960, it was only in 1961, a separate milk
commissioner was appointed to formulate dairy development
programme in the state.
Planning for organized dairy industry in Andhra Pradesh was
conceived in 1959 and a pilot milk project. The animal husbandry
expanded steadily in 1964, the department, UNICEF gifted dairy
equipment of value Rs. 1 crore to Hyderabad and Vijayawada with
the main objective of linking and supplying surplus milk gram
producing area to the consuming area.
The dairy development activities were carried out by the
Government through dairy development department. Through the
dairy industry started as a service organization and recognized as
development organization, in view of the nature of the business it
was converted in the commercial organization. Thus Andhra
Pradesh Diary Development Corporation was formed as 2-4-1974
state Government Undertaking.
Efforts to commission the milk product factory, Vijayawada and the
chilling centers in Krishna district were taken up. The work regarding
co-operative dairies at Nellore, Chittoor, and Kurnool were also
completed. These measures are needed considerable technical
man-power that was not available. In this state we did not name
dairy technology center to which training naturally we had to look for
institutions like national dairy research institute of Kurnool,
Bangalore, and Allahabad. While these dairies came to operation
one after another the need for getting a whole equates technical and
administrative men was keenly felt. All efforts were made to secure

39
experienced people as deputation from other departments for
various posts.
As per the policy of the Government of Andhra Pradesh to develop
dairying on co-operative lives on Anand patterns as being bid
through at the country the ―Andhra Pradesh Dairy Development Co-
operative Federation(APDDCF) limited was registered as 5-5-1981
to implement the operation flood-Il program in the state.
3.13 State-Wise Growth of Milk Production under
Operation Flood
The State-Wise growth performance in milk production during OF I
depicted a maximum significant growth in milk production in
Himachal Pradesh with a compound growth rate of 22.28 per cent
per annum followed by Assam and Kerala; where as a minimum
non-significant growth rate of 0.21 per cent per annum was obtained
in Uttar Pradesh followed by Gujarat and Maharashtra. The growth
in milk production during Operation Flood-Ill showed that the
maximum significant growth was obtained in Nagaland (35.97 per
cent per annum‘s) followed by Maharashtra and Haryana and the
minimum significant growth was noticed in Meghalaya with a
compound growth rate of 1.18 per cent per annum followed by
Andhra Pradesh and Rajasthan.

40
4. Literature
review 4.0 Review of literature on Training and development ........................... 41
4.1 Review of literature on Dairy Industry............................................... 53
41
Chapter 4
Literature Review
4.0 Review of literature on Training and development
Most of the universities and professional institutes in India and abroad
have made the study on Training and Development. Most of the studies
on Training in India focus only on one or the other aspect of training.
There is hardly any account of a comprehensive examination of all the
aspects of training covered in one study. Several research studies have
been undertaken with specific reference to training and development
covering several aspects such as effectiveness of training and executive
development, need assessment of the training, attitude and behaviour of
the employees. methods of training, benefits of training, evaluation of
training programmes etc. However, an attempt is made to review certain
important studies related to the present study.
Deloyd S. Steinmter (1976)‘ in his ―The History of Training‖ in Training
and Development Handbook, dealt with the following aspects. History of
Training — Man had ability to pass on to others, the knowledge and skill
gained in mastering circumstances. This was done signs and words.
Through training, learning took place and knowledge was transferred.
Richard B. Johnson (1976) in his ―Organisation and Management of
Training‖ in the training and development handbook stated that: ―An
organisation, whether public or private, exists and grows because it
provides the community with services or goods. The community sees it as
worthwhile. To do this effectively, the organisation must function at an
optimum level of productivity. This level is a direct result of collective
efforts of the employees. Yet not every employee works at the level
42
established by the standard of the performance for the job he or she
holds. Similarly groups of employees may not consistently produce up to
the standards. When there is a gap between actual performance and
what is needed, productivity suffers. Training can reduce if not eliminate
this gap. It does so by changing the behaviour of individuals by giving
them whatever additional specific items of knowledge, skill, and attitude
they need to perform up to that standard. Changing behaviour is the
function of training‖.
Uday Pareek and Venkateswara Rao (l991) in their ―Designing and
Managing Human Resources Systems‖, dealt with various aspects of the
training of employees, involving the employees in decision making on
various facets of training peripherally, expectations of training, the status
given to training at different levels of the organisation, the non-
professional image of training, the role of training in productivity in the
organisations evaluation of training and control etc.
Sushila Singhal (l990) in her publication ―Banks and Customers — A
Behavioural Analysis‖, emphasised the need to strengthen personnel
management function involving recruitment, training, promotion,
placement and performance appraisal of employees. Performance
appraisal should aim at objective assessment of what the employee does
and how his/her capability can be used. She further stressed that a
process of convenient evaluation, follow up and feedback should be
introduced at stages of recruitment, training and promotion. The
management of banks can seek the help of behavioural scientist to mould
their employee attitude/behaviour to tone up their efficiency etc. The
author of this publication attempted at analysing the job behaviour of the
employees in the banking industry and its relationship with the quality of
customer service.

43
Bhatwadekar, M.V. in his ―Evaluation of Training‖ dealt with evaluation of
training, i.e.,
1. Evaluation of a session.
2. Evaluation of a topic.
3. Evaluation of a training programme, and
4. Evaluation of a training institute.
Any training activity in which a few hundred people are employed and on
which approximately Rs. 15.20 crores are spent per annum is bound to
give rise to the following questions.
a. Are the facilities proved adequate to sustain a sufficient flow of
trained persons?
b. Are the trainees receiving training that is purposeful and relevant for
their job?
c. How much money is being spent on each trainee?
d. And do companies derive any benefits from trained employees?
e. What are the benefits and are they commensurate with resources
spent on training?
f. Finally, what benefits accrue to the society which ultimately pays for
its costs? Or does their activity constitute a waste of resources?
The above pertinent questions must be provided with answers. But the
way in which the training programmes have come to be organised
renders the task of evaluation impossible.
He concluded that various factors having bearing on the impact of training
on the job performance should give some idea of the vastness and
complexity of the problem.
This whole area remains unexplored and only a systematic research by a
team over a long period of time may provide satisfactory answers to the
44
vexed questions. In the absence of some measurement of output,
evaluation of training on comprehensive basis cannot be undertaken.‖
Hamblin, A.C.E. (1974) in his ―Evaluation and Control of Training‖,
defined evaluation (though the term literally means assessment of value)
in the context of training as ―any attempt to obtain information on the
effects of training programme and assess the value of training in the light
of information‖. Further, Hamblin says that evaluation helps in providing
feedback for improvement (and better control) of training. Evaluation is
therefore collection of relevant data and analysis in order to determine
whether a particular training effort is worthwhile or not, from the point of
objective set. Although cost benefit analysis is an essential feature of
good training, it is necessary to recognize that much hard work has to be
done in establishing what has actually been achieved before it is possible
to say whether the costs involved are justified.
Good results come only if the training objectives are right. These
objectives are also the start of evaluation, because they provide the
necessary standards for measurement.
Donald L. Kirk Patrick (l976) in his ―Evaluation of Training‖ in Training
and Development Hand Book, stated that effective training directors will
make an effort to evaluate all their training activities and the success of
these efforts depends to a large extent on a clear understanding of just
what ―evaluation‖ means.
1) To clarify the meaning of evaluation, and
2) To suggest techniques for conducting the evaluation. These
objectives will be related ―in house class room programmes, one of
the most common forms of training‖.
Many of the principles and procedures can be applied to all kinds of
training activities such as performance review, participation in outside
programmes, programmed instruction and the reading of selected books.

45
Saxena, A.P. (1973) brought out an edited volume under the title
―Training in Government, objectives and opportunities‖. Indian Institute of
Public Administration, New Delhi (1985) for and on behalf of the training
division, Department of Personnel and Administration Reforms,
Government of India, incorporating there in, the proceedings of the
annual conference conducted by the Indian Institute of Public
Administration, New Delhi, 1985. A number of papers dealing with various
aspects of training of employees presented at the conference are
included in this book.
Krishnaswamy, R. in his Article, ―Training Objectives at the Institution
Level‖ mentioned about the resources gap in training. The availability of
resources will determine the development of training objectives and the
choice of desirable training techniques. Both these are critical
determinants for ensuring the sense of training for growth. He also felt
that there is a resource gap in training i.e., availability of proper trainers of
the training programme and training institutions. Thus the conference had
only identified the shortcomings in the training procedure at present, but
failed to suggest remedial actions. He discussed various qualities of a
trainer such as, a high standard of competence, his behaviour, emphasis,
personnel needs, effective use of training inputs etc.
Ghosh, N.K. (1984) in his Article ―Role of Training for the better
organization and productivity‖ stated that: ―Training has become a very
useful tool in the hands of the management because of its important role
in the man power development. With the sophistication in the industries,
the role of training has become more important. The following points
deserve vivid description‖.
1) Why Training?
2) What is in the training?
3) What are the intangible results of the training?
4) What are the training loopholes?
46
5) What are the training inputs?
6) What is the role of refresher training in the industry set up?
Concluding the article, it is said ―Training has its advantages, given the
result context, training can really play wonders. But how many of us are
really serious about it? In a developing country like ours, to the employer,
training is a social responsibility, to a trainee, it is another kind of
employment, to a trade union it is like there would be members in the
process, if training to a society, it is a physical shape of statutory
obligation and to a trainer, it is his means of bread and butter.‖ In addition
to these, certain other important studies related to the present study are
also reviewed.
Regarding the socialization process as induction training is called helps
the individual to blend his personality with the organization.
Dayal (1990) points out that the socialization process helps an employee
to know more about himself, his hopes, aspirations and inclinations.
Chattopadhyay, P.K. (1990) collected data from 143 middle and senior
managers of 18 organizations. His results showed that in terms of the
benefits of management trainee scheme, 35.7 per cent felt that it
increased management skills, while for 34.3 per cent and 32.8 per cent it
enhanced adaptability, and motivation respectively.
During 1971 Argyris made a pioneering research study on the benefits of
training. He suggested that an organization effectiveness depends on its
ability to achieve its goals to maintain itself internally and to adapt to its
environment. Continuous training would help the employees to cope with
changes and retain organizational viability as well.
In a similar attempt Srinivasan (1977) collected data on trainees,
focusing on the individuals‘ motivation for attending training programmes;
47
the study highlighted two areas — career development and continuing
education.
In another study on the objectives of management development in India,
Sai, P. (1997) collected data from 57 organizations, (41 private and 16
public) on the executive training schemes. He found that in majority of the
cases the main objective of such training was individual development and
growth followed by improving skills and knowledge, meeting
organizational needs, and attitudinal change in that order.
McGhee and Thayer (l961) have made an in-depth study on
identification of training needs and they have proposed a model of that
consists of three components organizational analysis, Task analysis and
Man analysis.
Johnson (2002) provides the following additional methods of identifying
training needs. They are Analysis of Equipment, Brain storming, problem
clinic, simulation.
Dayal (1990) suggests that a detailed study of jobs and skill analysis is
absolutely necessary for training activity to be meaningful.
As far as the supervisory category is concerned, Sundaram (1970) points
out that the training needs for supervisors can be identified through
careful observation of their work, which is indicative of poor performance,
low production, high cost, poor product quality, high scrap spoilage,
wastage, accidents, absenteeism in and turn over.
Ghosh (1984) stresses the need for behavioural inputs in any training
programme organized for supervisors; using the Delphi technique for
assessing the training needs for managers.
48
Srinivasan (1977) recommends that the training programmes should
focus on corporate planning, organizational development, and personnel
management.
Bhatia (1981) sees a shift from knowledge to attitude as the main
objective of training. He identifies three areas of training technical skills
and knowledge, knowledge of organization and external systems, and
conceptual and interpersonal skills. He suggests that the emphasis on
these three must vary according to the level of employee.
Seth (1984) administered a 72 — item Questionnaire on 119 Personnel
Managers. On the basis of his research result, Seth suggested that
training for personnel managers should be directed towards attitudes and
beliefs underlying managerial philosophy and their inter-relatedness.
In India, the Bureau of Public Enterprises (BPE) introduced the action
learning (simulation) method of training in some public enterprises like oil
companies, air-craft manufacturing companies, fertilizer companies etc.,
(according to Bakshi (1979) till now over 82 such companies have
introduced this programme with some degree of success.
Basha (1971) takes the stand that multinational operating in India find
that their home tested training techniques do not have the same impact
here. Due to the differences in culture and background, business games,
T-groups, case methods, and workshops are not as effective in India as
perhaps in Europe or America. He concludes that given the Indian
context, the lecture-cum-discussion method would be most useful. In the
same spirit, Prahlad and Thiagarajan (1971) suggest that structured
exercises seem to offer greater scope in India.
Saxena (1973) suggests that the OD technique can be most useful for
training employees in Government.
49
In order to create a realistic atmosphere in training, Srinivasan (1980)
used experimental learning techniques in training a group postal
employees in the post staff college, New Delhi.
Agarwal (1982) in his study on graduate Engineering trainees in three
large public sector organizations found that both the method and the
contents of the training were perceived by the trainees as de motivating
and dissatisfying.
Sai (l997) in his study of 57 organizations found that the most preferred
method for executive training was conference followed by lectures, video,
case study, role play, business games, programmed instructions and
computer aided instructions in that order.
Charles (1980) provides through his study that the training Administration
basically refers to converting training needs into contents, types of
training programmes, location of training programmes, choice of faculty
and participants and general administration. These issues deal with the
design and development of training programmes.
Chatterjee (1978) lists four types of standard training programmes. They
are induction training, supervisory training, technical training and
management development training programme.
Saiyadain (1984) highlights the problems relate to faculty, participants
and administration in the implementation of training programmes in public
enterprises.
Mehta (l990) points out that the training effectiveness depends on two
considerations. Firstly, trainers are fully responsible for training. If the
employees do not show results, the trainer should be held accountable for
50
it. Secondly, training per se is not the answer to the problems. Training
effectiveness depends on the kind of atmosphere and culture that is
prevalent back home.
Sikka (1985) suggests two models to evaluate training effectiveness.
First is the expectation — achievement model consisting of matching
post-training achievements with pre-training expectations of the boss,
peers the sub-ordinates and trainer himself. The second is the
experimental control group model, wherein a group of employees who
have gone through training is compared in terms of their performance
with those who have not.
Omarbin Sayeed (1998) found that learning effect is a function of
trainees ability to develop meaningful expectation of career utility of
training and a deep sense of job involvement as most important variables
contributing to training effectiveness.
According to Lawande (l980), who carried research in Glaxo, it would be
better at the individual level, if the person himself identifies the need for
training and records it or the appraisee discusses the individual‘s training
needs in view of his deficiencies on the job. Then, this process helps a
great deal in making training useful to both the employees and the
organization.
Studies on the identification of training needs emphasise not only the
organizational analysis but job and individual role analysis as well. It is
also useful to emphasise the need for training in human resources
management.
A more direct approach was used by Kanitkar et al. (1994) instead of
going to HRM Department, they approached section heads and senior
managers of 73 milk unions associated with National Dairy Development
Board. Their study revealed five contents of training that were identified
51
by a very large majority of respondents. These were cost consciousness,
loss control, marketing, sanitation and hygiene and operations and
maintenance of utilities.
―Who needs what kind of training‖ was the focus of a study by Singh et
al. (1998). In a study of 92 Anganwadi workers, they found that the need
for training correlated inversely with age and in service training.
Gopalakrishna and Achuthan (1985) asked 39 executives from 27
organizations to rank various training programmes according to the
requirements of their organization programmes that could change the
attitude and behaviour of participants and programmes that focus
strategic decision-making, problem-solving etc., referred to top rank.
Srinivasan and Virmani (1977) mentions that a study conducted by the
Administrative Staff College of India identifies lack of seriousness on the
part of sponsored officers, lack of discussion with superiors on training,
and different expectations from training, as major problems of training.
According to a paper published in Economic Times of May 26, 1976, 65
per cent contribution to successful training expenses is made by food,
lodging and recreation facilities during the training programme.
Jam (1985) collected data on 119 managers in the Steel industry who
had attended in company or external training programmes regarding the
infrastructural facilities provided like the reading material, training
equipment and good instructions etc.
Bannerji (1981) collected data on supervisors who had undergone
training in an Indian Engineering Company. They were administered a
check-list. According to him most of them felt that training did improve
52
their self-confidence, motivation, identification with management goals,
and communication ability.
Maheswari (1989) collected data on 999 respondents from Banking
Institutions. Though these managers found training programmes less
effective with respect to their contribution to job performance, they did
endorse the usefulness of formal training.
On a supervisory development course, Sinha (1984) asked the
participants before the commencement of the training programme to write
what qualities in their opinion, should the supervisor possess and rate
them on a scale of 1 to 10. The results of the study suggest that training
can show visible and effective results.
Kazmi (1990) found that most organizations have a high level of
formalization with regard to the collection of gaining evaluation data.
Kumar & Shankar (1993) found that the alumni who want through
training programmes reported training to be very much useful (34%) quite
useful (63%) and of somewhat utility (3%).
Subramanian and Sajjan Rao (1997) studied the effect of tailor made
training on 34 workers labeled as dirt bag or marginal workers. These
workers were rated by their supervisors on overall job performance and
adaptability and discipline etc.
According to Lippitt (1978) points out that HRD consists of a series of
activities conducted to design behavioural changes in a specific period.
Rao (1985) defines HRD as a function consists of various activities
related to training and development and performance appraisal.
53
Saiyadain (1981) points out that astonishing list of activities have been
carried out in the name of HRD.
According to Monappa (1985) only HRD activities can achieve its
ultimate aim of improving quality of life.
The research of Gopalakrishnan and Achuthan (1985) can be called
comprehensive, as it deals with training needs, nature and duration of
programmes and faculty mix.
Saiyadain (1987) conducted a survey of training functions in India
covering 49 organizations. These results suggest that organizations have
taken the help of external consultants in estimating the effectiveness of
training programmes.
Subramanian, S. and Sajjan Rao, K. ―An integrated Training
Intervention. New Perspective for enhancing work effectiveness of low
performances‖, Indian Journal of Industrial Relations, 1997, 33 (1), pp.
68-80.
4.1 Review of literature on Dairy Industry
In the lines that follow, a brief account on review of current literature on
dairy development has been provided with. Such type of review will
provide enough access to the reader to understand the recent trends and
the underlying problems faced by the dairy industry, as well as farmers
and customers. This type of exercise would also provide to the researcher
for identifying the research gap and gives appropriate direction for the
identification of the objectives of the study.
54
―Gupta in his study stated that the per capita consumption of milk in India
is only 140 grams. while in most of the European countries, it is between
1990 to 1698 grams per day. He also stressed that market surveys have
revealed that only 43 percent of milk available is consumed in liquid form
and the remaining is converted in to kova, dahi and other milk products.
Sharma et.al, worked out the economic demand for milk at 36.68 million
liters in 1978 for India as against the recommended level of 210 grams
per capita per day. According to his study, the milk production should
increase at the rate of 3 metric tons. Annually up to 1978, thereafter at the
rate of 4 metric annually so as to bridge the ever increasing gap between
the demand and availability.
Muranjan identified key factors which affect the milk procurement viz.,
procurement price. Price of related commodities growth of procurement
agencies and changes in the overall productions of milk in public sector
diary plants in Maharashtra area.
Pillai considered the cost of fodder, cost of feed, labor cost (both family
and hired labor) veterinary and miscellaneous expenses as variable cost,
and depreciation and interests on value of animal, cow-shed and dead
stock were treated as fixed cost. Among fixed costs the costs on shed,
cows were significant and feed cost ranks high among the components of
variable cost.
Bhasin pointed in his article that feed alone accounts for 60 to 70 per
cent of the total cost of production in India. In Western countries, it
accounts for 45 to 60 per cent. The difference is due to the component of
labor cost.
In his study Jayachnadra made an attempt to study the season-wise cost
and returns from dairying as well as the possibilities of employment
55
generation in drought—prone area of Chitttoor district. The study reveals
that in order to reduce the cost of maintenance of much animals, it is
essential; to increase the availability of fodder, especially green fodder.
Girdhari started in his article ―Dairy marketing ―, that if dairying is to be
organized in the country on proper lines, proper marketing systems have
to be developed. Effective marketing organization of milk requires
development of suitable systems viz. procurement, process, pricing,
packaging and distribution of milk and milk products.
David Avery Vose observe that the structure of the procurement market
fluid milk served by a single co-operative societies approximated to
monopoly, while markets having more sellers resemble a highly
concentrated oligopoly where in the service constituted a source of
product differentiation sanitary regulation, milk marketing order, full supply
contract, the perishable nature of the product and transport cost influence
this strength of barriers to entry.
Shaik studied milk-marketing practices and found that dairy industries,
however in general, has not given give importance to marketing so far.
Professionalism is not observed in the marketing of dairy products. He
opined that this attitude needs to be changed especially when one
considers future potential of growth of the dairy industry.
In spite of increase in supply and demand for milk, the channels of trade
have not under gone any significant changing. Marketing of the middle
men appear to have increased considerably
MahinderKaur and Gill seeks to examine the present system of milk
marketing in Ludhiana district of Punjab in terms of existing milk market
channels, costs involved and profit margin in different milk marketing
channels. The study reveals that the direct channels (producer and

56
customer) in the most efficient from the point out view of producer and
customers.
An economic study on intensive cattle development programmed in Bihar
made by Ramakanti. A brief review of the current literature on dairying in
India reveals that much emphasis was laid on economic aspects of the
milk production and certain managerial aspects. However, scent attention
was given to customer preferences and satisfaction about milk and milk
products and certain of the important areas such as channels of
distribution and promotional activities. Against this back drop, an attempt
is made in this study to deserve in to the introduced areas as specified
above.

57
5. Objectives

58
Chapter 5
Objectives
The objectives of the study are:
1. To understand the need and nature of the training programmes.
2. To understand the organizational infrastructure available to conduct
the employee training programmes.
3. To get a feedback from the employees with respect to the usefulness
of the training programmes.
4. To identify the gap in the training programmes of the sample
organization and make suggestion to improve the same.
5. The study has been done with and special reference to Sangam Dairy.
59
6. Research
Methodology 6.0 Secondary data: ............................................................................ 60
6.1 Primary Data: ................................................................................. 61
6.2 Sample size: .................................................................................. 61
6.3 Sampling Method: ......................................................................... 61
6.4 Data collection method ................................................................. 61
6.4.1 Questionnaires: .............................................................. 62
6.4.2 Schedules: ..................................................................... 62
6.5 Data Analysis: ................................................................................ 62
60
Chapter 6
Research Methodology
Methodology is a system of principles, practices and procedures applied
to a specific branch of knowledge and it can also be described as the
method of achieving objectives through the data collection.
Basically, data can be classified into two types
Secondary data
Primary data
6.0 Secondary data:
Secondary data means data that is already available. They refer to
the data which have already been collected and analyzed by someone
else and which have already passed through the statistical process is
called secondary data. Secondary data may either be published data or
unpublished data.
The sources of secondary data are:
Printed materials and brochures
Evaluation statements of the employees feedback using
questionnaire method.
The secondary data used for the study are Company books and yearly
accounts manuals. The history of the company, organizational structure,
employee data, training methods are collected from company books,
Financial structure, production figures, annual accounts, annual budget
details are collected from early account manuals.

61
6.1 Primary Data:
Primary data can be collected either from experience or through
survey. That data which is collected afresh and for the first time and thus
happened to be original in character is called primary data. Some of the
means of collecting Primary data are listed below:
Observation
Through personal interview
Questionnaire
Schedules
6.2 Sample size:
The sample size for data collection is 125. The sample size was selected
by using sample size calculator available at the website
http://www.surveysystem.com/sscalc.htm. The sample size that was
arrived at with a confidence level of 95% and confidence interval of 8% is
121.
6.3 Sampling Method:
The type of sampling chosen is ―Stratified sampling‖ as the
population is divided into different segments on the basis of certain
common characteristics and then selection of items randomly from them
to constitute the sample. For the study the sample is selected randomly
from different departments and different levels in each department.
Necessary care was taken so ensure the sampling remained random.
6.4 Data collection method
The method used for data collection for the study is questionnaire
and schedules.
62
6.4.1 Questionnaires:
The questionnaires are generally sent through mail to informants. For
this study 50 questionnaires were administered to persons in the
managerial and supervisory positions. The data collection through
questionnaire is relatively cheap and economical. However non-response
is usually high in this case and needs lot of followup.
The questionnaire was administered to about 75 workers. As most of the
workers were not adequately educated to understand the questionnaires
that were made in English, after a preliminary visit to the dairy the
questionnaire was translated to Telugu, their mother tongue, The
questionnaire and the options to all the questions are translated to Telugu
and were given to the workers for obtaining their responses. For those
workers who are not even proficient in reading Telugu schedules method
was used for data collection.
6.4.2 Schedules:
Schedule method of data collection is very much like the collection of
data through questionnaire, with a little difference that schedules are filled
by the enumerators. Most of the workers in the organisation are
insufficiently educated to respond to questionnaire. Hence, decided to
use schedule for such sample respondents. Schedules were administered
to about 40 respondents personally by researcher so as to ensure better
control over data collection process.
6.5 Data Analysis:
Data collected from the above exercise was fed to the SPSS software
and an analysis was carried on the output of the SPSS. The graph and
tables that were generated by the software is enclosed at Annexure II.
The analysis was carried out separately for workers, executives and HR
employees engaged in the process of training employees.
63
7. Sangam Dairy
– A case study 7.0 Company profile of Sangam Dairy ............................................... 64
7.1 Organisational structure ............................................................... 67
7.2 Market profile of sangam dairy ..................................................... 68
7.3 Some facts about Sangam ........................................................... 69
7.4 Other Services ............................................................................... 70
7.5 Future targets ................................................................................ 70
7.6 Awards and recognitions .............................................................. 71
7.7 Innovations and interventions ...................................................... 71
7.8 Services offebred to the milk producers by Sangam ................. 72
7.9 Man power status .......................................................................... 74
7.10 HR Activities in Sangam Diary ..................................................... 74
7.12 Industrial relations ......................................................................... 77
7.13 Wage and salary administration .................................................. 77
7.14 Performance appraisal .................................................................. 78
7.15 Employee welfare and social security ......................................... 79
7.16 Social security................................................................................ 79
7.17 Training programmes arranged in Sangam Dairy ...................... 79

64
Chapter 7
Sangam Dairy – A Case study
7.0 Company profile of Sangam Dairy
The Sangam diary offers and illustration of one of the most successful
dairies sponsored on the Anand pattern. The name and style of the
Sangam dairy is due to presence of ―Sangameswara temple at village
Sangam Jagarlamudi in the immediate vicinity of the dairy plant. The
dairy is located on the Guntur & Tenali highway (via Narakodur) about 16
km from Guntur town.
Andhra Pradesh has permanent place in the dairy map of India. The
cattle wealth of A.P. is estimated at Rs. 220 crores and account of 70 per
cent total value. The Sangam dairy, Vadlamudi was commissioned on 1-
8-1978.
Sangam dairy, Vadlamudi has area site of 27.3 acres and cost of factory
building is Rs. 120 lakhs and the cost of UNICWF equipment and reaction
of about 19.4 Cores at present.
The Guntur district Sangam diary registered on 6-7-1983. Authorized
share capital is Rs. 5,00,000/- and paid up share capital is 3,02,000/-.
The number of societies registered is 193, number of societies affiliated
165, amount of fixed deposits are worth Rs.6,61,500/-.
In 1988-90 machinery was established in processing section chillier
capacity 20,000 ltd capacity 13 tanks. Now the above capacity is imported
chiller capacity.
The factory has the installing capacity of 1.25 expansions to 2.59 lakh
liters per day in the second stage. Sangam Dairy, Vadlamudi had the
distribution of handling milk to its capacity in the second year operation.
Apart from the handling milk (to its capacity) from Guntur district, it also
65
handled surplus milk received from districts of Prakasam during 1982-83
with a view to handling the increased surplus milk from Nellore, east and
west Godavari districts, A second spray drying plant with latest design to
produce about 14 M.T of milk powder had been established and
commissioned during 1982.
Guntur District was formed on 1 October. 1904 with head quarters at
Guntur. About 157 mandals have come into existence with effect from
25th May 1985 in the place of taluks and firkas. The Krishna and
Nalgonda districts bound the district on the north, on the west by
Prakasam and Mahaboobnagar districts, on the south by Prakasam
district, on the east by Bay of Bengal. It is situated between 15-18 and 16-
50 of the north longitude and 7- 10 and 80-55 of the eastern longitude
under the operation flood – 1 program. Guntur district was selected to
develop dairy activities on Amul pattern. Keeping in view the 3-tier system
of village dairy cooperative society at village level managed by the
selected representative of milk producers, a co-operative union at district
level managed by the representatives of village dairy co-operative
societies and co-operative federation at state level which is the apex body
are in vogue.
The Guntur district milk producers‘ co-operative union limited is registered
under Andhra Pradesh co-operative society‘s act 1964 with registration
number: 83 DD DT. 23.2.1977 with 81 affiliated milk producers‘ co-
operative societies. At present 840 milk procuring co-operative and 125
milk collection centers are functioning in the area of Guntur district milk
producer‘s cooperatives union limited. They are supplying a maximum
quantity of 2.2 lakh liters milk per day during flush season. The board of
management of the union comprise of 12 elected board of directors from
the village dairy co-operative societies and 5 ex-official board directors
comprising of one representative each from Andhra Pradesh dairy
development co-operative Federation (A.P.D.D), Director of Animal
Husbandry, Registrar of Co-operative societies, representative of finance

66
agency and the chief executive on the union. The management of the
dairy was handed over to the Guntur district milk producers Co-operative
Union limited by the Andhra Pradesh Dairy Development Corporation on
30-8-1978.
The Dairy has provision to mark 8 M.T of butter, 6 M.T of Ghee and 22
M.t of milk powder per day. The surplus milk after meeting the demand
from the public will be converted into products. Sangam Ghee is
consumed pack is being done only from Sangam Dairy, Vadlamudi in the
state. During 1988, trails were successfully conducted on manufacture of
infant milk food, based on the formula, provided by the centre
subsequently. Infant milk food with the brand name of ―Sangam spray‖
was introduced in customer pack of 1kg and ½ kg throughout the country.
The Sangam diary, Vadlamudi had the distinction of being first public
sector organization in the county, which produces milk powder - skim and
whole milk powder. The Ice cream milk powder is also being
manufactured in the dairy.
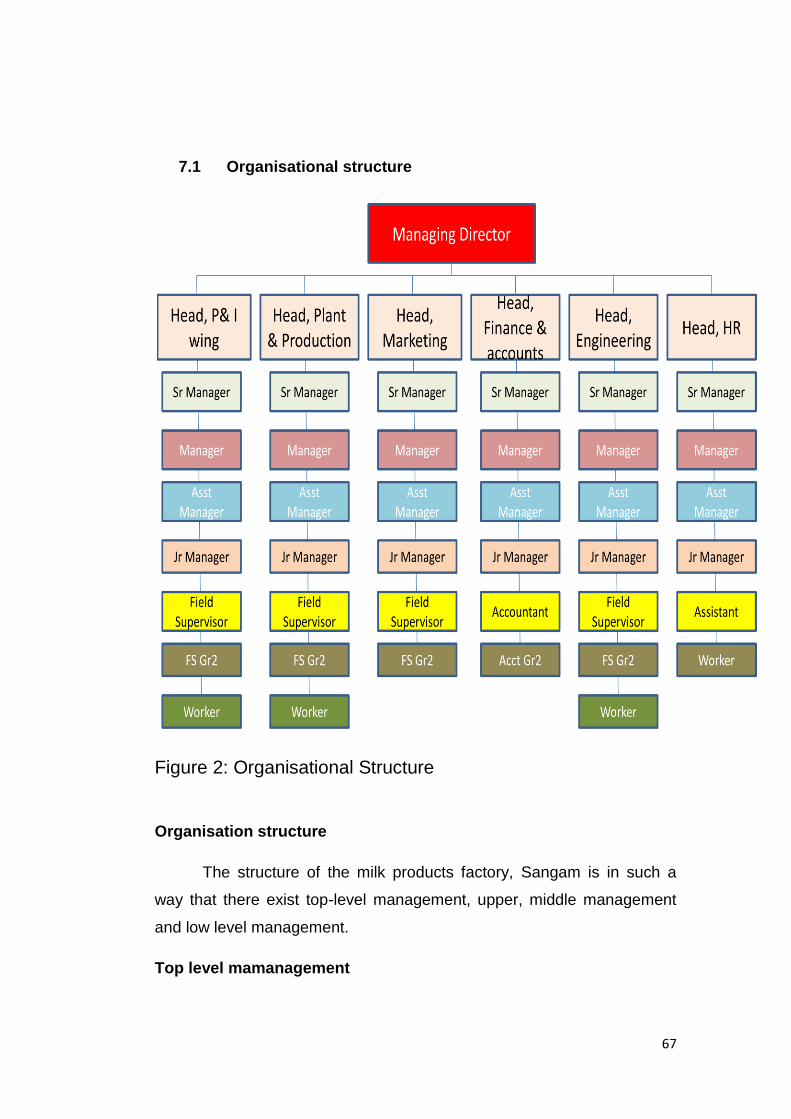
67
7.1 Organisational structure
Figure 2: Organisational Structure
Organisation structure
The structure of the milk products factory, Sangam is in such a
way that there exist top-level management, upper, middle management
and low level management.
Top level mamanagement
68
It refers to the administrative function and consists of board of
Directors, Chairman, General Manager of the company. They constitute
authority in the company, they set the objects the goal establishes the
policies and that being put into effect not. The organization effectiveness
depends upon willingness.
Upper level management
It consists of the various department heads such as plant manager
production manager, Deputy director of procurement, senior A/C officer,
marketing manager, material manager, personal manager and quality
control manager.
Middle management
This group consists of the deputy heads of the upper middle
managers. They are assistant dairy manager, assistant director A/C
officer, assistant manager of stores, quality control officer, personal
officer, and welfare section supervisor.
Lower level management
This group includes foreman, assistant dairy manger field supervisor,
quality control, assistant manager and security supervisor.
7.2 Market profile of sangam dairy
The union is currently marketing 150 lakh litres of milk in all the
towns in Guntur district besides twin cities of Secendrabad and
Hyderabad, Tirupati and Chennai.
Sangam produces and markets several milk products like
o Skim milk powder
o Table butter under vijaya brand
o White butter
o Ghee
o Doodhpeda
o Sterilized flavoured milk
69
o Butter milk in sachets
o Kalakan
o Basundi cups
o Curd(200 ml sachets,100 ml sachets)
o Sweet lassi (200 ml glasses, 200 ml sachets)
o Milk cake
o Paneer
o Sangam dairy also markets Mineral Water under ‗
Vijayasangam brand‘. Water is manufactured using
―Reverse osmosis‖ process.
7.3 Some facts about Sangam
Sangam has a strength of 167 lakh member producers and
produced around 479 lakh litres per annum during the year 2008 –
2009.
Sangam pumps back around Rs.240 lakh in to the rural economy
every 10 days towards payment to the milk producers (2008 –
2009).
Sangam cooperative is spread across and interwoven with 643
villages of Guntur districts.
Cream rich Sangam milk and Toned milk is sold in 8 towns in
Guntur districts. Sangam is brand leader in Guntur district.
Sangam paid one of the returns to the member producers during
2008- 2009, 76% of the turnover was paid as purchase price to
farmer
Sangam dairy products sell at a premium price on account of its
quality and richness.
Vijaya table butter is one of the leading brands in all Metro‘s. Table
butter in 500 gms, 100 gms, 10 gms(chiplets) is manufactured at
Sangam Dairy.
70
Sangam besides giving remunerative price to the farmers has been
consistently paying price difference to all its milk producers from its
surpluses.
Sangam Dairy commands a business turnover of approximately
189 crores. It is projected to double in the next five years.
Sangam hybrid fodder seeds are processed at it‘s own seed
processing plant at Guntur and are sold to all leading cooperatives
in the country.
7.4 Other Services
Apart from the business of Dairy and dairy products Sangam is
involved in serving the farming community in a big way. Various
services that are offered to the farmers include
Animal vaccines at subsidy rates
Fodder seeds
Distribution of chaff cutters
Distribution of cattle feed on subsidy rates
Distribution of mineral mixture
Cattle insurance on 1/5 subsidy
Providing financial aid in construction of society building
Distribution of cross breed cows and heifers
Training programmes to all farmers and paid secretaries
Accidents insurance to all member producers
7.5 Future targets
Some of the targets that sangam has set itself are
To enhance the present procurement to 4.0 ltrs/day.
To enhance the business turnover to 300 crores.
To make pucca buildings for all the milk societies in villages.
To bring all the societies in the districts to electronic milk
testing.
71
To achieve total computerization of ERP – programme with
OFC LAN network.
To achieve auto milk collection units more than 80 milk
societies in villages.
7.6 Awards and recognitions
Sangam was awarded for excellence and some of the awards
are
Recipient of excellence award and udgyog ratna award during the
year 1997 from the institution of economic studies – New Delhi.
Recipient of gold star award from the council of economic study
New Delhi in 1998.
Recipient of sri Mulukunuru viswanatha Reddy Award for coop
excellence by the coop development foundation – Hydarabad in
2005.
7.7 Innovations and interventions
Sangam which has been innovating and some of their new
interventions which have improved the position of the dairy and
worth mentioning are
1. Marketing of Sangam milk initiated in Hyderabad (june1997) and
Chennai (sep1999) and currently around 18,500 ltrs per day is sold on
Hyderabad, 54,000 in Chennai, Tirupati, Kalahasti, Kanchi, Nellore
and cuddapah.
2. Diversification into pure drinking water production and marketing of
―Vijaya Sangam‖ Mineral Water in 20 ltrs jars, 12 ltrs cans, 5ltrs
bottles,1 ltr bottles, 500ml sachets.
3. Curd in200grams poly pouches and 100 ml cups.
4. Kalakhand in 250 grams plastic boxes.
5. Sweet lassi in 200 ml glasses and sachets marketing since April 2004.
72
6. Sangam ghee poly pouches in 1liter, 500 ml and 200 ml marketing
since November 2000.
7. Milk cake and Paneer in 250 grams and home pack launched in
January 2006.
8. Supplying cattle feed to meet the requirement of producers at just
Rs.9.00 per kg.
9. Hybrid fodder seed, vaccines at subsidized prices to farmers.
10. Insurance coverage (milk producers accidental insurance) to 1,00,000
member milk producers for an amount of Rs.50,000.
7.8 Services offebred to the milk producers by
Sangam
7.8.1 Milk procurement
o Procuring all the surplus milk offered by Milk Producers round the
year with remunerative price based on quality of milk offered.
o Providing adequate infrastructural facilities for collection, testing
and transportation of milk.
o Free supply of testing chemicals to the MPCS.
o Providing service to all the EMT machines used for fat testing.
o Providing managerial assistance to the dairy co-operatives.
o Encouraging the milk producers to form co-operatives and
assisting them in the process.
o Encouraging milk producers through awards to the best producers
and co-operatives.
7.8.2 Animal breeding services
o Providing artificial insemination services through the A.I centers
maintained by the union.
o Providing high pedigree frozen semen procured from reputed
organizations
o Supply of breeding bulls of Murrah breed for natural service.

73
7.8.3 Feed and fodder development
Supplying quality feed of special ordinary, economy Categories regularly
from union owned feed plants.
o Supplying quality mineral mixture regularly.
o Supplying hybrid varieties of fodder seed at cost.
o Supplying fodder slips of improved varieties.
o Conducting Silvil Pasture programme in orchards.
o Conduct in wells recharging.
7.8.4 Animal health programme
o Supplying Vaccine for prevention of HS. HS-BQ and FMD
diseases on subsidized cost.
o Supplying deworming drugs for calf and adult cattle on full cost
o Arranging veterinary First Aid training to the MPCS Staff.
o Providing veterinary First Aid service through the VFA centers
maintained by the union.
o Conducting animal health camps.
o Conducting Mastitis control programme.
o Organizing Brucellosis prevention programme.
7.8.5 Other activities
o Providing insurance coverage for milk animals, milk producer,
spouse and cattle shed under the Gopal Raksha Scheme.
o Providing transport reimbursement for milk producers who procure
Murrah Buffaloes and cross breed cows from other states.
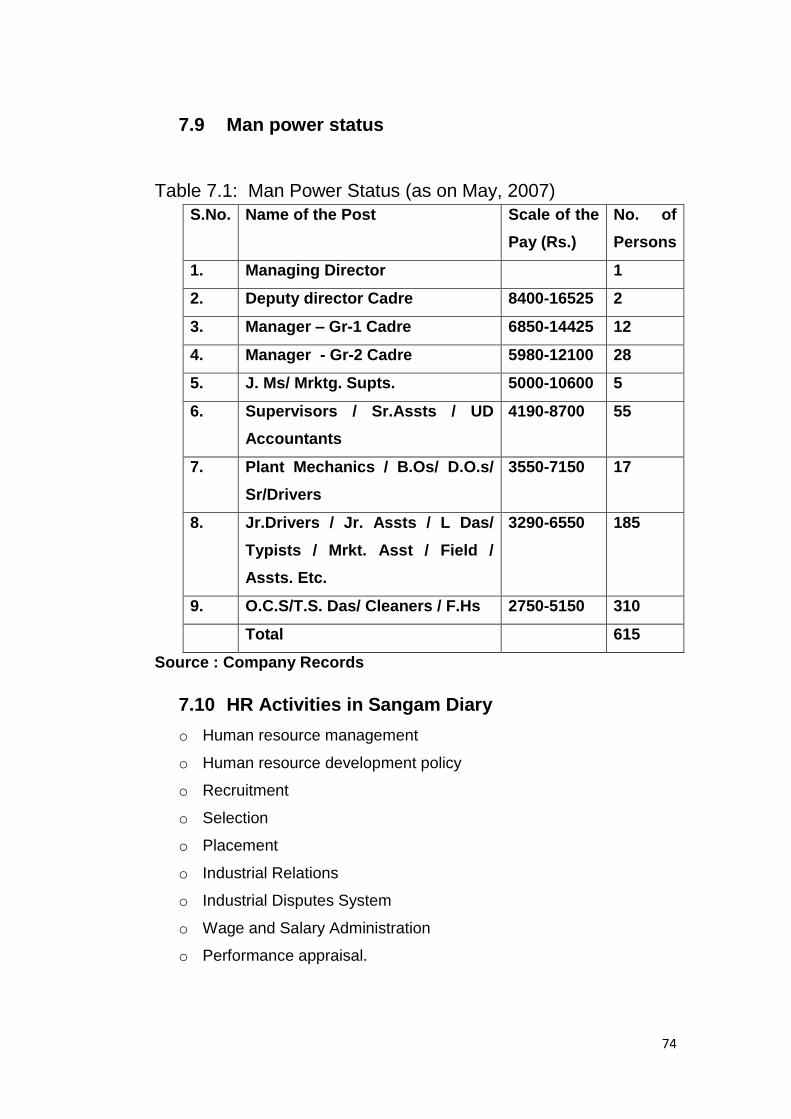
74
7.9 Man power status
Table 7.1: Man Power Status (as on May, 2007)
S.No. Name of the Post Scale of the
Pay (Rs.)
No. of
Persons
1. Managing Director 1
2. Deputy director Cadre 8400-16525 2
3. Manager – Gr-1 Cadre 6850-14425 12
4. Manager - Gr-2 Cadre 5980-12100 28
5. J. Ms/ Mrktg. Supts. 5000-10600 5
6. Supervisors / Sr.Assts / UD
Accountants
4190-8700 55
7. Plant Mechanics / B.Os/ D.O.s/
Sr/Drivers
3550-7150 17
8. Jr.Drivers / Jr. Assts / L Das/
Typists / Mrkt. Asst / Field /
Assts. Etc.
3290-6550 185
9. O.C.S/T.S. Das/ Cleaners / F.Hs 2750-5150 310
Total 615
Source : Company Records
7.10 HR Activities in Sangam Diary
o Human resource management
o Human resource development policy
o Recruitment
o Selection
o Placement
o Industrial Relations
o Industrial Disputes System
o Wage and Salary Administration
o Performance appraisal.

75
7.10.1 Human resource activities in the organisation
Human resources are nothing but the manpower in an organization. The
development of human resources can be known by verifying the
organizations human resources development policy.
7.11 Aspects covered under Human Resource Management
7.11.1 Recruitment
Recruitment is a process to identify the suitable candidates to the
suitable job.
7.11.2 Recruitment policy
This organization follows two types of sources for the recruitment of
the candidates.
(i) Inside sources
(ii) Outside sources
7.11.2.1 Inside sources
This organization takes the help of inside sources in procedures
like promotions, employee references, employee children's and transfers
etc.
7.11.2.2 Outside sources
The Organization follows this type of outside sources help
to recruit the candidates. Outside sources of paper advertisements,
through colleges and universities, employment exchanges Internet etc.
7.11.3 Selection
Meaning:
"Selection is a process to select the Right candidates for the given job."
7.11.3.1 Selection Procedure
Sangam dairy follows the following procedure to the process of selection.
76
7.11.3.2 Application Bank
It involves collection of candidate Name, Qualification, and experience
etc. through the application they receive.
7.11.3.3 Tests
After completion of short listing from the Application Blank, the HR
department in Sangam conducts written test to assess the capability of
the shortlisted candidates.
7.11.3.4 Interviews
After completion of written test the organization conducts
interviews for the applicants who qualified in the written test.
7.11.3.5 Medical Test
It is a common test for every job in Sangam. The candidates
qualified after the Interview will undergo medical test and only those who
are successful after the medical test are offered appointment.
7.11.3.6 Placement
Placement means to place the right candidates in the right job. The
process of placement is done in two stages.
7.11.3.7 Induction
Induction means to introduce the new employee for the organization.
Generally the induction period is one day to one week, depending up on
the person. If it is a big organization the induction period is one month. In
Sangam dairy the Induction period, depending on the job, lasts between
one day to one week.
7.11.3.8 Probation
In Sangam the Executive and managerial cadre probationary period
is six months to one year. If the management is not yet satisfied probation
period could be extended.

77
7.12 Industrial relations
7.12.1 Grievance redressal system
There are two types of methods followed to handle the Grievances of
employees in Sangam.
Step ladder policy
Open door policy.
7.12.2 Industial disputes system
Industrial disputes act 1947 described the methods and
machinery to settle the disputes. The organization is following the same.
7.12.3 Works commiittee
As per the industrial disputes act 1947 every organization where
100 or more workers are ordinarily employed the management should
constitute workers committee with representatives of both employers and
workers.
7.12.4 Safety committee
As per Factories act 1948 every factory, where 1000 or More workers are
ordinarily employed the management should constitute safety committee.
As the number of employees in the organization is less than it is not
mandatory to have a safety committee but however keeping the safety of
employees in view they have a safety committee in place which looks
after the safety of man and machines.
7.13 Wage and salary administration
7.13.1 Job Evaluation
Job Evaluation is a method to evaluate the jobs. Based on the Job
analysis the salary or wage of different cadres is fixed in Sangam.

78
7.13.2 Wage and salary components
Basic salary + Dearness Allowances+ V.D.A.+T.A.+Medical
Allowances +Other Allowances.
Policy procedure on D.A. Fixation
ln this Organization they Follow in fixation of D.A .through collective
bargaining between management & trade unions Wage board
Recommendations, Index numbers, Awards consider in collective
bargaining process.
7.14 Performance appraisal
Performance appraisal is a method to evaluate the Performance of an
individual.
7.14.1 Methods of Performance Appraisal
In Sangam there are two types of methods Involved in performance
appraisal.
1. Traditional method
2. Modern method
7.14.1.1 Traditional methods
Traditional methods are
(i) Simple Ranking Method
(ii) Person-to-Person comparison method
(iii) Graphic Scale Method
(iv) Confidential method
(vi) Forced method
7.14.1.2 Modernisation method:
The modern methods are
(i) MBO (management by objectives)
(ii) BARS (Behavioral Anchored Rating Sales)
(iii) Psychological Appraisal
(iv) 3600appraisal

79
7.15 Employee welfare and social security
.
The following welfare Provisions mandated under the Factories act 1948
are provided for the smooth running of the Organization.
Sec 42 Washing Facilities
Sec 43 Facilities for Storing and Drying Clothing
Sec 44 First aid Appliances
Sec 45 Facilities for Sitting
Sec 46 Canteen Facilities
Sec 47 Shelters lunch rooms and Lunch Rooms
Sec 48 Creches
Sec 49 Welfare Affairs
7.16 Social security
There are some Social Security Legislations existing in Sangam.
1. Employee Insurance Act 1948
2. Employee Provident Fund and Miscellaneous Provisions Act1942.
7.17 Training programmes arranged in Sangam Dairy
Like wise any other organization the Sangam Dairy unit also conduct the
following training programmes. The dairy unit undertake the following
programmes as its training programme. They are
1. On the job training
2. Off the job training
7.17.1 On the job training
Methods of on the job training takes place in Sangam are
a. Job rotation
b. Job instruction training
c. Coaching.
d. Committee assignments.

80
7.17.1.1 Job rotation
Job rotation implies systematic, planned and co-coordinated effort to
transfer an executive from job to job or from plant to plant. The main aim
of job rotation is to broaden the general back ground of the training
business. A junior entrant who is new to the organization requires a
considerable degree of specialized knowledge and skill but a man can
never acquire the diversified skill unless he is put in different types of
situations.
7.17.1.2 Job instruction training
Under this method instruction is being given by the senior or the instructor
and the employee or the junior will follow the instructions laid by the
senior in order to arrive their task or to co-operate with the management
so as to increase the productivity.
7.17.1.3 Coaching
Under this method the immediate superior guides the subordinates
about various methods and skills of job. He briefs the trainees what new
is expected from him and also guides him how to get it. He also watches
their performance.
7.17.1.4 Committee assignments
Under this method ad-hoc committee is constructed and is assigned a
subject related to make recommondents. Through the discussion in the
committee meetings the performance of the members are reviewed and
grade is given according to the performance.
7.17.2 Off the job training
Off the job training techniques used in Sangam are
a. Role play
b. Lecture method
c. management games
d. case study
e. special courses

81
7.17.2.1 Role play
Under this method their definite role is given to an employee to
play on. No dialogues will be given to the before. The employee should
play a particular role if he is in a present situation which is given to him.
7.17.2.2 Lecture method
A conference or Group meeting is conducted according to the
organized plan in which members practiced the oral discussion of a
particular problem and thus develop their knowledge and Understanding.
It is an Executive training device for conference. members and
conference leaders.
7.17.2.3 Management Games
Role play is a technique generally used for human relations and
leadership training. The purpose of trainees is to give an opportunity to
the learn of human relation skills through practice and to developing sight
of one‘s own behavior and effect upon others.
7.17.2.4 Case study
Case study method is generally to teach law, business
management and human relations etc. let the trainee may understand
that there will be different solutions to a particular problem. Under this
method real or hypothetical problem is given and solutions are to be
given.
7.17.2.5 Special courses
Under this method the special courses are offered by the
management to the manager to study for the future benefit and to
improve his own knowledge and to develop the organization .all this
expenses will be bare by the company only.
The HRD activities of Sangam dairy are organized in a three tier system
— village level, unit level and federation level. Villages form the grass root
level of the co-operative milk societies. The membership of the villagers is
mobilized and they are encouraged to become members of the society.
They constitute an important aspect of dairy industry in the sense that the

82
milk is supplied by them for processing at the district level. The farmers
are given guidance about the cattle rearing. They are also educated on
various aspects of dairy technology like fodder for the cattle, maintenance
of their health, promotion of hygiene, increase in milk yield and their role
in the organizational set up co-operative societies. In this regard a good
number of training programmes are organized for the farmers aiming at
their participation and qualitative improvement in their contribution for
effective functioning of society. A manager is appointed for this purpose
at Sangam diary who along with his supporting staff goes to the rural
areas and organize the training programmes at this level.
At the district level where the milk processing units are located attention is
paid to cover both managerial as well as non-managerial employees
under various training programmes. As regards the non- managerial
employees, on the job-training becomes the key aspect. As soon as an
employee is hired he is placed under the guidance of a supervisor, his
performance on the job is closely supervised and monitored by the
supervisor. The employee is given feedback about his performance and if
necessary coaching is given to overcome his deficiencies and improve his
performance.
In Sangam diary a training centre is established where the supervisors,
technical staff, clerks, workers, helpers and dairy attendants are given
training. This is mostly in the nature of off-the job training. If expertise in
the organization in the unit is not adequate they can bring outside expert
to train. It is noticed that an employee is given training not only in the
narrow area of his job but also helped to acquire skills and knowledge in
the related traits of the job. By this the concept of multi skilling is applied
and employee after-receiving his training is able to perform the jobs of
related trades. The researcher found that the efforts of the centre, through
appreciable are not adequate and they need to be further strengthened.
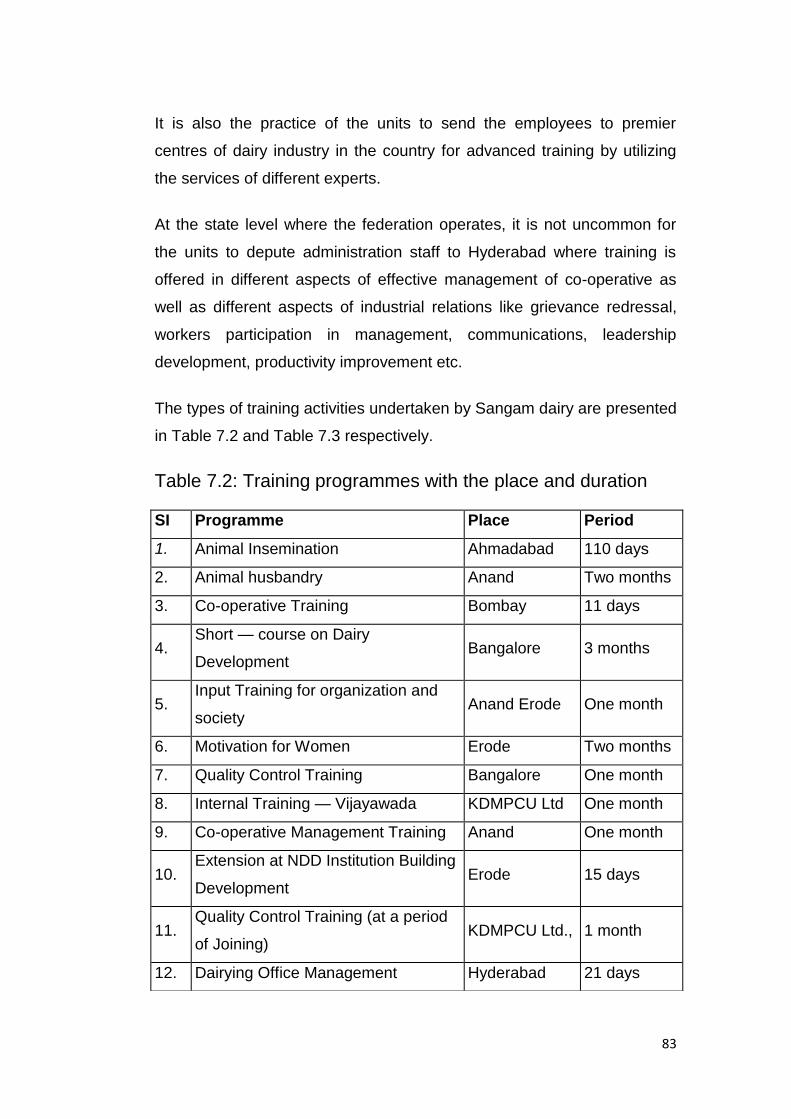
83
It is also the practice of the units to send the employees to premier
centres of dairy industry in the country for advanced training by utilizing
the services of different experts.
At the state level where the federation operates, it is not uncommon for
the units to depute administration staff to Hyderabad where training is
offered in different aspects of effective management of co-operative as
well as different aspects of industrial relations like grievance redressal,
workers participation in management, communications, leadership
development, productivity improvement etc.
The types of training activities undertaken by Sangam dairy are presented
in Table 7.2 and Table 7.3 respectively.
Table 7.2: Training programmes with the place and duration
SI Programme Place Period
1. Animal Insemination Ahmadabad 110 days
2. Animal husbandry Anand Two months
3. Co-operative Training Bombay 11 days
4. Short — course on Dairy
Development Bangalore 3 months
5. Input Training for organization and
society Anand Erode One month
6. Motivation for Women Erode Two months
7. Quality Control Training Bangalore One month
8. Internal Training — Vijayawada KDMPCU Ltd One month
9. Co-operative Management Training Anand One month
10. Extension at NDD Institution Building
Development Erode 15 days
11. Quality Control Training (at a period
of Joining) KDMPCU Ltd., 1 month
12. Dairying Office Management Hyderabad 21 days

84
Source: Sangam HR departments records
As mentioned in the above Table 7.2 various training programmes are
being organized in Vijayawada, Hyderabad, Bangalore, Bombay, Madras,
Ahmedabad, Anand, Erode, Baroda, and Allahabad. The training
programmes include animal insemination, animal husbandry, co-operative
training, short-course on dairy development, input training for organization
and society, motivation for women, quality control training, internal
training, cooperative management training extension at NDD institution
building development, dairy office management, HRD course, operation
and maintenance as aseptic filling machines, in plant training, English
training, first aid training, power maintenance, APS, tinseemers and dairy
technology. The duration of the above training programmes vary from one
week to two years depending upon the nature of the programme.
As revealed from the table 7.3 the planning included 8 training
programmes i.e veterinary first aid and Artificial insemination, VDC
training, institutional building and clean milk production, refresher course
in Animal insemination and first aid, farmers induction programmes, MCM
training programmes, management and accounts of MPCS and women
13. HRD Course Hyderabad 2 or 3
months
14. Operation and maintenance as
aseptic filling machines Baroda 40 days
15. IDDB Allahabad 2 years
16. In Plant Training Bangalore 1 month
17. English Training Hyderabad 20 days
18. First aid Training — Vijayawada KDMPCU Ltd 3 days
19. On powder maintenance NDDB Anand 25 days
20. APS BARODA -
21. Tinseemers Madras I week
22. Dairy Technology Hyderabad 3 months

85
Table 7.3 Training Programmes conducted
Sl.No. Name of the Programme Duration Batch size 04-05 05-06 06-07 07-08
1 Veterinary first aid & Artificial Insemination) 45 DAYS 20 60 60 60 60
2 V.D.C Training 12 DAYS 20 20 20 40 40
3 Institutional Building and clean milk production 3 DAYS 20 160 160 180 180
4 Refresher Course in A.l & first aid 6 DAYS 20 40 40 40 40
5 Farmers Inductions programme 1 DAY 50 600 600 600 600
6 M.C.M. Training Programme 2 DAYS 20 300 300 300 300
7 Management and Accounts of MPCS 5 DAYS 20 100 100 100 100
8 Woman Presidents 3 DAYS 10 30 30 30 30
1310 1310 1350 1350
Source: Sangam HR department records

86
presidents. The total number of trainees deputed for the above
programmes year wise are 1310 (2004-05), 1310 (2005-06), 1350 (2006-
07), and 1350 (2007-08). The duration of the programmes vary from one
day to 45 days. As indicated in the above table the management provided
the farmers induction programmes of one day duration and MCM training
programmes of two days duration for 600 and 300 farmers respectively as
per their plan.

87
8. Data Analysis
8.0 General questions ......................................................................... 88
8.1 Questions specific to Executives ................................................. 96
8.2 Questions specific to Workers ................................................... 105
8.3 Questions specific to HR Executives......................................... 118
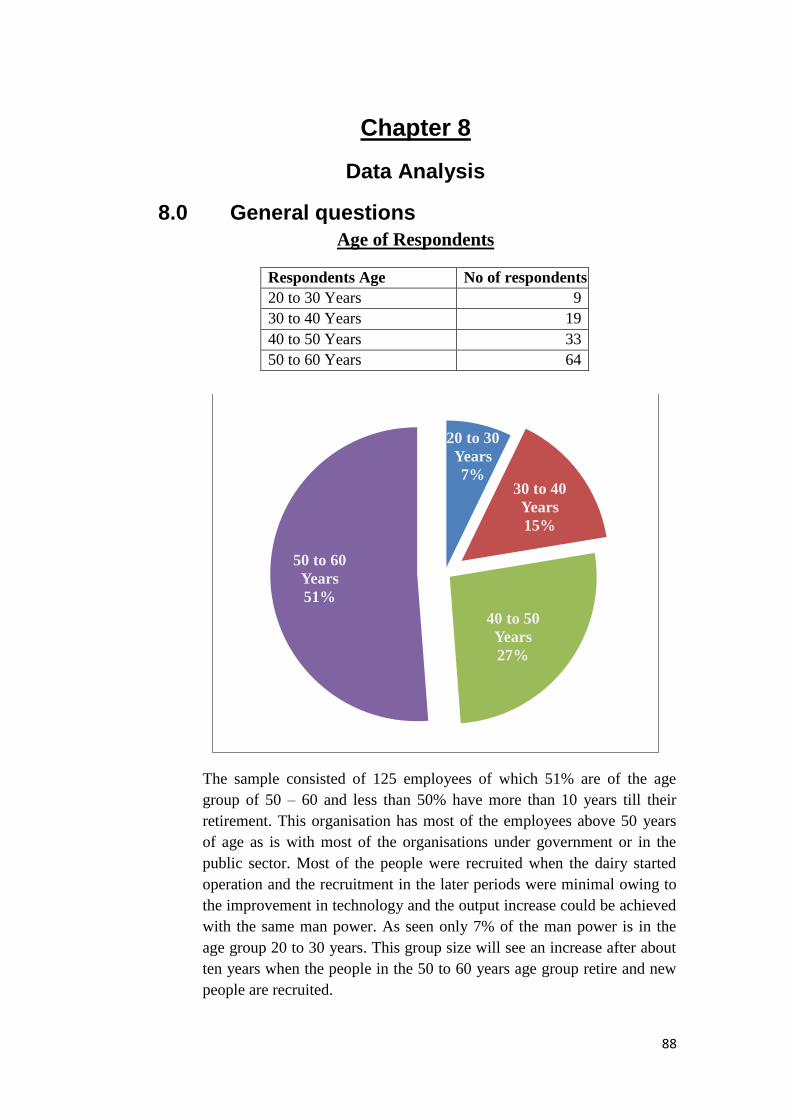
88
Chapter 8
Data Analysis
8.0 General questions
Age of Respondents
The sample consisted of 125 employees of which 51% are of the age
group of 50 – 60 and less than 50% have more than 10 years till their
retirement. This organisation has most of the employees above 50 years
of age as is with most of the organisations under government or in the
public sector. Most of the people were recruited when the dairy started
operation and the recruitment in the later periods were minimal owing to
the improvement in technology and the output increase could be achieved
with the same man power. As seen only 7% of the man power is in the
age group 20 to 30 years. This group size will see an increase after about
ten years when the people in the 50 to 60 years age group retire and new
people are recruited.
20 to 30
Years
7% 30 to 40
Years
15%
40 to 50
Years
27%
50 to 60
Years
51%
Respondents Age No of respondents
20 to 30 Years 9
30 to 40 Years 19
40 to 50 Years 33
50 to 60 Years 64
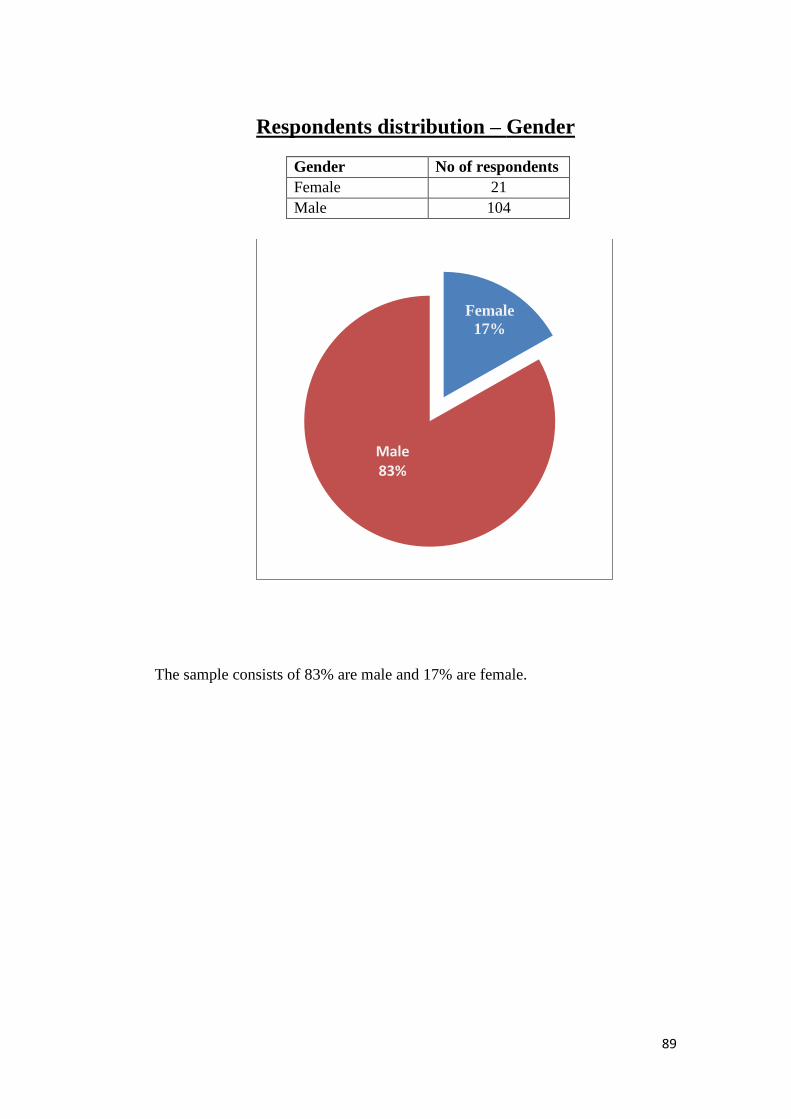
89
Respondents distribution – Gender
Gender No of respondents
Female 21
Male 104
The sample consists of 83% are male and 17% are female.
Female
17%
Male 83%
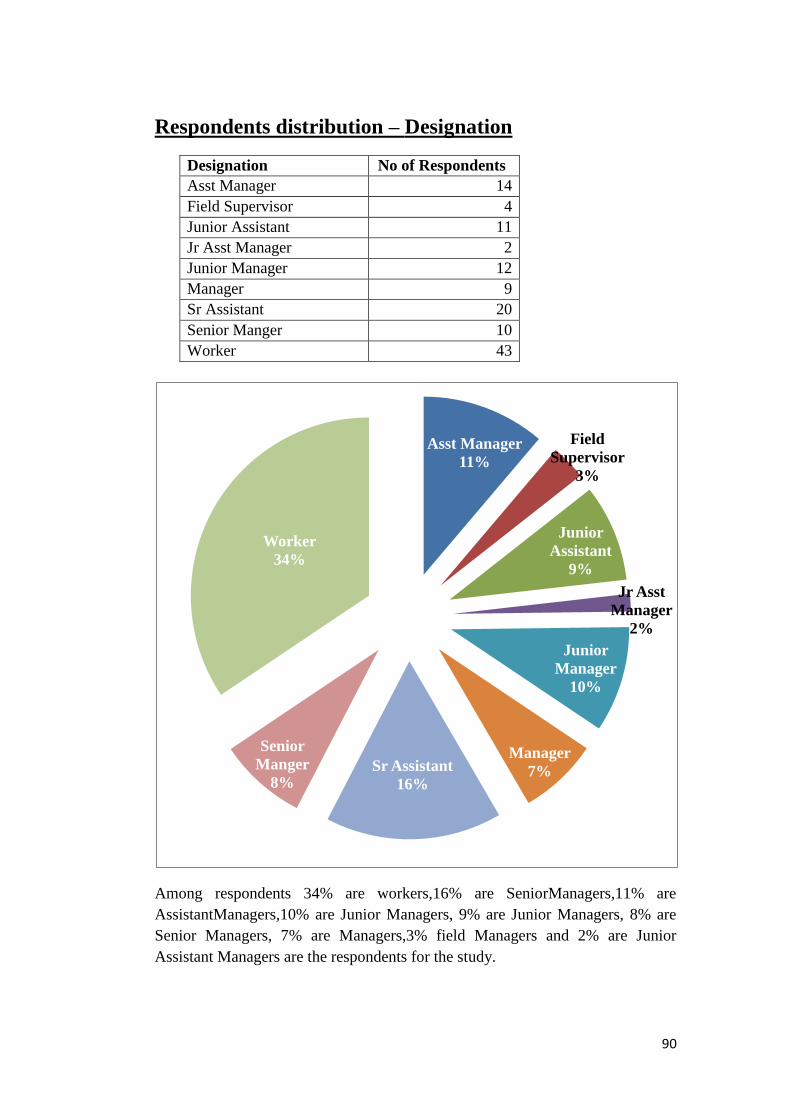
90
Respondents distribution – Designation
Designation No of Respondents
Asst Manager 14
Field Supervisor 4
Junior Assistant 11
Jr Asst Manager 2
Junior Manager 12
Manager 9
Sr Assistant 20
Senior Manger 10
Worker 43
Among respondents 34% are workers,16% are SeniorManagers,11% are
AssistantManagers,10% are Junior Managers, 9% are Junior Managers, 8% are
Senior Managers, 7% are Managers,3% field Managers and 2% are Junior
Assistant Managers are the respondents for the study.
Asst Manager
11%
Field
Supervisor
3%
Junior
Assistant
9%
Jr Asst
Manager
2%
Junior
Manager
10%
Manager
7% Sr Assistant
16%
Senior
Manger
8%
Worker
34%

91
Respondents distribution – department wise
Department No of Respondents
Engineering 15
Finance & Accounts 7
Human Resources 20
Marketing 8
P & I Wing 25
Plant & Production 50
In respondents 40% are plant and production,20% are p&I wing,16% are hr,12%
are Engineering,6% are marketing and 6% are finance department.
Engineering
12%
Finance &
Accounts
6%
Human
Resources
16%
Marketing
6%
P & I Wing
20%
Plant &
Production
40%

92
Experience profile of respondents
Question: How long have you been working for this company?
Experience No of Respondents
< 10 years 22
10 to 20 years 32
> 20 years 71
Among the respondents 57% have more than 20 years of experience,26% have
between 10-20 years of experience, and 17% have less than 10 years of
experience.
< 10 years
17%
10 to 20
years
26%
> 20 years
57%
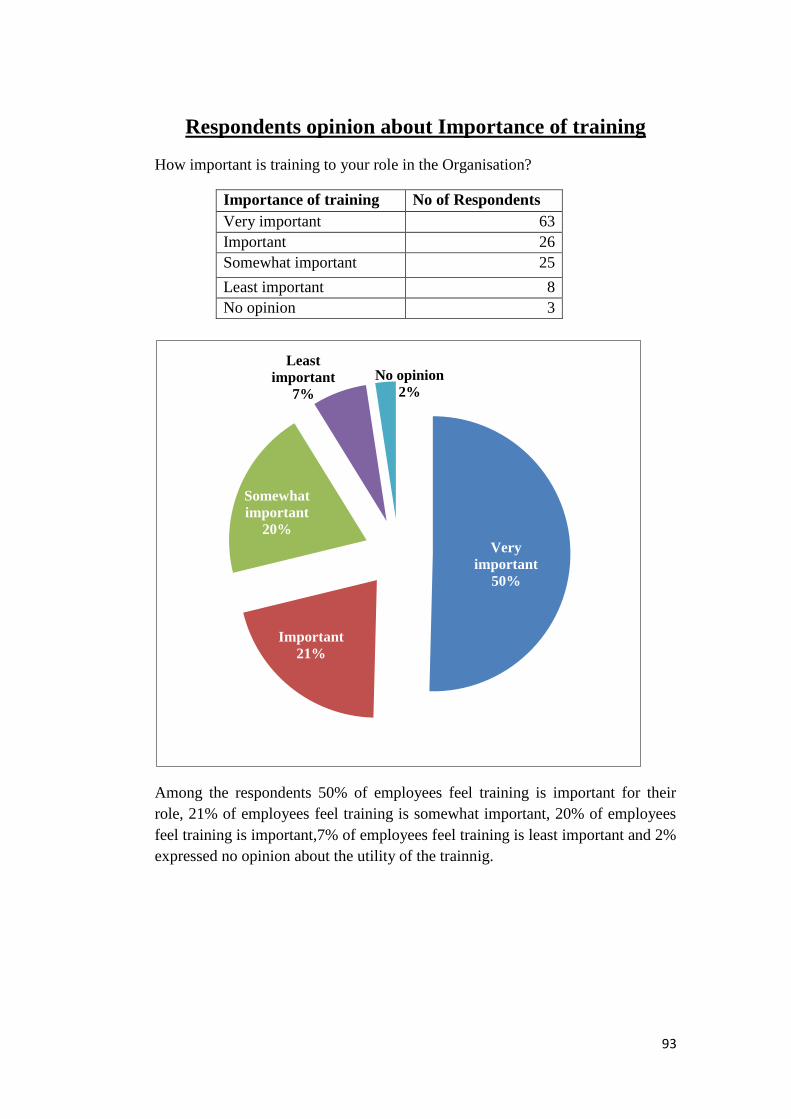
93
Respondents opinion about Importance of training
How important is training to your role in the Organisation?
Importance of training No of Respondents
Very important 63
Important 26
Somewhat important 25
Least important 8
No opinion 3
Among the respondents 50% of employees feel training is important for their
role, 21% of employees feel training is somewhat important, 20% of employees
feel training is important,7% of employees feel training is least important and 2%
expressed no opinion about the utility of the trainnig.
Very
important
50%
Important
21%
Somewhat
important
20%
Least
important
7%
No opinion
2%
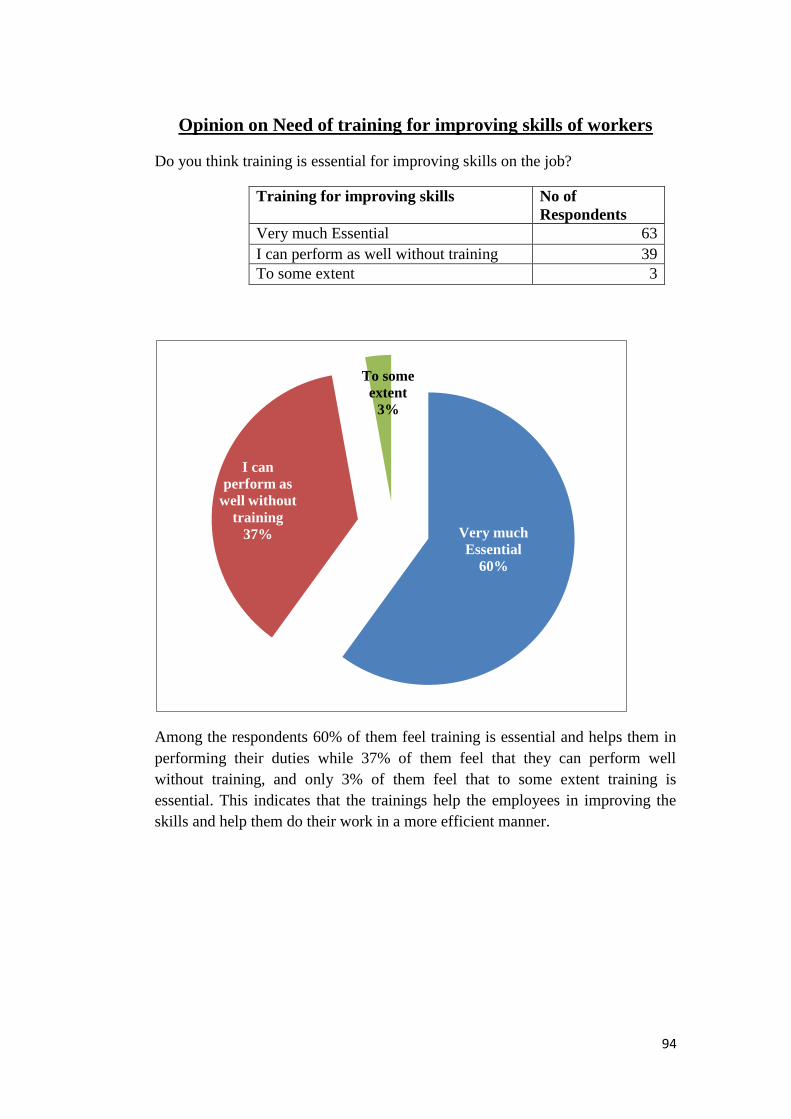
94
Opinion on Need of training for improving skills of workers
Do you think training is essential for improving skills on the job?
Training for improving skills No of
Respondents
Very much Essential 63
I can perform as well without training 39
To some extent 3
Among the respondents 60% of them feel training is essential and helps them in
performing their duties while 37% of them feel that they can perform well
without training, and only 3% of them feel that to some extent training is
essential. This indicates that the trainings help the employees in improving the
skills and help them do their work in a more efficient manner.
Very much
Essential
60%
I can
perform as
well without
training
37%
To some
extent
3%
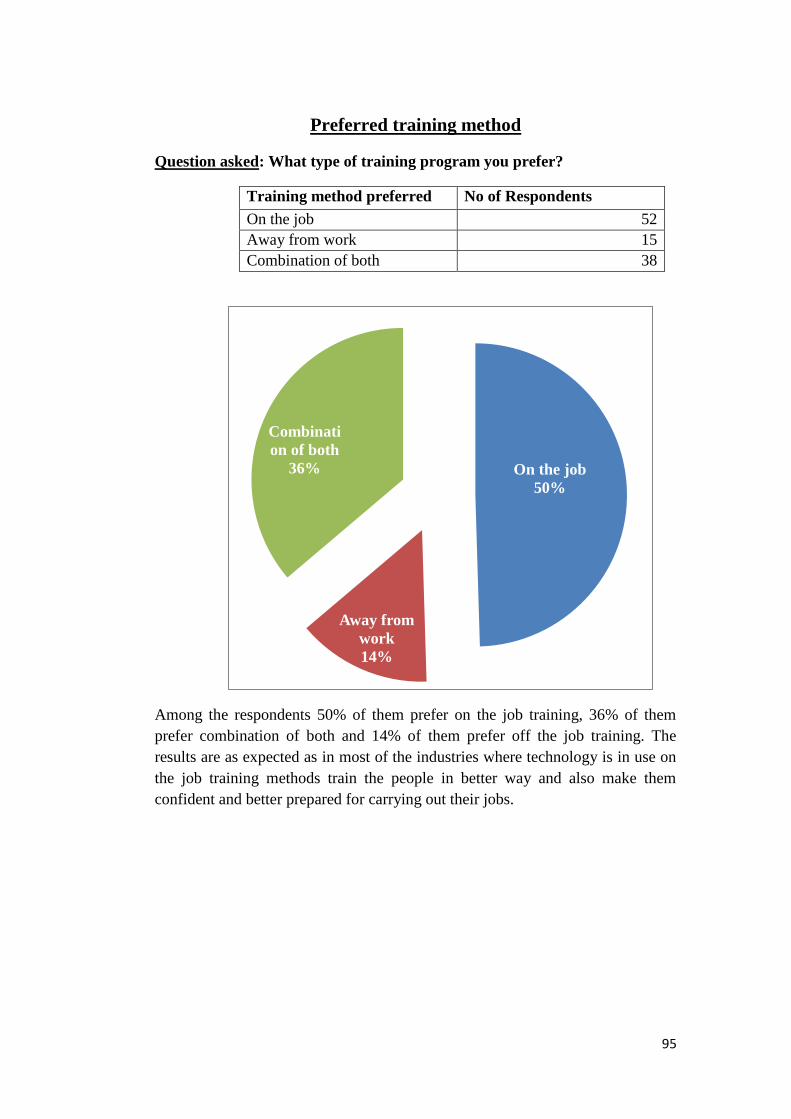
95
Preferred training method
Question asked: What type of training program you prefer?
Training method preferred No of Respondents
On the job 52
Away from work 15
Combination of both 38
Among the respondents 50% of them prefer on the job training, 36% of them
prefer combination of both and 14% of them prefer off the job training. The
results are as expected as in most of the industries where technology is in use on
the job training methods train the people in better way and also make them
confident and better prepared for carrying out their jobs.
On the job
50%
Away from
work
14%
Combinati
on of both
36%

96
8.1 Questions specific to Executives
Number of Trainings attended
Question asked: How many training programs did you attend this year?
Trainings attended No of Respondents
Attended atleast one 13
Attended more than one 16
Attended as per need and suggestion of superiors 26
We need not attend but learn on the job 7
Among the respondents them 42% indicated that they attended trainings as
suggested by superiors and when ever required, 26% of them attended more than
one training, 21% attended only one and 11% did not attend any training
program but they learnt on the job. In all a total of 53% attended trainings either
on a need basis or learnt on the job which again is a need based effort. This
shows that the company is making a good effort in making an effective use of
training as a tool of improving the capabilities of the employees.
Attended
atleast one
21%
Attended
more than
one
26%
Attended as
per need
and
suggestion
of superiors
42%
We need not
attend but
learn on the
job
11%
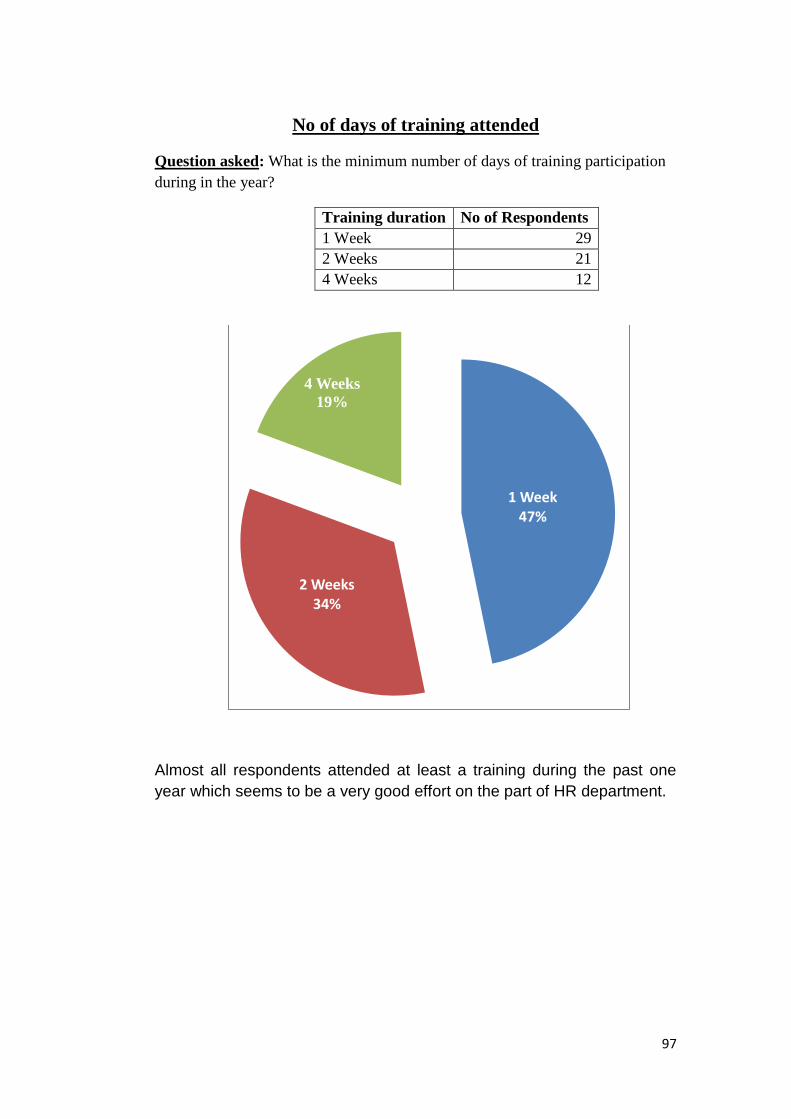
97
No of days of training attended
Question asked: What is the minimum number of days of training participation
during in the year?
Training duration No of Respondents
1 Week 29
2 Weeks 21
4 Weeks 12
Almost all respondents attended at least a training during the past one
year which seems to be a very good effort on the part of HR department.
1 Week 47%
2 Weeks 34%
4 Weeks
19%

98
Problems encountered during training
Question asked: Have come across any problem during the training sessions
conducted in your organisation?
Problems during training No of Respondents
Interpersonal 4
Personal 13
External 14
No problem 31
Among the respondents 50% of employees have no problem during the training
sessions, 23% have external problems, 21% have personal problems and the 6%
have interpersonal problems. As 50% had no problem while another 50% had
some kind of problem this area needs the attention of the management.
Interperso
nal
6%
Personal 21%
External 23%
No
problem
50%
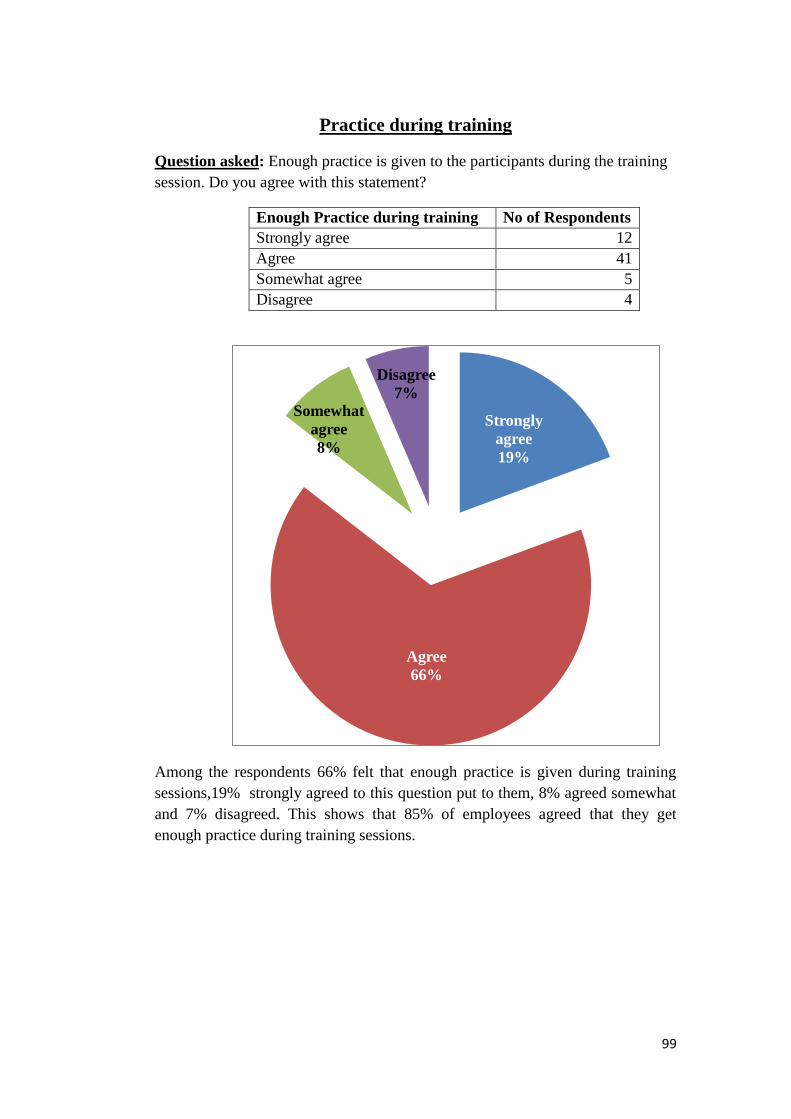
99
Practice during training
Question asked: Enough practice is given to the participants during the training
session. Do you agree with this statement?
Enough Practice during training No of Respondents
Strongly agree 12
Agree 41
Somewhat agree 5
Disagree 4
Among the respondents 66% felt that enough practice is given during training
sessions,19% strongly agreed to this question put to them, 8% agreed somewhat
and 7% disagreed. This shows that 85% of employees agreed that they get
enough practice during training sessions.
Strongly
agree
19%
Agree
66%
Somewhat
agree
8%
Disagree
7%
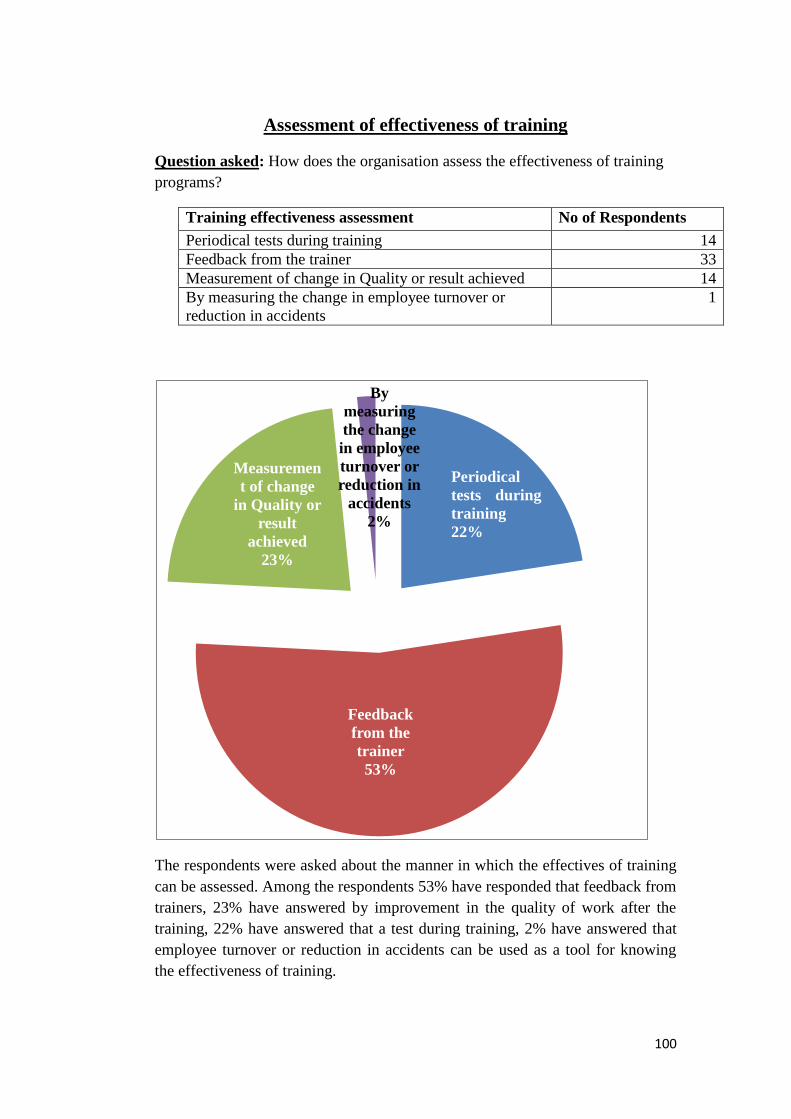
100
Assessment of effectiveness of training
Question asked: How does the organisation assess the effectiveness of training
programs?
Training effectiveness assessment No of Respondents
Periodical tests during training 14
Feedback from the trainer 33
Measurement of change in Quality or result achieved 14
By measuring the change in employee turnover or
reduction in accidents
1
The respondents were asked about the manner in which the effectives of training
can be assessed. Among the respondents 53% have responded that feedback from
trainers, 23% have answered by improvement in the quality of work after the
training, 22% have answered that a test during training, 2% have answered that
employee turnover or reduction in accidents can be used as a tool for knowing
the effectiveness of training.
Periodical
tests during
training
22%
Feedback
from the
trainer
53%
Measuremen
t of change
in Quality or
result
achieved
23%
By
measuring
the change
in employee
turnover or
reduction in
accidents
2%
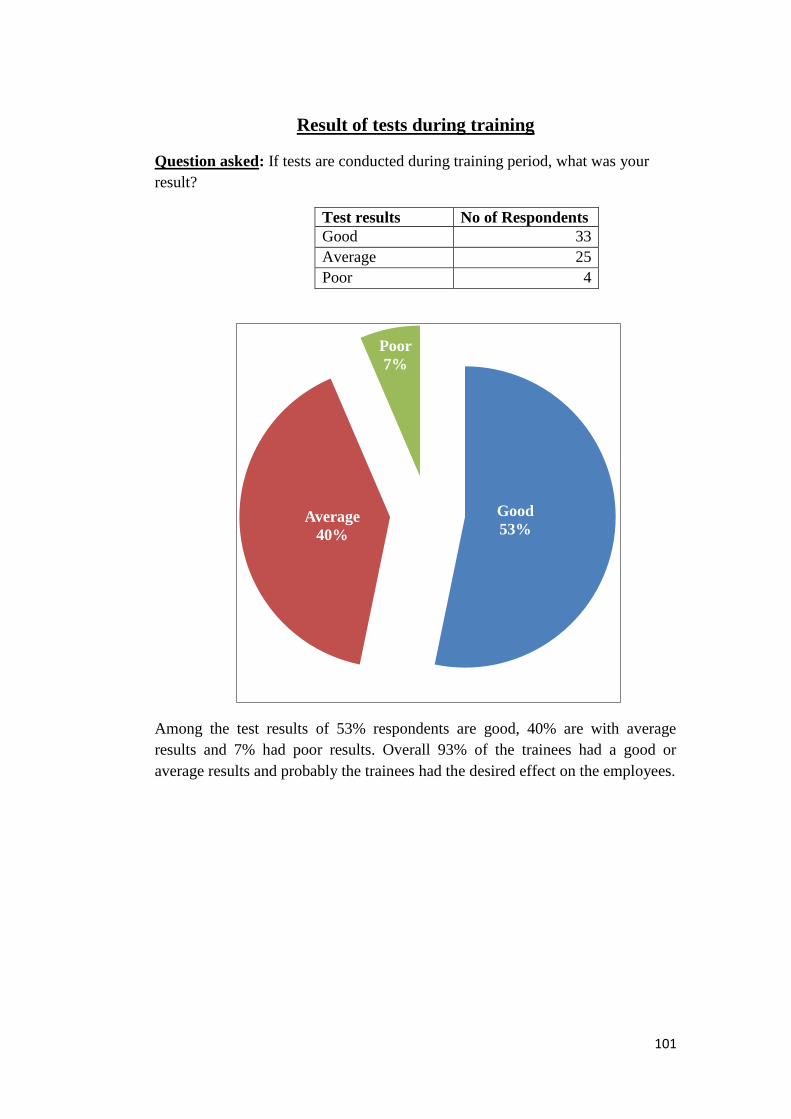
101
Result of tests during training
Question asked: If tests are conducted during training period, what was your
result?
Test results No of Respondents
Good 33
Average 25
Poor 4
Among the test results of 53% respondents are good, 40% are with average
results and 7% had poor results. Overall 93% of the trainees had a good or
average results and probably the trainees had the desired effect on the employees.
Good
53% Average
40%
Poor
7%

102
Incentive on successful training completion
Question asked: Is there any change in your job assignment after successful
completion of training?
Changes post Training No of Respondents
Promotion 13
More responsibility 27
They consider a request for transfer 2
Job rotation or change of department 19
After training 44% of the respondents got more responsibility, 31% got job
rotation or change of department, 22% got promotion and request for transfer of
3% was accepted. A total of 66% of the respondents were either promoted or
given more responsibility after successful training. This not only ensures interest
in training participation but also motivates more employees to attend the
trainings and take them seriously.
Promotion
22%
More
responsibili
ty
44%
They
consider a
request for
transfer
3%
Job
rotation or
change of
department
31%
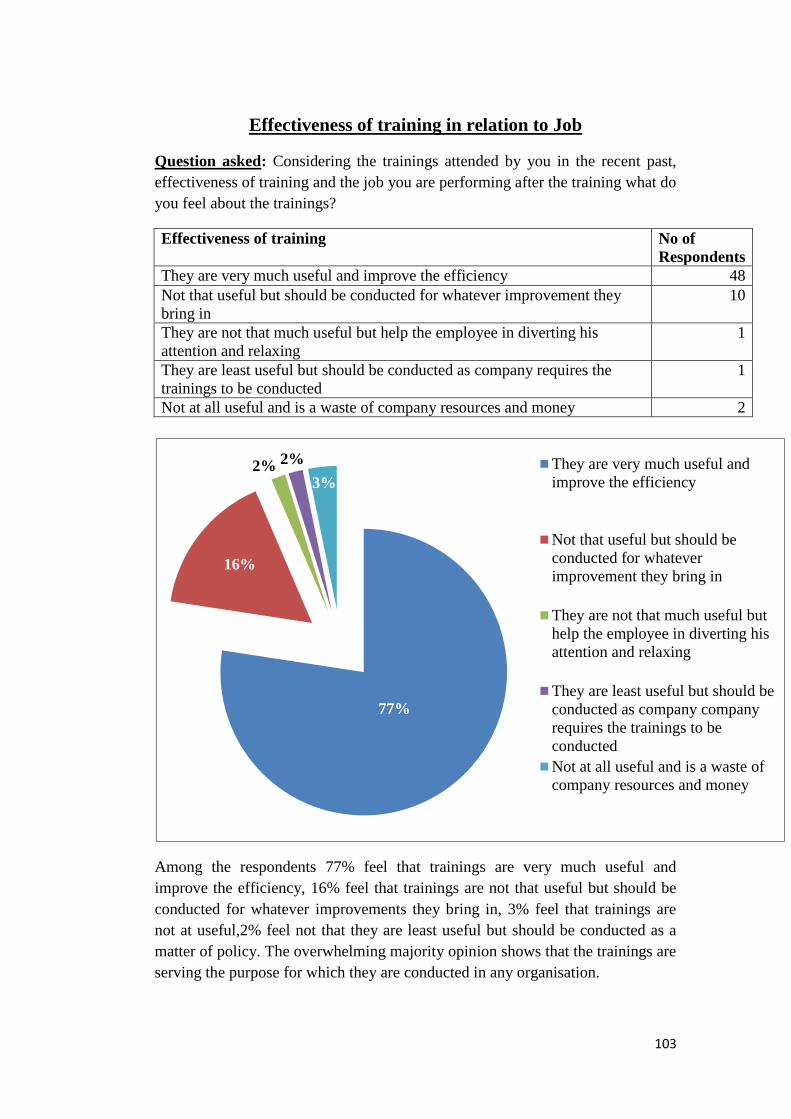
103
Effectiveness of training in relation to Job
Question asked: Considering the trainings attended by you in the recent past,
effectiveness of training and the job you are performing after the training what do
you feel about the trainings?
Effectiveness of training No of
Respondents
They are very much useful and improve the efficiency 48
Not that useful but should be conducted for whatever improvement they
bring in
10
They are not that much useful but help the employee in diverting his
attention and relaxing
1
They are least useful but should be conducted as company requires the
trainings to be conducted
1
Not at all useful and is a waste of company resources and money 2
Among the respondents 77% feel that trainings are very much useful and
improve the efficiency, 16% feel that trainings are not that useful but should be
conducted for whatever improvements they bring in, 3% feel that trainings are
not at useful,2% feel not that they are least useful but should be conducted as a
matter of policy. The overwhelming majority opinion shows that the trainings are
serving the purpose for which they are conducted in any organisation.
77%
16%
2% 2%
3%
They are very much useful and
improve the efficiency
Not that useful but should be
conducted for whatever
improvement they bring in
They are not that much useful but
help the employee in diverting his
attention and relaxing
They are least useful but should be
conducted as company company
requires the trainings to be
conducted
Not at all useful and is a waste of
company resources and money
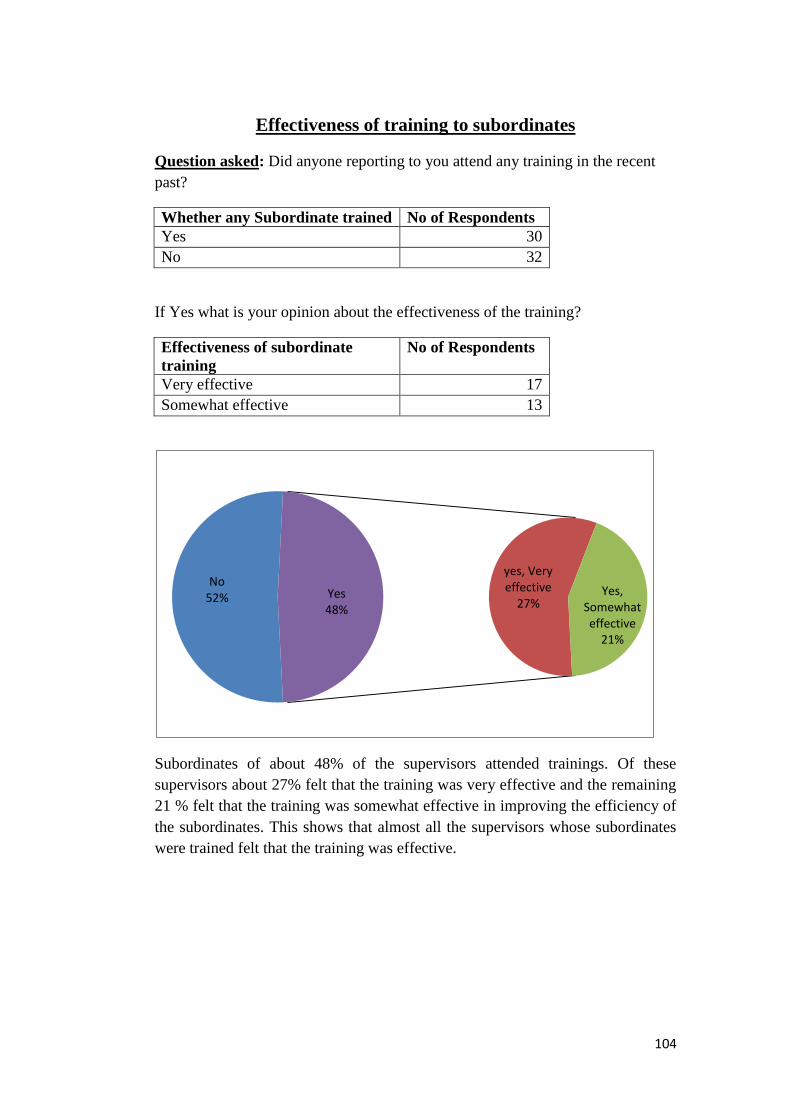
104
Effectiveness of training to subordinates
Question asked: Did anyone reporting to you attend any training in the recent
past?
Whether any Subordinate trained No of Respondents
Yes 30
No 32
If Yes what is your opinion about the effectiveness of the training?
Effectiveness of subordinate
training
No of Respondents
Very effective 17
Somewhat effective 13
Subordinates of about 48% of the supervisors attended trainings. Of these
supervisors about 27% felt that the training was very effective and the remaining
21 % felt that the training was somewhat effective in improving the efficiency of
the subordinates. This shows that almost all the supervisors whose subordinates
were trained felt that the training was effective.
No 52%
yes, Very effective
27% Yes,
Somewhat effective
21%
Yes 48%
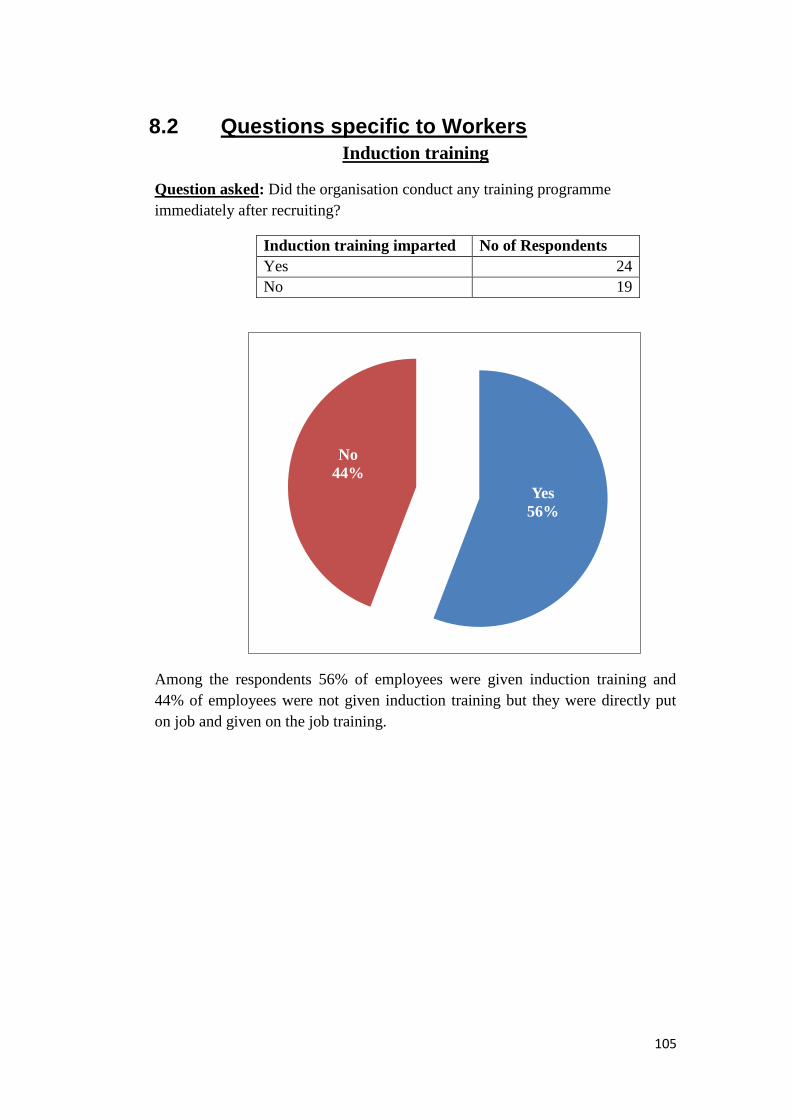
105
8.2 Questions specific to Workers
Induction training
Question asked: Did the organisation conduct any training programme
immediately after recruiting?
Induction training imparted No of Respondents
Yes 24
No 19
Among the respondents 56% of employees were given induction training and
44% of employees were not given induction training but they were directly put
on job and given on the job training.
Yes
56%
No
44%
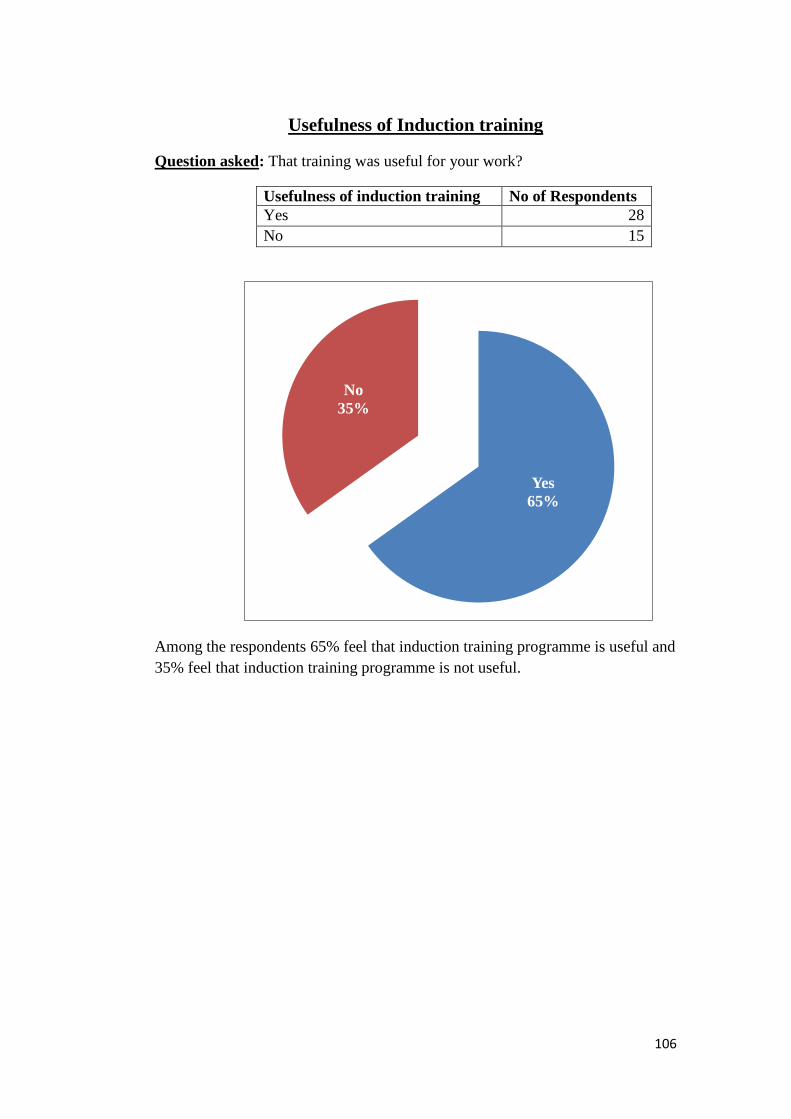
106
Usefulness of Induction training
Question asked: That training was useful for your work?
Usefulness of induction training No of Respondents
Yes 28
No 15
Among the respondents 65% feel that induction training programme is useful and
35% feel that induction training programme is not useful.
Yes
65%
No
35%

107
Training for improvement of skills on the job
Question asked: Do you think training is essential for improving your skills on
the job?
Training for improvement of skills No of Respondents
Very much essential 27
I can perform as well without training 13
To some extent 3
When the respondents were asked to respond about the utility of training in
improving the skills of the trainee 63% of them felt that the training is very much
essential in improving the skills of the trainees while about 7% felt that the the
trainings help to some extent. At the same time a significant 30% of the
employees felt that they can perform as well without the need for training.
Very much
essential
63%
I can
perform as
well without
training
30%
To some
extent
7%

108
Preferred Duration of training
Question asked: Do you prefer short term training programme or long term
training programme?
Duration of training preferred No of Respondents
Short term (2 to 3 days) 10
1 to 2 weeks 25
Long term (more than 2 weeks) 8
Among the respondents 58% preferred 1-2 weeks training, 23% preferred 2-3
days training, 19% preferred more 2 weeks training. The preference seems to be
for short term training.
Short
term (2 to
3 days)
23%
1 to 2
weeks
58%
Long term
(more
than 2
weeks)
19%

109
Training method preferred
Question asked: Do you prefer on the job training programmes or training
conducted away from your work area?
Type of training preferred No of Respondents
On the job training 26
Away from work 3
Combination of both 14
Among the respondents 50% preferred on the job training programme, 33%
preferred combination of both and 7% preferred away from work. It looks as
though the trainings are conducted in true spirit with the trainees involved in
training and the preference seem to be for learning on the job so that they tackle
real time problems in an effective and efficient manner.
On the job
training
60%
Away from
work
7%
Combinatio
n of both
33%

110
Trainings attended
Question asked: How many training programmes did you attend during the last
one year?
No fo trainings attended No of Respondents
0-2 29
02 to 04 14
Among the respondents 67% had less than 2 training programmes during the last
year and 33% attended between 2-4 training programmes.
0-2
67%
02 to 04
33%
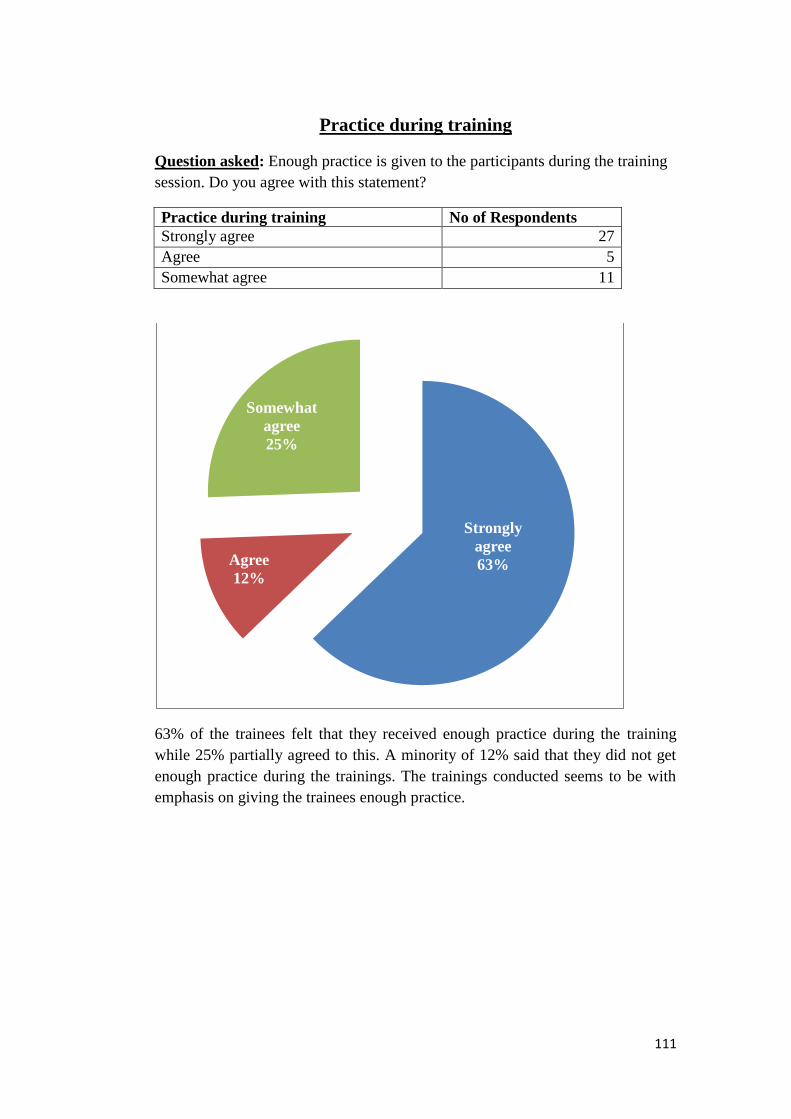
111
Practice during training
Question asked: Enough practice is given to the participants during the training
session. Do you agree with this statement?
Practice during training No of Respondents
Strongly agree 27
Agree 5
Somewhat agree 11
63% of the trainees felt that they received enough practice during the training
while 25% partially agreed to this. A minority of 12% said that they did not get
enough practice during the trainings. The trainings conducted seems to be with
emphasis on giving the trainees enough practice.
Strongly
agree
63% Agree
12%
Somewhat
agree
25%
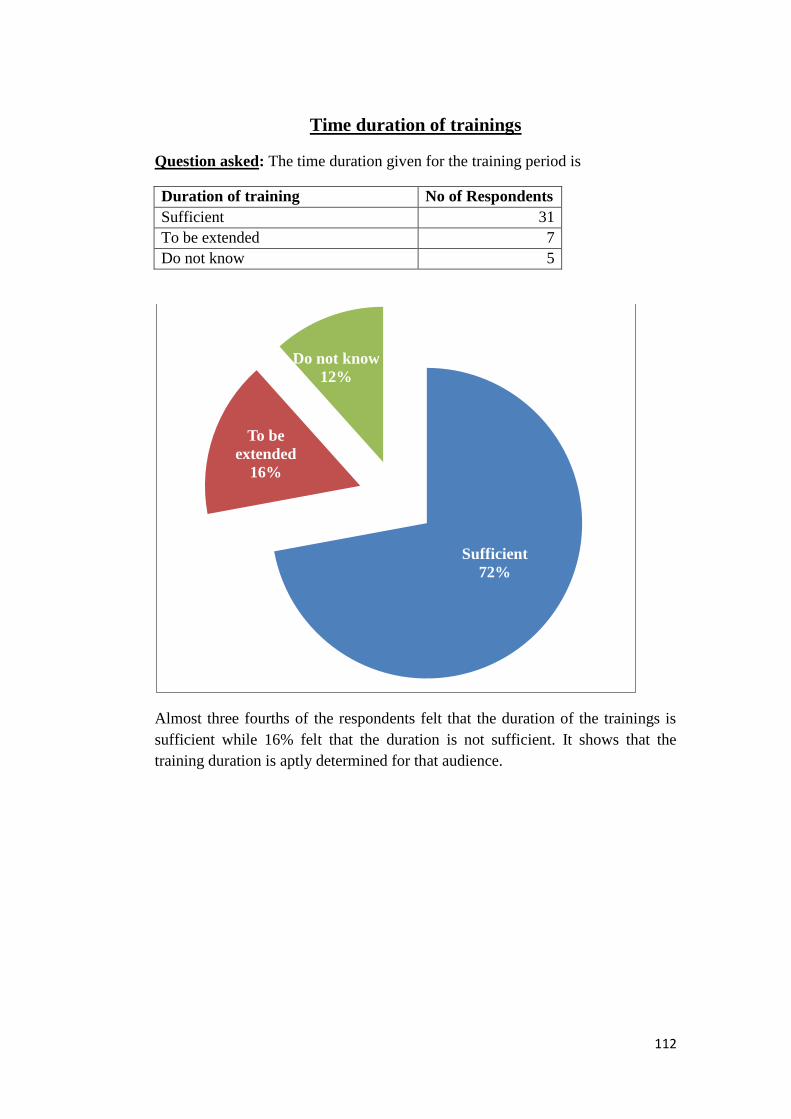
112
Time duration of trainings
Question asked: The time duration given for the training period is
Duration of training No of Respondents
Sufficient 31
To be extended 7
Do not know 5
Almost three fourths of the respondents felt that the duration of the trainings is
sufficient while 16% felt that the duration is not sufficient. It shows that the
training duration is aptly determined for that audience.
Sufficient
72%
To be
extended
16%
Do not know
12%
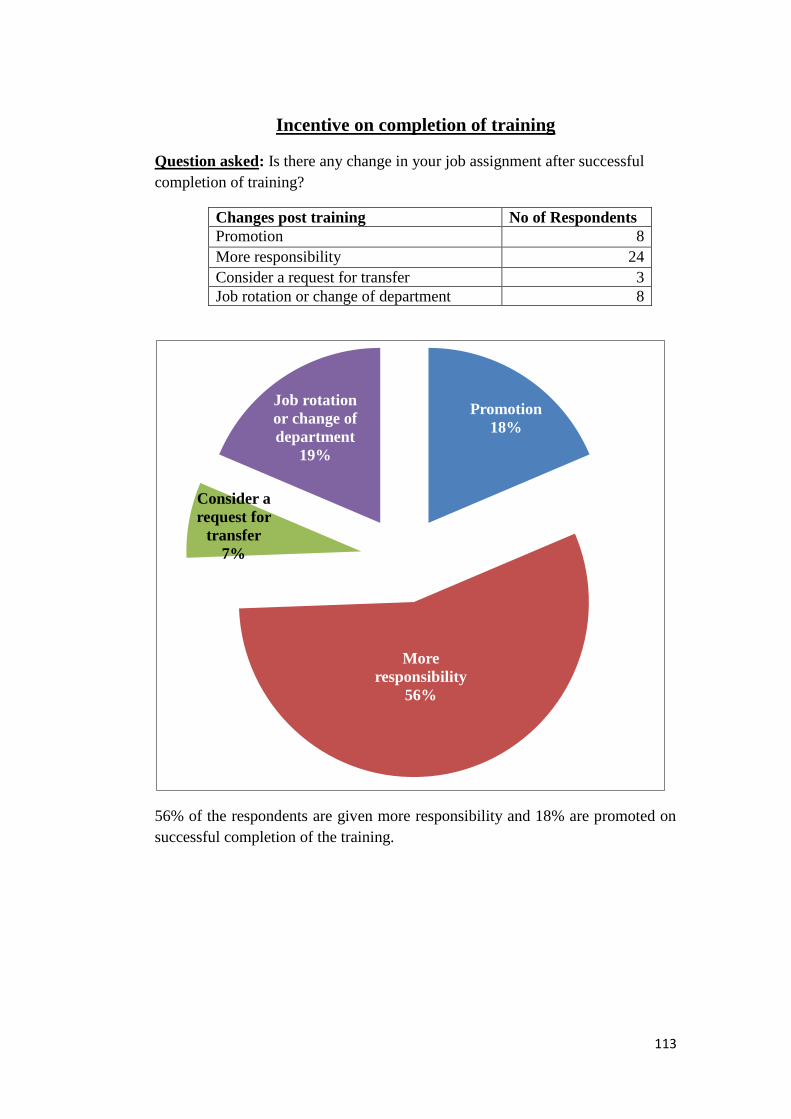
113
Incentive on completion of training
Question asked: Is there any change in your job assignment after successful
completion of training?
Changes post training No of Respondents
Promotion 8
More responsibility 24
Consider a request for transfer 3
Job rotation or change of department 8
56% of the respondents are given more responsibility and 18% are promoted on
successful completion of the training.
Promotion
18%
More
responsibility
56%
Consider a
request for
transfer
7%
Job rotation
or change of
department
19%

114
Effectiveness of training
Question asked: Considering the trainings attended by you in the recent past,
effectiveness of training and the job you are performing after the training what do
you feel about the trainings
Effectiveness of training No of
Respondents
They are very much useful and improve the efficiency 32
Not that useful but should be conducted for whatever improvement they
bring in
7
They are not that much useful but help the employee in diverting his
attention and relaxing
3
They are least useful but should be conducted as company policy requires
the trainings to be conducted
1
Almost 75% of employees trained felt that the training are very much useful and
improve the efficiency. Of the remaining 25% only 2% felt that trainings are
least useful.
75%
16%
7%
2% They are very much useful and
improve the efficiency
Not that useful but should be
conducted for whatever
improvement they bring in
They are not that much useful but
help the employee in diverting his
attention and relaxing
They are least useful but should be
conducted as company policy
requires the trainings to be
conducted
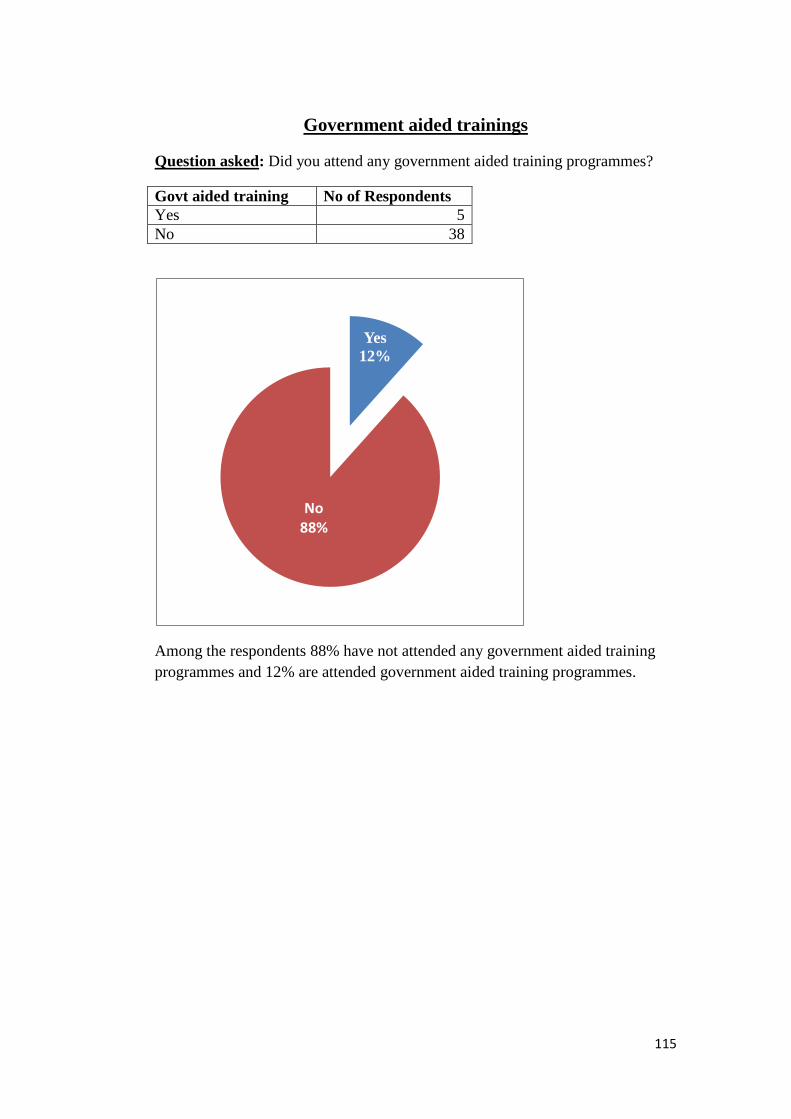
115
Government aided trainings
Question asked: Did you attend any government aided training programmes?
Govt aided training No of Respondents
Yes 5
No 38
Among the respondents 88% have not attended any government aided training
programmes and 12% are attended government aided training programmes.
Yes
12%
No 88%
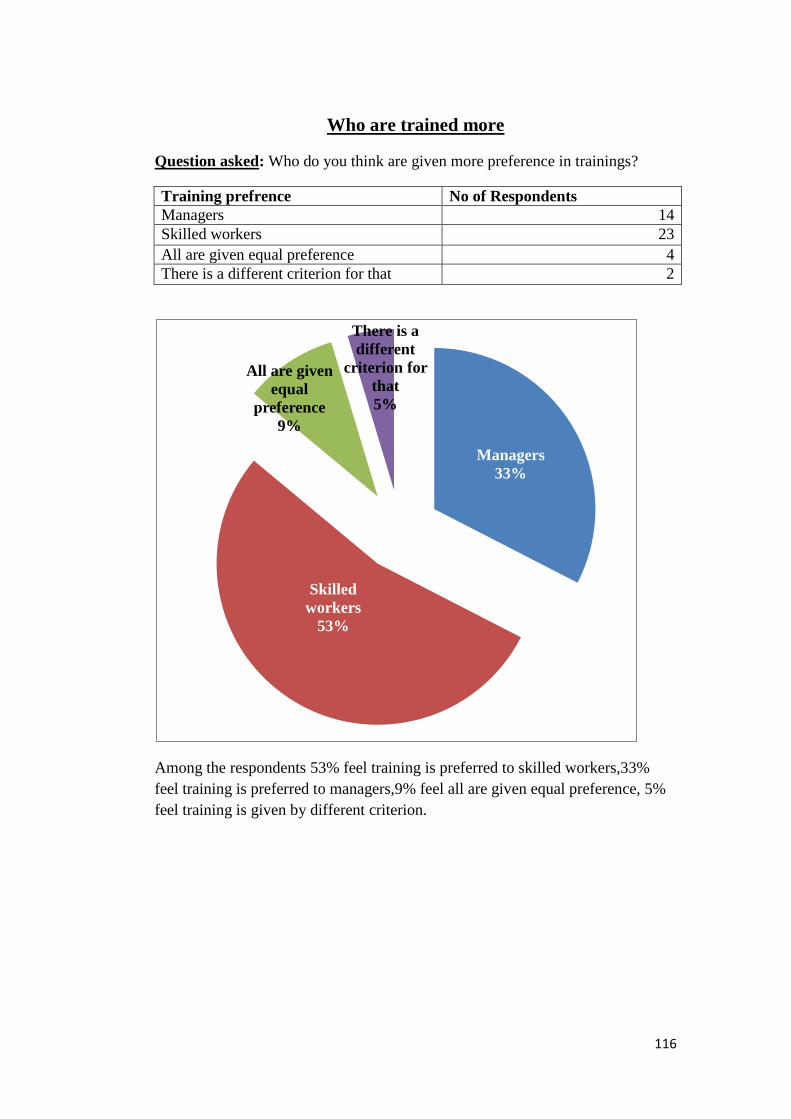
116
Who are trained more
Question asked: Who do you think are given more preference in trainings?
Training prefrence No of Respondents
Managers 14
Skilled workers 23
All are given equal preference 4
There is a different criterion for that 2
Among the respondents 53% feel training is preferred to skilled workers,33%
feel training is preferred to managers,9% feel all are given equal preference, 5%
feel training is given by different criterion.
Managers
33%
Skilled
workers
53%
All are given
equal
preference
9%
There is a
different
criterion for
that
5%

117
Feedback on trainings
Question asked: Is a feedback collected after training?
Feedback No of
Respondents
Yes and I gave feedback 17
Yes but I did not give feedback 6
No, they never ask for feedback 20
Among the respondents 46% indicated that they were not asked feedback, 40%
have given their feedback and 14% were asked feedback but they have not given
their opinion. It looks as though the system of asking feedback from participants
is not followed strictly as almost 60% missed out giving their feedback.
Yes and I
gave
feedback
40%
Yes but I did
not give
feedback
14%
No, they
never ask
for feedback
46%

118
8.3 Questions specific to HR Executives
Barriers to training
Question asked: What do you think are the important barriers to training and
development in your organisation
Barriers to training No of Respondents
Time 15
Lack of interest by the staff 1
Non availability of skilled trainers 4
Among the respondents 75% feel time is the important barriers to training, 20%
feel non availability of skilled trainers and 5% feel lack of interest by the staff.
Time
75%
Lack of
interest by
the staff
5%
Non
availability
of skilled
trainers
20%

119
Question asked: How is the trainee participation and interest ensured by the
organisation?
Trainee interest No of Respondents
By closely monitoring the participation 15
By giving certificates 4
Any other 1
75% of the HR team indicated that the interest among the trainees is kept alive by
monitoring the participants closely and 20% felt that the interest can be kept alive
by giving them certificates.
By closely
monitoring
the
participation
75%
By giving
certificates
20%
Any other
5%
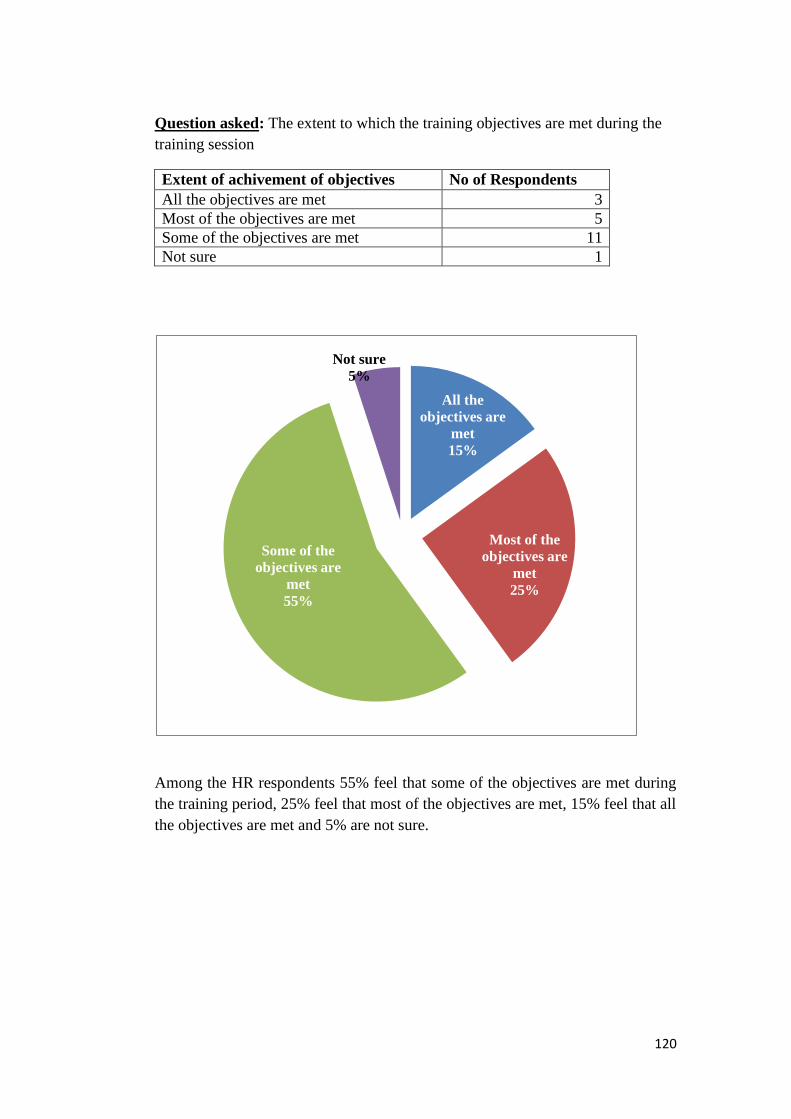
120
Question asked: The extent to which the training objectives are met during the
training session
Extent of achivement of objectives No of Respondents
All the objectives are met 3
Most of the objectives are met 5
Some of the objectives are met 11
Not sure 1
Among the HR respondents 55% feel that some of the objectives are met during
the training period, 25% feel that most of the objectives are met, 15% feel that all
the objectives are met and 5% are not sure.
All the
objectives are
met
15%
Most of the
objectives are
met
25%
Some of the
objectives are
met
55%
Not sure
5%

121
Question asked: If yes what type of training programme do you suggest?
Type of training No of Respondents
Short term training 13
Combination of both 7
65% of the HR executives who were interviewed felt that short term trainings
should be conducted and about 35% felt that the trainings should be a
combination of both long term and short term. They informed that short term
trainings keeps the participants interested and the trainings conducted give good
results.
Short term
training
65%
Combinatio
n of both
35%
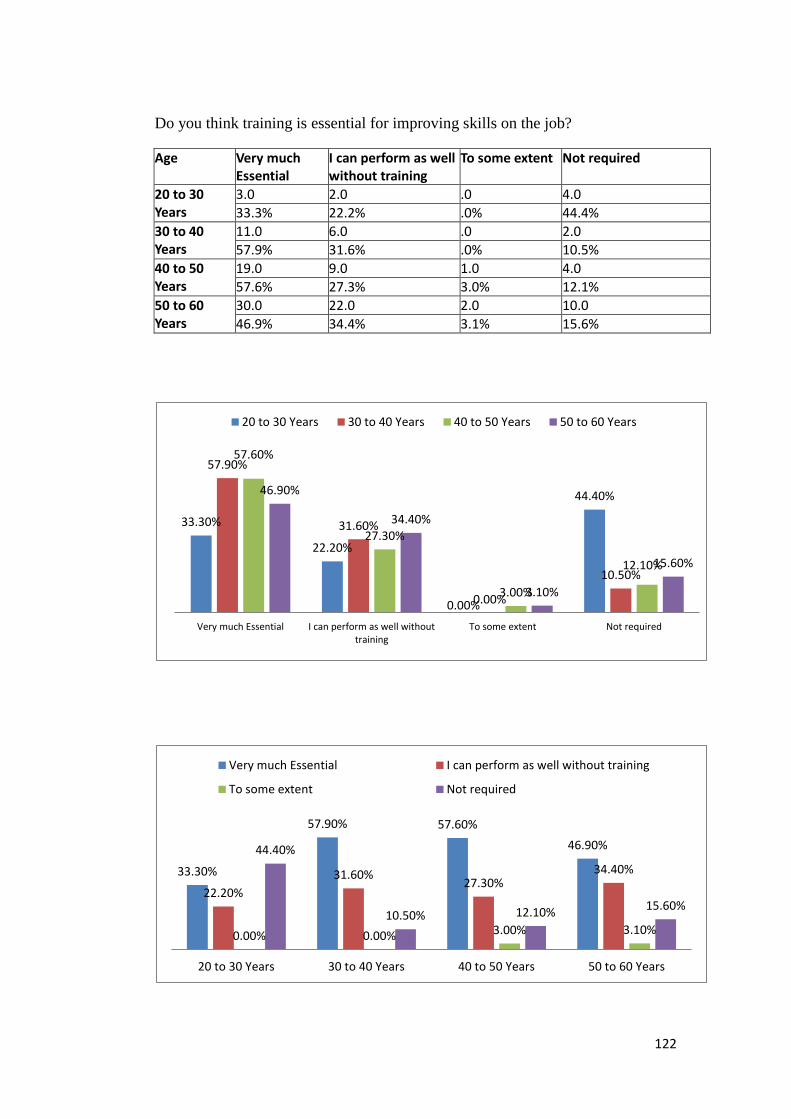
122
Do you think training is essential for improving skills on the job?
Age Very much Essential
I can perform as well without training
To some extent Not required
20 to 30 Years
3.0 2.0 .0 4.0
33.3% 22.2% .0% 44.4%
30 to 40 Years
11.0 6.0 .0 2.0
57.9% 31.6% .0% 10.5%
40 to 50 Years
19.0 9.0 1.0 4.0
57.6% 27.3% 3.0% 12.1%
50 to 60 Years
30.0 22.0 2.0 10.0
46.9% 34.4% 3.1% 15.6%
33.30%
22.20%
0.00%
44.40%
57.90%
31.60%
0.00%
10.50%
57.60%
27.30%
3.00%
12.10%
46.90%
34.40%
3.10%
15.60%
Very much Essential I can perform as well withouttraining
To some extent Not required
20 to 30 Years 30 to 40 Years 40 to 50 Years 50 to 60 Years
33.30%
57.90% 57.60%
46.90%
22.20%
31.60% 27.30%
34.40%
0.00% 0.00% 3.00% 3.10%
44.40%
10.50% 12.10% 15.60%
20 to 30 Years 30 to 40 Years 40 to 50 Years 50 to 60 Years
Very much Essential I can perform as well without training
To some extent Not required
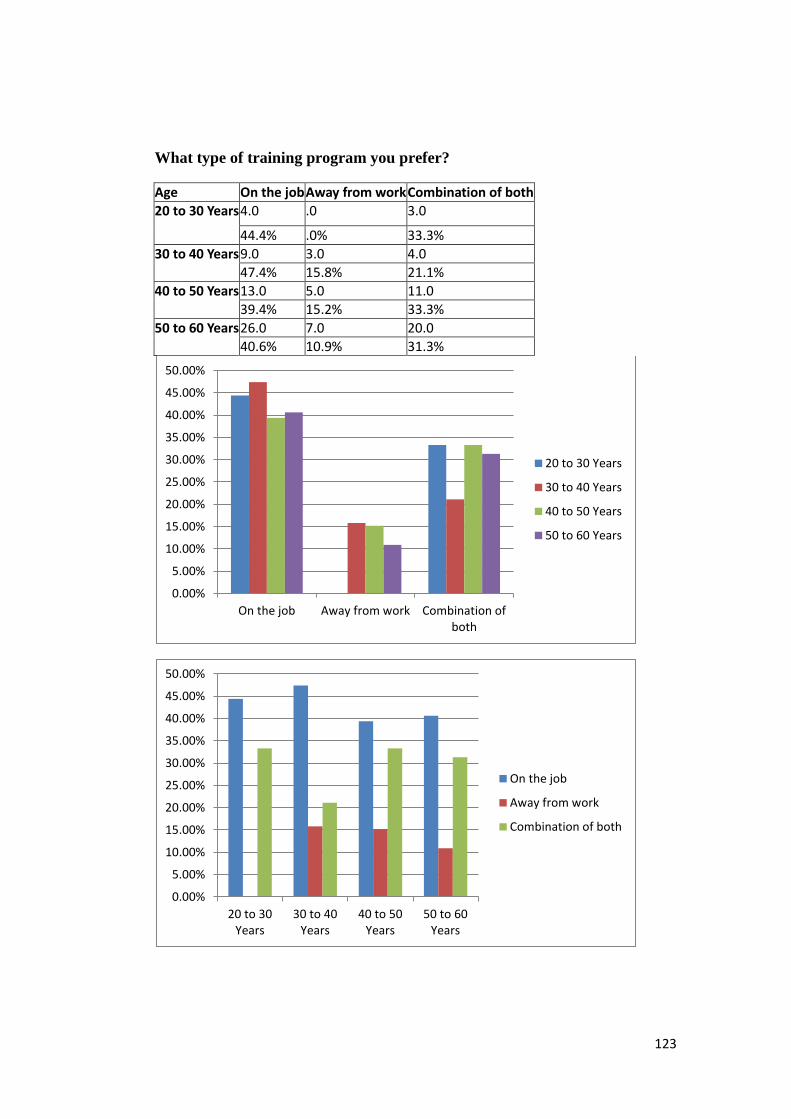
123
What type of training program you prefer?
Age On the job Away from work Combination of both
20 to 30 Years 4.0 .0 3.0
44.4% .0% 33.3%
30 to 40 Years 9.0 3.0 4.0
47.4% 15.8% 21.1%
40 to 50 Years 13.0 5.0 11.0
39.4% 15.2% 33.3%
50 to 60 Years 26.0 7.0 20.0
40.6% 10.9% 31.3%
0.00%
5.00%
10.00%
15.00%
20.00%
25.00%
30.00%
35.00%
40.00%
45.00%
50.00%
On the job Away from work Combination ofboth
20 to 30 Years
30 to 40 Years
40 to 50 Years
50 to 60 Years
0.00%
5.00%
10.00%
15.00%
20.00%
25.00%
30.00%
35.00%
40.00%
45.00%
50.00%
20 to 30Years
30 to 40Years
40 to 50Years
50 to 60Years
On the job
Away from work
Combination of both
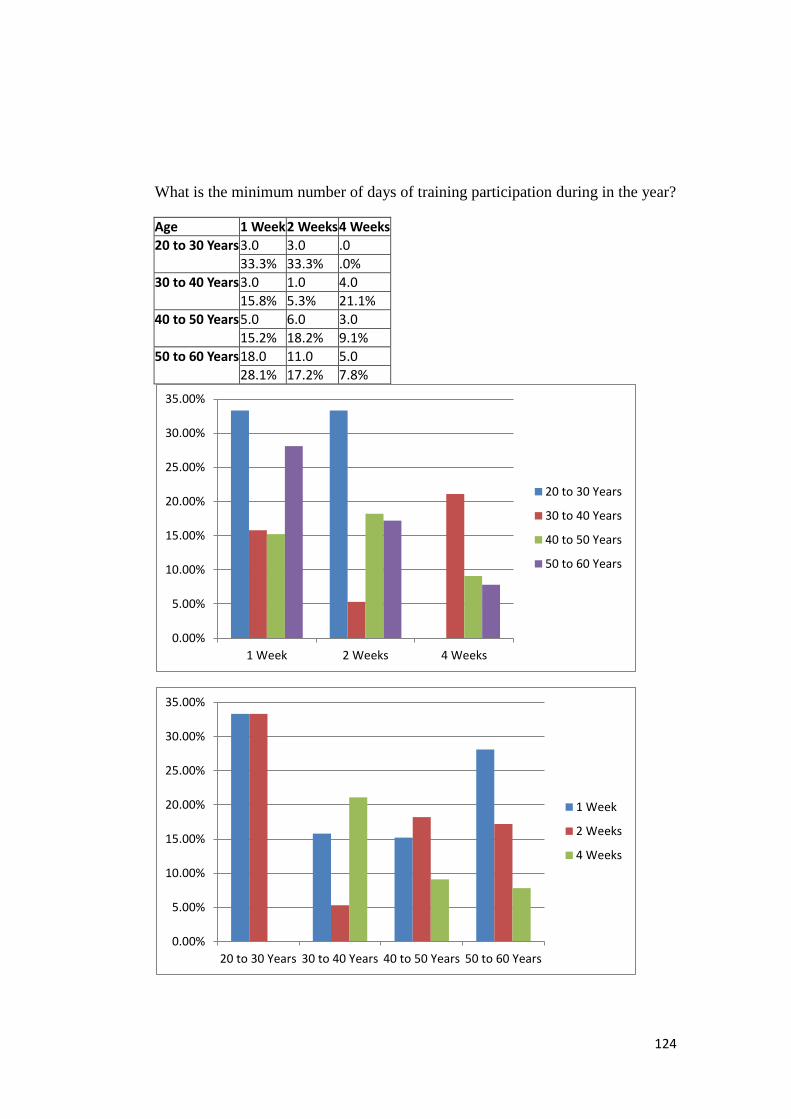
124
What is the minimum number of days of training participation during in the year?
Age 1 Week 2 Weeks 4 Weeks
20 to 30 Years 3.0 3.0 .0
33.3% 33.3% .0%
30 to 40 Years 3.0 1.0 4.0
15.8% 5.3% 21.1%
40 to 50 Years 5.0 6.0 3.0
15.2% 18.2% 9.1%
50 to 60 Years 18.0 11.0 5.0
28.1% 17.2% 7.8%
0.00%
5.00%
10.00%
15.00%
20.00%
25.00%
30.00%
35.00%
1 Week 2 Weeks 4 Weeks
20 to 30 Years
30 to 40 Years
40 to 50 Years
50 to 60 Years
0.00%
5.00%
10.00%
15.00%
20.00%
25.00%
30.00%
35.00%
20 to 30 Years 30 to 40 Years 40 to 50 Years 50 to 60 Years
1 Week
2 Weeks
4 Weeks
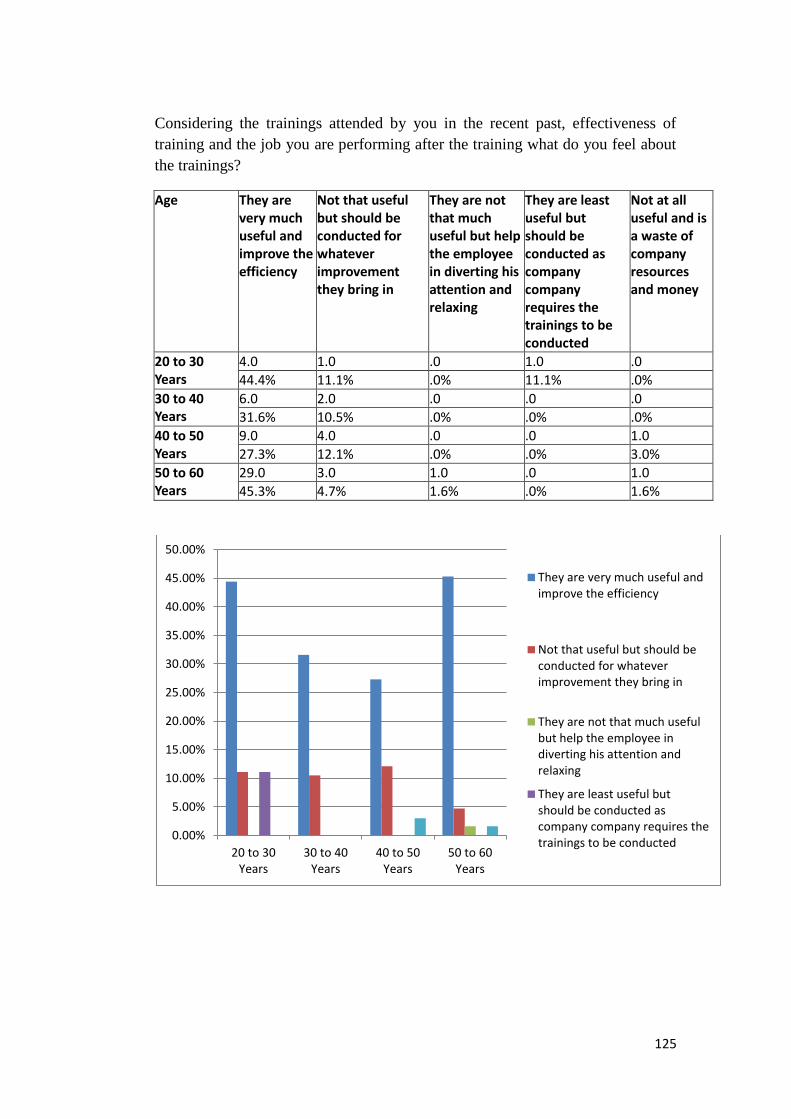
125
Considering the trainings attended by you in the recent past, effectiveness of
training and the job you are performing after the training what do you feel about
the trainings?
Age They are very much useful and improve the efficiency
Not that useful but should be conducted for whatever improvement they bring in
They are not that much useful but help the employee in diverting his attention and relaxing
They are least useful but should be conducted as company company requires the trainings to be conducted
Not at all useful and is a waste of company resources and money
20 to 30 Years
4.0 1.0 .0 1.0 .0
44.4% 11.1% .0% 11.1% .0%
30 to 40 Years
6.0 2.0 .0 .0 .0
31.6% 10.5% .0% .0% .0%
40 to 50 Years
9.0 4.0 .0 .0 1.0
27.3% 12.1% .0% .0% 3.0%
50 to 60 Years
29.0 3.0 1.0 .0 1.0
45.3% 4.7% 1.6% .0% 1.6%
0.00%
5.00%
10.00%
15.00%
20.00%
25.00%
30.00%
35.00%
40.00%
45.00%
50.00%
20 to 30Years
30 to 40Years
40 to 50Years
50 to 60Years
They are very much useful andimprove the efficiency
Not that useful but should beconducted for whateverimprovement they bring in
They are not that much usefulbut help the employee indiverting his attention andrelaxing
They are least useful butshould be conducted ascompany company requires thetrainings to be conducted

126
Do you prefer short term training programme or long term training programme?
Age Short term (2 to 3 days) 1 to 2 weeks Long term (more than 2 weeks)
20 to 30 Years .0 1.0 .0
.0% 11.1% .0%
30 to 40 Years 1.0 7.0 .0
5.3% 36.8% .0%
40 to 50 Years 6.0 7.0 2.0
18.2% 21.2% 6.1%
50 to 60 Years 3.0 10.0 6.0
4.7% 15.6% 9.4%
0.00%
5.00%
10.00%
15.00%
20.00%
25.00%
30.00%
35.00%
40.00%
Short term (2 to 3days)
1 to 2 weeks Long term (morethan 2 weeks)
20 to 30 Years
30 to 40 Years
40 to 50 Years
50 to 60 Years
0.00%
5.00%
10.00%
15.00%
20.00%
25.00%
30.00%
35.00%
40.00%
20 to 30Years
30 to 40Years
40 to 50Years
50 to 60Years
Short term (2 to 3 days)
1 to 2 weeks
Long term (more than 2weeks)
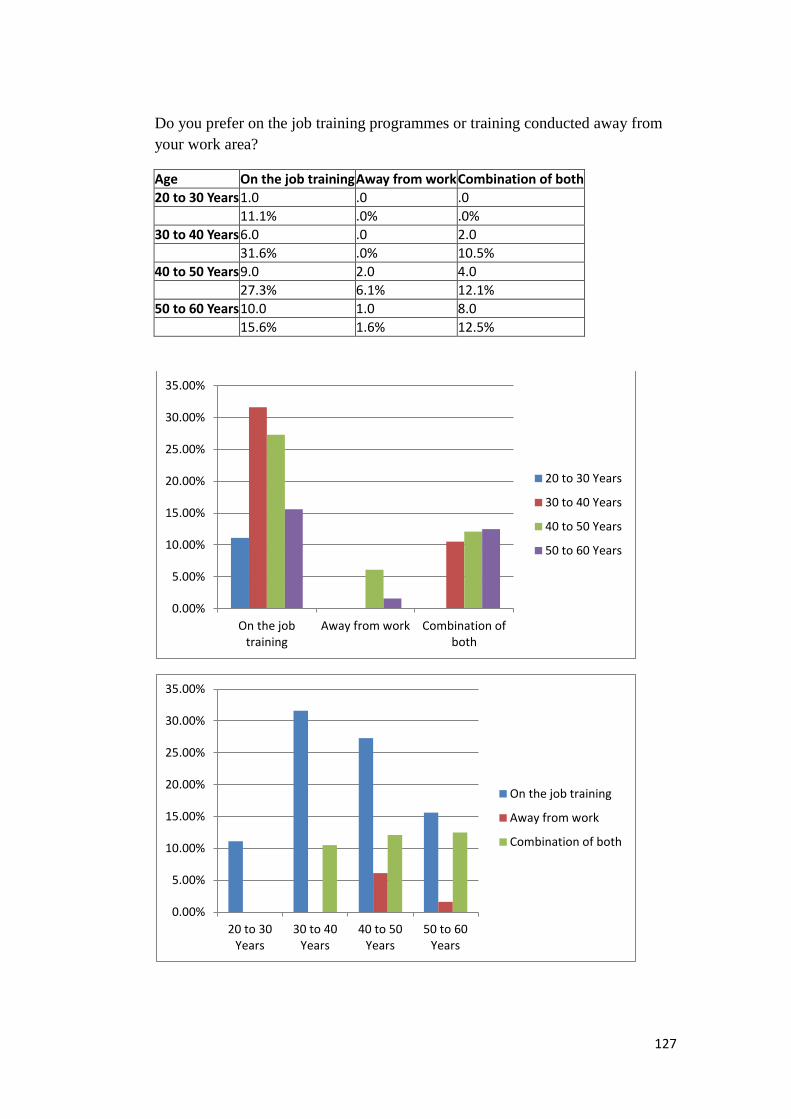
127
Do you prefer on the job training programmes or training conducted away from
your work area?
Age On the job training Away from work Combination of both
20 to 30 Years 1.0 .0 .0
11.1% .0% .0%
30 to 40 Years 6.0 .0 2.0
31.6% .0% 10.5%
40 to 50 Years 9.0 2.0 4.0
27.3% 6.1% 12.1%
50 to 60 Years 10.0 1.0 8.0
15.6% 1.6% 12.5%
0.00%
5.00%
10.00%
15.00%
20.00%
25.00%
30.00%
35.00%
On the jobtraining
Away from work Combination ofboth
20 to 30 Years
30 to 40 Years
40 to 50 Years
50 to 60 Years
0.00%
5.00%
10.00%
15.00%
20.00%
25.00%
30.00%
35.00%
20 to 30Years
30 to 40Years
40 to 50Years
50 to 60Years
On the job training
Away from work
Combination of both

128
Considering the trainings attended by you in the recent past, effectiveness of
training and the job you are performing after the training what do you feel about
the trainings
Age They are very much useful and improve the efficiency
Not that useful but should be conducted for whatever improvement they bring in
They are not that much useful but help the employee in diverting his attention and relaxing
They are least useful but should be conducted as company policy requires the trainings to be conducted
20 to 30 Years
1.0 .0 .0 .0
11.1% .0% .0% .0%
30 to 40 Years
4.0 4.0 .0 .0
21.1% 21.1% .0% .0%
40 to 50 Years
11.0 3.0 1.0 .0
33.3% 9.1% 3.0% .0%
50 to 60 Years
16.0 .0 2.0 1.0
25.0% .0% 3.1% 1.6%
0.00%
5.00%
10.00%
15.00%
20.00%
25.00%
30.00%
35.00%
20 to 30Years
30 to 40Years
40 to 50Years
50 to 60Years
They are very much useful andimprove the efficiency
Not that useful but should beconducted for whateverimprovement they bring in
They are not that much usefulbut help the employee indiverting his attention andrelaxing
They are least useful but shouldbe conducted as companypolicy requires the trainings tobe conducted
129
9 Conclusions, Suggestions
and Limitations
9.0 Conclusions & findings ............................................................... 130
9.1 Suggestions ................................................................................. 131
9.2 Limitations .................................................................................... 133

130
Chapter 9
Conclusions, Findings and Limitations
9.0 Conclusions & findings
1. Majority of the employees are quite satisfied with the training
programmes conducted in Sangam.
2. Mostly in-house training programmes are conducted than
institutional training programmes.
3. Employees participate in determining their training programmes
and orient them to their specific needs.
4. Training programmes are not linked with performance appraisal.
Promotion policy in sangam is mostly based on seniority.
5. Most of the employees are having more than 20-30 years of
experience. But in this period of their service, yearly they are only
2-4 training programmes some of them have not attended any
training programmes.
6. The training programmes held are mostly of short term training
programme and they are mostly on the job training programmes
and the employees also preferred on the job training programmes.
7. Most of the employees agreed that training programmes help in
achieving individual as well as organizational goals.
8. In sangam training needs are identified by the need and
suggestions of superiors and the HR people also said the same.
9. In Sangam most of the employees accepted that time duration
given for them is sufficient.
10. In Sangam nearly half of the employees have not been given
induction training programme, most of the employees have
suggested that induction training programmes are essential.
11. In Sangam more than half of the employees are given more
responsibility after training programmes, very few are getting
promotion or financial incentives. This may be the reason the
employees are not that interested in training programmes.
131
12. In Sangam, the management is not sending employees to
government aided training programmes. These training
programmes are very helpful for the employees but however no
one is sponsored in the recent past.
13. In Sangam HR people accepted that only some of the training
objectives are met at present but they are making effort to meet all
the objectives.
14. Training programmes held so far gave satisfactory results.
15. In Sangam preference is given to young employees who have
joined recently for training programmes.
9.1 Suggestions
1. It was observed that the trainings were not held as per plan and
the training programs should be held regularly as per the
requirement to get more advantage of the trainings.
2. The employees should be given more motivational training
programs and the trainings that are conducted should be
interesting because they are in the bore dome state.
3. The organization should conduct more of practical training
programmes so that each employee is given a chance to learn
practically and clear his or her doubts.
4. In Sangam as seen in the data analysis 51% of the employees are
in the age group 50 – 60 years and another 21% are in the age
group of 40 – 50 years. Also, about 57% of the total sample has
experience of more than 20 years. Keeping this fact in view the
necessity to conduct long term training programmes is less and
short term programmes will be enough to keep the employees in
touch with the latest and also this reduces the expenses.
5. Many of the employees felt that induction training helped them in
delivering better results. Hence induction training should be given
compulsorily to all the employees of the organization so that all the
employees can understand better the companies and

132
management‘s expectations from them and they can be better
prepared to deliver the expectations.
6. After the successful training completion most of the employees got
more responsibility while some of them were promoted. Giving the
employees incentives on successful completion of the training
should be thought of as a motivational scheme as this will increase
the interest of the employees in trainings. As the employees
acquire new knowledge, skills or aptitude and apply them on their
job, they should be significantly rewarded for their effort.
7. The HR executives should try to meet all the objectives of training
programmes when they conduct a training programme.
8. Some of the employees in the organization feel that they can
perform as well without training programme which shows that the
trainings could not meet their expectations or the trainings did not
add to their knowledge. So, an effort should be made to make a
careful planning of the training programmes and also to select
employees with uniform aptitude and knowledge levels so that the
trainings can be made interesting for all the participants.
9. The training programme should be designed in such a way that
fulfils organizational requirement and the individual needs.
10. The management and the HR department should compulsorily
take the opinion and suggestions of the workers and the
employees who participate in the trainings programmes through
written feedback or by interviewing them personally wherever
written feedback is not possible.
11. The organization must conduct feedback analysis of training
programme and take immediate action and incorporate the
suggestions so that the employees too feel their inclusion in
training programmes. This automatically promotes buy-in and
ownership of the employees for the trainings and increases
participation and interest.

133
12. Sangam mostly concentrating on training programmes for skilled
workers and managers. They should take care of the training
needs of other employees and those in support services as well.
13. The trainer has to adjust the training programme to the individual
abilities and aptitude. Individuals vary in intelligence and aptitude
from person to person.
9.2 Limitations
1. . The scope of the present study is very wide, which required much
time, so the researcher had to confine the study to the human
resource activities.
2. . The study period is very limited. The researcher had to collect the
information in a short period. Time is not sufficient to do a thorough
study.
3. . It is felt that some of the answers given by the employees to the
questionnaire are theoretical and the opinions expressed are
dependent on the employees, union rules and the management.
4. . The study is restricted to Sangam. Although there are some limitations
to the study this can be helpful for the understanding of the Human
Resource Policies and Practices of the dairy industry.
5. . All the employees are working from the time the organization started
operations and it is felt that due to this reason they developed a
great sense of loyalty to the organization. Due to this loyalty they
are not willing to give answer against their organization in which
they started their career and have built their social status and
development of their families depended on the organisation.
134
10 Appendix I – Research
questionnaire
10.0 Questionnaire on Training and Development for Managers ... 135
10.1 Questionnaire on Training and Development For workers ..... 139
10.2 .................................. 143
10.3 Questionnaire on Training and Development for HR executives
146
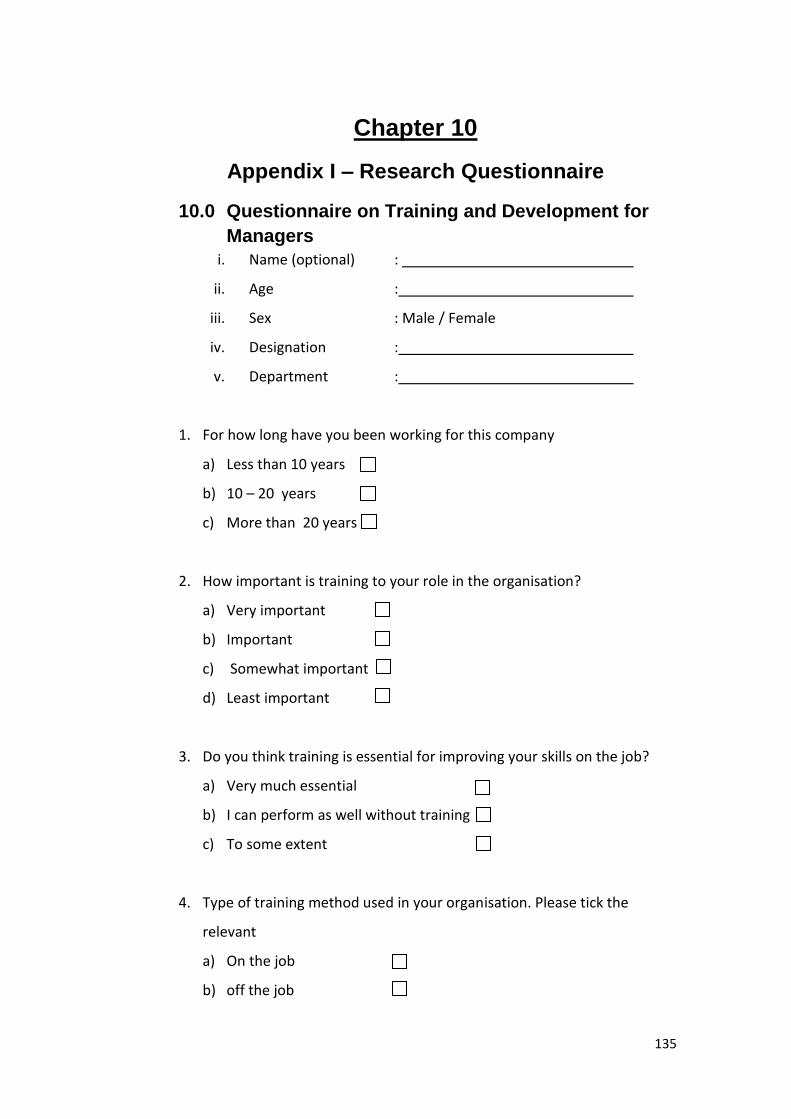
135
Chapter 10
Appendix I – Research Questionnaire
10.0 Questionnaire on Training and Development for
Managers
i. Name (optional) :
ii. Age :
iii. Sex : Male / Female
iv. Designation :
v. Department :
1. For how long have you been working for this company
a) Less than 10 years
b) 10 – 20 years
c) More than 20 years
2. How important is training to your role in the organisation?
a) Very important
b) Important
c) Somewhat important
d) Least important
3. Do you think training is essential for improving your skills on the job?
a) Very much essential
b) I can perform as well without training
c) To some extent
4. Type of training method used in your organisation. Please tick the
relevant
a) On the job
b) off the job

136
c) A combination of both
5. Do you prefer on the job training programmes or training conducted
away from your work area?
a) On the job training
b) Away from work
c) Combination of both
6. Is attending training compulsory and if yes how many do you attend in a
year?
a) Yes, we should attend at least one
b) Yes, we attend more than one
c) Yes, but we attend as per the need and suggestion by their
superiors
d) No, we need not attend any training programs and learn on the
job
7. What is the minimum number of days of participation is required per
year
a) One week
b) Two weeks
c) Four weeks
d) More than four weeks
8. Have you come across any problem during the training sessions
conducted in your organisation?
a) Interpersonal
b) Personal
c) External

137
9. Enough practice is given to the participants during the training session.
Do you agree with this statement?
a) Strongly agree
b) Agree
c) Somewhat agree
d) Disagree
10. How does the organisation assess the effectiveness of training
programmes
a) Periodical test during the training period
b) Feedback from the trainers
c) Measurement of change in quality or result achieved.
d) By measuring the reduction in employee turnover or the accidents.
11. If tests are conducted during training period or at the end of training to
evaluate the participant’s involvement and learning what was your
result?
12. Is there any change in your job assignment after successful completion
of training?
a) Promotion
b) More responsibility
c) They consider a request for transfer
d) Job rotation or change of department
e) Any other
13. Considering the trainings attended by you in the recent past,
effectiveness of training and the job you are performing after the
training what do you feel about the trainings
a) They are very much useful and improve the efficiency
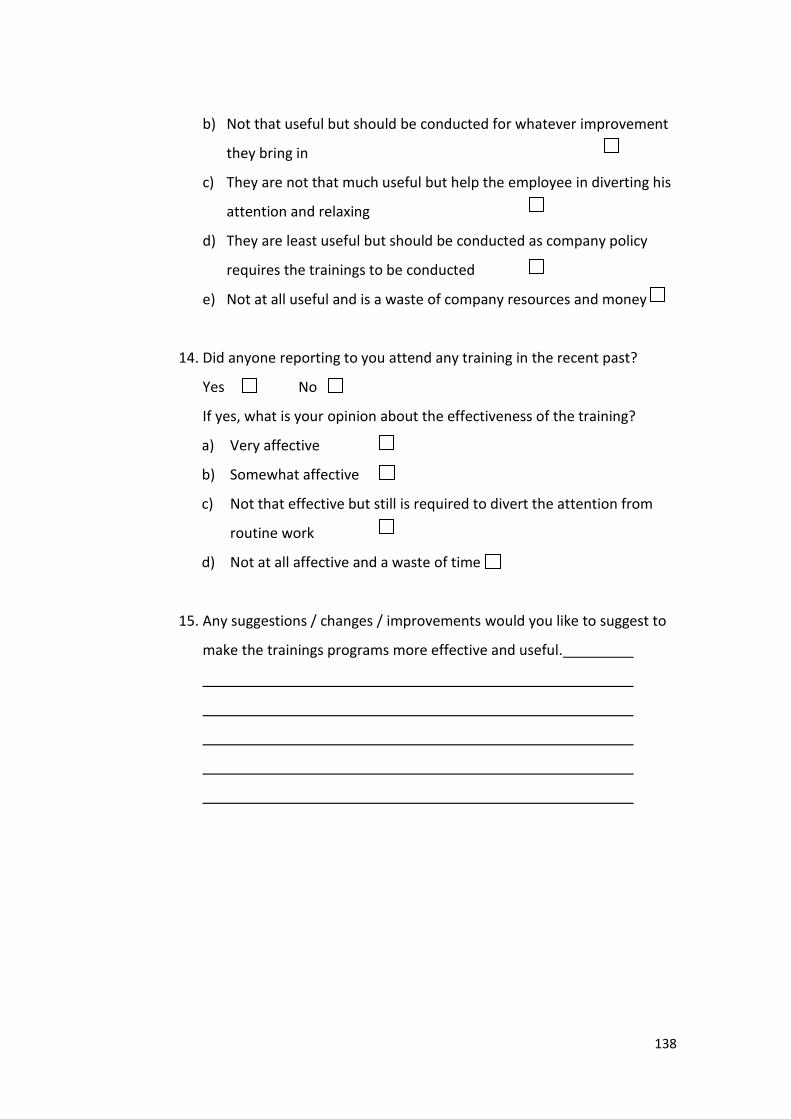
138
b) Not that useful but should be conducted for whatever improvement
they bring in
c) They are not that much useful but help the employee in diverting his
attention and relaxing
d) They are least useful but should be conducted as company policy
requires the trainings to be conducted
e) Not at all useful and is a waste of company resources and money
14. Did anyone reporting to you attend any training in the recent past?
Yes No
If yes, what is your opinion about the effectiveness of the training?
a) Very affective
b) Somewhat affective
c) Not that effective but still is required to divert the attention from
routine work
d) Not at all affective and a waste of time
15. Any suggestions / changes / improvements would you like to suggest to
make the trainings programs more effective and useful.

139
10.1 Questionnaire on Training and Development For
workers
i. Name (Optional):
ii. Age :
iii. Sex : Male / Female
iv. Designation :
v. Department :
1. For how long have you been working for this company
a) Less than 10 years
b) 10 – 20 years
c) More than 20 years
2. Did the organisation conduct any training programme immediately after
recruiting?
Yes No
If yes how many days?
3. That training was useful for your work? Yes No
4. Do you think training is essential for improving your skills on the job?
a) Very much essential
b) I can perform as well without training
c) To some extent
5. Do you prefer short term training programme or long term training
programme
a) Short term (2 to 3 days)
b) 1 to 2 weeks
c) Long term (more than 2 weeks)
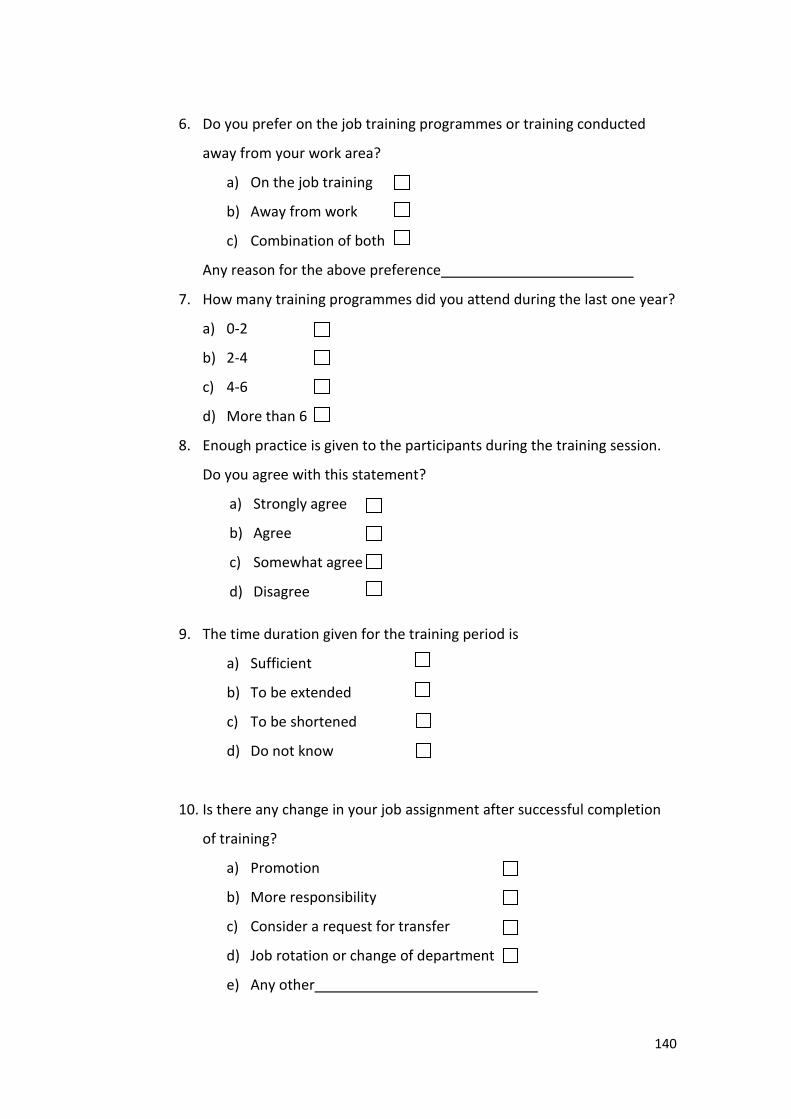
140
6. Do you prefer on the job training programmes or training conducted
away from your work area?
a) On the job training
b) Away from work
c) Combination of both
Any reason for the above preference
7. How many training programmes did you attend during the last one year?
a) 0-2
b) 2-4
c) 4-6
d) More than 6
8. Enough practice is given to the participants during the training session.
Do you agree with this statement?
a) Strongly agree
b) Agree
c) Somewhat agree
d) Disagree
9. The time duration given for the training period is
a) Sufficient
b) To be extended
c) To be shortened
d) Do not know
10. Is there any change in your job assignment after successful completion
of training?
a) Promotion
b) More responsibility
c) Consider a request for transfer
d) Job rotation or change of department
e) Any other
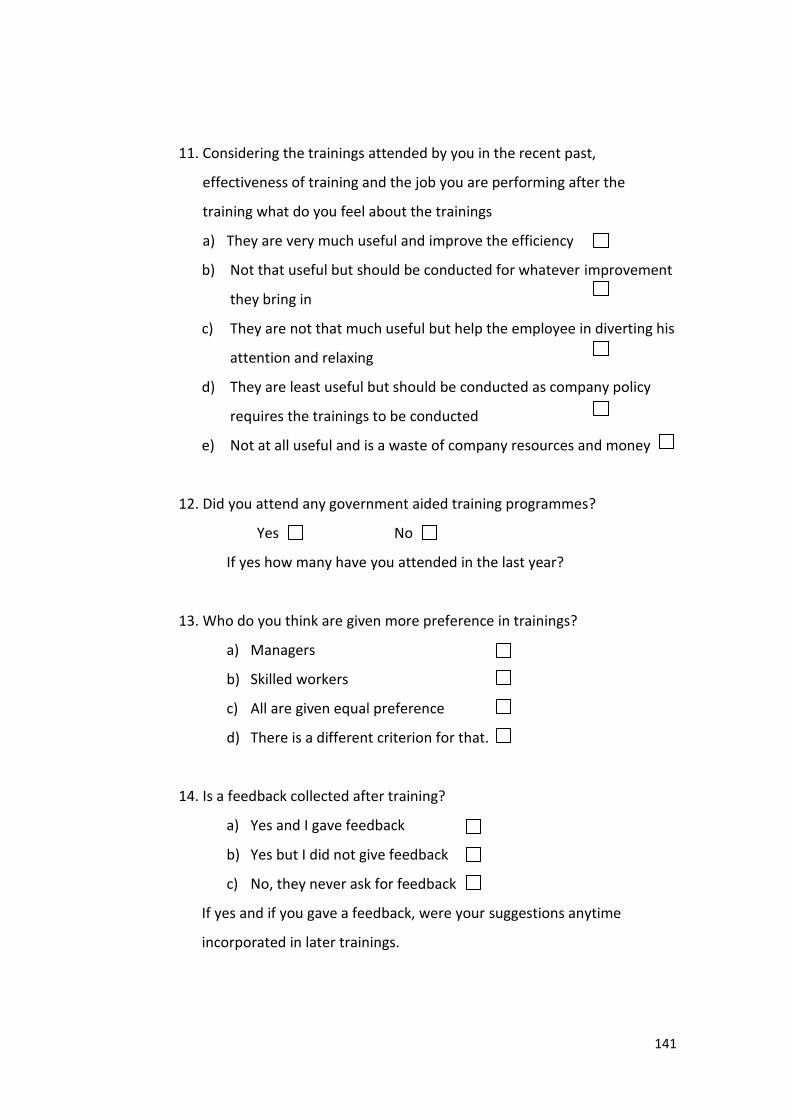
141
11. Considering the trainings attended by you in the recent past,
effectiveness of training and the job you are performing after the
training what do you feel about the trainings
a) They are very much useful and improve the efficiency
b) Not that useful but should be conducted for whatever improvement
they bring in
c) They are not that much useful but help the employee in diverting his
attention and relaxing
d) They are least useful but should be conducted as company policy
requires the trainings to be conducted
e) Not at all useful and is a waste of company resources and money
12. Did you attend any government aided training programmes?
Yes No
If yes how many have you attended in the last year?
13. Who do you think are given more preference in trainings?
a) Managers
b) Skilled workers
c) All are given equal preference
d) There is a different criterion for that.
14. Is a feedback collected after training?
a) Yes and I gave feedback
b) Yes but I did not give feedback
c) No, they never ask for feedback
If yes and if you gave a feedback, were your suggestions anytime
incorporated in later trainings.

142
15. Any suggestions / changes / improvements you would like to suggest in
order to make the trainings programs in your organisation more
effective and useful.
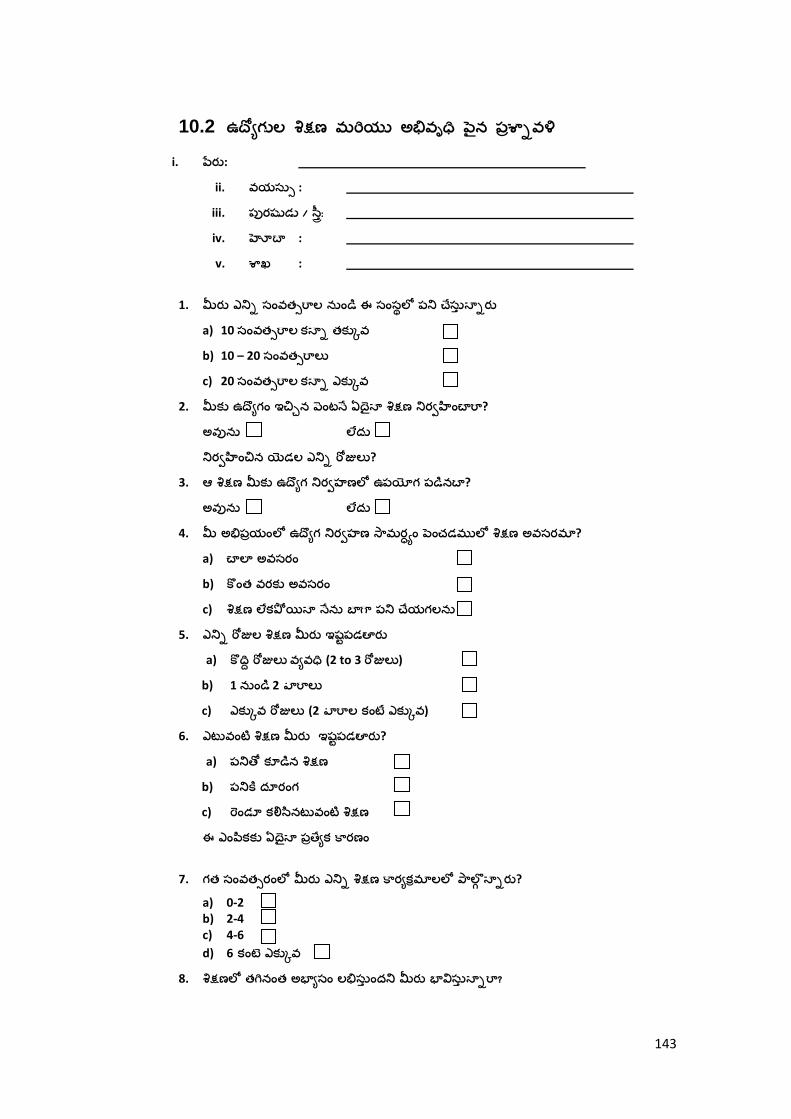
143
10.2
i. :
ii. :
iii.
iv. :
v. :
1.
a) 10
b) 10 – 20
c) 20
2. ?
? 3. ?
4. ?
a)
b)
c)
5.
a) (2 to 3 )
b) 1 2
c) (2 )
6. ?
a)
b)
c)
7. ?
a) 0-2 b) 2-4 c) 4-6
d) 6
8.
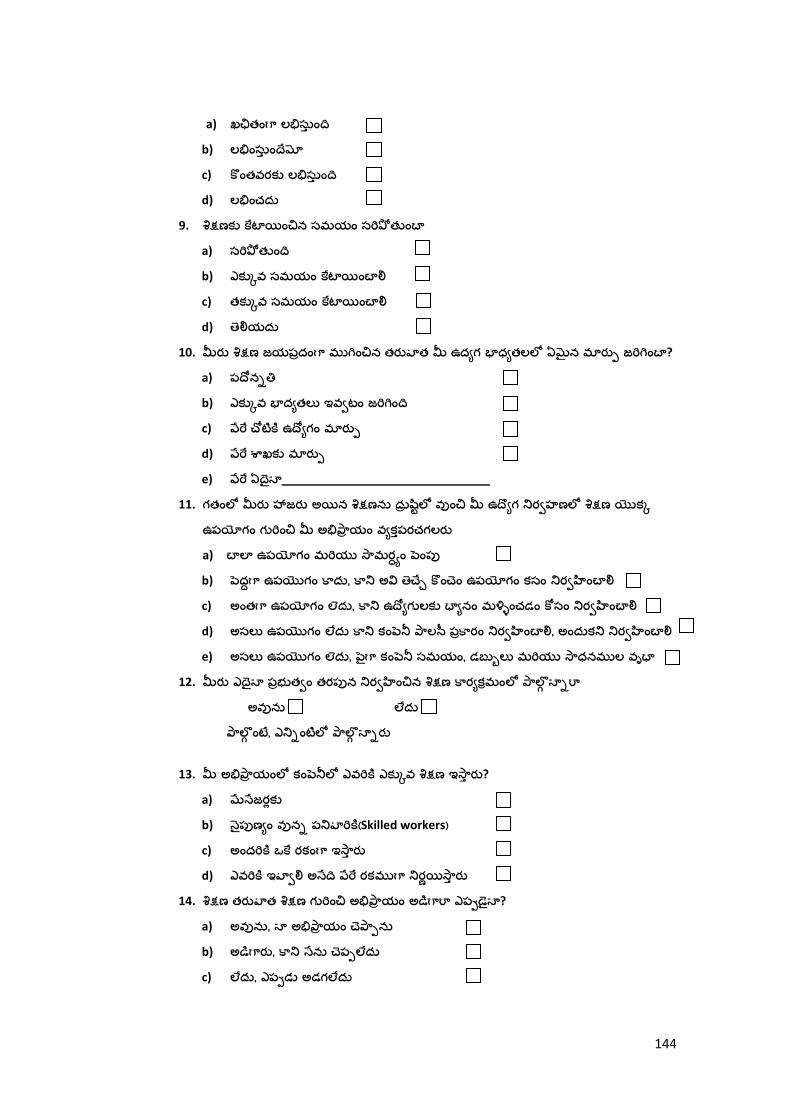
144
a)
b)
c)
d)
9.
a)
b)
c)
d)
10. ?
a)
b)
c)
d)
e)
11.
a)
b)
c)
d)
e)
12.
13. ?
a)
b) Skilled workers
c)
d)
14. ?
a)
b)
c)

145
.
15.

146
10.3 Questionnaire on Training and Development for
HR executives
Demographic data
i. Name :
ii. Age :
iii. Sex : Male / Female
iv. Designation :
1. For how long you have been working in this department?
a) Less than 10 years
b) 10-20 years
c) More than 20 years
2. Do you think training is essential for improving the skills of the
workers?
Yes No
If yes what type of training programme do you suggest?
a) Short term training
b) Long term training
c) Combination of both
3. How are training needs of the employees assessed
a) Feedback from employees
b) Requirement of sectional heads
c) Schedule already prepared
d) Any other
4. Which category of employees is given more training in your
organisation?
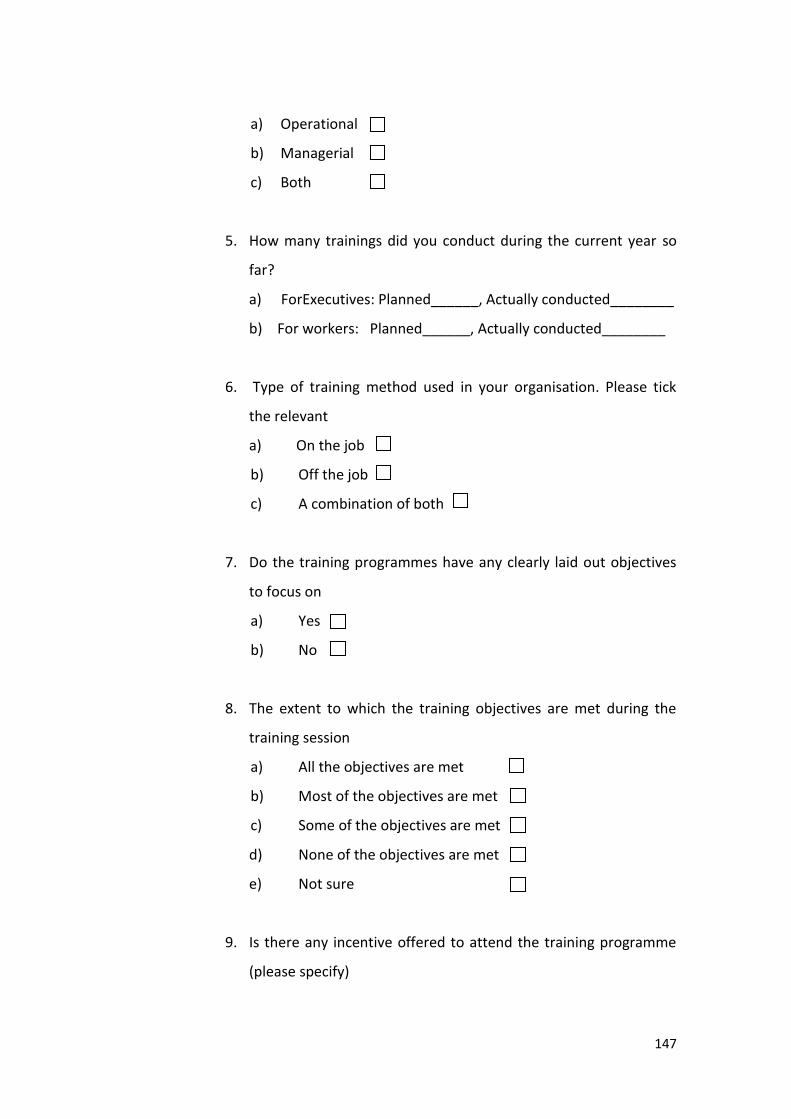
147
a) Operational
b) Managerial
c) Both
5. How many trainings did you conduct during the current year so
far?
a) ForExecutives: Planned______, Actually conducted________
b) For workers: Planned______, Actually conducted________
6. Type of training method used in your organisation. Please tick
the relevant
a) On the job
b) Off the job
c) A combination of both
7. Do the training programmes have any clearly laid out objectives
to focus on
a) Yes
b) No
8. The extent to which the training objectives are met during the
training session
a) All the objectives are met
b) Most of the objectives are met
c) Some of the objectives are met
d) None of the objectives are met
e) Not sure
9. Is there any incentive offered to attend the training programme
(please specify)
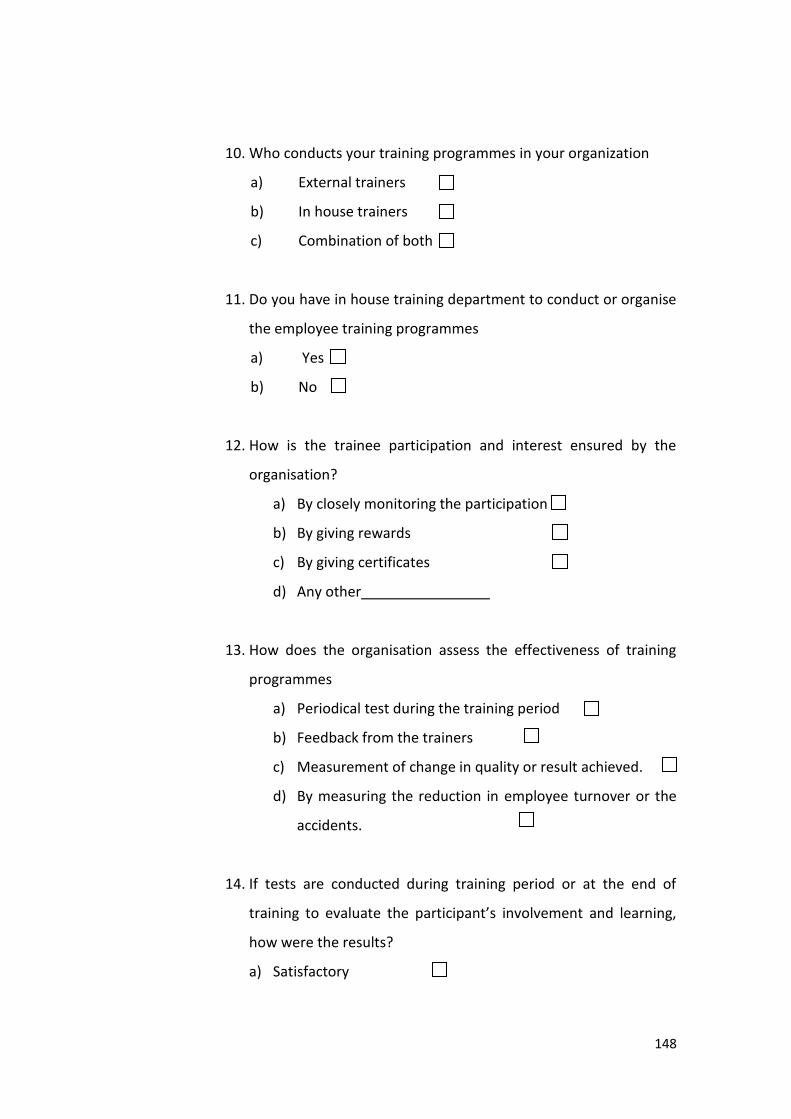
148
10. Who conducts your training programmes in your organization
a) External trainers
b) In house trainers
c) Combination of both
11. Do you have in house training department to conduct or organise
the employee training programmes
a) Yes
b) No
12. How is the trainee participation and interest ensured by the
organisation?
a) By closely monitoring the participation
b) By giving rewards
c) By giving certificates
d) Any other
13. How does the organisation assess the effectiveness of training
programmes
a) Periodical test during the training period
b) Feedback from the trainers
c) Measurement of change in quality or result achieved.
d) By measuring the reduction in employee turnover or the
accidents.
14. If tests are conducted during training period or at the end of
training to evaluate the participant’s involvement and learning,
how were the results?
a) Satisfactory

149
b) Somewhat satisfactory
c) Not satisfied
15. What do you think are the important barriers to training and
development in your organisation
a) Time
b) Money
c) Lack of interest by the staff
d) Non availability of skilled trainers
16. Have you come across any problem during the training session
conducted in your organisation?
a) Interpersonal
b) Personal
c) External
17. Any suggestions / changes / improvements you would like to
suggest in order to make the trainings programs in your
organisation more effective and useful.

150
11 Appendix II – SPSS Output
11.0 Responses of Executives ........................................................... 151
11.1 Responses of HR Executives..................................................... 182
11.2 Responses of workers ................................................................ 206
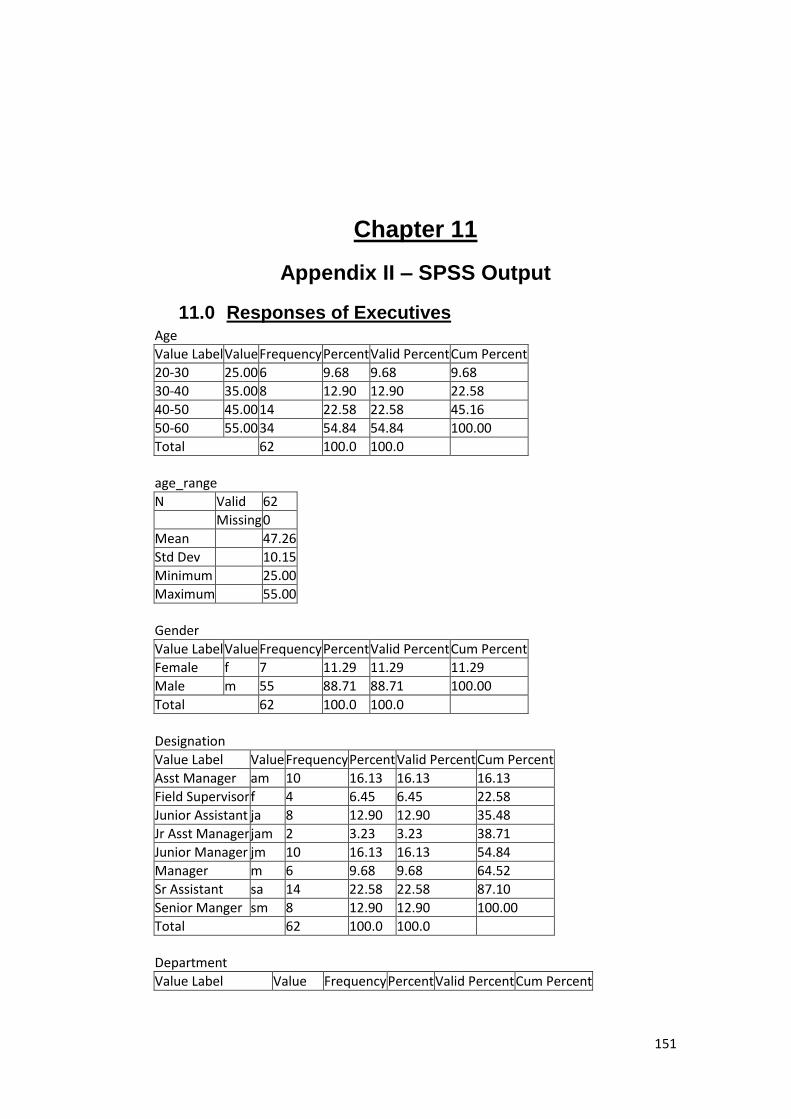
151
Chapter 11
Appendix II – SPSS Output
11.0 Responses of Executives Age
Value Label Value Frequency Percent Valid Percent Cum Percent
20-30 25.00 6 9.68 9.68 9.68
30-40 35.00 8 12.90 12.90 22.58
40-50 45.00 14 22.58 22.58 45.16
50-60 55.00 34 54.84 54.84 100.00
Total 62 100.0 100.0
age_range
N Valid 62
Missing 0
Mean 47.26
Std Dev 10.15
Minimum 25.00
Maximum 55.00
Gender
Value Label Value Frequency Percent Valid Percent Cum Percent
Female f 7 11.29 11.29 11.29
Male m 55 88.71 88.71 100.00
Total 62 100.0 100.0
Designation
Value Label Value Frequency Percent Valid Percent Cum Percent
Asst Manager am 10 16.13 16.13 16.13
Field Supervisor f 4 6.45 6.45 22.58
Junior Assistant ja 8 12.90 12.90 35.48
Jr Asst Manager jam 2 3.23 3.23 38.71
Junior Manager jm 10 16.13 16.13 54.84
Manager m 6 9.68 9.68 64.52
Sr Assistant sa 14 22.58 22.58 87.10
Senior Manger sm 8 12.90 12.90 100.00
Total 62 100.0 100.0
Department
Value Label Value Frequency Percent Valid Percent Cum Percent

152
Value Label Value Frequency Percent Valid Percent Cum Percent
> 20 yea 1 1.61 1.61 1.61
Engineering e 15 24.19 24.19 25.81
Finance & Accounts fa 7 11.29 11.29 37.10
Marketing m 8 12.90 12.90 50.00
P & I Wing pi 16 25.81 25.81 75.81
Plant & Production pp 15 24.19 24.19 100.00
Total 62 100.0 100.0
How long have you been working for this company?
Value Label Value Frequency Percent Valid Percent Cum Percent
< 10 years a 14 22.58 22.58 22.58
10 to 20 years b 13 20.97 20.97 43.55
> 20 years c 35 56.45 56.45 100.00
Total 62 100.0 100.0
How important is training to your role in the Organisation?
Value Label Value Frequency Percent Valid Percent Cum Percent
Very important a 26 41.94 41.94 41.94
Important b 25 40.32 40.32 82.26
Somewhat important c 8 12.90 12.90 95.16
Least important d 3 4.84 4.84 100.00
Total 62 100.0 100.0
Do you think training is essential for improving skills on the job?
Value Label Value Frequency Percent Valid Percent
Cum Percent
Very much Essential a 39 62.90 62.90 62.90
I can perform as well without training
b 3 4.84 4.84 67.74
To some extent c 20 32.26 32.26 100.00
Total 62 100.0 100.0
Type of training method used in your organisation?
Value Label Value Frequency Percent Valid Percent Cum Percent
On the job a 27 43.55 43.55 43.55
Off the job b 10 16.13 16.13 59.68
Combination of both c 25 40.32 40.32 100.00
Total 62 100.0 100.0
What type of training program you prefer?
Value Label Value Frequency Percent Valid Percent Cum Percent
On the job a 26 41.94 41.94 41.94
Away from work b 12 19.35 19.35 61.29
Combination of both c 24 38.71 38.71 100.00
Total 62 100.0 100.0
How many training programs do you ateend in a year?
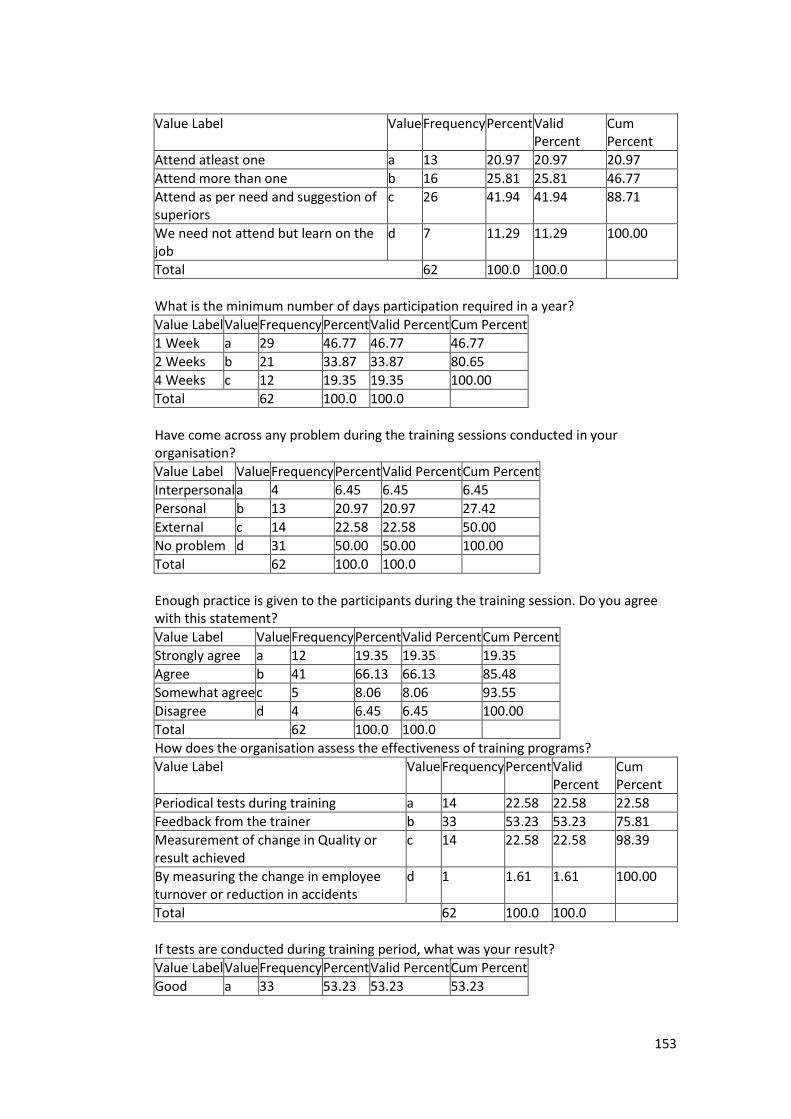
153
Value Label Value Frequency Percent Valid Percent
Cum Percent
Attend atleast one a 13 20.97 20.97 20.97
Attend more than one b 16 25.81 25.81 46.77
Attend as per need and suggestion of superiors
c 26 41.94 41.94 88.71
We need not attend but learn on the job
d 7 11.29 11.29 100.00
Total 62 100.0 100.0
What is the minimum number of days participation required in a year?
Value Label Value Frequency Percent Valid Percent Cum Percent
1 Week a 29 46.77 46.77 46.77
2 Weeks b 21 33.87 33.87 80.65
4 Weeks c 12 19.35 19.35 100.00
Total 62 100.0 100.0
Have come across any problem during the training sessions conducted in your organisation?
Value Label Value Frequency Percent Valid Percent Cum Percent
Interpersonal a 4 6.45 6.45 6.45
Personal b 13 20.97 20.97 27.42
External c 14 22.58 22.58 50.00
No problem d 31 50.00 50.00 100.00
Total 62 100.0 100.0
Enough practice is given to the participants during the training session. Do you agree with this statement?
Value Label Value Frequency Percent Valid Percent Cum Percent
Strongly agree a 12 19.35 19.35 19.35
Agree b 41 66.13 66.13 85.48
Somewhat agree c 5 8.06 8.06 93.55
Disagree d 4 6.45 6.45 100.00
Total 62 100.0 100.0
How does the organisation assess the effectiveness of training programs?
Value Label Value Frequency Percent Valid Percent
Cum Percent
Periodical tests during training a 14 22.58 22.58 22.58
Feedback from the trainer b 33 53.23 53.23 75.81
Measurement of change in Quality or result achieved
c 14 22.58 22.58 98.39
By measuring the change in employee turnover or reduction in accidents
d 1 1.61 1.61 100.00
Total 62 100.0 100.0
If tests are conducted during training period, what was your result?
Value Label Value Frequency Percent Valid Percent Cum Percent
Good a 33 53.23 53.23 53.23
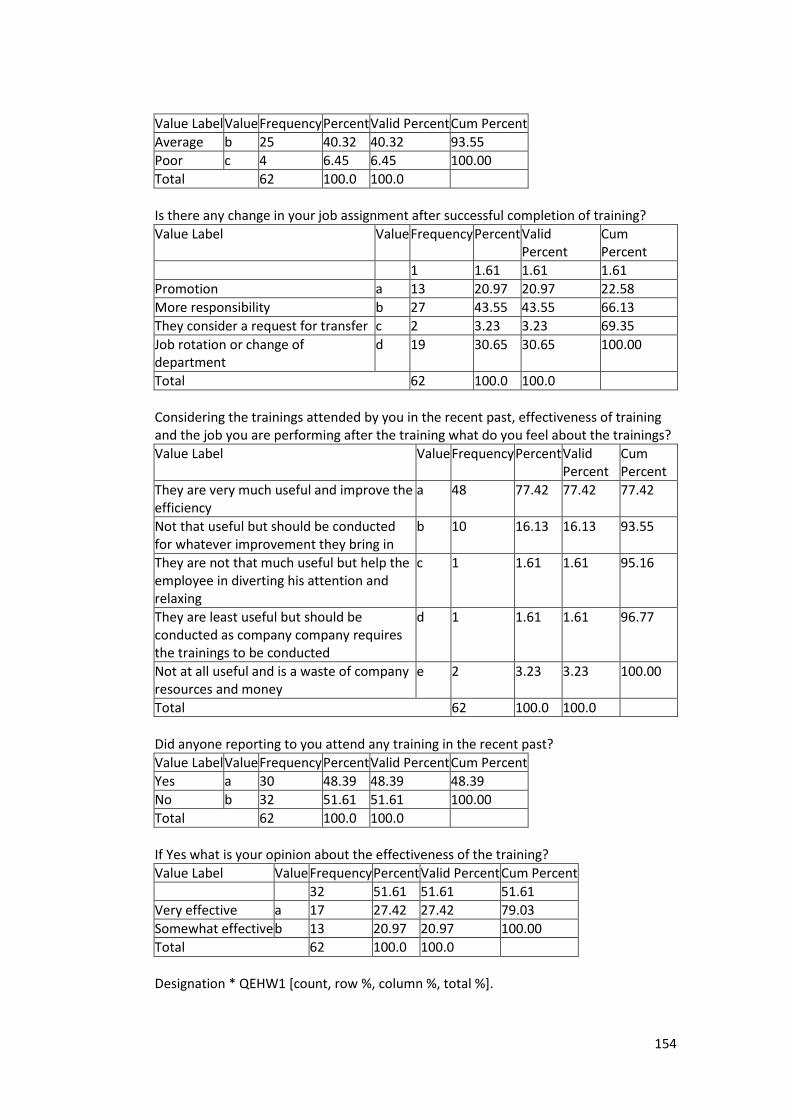
154
Value Label Value Frequency Percent Valid Percent Cum Percent
Average b 25 40.32 40.32 93.55
Poor c 4 6.45 6.45 100.00
Total 62 100.0 100.0
Is there any change in your job assignment after successful completion of training?
Value Label Value Frequency Percent Valid Percent
Cum Percent
1 1.61 1.61 1.61
Promotion a 13 20.97 20.97 22.58
More responsibility b 27 43.55 43.55 66.13
They consider a request for transfer c 2 3.23 3.23 69.35
Job rotation or change of department
d 19 30.65 30.65 100.00
Total 62 100.0 100.0
Considering the trainings attended by you in the recent past, effectiveness of training and the job you are performing after the training what do you feel about the trainings?
Value Label Value Frequency Percent Valid Percent
Cum Percent
They are very much useful and improve the efficiency
a 48 77.42 77.42 77.42
Not that useful but should be conducted for whatever improvement they bring in
b 10 16.13 16.13 93.55
They are not that much useful but help the employee in diverting his attention and relaxing
c 1 1.61 1.61 95.16
They are least useful but should be conducted as company company requires the trainings to be conducted
d 1 1.61 1.61 96.77
Not at all useful and is a waste of company resources and money
e 2 3.23 3.23 100.00
Total 62 100.0 100.0
Did anyone reporting to you attend any training in the recent past?
Value Label Value Frequency Percent Valid Percent Cum Percent
Yes a 30 48.39 48.39 48.39
No b 32 51.61 51.61 100.00
Total 62 100.0 100.0
If Yes what is your opinion about the effectiveness of the training?
Value Label Value Frequency Percent Valid Percent Cum Percent
32 51.61 51.61 51.61
Very effective a 17 27.42 27.42 79.03
Somewhat effective b 13 20.97 20.97 100.00
Total 62 100.0 100.0
Designation * QEHW1 [count, row %, column %, total %].
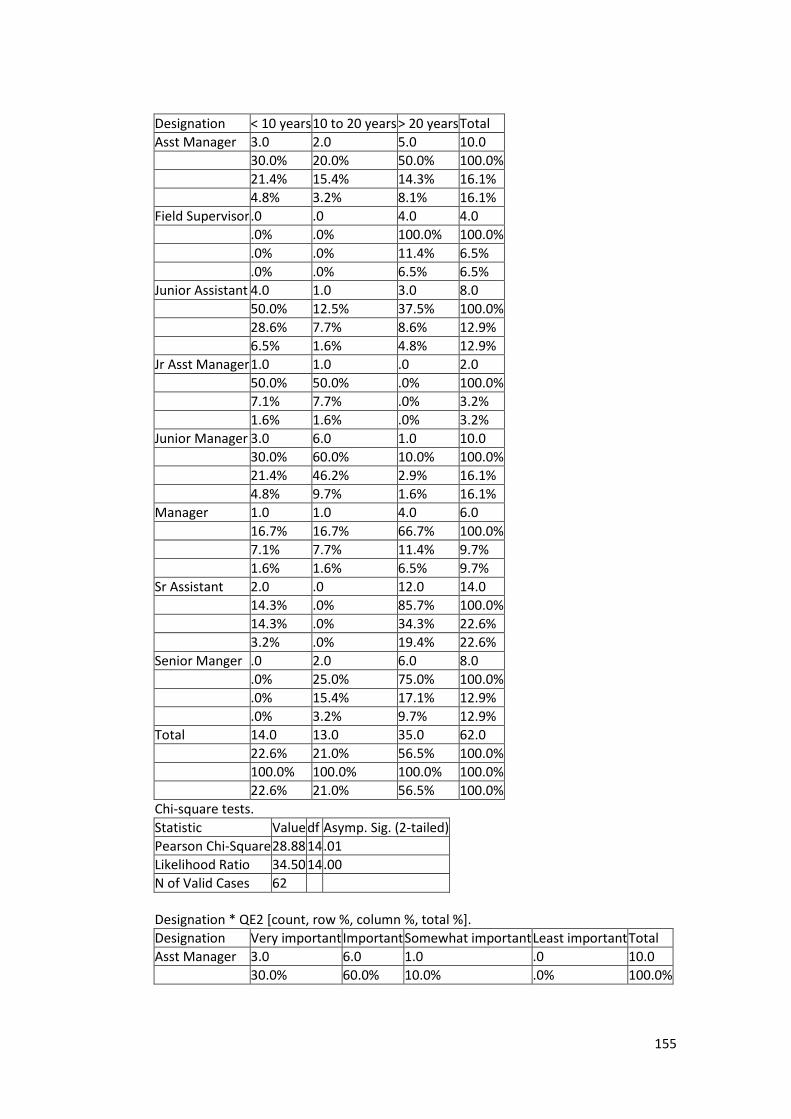
155
Designation < 10 years 10 to 20 years > 20 years Total
Asst Manager 3.0 2.0 5.0 10.0
30.0% 20.0% 50.0% 100.0%
21.4% 15.4% 14.3% 16.1%
4.8% 3.2% 8.1% 16.1%
Field Supervisor .0 .0 4.0 4.0
.0% .0% 100.0% 100.0%
.0% .0% 11.4% 6.5%
.0% .0% 6.5% 6.5%
Junior Assistant 4.0 1.0 3.0 8.0
50.0% 12.5% 37.5% 100.0%
28.6% 7.7% 8.6% 12.9%
6.5% 1.6% 4.8% 12.9%
Jr Asst Manager 1.0 1.0 .0 2.0
50.0% 50.0% .0% 100.0%
7.1% 7.7% .0% 3.2%
1.6% 1.6% .0% 3.2%
Junior Manager 3.0 6.0 1.0 10.0
30.0% 60.0% 10.0% 100.0%
21.4% 46.2% 2.9% 16.1%
4.8% 9.7% 1.6% 16.1%
Manager 1.0 1.0 4.0 6.0
16.7% 16.7% 66.7% 100.0%
7.1% 7.7% 11.4% 9.7%
1.6% 1.6% 6.5% 9.7%
Sr Assistant 2.0 .0 12.0 14.0
14.3% .0% 85.7% 100.0%
14.3% .0% 34.3% 22.6%
3.2% .0% 19.4% 22.6%
Senior Manger .0 2.0 6.0 8.0
.0% 25.0% 75.0% 100.0%
.0% 15.4% 17.1% 12.9%
.0% 3.2% 9.7% 12.9%
Total 14.0 13.0 35.0 62.0
22.6% 21.0% 56.5% 100.0%
100.0% 100.0% 100.0% 100.0%
22.6% 21.0% 56.5% 100.0%
Chi-square tests.
Statistic Value df Asymp. Sig. (2-tailed)
Pearson Chi-Square 28.88 14 .01
Likelihood Ratio 34.50 14 .00
N of Valid Cases 62
Designation * QE2 [count, row %, column %, total %].
Designation Very important Important Somewhat important Least important Total
Asst Manager 3.0 6.0 1.0 .0 10.0
30.0% 60.0% 10.0% .0% 100.0%
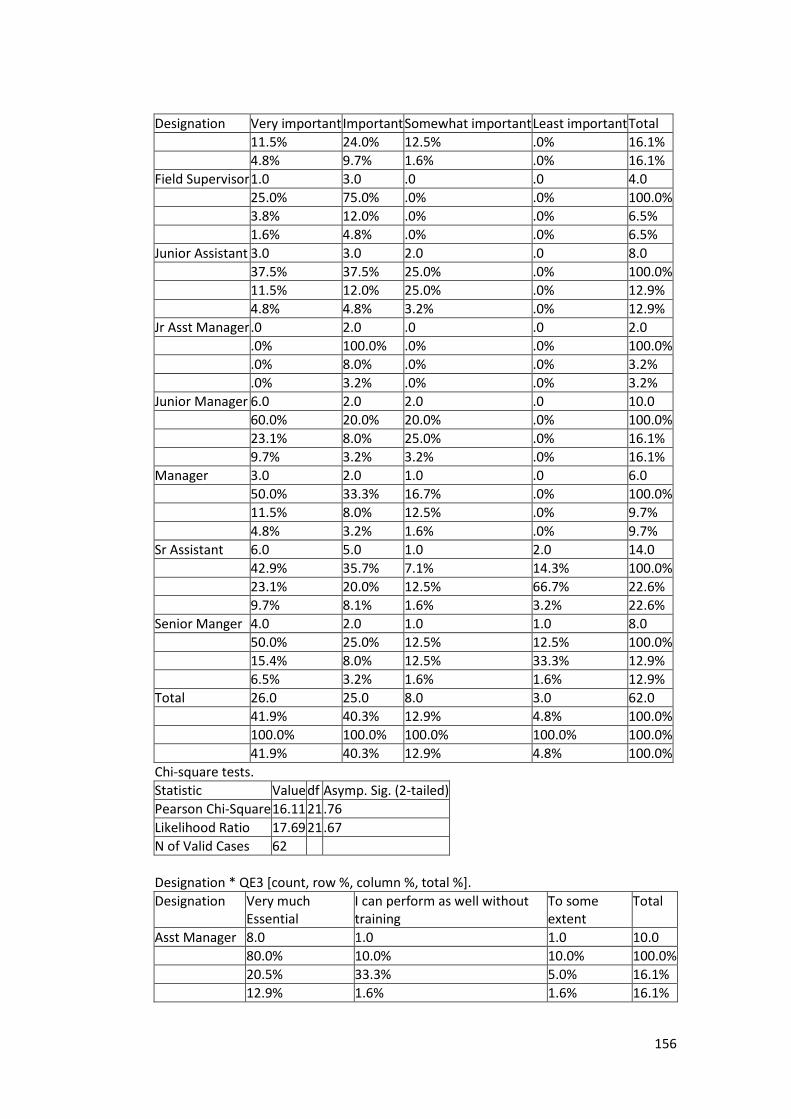
156
Designation Very important Important Somewhat important Least important Total
11.5% 24.0% 12.5% .0% 16.1%
4.8% 9.7% 1.6% .0% 16.1%
Field Supervisor 1.0 3.0 .0 .0 4.0
25.0% 75.0% .0% .0% 100.0%
3.8% 12.0% .0% .0% 6.5%
1.6% 4.8% .0% .0% 6.5%
Junior Assistant 3.0 3.0 2.0 .0 8.0
37.5% 37.5% 25.0% .0% 100.0%
11.5% 12.0% 25.0% .0% 12.9%
4.8% 4.8% 3.2% .0% 12.9%
Jr Asst Manager .0 2.0 .0 .0 2.0
.0% 100.0% .0% .0% 100.0%
.0% 8.0% .0% .0% 3.2%
.0% 3.2% .0% .0% 3.2%
Junior Manager 6.0 2.0 2.0 .0 10.0
60.0% 20.0% 20.0% .0% 100.0%
23.1% 8.0% 25.0% .0% 16.1%
9.7% 3.2% 3.2% .0% 16.1%
Manager 3.0 2.0 1.0 .0 6.0
50.0% 33.3% 16.7% .0% 100.0%
11.5% 8.0% 12.5% .0% 9.7%
4.8% 3.2% 1.6% .0% 9.7%
Sr Assistant 6.0 5.0 1.0 2.0 14.0
42.9% 35.7% 7.1% 14.3% 100.0%
23.1% 20.0% 12.5% 66.7% 22.6%
9.7% 8.1% 1.6% 3.2% 22.6%
Senior Manger 4.0 2.0 1.0 1.0 8.0
50.0% 25.0% 12.5% 12.5% 100.0%
15.4% 8.0% 12.5% 33.3% 12.9%
6.5% 3.2% 1.6% 1.6% 12.9%
Total 26.0 25.0 8.0 3.0 62.0
41.9% 40.3% 12.9% 4.8% 100.0%
100.0% 100.0% 100.0% 100.0% 100.0%
41.9% 40.3% 12.9% 4.8% 100.0%
Chi-square tests.
Statistic Value df Asymp. Sig. (2-tailed)
Pearson Chi-Square 16.11 21 .76
Likelihood Ratio 17.69 21 .67
N of Valid Cases 62
Designation * QE3 [count, row %, column %, total %].
Designation Very much Essential
I can perform as well without training
To some extent
Total
Asst Manager 8.0 1.0 1.0 10.0
80.0% 10.0% 10.0% 100.0%
20.5% 33.3% 5.0% 16.1%
12.9% 1.6% 1.6% 16.1%
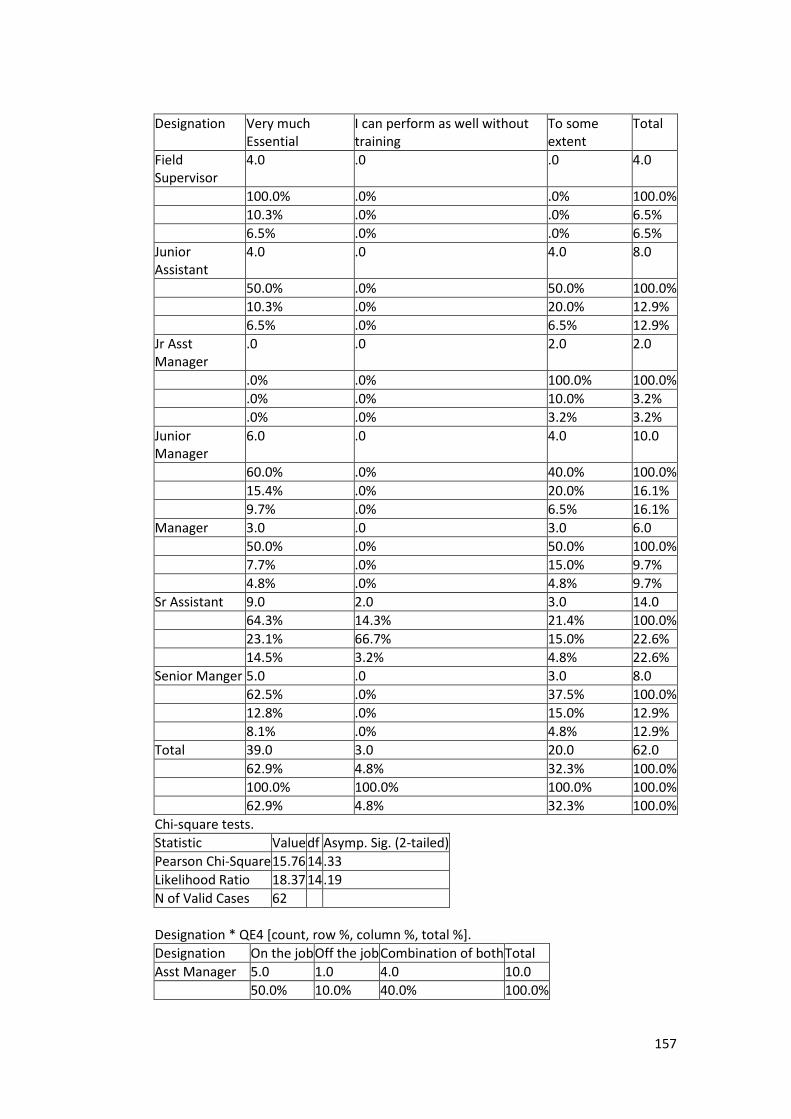
157
Designation Very much Essential
I can perform as well without training
To some extent
Total
Field Supervisor
4.0 .0 .0 4.0
100.0% .0% .0% 100.0%
10.3% .0% .0% 6.5%
6.5% .0% .0% 6.5%
Junior Assistant
4.0 .0 4.0 8.0
50.0% .0% 50.0% 100.0%
10.3% .0% 20.0% 12.9%
6.5% .0% 6.5% 12.9%
Jr Asst Manager
.0 .0 2.0 2.0
.0% .0% 100.0% 100.0%
.0% .0% 10.0% 3.2%
.0% .0% 3.2% 3.2%
Junior Manager
6.0 .0 4.0 10.0
60.0% .0% 40.0% 100.0%
15.4% .0% 20.0% 16.1%
9.7% .0% 6.5% 16.1%
Manager 3.0 .0 3.0 6.0
50.0% .0% 50.0% 100.0%
7.7% .0% 15.0% 9.7%
4.8% .0% 4.8% 9.7%
Sr Assistant 9.0 2.0 3.0 14.0
64.3% 14.3% 21.4% 100.0%
23.1% 66.7% 15.0% 22.6%
14.5% 3.2% 4.8% 22.6%
Senior Manger 5.0 .0 3.0 8.0
62.5% .0% 37.5% 100.0%
12.8% .0% 15.0% 12.9%
8.1% .0% 4.8% 12.9%
Total 39.0 3.0 20.0 62.0
62.9% 4.8% 32.3% 100.0%
100.0% 100.0% 100.0% 100.0%
62.9% 4.8% 32.3% 100.0%
Chi-square tests.
Statistic Value df Asymp. Sig. (2-tailed)
Pearson Chi-Square 15.76 14 .33
Likelihood Ratio 18.37 14 .19
N of Valid Cases 62
Designation * QE4 [count, row %, column %, total %].
Designation On the job Off the job Combination of both Total
Asst Manager 5.0 1.0 4.0 10.0
50.0% 10.0% 40.0% 100.0%
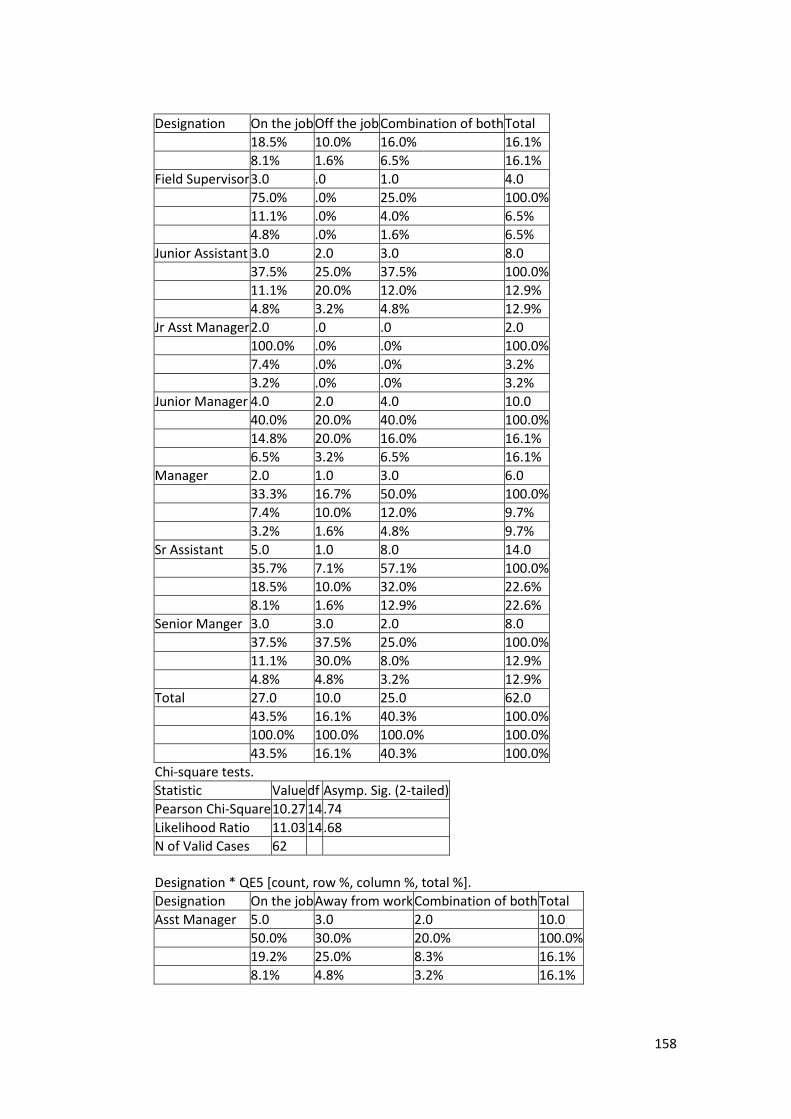
158
Designation On the job Off the job Combination of both Total
18.5% 10.0% 16.0% 16.1%
8.1% 1.6% 6.5% 16.1%
Field Supervisor 3.0 .0 1.0 4.0
75.0% .0% 25.0% 100.0%
11.1% .0% 4.0% 6.5%
4.8% .0% 1.6% 6.5%
Junior Assistant 3.0 2.0 3.0 8.0
37.5% 25.0% 37.5% 100.0%
11.1% 20.0% 12.0% 12.9%
4.8% 3.2% 4.8% 12.9%
Jr Asst Manager 2.0 .0 .0 2.0
100.0% .0% .0% 100.0%
7.4% .0% .0% 3.2%
3.2% .0% .0% 3.2%
Junior Manager 4.0 2.0 4.0 10.0
40.0% 20.0% 40.0% 100.0%
14.8% 20.0% 16.0% 16.1%
6.5% 3.2% 6.5% 16.1%
Manager 2.0 1.0 3.0 6.0
33.3% 16.7% 50.0% 100.0%
7.4% 10.0% 12.0% 9.7%
3.2% 1.6% 4.8% 9.7%
Sr Assistant 5.0 1.0 8.0 14.0
35.7% 7.1% 57.1% 100.0%
18.5% 10.0% 32.0% 22.6%
8.1% 1.6% 12.9% 22.6%
Senior Manger 3.0 3.0 2.0 8.0
37.5% 37.5% 25.0% 100.0%
11.1% 30.0% 8.0% 12.9%
4.8% 4.8% 3.2% 12.9%
Total 27.0 10.0 25.0 62.0
43.5% 16.1% 40.3% 100.0%
100.0% 100.0% 100.0% 100.0%
43.5% 16.1% 40.3% 100.0%
Chi-square tests.
Statistic Value df Asymp. Sig. (2-tailed)
Pearson Chi-Square 10.27 14 .74
Likelihood Ratio 11.03 14 .68
N of Valid Cases 62
Designation * QE5 [count, row %, column %, total %].
Designation On the job Away from work Combination of both Total
Asst Manager 5.0 3.0 2.0 10.0
50.0% 30.0% 20.0% 100.0%
19.2% 25.0% 8.3% 16.1%
8.1% 4.8% 3.2% 16.1%
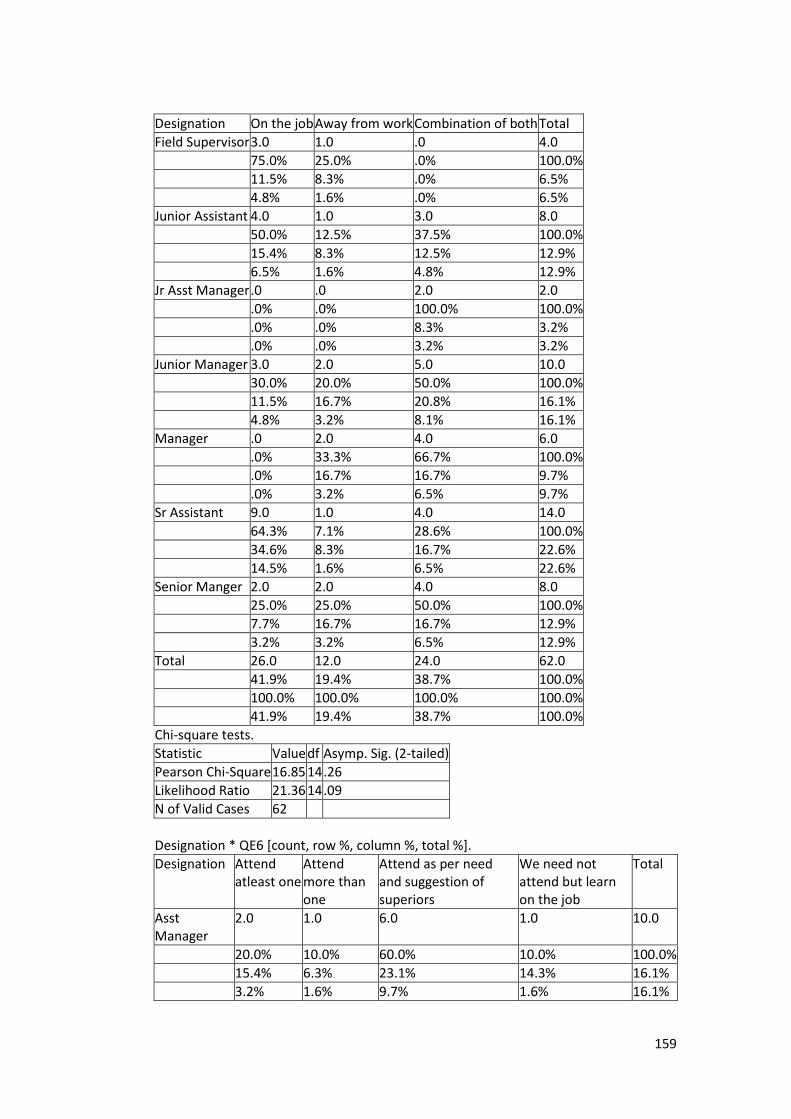
159
Designation On the job Away from work Combination of both Total
Field Supervisor 3.0 1.0 .0 4.0
75.0% 25.0% .0% 100.0%
11.5% 8.3% .0% 6.5%
4.8% 1.6% .0% 6.5%
Junior Assistant 4.0 1.0 3.0 8.0
50.0% 12.5% 37.5% 100.0%
15.4% 8.3% 12.5% 12.9%
6.5% 1.6% 4.8% 12.9%
Jr Asst Manager .0 .0 2.0 2.0
.0% .0% 100.0% 100.0%
.0% .0% 8.3% 3.2%
.0% .0% 3.2% 3.2%
Junior Manager 3.0 2.0 5.0 10.0
30.0% 20.0% 50.0% 100.0%
11.5% 16.7% 20.8% 16.1%
4.8% 3.2% 8.1% 16.1%
Manager .0 2.0 4.0 6.0
.0% 33.3% 66.7% 100.0%
.0% 16.7% 16.7% 9.7%
.0% 3.2% 6.5% 9.7%
Sr Assistant 9.0 1.0 4.0 14.0
64.3% 7.1% 28.6% 100.0%
34.6% 8.3% 16.7% 22.6%
14.5% 1.6% 6.5% 22.6%
Senior Manger 2.0 2.0 4.0 8.0
25.0% 25.0% 50.0% 100.0%
7.7% 16.7% 16.7% 12.9%
3.2% 3.2% 6.5% 12.9%
Total 26.0 12.0 24.0 62.0
41.9% 19.4% 38.7% 100.0%
100.0% 100.0% 100.0% 100.0%
41.9% 19.4% 38.7% 100.0%
Chi-square tests.
Statistic Value df Asymp. Sig. (2-tailed)
Pearson Chi-Square 16.85 14 .26
Likelihood Ratio 21.36 14 .09
N of Valid Cases 62
Designation * QE6 [count, row %, column %, total %].
Designation Attend atleast one
Attend more than one
Attend as per need and suggestion of superiors
We need not attend but learn on the job
Total
Asst Manager
2.0 1.0 6.0 1.0 10.0
20.0% 10.0% 60.0% 10.0% 100.0%
15.4% 6.3% 23.1% 14.3% 16.1%
3.2% 1.6% 9.7% 1.6% 16.1%

160
Designation Attend atleast one
Attend more than one
Attend as per need and suggestion of superiors
We need not attend but learn on the job
Total
Field Supervisor
1.0 1.0 2.0 .0 4.0
25.0% 25.0% 50.0% .0% 100.0%
7.7% 6.3% 7.7% .0% 6.5%
1.6% 1.6% 3.2% .0% 6.5%
Junior Assistant
.0 3.0 3.0 2.0 8.0
.0% 37.5% 37.5% 25.0% 100.0%
.0% 18.8% 11.5% 28.6% 12.9%
.0% 4.8% 4.8% 3.2% 12.9%
Jr Asst Manager
.0 1.0 .0 1.0 2.0
.0% 50.0% .0% 50.0% 100.0%
.0% 6.3% .0% 14.3% 3.2%
.0% 1.6% .0% 1.6% 3.2%
Junior Manager
4.0 5.0 1.0 .0 10.0
40.0% 50.0% 10.0% .0% 100.0%
30.8% 31.3% 3.8% .0% 16.1%
6.5% 8.1% 1.6% .0% 16.1%
Manager .0 .0 6.0 .0 6.0
.0% .0% 100.0% .0% 100.0%
.0% .0% 23.1% .0% 9.7%
.0% .0% 9.7% .0% 9.7%
Sr Assistant 5.0 1.0 6.0 2.0 14.0
35.7% 7.1% 42.9% 14.3% 100.0%
38.5% 6.3% 23.1% 28.6% 22.6%
8.1% 1.6% 9.7% 3.2% 22.6%
Senior Manger
1.0 4.0 2.0 1.0 8.0
12.5% 50.0% 25.0% 12.5% 100.0%
7.7% 25.0% 7.7% 14.3% 12.9%
1.6% 6.5% 3.2% 1.6% 12.9%
Total 13.0 16.0 26.0 7.0 62.0
21.0% 25.8% 41.9% 11.3% 100.0%
100.0% 100.0% 100.0% 100.0% 100.0%
21.0% 25.8% 41.9% 11.3% 100.0%
Chi-square tests.
Statistic Value df Asymp. Sig. (2-tailed)
Pearson Chi-Square 32.11 21 .06
Likelihood Ratio 37.71 21 .01
N of Valid Cases 62
Designation * QE7 [count, row %, column %, total %].
Designation 1 Week 2 Weeks 4 Weeks Total
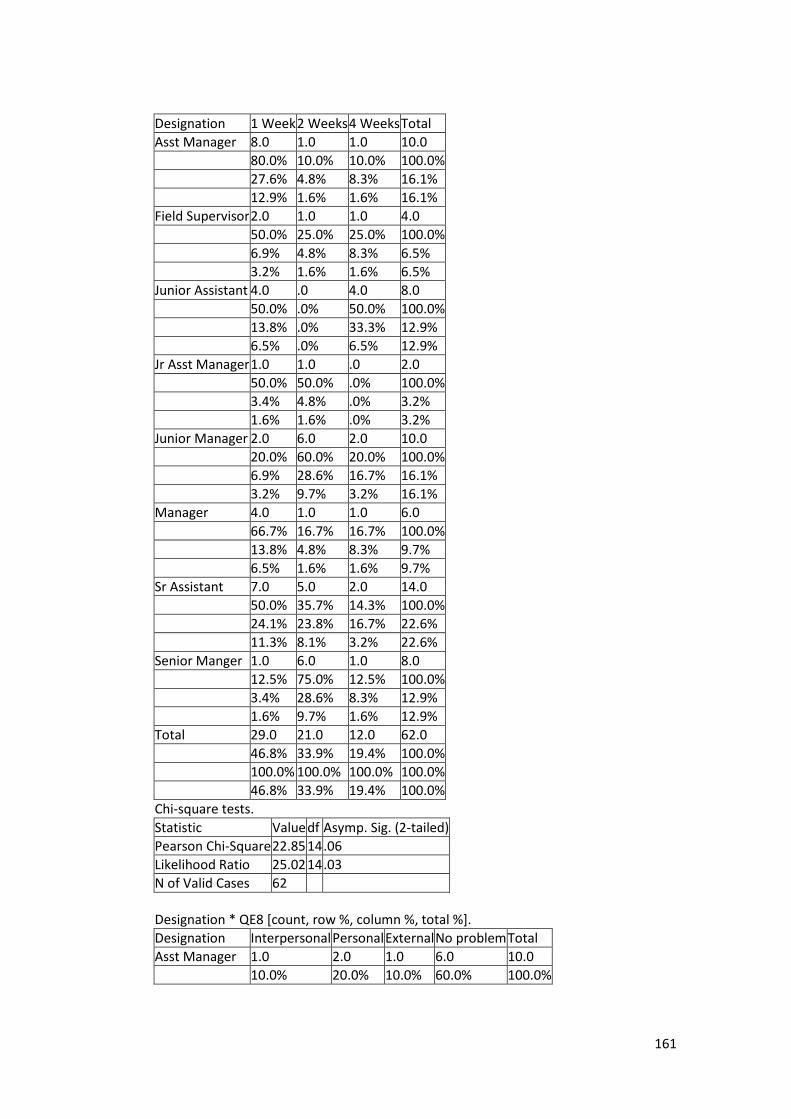
161
Designation 1 Week 2 Weeks 4 Weeks Total
Asst Manager 8.0 1.0 1.0 10.0
80.0% 10.0% 10.0% 100.0%
27.6% 4.8% 8.3% 16.1%
12.9% 1.6% 1.6% 16.1%
Field Supervisor 2.0 1.0 1.0 4.0
50.0% 25.0% 25.0% 100.0%
6.9% 4.8% 8.3% 6.5%
3.2% 1.6% 1.6% 6.5%
Junior Assistant 4.0 .0 4.0 8.0
50.0% .0% 50.0% 100.0%
13.8% .0% 33.3% 12.9%
6.5% .0% 6.5% 12.9%
Jr Asst Manager 1.0 1.0 .0 2.0
50.0% 50.0% .0% 100.0%
3.4% 4.8% .0% 3.2%
1.6% 1.6% .0% 3.2%
Junior Manager 2.0 6.0 2.0 10.0
20.0% 60.0% 20.0% 100.0%
6.9% 28.6% 16.7% 16.1%
3.2% 9.7% 3.2% 16.1%
Manager 4.0 1.0 1.0 6.0
66.7% 16.7% 16.7% 100.0%
13.8% 4.8% 8.3% 9.7%
6.5% 1.6% 1.6% 9.7%
Sr Assistant 7.0 5.0 2.0 14.0
50.0% 35.7% 14.3% 100.0%
24.1% 23.8% 16.7% 22.6%
11.3% 8.1% 3.2% 22.6%
Senior Manger 1.0 6.0 1.0 8.0
12.5% 75.0% 12.5% 100.0%
3.4% 28.6% 8.3% 12.9%
1.6% 9.7% 1.6% 12.9%
Total 29.0 21.0 12.0 62.0
46.8% 33.9% 19.4% 100.0%
100.0% 100.0% 100.0% 100.0%
46.8% 33.9% 19.4% 100.0%
Chi-square tests.
Statistic Value df Asymp. Sig. (2-tailed)
Pearson Chi-Square 22.85 14 .06
Likelihood Ratio 25.02 14 .03
N of Valid Cases 62
Designation * QE8 [count, row %, column %, total %].
Designation Interpersonal Personal External No problem Total
Asst Manager 1.0 2.0 1.0 6.0 10.0
10.0% 20.0% 10.0% 60.0% 100.0%

162
Designation Interpersonal Personal External No problem Total
25.0% 15.4% 7.1% 19.4% 16.1%
1.6% 3.2% 1.6% 9.7% 16.1%
Field Supervisor 1.0 1.0 2.0 .0 4.0
25.0% 25.0% 50.0% .0% 100.0%
25.0% 7.7% 14.3% .0% 6.5%
1.6% 1.6% 3.2% .0% 6.5%
Junior Assistant 1.0 1.0 3.0 3.0 8.0
12.5% 12.5% 37.5% 37.5% 100.0%
25.0% 7.7% 21.4% 9.7% 12.9%
1.6% 1.6% 4.8% 4.8% 12.9%
Jr Asst Manager .0 2.0 .0 .0 2.0
.0% 100.0% .0% .0% 100.0%
.0% 15.4% .0% .0% 3.2%
.0% 3.2% .0% .0% 3.2%
Junior Manager 1.0 1.0 6.0 2.0 10.0
10.0% 10.0% 60.0% 20.0% 100.0%
25.0% 7.7% 42.9% 6.5% 16.1%
1.6% 1.6% 9.7% 3.2% 16.1%
Manager .0 1.0 .0 5.0 6.0
.0% 16.7% .0% 83.3% 100.0%
.0% 7.7% .0% 16.1% 9.7%
.0% 1.6% .0% 8.1% 9.7%
Sr Assistant .0 1.0 1.0 12.0 14.0
.0% 7.1% 7.1% 85.7% 100.0%
.0% 7.7% 7.1% 38.7% 22.6%
.0% 1.6% 1.6% 19.4% 22.6%
Senior Manger .0 4.0 1.0 3.0 8.0
.0% 50.0% 12.5% 37.5% 100.0%
.0% 30.8% 7.1% 9.7% 12.9%
.0% 6.5% 1.6% 4.8% 12.9%
Total 4.0 13.0 14.0 31.0 62.0
6.5% 21.0% 22.6% 50.0% 100.0%
100.0% 100.0% 100.0% 100.0% 100.0%
6.5% 21.0% 22.6% 50.0% 100.0%
Chi-square tests.
Statistic Value df Asymp. Sig. (2-tailed)
Pearson Chi-Square 39.37 21 .01
Likelihood Ratio 39.97 21 .01
N of Valid Cases 62
Designation * QE9 [count, row %, column %, total %].
Designation Strongly agree Agree Somewhat agree Disagree Total
Asst Manager 1.0 7.0 .0 2.0 10.0
10.0% 70.0% .0% 20.0% 100.0%
8.3% 17.1% .0% 50.0% 16.1%
1.6% 11.3% .0% 3.2% 16.1%
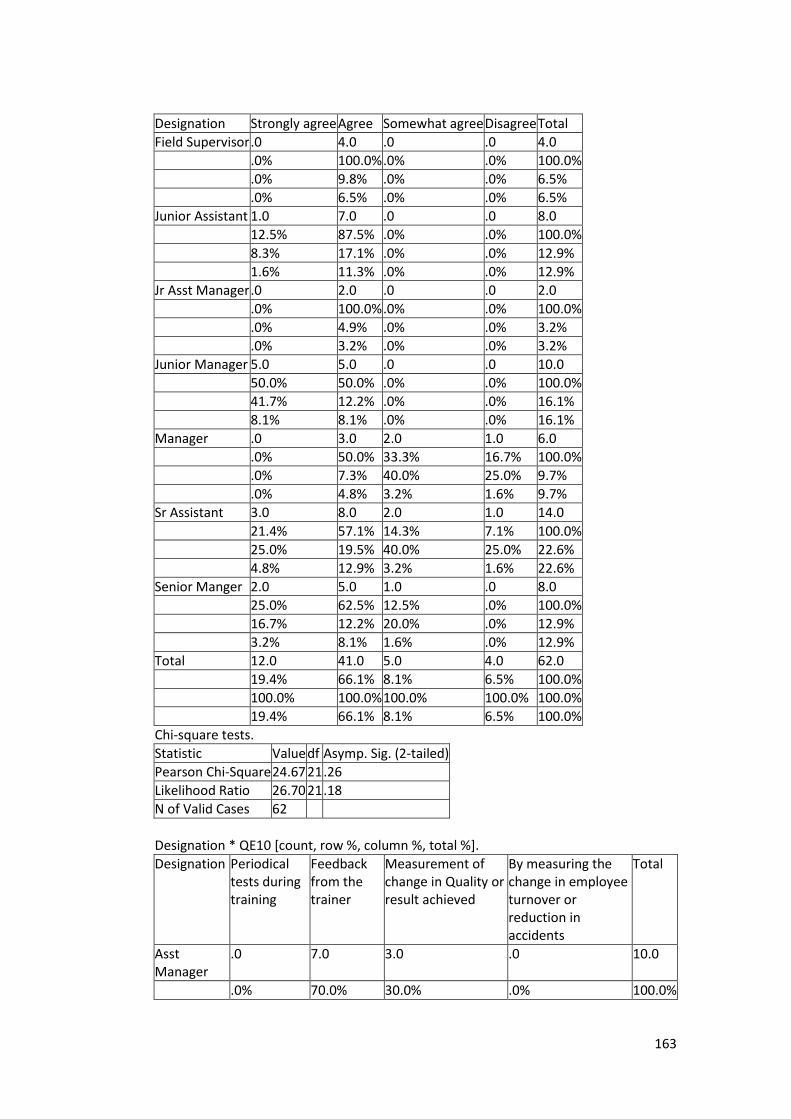
163
Designation Strongly agree Agree Somewhat agree Disagree Total
Field Supervisor .0 4.0 .0 .0 4.0
.0% 100.0% .0% .0% 100.0%
.0% 9.8% .0% .0% 6.5%
.0% 6.5% .0% .0% 6.5%
Junior Assistant 1.0 7.0 .0 .0 8.0
12.5% 87.5% .0% .0% 100.0%
8.3% 17.1% .0% .0% 12.9%
1.6% 11.3% .0% .0% 12.9%
Jr Asst Manager .0 2.0 .0 .0 2.0
.0% 100.0% .0% .0% 100.0%
.0% 4.9% .0% .0% 3.2%
.0% 3.2% .0% .0% 3.2%
Junior Manager 5.0 5.0 .0 .0 10.0
50.0% 50.0% .0% .0% 100.0%
41.7% 12.2% .0% .0% 16.1%
8.1% 8.1% .0% .0% 16.1%
Manager .0 3.0 2.0 1.0 6.0
.0% 50.0% 33.3% 16.7% 100.0%
.0% 7.3% 40.0% 25.0% 9.7%
.0% 4.8% 3.2% 1.6% 9.7%
Sr Assistant 3.0 8.0 2.0 1.0 14.0
21.4% 57.1% 14.3% 7.1% 100.0%
25.0% 19.5% 40.0% 25.0% 22.6%
4.8% 12.9% 3.2% 1.6% 22.6%
Senior Manger 2.0 5.0 1.0 .0 8.0
25.0% 62.5% 12.5% .0% 100.0%
16.7% 12.2% 20.0% .0% 12.9%
3.2% 8.1% 1.6% .0% 12.9%
Total 12.0 41.0 5.0 4.0 62.0
19.4% 66.1% 8.1% 6.5% 100.0%
100.0% 100.0% 100.0% 100.0% 100.0%
19.4% 66.1% 8.1% 6.5% 100.0%
Chi-square tests.
Statistic Value df Asymp. Sig. (2-tailed)
Pearson Chi-Square 24.67 21 .26
Likelihood Ratio 26.70 21 .18
N of Valid Cases 62
Designation * QE10 [count, row %, column %, total %].
Designation Periodical tests during training
Feedback from the trainer
Measurement of change in Quality or result achieved
By measuring the change in employee turnover or reduction in accidents
Total
Asst Manager
.0 7.0 3.0 .0 10.0
.0% 70.0% 30.0% .0% 100.0%

164
Designation Periodical tests during training
Feedback from the trainer
Measurement of change in Quality or result achieved
By measuring the change in employee turnover or reduction in accidents
Total
.0% 21.2% 21.4% .0% 16.1%
.0% 11.3% 4.8% .0% 16.1%
Field Supervisor
1.0 3.0 .0 .0 4.0
25.0% 75.0% .0% .0% 100.0%
7.1% 9.1% .0% .0% 6.5%
1.6% 4.8% .0% .0% 6.5%
Junior Assistant
2.0 4.0 2.0 .0 8.0
25.0% 50.0% 25.0% .0% 100.0%
14.3% 12.1% 14.3% .0% 12.9%
3.2% 6.5% 3.2% .0% 12.9%
Jr Asst Manager
2.0 .0 .0 .0 2.0
100.0% .0% .0% .0% 100.0%
14.3% .0% .0% .0% 3.2%
3.2% .0% .0% .0% 3.2%
Junior Manager
1.0 4.0 5.0 .0 10.0
10.0% 40.0% 50.0% .0% 100.0%
7.1% 12.1% 35.7% .0% 16.1%
1.6% 6.5% 8.1% .0% 16.1%
Manager 3.0 3.0 .0 .0 6.0
50.0% 50.0% .0% .0% 100.0%
21.4% 9.1% .0% .0% 9.7%
4.8% 4.8% .0% .0% 9.7%
Sr Assistant 3.0 9.0 2.0 .0 14.0
21.4% 64.3% 14.3% .0% 100.0%
21.4% 27.3% 14.3% .0% 22.6%
4.8% 14.5% 3.2% .0% 22.6%
Senior Manger
2.0 3.0 2.0 1.0 8.0
25.0% 37.5% 25.0% 12.5% 100.0%
14.3% 9.1% 14.3% 100.0% 12.9%
3.2% 4.8% 3.2% 1.6% 12.9%
Total 14.0 33.0 14.0 1.0 62.0
22.6% 53.2% 22.6% 1.6% 100.0%
100.0% 100.0% 100.0% 100.0% 100.0%
22.6% 53.2% 22.6% 1.6% 100.0%
Chi-square tests.
Statistic Value df Asymp. Sig. (2-tailed)
Pearson Chi-Square 26.83 21 .18
Likelihood Ratio 26.56 21 .19
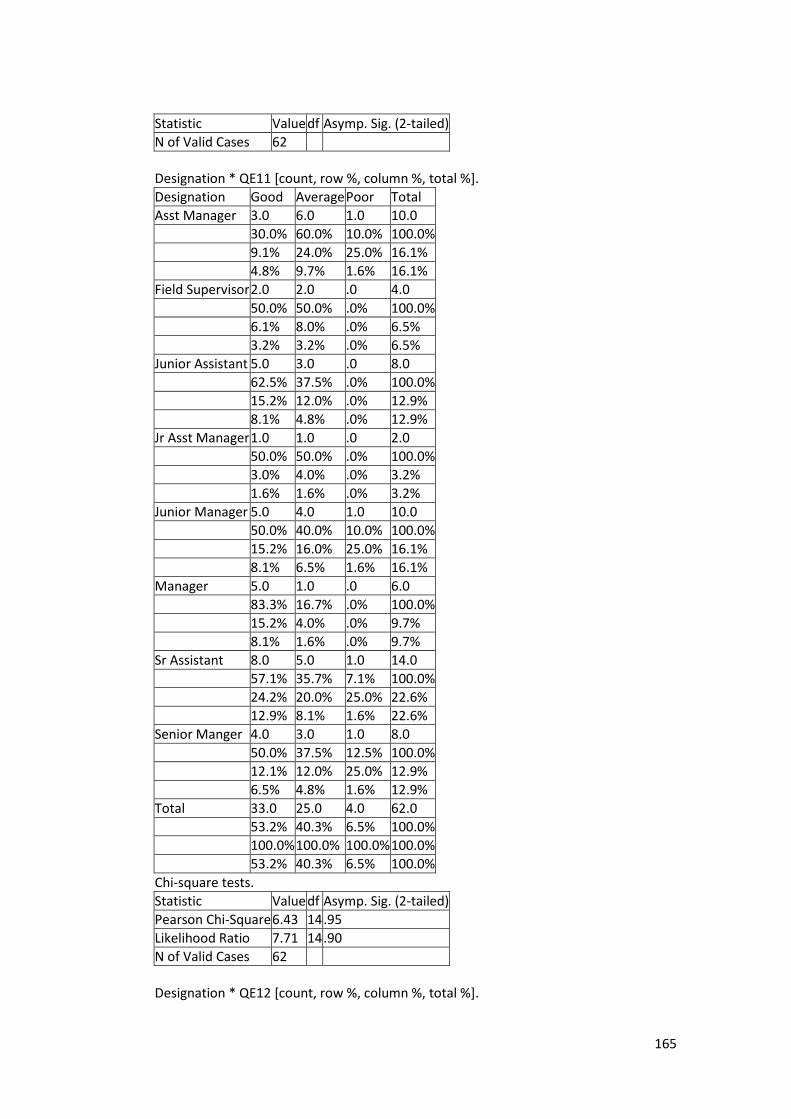
165
Statistic Value df Asymp. Sig. (2-tailed)
N of Valid Cases 62
Designation * QE11 [count, row %, column %, total %].
Designation Good Average Poor Total
Asst Manager 3.0 6.0 1.0 10.0
30.0% 60.0% 10.0% 100.0%
9.1% 24.0% 25.0% 16.1%
4.8% 9.7% 1.6% 16.1%
Field Supervisor 2.0 2.0 .0 4.0
50.0% 50.0% .0% 100.0%
6.1% 8.0% .0% 6.5%
3.2% 3.2% .0% 6.5%
Junior Assistant 5.0 3.0 .0 8.0
62.5% 37.5% .0% 100.0%
15.2% 12.0% .0% 12.9%
8.1% 4.8% .0% 12.9%
Jr Asst Manager 1.0 1.0 .0 2.0
50.0% 50.0% .0% 100.0%
3.0% 4.0% .0% 3.2%
1.6% 1.6% .0% 3.2%
Junior Manager 5.0 4.0 1.0 10.0
50.0% 40.0% 10.0% 100.0%
15.2% 16.0% 25.0% 16.1%
8.1% 6.5% 1.6% 16.1%
Manager 5.0 1.0 .0 6.0
83.3% 16.7% .0% 100.0%
15.2% 4.0% .0% 9.7%
8.1% 1.6% .0% 9.7%
Sr Assistant 8.0 5.0 1.0 14.0
57.1% 35.7% 7.1% 100.0%
24.2% 20.0% 25.0% 22.6%
12.9% 8.1% 1.6% 22.6%
Senior Manger 4.0 3.0 1.0 8.0
50.0% 37.5% 12.5% 100.0%
12.1% 12.0% 25.0% 12.9%
6.5% 4.8% 1.6% 12.9%
Total 33.0 25.0 4.0 62.0
53.2% 40.3% 6.5% 100.0%
100.0% 100.0% 100.0% 100.0%
53.2% 40.3% 6.5% 100.0%
Chi-square tests.
Statistic Value df Asymp. Sig. (2-tailed)
Pearson Chi-Square 6.43 14 .95
Likelihood Ratio 7.71 14 .90
N of Valid Cases 62
Designation * QE12 [count, row %, column %, total %].
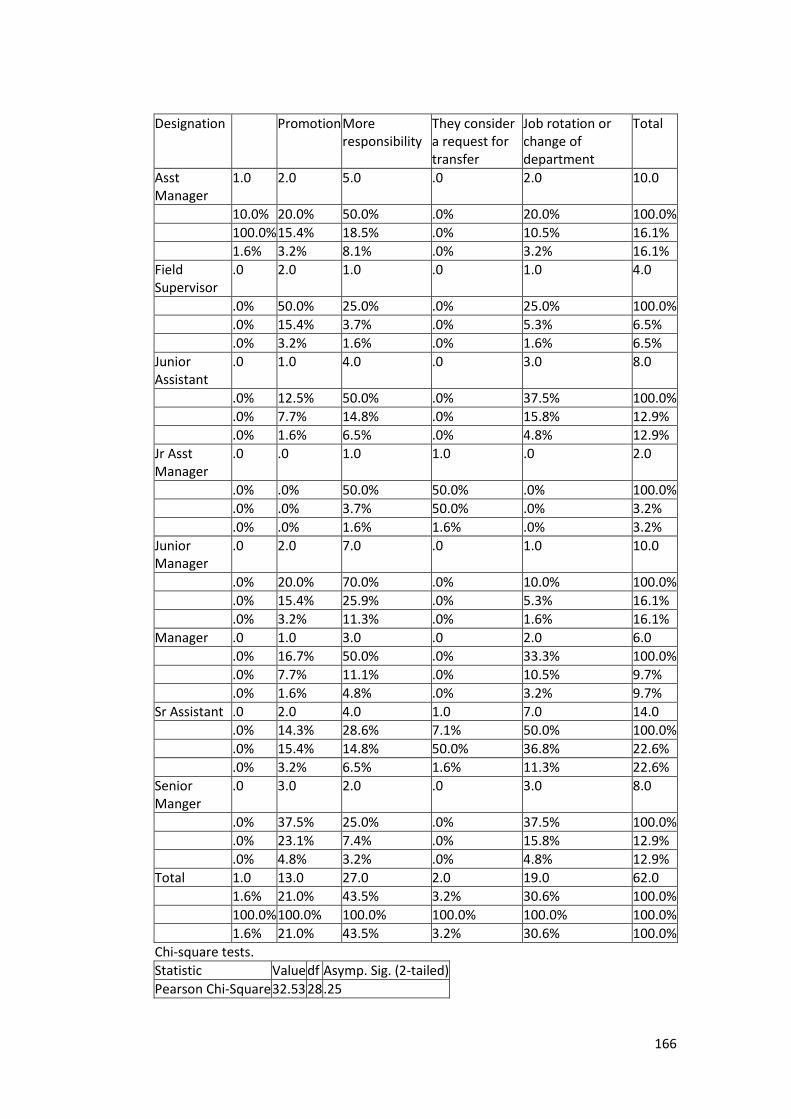
166
Designation Promotion More responsibility
They consider a request for transfer
Job rotation or change of department
Total
Asst Manager
1.0 2.0 5.0 .0 2.0 10.0
10.0% 20.0% 50.0% .0% 20.0% 100.0%
100.0% 15.4% 18.5% .0% 10.5% 16.1%
1.6% 3.2% 8.1% .0% 3.2% 16.1%
Field Supervisor
.0 2.0 1.0 .0 1.0 4.0
.0% 50.0% 25.0% .0% 25.0% 100.0%
.0% 15.4% 3.7% .0% 5.3% 6.5%
.0% 3.2% 1.6% .0% 1.6% 6.5%
Junior Assistant
.0 1.0 4.0 .0 3.0 8.0
.0% 12.5% 50.0% .0% 37.5% 100.0%
.0% 7.7% 14.8% .0% 15.8% 12.9%
.0% 1.6% 6.5% .0% 4.8% 12.9%
Jr Asst Manager
.0 .0 1.0 1.0 .0 2.0
.0% .0% 50.0% 50.0% .0% 100.0%
.0% .0% 3.7% 50.0% .0% 3.2%
.0% .0% 1.6% 1.6% .0% 3.2%
Junior Manager
.0 2.0 7.0 .0 1.0 10.0
.0% 20.0% 70.0% .0% 10.0% 100.0%
.0% 15.4% 25.9% .0% 5.3% 16.1%
.0% 3.2% 11.3% .0% 1.6% 16.1%
Manager .0 1.0 3.0 .0 2.0 6.0
.0% 16.7% 50.0% .0% 33.3% 100.0%
.0% 7.7% 11.1% .0% 10.5% 9.7%
.0% 1.6% 4.8% .0% 3.2% 9.7%
Sr Assistant .0 2.0 4.0 1.0 7.0 14.0
.0% 14.3% 28.6% 7.1% 50.0% 100.0%
.0% 15.4% 14.8% 50.0% 36.8% 22.6%
.0% 3.2% 6.5% 1.6% 11.3% 22.6%
Senior Manger
.0 3.0 2.0 .0 3.0 8.0
.0% 37.5% 25.0% .0% 37.5% 100.0%
.0% 23.1% 7.4% .0% 15.8% 12.9%
.0% 4.8% 3.2% .0% 4.8% 12.9%
Total 1.0 13.0 27.0 2.0 19.0 62.0
1.6% 21.0% 43.5% 3.2% 30.6% 100.0%
100.0% 100.0% 100.0% 100.0% 100.0% 100.0%
1.6% 21.0% 43.5% 3.2% 30.6% 100.0%
Chi-square tests.
Statistic Value df Asymp. Sig. (2-tailed)
Pearson Chi-Square 32.53 28 .25
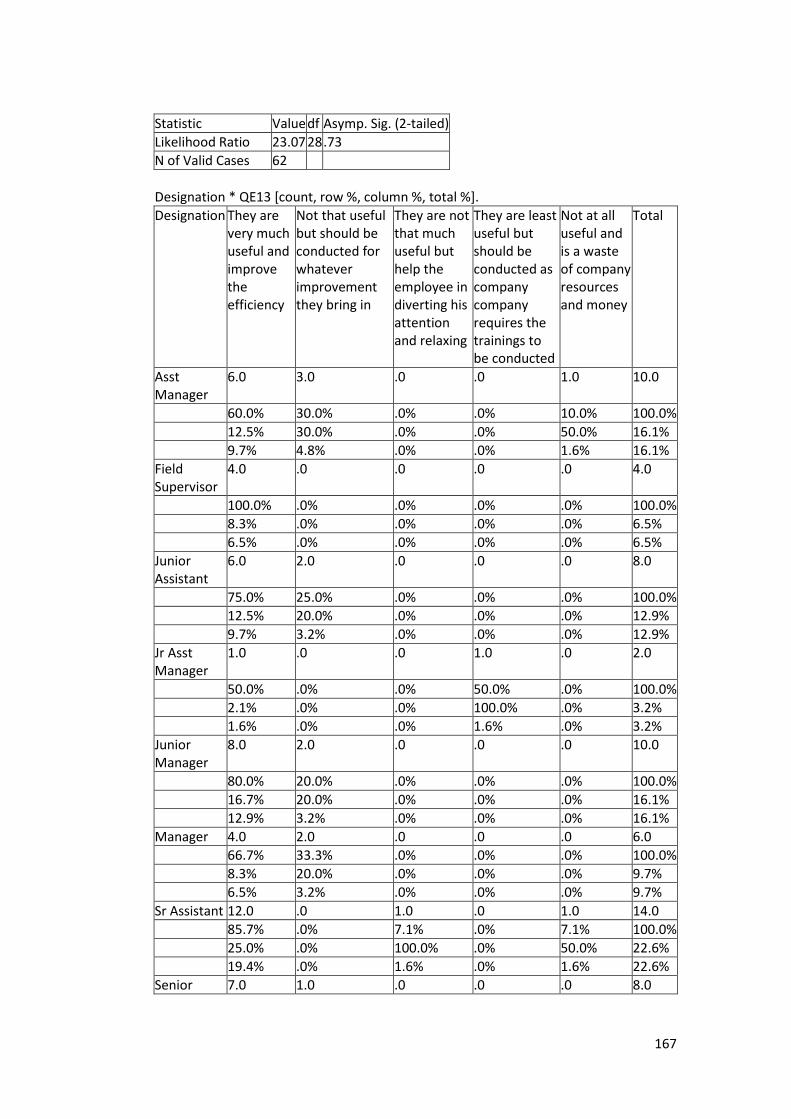
167
Statistic Value df Asymp. Sig. (2-tailed)
Likelihood Ratio 23.07 28 .73
N of Valid Cases 62
Designation * QE13 [count, row %, column %, total %].
Designation They are very much useful and improve the efficiency
Not that useful but should be conducted for whatever improvement they bring in
They are not that much useful but help the employee in diverting his attention and relaxing
They are least useful but should be conducted as company company requires the trainings to be conducted
Not at all useful and is a waste of company resources and money
Total
Asst Manager
6.0 3.0 .0 .0 1.0 10.0
60.0% 30.0% .0% .0% 10.0% 100.0%
12.5% 30.0% .0% .0% 50.0% 16.1%
9.7% 4.8% .0% .0% 1.6% 16.1%
Field Supervisor
4.0 .0 .0 .0 .0 4.0
100.0% .0% .0% .0% .0% 100.0%
8.3% .0% .0% .0% .0% 6.5%
6.5% .0% .0% .0% .0% 6.5%
Junior Assistant
6.0 2.0 .0 .0 .0 8.0
75.0% 25.0% .0% .0% .0% 100.0%
12.5% 20.0% .0% .0% .0% 12.9%
9.7% 3.2% .0% .0% .0% 12.9%
Jr Asst Manager
1.0 .0 .0 1.0 .0 2.0
50.0% .0% .0% 50.0% .0% 100.0%
2.1% .0% .0% 100.0% .0% 3.2%
1.6% .0% .0% 1.6% .0% 3.2%
Junior Manager
8.0 2.0 .0 .0 .0 10.0
80.0% 20.0% .0% .0% .0% 100.0%
16.7% 20.0% .0% .0% .0% 16.1%
12.9% 3.2% .0% .0% .0% 16.1%
Manager 4.0 2.0 .0 .0 .0 6.0
66.7% 33.3% .0% .0% .0% 100.0%
8.3% 20.0% .0% .0% .0% 9.7%
6.5% 3.2% .0% .0% .0% 9.7%
Sr Assistant 12.0 .0 1.0 .0 1.0 14.0
85.7% .0% 7.1% .0% 7.1% 100.0%
25.0% .0% 100.0% .0% 50.0% 22.6%
19.4% .0% 1.6% .0% 1.6% 22.6%
Senior 7.0 1.0 .0 .0 .0 8.0
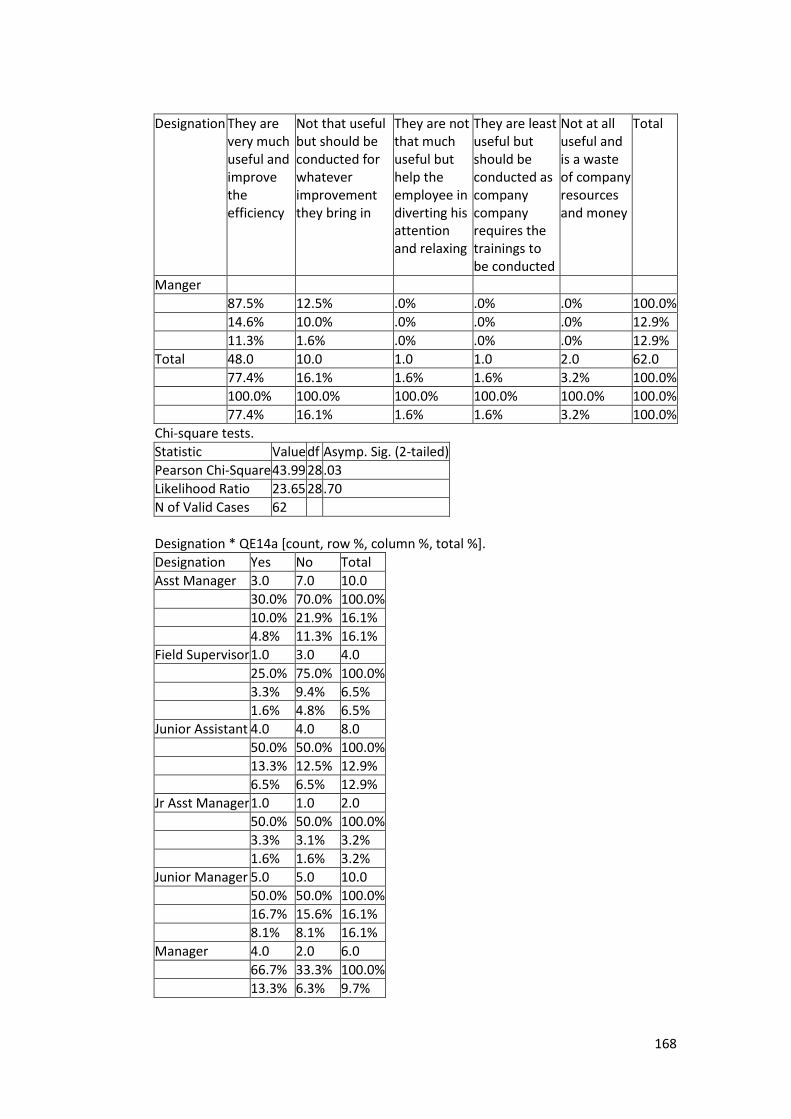
168
Designation They are very much useful and improve the efficiency
Not that useful but should be conducted for whatever improvement they bring in
They are not that much useful but help the employee in diverting his attention and relaxing
They are least useful but should be conducted as company company requires the trainings to be conducted
Not at all useful and is a waste of company resources and money
Total
Manger
87.5% 12.5% .0% .0% .0% 100.0%
14.6% 10.0% .0% .0% .0% 12.9%
11.3% 1.6% .0% .0% .0% 12.9%
Total 48.0 10.0 1.0 1.0 2.0 62.0
77.4% 16.1% 1.6% 1.6% 3.2% 100.0%
100.0% 100.0% 100.0% 100.0% 100.0% 100.0%
77.4% 16.1% 1.6% 1.6% 3.2% 100.0%
Chi-square tests.
Statistic Value df Asymp. Sig. (2-tailed)
Pearson Chi-Square 43.99 28 .03
Likelihood Ratio 23.65 28 .70
N of Valid Cases 62
Designation * QE14a [count, row %, column %, total %].
Designation Yes No Total
Asst Manager 3.0 7.0 10.0
30.0% 70.0% 100.0%
10.0% 21.9% 16.1%
4.8% 11.3% 16.1%
Field Supervisor 1.0 3.0 4.0
25.0% 75.0% 100.0%
3.3% 9.4% 6.5%
1.6% 4.8% 6.5%
Junior Assistant 4.0 4.0 8.0
50.0% 50.0% 100.0%
13.3% 12.5% 12.9%
6.5% 6.5% 12.9%
Jr Asst Manager 1.0 1.0 2.0
50.0% 50.0% 100.0%
3.3% 3.1% 3.2%
1.6% 1.6% 3.2%
Junior Manager 5.0 5.0 10.0
50.0% 50.0% 100.0%
16.7% 15.6% 16.1%
8.1% 8.1% 16.1%
Manager 4.0 2.0 6.0
66.7% 33.3% 100.0%
13.3% 6.3% 9.7%
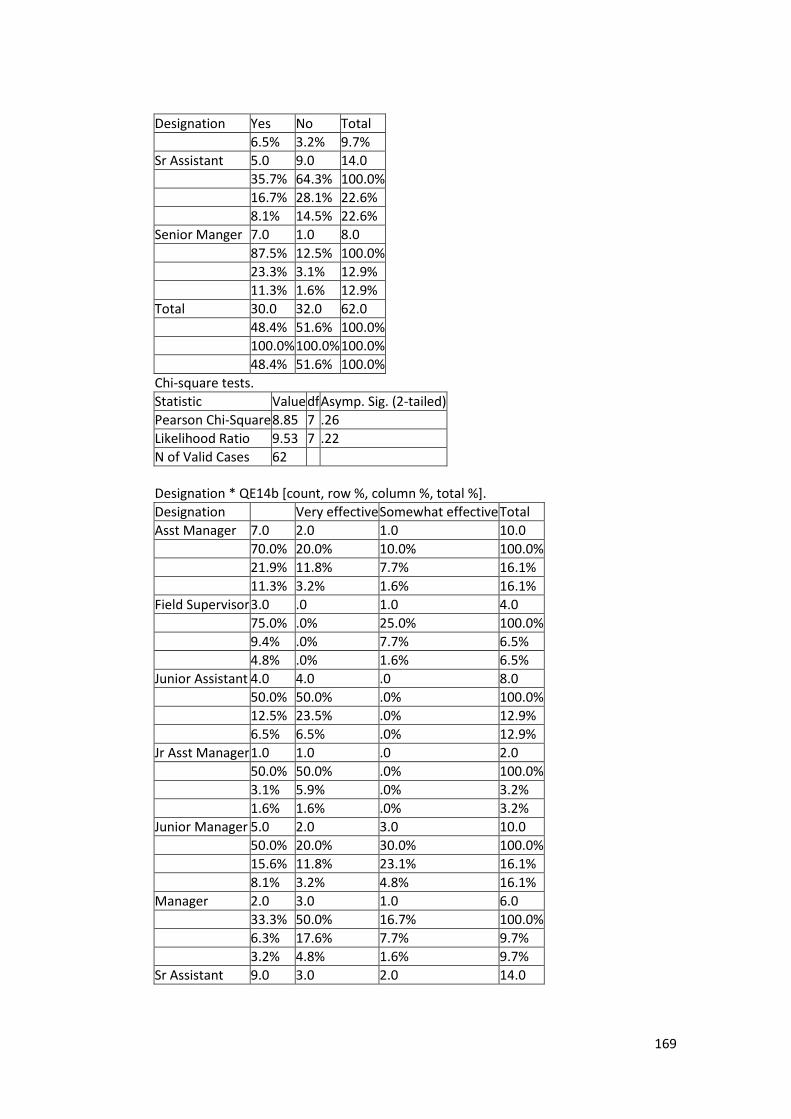
169
Designation Yes No Total
6.5% 3.2% 9.7%
Sr Assistant 5.0 9.0 14.0
35.7% 64.3% 100.0%
16.7% 28.1% 22.6%
8.1% 14.5% 22.6%
Senior Manger 7.0 1.0 8.0
87.5% 12.5% 100.0%
23.3% 3.1% 12.9%
11.3% 1.6% 12.9%
Total 30.0 32.0 62.0
48.4% 51.6% 100.0%
100.0% 100.0% 100.0%
48.4% 51.6% 100.0%
Chi-square tests.
Statistic Value df Asymp. Sig. (2-tailed)
Pearson Chi-Square 8.85 7 .26
Likelihood Ratio 9.53 7 .22
N of Valid Cases 62
Designation * QE14b [count, row %, column %, total %].
Designation Very effective Somewhat effective Total
Asst Manager 7.0 2.0 1.0 10.0
70.0% 20.0% 10.0% 100.0%
21.9% 11.8% 7.7% 16.1%
11.3% 3.2% 1.6% 16.1%
Field Supervisor 3.0 .0 1.0 4.0
75.0% .0% 25.0% 100.0%
9.4% .0% 7.7% 6.5%
4.8% .0% 1.6% 6.5%
Junior Assistant 4.0 4.0 .0 8.0
50.0% 50.0% .0% 100.0%
12.5% 23.5% .0% 12.9%
6.5% 6.5% .0% 12.9%
Jr Asst Manager 1.0 1.0 .0 2.0
50.0% 50.0% .0% 100.0%
3.1% 5.9% .0% 3.2%
1.6% 1.6% .0% 3.2%
Junior Manager 5.0 2.0 3.0 10.0
50.0% 20.0% 30.0% 100.0%
15.6% 11.8% 23.1% 16.1%
8.1% 3.2% 4.8% 16.1%
Manager 2.0 3.0 1.0 6.0
33.3% 50.0% 16.7% 100.0%
6.3% 17.6% 7.7% 9.7%
3.2% 4.8% 1.6% 9.7%
Sr Assistant 9.0 3.0 2.0 14.0
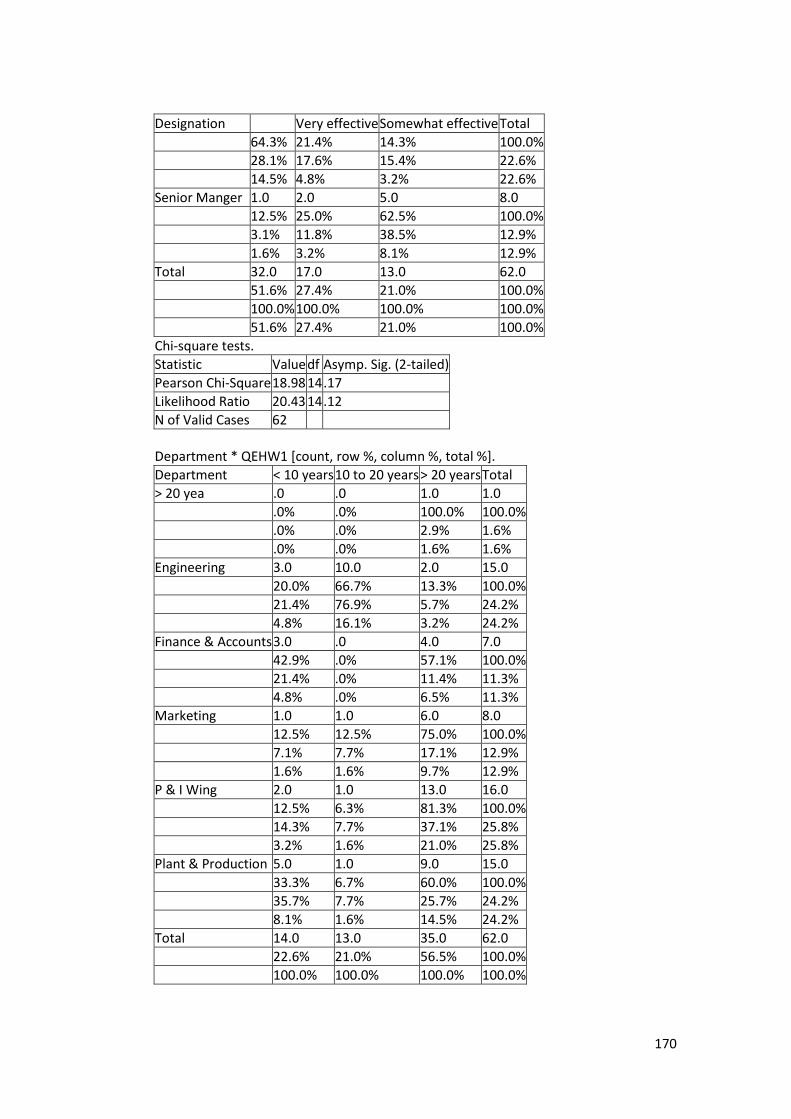
170
Designation Very effective Somewhat effective Total
64.3% 21.4% 14.3% 100.0%
28.1% 17.6% 15.4% 22.6%
14.5% 4.8% 3.2% 22.6%
Senior Manger 1.0 2.0 5.0 8.0
12.5% 25.0% 62.5% 100.0%
3.1% 11.8% 38.5% 12.9%
1.6% 3.2% 8.1% 12.9%
Total 32.0 17.0 13.0 62.0
51.6% 27.4% 21.0% 100.0%
100.0% 100.0% 100.0% 100.0%
51.6% 27.4% 21.0% 100.0%
Chi-square tests.
Statistic Value df Asymp. Sig. (2-tailed)
Pearson Chi-Square 18.98 14 .17
Likelihood Ratio 20.43 14 .12
N of Valid Cases 62
Department * QEHW1 [count, row %, column %, total %].
Department < 10 years 10 to 20 years > 20 years Total
> 20 yea .0 .0 1.0 1.0
.0% .0% 100.0% 100.0%
.0% .0% 2.9% 1.6%
.0% .0% 1.6% 1.6%
Engineering 3.0 10.0 2.0 15.0
20.0% 66.7% 13.3% 100.0%
21.4% 76.9% 5.7% 24.2%
4.8% 16.1% 3.2% 24.2%
Finance & Accounts 3.0 .0 4.0 7.0
42.9% .0% 57.1% 100.0%
21.4% .0% 11.4% 11.3%
4.8% .0% 6.5% 11.3%
Marketing 1.0 1.0 6.0 8.0
12.5% 12.5% 75.0% 100.0%
7.1% 7.7% 17.1% 12.9%
1.6% 1.6% 9.7% 12.9%
P & I Wing 2.0 1.0 13.0 16.0
12.5% 6.3% 81.3% 100.0%
14.3% 7.7% 37.1% 25.8%
3.2% 1.6% 21.0% 25.8%
Plant & Production 5.0 1.0 9.0 15.0
33.3% 6.7% 60.0% 100.0%
35.7% 7.7% 25.7% 24.2%
8.1% 1.6% 14.5% 24.2%
Total 14.0 13.0 35.0 62.0
22.6% 21.0% 56.5% 100.0%
100.0% 100.0% 100.0% 100.0%
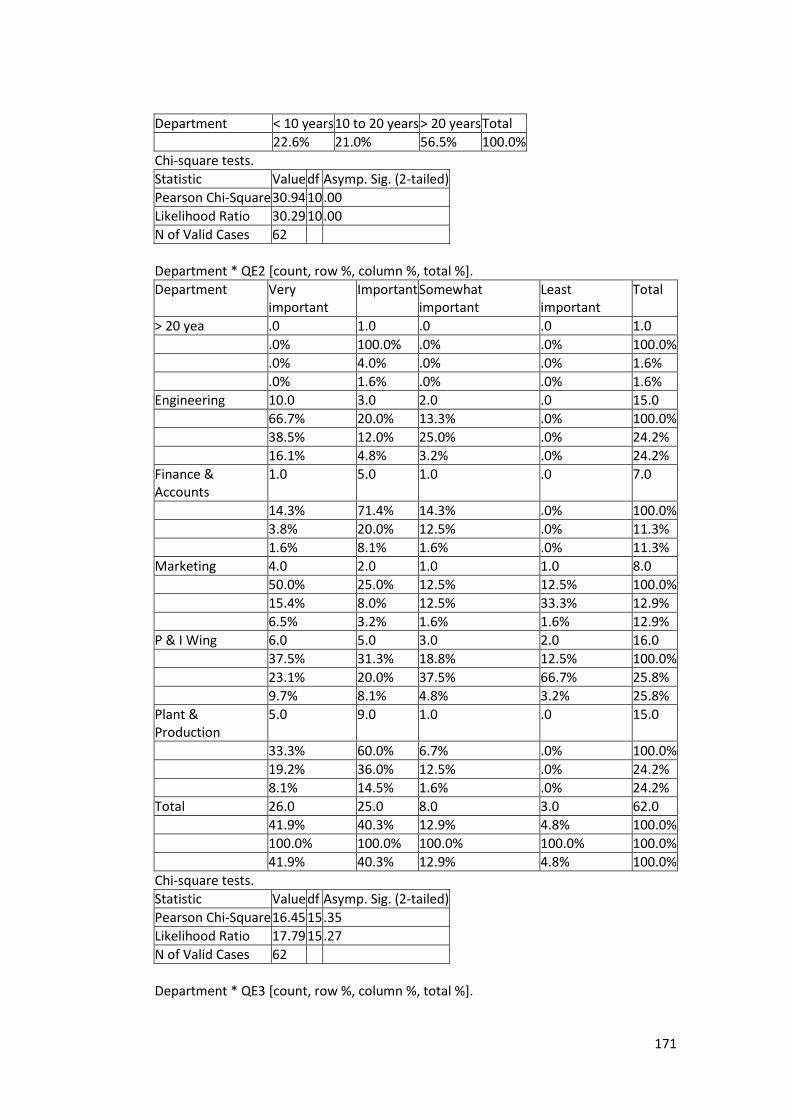
171
Department < 10 years 10 to 20 years > 20 years Total
22.6% 21.0% 56.5% 100.0%
Chi-square tests.
Statistic Value df Asymp. Sig. (2-tailed)
Pearson Chi-Square 30.94 10 .00
Likelihood Ratio 30.29 10 .00
N of Valid Cases 62
Department * QE2 [count, row %, column %, total %].
Department Very important
Important Somewhat important
Least important
Total
> 20 yea .0 1.0 .0 .0 1.0
.0% 100.0% .0% .0% 100.0%
.0% 4.0% .0% .0% 1.6%
.0% 1.6% .0% .0% 1.6%
Engineering 10.0 3.0 2.0 .0 15.0
66.7% 20.0% 13.3% .0% 100.0%
38.5% 12.0% 25.0% .0% 24.2%
16.1% 4.8% 3.2% .0% 24.2%
Finance & Accounts
1.0 5.0 1.0 .0 7.0
14.3% 71.4% 14.3% .0% 100.0%
3.8% 20.0% 12.5% .0% 11.3%
1.6% 8.1% 1.6% .0% 11.3%
Marketing 4.0 2.0 1.0 1.0 8.0
50.0% 25.0% 12.5% 12.5% 100.0%
15.4% 8.0% 12.5% 33.3% 12.9%
6.5% 3.2% 1.6% 1.6% 12.9%
P & I Wing 6.0 5.0 3.0 2.0 16.0
37.5% 31.3% 18.8% 12.5% 100.0%
23.1% 20.0% 37.5% 66.7% 25.8%
9.7% 8.1% 4.8% 3.2% 25.8%
Plant & Production
5.0 9.0 1.0 .0 15.0
33.3% 60.0% 6.7% .0% 100.0%
19.2% 36.0% 12.5% .0% 24.2%
8.1% 14.5% 1.6% .0% 24.2%
Total 26.0 25.0 8.0 3.0 62.0
41.9% 40.3% 12.9% 4.8% 100.0%
100.0% 100.0% 100.0% 100.0% 100.0%
41.9% 40.3% 12.9% 4.8% 100.0%
Chi-square tests.
Statistic Value df Asymp. Sig. (2-tailed)
Pearson Chi-Square 16.45 15 .35
Likelihood Ratio 17.79 15 .27
N of Valid Cases 62
Department * QE3 [count, row %, column %, total %].
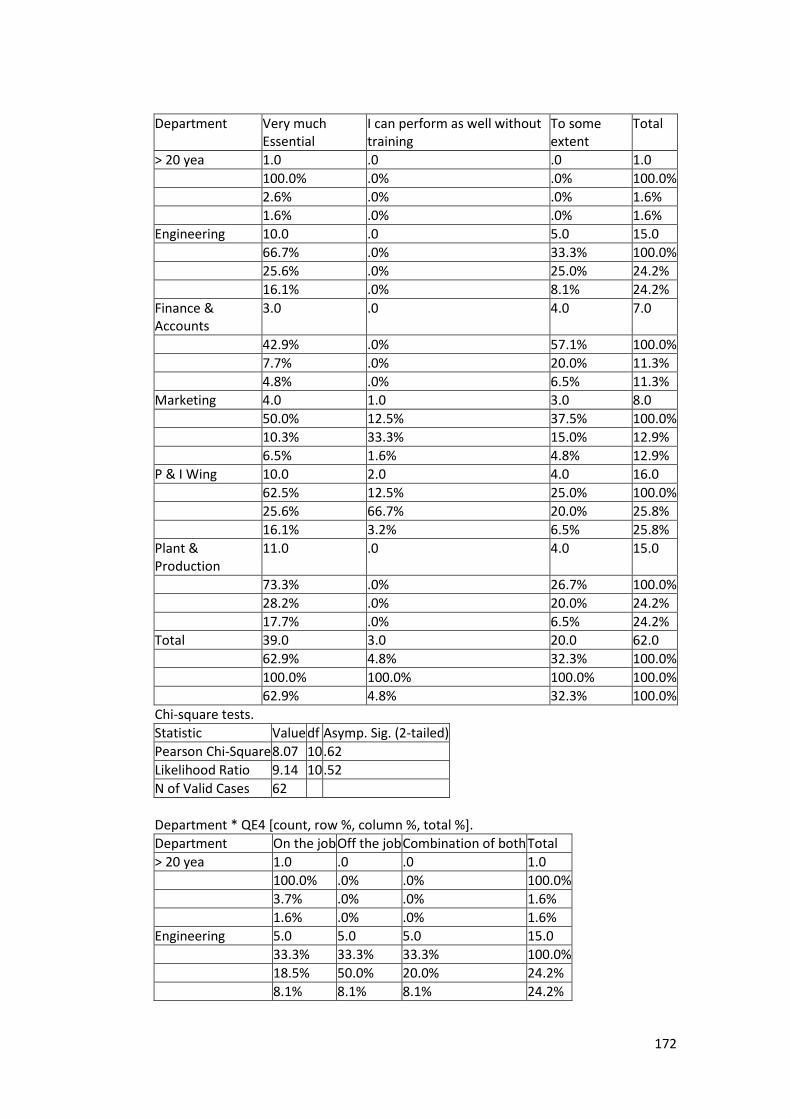
172
Department Very much Essential
I can perform as well without training
To some extent
Total
> 20 yea 1.0 .0 .0 1.0
100.0% .0% .0% 100.0%
2.6% .0% .0% 1.6%
1.6% .0% .0% 1.6%
Engineering 10.0 .0 5.0 15.0
66.7% .0% 33.3% 100.0%
25.6% .0% 25.0% 24.2%
16.1% .0% 8.1% 24.2%
Finance & Accounts
3.0 .0 4.0 7.0
42.9% .0% 57.1% 100.0%
7.7% .0% 20.0% 11.3%
4.8% .0% 6.5% 11.3%
Marketing 4.0 1.0 3.0 8.0
50.0% 12.5% 37.5% 100.0%
10.3% 33.3% 15.0% 12.9%
6.5% 1.6% 4.8% 12.9%
P & I Wing 10.0 2.0 4.0 16.0
62.5% 12.5% 25.0% 100.0%
25.6% 66.7% 20.0% 25.8%
16.1% 3.2% 6.5% 25.8%
Plant & Production
11.0 .0 4.0 15.0
73.3% .0% 26.7% 100.0%
28.2% .0% 20.0% 24.2%
17.7% .0% 6.5% 24.2%
Total 39.0 3.0 20.0 62.0
62.9% 4.8% 32.3% 100.0%
100.0% 100.0% 100.0% 100.0%
62.9% 4.8% 32.3% 100.0%
Chi-square tests.
Statistic Value df Asymp. Sig. (2-tailed)
Pearson Chi-Square 8.07 10 .62
Likelihood Ratio 9.14 10 .52
N of Valid Cases 62
Department * QE4 [count, row %, column %, total %].
Department On the job Off the job Combination of both Total
> 20 yea 1.0 .0 .0 1.0
100.0% .0% .0% 100.0%
3.7% .0% .0% 1.6%
1.6% .0% .0% 1.6%
Engineering 5.0 5.0 5.0 15.0
33.3% 33.3% 33.3% 100.0%
18.5% 50.0% 20.0% 24.2%
8.1% 8.1% 8.1% 24.2%

173
Department On the job Off the job Combination of both Total
Finance & Accounts 4.0 .0 3.0 7.0
57.1% .0% 42.9% 100.0%
14.8% .0% 12.0% 11.3%
6.5% .0% 4.8% 11.3%
Marketing 5.0 .0 3.0 8.0
62.5% .0% 37.5% 100.0%
18.5% .0% 12.0% 12.9%
8.1% .0% 4.8% 12.9%
P & I Wing 5.0 3.0 8.0 16.0
31.3% 18.8% 50.0% 100.0%
18.5% 30.0% 32.0% 25.8%
8.1% 4.8% 12.9% 25.8%
Plant & Production 7.0 2.0 6.0 15.0
46.7% 13.3% 40.0% 100.0%
25.9% 20.0% 24.0% 24.2%
11.3% 3.2% 9.7% 24.2%
Total 27.0 10.0 25.0 62.0
43.5% 16.1% 40.3% 100.0%
100.0% 100.0% 100.0% 100.0%
43.5% 16.1% 40.3% 100.0%
Chi-square tests.
Statistic Value df Asymp. Sig. (2-tailed)
Pearson Chi-Square 9.10 10 .52
Likelihood Ratio 11.20 10 .34
N of Valid Cases 62
Department * QE5 [count, row %, column %, total %].
Department On the job Away from work Combination of both Total
> 20 yea 1.0 .0 .0 1.0
100.0% .0% .0% 100.0%
3.8% .0% .0% 1.6%
1.6% .0% .0% 1.6%
Engineering 2.0 4.0 9.0 15.0
13.3% 26.7% 60.0% 100.0%
7.7% 33.3% 37.5% 24.2%
3.2% 6.5% 14.5% 24.2%
Finance & Accounts 3.0 .0 4.0 7.0
42.9% .0% 57.1% 100.0%
11.5% .0% 16.7% 11.3%
4.8% .0% 6.5% 11.3%
Marketing 3.0 2.0 3.0 8.0
37.5% 25.0% 37.5% 100.0%
11.5% 16.7% 12.5% 12.9%
4.8% 3.2% 4.8% 12.9%
P & I Wing 7.0 4.0 5.0 16.0
43.8% 25.0% 31.3% 100.0%
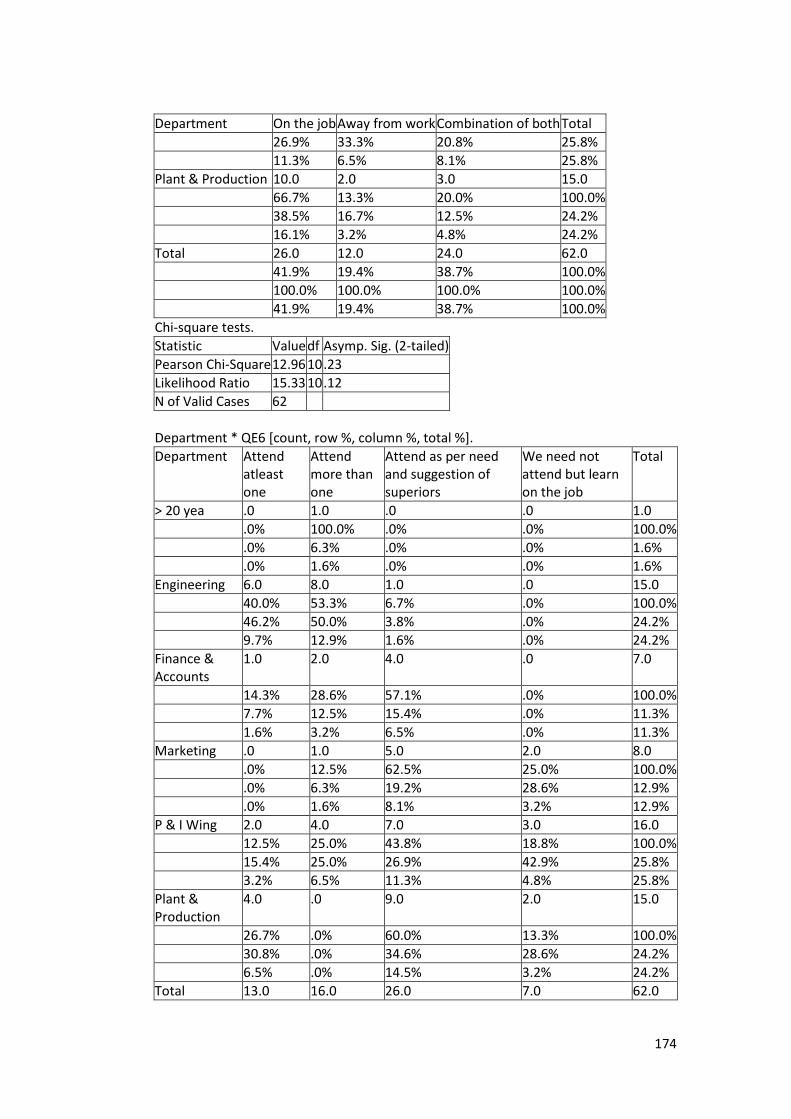
174
Department On the job Away from work Combination of both Total
26.9% 33.3% 20.8% 25.8%
11.3% 6.5% 8.1% 25.8%
Plant & Production 10.0 2.0 3.0 15.0
66.7% 13.3% 20.0% 100.0%
38.5% 16.7% 12.5% 24.2%
16.1% 3.2% 4.8% 24.2%
Total 26.0 12.0 24.0 62.0
41.9% 19.4% 38.7% 100.0%
100.0% 100.0% 100.0% 100.0%
41.9% 19.4% 38.7% 100.0%
Chi-square tests.
Statistic Value df Asymp. Sig. (2-tailed)
Pearson Chi-Square 12.96 10 .23
Likelihood Ratio 15.33 10 .12
N of Valid Cases 62
Department * QE6 [count, row %, column %, total %].
Department Attend atleast one
Attend more than one
Attend as per need and suggestion of superiors
We need not attend but learn on the job
Total
> 20 yea .0 1.0 .0 .0 1.0
.0% 100.0% .0% .0% 100.0%
.0% 6.3% .0% .0% 1.6%
.0% 1.6% .0% .0% 1.6%
Engineering 6.0 8.0 1.0 .0 15.0
40.0% 53.3% 6.7% .0% 100.0%
46.2% 50.0% 3.8% .0% 24.2%
9.7% 12.9% 1.6% .0% 24.2%
Finance & Accounts
1.0 2.0 4.0 .0 7.0
14.3% 28.6% 57.1% .0% 100.0%
7.7% 12.5% 15.4% .0% 11.3%
1.6% 3.2% 6.5% .0% 11.3%
Marketing .0 1.0 5.0 2.0 8.0
.0% 12.5% 62.5% 25.0% 100.0%
.0% 6.3% 19.2% 28.6% 12.9%
.0% 1.6% 8.1% 3.2% 12.9%
P & I Wing 2.0 4.0 7.0 3.0 16.0
12.5% 25.0% 43.8% 18.8% 100.0%
15.4% 25.0% 26.9% 42.9% 25.8%
3.2% 6.5% 11.3% 4.8% 25.8%
Plant & Production
4.0 .0 9.0 2.0 15.0
26.7% .0% 60.0% 13.3% 100.0%
30.8% .0% 34.6% 28.6% 24.2%
6.5% .0% 14.5% 3.2% 24.2%
Total 13.0 16.0 26.0 7.0 62.0

175
Department Attend atleast one
Attend more than one
Attend as per need and suggestion of superiors
We need not attend but learn on the job
Total
21.0% 25.8% 41.9% 11.3% 100.0%
100.0% 100.0% 100.0% 100.0% 100.0%
21.0% 25.8% 41.9% 11.3% 100.0%
Chi-square tests.
Statistic Value df Asymp. Sig. (2-tailed)
Pearson Chi-Square 28.40 15 .02
Likelihood Ratio 36.58 15 .00
N of Valid Cases 62
Department * QE7 [count, row %, column %, total %].
Department 1 Week 2 Weeks 4 Weeks Total
> 20 yea .0 .0 1.0 1.0
.0% .0% 100.0% 100.0%
.0% .0% 8.3% 1.6%
.0% .0% 1.6% 1.6%
Engineering 2.0 9.0 4.0 15.0
13.3% 60.0% 26.7% 100.0%
6.9% 42.9% 33.3% 24.2%
3.2% 14.5% 6.5% 24.2%
Finance & Accounts 3.0 1.0 3.0 7.0
42.9% 14.3% 42.9% 100.0%
10.3% 4.8% 25.0% 11.3%
4.8% 1.6% 4.8% 11.3%
Marketing 4.0 4.0 .0 8.0
50.0% 50.0% .0% 100.0%
13.8% 19.0% .0% 12.9%
6.5% 6.5% .0% 12.9%
P & I Wing 11.0 3.0 2.0 16.0
68.8% 18.8% 12.5% 100.0%
37.9% 14.3% 16.7% 25.8%
17.7% 4.8% 3.2% 25.8%
Plant & Production 9.0 4.0 2.0 15.0
60.0% 26.7% 13.3% 100.0%
31.0% 19.0% 16.7% 24.2%
14.5% 6.5% 3.2% 24.2%
Total 29.0 21.0 12.0 62.0
46.8% 33.9% 19.4% 100.0%
100.0% 100.0% 100.0% 100.0%
46.8% 33.9% 19.4% 100.0%
Chi-square tests.
Statistic Value df Asymp. Sig. (2-tailed)
Pearson Chi-Square 20.38 10 .03
Likelihood Ratio 21.54 10 .02
N of Valid Cases 62

176
Department * QE8 [count, row %, column %, total %].
Department Interpersonal Personal External No problem Total
> 20 yea 1.0 .0 .0 .0 1.0
100.0% .0% .0% .0% 100.0%
25.0% .0% .0% .0% 1.6%
1.6% .0% .0% .0% 1.6%
Engineering 1.0 6.0 7.0 1.0 15.0
6.7% 40.0% 46.7% 6.7% 100.0%
25.0% 46.2% 50.0% 3.2% 24.2%
1.6% 9.7% 11.3% 1.6% 24.2%
Finance & Accounts .0 1.0 2.0 4.0 7.0
.0% 14.3% 28.6% 57.1% 100.0%
.0% 7.7% 14.3% 12.9% 11.3%
.0% 1.6% 3.2% 6.5% 11.3%
Marketing .0 1.0 .0 7.0 8.0
.0% 12.5% .0% 87.5% 100.0%
.0% 7.7% .0% 22.6% 12.9%
.0% 1.6% .0% 11.3% 12.9%
P & I Wing 2.0 2.0 1.0 11.0 16.0
12.5% 12.5% 6.3% 68.8% 100.0%
50.0% 15.4% 7.1% 35.5% 25.8%
3.2% 3.2% 1.6% 17.7% 25.8%
Plant & Production .0 3.0 4.0 8.0 15.0
.0% 20.0% 26.7% 53.3% 100.0%
.0% 23.1% 28.6% 25.8% 24.2%
.0% 4.8% 6.5% 12.9% 24.2%
Total 4.0 13.0 14.0 31.0 62.0
6.5% 21.0% 22.6% 50.0% 100.0%
100.0% 100.0% 100.0% 100.0% 100.0%
6.5% 21.0% 22.6% 50.0% 100.0%
Chi-square tests.
Statistic Value df Asymp. Sig. (2-tailed)
Pearson Chi-Square 37.80 15 .00
Likelihood Ratio 34.57 15 .00
N of Valid Cases 62
Department * QE9 [count, row %, column %, total %].
Department Strongly agree Agree Somewhat agree Disagree Total
> 20 yea .0 1.0 .0 .0 1.0
.0% 100.0% .0% .0% 100.0%
.0% 2.4% .0% .0% 1.6%
.0% 1.6% .0% .0% 1.6%
Engineering 7.0 7.0 1.0 .0 15.0
46.7% 46.7% 6.7% .0% 100.0%
58.3% 17.1% 20.0% .0% 24.2%
11.3% 11.3% 1.6% .0% 24.2%
Finance & Accounts .0 5.0 2.0 .0 7.0
.0% 71.4% 28.6% .0% 100.0%
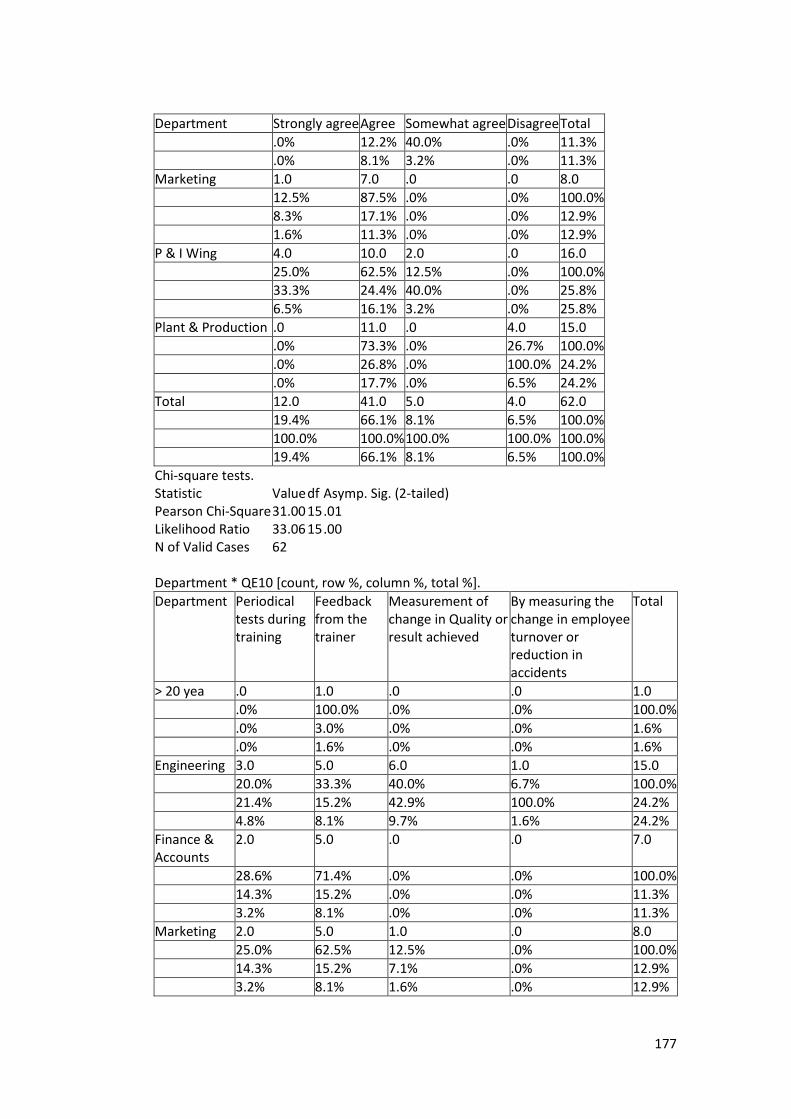
177
Department Strongly agree Agree Somewhat agree Disagree Total
.0% 12.2% 40.0% .0% 11.3%
.0% 8.1% 3.2% .0% 11.3%
Marketing 1.0 7.0 .0 .0 8.0
12.5% 87.5% .0% .0% 100.0%
8.3% 17.1% .0% .0% 12.9%
1.6% 11.3% .0% .0% 12.9%
P & I Wing 4.0 10.0 2.0 .0 16.0
25.0% 62.5% 12.5% .0% 100.0%
33.3% 24.4% 40.0% .0% 25.8%
6.5% 16.1% 3.2% .0% 25.8%
Plant & Production .0 11.0 .0 4.0 15.0
.0% 73.3% .0% 26.7% 100.0%
.0% 26.8% .0% 100.0% 24.2%
.0% 17.7% .0% 6.5% 24.2%
Total 12.0 41.0 5.0 4.0 62.0
19.4% 66.1% 8.1% 6.5% 100.0%
100.0% 100.0% 100.0% 100.0% 100.0%
19.4% 66.1% 8.1% 6.5% 100.0%
Chi-square tests. Statistic Value df Asymp. Sig. (2-tailed) Pearson Chi-Square 31.00 15 .01 Likelihood Ratio 33.06 15 .00 N of Valid Cases 62 Department * QE10 [count, row %, column %, total %].
Department Periodical tests during training
Feedback from the trainer
Measurement of change in Quality or result achieved
By measuring the change in employee turnover or reduction in accidents
Total
> 20 yea .0 1.0 .0 .0 1.0
.0% 100.0% .0% .0% 100.0%
.0% 3.0% .0% .0% 1.6%
.0% 1.6% .0% .0% 1.6%
Engineering 3.0 5.0 6.0 1.0 15.0
20.0% 33.3% 40.0% 6.7% 100.0%
21.4% 15.2% 42.9% 100.0% 24.2%
4.8% 8.1% 9.7% 1.6% 24.2%
Finance & Accounts
2.0 5.0 .0 .0 7.0
28.6% 71.4% .0% .0% 100.0%
14.3% 15.2% .0% .0% 11.3%
3.2% 8.1% .0% .0% 11.3%
Marketing 2.0 5.0 1.0 .0 8.0
25.0% 62.5% 12.5% .0% 100.0%
14.3% 15.2% 7.1% .0% 12.9%
3.2% 8.1% 1.6% .0% 12.9%

178
Department Periodical tests during training
Feedback from the trainer
Measurement of change in Quality or result achieved
By measuring the change in employee turnover or reduction in accidents
Total
P & I Wing 6.0 7.0 3.0 .0 16.0
37.5% 43.8% 18.8% .0% 100.0%
42.9% 21.2% 21.4% .0% 25.8%
9.7% 11.3% 4.8% .0% 25.8%
Plant & Production
1.0 10.0 4.0 .0 15.0
6.7% 66.7% 26.7% .0% 100.0%
7.1% 30.3% 28.6% .0% 24.2%
1.6% 16.1% 6.5% .0% 24.2%
Total 14.0 33.0 14.0 1.0 62.0
22.6% 53.2% 22.6% 1.6% 100.0%
100.0% 100.0% 100.0% 100.0% 100.0%
22.6% 53.2% 22.6% 1.6% 100.0%
Chi-square tests.
Statistic Value df Asymp. Sig. (2-tailed)
Pearson Chi-Square 14.06 15 .52
Likelihood Ratio 15.89 15 .39
N of Valid Cases 62
Department * QE11 [count, row %, column %, total %].
Department Good Average Poor Total
> 20 yea 1.0 .0 .0 1.0
100.0% .0% .0% 100.0%
3.0% .0% .0% 1.6%
1.6% .0% .0% 1.6%
Engineering 7.0 7.0 1.0 15.0
46.7% 46.7% 6.7% 100.0%
21.2% 28.0% 25.0% 24.2%
11.3% 11.3% 1.6% 24.2%
Finance & Accounts 5.0 2.0 .0 7.0
71.4% 28.6% .0% 100.0%
15.2% 8.0% .0% 11.3%
8.1% 3.2% .0% 11.3%
Marketing 5.0 3.0 .0 8.0
62.5% 37.5% .0% 100.0%
15.2% 12.0% .0% 12.9%
8.1% 4.8% .0% 12.9%
P & I Wing 8.0 6.0 2.0 16.0
50.0% 37.5% 12.5% 100.0%
24.2% 24.0% 50.0% 25.8%
12.9% 9.7% 3.2% 25.8%
Plant & Production 7.0 7.0 1.0 15.0
46.7% 46.7% 6.7% 100.0%

179
Department Good Average Poor Total
21.2% 28.0% 25.0% 24.2%
11.3% 11.3% 1.6% 24.2%
Total 33.0 25.0 4.0 62.0
53.2% 40.3% 6.5% 100.0%
100.0% 100.0% 100.0% 100.0%
53.2% 40.3% 6.5% 100.0%
Chi-square tests.
Statistic Value df Asymp. Sig. (2-tailed)
Pearson Chi-Square 4.18 10 .94
Likelihood Ratio 5.31 10 .87
N of Valid Cases 62
Department * QE12 [count, row %, column %, total %].
Department Promotion More responsibility
They consider a request for transfer
Job rotation or change of department
Total
> 20 yea .0 1.0 .0 .0 .0 1.0
.0% 100.0% .0% .0% .0% 100.0%
.0% 7.7% .0% .0% .0% 1.6%
.0% 1.6% .0% .0% .0% 1.6%
Engineering .0 5.0 9.0 .0 1.0 15.0
.0% 33.3% 60.0% .0% 6.7% 100.0%
.0% 38.5% 33.3% .0% 5.3% 24.2%
.0% 8.1% 14.5% .0% 1.6% 24.2%
Finance & Accounts
.0 .0 5.0 .0 2.0 7.0
.0% .0% 71.4% .0% 28.6% 100.0%
.0% .0% 18.5% .0% 10.5% 11.3%
.0% .0% 8.1% .0% 3.2% 11.3%
Marketing 1.0 1.0 .0 1.0 5.0 8.0
12.5% 12.5% .0% 12.5% 62.5% 100.0%
100.0% 7.7% .0% 50.0% 26.3% 12.9%
1.6% 1.6% .0% 1.6% 8.1% 12.9%
P & I Wing .0 4.0 6.0 1.0 5.0 16.0
.0% 25.0% 37.5% 6.3% 31.3% 100.0%
.0% 30.8% 22.2% 50.0% 26.3% 25.8%
.0% 6.5% 9.7% 1.6% 8.1% 25.8%
Plant & Production
.0 2.0 7.0 .0 6.0 15.0
.0% 13.3% 46.7% .0% 40.0% 100.0%
.0% 15.4% 25.9% .0% 31.6% 24.2%
.0% 3.2% 11.3% .0% 9.7% 24.2%
Total 1.0 13.0 27.0 2.0 19.0 62.0
1.6% 21.0% 43.5% 3.2% 30.6% 100.0%
100.0% 100.0% 100.0% 100.0% 100.0% 100.0%
1.6% 21.0% 43.5% 3.2% 30.6% 100.0%
Chi-square tests.
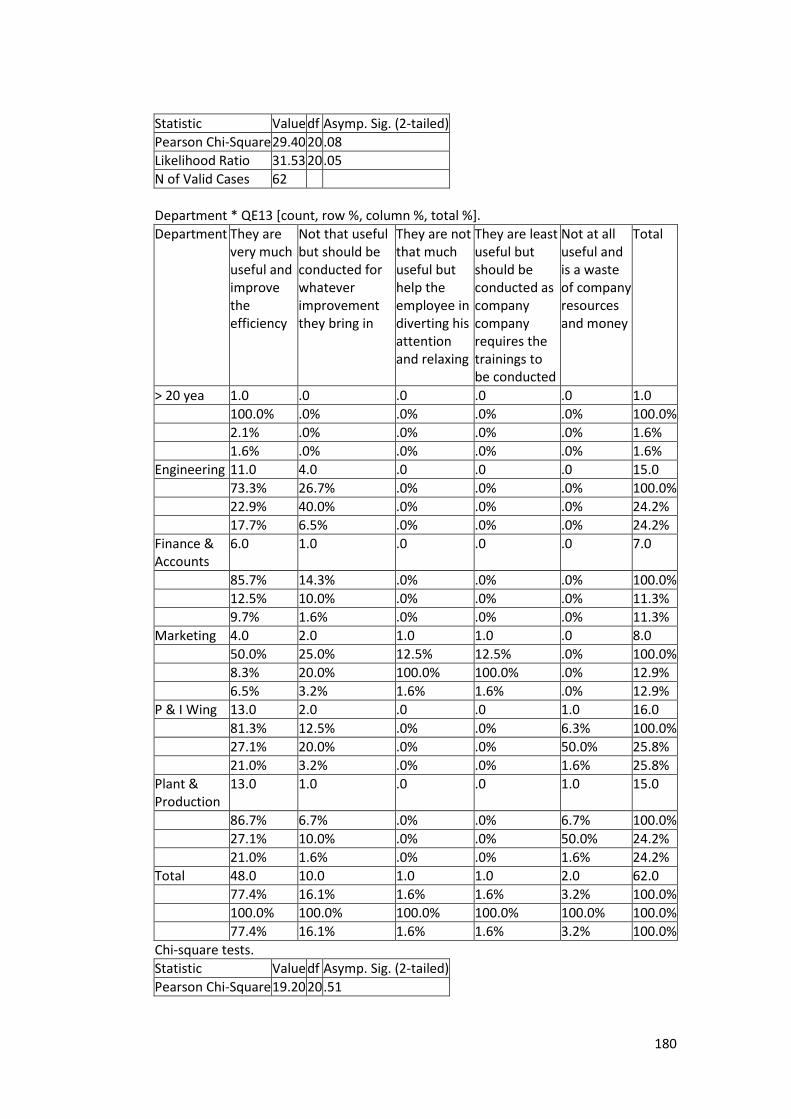
180
Statistic Value df Asymp. Sig. (2-tailed)
Pearson Chi-Square 29.40 20 .08
Likelihood Ratio 31.53 20 .05
N of Valid Cases 62
Department * QE13 [count, row %, column %, total %].
Department They are very much useful and improve the efficiency
Not that useful but should be conducted for whatever improvement they bring in
They are not that much useful but help the employee in diverting his attention and relaxing
They are least useful but should be conducted as company company requires the trainings to be conducted
Not at all useful and is a waste of company resources and money
Total
> 20 yea 1.0 .0 .0 .0 .0 1.0
100.0% .0% .0% .0% .0% 100.0%
2.1% .0% .0% .0% .0% 1.6%
1.6% .0% .0% .0% .0% 1.6%
Engineering 11.0 4.0 .0 .0 .0 15.0
73.3% 26.7% .0% .0% .0% 100.0%
22.9% 40.0% .0% .0% .0% 24.2%
17.7% 6.5% .0% .0% .0% 24.2%
Finance & Accounts
6.0 1.0 .0 .0 .0 7.0
85.7% 14.3% .0% .0% .0% 100.0%
12.5% 10.0% .0% .0% .0% 11.3%
9.7% 1.6% .0% .0% .0% 11.3%
Marketing 4.0 2.0 1.0 1.0 .0 8.0
50.0% 25.0% 12.5% 12.5% .0% 100.0%
8.3% 20.0% 100.0% 100.0% .0% 12.9%
6.5% 3.2% 1.6% 1.6% .0% 12.9%
P & I Wing 13.0 2.0 .0 .0 1.0 16.0
81.3% 12.5% .0% .0% 6.3% 100.0%
27.1% 20.0% .0% .0% 50.0% 25.8%
21.0% 3.2% .0% .0% 1.6% 25.8%
Plant & Production
13.0 1.0 .0 .0 1.0 15.0
86.7% 6.7% .0% .0% 6.7% 100.0%
27.1% 10.0% .0% .0% 50.0% 24.2%
21.0% 1.6% .0% .0% 1.6% 24.2%
Total 48.0 10.0 1.0 1.0 2.0 62.0
77.4% 16.1% 1.6% 1.6% 3.2% 100.0%
100.0% 100.0% 100.0% 100.0% 100.0% 100.0%
77.4% 16.1% 1.6% 1.6% 3.2% 100.0%
Chi-square tests.
Statistic Value df Asymp. Sig. (2-tailed)
Pearson Chi-Square 19.20 20 .51
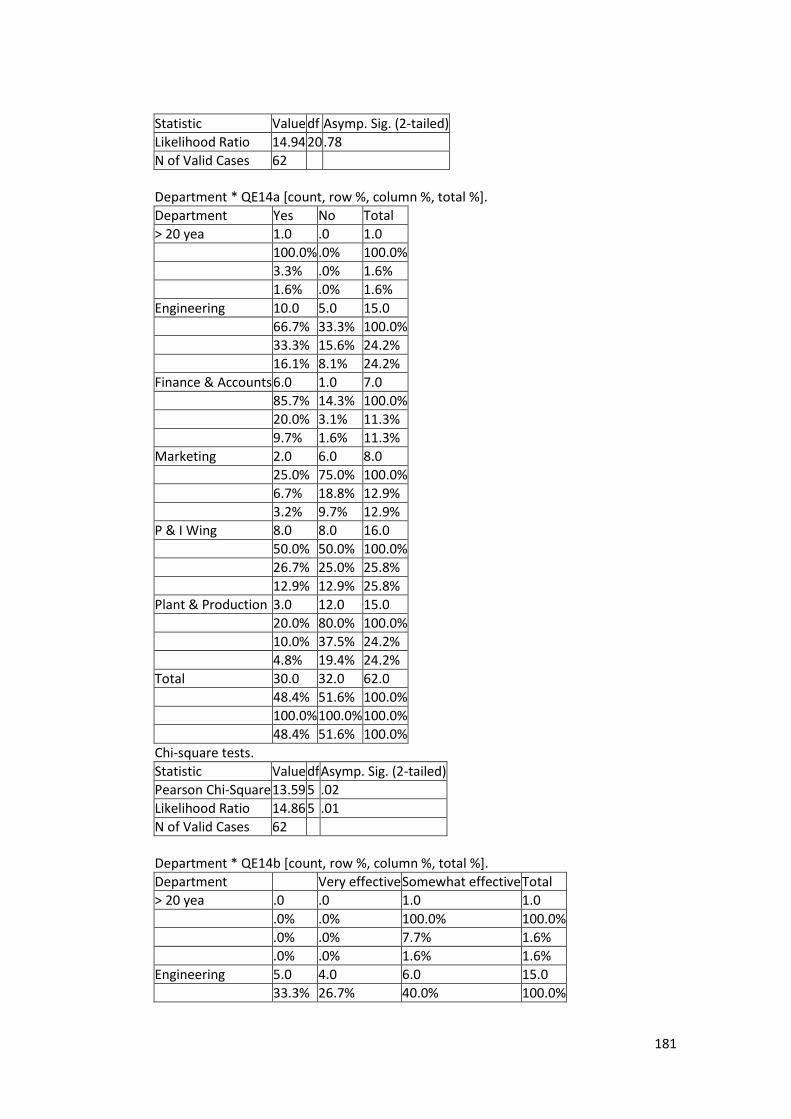
181
Statistic Value df Asymp. Sig. (2-tailed)
Likelihood Ratio 14.94 20 .78
N of Valid Cases 62
Department * QE14a [count, row %, column %, total %].
Department Yes No Total
> 20 yea 1.0 .0 1.0
100.0% .0% 100.0%
3.3% .0% 1.6%
1.6% .0% 1.6%
Engineering 10.0 5.0 15.0
66.7% 33.3% 100.0%
33.3% 15.6% 24.2%
16.1% 8.1% 24.2%
Finance & Accounts 6.0 1.0 7.0
85.7% 14.3% 100.0%
20.0% 3.1% 11.3%
9.7% 1.6% 11.3%
Marketing 2.0 6.0 8.0
25.0% 75.0% 100.0%
6.7% 18.8% 12.9%
3.2% 9.7% 12.9%
P & I Wing 8.0 8.0 16.0
50.0% 50.0% 100.0%
26.7% 25.0% 25.8%
12.9% 12.9% 25.8%
Plant & Production 3.0 12.0 15.0
20.0% 80.0% 100.0%
10.0% 37.5% 24.2%
4.8% 19.4% 24.2%
Total 30.0 32.0 62.0
48.4% 51.6% 100.0%
100.0% 100.0% 100.0%
48.4% 51.6% 100.0%
Chi-square tests.
Statistic Value df Asymp. Sig. (2-tailed)
Pearson Chi-Square 13.59 5 .02
Likelihood Ratio 14.86 5 .01
N of Valid Cases 62
Department * QE14b [count, row %, column %, total %].
Department Very effective Somewhat effective Total
> 20 yea .0 .0 1.0 1.0
.0% .0% 100.0% 100.0%
.0% .0% 7.7% 1.6%
.0% .0% 1.6% 1.6%
Engineering 5.0 4.0 6.0 15.0
33.3% 26.7% 40.0% 100.0%
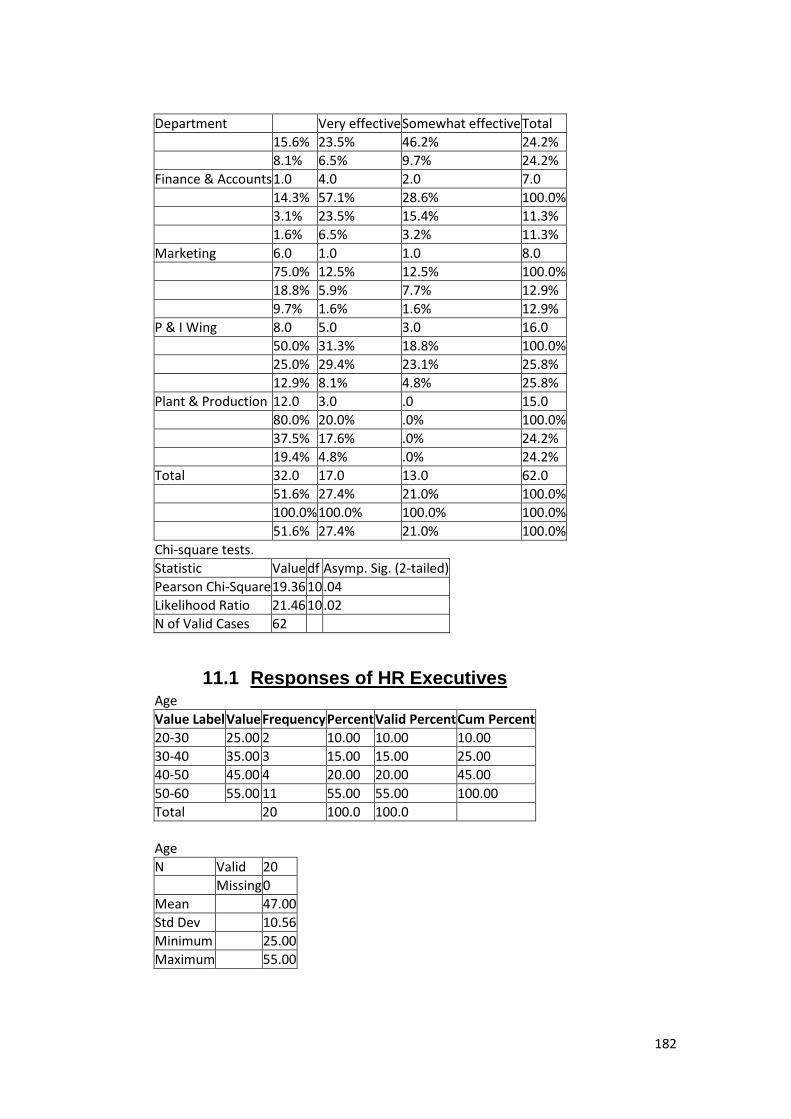
182
Department Very effective Somewhat effective Total
15.6% 23.5% 46.2% 24.2%
8.1% 6.5% 9.7% 24.2%
Finance & Accounts 1.0 4.0 2.0 7.0
14.3% 57.1% 28.6% 100.0%
3.1% 23.5% 15.4% 11.3%
1.6% 6.5% 3.2% 11.3%
Marketing 6.0 1.0 1.0 8.0
75.0% 12.5% 12.5% 100.0%
18.8% 5.9% 7.7% 12.9%
9.7% 1.6% 1.6% 12.9%
P & I Wing 8.0 5.0 3.0 16.0
50.0% 31.3% 18.8% 100.0%
25.0% 29.4% 23.1% 25.8%
12.9% 8.1% 4.8% 25.8%
Plant & Production 12.0 3.0 .0 15.0
80.0% 20.0% .0% 100.0%
37.5% 17.6% .0% 24.2%
19.4% 4.8% .0% 24.2%
Total 32.0 17.0 13.0 62.0
51.6% 27.4% 21.0% 100.0%
100.0% 100.0% 100.0% 100.0%
51.6% 27.4% 21.0% 100.0%
Chi-square tests.
Statistic Value df Asymp. Sig. (2-tailed)
Pearson Chi-Square 19.36 10 .04
Likelihood Ratio 21.46 10 .02
N of Valid Cases 62
11.1 Responses of HR Executives Age
Value Label Value Frequency Percent Valid Percent Cum Percent
20-30 25.00 2 10.00 10.00 10.00
30-40 35.00 3 15.00 15.00 25.00
40-50 45.00 4 20.00 20.00 45.00
50-60 55.00 11 55.00 55.00 100.00
Total 20 100.0 100.0
Age
N Valid 20
Missing 0
Mean 47.00
Std Dev 10.56
Minimum 25.00
Maximum 55.00

183
Gender
Value Label Value Frequency Percent Valid Percent Cum Percent
Female f 5 25.00 25.00 25.00
Male m 15 75.00 75.00 100.00
Total 20 100.0 100.0
Designation
Value Label Value Frequency Percent Valid Percent Cum Percent
Asst Manager am 4 20.00 20.00 20.00
Junior Assistant ja 3 15.00 15.00 35.00
Junior Manager jm 2 10.00 10.00 45.00
Manager m 3 15.00 15.00 60.00
Sr Assistant sa 6 30.00 30.00 90.00
Senior Manger sm 2 10.00 10.00 100.00
Total 20 100.0 100.0
Department
Value Label Value Frequency Percent Valid Percent Cum Percent
Human Resources hr 20 100.00 100.00 100.00
Total 20 100.0 100.0
How long have you been working for this company?
Value Label Value Frequency Percent Valid Percent Cum Percent
< 10 years a 3 15.00 15.00 15.00
10 to 20 years b 4 20.00 20.00 35.00
> 20 years c 13 65.00 65.00 100.00
Total 20 100.0 100.0
Do you think training is essential for improving the skills of the workers
Value Label Value Frequency Percent Valid Percent Cum Percent
Yes a 20 100.00 100.00 100.00
Total 20 100.0 100.0
If yes what type of training programme do you suggest?
Value Label Value Frequency Percent Valid Percent Cum Percent
Short term training a 13 65.00 65.00 65.00
Combination of both c 7 35.00 35.00 100.00
Total 20 100.0 100.0
How are training needs of the employees assessed?
Value Label Value Frequency Percent Valid Percent Cum Percent
Feedback from employees a 7 35.00 35.00 35.00
Requirement of sectional heads b 12 60.00 60.00 95.00
Schedule already prepared c 1 5.00 5.00 100.00
Total 20 100.0 100.0
Which category of employees is given more training in your organisation?
Value Label Value Frequency Percent Valid Percent Cum Percent

184
Value Label Value Frequency Percent Valid Percent Cum Percent
Operational a 3 15.00 15.00 15.00
Managerial b 7 35.00 35.00 50.00
Both c 10 50.00 50.00 100.00
Total 20 100.0 100.0
How many trainings did you conduct during the current year so far? For Executives
Value Label Value Frequency Percent Valid Percent Cum Percent
20 100.00 100.00 100.00
Total 20 100.0 100.0
How many trainings did you conduct during the current year so far? For workers
Value Label Value Frequency Percent Valid Percent Cum Percent
20 100.00 100.00 100.00
Total 20 100.0 100.0
Type of training method used in your organisation. Please tick the relevant
Value Label Value Frequency Percent Valid Percent Cum Percent
On the job a 16 80.00 80.00 80.00
Off the job b 3 15.00 15.00 95.00
A combination of both c 1 5.00 5.00 100.00
Total 20 100.0 100.0
Do the training programmes have any clearly laid out objectives to focus on?
Value Label Value Frequency Percent Valid Percent Cum Percent
Yes a 19 95.00 95.00 95.00
No b 1 5.00 5.00 100.00
Total 20 100.0 100.0
The extent to which the training objectives are met during the training session
Value Label Value Frequency Percent Valid Percent Cum Percent
All the objectives are met a 3 15.00 15.00 15.00
Most of the objectives are met b 5 25.00 25.00 40.00
Some of the objectives are met c 11 55.00 55.00 95.00
Not sure e 1 5.00 5.00 100.00
Total 20 100.0 100.0
Is there any incentive offered to attend the training programme (please specify)
Value Label Value Frequency Percent Valid Percent Cum Percent
20 100.00 100.00 100.00
Total 20 100.0 100.0
Who conducts your training programmes in your organization
Value Label Value Frequency Percent Valid Percent Cum Percent
External trainers a 6 30.00 30.00 30.00
In house trainers b 8 40.00 40.00 70.00
Combination of both c 6 30.00 30.00 100.00
Total 20 100.0 100.0
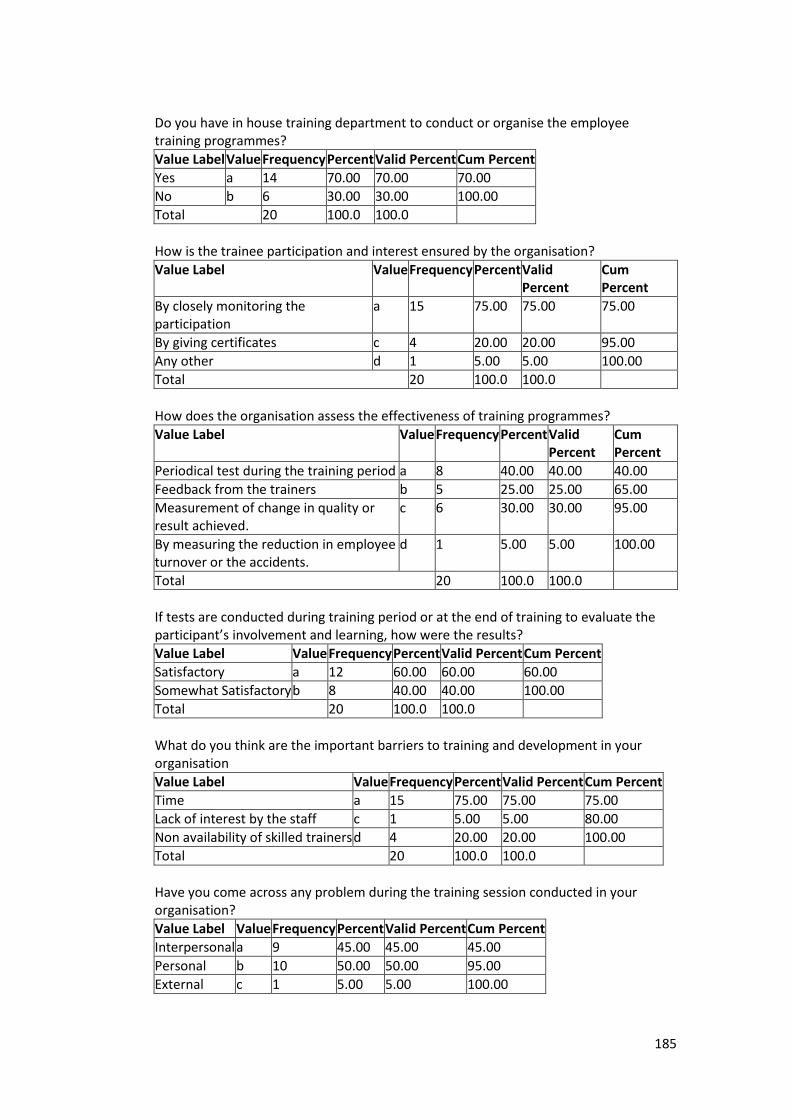
185
Do you have in house training department to conduct or organise the employee training programmes?
Value Label Value Frequency Percent Valid Percent Cum Percent
Yes a 14 70.00 70.00 70.00
No b 6 30.00 30.00 100.00
Total 20 100.0 100.0
How is the trainee participation and interest ensured by the organisation?
Value Label Value Frequency Percent Valid Percent
Cum Percent
By closely monitoring the participation
a 15 75.00 75.00 75.00
By giving certificates c 4 20.00 20.00 95.00
Any other d 1 5.00 5.00 100.00
Total 20 100.0 100.0
How does the organisation assess the effectiveness of training programmes?
Value Label Value Frequency Percent Valid Percent
Cum Percent
Periodical test during the training period a 8 40.00 40.00 40.00
Feedback from the trainers b 5 25.00 25.00 65.00
Measurement of change in quality or result achieved.
c 6 30.00 30.00 95.00
By measuring the reduction in employee turnover or the accidents.
d 1 5.00 5.00 100.00
Total 20 100.0 100.0
If tests are conducted during training period or at the end of training to evaluate the participant’s involvement and learning, how were the results?
Value Label Value Frequency Percent Valid Percent Cum Percent
Satisfactory a 12 60.00 60.00 60.00
Somewhat Satisfactory b 8 40.00 40.00 100.00
Total 20 100.0 100.0
What do you think are the important barriers to training and development in your organisation
Value Label Value Frequency Percent Valid Percent Cum Percent
Time a 15 75.00 75.00 75.00
Lack of interest by the staff c 1 5.00 5.00 80.00
Non availability of skilled trainers d 4 20.00 20.00 100.00
Total 20 100.0 100.0
Have you come across any problem during the training session conducted in your organisation?
Value Label Value Frequency Percent Valid Percent Cum Percent
Interpersonal a 9 45.00 45.00 45.00
Personal b 10 50.00 50.00 95.00
External c 1 5.00 5.00 100.00
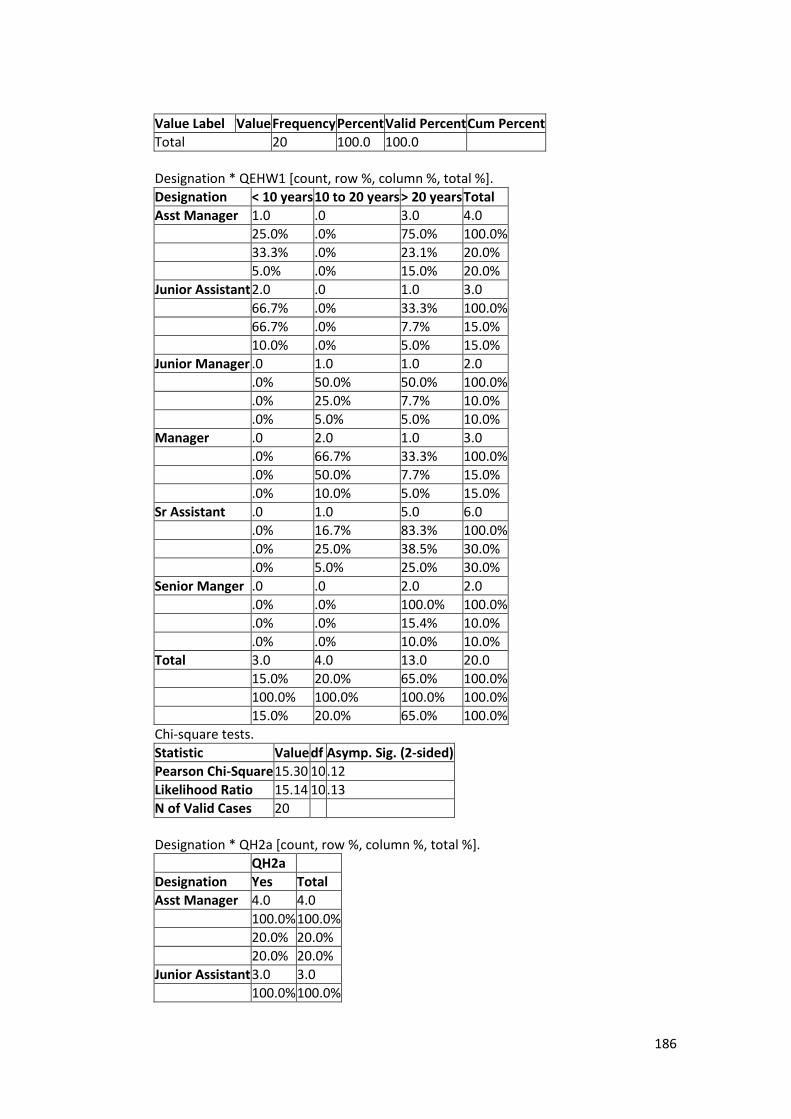
186
Value Label Value Frequency Percent Valid Percent Cum Percent
Total 20 100.0 100.0
Designation * QEHW1 [count, row %, column %, total %].
Designation < 10 years 10 to 20 years > 20 years Total
Asst Manager 1.0 .0 3.0 4.0
25.0% .0% 75.0% 100.0%
33.3% .0% 23.1% 20.0%
5.0% .0% 15.0% 20.0%
Junior Assistant 2.0 .0 1.0 3.0
66.7% .0% 33.3% 100.0%
66.7% .0% 7.7% 15.0%
10.0% .0% 5.0% 15.0%
Junior Manager .0 1.0 1.0 2.0
.0% 50.0% 50.0% 100.0%
.0% 25.0% 7.7% 10.0%
.0% 5.0% 5.0% 10.0%
Manager .0 2.0 1.0 3.0
.0% 66.7% 33.3% 100.0%
.0% 50.0% 7.7% 15.0%
.0% 10.0% 5.0% 15.0%
Sr Assistant .0 1.0 5.0 6.0
.0% 16.7% 83.3% 100.0%
.0% 25.0% 38.5% 30.0%
.0% 5.0% 25.0% 30.0%
Senior Manger .0 .0 2.0 2.0
.0% .0% 100.0% 100.0%
.0% .0% 15.4% 10.0%
.0% .0% 10.0% 10.0%
Total 3.0 4.0 13.0 20.0
15.0% 20.0% 65.0% 100.0%
100.0% 100.0% 100.0% 100.0%
15.0% 20.0% 65.0% 100.0%
Chi-square tests.
Statistic Value df Asymp. Sig. (2-sided)
Pearson Chi-Square 15.30 10 .12
Likelihood Ratio 15.14 10 .13
N of Valid Cases 20
Designation * QH2a [count, row %, column %, total %].
QH2a
Designation Yes Total
Asst Manager 4.0 4.0
100.0% 100.0%
20.0% 20.0%
20.0% 20.0%
Junior Assistant 3.0 3.0
100.0% 100.0%
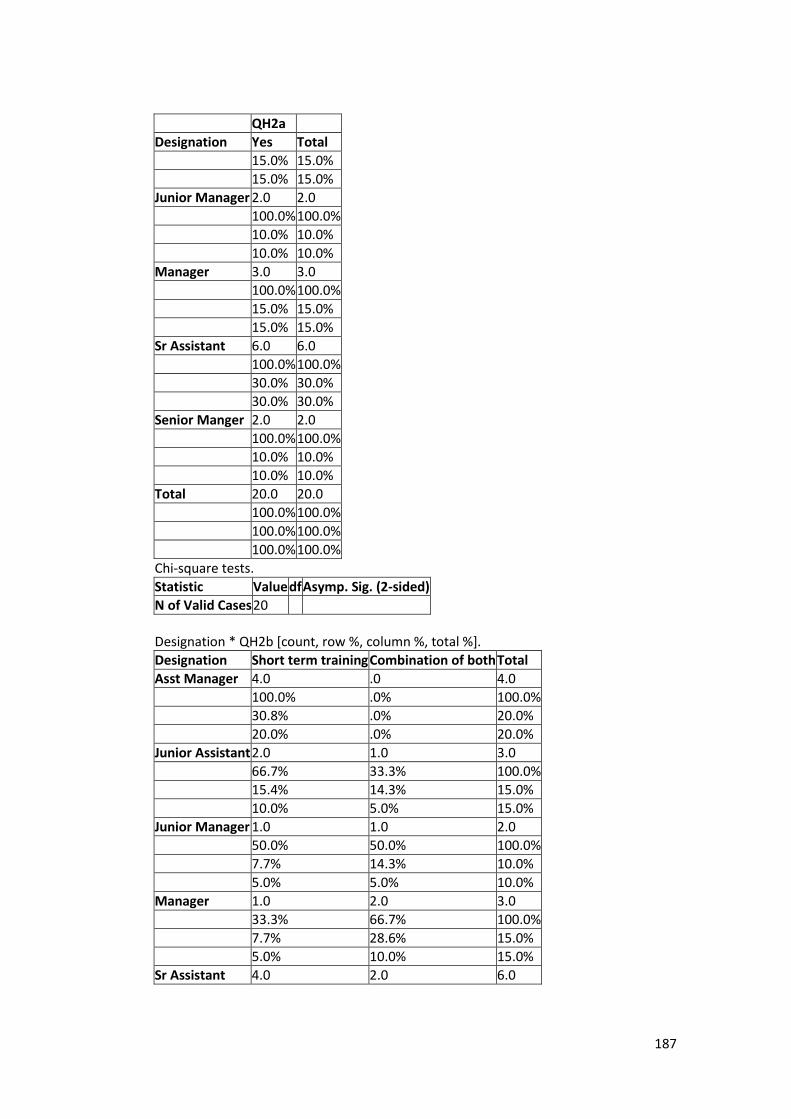
187
QH2a
Designation Yes Total
15.0% 15.0%
15.0% 15.0%
Junior Manager 2.0 2.0
100.0% 100.0%
10.0% 10.0%
10.0% 10.0%
Manager 3.0 3.0
100.0% 100.0%
15.0% 15.0%
15.0% 15.0%
Sr Assistant 6.0 6.0
100.0% 100.0%
30.0% 30.0%
30.0% 30.0%
Senior Manger 2.0 2.0
100.0% 100.0%
10.0% 10.0%
10.0% 10.0%
Total 20.0 20.0
100.0% 100.0%
100.0% 100.0%
100.0% 100.0%
Chi-square tests.
Statistic Value df Asymp. Sig. (2-sided)
N of Valid Cases 20
Designation * QH2b [count, row %, column %, total %].
Designation Short term training Combination of both Total
Asst Manager 4.0 .0 4.0
100.0% .0% 100.0%
30.8% .0% 20.0%
20.0% .0% 20.0%
Junior Assistant 2.0 1.0 3.0
66.7% 33.3% 100.0%
15.4% 14.3% 15.0%
10.0% 5.0% 15.0%
Junior Manager 1.0 1.0 2.0
50.0% 50.0% 100.0%
7.7% 14.3% 10.0%
5.0% 5.0% 10.0%
Manager 1.0 2.0 3.0
33.3% 66.7% 100.0%
7.7% 28.6% 15.0%
5.0% 10.0% 15.0%
Sr Assistant 4.0 2.0 6.0

188
Designation Short term training Combination of both Total
66.7% 33.3% 100.0%
30.8% 28.6% 30.0%
20.0% 10.0% 30.0%
Senior Manger 1.0 1.0 2.0
50.0% 50.0% 100.0%
7.7% 14.3% 10.0%
5.0% 5.0% 10.0%
Total 13.0 7.0 20.0
65.0% 35.0% 100.0%
100.0% 100.0% 100.0%
65.0% 35.0% 100.0%
Chi-square tests.
Statistic Value df Asymp. Sig. (2-sided)
Pearson Chi-Square 3.88 5 .57
Likelihood Ratio 5.08 5 .41
N of Valid Cases 20
Designation * QH3 [count, row %, column %, total %].
Designation Feedback from employees
Requirement of sectional heads
Schedule already prepared
Total
Asst Manager 1.0 3.0 .0 4.0
25.0% 75.0% .0% 100.0%
14.3% 25.0% .0% 20.0%
5.0% 15.0% .0% 20.0%
Junior Assistant
1.0 1.0 1.0 3.0
33.3% 33.3% 33.3% 100.0%
14.3% 8.3% 100.0% 15.0%
5.0% 5.0% 5.0% 15.0%
Junior Manager
.0 2.0 .0 2.0
.0% 100.0% .0% 100.0%
.0% 16.7% .0% 10.0%
.0% 10.0% .0% 10.0%
Manager 1.0 2.0 .0 3.0
33.3% 66.7% .0% 100.0%
14.3% 16.7% .0% 15.0%
5.0% 10.0% .0% 15.0%
Sr Assistant 4.0 2.0 .0 6.0
66.7% 33.3% .0% 100.0%
57.1% 16.7% .0% 30.0%
20.0% 10.0% .0% 30.0%
Senior Manger
.0 2.0 .0 2.0
.0% 100.0% .0% 100.0%
.0% 16.7% .0% 10.0%
.0% 10.0% .0% 10.0%
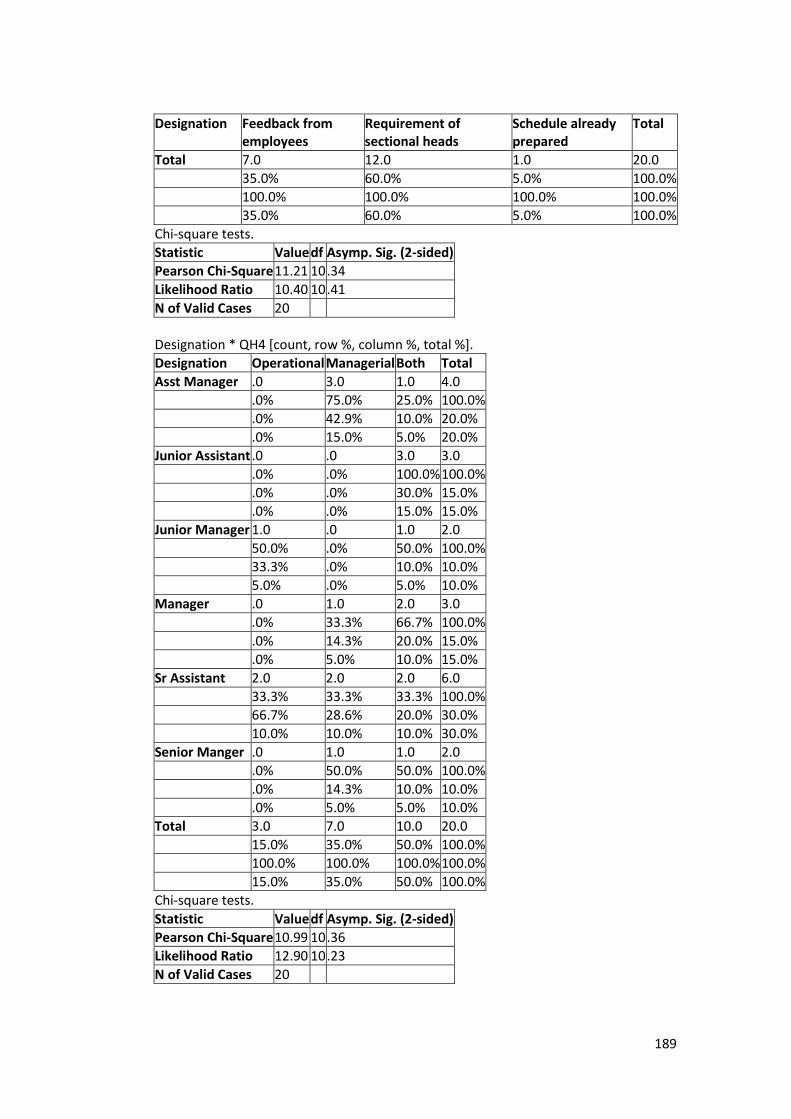
189
Designation Feedback from employees
Requirement of sectional heads
Schedule already prepared
Total
Total 7.0 12.0 1.0 20.0
35.0% 60.0% 5.0% 100.0%
100.0% 100.0% 100.0% 100.0%
35.0% 60.0% 5.0% 100.0%
Chi-square tests.
Statistic Value df Asymp. Sig. (2-sided)
Pearson Chi-Square 11.21 10 .34
Likelihood Ratio 10.40 10 .41
N of Valid Cases 20
Designation * QH4 [count, row %, column %, total %].
Designation Operational Managerial Both Total
Asst Manager .0 3.0 1.0 4.0
.0% 75.0% 25.0% 100.0%
.0% 42.9% 10.0% 20.0%
.0% 15.0% 5.0% 20.0%
Junior Assistant .0 .0 3.0 3.0
.0% .0% 100.0% 100.0%
.0% .0% 30.0% 15.0%
.0% .0% 15.0% 15.0%
Junior Manager 1.0 .0 1.0 2.0
50.0% .0% 50.0% 100.0%
33.3% .0% 10.0% 10.0%
5.0% .0% 5.0% 10.0%
Manager .0 1.0 2.0 3.0
.0% 33.3% 66.7% 100.0%
.0% 14.3% 20.0% 15.0%
.0% 5.0% 10.0% 15.0%
Sr Assistant 2.0 2.0 2.0 6.0
33.3% 33.3% 33.3% 100.0%
66.7% 28.6% 20.0% 30.0%
10.0% 10.0% 10.0% 30.0%
Senior Manger .0 1.0 1.0 2.0
.0% 50.0% 50.0% 100.0%
.0% 14.3% 10.0% 10.0%
.0% 5.0% 5.0% 10.0%
Total 3.0 7.0 10.0 20.0
15.0% 35.0% 50.0% 100.0%
100.0% 100.0% 100.0% 100.0%
15.0% 35.0% 50.0% 100.0%
Chi-square tests.
Statistic Value df Asymp. Sig. (2-sided)
Pearson Chi-Square 10.99 10 .36
Likelihood Ratio 12.90 10 .23
N of Valid Cases 20

190
Designation * QH5 [count, row %, column %, total %].
QH5
Designation Total
Asst Manager 4.0 4.0
100.0% 100.0%
20.0% 20.0%
20.0% 20.0%
Junior Assistant 3.0 3.0
100.0% 100.0%
15.0% 15.0%
15.0% 15.0%
Junior Manager 2.0 2.0
100.0% 100.0%
10.0% 10.0%
10.0% 10.0%
Manager 3.0 3.0
100.0% 100.0%
15.0% 15.0%
15.0% 15.0%
Sr Assistant 6.0 6.0
100.0% 100.0%
30.0% 30.0%
30.0% 30.0%
Senior Manger 2.0 2.0
100.0% 100.0%
10.0% 10.0%
10.0% 10.0%
Total 20.0 20.0
100.0% 100.0%
100.0% 100.0%
100.0% 100.0%
Chi-square tests.
Statistic Value df Asymp. Sig. (2-sided)
N of Valid Cases 20
Designation * QH5b [count, row %, column %, total %].
QH5b
Designation Total
Asst Manager 4.0 4.0
100.0% 100.0%
20.0% 20.0%
20.0% 20.0%
Junior Assistant 3.0 3.0
100.0% 100.0%
15.0% 15.0%
15.0% 15.0%
Junior Manager 2.0 2.0
100.0% 100.0%

191
QH5b
Designation Total
10.0% 10.0%
10.0% 10.0%
Manager 3.0 3.0
100.0% 100.0%
15.0% 15.0%
15.0% 15.0%
Sr Assistant 6.0 6.0
100.0% 100.0%
30.0% 30.0%
30.0% 30.0%
Senior Manger 2.0 2.0
100.0% 100.0%
10.0% 10.0%
10.0% 10.0%
Total 20.0 20.0
100.0% 100.0%
100.0% 100.0%
100.0% 100.0%
Chi-square tests. Statistic Value df Asymp. Sig. (2-sided) N of Valid Cases 20 Designation * QH6 [count, row %, column %, total %].
Designation On the job Off the job A combination of both Total
Asst Manager 3.0 1.0 .0 4.0
75.0% 25.0% .0% 100.0%
18.8% 33.3% .0% 20.0%
15.0% 5.0% .0% 20.0%
Junior Assistant 3.0 .0 .0 3.0
100.0% .0% .0% 100.0%
18.8% .0% .0% 15.0%
15.0% .0% .0% 15.0%
Junior Manager 2.0 .0 .0 2.0
100.0% .0% .0% 100.0%
12.5% .0% .0% 10.0%
10.0% .0% .0% 10.0%
Manager 2.0 1.0 .0 3.0
66.7% 33.3% .0% 100.0%
12.5% 33.3% .0% 15.0%
10.0% 5.0% .0% 15.0%
Sr Assistant 4.0 1.0 1.0 6.0
66.7% 16.7% 16.7% 100.0%
25.0% 33.3% 100.0% 30.0%
20.0% 5.0% 5.0% 30.0%
Senior Manger 2.0 .0 .0 2.0
100.0% .0% .0% 100.0%
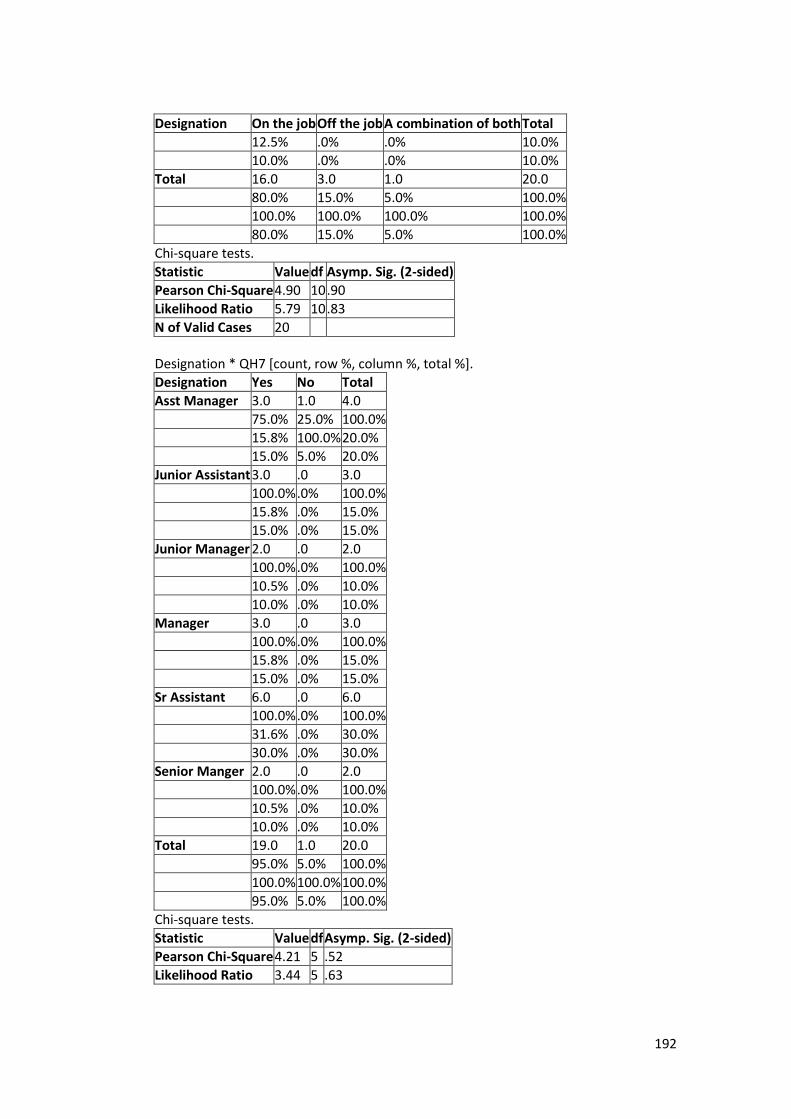
192
Designation On the job Off the job A combination of both Total
12.5% .0% .0% 10.0%
10.0% .0% .0% 10.0%
Total 16.0 3.0 1.0 20.0
80.0% 15.0% 5.0% 100.0%
100.0% 100.0% 100.0% 100.0%
80.0% 15.0% 5.0% 100.0%
Chi-square tests.
Statistic Value df Asymp. Sig. (2-sided)
Pearson Chi-Square 4.90 10 .90
Likelihood Ratio 5.79 10 .83
N of Valid Cases 20
Designation * QH7 [count, row %, column %, total %].
Designation Yes No Total
Asst Manager 3.0 1.0 4.0
75.0% 25.0% 100.0%
15.8% 100.0% 20.0%
15.0% 5.0% 20.0%
Junior Assistant 3.0 .0 3.0
100.0% .0% 100.0%
15.8% .0% 15.0%
15.0% .0% 15.0%
Junior Manager 2.0 .0 2.0
100.0% .0% 100.0%
10.5% .0% 10.0%
10.0% .0% 10.0%
Manager 3.0 .0 3.0
100.0% .0% 100.0%
15.8% .0% 15.0%
15.0% .0% 15.0%
Sr Assistant 6.0 .0 6.0
100.0% .0% 100.0%
31.6% .0% 30.0%
30.0% .0% 30.0%
Senior Manger 2.0 .0 2.0
100.0% .0% 100.0%
10.5% .0% 10.0%
10.0% .0% 10.0%
Total 19.0 1.0 20.0
95.0% 5.0% 100.0%
100.0% 100.0% 100.0%
95.0% 5.0% 100.0%
Chi-square tests.
Statistic Value df Asymp. Sig. (2-sided)
Pearson Chi-Square 4.21 5 .52
Likelihood Ratio 3.44 5 .63
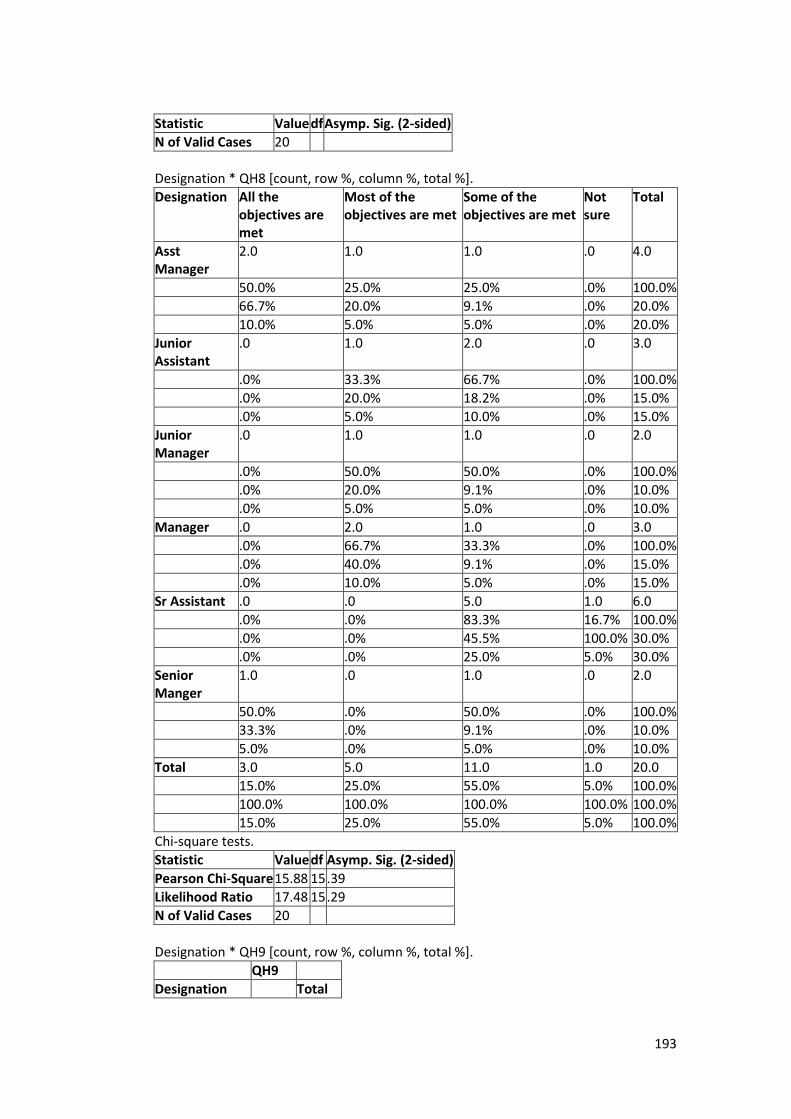
193
Statistic Value df Asymp. Sig. (2-sided)
N of Valid Cases 20
Designation * QH8 [count, row %, column %, total %].
Designation All the objectives are met
Most of the objectives are met
Some of the objectives are met
Not sure
Total
Asst Manager
2.0 1.0 1.0 .0 4.0
50.0% 25.0% 25.0% .0% 100.0%
66.7% 20.0% 9.1% .0% 20.0%
10.0% 5.0% 5.0% .0% 20.0%
Junior Assistant
.0 1.0 2.0 .0 3.0
.0% 33.3% 66.7% .0% 100.0%
.0% 20.0% 18.2% .0% 15.0%
.0% 5.0% 10.0% .0% 15.0%
Junior Manager
.0 1.0 1.0 .0 2.0
.0% 50.0% 50.0% .0% 100.0%
.0% 20.0% 9.1% .0% 10.0%
.0% 5.0% 5.0% .0% 10.0%
Manager .0 2.0 1.0 .0 3.0
.0% 66.7% 33.3% .0% 100.0%
.0% 40.0% 9.1% .0% 15.0%
.0% 10.0% 5.0% .0% 15.0%
Sr Assistant .0 .0 5.0 1.0 6.0
.0% .0% 83.3% 16.7% 100.0%
.0% .0% 45.5% 100.0% 30.0%
.0% .0% 25.0% 5.0% 30.0%
Senior Manger
1.0 .0 1.0 .0 2.0
50.0% .0% 50.0% .0% 100.0%
33.3% .0% 9.1% .0% 10.0%
5.0% .0% 5.0% .0% 10.0%
Total 3.0 5.0 11.0 1.0 20.0
15.0% 25.0% 55.0% 5.0% 100.0%
100.0% 100.0% 100.0% 100.0% 100.0%
15.0% 25.0% 55.0% 5.0% 100.0%
Chi-square tests.
Statistic Value df Asymp. Sig. (2-sided)
Pearson Chi-Square 15.88 15 .39
Likelihood Ratio 17.48 15 .29
N of Valid Cases 20
Designation * QH9 [count, row %, column %, total %].
QH9
Designation Total
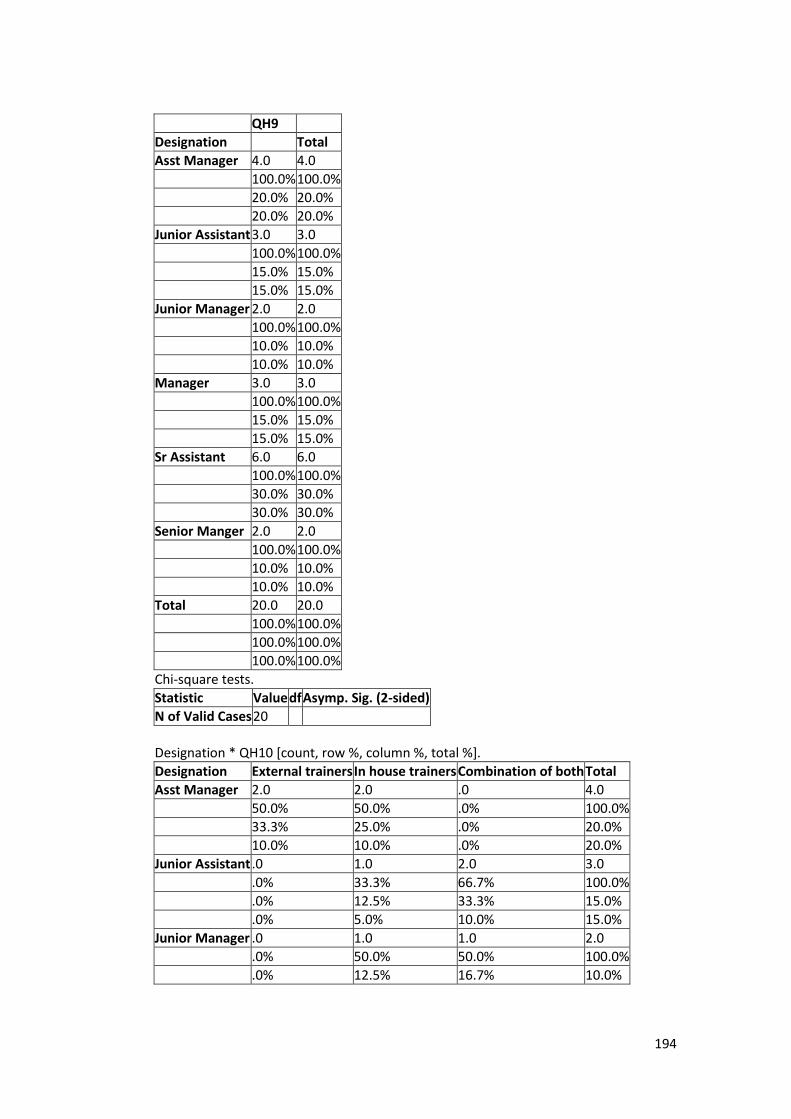
194
QH9
Designation Total
Asst Manager 4.0 4.0
100.0% 100.0%
20.0% 20.0%
20.0% 20.0%
Junior Assistant 3.0 3.0
100.0% 100.0%
15.0% 15.0%
15.0% 15.0%
Junior Manager 2.0 2.0
100.0% 100.0%
10.0% 10.0%
10.0% 10.0%
Manager 3.0 3.0
100.0% 100.0%
15.0% 15.0%
15.0% 15.0%
Sr Assistant 6.0 6.0
100.0% 100.0%
30.0% 30.0%
30.0% 30.0%
Senior Manger 2.0 2.0
100.0% 100.0%
10.0% 10.0%
10.0% 10.0%
Total 20.0 20.0
100.0% 100.0%
100.0% 100.0%
100.0% 100.0%
Chi-square tests.
Statistic Value df Asymp. Sig. (2-sided)
N of Valid Cases 20
Designation * QH10 [count, row %, column %, total %].
Designation External trainers In house trainers Combination of both Total
Asst Manager 2.0 2.0 .0 4.0
50.0% 50.0% .0% 100.0%
33.3% 25.0% .0% 20.0%
10.0% 10.0% .0% 20.0%
Junior Assistant .0 1.0 2.0 3.0
.0% 33.3% 66.7% 100.0%
.0% 12.5% 33.3% 15.0%
.0% 5.0% 10.0% 15.0%
Junior Manager .0 1.0 1.0 2.0
.0% 50.0% 50.0% 100.0%
.0% 12.5% 16.7% 10.0%

195
Designation External trainers In house trainers Combination of both Total
.0% 5.0% 5.0% 10.0%
Manager .0 1.0 2.0 3.0
.0% 33.3% 66.7% 100.0%
.0% 12.5% 33.3% 15.0%
.0% 5.0% 10.0% 15.0%
Sr Assistant 2.0 3.0 1.0 6.0
33.3% 50.0% 16.7% 100.0%
33.3% 37.5% 16.7% 30.0%
10.0% 15.0% 5.0% 30.0%
Senior Manger 2.0 .0 .0 2.0
100.0% .0% .0% 100.0%
33.3% .0% .0% 10.0%
10.0% .0% .0% 10.0%
Total 6.0 8.0 6.0 20.0
30.0% 40.0% 30.0% 100.0%
100.0% 100.0% 100.0% 100.0%
30.0% 40.0% 30.0% 100.0%
Chi-square tests.
Statistic Value df Asymp. Sig. (2-sided)
Pearson Chi-Square 12.50 10 .25
Likelihood Ratio 15.46 10 .12
N of Valid Cases 20
Designation * QH11 [count, row %, column %, total %].
Designation Yes No Total
Asst Manager 3.0 1.0 4.0
75.0% 25.0% 100.0%
21.4% 16.7% 20.0%
15.0% 5.0% 20.0%
Junior Assistant 3.0 .0 3.0
100.0% .0% 100.0%
21.4% .0% 15.0%
15.0% .0% 15.0%
Junior Manager 1.0 1.0 2.0
50.0% 50.0% 100.0%
7.1% 16.7% 10.0%
5.0% 5.0% 10.0%
Manager 3.0 .0 3.0
100.0% .0% 100.0%
21.4% .0% 15.0%
15.0% .0% 15.0%
Sr Assistant 4.0 2.0 6.0
66.7% 33.3% 100.0%
28.6% 33.3% 30.0%
20.0% 10.0% 30.0%
Senior Manger .0 2.0 2.0
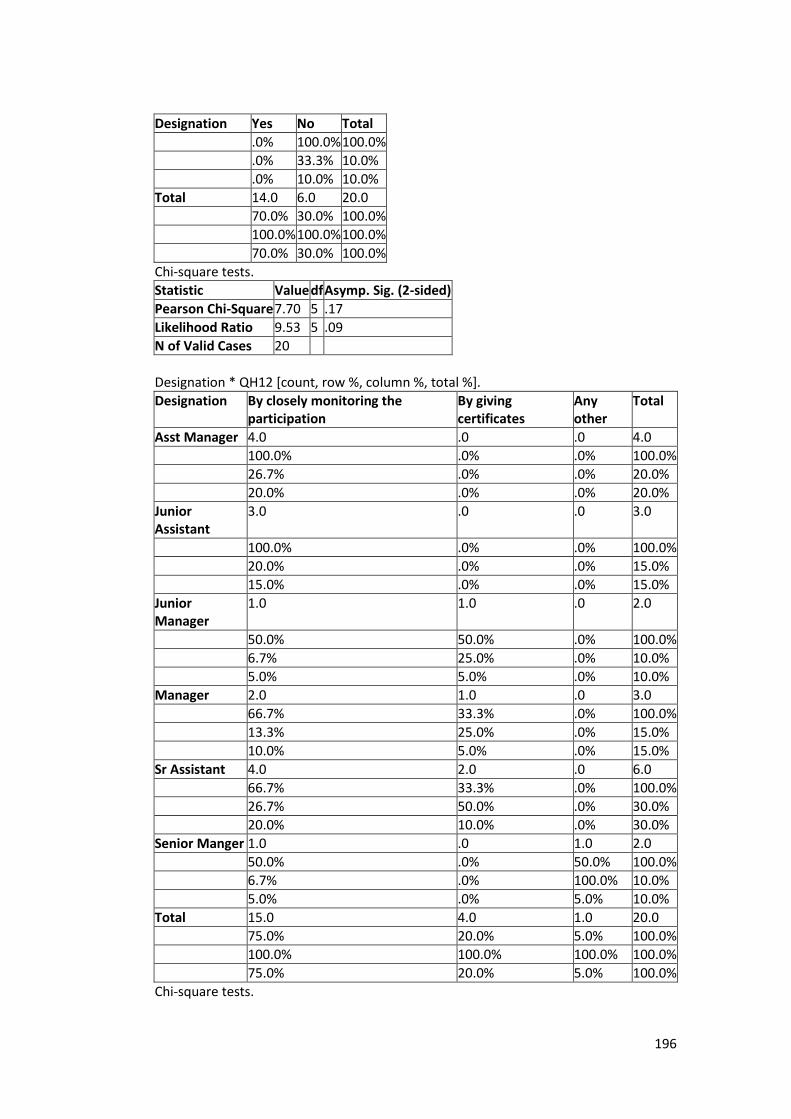
196
Designation Yes No Total
.0% 100.0% 100.0%
.0% 33.3% 10.0%
.0% 10.0% 10.0%
Total 14.0 6.0 20.0
70.0% 30.0% 100.0%
100.0% 100.0% 100.0%
70.0% 30.0% 100.0%
Chi-square tests.
Statistic Value df Asymp. Sig. (2-sided)
Pearson Chi-Square 7.70 5 .17
Likelihood Ratio 9.53 5 .09
N of Valid Cases 20
Designation * QH12 [count, row %, column %, total %].
Designation By closely monitoring the participation
By giving certificates
Any other
Total
Asst Manager 4.0 .0 .0 4.0
100.0% .0% .0% 100.0%
26.7% .0% .0% 20.0%
20.0% .0% .0% 20.0%
Junior Assistant
3.0 .0 .0 3.0
100.0% .0% .0% 100.0%
20.0% .0% .0% 15.0%
15.0% .0% .0% 15.0%
Junior Manager
1.0 1.0 .0 2.0
50.0% 50.0% .0% 100.0%
6.7% 25.0% .0% 10.0%
5.0% 5.0% .0% 10.0%
Manager 2.0 1.0 .0 3.0
66.7% 33.3% .0% 100.0%
13.3% 25.0% .0% 15.0%
10.0% 5.0% .0% 15.0%
Sr Assistant 4.0 2.0 .0 6.0
66.7% 33.3% .0% 100.0%
26.7% 50.0% .0% 30.0%
20.0% 10.0% .0% 30.0%
Senior Manger 1.0 .0 1.0 2.0
50.0% .0% 50.0% 100.0%
6.7% .0% 100.0% 10.0%
5.0% .0% 5.0% 10.0%
Total 15.0 4.0 1.0 20.0
75.0% 20.0% 5.0% 100.0%
100.0% 100.0% 100.0% 100.0%
75.0% 20.0% 5.0% 100.0%
Chi-square tests.
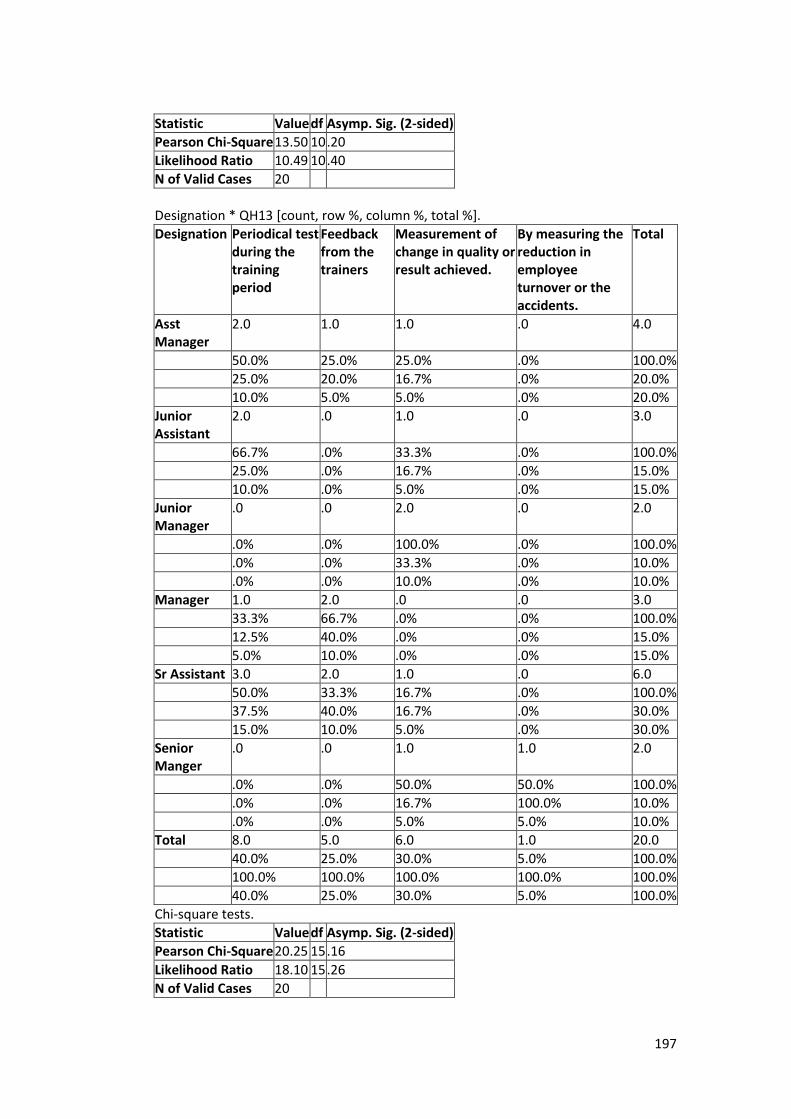
197
Statistic Value df Asymp. Sig. (2-sided)
Pearson Chi-Square 13.50 10 .20
Likelihood Ratio 10.49 10 .40
N of Valid Cases 20
Designation * QH13 [count, row %, column %, total %].
Designation Periodical test during the training period
Feedback from the trainers
Measurement of change in quality or result achieved.
By measuring the reduction in employee turnover or the accidents.
Total
Asst Manager
2.0 1.0 1.0 .0 4.0
50.0% 25.0% 25.0% .0% 100.0%
25.0% 20.0% 16.7% .0% 20.0%
10.0% 5.0% 5.0% .0% 20.0%
Junior Assistant
2.0 .0 1.0 .0 3.0
66.7% .0% 33.3% .0% 100.0%
25.0% .0% 16.7% .0% 15.0%
10.0% .0% 5.0% .0% 15.0%
Junior Manager
.0 .0 2.0 .0 2.0
.0% .0% 100.0% .0% 100.0%
.0% .0% 33.3% .0% 10.0%
.0% .0% 10.0% .0% 10.0%
Manager 1.0 2.0 .0 .0 3.0
33.3% 66.7% .0% .0% 100.0%
12.5% 40.0% .0% .0% 15.0%
5.0% 10.0% .0% .0% 15.0%
Sr Assistant 3.0 2.0 1.0 .0 6.0
50.0% 33.3% 16.7% .0% 100.0%
37.5% 40.0% 16.7% .0% 30.0%
15.0% 10.0% 5.0% .0% 30.0%
Senior Manger
.0 .0 1.0 1.0 2.0
.0% .0% 50.0% 50.0% 100.0%
.0% .0% 16.7% 100.0% 10.0%
.0% .0% 5.0% 5.0% 10.0%
Total 8.0 5.0 6.0 1.0 20.0
40.0% 25.0% 30.0% 5.0% 100.0%
100.0% 100.0% 100.0% 100.0% 100.0%
40.0% 25.0% 30.0% 5.0% 100.0%
Chi-square tests.
Statistic Value df Asymp. Sig. (2-sided)
Pearson Chi-Square 20.25 15 .16
Likelihood Ratio 18.10 15 .26
N of Valid Cases 20
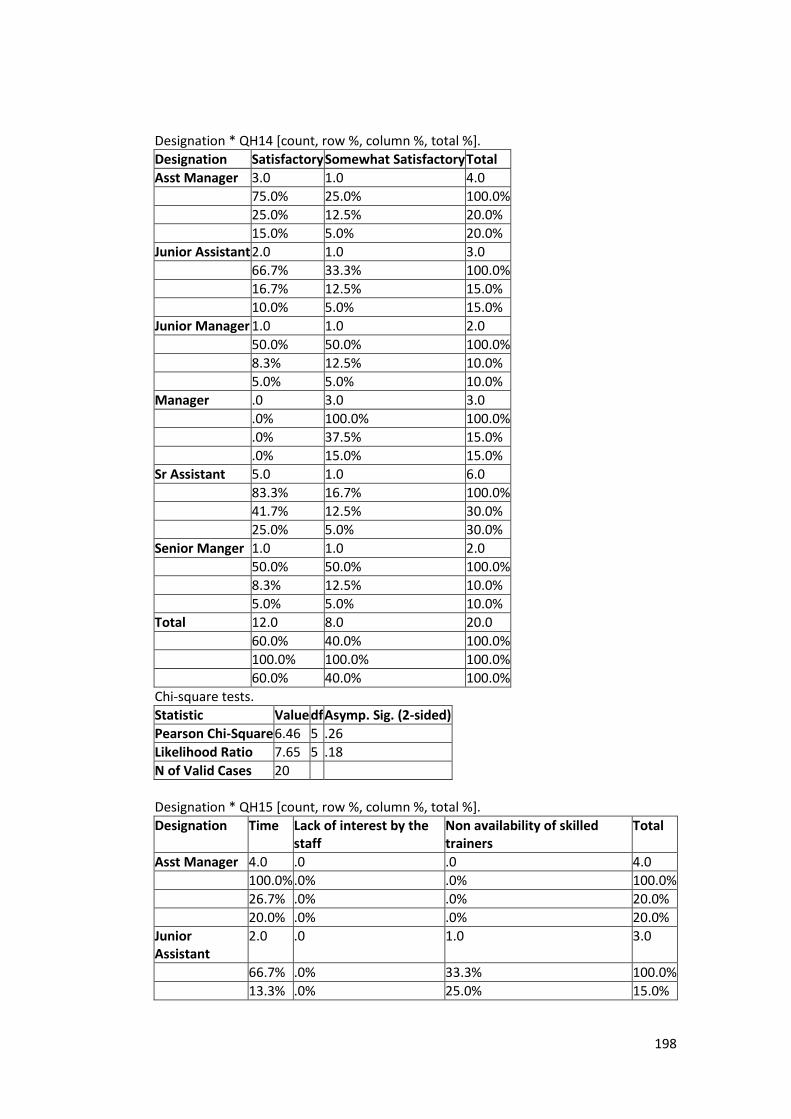
198
Designation * QH14 [count, row %, column %, total %].
Designation Satisfactory Somewhat Satisfactory Total
Asst Manager 3.0 1.0 4.0
75.0% 25.0% 100.0%
25.0% 12.5% 20.0%
15.0% 5.0% 20.0%
Junior Assistant 2.0 1.0 3.0
66.7% 33.3% 100.0%
16.7% 12.5% 15.0%
10.0% 5.0% 15.0%
Junior Manager 1.0 1.0 2.0
50.0% 50.0% 100.0%
8.3% 12.5% 10.0%
5.0% 5.0% 10.0%
Manager .0 3.0 3.0
.0% 100.0% 100.0%
.0% 37.5% 15.0%
.0% 15.0% 15.0%
Sr Assistant 5.0 1.0 6.0
83.3% 16.7% 100.0%
41.7% 12.5% 30.0%
25.0% 5.0% 30.0%
Senior Manger 1.0 1.0 2.0
50.0% 50.0% 100.0%
8.3% 12.5% 10.0%
5.0% 5.0% 10.0%
Total 12.0 8.0 20.0
60.0% 40.0% 100.0%
100.0% 100.0% 100.0%
60.0% 40.0% 100.0%
Chi-square tests.
Statistic Value df Asymp. Sig. (2-sided)
Pearson Chi-Square 6.46 5 .26
Likelihood Ratio 7.65 5 .18
N of Valid Cases 20
Designation * QH15 [count, row %, column %, total %].
Designation Time Lack of interest by the staff
Non availability of skilled trainers
Total
Asst Manager 4.0 .0 .0 4.0
100.0% .0% .0% 100.0%
26.7% .0% .0% 20.0%
20.0% .0% .0% 20.0%
Junior Assistant
2.0 .0 1.0 3.0
66.7% .0% 33.3% 100.0%
13.3% .0% 25.0% 15.0%
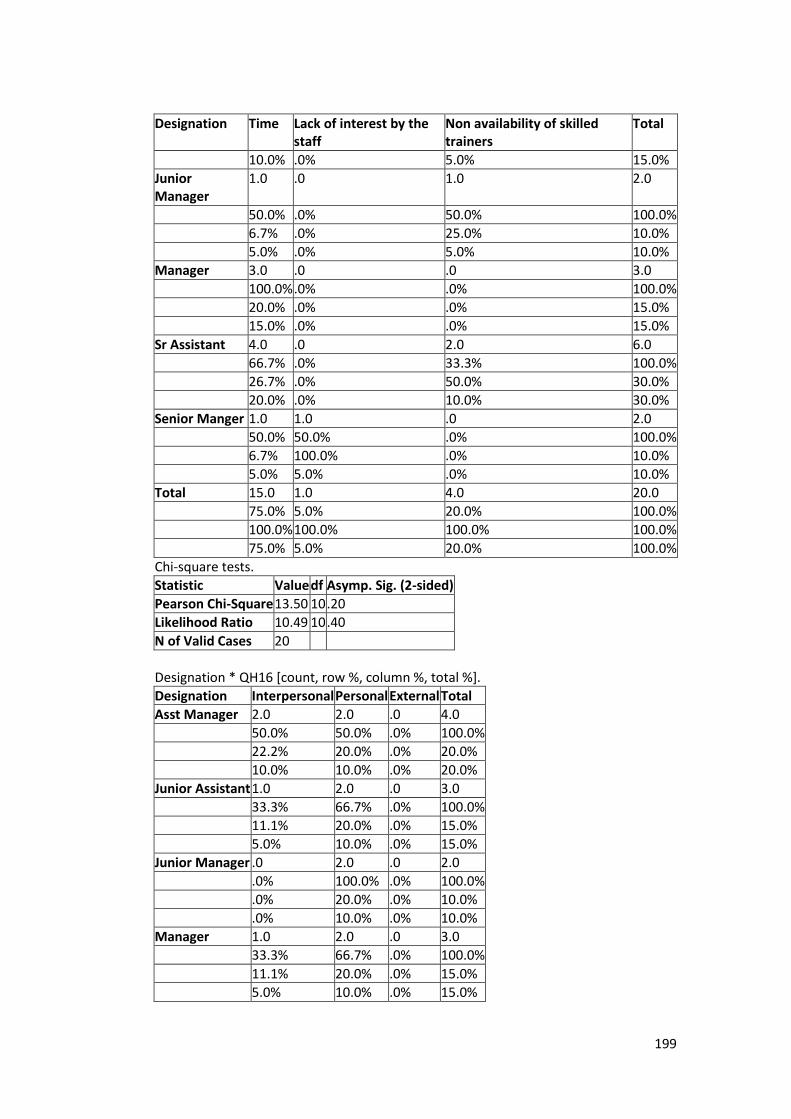
199
Designation Time Lack of interest by the staff
Non availability of skilled trainers
Total
10.0% .0% 5.0% 15.0%
Junior Manager
1.0 .0 1.0 2.0
50.0% .0% 50.0% 100.0%
6.7% .0% 25.0% 10.0%
5.0% .0% 5.0% 10.0%
Manager 3.0 .0 .0 3.0
100.0% .0% .0% 100.0%
20.0% .0% .0% 15.0%
15.0% .0% .0% 15.0%
Sr Assistant 4.0 .0 2.0 6.0
66.7% .0% 33.3% 100.0%
26.7% .0% 50.0% 30.0%
20.0% .0% 10.0% 30.0%
Senior Manger 1.0 1.0 .0 2.0
50.0% 50.0% .0% 100.0%
6.7% 100.0% .0% 10.0%
5.0% 5.0% .0% 10.0%
Total 15.0 1.0 4.0 20.0
75.0% 5.0% 20.0% 100.0%
100.0% 100.0% 100.0% 100.0%
75.0% 5.0% 20.0% 100.0%
Chi-square tests.
Statistic Value df Asymp. Sig. (2-sided)
Pearson Chi-Square 13.50 10 .20
Likelihood Ratio 10.49 10 .40
N of Valid Cases 20
Designation * QH16 [count, row %, column %, total %].
Designation Interpersonal Personal External Total
Asst Manager 2.0 2.0 .0 4.0
50.0% 50.0% .0% 100.0%
22.2% 20.0% .0% 20.0%
10.0% 10.0% .0% 20.0%
Junior Assistant 1.0 2.0 .0 3.0
33.3% 66.7% .0% 100.0%
11.1% 20.0% .0% 15.0%
5.0% 10.0% .0% 15.0%
Junior Manager .0 2.0 .0 2.0
.0% 100.0% .0% 100.0%
.0% 20.0% .0% 10.0%
.0% 10.0% .0% 10.0%
Manager 1.0 2.0 .0 3.0
33.3% 66.7% .0% 100.0%
11.1% 20.0% .0% 15.0%
5.0% 10.0% .0% 15.0%
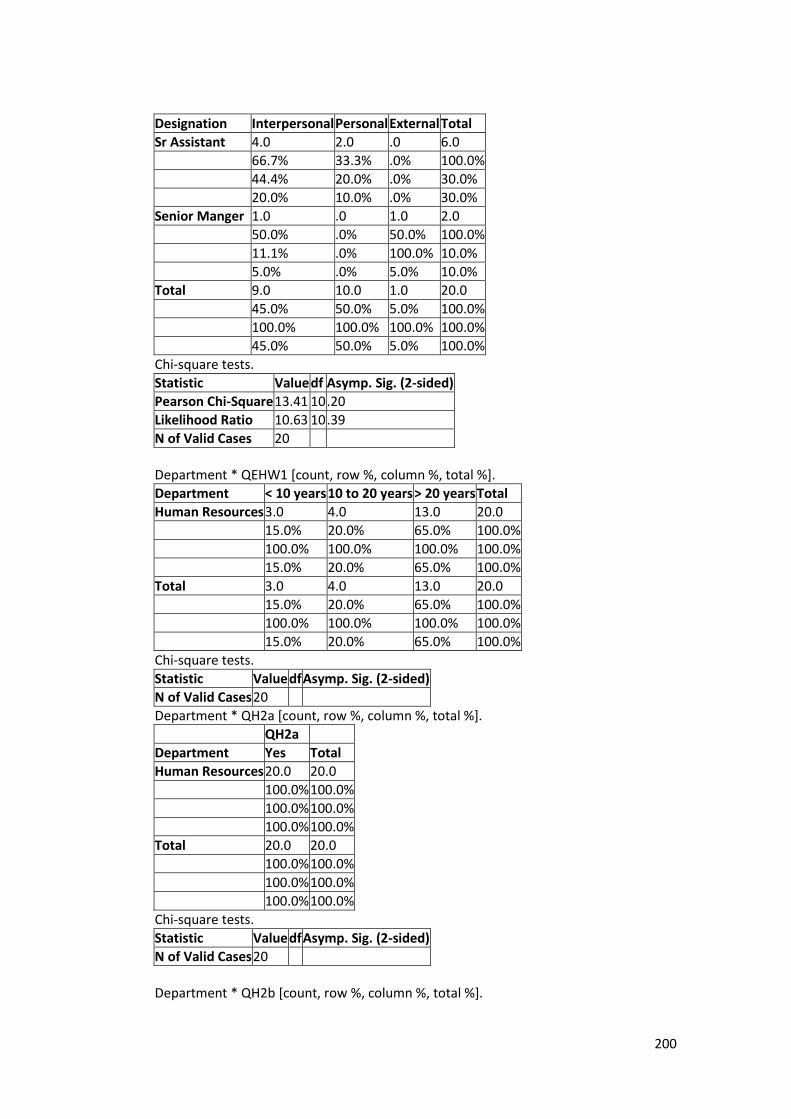
200
Designation Interpersonal Personal External Total
Sr Assistant 4.0 2.0 .0 6.0
66.7% 33.3% .0% 100.0%
44.4% 20.0% .0% 30.0%
20.0% 10.0% .0% 30.0%
Senior Manger 1.0 .0 1.0 2.0
50.0% .0% 50.0% 100.0%
11.1% .0% 100.0% 10.0%
5.0% .0% 5.0% 10.0%
Total 9.0 10.0 1.0 20.0
45.0% 50.0% 5.0% 100.0%
100.0% 100.0% 100.0% 100.0%
45.0% 50.0% 5.0% 100.0%
Chi-square tests.
Statistic Value df Asymp. Sig. (2-sided)
Pearson Chi-Square 13.41 10 .20
Likelihood Ratio 10.63 10 .39
N of Valid Cases 20
Department * QEHW1 [count, row %, column %, total %].
Department < 10 years 10 to 20 years > 20 years Total
Human Resources 3.0 4.0 13.0 20.0
15.0% 20.0% 65.0% 100.0%
100.0% 100.0% 100.0% 100.0%
15.0% 20.0% 65.0% 100.0%
Total 3.0 4.0 13.0 20.0
15.0% 20.0% 65.0% 100.0%
100.0% 100.0% 100.0% 100.0%
15.0% 20.0% 65.0% 100.0%
Chi-square tests.
Statistic Value df Asymp. Sig. (2-sided)
N of Valid Cases 20
Department * QH2a [count, row %, column %, total %].
QH2a
Department Yes Total
Human Resources 20.0 20.0
100.0% 100.0%
100.0% 100.0%
100.0% 100.0%
Total 20.0 20.0
100.0% 100.0%
100.0% 100.0%
100.0% 100.0%
Chi-square tests.
Statistic Value df Asymp. Sig. (2-sided)
N of Valid Cases 20
Department * QH2b [count, row %, column %, total %].
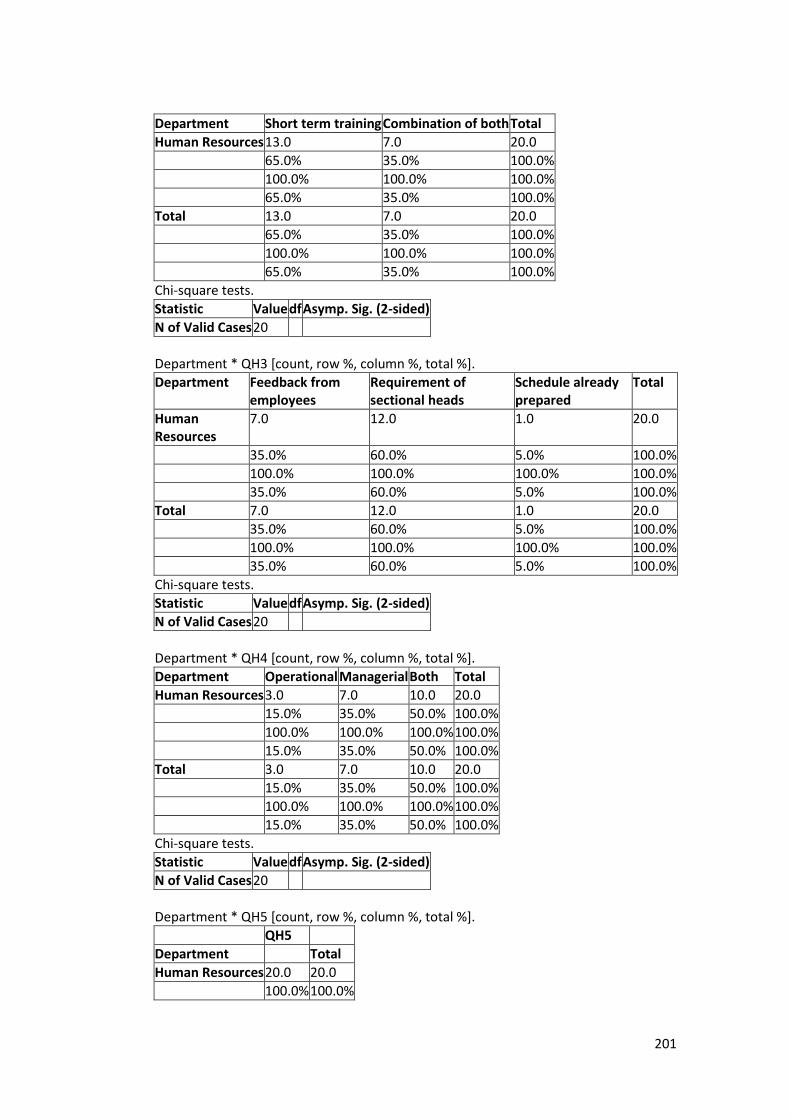
201
Department Short term training Combination of both Total
Human Resources 13.0 7.0 20.0
65.0% 35.0% 100.0%
100.0% 100.0% 100.0%
65.0% 35.0% 100.0%
Total 13.0 7.0 20.0
65.0% 35.0% 100.0%
100.0% 100.0% 100.0%
65.0% 35.0% 100.0%
Chi-square tests.
Statistic Value df Asymp. Sig. (2-sided)
N of Valid Cases 20
Department * QH3 [count, row %, column %, total %].
Department Feedback from employees
Requirement of sectional heads
Schedule already prepared
Total
Human Resources
7.0 12.0 1.0 20.0
35.0% 60.0% 5.0% 100.0%
100.0% 100.0% 100.0% 100.0%
35.0% 60.0% 5.0% 100.0%
Total 7.0 12.0 1.0 20.0
35.0% 60.0% 5.0% 100.0%
100.0% 100.0% 100.0% 100.0%
35.0% 60.0% 5.0% 100.0%
Chi-square tests.
Statistic Value df Asymp. Sig. (2-sided)
N of Valid Cases 20
Department * QH4 [count, row %, column %, total %].
Department Operational Managerial Both Total
Human Resources 3.0 7.0 10.0 20.0
15.0% 35.0% 50.0% 100.0%
100.0% 100.0% 100.0% 100.0%
15.0% 35.0% 50.0% 100.0%
Total 3.0 7.0 10.0 20.0
15.0% 35.0% 50.0% 100.0%
100.0% 100.0% 100.0% 100.0%
15.0% 35.0% 50.0% 100.0%
Chi-square tests.
Statistic Value df Asymp. Sig. (2-sided)
N of Valid Cases 20
Department * QH5 [count, row %, column %, total %].
QH5
Department Total
Human Resources 20.0 20.0
100.0% 100.0%

202
QH5
Department Total
100.0% 100.0%
100.0% 100.0%
Total 20.0 20.0
100.0% 100.0%
100.0% 100.0%
100.0% 100.0%
Chi-square tests.
Statistic Value df Asymp. Sig. (2-sided)
N of Valid Cases 20
Department * QH5b [count, row %, column %, total %].
QH5b
Department Total
Human Resources 20.0 20.0
100.0% 100.0%
100.0% 100.0%
100.0% 100.0%
Total 20.0 20.0
100.0% 100.0%
100.0% 100.0%
100.0% 100.0%
Chi-square tests.
Statistic Value df Asymp. Sig. (2-sided)
N of Valid Cases 20
Department * QH6 [count, row %, column %, total %].
Department On the job Off the job A combination of both Total
Human Resources 16.0 3.0 1.0 20.0
80.0% 15.0% 5.0% 100.0%
100.0% 100.0% 100.0% 100.0%
80.0% 15.0% 5.0% 100.0%
Total 16.0 3.0 1.0 20.0
80.0% 15.0% 5.0% 100.0%
100.0% 100.0% 100.0% 100.0%
80.0% 15.0% 5.0% 100.0%
Chi-square tests.
Statistic Value df Asymp. Sig. (2-sided)
N of Valid Cases 20
Department * QH7 [count, row %, column %, total %].
Department Yes No Total
Human Resources 19.0 1.0 20.0
95.0% 5.0% 100.0%
100.0% 100.0% 100.0%
95.0% 5.0% 100.0%
Total 19.0 1.0 20.0

203
Department Yes No Total
95.0% 5.0% 100.0%
100.0% 100.0% 100.0%
95.0% 5.0% 100.0%
Chi-square tests.
Statistic Value df Asymp. Sig. (2-sided)
N of Valid Cases 20
Department * QH8 [count, row %, column %, total %].
Department All the objectives are met
Most of the objectives are met
Some of the objectives are met
Not sure
Total
Human Resources
3.0 5.0 11.0 1.0 20.0
15.0% 25.0% 55.0% 5.0% 100.0%
100.0% 100.0% 100.0% 100.0% 100.0%
15.0% 25.0% 55.0% 5.0% 100.0%
Total 3.0 5.0 11.0 1.0 20.0
15.0% 25.0% 55.0% 5.0% 100.0%
100.0% 100.0% 100.0% 100.0% 100.0%
15.0% 25.0% 55.0% 5.0% 100.0%
Chi-square tests.
Statistic Value df Asymp. Sig. (2-sided)
N of Valid Cases 20
Department * QH9 [count, row %, column %, total %].
QH9
Department Total
Human Resources 20.0 20.0
100.0% 100.0%
100.0% 100.0%
100.0% 100.0%
Total 20.0 20.0
100.0% 100.0%
100.0% 100.0%
100.0% 100.0%
Chi-square tests.
Statistic Value df Asymp. Sig. (2-sided)
N of Valid Cases 20
Department * QH10 [count, row %, column %, total %].
Department External trainers In house trainers Combination of both Total
Human Resources 6.0 8.0 6.0 20.0
30.0% 40.0% 30.0% 100.0%
100.0% 100.0% 100.0% 100.0%
30.0% 40.0% 30.0% 100.0%
Total 6.0 8.0 6.0 20.0
30.0% 40.0% 30.0% 100.0%
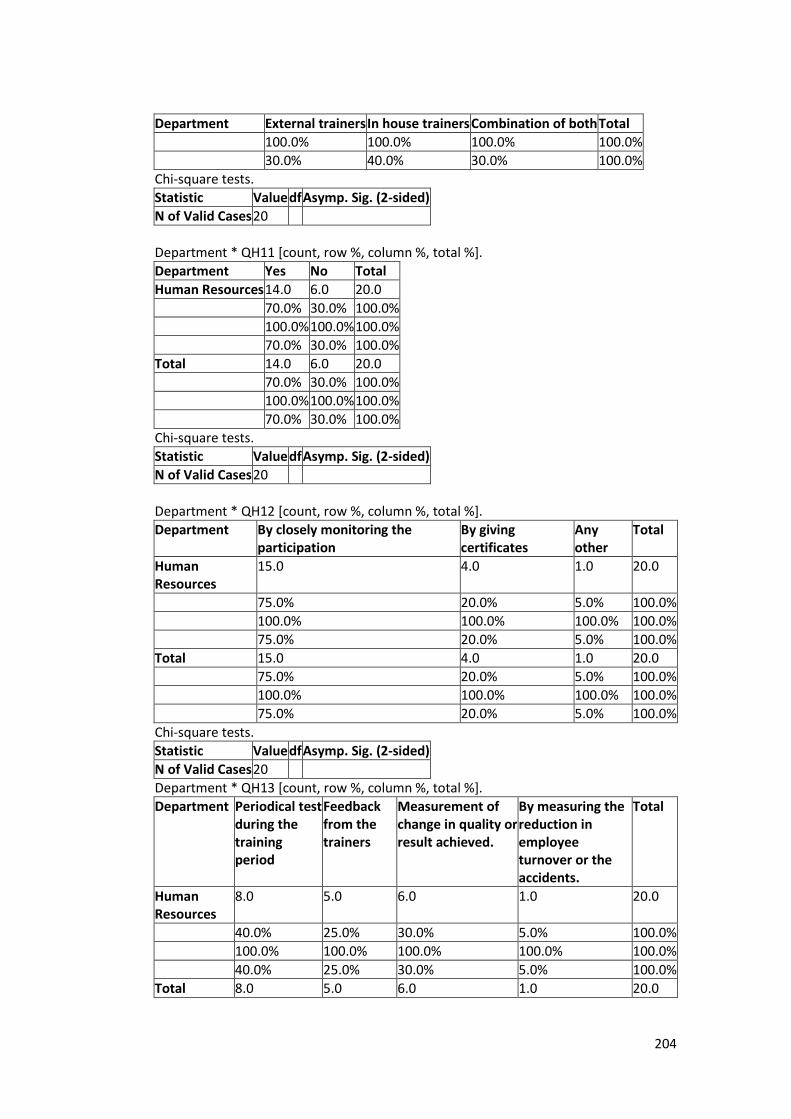
204
Department External trainers In house trainers Combination of both Total
100.0% 100.0% 100.0% 100.0%
30.0% 40.0% 30.0% 100.0%
Chi-square tests.
Statistic Value df Asymp. Sig. (2-sided)
N of Valid Cases 20
Department * QH11 [count, row %, column %, total %].
Department Yes No Total
Human Resources 14.0 6.0 20.0
70.0% 30.0% 100.0%
100.0% 100.0% 100.0%
70.0% 30.0% 100.0%
Total 14.0 6.0 20.0
70.0% 30.0% 100.0%
100.0% 100.0% 100.0%
70.0% 30.0% 100.0%
Chi-square tests.
Statistic Value df Asymp. Sig. (2-sided)
N of Valid Cases 20
Department * QH12 [count, row %, column %, total %].
Department By closely monitoring the participation
By giving certificates
Any other
Total
Human Resources
15.0 4.0 1.0 20.0
75.0% 20.0% 5.0% 100.0%
100.0% 100.0% 100.0% 100.0%
75.0% 20.0% 5.0% 100.0%
Total 15.0 4.0 1.0 20.0
75.0% 20.0% 5.0% 100.0%
100.0% 100.0% 100.0% 100.0%
75.0% 20.0% 5.0% 100.0%
Chi-square tests.
Statistic Value df Asymp. Sig. (2-sided)
N of Valid Cases 20
Department * QH13 [count, row %, column %, total %].
Department Periodical test during the training period
Feedback from the trainers
Measurement of change in quality or result achieved.
By measuring the reduction in employee turnover or the accidents.
Total
Human Resources
8.0 5.0 6.0 1.0 20.0
40.0% 25.0% 30.0% 5.0% 100.0%
100.0% 100.0% 100.0% 100.0% 100.0%
40.0% 25.0% 30.0% 5.0% 100.0%
Total 8.0 5.0 6.0 1.0 20.0

205
Department Periodical test during the training period
Feedback from the trainers
Measurement of change in quality or result achieved.
By measuring the reduction in employee turnover or the accidents.
Total
40.0% 25.0% 30.0% 5.0% 100.0%
100.0% 100.0% 100.0% 100.0% 100.0%
40.0% 25.0% 30.0% 5.0% 100.0%
Chi-square tests.
Statistic Value df Asymp. Sig. (2-sided)
N of Valid Cases 20
Department * QH14 [count, row %, column %, total %].
Department Satisfactory Somewhat Satisfactory Total
Human Resources 12.0 8.0 20.0
60.0% 40.0% 100.0%
100.0% 100.0% 100.0%
60.0% 40.0% 100.0%
Total 12.0 8.0 20.0
60.0% 40.0% 100.0%
100.0% 100.0% 100.0%
60.0% 40.0% 100.0%
Chi-square tests.
Statistic Value df Asymp. Sig. (2-sided)
N of Valid Cases 20
Department * QH15 [count, row %, column %, total %].
Department Time Lack of interest by the staff
Non availability of skilled trainers
Total
Human Resources
15.0 1.0 4.0 20.0
75.0% 5.0% 20.0% 100.0%
100.0% 100.0% 100.0% 100.0%
75.0% 5.0% 20.0% 100.0%
Total 15.0 1.0 4.0 20.0
75.0% 5.0% 20.0% 100.0%
100.0% 100.0% 100.0% 100.0%
75.0% 5.0% 20.0% 100.0%
Chi-square tests.
Statistic Value df Asymp. Sig. (2-sided)
N of Valid Cases 20
Department * QH16 [count, row %, column %, total %].
Department Interpersonal Personal External Total
Human Resources 9.0 10.0 1.0 20.0
45.0% 50.0% 5.0% 100.0%
100.0% 100.0% 100.0% 100.0%
45.0% 50.0% 5.0% 100.0%
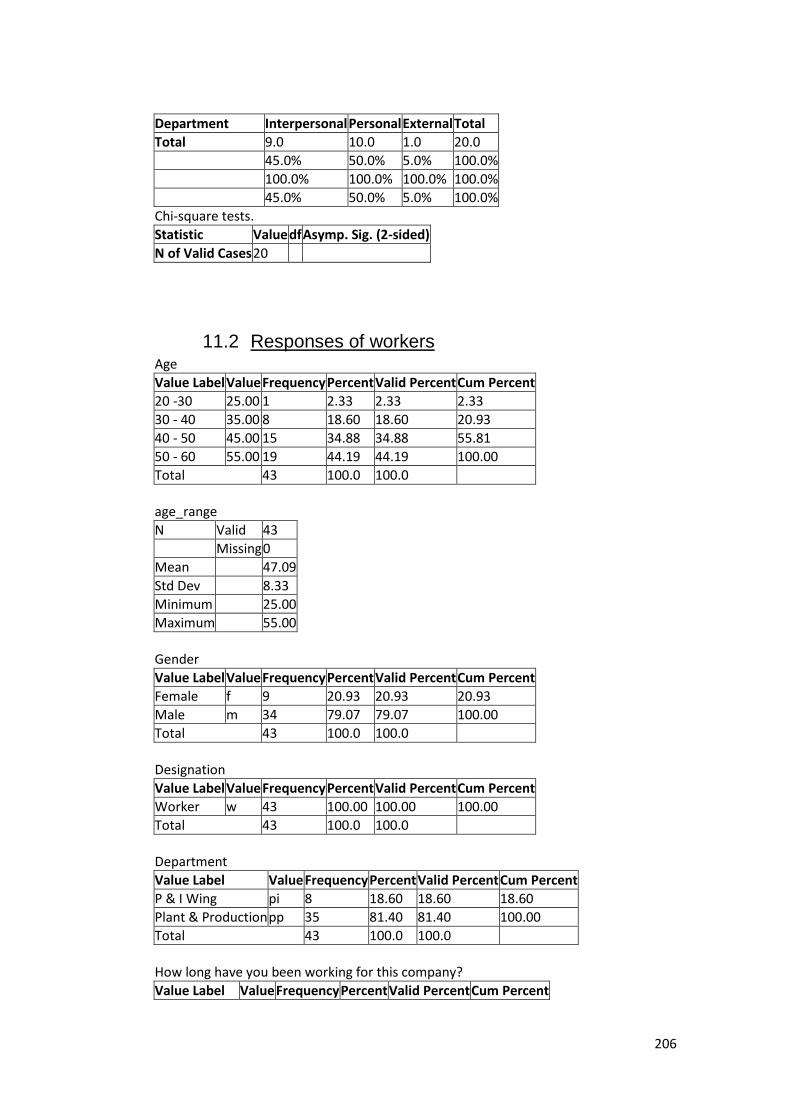
206
Department Interpersonal Personal External Total
Total 9.0 10.0 1.0 20.0
45.0% 50.0% 5.0% 100.0%
100.0% 100.0% 100.0% 100.0%
45.0% 50.0% 5.0% 100.0%
Chi-square tests.
Statistic Value df Asymp. Sig. (2-sided)
N of Valid Cases 20
11.2 Responses of workers Age
Value Label Value Frequency Percent Valid Percent Cum Percent
20 -30 25.00 1 2.33 2.33 2.33
30 - 40 35.00 8 18.60 18.60 20.93
40 - 50 45.00 15 34.88 34.88 55.81
50 - 60 55.00 19 44.19 44.19 100.00
Total 43 100.0 100.0
age_range
N Valid 43
Missing 0
Mean 47.09
Std Dev 8.33
Minimum 25.00
Maximum 55.00
Gender
Value Label Value Frequency Percent Valid Percent Cum Percent
Female f 9 20.93 20.93 20.93
Male m 34 79.07 79.07 100.00
Total 43 100.0 100.0
Designation
Value Label Value Frequency Percent Valid Percent Cum Percent
Worker w 43 100.00 100.00 100.00
Total 43 100.0 100.0
Department
Value Label Value Frequency Percent Valid Percent Cum Percent
P & I Wing pi 8 18.60 18.60 18.60
Plant & Production pp 35 81.40 81.40 100.00
Total 43 100.0 100.0
How long have you been working for this company?
Value Label Value Frequency Percent Valid Percent Cum Percent
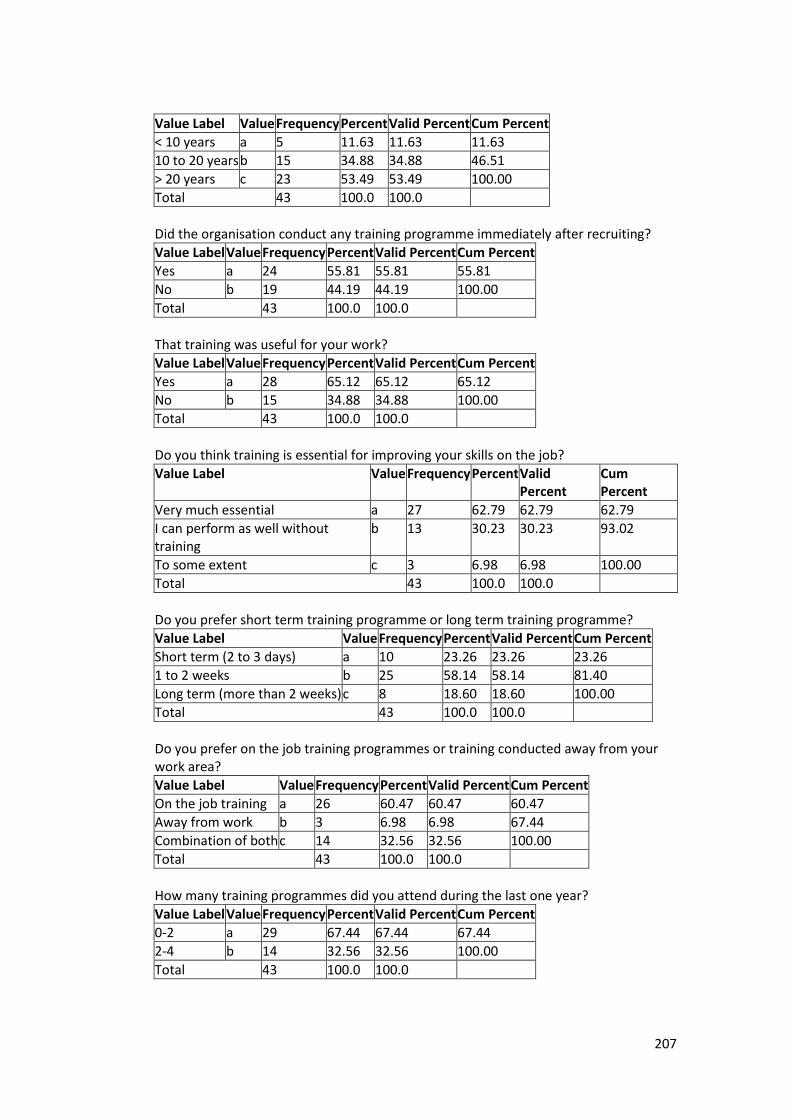
207
Value Label Value Frequency Percent Valid Percent Cum Percent
< 10 years a 5 11.63 11.63 11.63
10 to 20 years b 15 34.88 34.88 46.51
> 20 years c 23 53.49 53.49 100.00
Total 43 100.0 100.0
Did the organisation conduct any training programme immediately after recruiting?
Value Label Value Frequency Percent Valid Percent Cum Percent
Yes a 24 55.81 55.81 55.81
No b 19 44.19 44.19 100.00
Total 43 100.0 100.0
That training was useful for your work?
Value Label Value Frequency Percent Valid Percent Cum Percent
Yes a 28 65.12 65.12 65.12
No b 15 34.88 34.88 100.00
Total 43 100.0 100.0
Do you think training is essential for improving your skills on the job?
Value Label Value Frequency Percent Valid Percent
Cum Percent
Very much essential a 27 62.79 62.79 62.79
I can perform as well without training
b 13 30.23 30.23 93.02
To some extent c 3 6.98 6.98 100.00
Total 43 100.0 100.0
Do you prefer short term training programme or long term training programme?
Value Label Value Frequency Percent Valid Percent Cum Percent
Short term (2 to 3 days) a 10 23.26 23.26 23.26
1 to 2 weeks b 25 58.14 58.14 81.40
Long term (more than 2 weeks) c 8 18.60 18.60 100.00
Total 43 100.0 100.0
Do you prefer on the job training programmes or training conducted away from your work area?
Value Label Value Frequency Percent Valid Percent Cum Percent
On the job training a 26 60.47 60.47 60.47
Away from work b 3 6.98 6.98 67.44
Combination of both c 14 32.56 32.56 100.00
Total 43 100.0 100.0
How many training programmes did you attend during the last one year?
Value Label Value Frequency Percent Valid Percent Cum Percent
0-2 a 29 67.44 67.44 67.44
2-4 b 14 32.56 32.56 100.00
Total 43 100.0 100.0
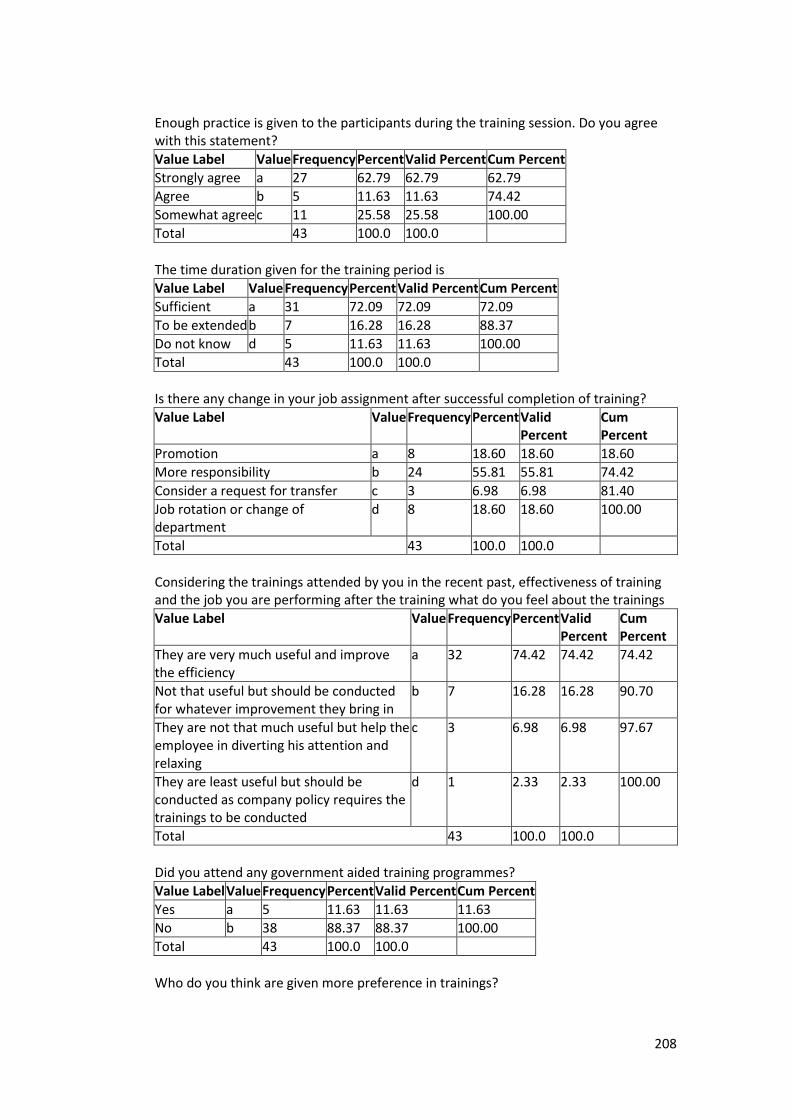
208
Enough practice is given to the participants during the training session. Do you agree with this statement?
Value Label Value Frequency Percent Valid Percent Cum Percent
Strongly agree a 27 62.79 62.79 62.79
Agree b 5 11.63 11.63 74.42
Somewhat agree c 11 25.58 25.58 100.00
Total 43 100.0 100.0
The time duration given for the training period is
Value Label Value Frequency Percent Valid Percent Cum Percent
Sufficient a 31 72.09 72.09 72.09
To be extended b 7 16.28 16.28 88.37
Do not know d 5 11.63 11.63 100.00
Total 43 100.0 100.0
Is there any change in your job assignment after successful completion of training?
Value Label Value Frequency Percent Valid Percent
Cum Percent
Promotion a 8 18.60 18.60 18.60
More responsibility b 24 55.81 55.81 74.42
Consider a request for transfer c 3 6.98 6.98 81.40
Job rotation or change of department
d 8 18.60 18.60 100.00
Total 43 100.0 100.0
Considering the trainings attended by you in the recent past, effectiveness of training and the job you are performing after the training what do you feel about the trainings
Value Label Value Frequency Percent Valid Percent
Cum Percent
They are very much useful and improve the efficiency
a 32 74.42 74.42 74.42
Not that useful but should be conducted for whatever improvement they bring in
b 7 16.28 16.28 90.70
They are not that much useful but help the employee in diverting his attention and relaxing
c 3 6.98 6.98 97.67
They are least useful but should be conducted as company policy requires the trainings to be conducted
d 1 2.33 2.33 100.00
Total 43 100.0 100.0
Did you attend any government aided training programmes?
Value Label Value Frequency Percent Valid Percent Cum Percent
Yes a 5 11.63 11.63 11.63
No b 38 88.37 88.37 100.00
Total 43 100.0 100.0
Who do you think are given more preference in trainings?
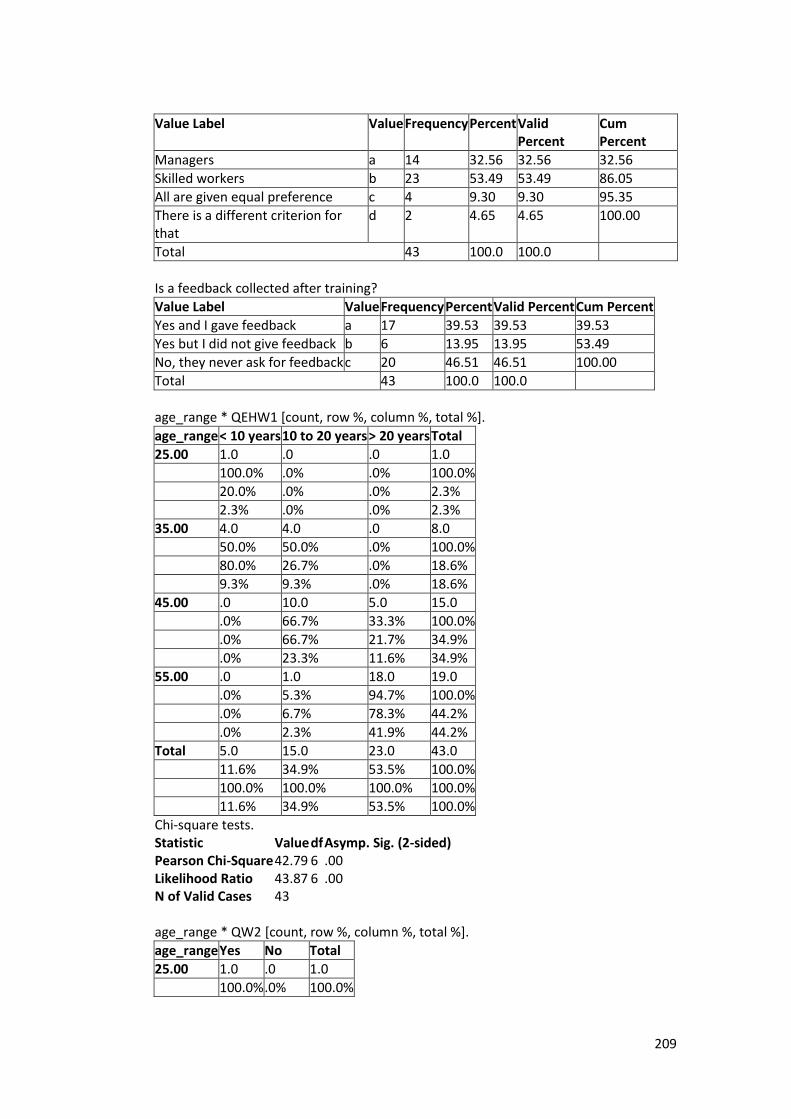
209
Value Label Value Frequency Percent Valid Percent
Cum Percent
Managers a 14 32.56 32.56 32.56
Skilled workers b 23 53.49 53.49 86.05
All are given equal preference c 4 9.30 9.30 95.35
There is a different criterion for that
d 2 4.65 4.65 100.00
Total 43 100.0 100.0
Is a feedback collected after training?
Value Label Value Frequency Percent Valid Percent Cum Percent
Yes and I gave feedback a 17 39.53 39.53 39.53
Yes but I did not give feedback b 6 13.95 13.95 53.49
No, they never ask for feedback c 20 46.51 46.51 100.00
Total 43 100.0 100.0
age_range * QEHW1 [count, row %, column %, total %].
age_range < 10 years 10 to 20 years > 20 years Total
25.00 1.0 .0 .0 1.0
100.0% .0% .0% 100.0%
20.0% .0% .0% 2.3%
2.3% .0% .0% 2.3%
35.00 4.0 4.0 .0 8.0
50.0% 50.0% .0% 100.0%
80.0% 26.7% .0% 18.6%
9.3% 9.3% .0% 18.6%
45.00 .0 10.0 5.0 15.0
.0% 66.7% 33.3% 100.0%
.0% 66.7% 21.7% 34.9%
.0% 23.3% 11.6% 34.9%
55.00 .0 1.0 18.0 19.0
.0% 5.3% 94.7% 100.0%
.0% 6.7% 78.3% 44.2%
.0% 2.3% 41.9% 44.2%
Total 5.0 15.0 23.0 43.0
11.6% 34.9% 53.5% 100.0%
100.0% 100.0% 100.0% 100.0%
11.6% 34.9% 53.5% 100.0%
Chi-square tests. Statistic Value df Asymp. Sig. (2-sided) Pearson Chi-Square 42.79 6 .00 Likelihood Ratio 43.87 6 .00 N of Valid Cases 43 age_range * QW2 [count, row %, column %, total %].
age_range Yes No Total
25.00 1.0 .0 1.0
100.0% .0% 100.0%

210
age_range Yes No Total
4.2% .0% 2.3%
2.3% .0% 2.3%
35.00 6.0 2.0 8.0
75.0% 25.0% 100.0%
25.0% 10.5% 18.6%
14.0% 4.7% 18.6%
45.00 9.0 6.0 15.0
60.0% 40.0% 100.0%
37.5% 31.6% 34.9%
20.9% 14.0% 34.9%
55.00 8.0 11.0 19.0
42.1% 57.9% 100.0%
33.3% 57.9% 44.2%
18.6% 25.6% 44.2%
Total 24.0 19.0 43.0
55.8% 44.2% 100.0%
100.0% 100.0% 100.0%
55.8% 44.2% 100.0%
Chi-square tests. Statistic Value df Asymp. Sig. (2-sided) Pearson Chi-Square 3.54 3 .32 Likelihood Ratio 3.98 3 .26 N of Valid Cases 43 age_range * QW3 [count, row %, column %, total %].
age_range Yes No Total
25.00 1.0 .0 1.0
100.0% .0% 100.0%
3.6% .0% 2.3%
2.3% .0% 2.3%
35.00 6.0 2.0 8.0
75.0% 25.0% 100.0%
21.4% 13.3% 18.6%
14.0% 4.7% 18.6%
45.00 11.0 4.0 15.0
73.3% 26.7% 100.0%
39.3% 26.7% 34.9%
25.6% 9.3% 34.9%
55.00 10.0 9.0 19.0
52.6% 47.4% 100.0%
35.7% 60.0% 44.2%
23.3% 20.9% 44.2%
Total 28.0 15.0 43.0
65.1% 34.9% 100.0%
100.0% 100.0% 100.0%
65.1% 34.9% 100.0%
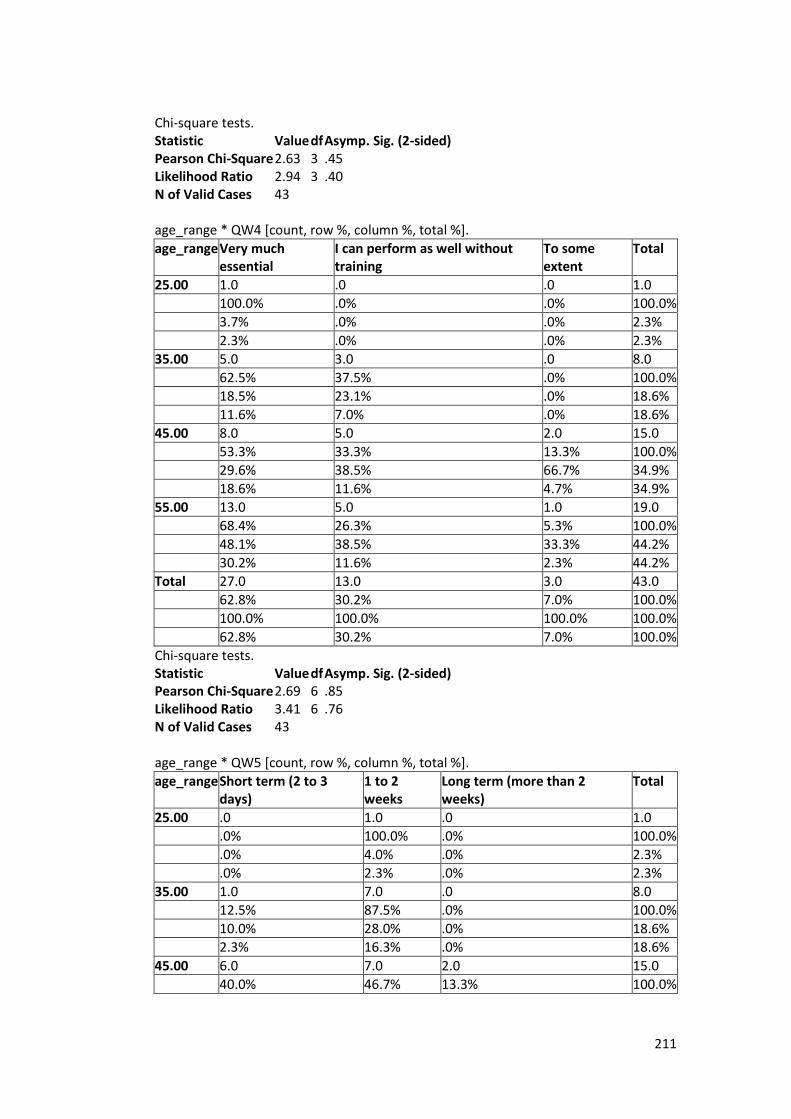
211
Chi-square tests. Statistic Value df Asymp. Sig. (2-sided) Pearson Chi-Square 2.63 3 .45 Likelihood Ratio 2.94 3 .40 N of Valid Cases 43 age_range * QW4 [count, row %, column %, total %].
age_range Very much essential
I can perform as well without training
To some extent
Total
25.00 1.0 .0 .0 1.0
100.0% .0% .0% 100.0%
3.7% .0% .0% 2.3%
2.3% .0% .0% 2.3%
35.00 5.0 3.0 .0 8.0
62.5% 37.5% .0% 100.0%
18.5% 23.1% .0% 18.6%
11.6% 7.0% .0% 18.6%
45.00 8.0 5.0 2.0 15.0
53.3% 33.3% 13.3% 100.0%
29.6% 38.5% 66.7% 34.9%
18.6% 11.6% 4.7% 34.9%
55.00 13.0 5.0 1.0 19.0
68.4% 26.3% 5.3% 100.0%
48.1% 38.5% 33.3% 44.2%
30.2% 11.6% 2.3% 44.2%
Total 27.0 13.0 3.0 43.0
62.8% 30.2% 7.0% 100.0%
100.0% 100.0% 100.0% 100.0%
62.8% 30.2% 7.0% 100.0%
Chi-square tests. Statistic Value df Asymp. Sig. (2-sided) Pearson Chi-Square 2.69 6 .85 Likelihood Ratio 3.41 6 .76 N of Valid Cases 43 age_range * QW5 [count, row %, column %, total %].
age_range Short term (2 to 3 days)
1 to 2 weeks
Long term (more than 2 weeks)
Total
25.00 .0 1.0 .0 1.0
.0% 100.0% .0% 100.0%
.0% 4.0% .0% 2.3%
.0% 2.3% .0% 2.3%
35.00 1.0 7.0 .0 8.0
12.5% 87.5% .0% 100.0%
10.0% 28.0% .0% 18.6%
2.3% 16.3% .0% 18.6%
45.00 6.0 7.0 2.0 15.0
40.0% 46.7% 13.3% 100.0%
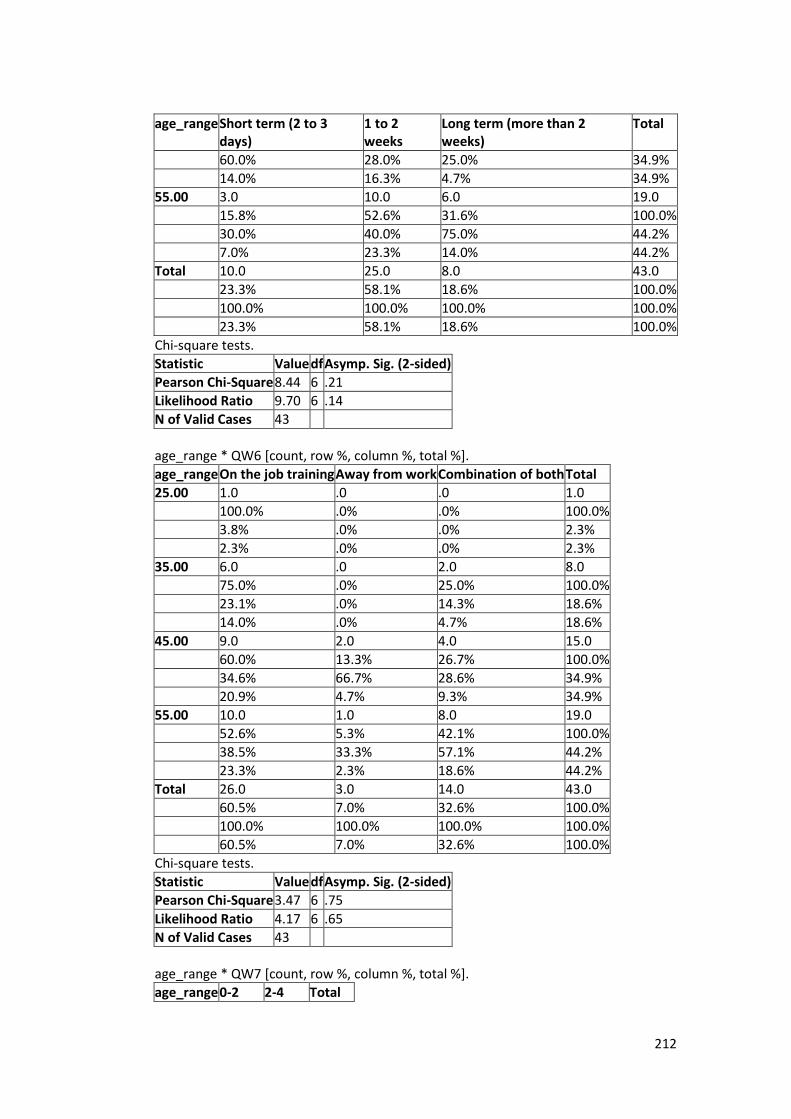
212
age_range Short term (2 to 3 days)
1 to 2 weeks
Long term (more than 2 weeks)
Total
60.0% 28.0% 25.0% 34.9%
14.0% 16.3% 4.7% 34.9%
55.00 3.0 10.0 6.0 19.0
15.8% 52.6% 31.6% 100.0%
30.0% 40.0% 75.0% 44.2%
7.0% 23.3% 14.0% 44.2%
Total 10.0 25.0 8.0 43.0
23.3% 58.1% 18.6% 100.0%
100.0% 100.0% 100.0% 100.0%
23.3% 58.1% 18.6% 100.0%
Chi-square tests.
Statistic Value df Asymp. Sig. (2-sided)
Pearson Chi-Square 8.44 6 .21
Likelihood Ratio 9.70 6 .14
N of Valid Cases 43
age_range * QW6 [count, row %, column %, total %].
age_range On the job training Away from work Combination of both Total
25.00 1.0 .0 .0 1.0
100.0% .0% .0% 100.0%
3.8% .0% .0% 2.3%
2.3% .0% .0% 2.3%
35.00 6.0 .0 2.0 8.0
75.0% .0% 25.0% 100.0%
23.1% .0% 14.3% 18.6%
14.0% .0% 4.7% 18.6%
45.00 9.0 2.0 4.0 15.0
60.0% 13.3% 26.7% 100.0%
34.6% 66.7% 28.6% 34.9%
20.9% 4.7% 9.3% 34.9%
55.00 10.0 1.0 8.0 19.0
52.6% 5.3% 42.1% 100.0%
38.5% 33.3% 57.1% 44.2%
23.3% 2.3% 18.6% 44.2%
Total 26.0 3.0 14.0 43.0
60.5% 7.0% 32.6% 100.0%
100.0% 100.0% 100.0% 100.0%
60.5% 7.0% 32.6% 100.0%
Chi-square tests.
Statistic Value df Asymp. Sig. (2-sided)
Pearson Chi-Square 3.47 6 .75
Likelihood Ratio 4.17 6 .65
N of Valid Cases 43
age_range * QW7 [count, row %, column %, total %].
age_range 0-2 2-4 Total
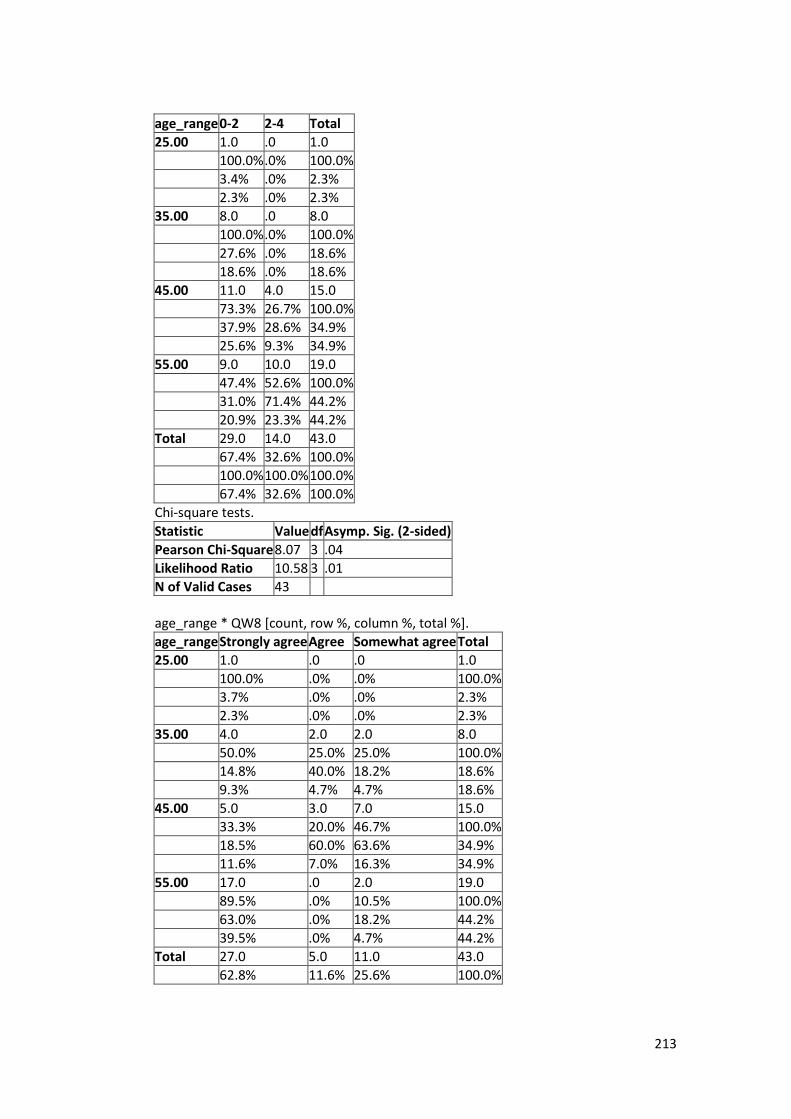
213
age_range 0-2 2-4 Total
25.00 1.0 .0 1.0
100.0% .0% 100.0%
3.4% .0% 2.3%
2.3% .0% 2.3%
35.00 8.0 .0 8.0
100.0% .0% 100.0%
27.6% .0% 18.6%
18.6% .0% 18.6%
45.00 11.0 4.0 15.0
73.3% 26.7% 100.0%
37.9% 28.6% 34.9%
25.6% 9.3% 34.9%
55.00 9.0 10.0 19.0
47.4% 52.6% 100.0%
31.0% 71.4% 44.2%
20.9% 23.3% 44.2%
Total 29.0 14.0 43.0
67.4% 32.6% 100.0%
100.0% 100.0% 100.0%
67.4% 32.6% 100.0%
Chi-square tests.
Statistic Value df Asymp. Sig. (2-sided)
Pearson Chi-Square 8.07 3 .04
Likelihood Ratio 10.58 3 .01
N of Valid Cases 43
age_range * QW8 [count, row %, column %, total %].
age_range Strongly agree Agree Somewhat agree Total
25.00 1.0 .0 .0 1.0
100.0% .0% .0% 100.0%
3.7% .0% .0% 2.3%
2.3% .0% .0% 2.3%
35.00 4.0 2.0 2.0 8.0
50.0% 25.0% 25.0% 100.0%
14.8% 40.0% 18.2% 18.6%
9.3% 4.7% 4.7% 18.6%
45.00 5.0 3.0 7.0 15.0
33.3% 20.0% 46.7% 100.0%
18.5% 60.0% 63.6% 34.9%
11.6% 7.0% 16.3% 34.9%
55.00 17.0 .0 2.0 19.0
89.5% .0% 10.5% 100.0%
63.0% .0% 18.2% 44.2%
39.5% .0% 4.7% 44.2%
Total 27.0 5.0 11.0 43.0
62.8% 11.6% 25.6% 100.0%
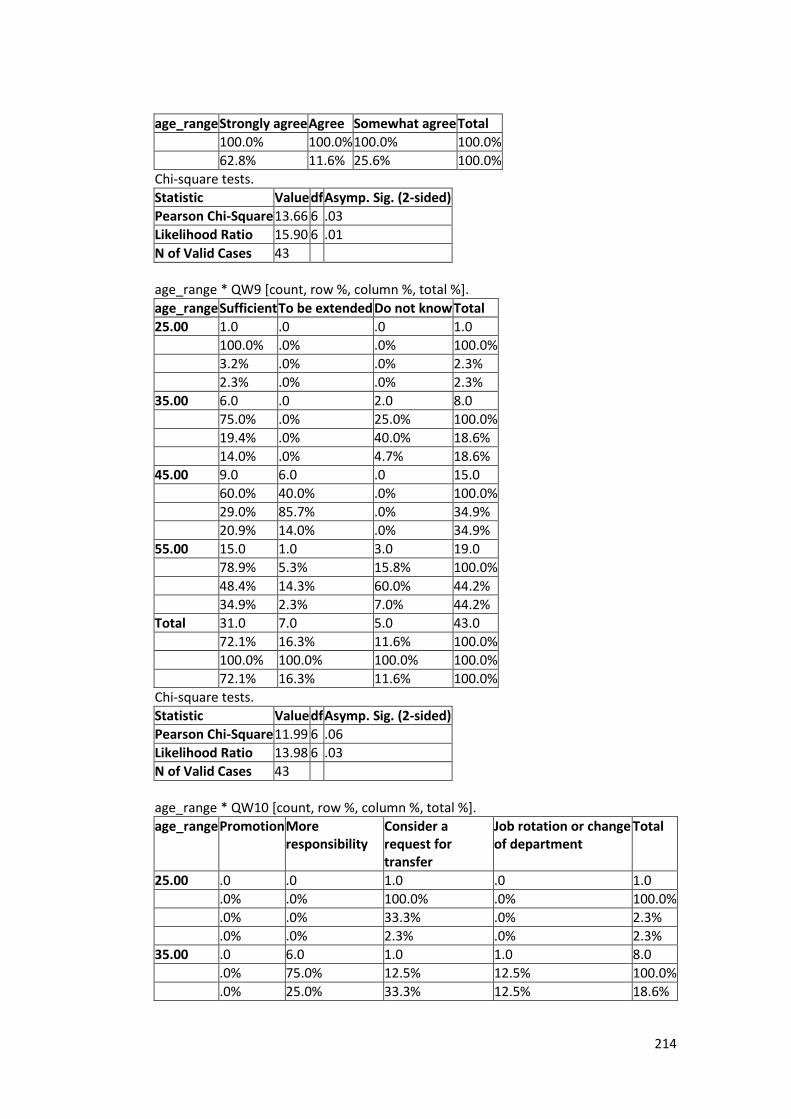
214
age_range Strongly agree Agree Somewhat agree Total
100.0% 100.0% 100.0% 100.0%
62.8% 11.6% 25.6% 100.0%
Chi-square tests.
Statistic Value df Asymp. Sig. (2-sided)
Pearson Chi-Square 13.66 6 .03
Likelihood Ratio 15.90 6 .01
N of Valid Cases 43
age_range * QW9 [count, row %, column %, total %].
age_range Sufficient To be extended Do not know Total
25.00 1.0 .0 .0 1.0
100.0% .0% .0% 100.0%
3.2% .0% .0% 2.3%
2.3% .0% .0% 2.3%
35.00 6.0 .0 2.0 8.0
75.0% .0% 25.0% 100.0%
19.4% .0% 40.0% 18.6%
14.0% .0% 4.7% 18.6%
45.00 9.0 6.0 .0 15.0
60.0% 40.0% .0% 100.0%
29.0% 85.7% .0% 34.9%
20.9% 14.0% .0% 34.9%
55.00 15.0 1.0 3.0 19.0
78.9% 5.3% 15.8% 100.0%
48.4% 14.3% 60.0% 44.2%
34.9% 2.3% 7.0% 44.2%
Total 31.0 7.0 5.0 43.0
72.1% 16.3% 11.6% 100.0%
100.0% 100.0% 100.0% 100.0%
72.1% 16.3% 11.6% 100.0%
Chi-square tests.
Statistic Value df Asymp. Sig. (2-sided)
Pearson Chi-Square 11.99 6 .06
Likelihood Ratio 13.98 6 .03
N of Valid Cases 43
age_range * QW10 [count, row %, column %, total %].
age_range Promotion More responsibility
Consider a request for transfer
Job rotation or change of department
Total
25.00 .0 .0 1.0 .0 1.0
.0% .0% 100.0% .0% 100.0%
.0% .0% 33.3% .0% 2.3%
.0% .0% 2.3% .0% 2.3%
35.00 .0 6.0 1.0 1.0 8.0
.0% 75.0% 12.5% 12.5% 100.0%
.0% 25.0% 33.3% 12.5% 18.6%

215
age_range Promotion More responsibility
Consider a request for transfer
Job rotation or change of department
Total
.0% 14.0% 2.3% 2.3% 18.6%
45.00 3.0 6.0 1.0 5.0 15.0
20.0% 40.0% 6.7% 33.3% 100.0%
37.5% 25.0% 33.3% 62.5% 34.9%
7.0% 14.0% 2.3% 11.6% 34.9%
55.00 5.0 12.0 .0 2.0 19.0
26.3% 63.2% .0% 10.5% 100.0%
62.5% 50.0% .0% 25.0% 44.2%
11.6% 27.9% .0% 4.7% 44.2%
Total 8.0 24.0 3.0 8.0 43.0
18.6% 55.8% 7.0% 18.6% 100.0%
100.0% 100.0% 100.0% 100.0% 100.0%
18.6% 55.8% 7.0% 18.6% 100.0%
Chi-square tests.
Statistic Value df Asymp. Sig. (2-sided)
Pearson Chi-Square 21.08 9 .01
Likelihood Ratio 15.57 9 .08
N of Valid Cases 43
age_range * QW11 [count, row %, column %, total %].
age_range They are very much useful and improve the efficiency
Not that useful but should be conducted for whatever improvement they bring in
They are not that much useful but help the employee in diverting his attention and relaxing
They are least useful but should be conducted as company policy requires the trainings to be conducted
Total
25.00 1.0 .0 .0 .0 1.0
100.0% .0% .0% .0% 100.0%
3.1% .0% .0% .0% 2.3%
2.3% .0% .0% .0% 2.3%
35.00 4.0 4.0 .0 .0 8.0
50.0% 50.0% .0% .0% 100.0%
12.5% 57.1% .0% .0% 18.6%
9.3% 9.3% .0% .0% 18.6%
45.00 11.0 3.0 1.0 .0 15.0
73.3% 20.0% 6.7% .0% 100.0%
34.4% 42.9% 33.3% .0% 34.9%
25.6% 7.0% 2.3% .0% 34.9%
55.00 16.0 .0 2.0 1.0 19.0
84.2% .0% 10.5% 5.3% 100.0%
50.0% .0% 66.7% 100.0% 44.2%
37.2% .0% 4.7% 2.3% 44.2%
Total 32.0 7.0 3.0 1.0 43.0
74.4% 16.3% 7.0% 2.3% 100.0%
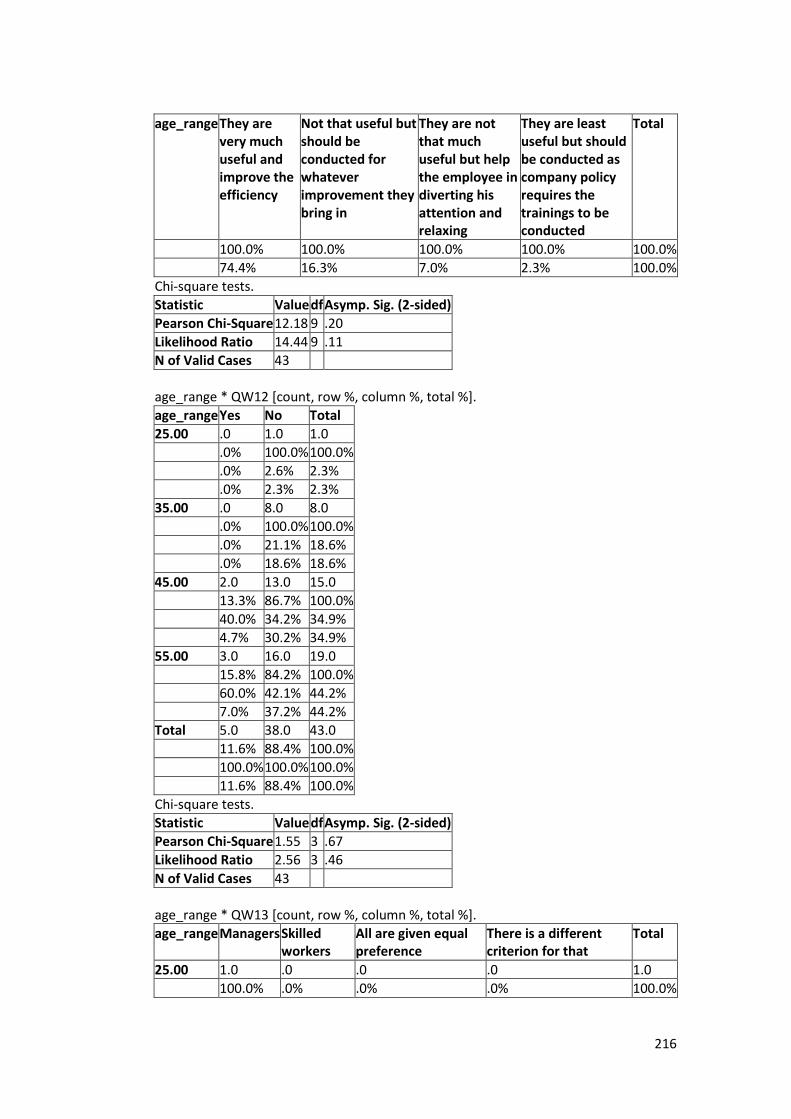
216
age_range They are very much useful and improve the efficiency
Not that useful but should be conducted for whatever improvement they bring in
They are not that much useful but help the employee in diverting his attention and relaxing
They are least useful but should be conducted as company policy requires the trainings to be conducted
Total
100.0% 100.0% 100.0% 100.0% 100.0%
74.4% 16.3% 7.0% 2.3% 100.0%
Chi-square tests.
Statistic Value df Asymp. Sig. (2-sided)
Pearson Chi-Square 12.18 9 .20
Likelihood Ratio 14.44 9 .11
N of Valid Cases 43
age_range * QW12 [count, row %, column %, total %].
age_range Yes No Total
25.00 .0 1.0 1.0
.0% 100.0% 100.0%
.0% 2.6% 2.3%
.0% 2.3% 2.3%
35.00 .0 8.0 8.0
.0% 100.0% 100.0%
.0% 21.1% 18.6%
.0% 18.6% 18.6%
45.00 2.0 13.0 15.0
13.3% 86.7% 100.0%
40.0% 34.2% 34.9%
4.7% 30.2% 34.9%
55.00 3.0 16.0 19.0
15.8% 84.2% 100.0%
60.0% 42.1% 44.2%
7.0% 37.2% 44.2%
Total 5.0 38.0 43.0
11.6% 88.4% 100.0%
100.0% 100.0% 100.0%
11.6% 88.4% 100.0%
Chi-square tests.
Statistic Value df Asymp. Sig. (2-sided)
Pearson Chi-Square 1.55 3 .67
Likelihood Ratio 2.56 3 .46
N of Valid Cases 43
age_range * QW13 [count, row %, column %, total %].
age_range Managers Skilled workers
All are given equal preference
There is a different criterion for that
Total
25.00 1.0 .0 .0 .0 1.0
100.0% .0% .0% .0% 100.0%

217
age_range Managers Skilled workers
All are given equal preference
There is a different criterion for that
Total
7.1% .0% .0% .0% 2.3%
2.3% .0% .0% .0% 2.3%
35.00 3.0 5.0 .0 .0 8.0
37.5% 62.5% .0% .0% 100.0%
21.4% 21.7% .0% .0% 18.6%
7.0% 11.6% .0% .0% 18.6%
45.00 5.0 8.0 2.0 .0 15.0
33.3% 53.3% 13.3% .0% 100.0%
35.7% 34.8% 50.0% .0% 34.9%
11.6% 18.6% 4.7% .0% 34.9%
55.00 5.0 10.0 2.0 2.0 19.0
26.3% 52.6% 10.5% 10.5% 100.0%
35.7% 43.5% 50.0% 100.0% 44.2%
11.6% 23.3% 4.7% 4.7% 44.2%
Total 14.0 23.0 4.0 2.0 43.0
32.6% 53.5% 9.3% 4.7% 100.0%
100.0% 100.0% 100.0% 100.0% 100.0%
32.6% 53.5% 9.3% 4.7% 100.0%
Chi-square tests.
Statistic Value df Asymp. Sig. (2-sided)
Pearson Chi-Square 6.00 9 .74
Likelihood Ratio 7.59 9 .58
N of Valid Cases 43
age_range * QW14 [count, row %, column %, total %].
age_range Yes and I gave feedback
Yes but I did not give feedback
No, they never ask for feedback
Total
25.00 .0 .0 1.0 1.0
.0% .0% 100.0% 100.0%
.0% .0% 5.0% 2.3%
.0% .0% 2.3% 2.3%
35.00 1.0 1.0 6.0 8.0
12.5% 12.5% 75.0% 100.0%
5.9% 16.7% 30.0% 18.6%
2.3% 2.3% 14.0% 18.6%
45.00 3.0 2.0 10.0 15.0
20.0% 13.3% 66.7% 100.0%
17.6% 33.3% 50.0% 34.9%
7.0% 4.7% 23.3% 34.9%
55.00 13.0 3.0 3.0 19.0
68.4% 15.8% 15.8% 100.0%
76.5% 50.0% 15.0% 44.2%
30.2% 7.0% 7.0% 44.2%
Total 17.0 6.0 20.0 43.0
39.5% 14.0% 46.5% 100.0%
100.0% 100.0% 100.0% 100.0%

218
age_range Yes and I gave feedback
Yes but I did not give feedback
No, they never ask for feedback
Total
39.5% 14.0% 46.5% 100.0%
Chi-square tests.
Statistic Value df Asymp. Sig. (2-sided)
Pearson Chi-Square 14.71 6 .02
Likelihood Ratio 16.19 6 .01
N of Valid Cases 43
Gender * QEHW1 [count, row %, column %, total %].
Gender < 10 years 10 to 20 years > 20 years Total
Female 3.0 6.0 .0 9.0
33.3% 66.7% .0% 100.0%
60.0% 40.0% .0% 20.9%
7.0% 14.0% .0% 20.9%
Male 2.0 9.0 23.0 34.0
5.9% 26.5% 67.6% 100.0%
40.0% 60.0% 100.0% 79.1%
4.7% 20.9% 53.5% 79.1%
Total 5.0 15.0 23.0 43.0
11.6% 34.9% 53.5% 100.0%
100.0% 100.0% 100.0% 100.0%
11.6% 34.9% 53.5% 100.0%
Chi-square tests.
Statistic Value df Asymp. Sig. (2-sided)
Pearson Chi-Square 14.00 2 .00
Likelihood Ratio 17.20 2 .00
N of Valid Cases 43
Gender * QW2 [count, row %, column %, total %].
Gender Yes No Total
Female 7.0 2.0 9.0
77.8% 22.2% 100.0%
29.2% 10.5% 20.9%
16.3% 4.7% 20.9%
Male 17.0 17.0 34.0
50.0% 50.0% 100.0%
70.8% 89.5% 79.1%
39.5% 39.5% 79.1%
Total 24.0 19.0 43.0
55.8% 44.2% 100.0%
100.0% 100.0% 100.0%
55.8% 44.2% 100.0%
Chi-square tests.
Statistic Value df Asymp. Sig. (2-sided)
Exact Sig. (2-sided)
Exact Sig. (1-sided)
Pearson Chi-Square 2.23 1 .14
Likelihood Ratio 2.36 1 .12

219
Statistic Value df Asymp. Sig. (2-sided)
Exact Sig. (2-sided)
Exact Sig. (1-sided)
Fisher's Exact Test 1.00 .13
Continuity Correction
1.24 1 .26
N of Valid Cases 43
Gender * QW3 [count, row %, column %, total %].
Gender Yes No Total
Female 7.0 2.0 9.0
77.8% 22.2% 100.0%
25.0% 13.3% 20.9%
16.3% 4.7% 20.9%
Male 21.0 13.0 34.0
61.8% 38.2% 100.0%
75.0% 86.7% 79.1%
48.8% 30.2% 79.1%
Total 28.0 15.0 43.0
65.1% 34.9% 100.0%
100.0% 100.0% 100.0%
65.1% 34.9% 100.0%
Chi-square tests.
Statistic Value df Asymp. Sig. (2-sided)
Exact Sig. (2-sided)
Exact Sig. (1-sided)
Pearson Chi-Square .80 1 .37
Likelihood Ratio .85 1 .36
Fisher's Exact Test 1.00 .32
Continuity Correction
.25 1 .61
N of Valid Cases 43
Gender * QW4 [count, row %, column %, total %].
Gender Very much essential
I can perform as well without training
To some extent
Total
Female 7.0 1.0 1.0 9.0
77.8% 11.1% 11.1% 100.0%
25.9% 7.7% 33.3% 20.9%
16.3% 2.3% 2.3% 20.9%
Male 20.0 12.0 2.0 34.0
58.8% 35.3% 5.9% 100.0%
74.1% 92.3% 66.7% 79.1%
46.5% 27.9% 4.7% 79.1%
Total 27.0 13.0 3.0 43.0
62.8% 30.2% 7.0% 100.0%
100.0% 100.0% 100.0% 100.0%
62.8% 30.2% 7.0% 100.0%
Chi-square tests.
Statistic Value df Asymp. Sig. (2-sided)
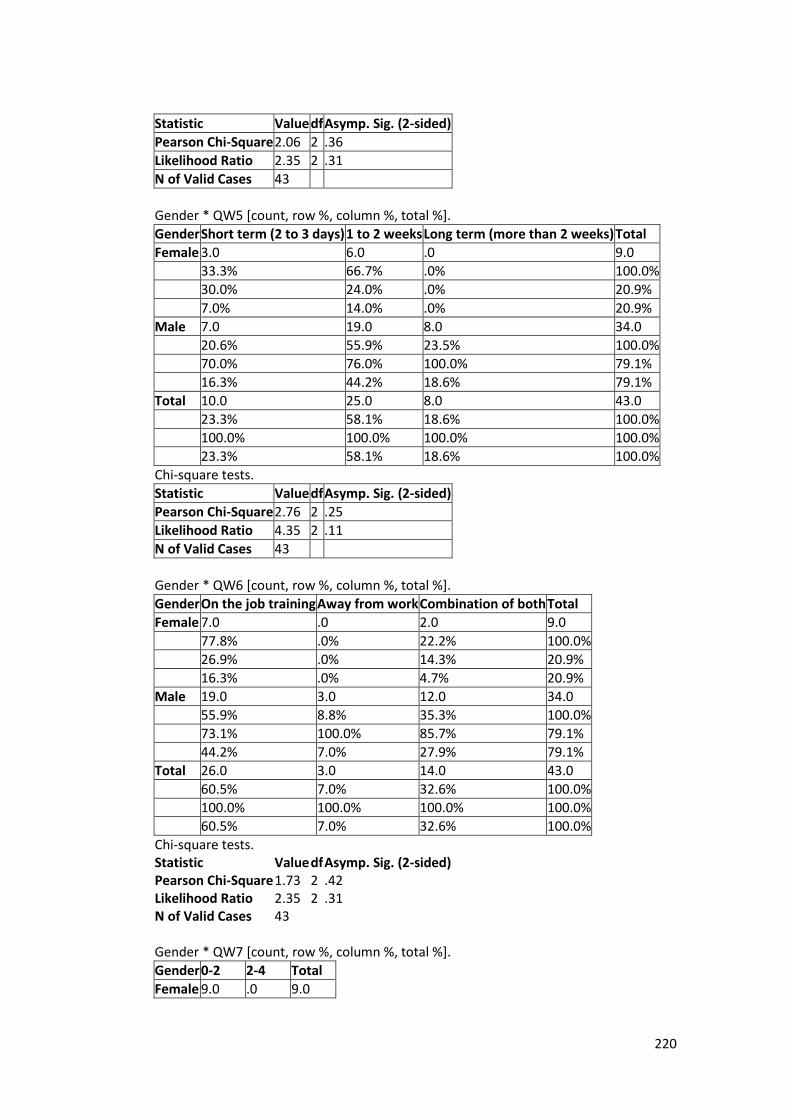
220
Statistic Value df Asymp. Sig. (2-sided)
Pearson Chi-Square 2.06 2 .36
Likelihood Ratio 2.35 2 .31
N of Valid Cases 43
Gender * QW5 [count, row %, column %, total %].
Gender Short term (2 to 3 days) 1 to 2 weeks Long term (more than 2 weeks) Total
Female 3.0 6.0 .0 9.0
33.3% 66.7% .0% 100.0%
30.0% 24.0% .0% 20.9%
7.0% 14.0% .0% 20.9%
Male 7.0 19.0 8.0 34.0
20.6% 55.9% 23.5% 100.0%
70.0% 76.0% 100.0% 79.1%
16.3% 44.2% 18.6% 79.1%
Total 10.0 25.0 8.0 43.0
23.3% 58.1% 18.6% 100.0%
100.0% 100.0% 100.0% 100.0%
23.3% 58.1% 18.6% 100.0%
Chi-square tests.
Statistic Value df Asymp. Sig. (2-sided)
Pearson Chi-Square 2.76 2 .25
Likelihood Ratio 4.35 2 .11
N of Valid Cases 43
Gender * QW6 [count, row %, column %, total %].
Gender On the job training Away from work Combination of both Total
Female 7.0 .0 2.0 9.0
77.8% .0% 22.2% 100.0%
26.9% .0% 14.3% 20.9%
16.3% .0% 4.7% 20.9%
Male 19.0 3.0 12.0 34.0
55.9% 8.8% 35.3% 100.0%
73.1% 100.0% 85.7% 79.1%
44.2% 7.0% 27.9% 79.1%
Total 26.0 3.0 14.0 43.0
60.5% 7.0% 32.6% 100.0%
100.0% 100.0% 100.0% 100.0%
60.5% 7.0% 32.6% 100.0%
Chi-square tests. Statistic Value df Asymp. Sig. (2-sided) Pearson Chi-Square 1.73 2 .42 Likelihood Ratio 2.35 2 .31 N of Valid Cases 43 Gender * QW7 [count, row %, column %, total %].
Gender 0-2 2-4 Total
Female 9.0 .0 9.0
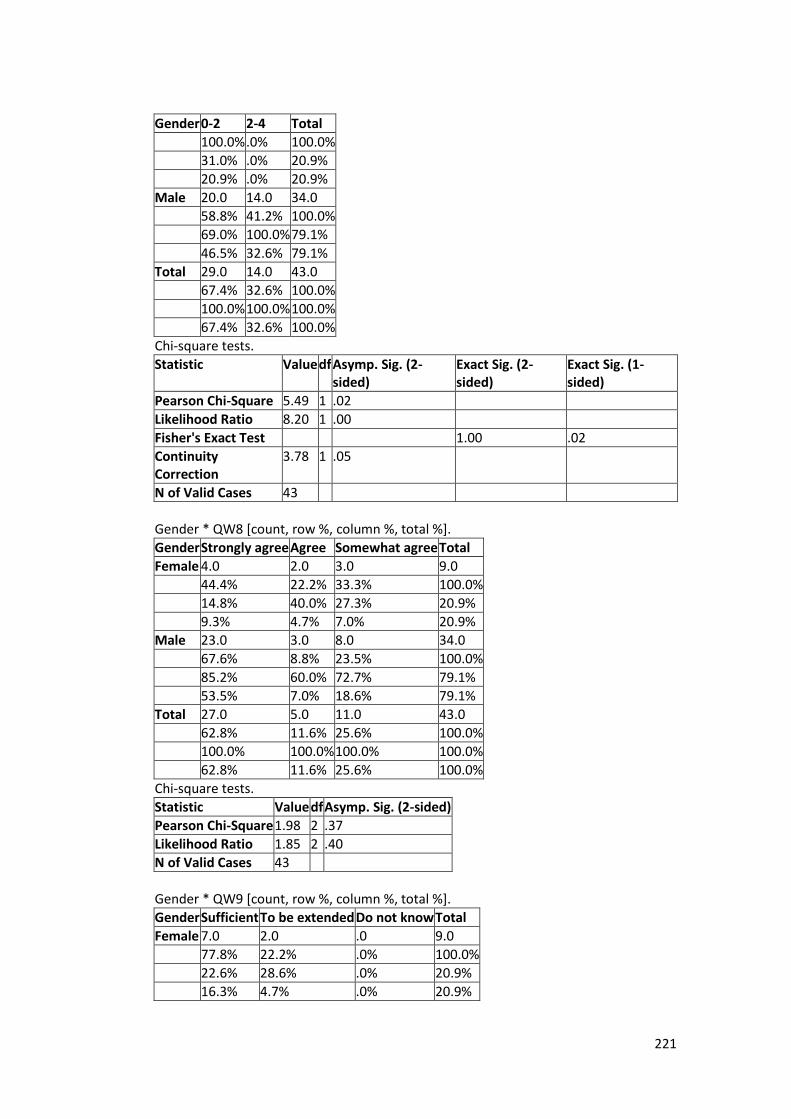
221
Gender 0-2 2-4 Total
100.0% .0% 100.0%
31.0% .0% 20.9%
20.9% .0% 20.9%
Male 20.0 14.0 34.0
58.8% 41.2% 100.0%
69.0% 100.0% 79.1%
46.5% 32.6% 79.1%
Total 29.0 14.0 43.0
67.4% 32.6% 100.0%
100.0% 100.0% 100.0%
67.4% 32.6% 100.0%
Chi-square tests.
Statistic Value df Asymp. Sig. (2-sided)
Exact Sig. (2-sided)
Exact Sig. (1-sided)
Pearson Chi-Square 5.49 1 .02
Likelihood Ratio 8.20 1 .00
Fisher's Exact Test 1.00 .02
Continuity Correction
3.78 1 .05
N of Valid Cases 43
Gender * QW8 [count, row %, column %, total %].
Gender Strongly agree Agree Somewhat agree Total
Female 4.0 2.0 3.0 9.0
44.4% 22.2% 33.3% 100.0%
14.8% 40.0% 27.3% 20.9%
9.3% 4.7% 7.0% 20.9%
Male 23.0 3.0 8.0 34.0
67.6% 8.8% 23.5% 100.0%
85.2% 60.0% 72.7% 79.1%
53.5% 7.0% 18.6% 79.1%
Total 27.0 5.0 11.0 43.0
62.8% 11.6% 25.6% 100.0%
100.0% 100.0% 100.0% 100.0%
62.8% 11.6% 25.6% 100.0%
Chi-square tests.
Statistic Value df Asymp. Sig. (2-sided)
Pearson Chi-Square 1.98 2 .37
Likelihood Ratio 1.85 2 .40
N of Valid Cases 43
Gender * QW9 [count, row %, column %, total %].
Gender Sufficient To be extended Do not know Total
Female 7.0 2.0 .0 9.0
77.8% 22.2% .0% 100.0%
22.6% 28.6% .0% 20.9%
16.3% 4.7% .0% 20.9%
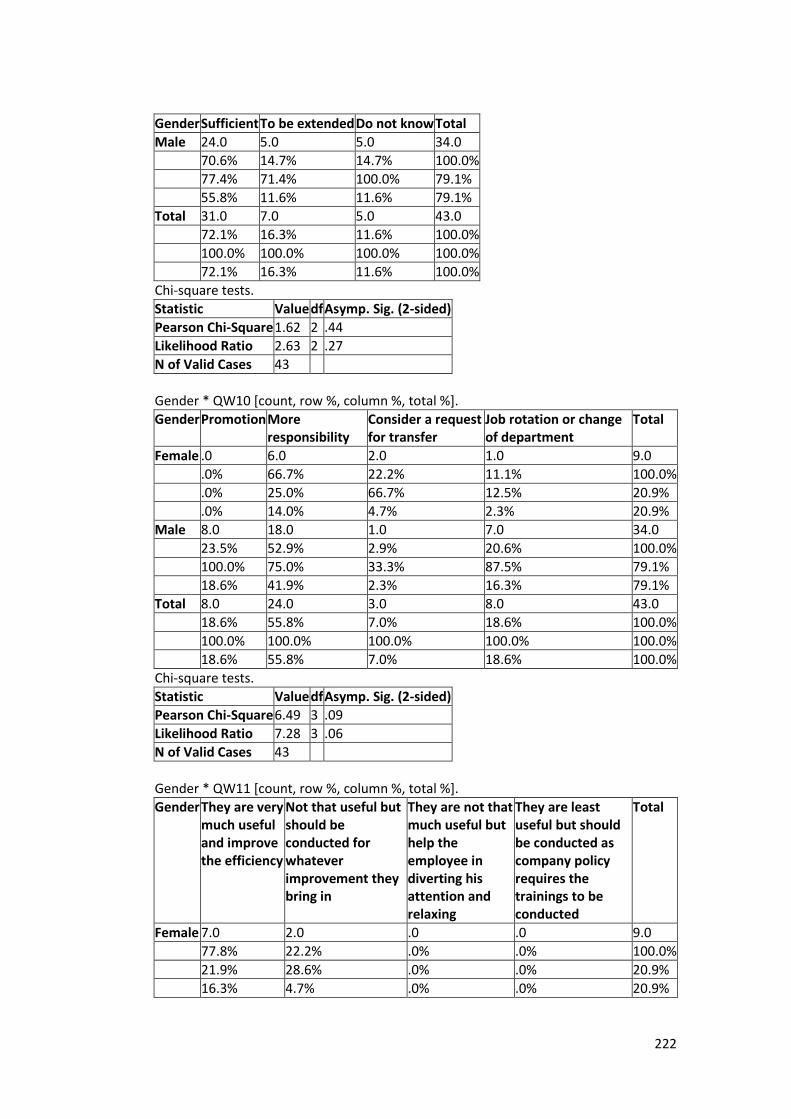
222
Gender Sufficient To be extended Do not know Total
Male 24.0 5.0 5.0 34.0
70.6% 14.7% 14.7% 100.0%
77.4% 71.4% 100.0% 79.1%
55.8% 11.6% 11.6% 79.1%
Total 31.0 7.0 5.0 43.0
72.1% 16.3% 11.6% 100.0%
100.0% 100.0% 100.0% 100.0%
72.1% 16.3% 11.6% 100.0%
Chi-square tests.
Statistic Value df Asymp. Sig. (2-sided)
Pearson Chi-Square 1.62 2 .44
Likelihood Ratio 2.63 2 .27
N of Valid Cases 43
Gender * QW10 [count, row %, column %, total %].
Gender Promotion More responsibility
Consider a request for transfer
Job rotation or change of department
Total
Female .0 6.0 2.0 1.0 9.0
.0% 66.7% 22.2% 11.1% 100.0%
.0% 25.0% 66.7% 12.5% 20.9%
.0% 14.0% 4.7% 2.3% 20.9%
Male 8.0 18.0 1.0 7.0 34.0
23.5% 52.9% 2.9% 20.6% 100.0%
100.0% 75.0% 33.3% 87.5% 79.1%
18.6% 41.9% 2.3% 16.3% 79.1%
Total 8.0 24.0 3.0 8.0 43.0
18.6% 55.8% 7.0% 18.6% 100.0%
100.0% 100.0% 100.0% 100.0% 100.0%
18.6% 55.8% 7.0% 18.6% 100.0%
Chi-square tests.
Statistic Value df Asymp. Sig. (2-sided)
Pearson Chi-Square 6.49 3 .09
Likelihood Ratio 7.28 3 .06
N of Valid Cases 43
Gender * QW11 [count, row %, column %, total %].
Gender They are very much useful and improve the efficiency
Not that useful but should be conducted for whatever improvement they bring in
They are not that much useful but help the employee in diverting his attention and relaxing
They are least useful but should be conducted as company policy requires the trainings to be conducted
Total
Female 7.0 2.0 .0 .0 9.0
77.8% 22.2% .0% .0% 100.0%
21.9% 28.6% .0% .0% 20.9%
16.3% 4.7% .0% .0% 20.9%
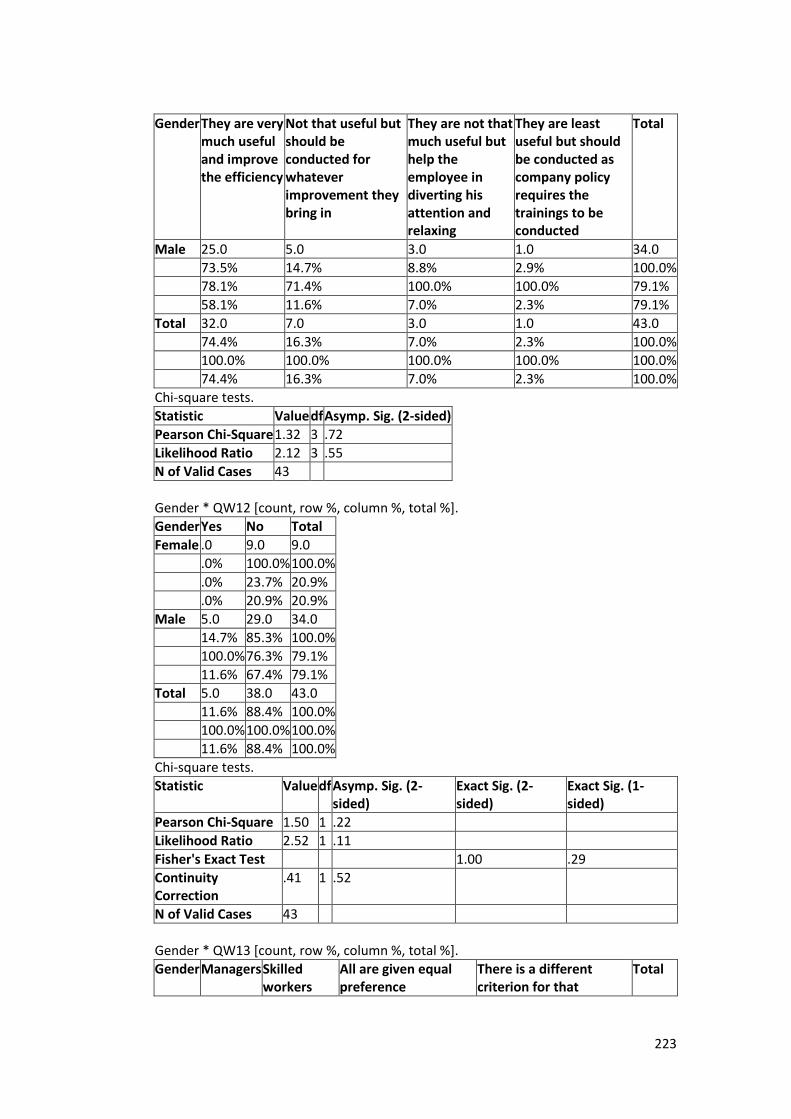
223
Gender They are very much useful and improve the efficiency
Not that useful but should be conducted for whatever improvement they bring in
They are not that much useful but help the employee in diverting his attention and relaxing
They are least useful but should be conducted as company policy requires the trainings to be conducted
Total
Male 25.0 5.0 3.0 1.0 34.0
73.5% 14.7% 8.8% 2.9% 100.0%
78.1% 71.4% 100.0% 100.0% 79.1%
58.1% 11.6% 7.0% 2.3% 79.1%
Total 32.0 7.0 3.0 1.0 43.0
74.4% 16.3% 7.0% 2.3% 100.0%
100.0% 100.0% 100.0% 100.0% 100.0%
74.4% 16.3% 7.0% 2.3% 100.0%
Chi-square tests.
Statistic Value df Asymp. Sig. (2-sided)
Pearson Chi-Square 1.32 3 .72
Likelihood Ratio 2.12 3 .55
N of Valid Cases 43
Gender * QW12 [count, row %, column %, total %].
Gender Yes No Total
Female .0 9.0 9.0
.0% 100.0% 100.0%
.0% 23.7% 20.9%
.0% 20.9% 20.9%
Male 5.0 29.0 34.0
14.7% 85.3% 100.0%
100.0% 76.3% 79.1%
11.6% 67.4% 79.1%
Total 5.0 38.0 43.0
11.6% 88.4% 100.0%
100.0% 100.0% 100.0%
11.6% 88.4% 100.0%
Chi-square tests.
Statistic Value df Asymp. Sig. (2-sided)
Exact Sig. (2-sided)
Exact Sig. (1-sided)
Pearson Chi-Square 1.50 1 .22
Likelihood Ratio 2.52 1 .11
Fisher's Exact Test 1.00 .29
Continuity Correction
.41 1 .52
N of Valid Cases 43
Gender * QW13 [count, row %, column %, total %].
Gender Managers Skilled workers
All are given equal preference
There is a different criterion for that
Total

224
Gender Managers Skilled workers
All are given equal preference
There is a different criterion for that
Total
Female 4.0 4.0 1.0 .0 9.0
44.4% 44.4% 11.1% .0% 100.0%
28.6% 17.4% 25.0% .0% 20.9%
9.3% 9.3% 2.3% .0% 20.9%
Male 10.0 19.0 3.0 2.0 34.0
29.4% 55.9% 8.8% 5.9% 100.0%
71.4% 82.6% 75.0% 100.0% 79.1%
23.3% 44.2% 7.0% 4.7% 79.1%
Total 14.0 23.0 4.0 2.0 43.0
32.6% 53.5% 9.3% 4.7% 100.0%
100.0% 100.0% 100.0% 100.0% 100.0%
32.6% 53.5% 9.3% 4.7% 100.0%
Chi-square tests.
Statistic Value df Asymp. Sig. (2-sided)
Pearson Chi-Square 1.24 3 .74
Likelihood Ratio 1.62 3 .66
N of Valid Cases 43
Gender * QW14 [count, row %, column %, total %].
Gender Yes and I gave feedback
Yes but I did not give feedback
No, they never ask for feedback
Total
Female 2.0 1.0 6.0 9.0
22.2% 11.1% 66.7% 100.0%
11.8% 16.7% 30.0% 20.9%
4.7% 2.3% 14.0% 20.9%
Male 15.0 5.0 14.0 34.0
44.1% 14.7% 41.2% 100.0%
88.2% 83.3% 70.0% 79.1%
34.9% 11.6% 32.6% 79.1%
Total 17.0 6.0 20.0 43.0
39.5% 14.0% 46.5% 100.0%
100.0% 100.0% 100.0% 100.0%
39.5% 14.0% 46.5% 100.0%
Chi-square tests.
Statistic Value df Asymp. Sig. (2-sided)
Pearson Chi-Square 1.92 2 .38
Likelihood Ratio 1.96 2 .37
N of Valid Cases 43
Designation * QEHW1 [count, row %, column %, total %].
Designation < 10 years 10 to 20 years > 20 years Total
Worker 5.0 15.0 23.0 43.0
11.6% 34.9% 53.5% 100.0%
100.0% 100.0% 100.0% 100.0%
11.6% 34.9% 53.5% 100.0%
Total 5.0 15.0 23.0 43.0

225
Designation < 10 years 10 to 20 years > 20 years Total
11.6% 34.9% 53.5% 100.0%
100.0% 100.0% 100.0% 100.0%
11.6% 34.9% 53.5% 100.0%
Chi-square tests.
Statistic Value df Asymp. Sig. (2-sided)
N of Valid Cases 43
Designation * QW2 [count, row %, column %, total %].
Designation Yes No Total
Worker 24.0 19.0 43.0
55.8% 44.2% 100.0%
100.0% 100.0% 100.0%
55.8% 44.2% 100.0%
Total 24.0 19.0 43.0
55.8% 44.2% 100.0%
100.0% 100.0% 100.0%
55.8% 44.2% 100.0%
Chi-square tests. Statistic Value df Asymp. Sig. (2-sided) N of Valid Cases 43 Designation * QW3 [count, row %, column %, total %].
Designation Yes No Total
Worker 28.0 15.0 43.0
65.1% 34.9% 100.0%
100.0% 100.0% 100.0%
65.1% 34.9% 100.0%
Total 28.0 15.0 43.0
65.1% 34.9% 100.0%
100.0% 100.0% 100.0%
65.1% 34.9% 100.0%
Chi-square tests.
Statistic Value df Asymp. Sig. (2-sided)
N of Valid Cases 43
Designation * QW4 [count, row %, column %, total %].
Designation Very much essential
I can perform as well without training
To some extent
Total
Worker 27.0 13.0 3.0 43.0
62.8% 30.2% 7.0% 100.0%
100.0% 100.0% 100.0% 100.0%
62.8% 30.2% 7.0% 100.0%
Total 27.0 13.0 3.0 43.0
62.8% 30.2% 7.0% 100.0%
100.0% 100.0% 100.0% 100.0%
62.8% 30.2% 7.0% 100.0%
Chi-square tests.
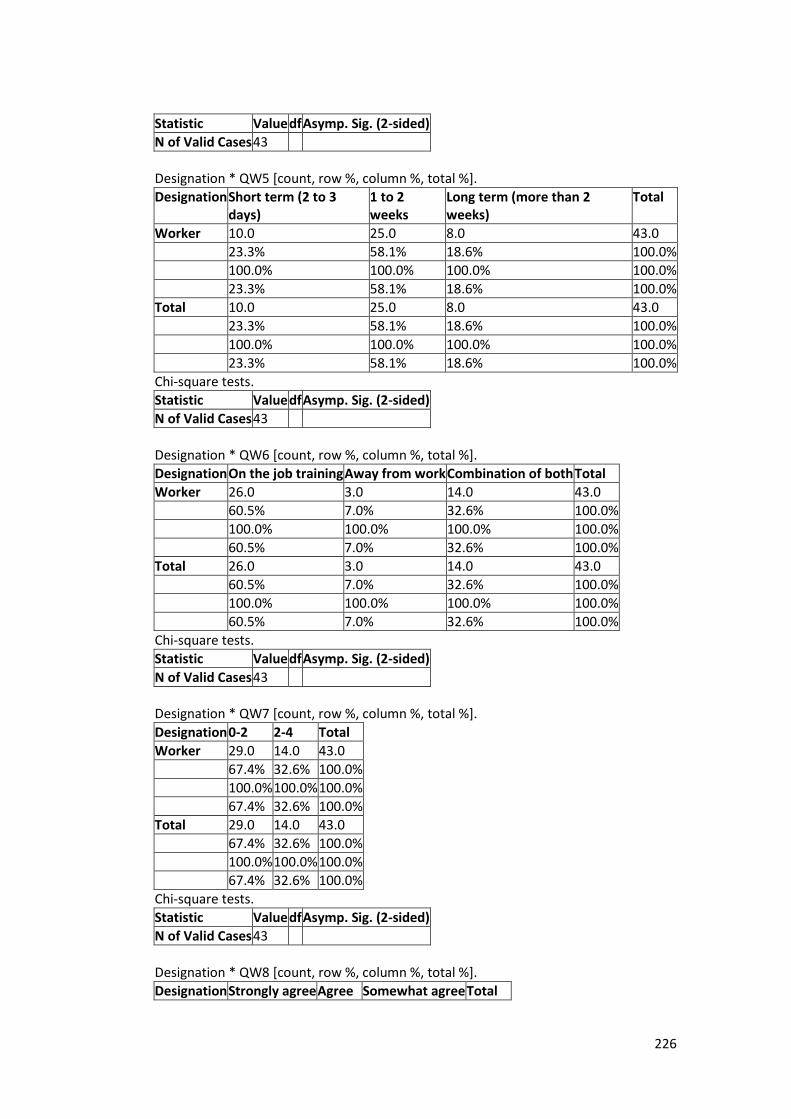
226
Statistic Value df Asymp. Sig. (2-sided)
N of Valid Cases 43
Designation * QW5 [count, row %, column %, total %].
Designation Short term (2 to 3 days)
1 to 2 weeks
Long term (more than 2 weeks)
Total
Worker 10.0 25.0 8.0 43.0
23.3% 58.1% 18.6% 100.0%
100.0% 100.0% 100.0% 100.0%
23.3% 58.1% 18.6% 100.0%
Total 10.0 25.0 8.0 43.0
23.3% 58.1% 18.6% 100.0%
100.0% 100.0% 100.0% 100.0%
23.3% 58.1% 18.6% 100.0%
Chi-square tests.
Statistic Value df Asymp. Sig. (2-sided)
N of Valid Cases 43
Designation * QW6 [count, row %, column %, total %].
Designation On the job training Away from work Combination of both Total
Worker 26.0 3.0 14.0 43.0
60.5% 7.0% 32.6% 100.0%
100.0% 100.0% 100.0% 100.0%
60.5% 7.0% 32.6% 100.0%
Total 26.0 3.0 14.0 43.0
60.5% 7.0% 32.6% 100.0%
100.0% 100.0% 100.0% 100.0%
60.5% 7.0% 32.6% 100.0%
Chi-square tests.
Statistic Value df Asymp. Sig. (2-sided)
N of Valid Cases 43
Designation * QW7 [count, row %, column %, total %].
Designation 0-2 2-4 Total
Worker 29.0 14.0 43.0
67.4% 32.6% 100.0%
100.0% 100.0% 100.0%
67.4% 32.6% 100.0%
Total 29.0 14.0 43.0
67.4% 32.6% 100.0%
100.0% 100.0% 100.0%
67.4% 32.6% 100.0%
Chi-square tests.
Statistic Value df Asymp. Sig. (2-sided)
N of Valid Cases 43
Designation * QW8 [count, row %, column %, total %].
Designation Strongly agree Agree Somewhat agree Total
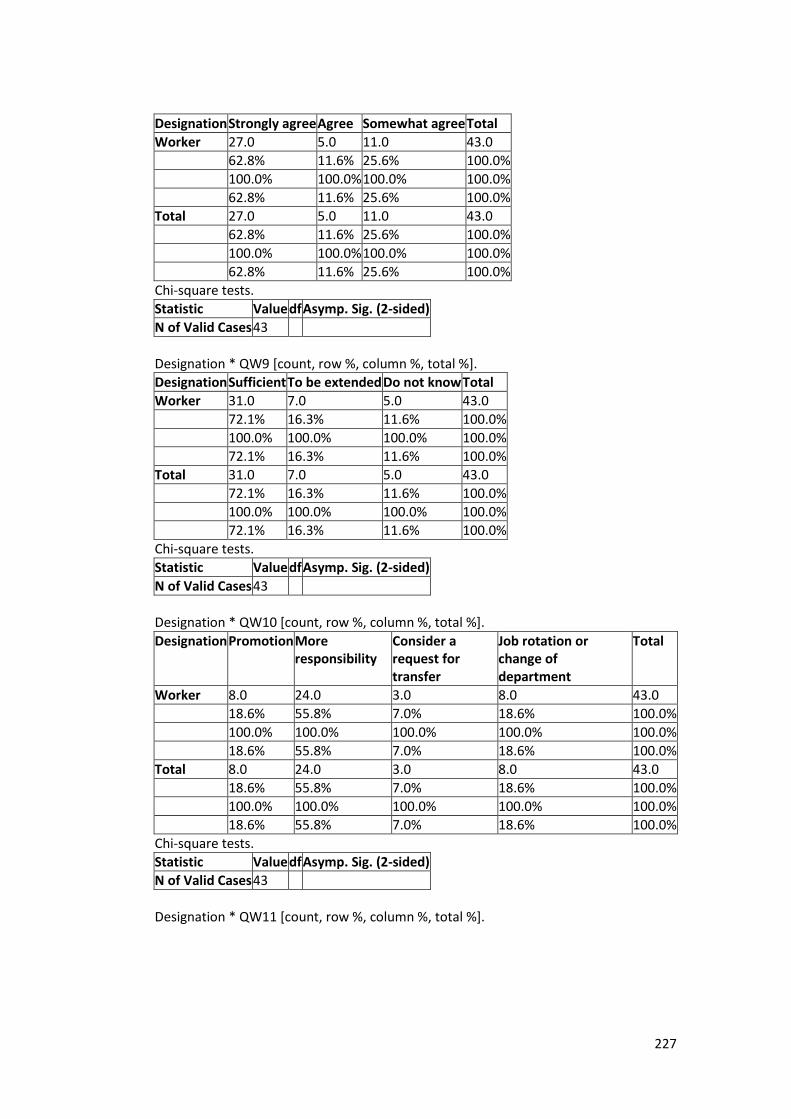
227
Designation Strongly agree Agree Somewhat agree Total
Worker 27.0 5.0 11.0 43.0
62.8% 11.6% 25.6% 100.0%
100.0% 100.0% 100.0% 100.0%
62.8% 11.6% 25.6% 100.0%
Total 27.0 5.0 11.0 43.0
62.8% 11.6% 25.6% 100.0%
100.0% 100.0% 100.0% 100.0%
62.8% 11.6% 25.6% 100.0%
Chi-square tests.
Statistic Value df Asymp. Sig. (2-sided)
N of Valid Cases 43
Designation * QW9 [count, row %, column %, total %].
Designation Sufficient To be extended Do not know Total
Worker 31.0 7.0 5.0 43.0
72.1% 16.3% 11.6% 100.0%
100.0% 100.0% 100.0% 100.0%
72.1% 16.3% 11.6% 100.0%
Total 31.0 7.0 5.0 43.0
72.1% 16.3% 11.6% 100.0%
100.0% 100.0% 100.0% 100.0%
72.1% 16.3% 11.6% 100.0%
Chi-square tests.
Statistic Value df Asymp. Sig. (2-sided)
N of Valid Cases 43
Designation * QW10 [count, row %, column %, total %].
Designation Promotion More responsibility
Consider a request for transfer
Job rotation or change of department
Total
Worker 8.0 24.0 3.0 8.0 43.0
18.6% 55.8% 7.0% 18.6% 100.0%
100.0% 100.0% 100.0% 100.0% 100.0%
18.6% 55.8% 7.0% 18.6% 100.0%
Total 8.0 24.0 3.0 8.0 43.0
18.6% 55.8% 7.0% 18.6% 100.0%
100.0% 100.0% 100.0% 100.0% 100.0%
18.6% 55.8% 7.0% 18.6% 100.0%
Chi-square tests.
Statistic Value df Asymp. Sig. (2-sided)
N of Valid Cases 43
Designation * QW11 [count, row %, column %, total %].

228
Designation They are very much useful and improve the efficiency
Not that useful but should be conducted for whatever improvement they bring in
They are not that much useful but help the employee in diverting his attention and relaxing
They are least useful but should be conducted as company policy requires the trainings to be conducted
Total
Worker 32.0 7.0 3.0 1.0 43.0
74.4% 16.3% 7.0% 2.3% 100.0%
100.0% 100.0% 100.0% 100.0% 100.0%
74.4% 16.3% 7.0% 2.3% 100.0%
Total 32.0 7.0 3.0 1.0 43.0
74.4% 16.3% 7.0% 2.3% 100.0%
100.0% 100.0% 100.0% 100.0% 100.0%
74.4% 16.3% 7.0% 2.3% 100.0%
Chi-square tests.
Statistic Value df Asymp. Sig. (2-sided)
N of Valid Cases 43
Designation * QW12 [count, row %, column %, total %].
Designation Yes No Total
Worker 5.0 38.0 43.0
11.6% 88.4% 100.0%
100.0% 100.0% 100.0%
11.6% 88.4% 100.0%
Total 5.0 38.0 43.0
11.6% 88.4% 100.0%
100.0% 100.0% 100.0%
11.6% 88.4% 100.0%
Chi-square tests.
Statistic Value df Asymp. Sig. (2-sided)
N of Valid Cases 43
Designation * QW13 [count, row %, column %, total %].
Designation Managers Skilled workers
All are given equal preference
There is a different criterion for that
Total
Worker 14.0 23.0 4.0 2.0 43.0
32.6% 53.5% 9.3% 4.7% 100.0%
100.0% 100.0% 100.0% 100.0% 100.0%
32.6% 53.5% 9.3% 4.7% 100.0%
Total 14.0 23.0 4.0 2.0 43.0
32.6% 53.5% 9.3% 4.7% 100.0%
100.0% 100.0% 100.0% 100.0% 100.0%
32.6% 53.5% 9.3% 4.7% 100.0%
Chi-square tests.
Statistic Value df Asymp. Sig. (2-sided)
N of Valid Cases 43
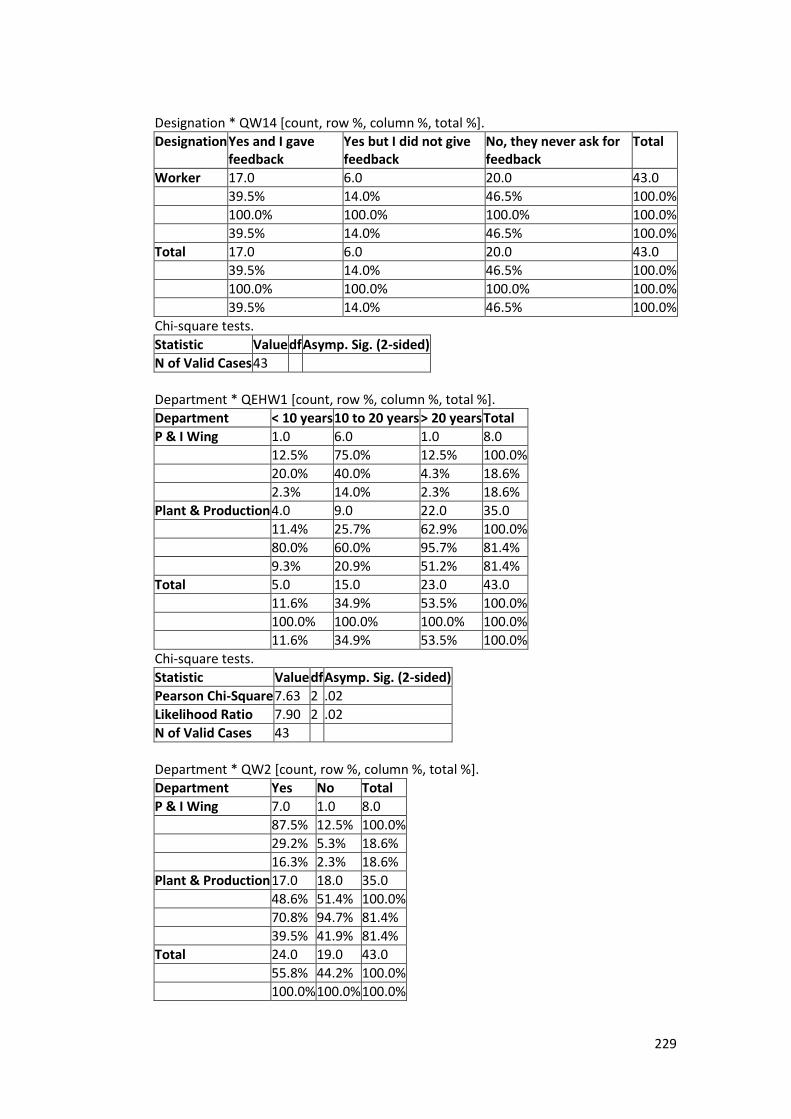
229
Designation * QW14 [count, row %, column %, total %].
Designation Yes and I gave feedback
Yes but I did not give feedback
No, they never ask for feedback
Total
Worker 17.0 6.0 20.0 43.0
39.5% 14.0% 46.5% 100.0%
100.0% 100.0% 100.0% 100.0%
39.5% 14.0% 46.5% 100.0%
Total 17.0 6.0 20.0 43.0
39.5% 14.0% 46.5% 100.0%
100.0% 100.0% 100.0% 100.0%
39.5% 14.0% 46.5% 100.0%
Chi-square tests.
Statistic Value df Asymp. Sig. (2-sided)
N of Valid Cases 43
Department * QEHW1 [count, row %, column %, total %].
Department < 10 years 10 to 20 years > 20 years Total
P & I Wing 1.0 6.0 1.0 8.0
12.5% 75.0% 12.5% 100.0%
20.0% 40.0% 4.3% 18.6%
2.3% 14.0% 2.3% 18.6%
Plant & Production 4.0 9.0 22.0 35.0
11.4% 25.7% 62.9% 100.0%
80.0% 60.0% 95.7% 81.4%
9.3% 20.9% 51.2% 81.4%
Total 5.0 15.0 23.0 43.0
11.6% 34.9% 53.5% 100.0%
100.0% 100.0% 100.0% 100.0%
11.6% 34.9% 53.5% 100.0%
Chi-square tests.
Statistic Value df Asymp. Sig. (2-sided)
Pearson Chi-Square 7.63 2 .02
Likelihood Ratio 7.90 2 .02
N of Valid Cases 43
Department * QW2 [count, row %, column %, total %].
Department Yes No Total
P & I Wing 7.0 1.0 8.0
87.5% 12.5% 100.0%
29.2% 5.3% 18.6%
16.3% 2.3% 18.6%
Plant & Production 17.0 18.0 35.0
48.6% 51.4% 100.0%
70.8% 94.7% 81.4%
39.5% 41.9% 81.4%
Total 24.0 19.0 43.0
55.8% 44.2% 100.0%
100.0% 100.0% 100.0%
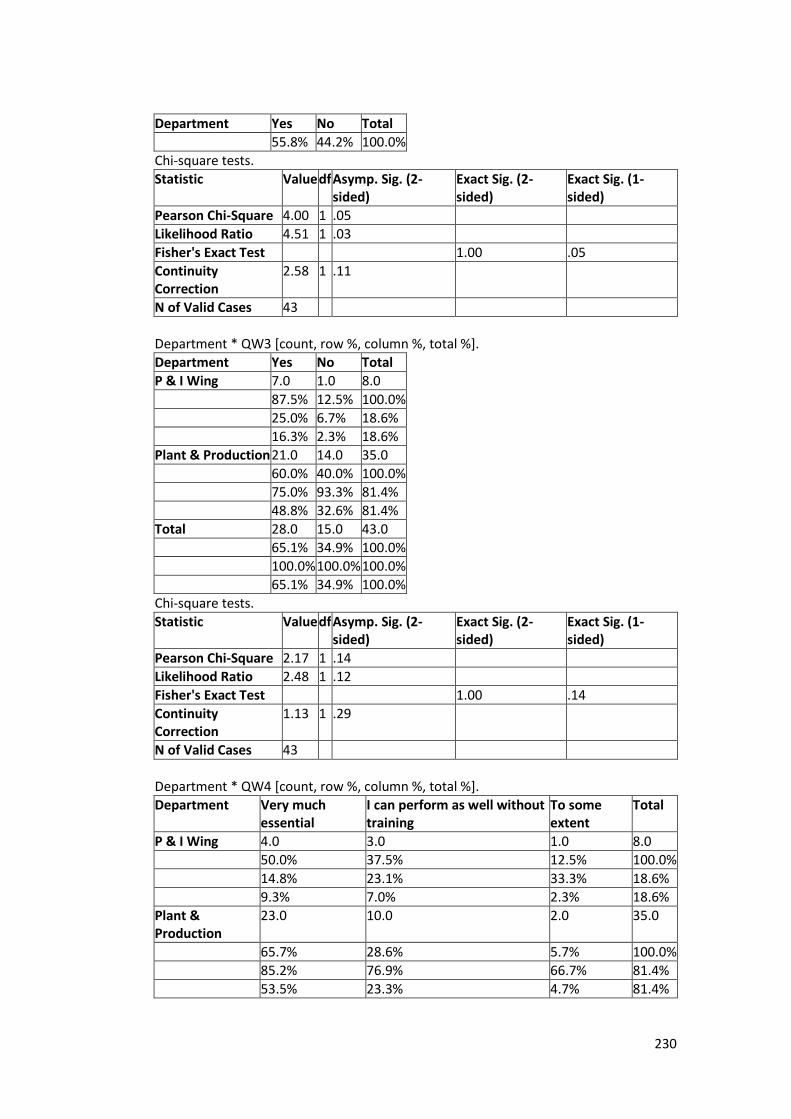
230
Department Yes No Total
55.8% 44.2% 100.0%
Chi-square tests.
Statistic Value df Asymp. Sig. (2-sided)
Exact Sig. (2-sided)
Exact Sig. (1-sided)
Pearson Chi-Square 4.00 1 .05
Likelihood Ratio 4.51 1 .03
Fisher's Exact Test 1.00 .05
Continuity Correction
2.58 1 .11
N of Valid Cases 43
Department * QW3 [count, row %, column %, total %].
Department Yes No Total
P & I Wing 7.0 1.0 8.0
87.5% 12.5% 100.0%
25.0% 6.7% 18.6%
16.3% 2.3% 18.6%
Plant & Production 21.0 14.0 35.0
60.0% 40.0% 100.0%
75.0% 93.3% 81.4%
48.8% 32.6% 81.4%
Total 28.0 15.0 43.0
65.1% 34.9% 100.0%
100.0% 100.0% 100.0%
65.1% 34.9% 100.0%
Chi-square tests.
Statistic Value df Asymp. Sig. (2-sided)
Exact Sig. (2-sided)
Exact Sig. (1-sided)
Pearson Chi-Square 2.17 1 .14
Likelihood Ratio 2.48 1 .12
Fisher's Exact Test 1.00 .14
Continuity Correction
1.13 1 .29
N of Valid Cases 43
Department * QW4 [count, row %, column %, total %].
Department Very much essential
I can perform as well without training
To some extent
Total
P & I Wing 4.0 3.0 1.0 8.0
50.0% 37.5% 12.5% 100.0%
14.8% 23.1% 33.3% 18.6%
9.3% 7.0% 2.3% 18.6%
Plant & Production
23.0 10.0 2.0 35.0
65.7% 28.6% 5.7% 100.0%
85.2% 76.9% 66.7% 81.4%
53.5% 23.3% 4.7% 81.4%
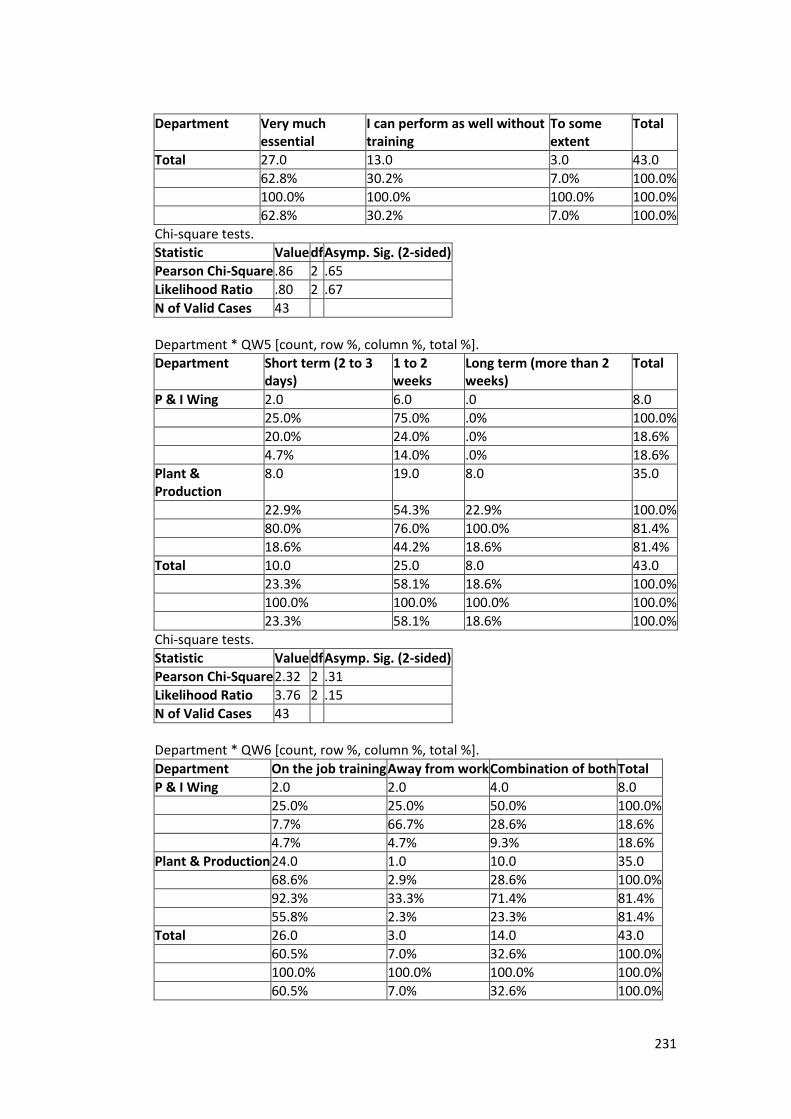
231
Department Very much essential
I can perform as well without training
To some extent
Total
Total 27.0 13.0 3.0 43.0
62.8% 30.2% 7.0% 100.0%
100.0% 100.0% 100.0% 100.0%
62.8% 30.2% 7.0% 100.0%
Chi-square tests.
Statistic Value df Asymp. Sig. (2-sided)
Pearson Chi-Square .86 2 .65
Likelihood Ratio .80 2 .67
N of Valid Cases 43
Department * QW5 [count, row %, column %, total %].
Department Short term (2 to 3 days)
1 to 2 weeks
Long term (more than 2 weeks)
Total
P & I Wing 2.0 6.0 .0 8.0
25.0% 75.0% .0% 100.0%
20.0% 24.0% .0% 18.6%
4.7% 14.0% .0% 18.6%
Plant & Production
8.0 19.0 8.0 35.0
22.9% 54.3% 22.9% 100.0%
80.0% 76.0% 100.0% 81.4%
18.6% 44.2% 18.6% 81.4%
Total 10.0 25.0 8.0 43.0
23.3% 58.1% 18.6% 100.0%
100.0% 100.0% 100.0% 100.0%
23.3% 58.1% 18.6% 100.0%
Chi-square tests.
Statistic Value df Asymp. Sig. (2-sided)
Pearson Chi-Square 2.32 2 .31
Likelihood Ratio 3.76 2 .15
N of Valid Cases 43
Department * QW6 [count, row %, column %, total %].
Department On the job training Away from work Combination of both Total
P & I Wing 2.0 2.0 4.0 8.0
25.0% 25.0% 50.0% 100.0%
7.7% 66.7% 28.6% 18.6%
4.7% 4.7% 9.3% 18.6%
Plant & Production 24.0 1.0 10.0 35.0
68.6% 2.9% 28.6% 100.0%
92.3% 33.3% 71.4% 81.4%
55.8% 2.3% 23.3% 81.4%
Total 26.0 3.0 14.0 43.0
60.5% 7.0% 32.6% 100.0%
100.0% 100.0% 100.0% 100.0%
60.5% 7.0% 32.6% 100.0%

232
Chi-square tests.
Statistic Value df Asymp. Sig. (2-sided)
Pearson Chi-Square 7.54 2 .02
Likelihood Ratio 6.65 2 .04
N of Valid Cases 43
Department * QW7 [count, row %, column %, total %].
Department 0-2 2-4 Total
P & I Wing 8.0 .0 8.0
100.0% .0% 100.0%
27.6% .0% 18.6%
18.6% .0% 18.6%
Plant & Production 21.0 14.0 35.0
60.0% 40.0% 100.0%
72.4% 100.0% 81.4%
48.8% 32.6% 81.4%
Total 29.0 14.0 43.0
67.4% 32.6% 100.0%
100.0% 100.0% 100.0%
67.4% 32.6% 100.0%
Chi-square tests.
Statistic Value df Asymp. Sig. (2-sided)
Exact Sig. (2-sided)
Exact Sig. (1-sided)
Pearson Chi-Square 4.74 1 .03
Likelihood Ratio 7.16 1 .01
Fisher's Exact Test 1.00 .03
Continuity Correction
3.10 1 .08
N of Valid Cases 43
Department * QW8 [count, row %, column %, total %].
Department Strongly agree Agree Somewhat agree Total
P & I Wing 2.0 2.0 4.0 8.0
25.0% 25.0% 50.0% 100.0%
7.4% 40.0% 36.4% 18.6%
4.7% 4.7% 9.3% 18.6%
Plant & Production 25.0 3.0 7.0 35.0
71.4% 8.6% 20.0% 100.0%
92.6% 60.0% 63.6% 81.4%
58.1% 7.0% 16.3% 81.4%
Total 27.0 5.0 11.0 43.0
62.8% 11.6% 25.6% 100.0%
100.0% 100.0% 100.0% 100.0%
62.8% 11.6% 25.6% 100.0%
Chi-square tests.
Statistic Value df Asymp. Sig. (2-sided)
Pearson Chi-Square 6.04 2 .05
Likelihood Ratio 5.91 2 .05

233
Statistic Value df Asymp. Sig. (2-sided)
N of Valid Cases 43
Department * QW9 [count, row %, column %, total %].
Department Sufficient To be extended Do not know Total
P & I Wing 4.0 3.0 1.0 8.0
50.0% 37.5% 12.5% 100.0%
12.9% 42.9% 20.0% 18.6%
9.3% 7.0% 2.3% 18.6%
Plant & Production 27.0 4.0 4.0 35.0
77.1% 11.4% 11.4% 100.0%
87.1% 57.1% 80.0% 81.4%
62.8% 9.3% 9.3% 81.4%
Total 31.0 7.0 5.0 43.0
72.1% 16.3% 11.6% 100.0%
100.0% 100.0% 100.0% 100.0%
72.1% 16.3% 11.6% 100.0%
Chi-square tests.
Statistic Value df Asymp. Sig. (2-sided)
Pearson Chi-Square 3.39 2 .18
Likelihood Ratio 2.91 2 .23
N of Valid Cases 43
Department * QW10 [count, row %, column %, total %].
Department Promotion More responsibility
Consider a request for transfer
Job rotation or change of department
Total
P & I Wing 1.0 3.0 1.0 3.0 8.0
12.5% 37.5% 12.5% 37.5% 100.0%
12.5% 12.5% 33.3% 37.5% 18.6%
2.3% 7.0% 2.3% 7.0% 18.6%
Plant & Production
7.0 21.0 2.0 5.0 35.0
20.0% 60.0% 5.7% 14.3% 100.0%
87.5% 87.5% 66.7% 62.5% 81.4%
16.3% 48.8% 4.7% 11.6% 81.4%
Total 8.0 24.0 3.0 8.0 43.0
18.6% 55.8% 7.0% 18.6% 100.0%
100.0% 100.0% 100.0% 100.0% 100.0%
18.6% 55.8% 7.0% 18.6% 100.0%
Chi-square tests.
Statistic Value df Asymp. Sig. (2-sided)
Pearson Chi-Square 3.10 3 .38
Likelihood Ratio 2.80 3 .42
N of Valid Cases 43
Department * QW11 [count, row %, column %, total %].

234
Department They are very much useful and improve the efficiency
Not that useful but should be conducted for whatever improvement they bring in
They are not that much useful but help the employee in diverting his attention and relaxing
They are least useful but should be conducted as company policy requires the trainings to be conducted
Total
P & I Wing 5.0 2.0 1.0 .0 8.0
62.5% 25.0% 12.5% .0% 100.0%
15.6% 28.6% 33.3% .0% 18.6%
11.6% 4.7% 2.3% .0% 18.6%
Plant & Production
27.0 5.0 2.0 1.0 35.0
77.1% 14.3% 5.7% 2.9% 100.0%
84.4% 71.4% 66.7% 100.0% 81.4%
62.8% 11.6% 4.7% 2.3% 81.4%
Total 32.0 7.0 3.0 1.0 43.0
74.4% 16.3% 7.0% 2.3% 100.0%
100.0% 100.0% 100.0% 100.0% 100.0%
74.4% 16.3% 7.0% 2.3% 100.0%
Chi-square tests.
Statistic Value df Asymp. Sig. (2-sided)
Pearson Chi-Square 1.31 3 .73
Likelihood Ratio 1.39 3 .71
N of Valid Cases 43
Department * QW12 [count, row %, column %, total %].
Department Yes No Total
P & I Wing .0 8.0 8.0
.0% 100.0% 100.0%
.0% 21.1% 18.6%
.0% 18.6% 18.6%
Plant & Production 5.0 30.0 35.0
14.3% 85.7% 100.0%
100.0% 78.9% 81.4%
11.6% 69.8% 81.4%
Total 5.0 38.0 43.0
11.6% 88.4% 100.0%
100.0% 100.0% 100.0%
11.6% 88.4% 100.0%
Chi-square tests.
Statistic Value df Asymp. Sig. (2-sided)
Exact Sig. (2-sided)
Exact Sig. (1-sided)
Pearson Chi-Square 1.29 1 .26
Likelihood Ratio 2.20 1 .14
Fisher's Exact Test 1.00 .34
Continuity Correction
.28 1 .60
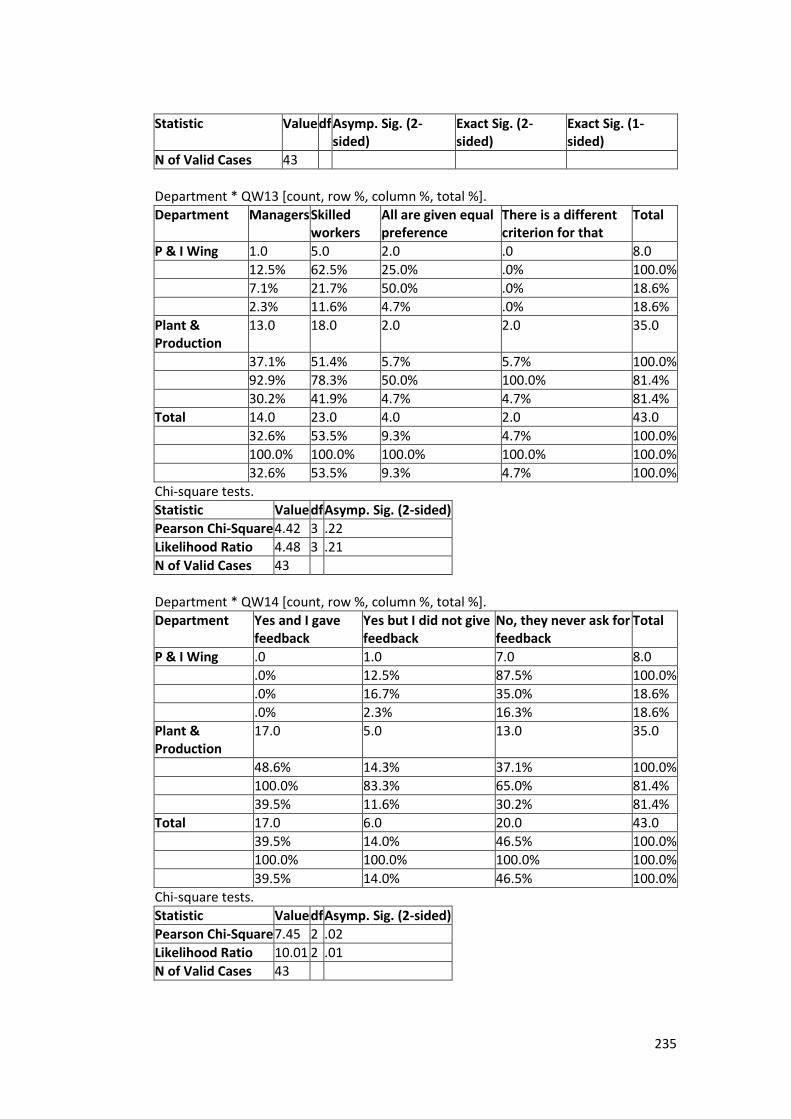
235
Statistic Value df Asymp. Sig. (2-sided)
Exact Sig. (2-sided)
Exact Sig. (1-sided)
N of Valid Cases 43
Department * QW13 [count, row %, column %, total %].
Department Managers Skilled workers
All are given equal preference
There is a different criterion for that
Total
P & I Wing 1.0 5.0 2.0 .0 8.0
12.5% 62.5% 25.0% .0% 100.0%
7.1% 21.7% 50.0% .0% 18.6%
2.3% 11.6% 4.7% .0% 18.6%
Plant & Production
13.0 18.0 2.0 2.0 35.0
37.1% 51.4% 5.7% 5.7% 100.0%
92.9% 78.3% 50.0% 100.0% 81.4%
30.2% 41.9% 4.7% 4.7% 81.4%
Total 14.0 23.0 4.0 2.0 43.0
32.6% 53.5% 9.3% 4.7% 100.0%
100.0% 100.0% 100.0% 100.0% 100.0%
32.6% 53.5% 9.3% 4.7% 100.0%
Chi-square tests.
Statistic Value df Asymp. Sig. (2-sided)
Pearson Chi-Square 4.42 3 .22
Likelihood Ratio 4.48 3 .21
N of Valid Cases 43
Department * QW14 [count, row %, column %, total %].
Department Yes and I gave feedback
Yes but I did not give feedback
No, they never ask for feedback
Total
P & I Wing .0 1.0 7.0 8.0
.0% 12.5% 87.5% 100.0%
.0% 16.7% 35.0% 18.6%
.0% 2.3% 16.3% 18.6%
Plant & Production
17.0 5.0 13.0 35.0
48.6% 14.3% 37.1% 100.0%
100.0% 83.3% 65.0% 81.4%
39.5% 11.6% 30.2% 81.4%
Total 17.0 6.0 20.0 43.0
39.5% 14.0% 46.5% 100.0%
100.0% 100.0% 100.0% 100.0%
39.5% 14.0% 46.5% 100.0%
Chi-square tests.
Statistic Value df Asymp. Sig. (2-sided)
Pearson Chi-Square 7.45 2 .02
Likelihood Ratio 10.01 2 .01
N of Valid Cases 43

236
12. Appendix III – Bibliography
12.0 Books ............................................................................................ 237
12.1 Journals ........................................................................................ 238
12.2 Webliography ............................................................................... 240
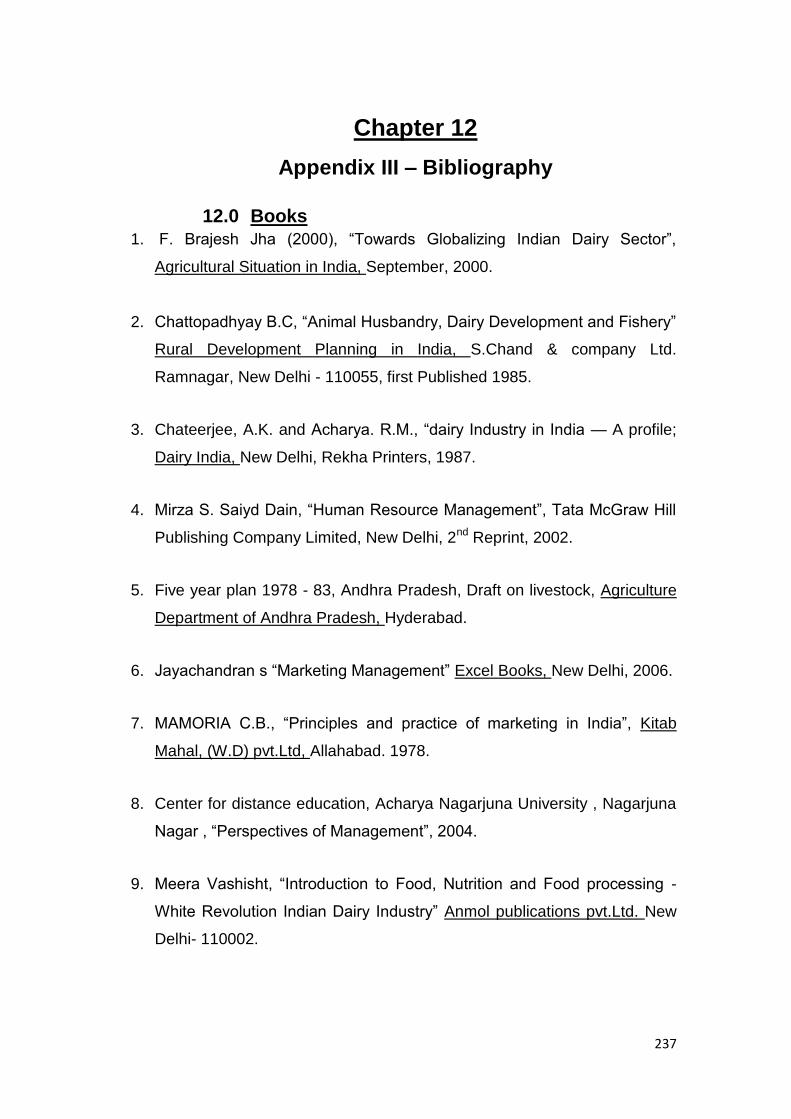
237
Chapter 12
Appendix III – Bibliography
12.0 Books
1. F. Brajesh Jha (2000), ―Towards Globalizing Indian Dairy Sector‖,
Agricultural Situation in India, September, 2000.
2. Chattopadhyay B.C, ―Animal Husbandry, Dairy Development and Fishery‖
Rural Development Planning in India, S.Chand & company Ltd.
Ramnagar, New Delhi - 110055, first Published 1985.
3. Chateerjee, A.K. and Acharya. R.M., ―dairy Industry in India — A profile;
Dairy India, New Delhi, Rekha Printers, 1987.
4. Mirza S. Saiyd Dain, ―Human Resource Management‖, Tata McGraw Hill
Publishing Company Limited, New Delhi, 2nd Reprint, 2002.
5. Five year plan 1978 - 83, Andhra Pradesh, Draft on livestock, Agriculture
Department of Andhra Pradesh, Hyderabad.
6. Jayachandran s ―Marketing Management‖ Excel Books, New Delhi, 2006.
7. MAMORIA C.B., ―Principles and practice of marketing in India‖, Kitab
Mahal, (W.D) pvt.Ltd, Allahabad. 1978.
8. Center for distance education, Acharya Nagarjuna University , Nagarjuna
Nagar , ―Perspectives of Management‖, 2004.
9. Meera Vashisht, ―Introduction to Food, Nutrition and Food processing -
White Revolution Indian Dairy Industry‖ Anmol publications pvt.Ltd. New
Delhi- 110002.
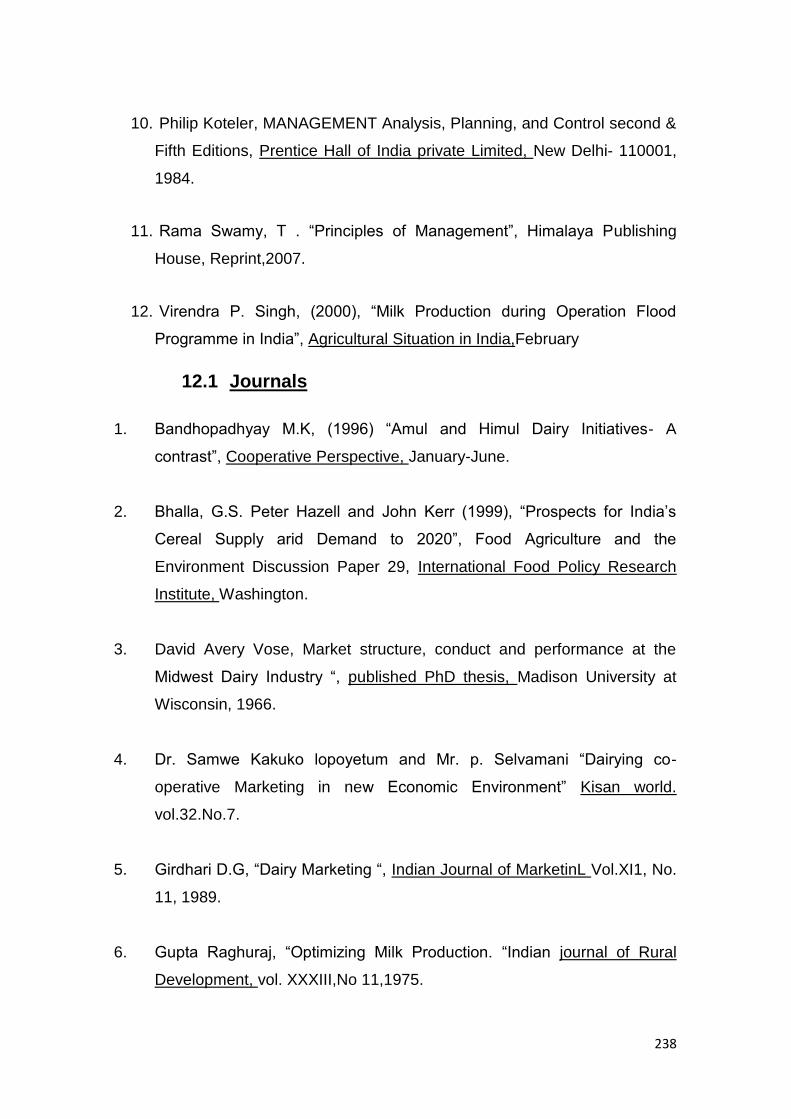
238
10. Philip Koteler, MANAGEMENT Analysis, Planning, and Control second &
Fifth Editions, Prentice Hall of India private Limited, New Delhi- 110001,
1984.
11. Rama Swamy, T . ―Principles of Management‖, Himalaya Publishing
House, Reprint,2007.
12. Virendra P. Singh, (2000), ―Milk Production during Operation Flood
Programme in India‖, Agricultural Situation in India,February
12.1 Journals
1. Bandhopadhyay M.K, (1996) ―Amul and Himul Dairy Initiatives- A
contrast‖, Cooperative Perspective, January-June.
2. Bhalla, G.S. Peter Hazell and John Kerr (1999), ―Prospects for India‘s
Cereal Supply arid Demand to 2020‖, Food Agriculture and the
Environment Discussion Paper 29, International Food Policy Research
Institute, Washington.
3. David Avery Vose, Market structure, conduct and performance at the
Midwest Dairy Industry ―, published PhD thesis, Madison University at
Wisconsin, 1966.
4. Dr. Samwe Kakuko lopoyetum and Mr. p. Selvamani ―Dairying co-
operative Marketing in new Economic Environment‖ Kisan world.
vol.32.No.7.
5. Girdhari D.G, ―Dairy Marketing ―, Indian Journal of MarketinL Vol.XI1, No.
11, 1989.
6. Gupta Raghuraj, ―Optimizing Milk Production. ―Indian journal of Rural
Development, vol. XXXIII,No 11,1975.

239
7. Jayachandra K,‖Dairying in Drought- prone Areas - A study‖, Yojana,
Vol.34, No.4, March, 1990.
8. Manieka Vasagam Pillai, N, ―A study on Resource use Efficiency in Milk
Production in Prambikulam Aliyar Project Region, Tamil Nadu. and
Dissertation submitted to the Tamil Nadu Agricultural University,
Coimbatire. 1976.
9. Milk Procurement and Technical Inputs Manual, National Development
Board Dairy, Anand, 1985.
10. Muranjan, S ―Factors Responsible for Increased Procurement of Milk in
Maharastra, Artha vijnana, Vol.29, No.4, December, 1977.
11. Pratap, S. Birthal, et.al, (1999), ―Policy Paper, National Center for
Agricultural Economics and Policy Research‖, New Delhi, March.
12. ―Production and Utilization Pattern of Milk at the Rural Producers Level:
An Analysis across the States‖ Monthly Public Opinion Surveys, Vol XLVI
no. 11, August, 2001.
13. Ramesh Kolli and A.C. Kulsestha, (1997) ―Contribution of Livestock to
National Income‖, Dairy India.
14. Sinha, Ramakanti, ―Intensive cattle development programme in Bihar; An
economic study with special reference to intensive cattle development
Block Barohni, BeguSavar, Patna. 1980.
15. The Hindu Survey of Indian Agriculture. (2004).
16. World Focus on Indian Dairying‖, Dairy India, 2007.
240
17. Shaik N.A., Liquid Milk Marketing, Indian Dairyman, vol.40, No.5, 1988.
18. Kumar, A. and Shanthan, S.R. ―Utilisation of General Management
Training at shop floor: A case study‖, Indian Journal of Training and
Development, I993, 23(4), pp. 56-59.
19. 6. Jay Chandra K, ―Dairying in Drought- prone Areas - A studv‘, Yojana,
Vol.34, No.4, March, 1990, Pp.27-29.
12.2 Webliography
1. http://www.fao.org/ag/AGA/publication/mpuide/mpuide6.htm
2. http://en.wikipedia.or/wiki/Dairy product
3. http://www.nddb.org
4. http://www.ifcnnetwork.org
5. http://dahd.nic.in

241
13 Appendix IV – Copies of Literature