Study of the stress gradient and the size effect in...
94
Tese de Doutorado em Ciências Mecânicas Study of the stress gradient and the size effect in fretting fatigue Barbara Marie Céline Ferry UNIVERSIDADE DE BRASILIA FACULDADE DE TECNOLOGIA DEPARTAMENTO DE ENGENHARIA MECANICA UNIVERSIDADE DE BRASILIA Faculdade de Tecnologia Departamento de Engenharia Mecânica
-
Upload
hoangkhanh -
Category
Documents
-
view
214 -
download
0
Transcript of Study of the stress gradient and the size effect in...
Tese de Doutorado em Ciências Mecânicas
Study of the stress gradient and the size
effect in fretting fatigue
Barbara Marie Céline Ferry
UNIVERSIDADE DE BRASILIA
FACULDADE DE TECNOLOGIA
DEPARTAMENTO DE ENGENHARIA MECANICA
UNIVERSIDADE DE BRASILIA
Faculdade de Tecnologia
Departamento de Engenharia Mecânica

ii
Tese de Doutorado em Ciências Mecânicas
Study of the stress gradient and the size
effect in fretting fatigue
Barbara Marie Céline Ferry
Orientadores: José Alexander Araújo
Sylvie Pommier
Publicação: ENM-DT-42/2017
Brasília/DF: Setembro – 2017
Universidade de Brasília
Faculdade de Tecnologia
Departamento de Engenharia Mecânica

iii
Tese de Doutorado em Ciências Mecânicas
Study of the stress gradient and the size
effect in fretting fatigue
Barbara Ferry
Tese de doutorado submetida ao departamento de engenharia
mecânica da faculdade de tecnologia da universidade de Brasília
como parte dos requisitos necessários para a obtenção do grau
de doutor.
Banca examinadora:
Profa. Sylvie Pommier. (LMT – Université Paris Saclay) - Orientadora
Prof. J. Alexander Araújo. (ENM – FT - UnB) - Orientador
Prof.. Fábio Comes de Castro – Examinador Interno
Prof..Thierry Palin-Luc – Examinador Externo
Prof.. Yves Nadot – Examinador Externo
Brasília/DF
Abstract
iv
Abstract
Fretting fatigue refers to the damage process localized at the frontier of the contact between
two contacting bodies subjected to fatigue loadings. The prediction of this phenomenon is of
major importance in determining, for instance, the lifetime of fan’s disk. In the vicinity of the
contact front, the stress field inherited from the contact loads is maximal at the surface and
displays a strong gradient under the contact. The difference of scale between the laboratory’s
experiments and the industrials’ system motivated the study of the impact of the size effect
for the determination of the lifetimes.
To quantify the effect of the stress gradient and of the size effect, tests were carried
out on a two vertical-actuators fretting-fatigue rig at the University of Brasilia, with
experimental conditions ensuring different stress gradient and later different volume
solicited under the contact. Damage mechanisms were studied using post-mortem analysis
with a confocal microscope on some contact elements tested.
It was shown on this thesis, for a Ti-6Al-4V alloy, that a nonlocal approach, based on
equivalent velocity field on a determined area around the contact, leads to good expectation
for the determination of fretting fatigue lives. The influence of the bulk stress for the
description of the fretting fatigue crack initiation and propagation was also determined and it
appears that it could not be neglected for the determination of the crack initiation boundary.
As a matter of fact, if around 75% of the crack initiation mechanism in fretting fatigue is
controlled by the contact stresses, i.e. shear stress and contact pressure, the consideration of
the normal stress allows to obtain more realistic prediction.
The study of the size effect was divided into two phases. First the influence of the
volume stressed was investigated by reducing the width of the contact but maintaining the
stress gradient under the contact and the damaged area within the slip zone constant. Then,
the influence of the damaged area within the slip zone was isolated by maintaining the
experimental parameters, i.e. σB,max/p0 and Q/fP, constant while the damaged area under the
slip zone was reduced. The experimental results were analysed by applying a fatigue
criterion, the Modified Wöhler Curve Method, in conjunction with the Theory of the Critical
Distance. It was found that none of these two parameters influences significantly the fretting
fatigue lifetimes, and so the term ‘size effect’ usually referenced in the literature as a
damaging effect should refer only to the gradient effect.

List of Figures
i
Resumo
A fadiga por fretting está relacionada com o processo de dano, localizado na fronteira de
contato entre dois corpos submetidos a cargas de fadiga. A previsão desse fenômeno é de
grande importância na análise, por exemplo, da vida de lâminas de discos de turbinas. Na
fadiga por fretting, o campo de tensão é máximo na superfície de contato, sendo observado
um alto gradiente de tensão sob essa superfície. A diferença de escala entre experimentos
realizados em laboratórios e os sistemas industriais, motivaram, nessa pesquisa, uma
investigação da influência do efeito de tamanho na previsão de vida em fadiga por fretting.
Para quantificar o efeito do gradiente de tensão e o efeito de tamanho, diferentes
testes foram realizados na Universidade de Brasília em um equipamento servo-hidráulico
com dois atuadores especialmente desenvolvido para ensaios de fadiga por fretting. Os
parâmetros de testes foram definidos de forma que induzissem diferentes gradientes de
tensão nos corpos de prova e posteriormente foram ajustados de modo que o volume
solicitado sob a região de contato fosse o mesmo. Após os ensaios, para investigar os
mecanismos de dano, os corpos de prova foram analisados por meio de um microscópio
confocal laser.
Foi demostrado nesta tese que para a liga Ti-6Al-4V, uma abordagem não local,
baseada no campo de velocidades em uma determinada área ao redor da região de contato
consegue prover boas previsões de vida em fadiga por fretting. Uma análise da influência das
forças de fadiga nos processos de iniciação e propagação de trincas foi realizada e indicaram
que essas forças não podem ser negligenciadas. De fato, se cerca de 75% dos mecanismos de
iniciação de trinca em fadiga por fretting são controlados por tensões de contato (cisalhantes
e pressão de contato) a consideração das tensões normais possibilita realizar previsões de
vida mais realistas.
O estudo do efeito do tamanho foi dividido em duas fases. A primeira investigou a
influência do volume solicitado, reduzindo a largura de contato, porém, o gradiente de tensão
sob a área de contato e a área de dano dentro da zona de deslizamento foram mantidas
constantes. Na segunda, mantendo os parâmetro experimentais σB,max/p0 e Q/fP constantes, a
influência da área de dano no interior da zona de deslizamento foi isolada enquanto que a
área de dano sob a zona de deslizamento foi reduzida. Os resultados experimentais foram
analisados utilizando o critério de fadiga da Curva Modificada de Wöhler em conjunto com a
Teoria da Distância Crítica. Foi observado que nenhum desses dois parâmetros influenciam
significativamente a vida em fadiga por fretting. Assim, o termo “efeito de tamanho” deve ser
analisado somente com base no efeito do gradiente.
List of Figures
ii
List of Figures
Figure 1-1: Cut view of the CFM56-5B Turbofan Engine. ........................................................... 1
Figure 1-2: (a) schematic diagram of the dovetail fixing and (b) load configuration (adapted
from (Mériaux, 2010)). ....................................................................................................... 2
Figure 1-3: Photographs of an aircraft (a) engine and (b) fuselage damage in a Southwest
Airline’s Boeing 737-700 in August, 27th 2016 near Pensacola (Photo: Peter Lemme). .... 3
Figure 1-4: Photographs of the recovered low pressure compressor 2nd stage disk (Photo:
SIB). .................................................................................................................................... 3
Figure 1-5: Schematic description of the methodology 1 (Araújo, 2000) .................................. 6
Figure 1-6: Schematic description of the methodology 2 (Araújo, 2000) ................................. 6
Figure 2-1: Geometries of the three reference contacts: (a) sphere/plane; (b)
Cylindrical/plane; (c) Flat/plane contact. ......................................................................... 15
Figure 2-2: Cylinder-plane contact subject to normal and tangential forces. ..........................16
Figure 2-3: Normalised distribution of pressure and shear stress for Q/fP=0,45 and
σB/fp0=0. ........................................................................................................................... 20
Figure 2-4: Variation of shear load Q with the time .................................................................21
Figure 2-5: Variation of shear traction at different instants of the fully reversed fretting cycle.
Q/fP varies from +0.6 to -0.6. .......................................................................................... 22
Figure 2-6: Schematic representation of the experimental contact configuration used by
Nowell showing the coordinate system chosen for the analysis. ...................................... 23
Figure 2-7: Coefficient of friction under the contact at the beginning of the experiment. ...... 26
Figure 2-8: Coefficient of friction under the contact after n cycles. ........................................ 26
Figure 2-9: Prediction of the coefficient of friction within the slip zones measured from
average values (Araújo, 2000). ......................................................................................... 27
Figure 2-10: Stress path ψ, its convex hull and the identification of the characteristic lengths
used to compute the shear stress amplitude in a material plane. .................................... 30
Figure 2-11: Illustration of the three propagation modes. ....................................................... 33
Figure 2-12: Crack in an infinite plane. .................................................................................... 34
Figure 2-13: Schematic configuration of (a) the Point Method and (b) the Line Method
[adapted from Susmel (2006)] ......................................................................................... 35
Figure 2-14: Geometrical similarities between the contact edge and the crack tip. ................ 36
Figure 2-15: FEM details and loading evolution used. ............................................................ 37
Figure 2-16: (a) Loading history, (b) Contact configuration, (c) schemes of modes I and II
cracks. ............................................................................................................................... 39
Figure 3-1: Microstructure of the Ti-6Al-4V alloy used. .......................................................... 46
List of Figures
iii
Figure 3-2: Illustration of the stress gradient: σxx for three pad radii (p0=500MPa, σB,max =
300MPa ad Q/fP = 0,46). .................................................................................................. 51
Figure 3-3: Methodology follows for the Group I Tests: (a) Illustration of the evolution of the
Multiaxial Index gradient studied in this work, (b) Excepting results with the application
of the Theory of Critical Distance and (c) Intended results after the application of the
nonlocal criterion. .............................................................................................................. 51
Figure 3-4: Fretting fatigue specimen of the first group of experiment (dimension in mm). . 52
Figure 3-5: Fretting pads of the first group of tests (dimension in mm). ................................ 52
Figure 3-6: Schematic representation of the objectives of the Group II Tests: (a) Group II-a
Tests with same fretting damaged area for the two specimen’s widths, (b) Group II-b
Tests for different fretting damaged areas........................................................................ 54
Figure 3-7: Fretting-fatigue main specimen of the second group of tests (dimension in mm)54
Figure 3-8: Fretting pad of the second group of tests (dimension in mm). ............................ 55
Figure 3-9: Photograph of fretting fatigue specimens and pads.............................................. 55
Figure 3-10: Detailed schematic view of the two actuators fretting-fatigue rig....................... 57
Figure 3-11: Schematic cut-view of the fretting-fatigue apparatus. ......................................... 57
Figure 3-12: Photograph of the two vertical-actuators fretting fatigue rig of the UnB. .......... 58
Figure 3-13: Photograph with a detailed view of the pad/specimen assembly in the two-
actuator rig. ....................................................................................................................... 58
Figure 3-14: Possible alignment conditions of cylindrical pads and corresponding pressure
distribution: (a) aligned; (b) and (c) misaligned. ............................................................. 59
Figure 3-15: Prints pressure of (a) misaligned pad; (b) aligned pad. ...................................... 60
Figure 3-16: Illustration of the typical loading of the tests. ......................................................61
Figure 3-17: Fretting fatigue loops (a) Partial slip, (b) Full slip ...............................................61
Figure 3-18: Station manager scope monitoring the fatigue load. .......................................... 62
Figure 3-19: Station manager scope monitoring the fretting load. .......................................... 62
Figure 3-20: Station manager scope monitoring the “fretting loop”. ...................................... 62
Figure 4-1: Schematic representation of the variation of the multiaxial fatigue parameter with
distance from the contact surface at the trailing edge of the contact for three different
pad radii. ........................................................................................................................... 67
Figure 4-2: Variation of the multiaxial fatigue index with distance from the contact surface at
the trailing edge of the contact for three different pad radii in Ti-6Al-4V. ...................... 69
Figure 4-3: Multiaxial Fatigue Index in terms of the Modified Wöhler Curve Method at the
Critical Distance against the number of cycles to failure from the experimental results. 70
Figure 4-4: Fretted area of the specimen under the contact of the cylinder pad with radius
R=70mm. .......................................................................................................................... 72

List of Figures
iv
Figure 4-5: Angle of the crack initiation and profile of the crack propagation for the specimen
under the contact of the cylinder pad with radius R=70mm............................................ 72
Figure 4-6: Confocal photograph of the fracture surface for the specimen under the contact of
the cylinder pad with radius R=70mm. ............................................................................ 73
Figure 4-7: Fretted area of the specimen under the contact of the cylinder pad with radius
R=50mm. .......................................................................................................................... 73
Figure 4-8: Angle of the crack initiation and profile of the crack propagation for the specimen
under the contact of the cylinder pad with radius R=50mm. .......................................... 74
Figure 4-9: Confocal photograph of the fracture surface for the specimen under the contact of
the cylinder pad with radius R=50mm. ............................................................................ 74
Figure 4-10: Typical loading history implemented in the FE model to compute the non-local
parameters for the crack analogue model. ....................................................................... 77
Figure 4-11: Loads and Boundaries conditions of the Finite Element model. ......................... 77
Figure 4-12: Global mesh of the finite element model. ............................................................ 78
Figure 4-13: Details of the refined area. ................................................................................... 78
Figure 4-14: Comparison between the analytical formulation and the finite element model for
the normal tractions at the surface for a pad radius of 70mm. ........................................ 79
Figure 4-15: Comparison between the analytical formulation and the finite element model for
the shear tractions at the surface for a pad radius of 70mm. ........................................... 79
Figure 4-16: Comparison between the analytical formulation and the finite element model
results for the first component of the stress, σxx, along the contact interface. ................. 80
Figure 4-17: Nonlocal map for experiments configuration considering three different pad
radii. All experiments represented on this map have broken around 200 000 cycles. ... 82
Figure 4-18: Nonlocal map for experiments configuration considering three different pad
radii. All experiments represented on this map have broken around 500 000 cycles. .... 82
Figure 4-19: Nonlocal map for experiments configuration considering three different pad
radii. All experiments represented on this map have ran-out. ......................................... 83
Figure 4-20: Boundary between safe and failure zones written terms of Ia and Is and in
accordance with equation (4.5) and the experimental results obtained for an infinite life
(at 1 000 000 cycles). ........................................................................................................ 85
Figure 4-21: Boundary between safe and failure zones written terms of Ia and Is and in
accordance with equation (4.4) and the experimental results obtained for an infinite life
(at 1 000 000 cycles). ........................................................................................................ 85
Figure 5-1: Scheme of the damaged area for both specimen widths. ...................................... 92
Figure 5-2: Evolution of the stress under the contact at x/a = -1 for both specimen widths
(For W13: σB,max/p0 = 0,6; Q/fP =0,46. For W8: σB,max/p0 = 0,45; Q/fP =0,68). ................ 93
List of Figures
v
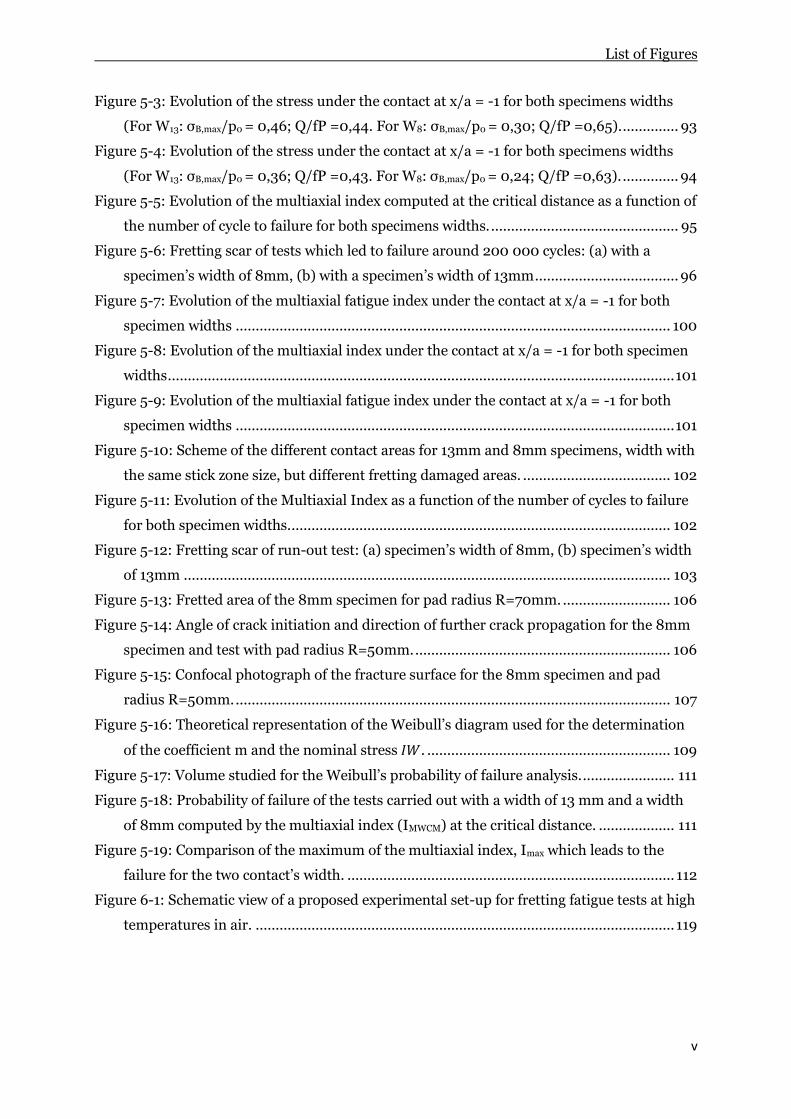
Figure 5-3: Evolution of the stress under the contact at x/a = -1 for both specimens widths
(For W13: σB,max/p0 = 0,46; Q/fP =0,44. For W8: σB,max/p0 = 0,30; Q/fP =0,65). .............. 93
Figure 5-4: Evolution of the stress under the contact at x/a = -1 for both specimens widths
(For W13: σB,max/p0 = 0,36; Q/fP =0,43. For W8: σB,max/p0 = 0,24; Q/fP =0,63). .............. 94
Figure 5-5: Evolution of the multiaxial index computed at the critical distance as a function of
the number of cycle to failure for both specimens widths. ............................................... 95
Figure 5-6: Fretting scar of tests which led to failure around 200 000 cycles: (a) with a
specimen’s width of 8mm, (b) with a specimen’s width of 13mm .................................... 96
Figure 5-7: Evolution of the multiaxial fatigue index under the contact at x/a = -1 for both
specimen widths ............................................................................................................. 100
Figure 5-8: Evolution of the multiaxial index under the contact at x/a = -1 for both specimen
widths ............................................................................................................................... 101
Figure 5-9: Evolution of the multiaxial fatigue index under the contact at x/a = -1 for both
specimen widths .............................................................................................................. 101
Figure 5-10: Scheme of the different contact areas for 13mm and 8mm specimens, width with
the same stick zone size, but different fretting damaged areas. ..................................... 102
Figure 5-11: Evolution of the Multiaxial Index as a function of the number of cycles to failure
for both specimen widths. ............................................................................................... 102
Figure 5-12: Fretting scar of run-out test: (a) specimen’s width of 8mm, (b) specimen’s width
of 13mm .......................................................................................................................... 103
Figure 5-13: Fretted area of the 8mm specimen for pad radius R=70mm. ........................... 106
Figure 5-14: Angle of crack initiation and direction of further crack propagation for the 8mm
specimen and test with pad radius R=50mm. ................................................................ 106
Figure 5-15: Confocal photograph of the fracture surface for the 8mm specimen and pad
radius R=50mm. ............................................................................................................. 107
Figure 5-16: Theoretical representation of the Weibull’s diagram used for the determination
of the coefficient m and the nominal stress . ............................................................. 109
Figure 5-17: Volume studied for the Weibull’s probability of failure analysis. ....................... 111
Figure 5-18: Probability of failure of the tests carried out with a width of 13 mm and a width
of 8mm computed by the multiaxial index (IMWCM) at the critical distance. ................... 111
Figure 5-19: Comparison of the maximum of the multiaxial index, Imax which leads to the
failure for the two contact’s width. .................................................................................. 112
Figure 6-1: Schematic view of a proposed experimental set-up for fretting fatigue tests at high
temperatures in air. ......................................................................................................... 119

List of Tables
vi
List of Tables
Table 3-1: Principal elements of TI-6Al-4V alloys manufactured for the Safran Snecma fan
disc and blade. .................................................................................................................. 45
Table 3-2: Material properties of the Ti-6Al-4V studied. ........................................................ 47
Table 3-3: Literature review of bimodal macrostructure parameters and HCF data of Ti-6Al-
4V titanium alloy. .............................................................................................................. 48
Table 4-1: Experimental parameters and results used in Bellecave’s experiments (2015). .... 69
Table 4-2: Results of Group 1 fretting-fatigue tests. ................................................................ 70
Table 5-1: Experimental results of the first section of the Group II-a Tests. ........................... 94
Table 5-2: Theoretical and measured values of the global contact and stick zones for the
Group II-a Tests loading conditions. ................................................................................ 97
Table 5-3: Experimental results of the Group II-b Tests. ...................................................... 102
Table 5-4: Theoretical and measured values of the contact and stick zone sizes, as well as for
the fretting damaged areas for the Group II-b Tests loading conditions. ...................... 104

Nomenclature
vii
Nomenclature.
A Composite compliance
,
Damaged area under the slip zone for the width of 13mm and 8mm respectively
Theoretical damaged area in mm²
Measured damaged area in mm²
a Semi-width of the contact
ath Theoretical semi-width of the contact
am Measured semi-width of the contact
a8, a13 Semi-width of the contact for the specimen of 8mm and 13mm respectively
a1(φ) and a2(φ) Halves size of the sides of a rectangular hull
B Tensile force
c Semi-width of the stick zone
cth Theoretical semi-width of the stick zone
cm Measured semi-width of the stick zone
c8, c13 Semi-width of the stick zone for the specimen of 8mm and 13 mm respectively
da Antisymmetric spatial reference field
dc Complementary spatial reference field
ds Symmetric spatial reference field
E Young modulus
E* Equivalent Young modulus
f Friction coefficient
fO Initial coefficient of friction
fm Average coefficient of friction
fs Friction coefficient within the slip zones
f(r) Radial evolution of the spatial reference field
G Modulus of rigidity
g(θ) Tangential evolution of the spatial reference field
Ia Antisymmetric part of the nonlocal intensity factor
Maximum of the antisymmetric part of the nonlocal intensity factor
Is Symmetric part of the nonlocal intensity factor
Ic Complementary part of the nonlocal intensity factor
IMWCM Multiaxial Fatigue Index in terms of Modified Wölher Curve Method
Nomenclature
viii
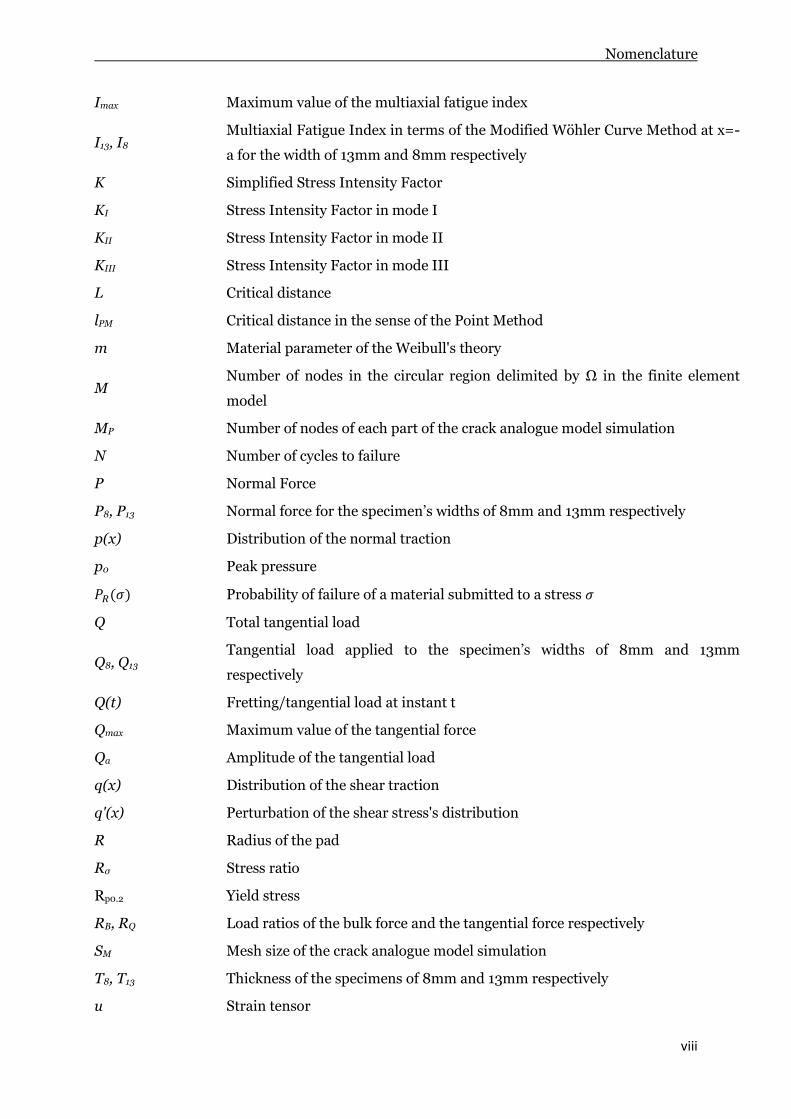
Imax Maximum value of the multiaxial fatigue index
I13, I8
Multiaxial Fatigue Index in terms of the Modified Wöhler Curve Method at x=-
a for the width of 13mm and 8mm respectively
K Simplified Stress Intensity Factor
KI Stress Intensity Factor in mode I
KII Stress Intensity Factor in mode II
KIII Stress Intensity Factor in mode III
L Critical distance
lPM Critical distance in the sense of the Point Method
m Material parameter of the Weibull's theory
M Number of nodes in the circular region delimited by Ω in the finite element
model
MP Number of nodes of each part of the crack analogue model simulation
N Number of cycles to failure
P Normal Force
P8, P13 Normal force for the specimen’s widths of 8mm and 13mm respectively
p(x) Distribution of the normal traction
p0 Peak pressure
Probability of failure of a material submitted to a stress
Q Total tangential load
Q8, Q13
Tangential load applied to the specimen’s widths of 8mm and 13mm
respectively
Q(t) Fretting/tangential load at instant t
Qmax Maximum value of the tangential force
Qa Amplitude of the tangential load
q(x) Distribution of the shear traction
q'(x) Perturbation of the shear stress's distribution
R Radius of the pad
Rσ Stress ratio
Rp0.2 Yield stress
RB, RQ Load ratios of the bulk force and the tangential force respectively
SM Mesh size of the crack analogue model simulation
T8, T13 Thickness of the specimens of 8mm and 13mm respectively
u Strain tensor
Nomenclature
ix
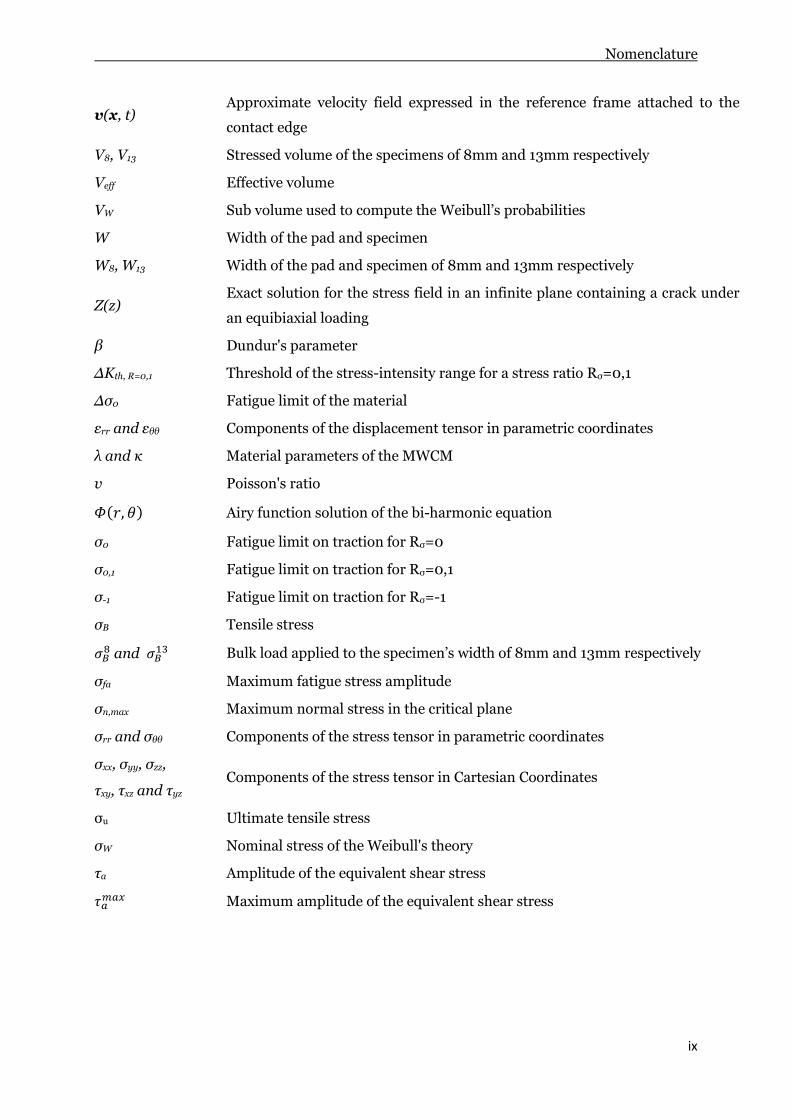
v(x, t) Approximate velocity field expressed in the reference frame attached to the
contact edge
V8, V13 Stressed volume of the specimens of 8mm and 13mm respectively
Veff Effective volume
VW Sub volume used to compute the Weibull’s probabilities
W Width of the pad and specimen
W8, W13 Width of the pad and specimen of 8mm and 13mm respectively
Z(z) Exact solution for the stress field in an infinite plane containing a crack under
an equibiaxial loading
β Dundur's parameter
ΔKth, R=0,1 Threshold of the stress-intensity range for a stress ratio Rσ=0,1
Δσ0 Fatigue limit of the material
εrr and εθθ Components of the displacement tensor in parametric coordinates
λ and κ Material parameters of the MWCM
υ Poisson's ratio
Airy function solution of the bi-harmonic equation
σ0 Fatigue limit on traction for Rσ=0
σ0,1 Fatigue limit on traction for Rσ=0,1
σ-1 Fatigue limit on traction for Rσ=-1
σB Tensile stress
and
Bulk load applied to the specimen’s width of 8mm and 13mm respectively
σfa Maximum fatigue stress amplitude
σn,max Maximum normal stress in the critical plane
σrr and σθθ Components of the stress tensor in parametric coordinates
σxx, σyy, σzz,
τxy, τxz and τyz Components of the stress tensor in Cartesian Coordinates
σu Ultimate tensile stress
σW Nominal stress of the Weibull's theory
τa Amplitude of the equivalent shear stress
Maximum amplitude of the equivalent shear stress
Contents
x
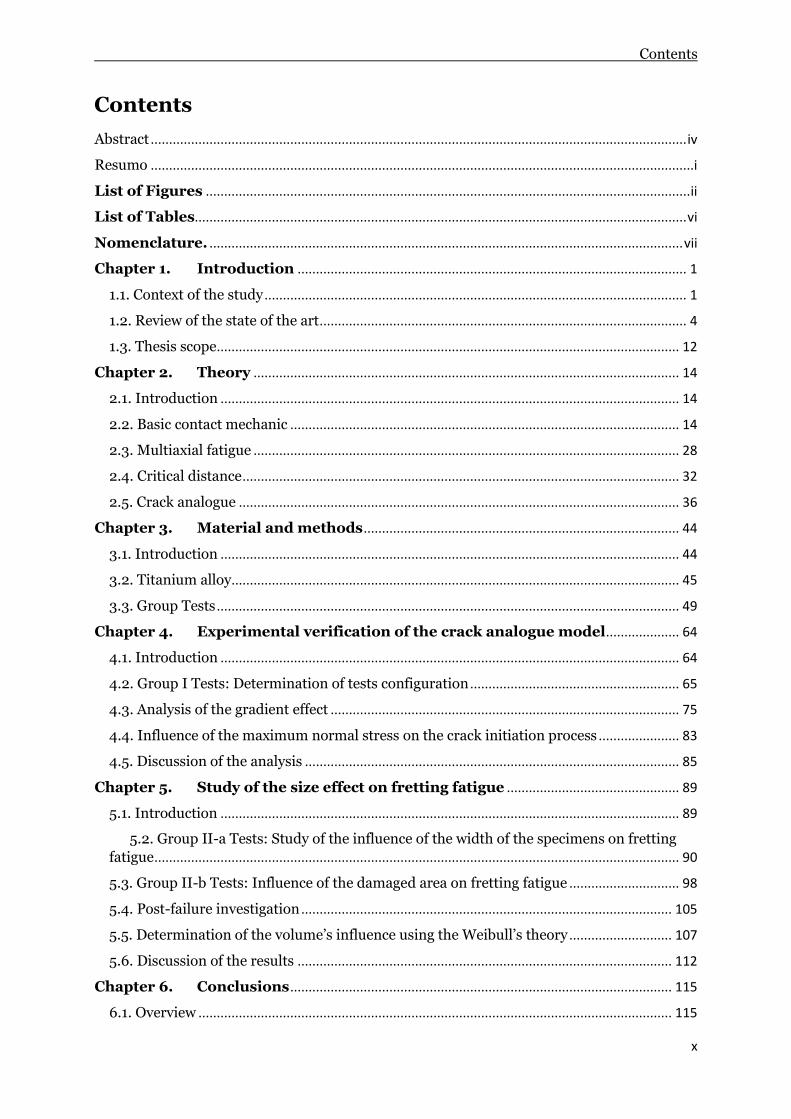
Contents
Abstract .................................................................................................................................................. iv
Resumo ....................................................................................................................................................i
List of Figures .................................................................................................................................... ii
List of Tables...................................................................................................................................... vi
Nomenclature. ................................................................................................................................. vii
Chapter 1. Introduction .......................................................................................................... 1
1.1. Context of the study ................................................................................................................... 1
1.2. Review of the state of the art .................................................................................................... 4
1.3. Thesis scope .............................................................................................................................. 12
Chapter 2. Theory .................................................................................................................... 14
2.1. Introduction ............................................................................................................................. 14
2.2. Basic contact mechanic .......................................................................................................... 14
2.3. Multiaxial fatigue .................................................................................................................... 28
2.4. Critical distance ....................................................................................................................... 32
2.5. Crack analogue ........................................................................................................................ 36
Chapter 3. Material and methods ...................................................................................... 44
3.1. Introduction ............................................................................................................................. 44
3.2. Titanium alloy.......................................................................................................................... 45
3.3. Group Tests .............................................................................................................................. 49
Chapter 4. Experimental verification of the crack analogue model .................... 64
4.1. Introduction ............................................................................................................................. 64
4.2. Group I Tests: Determination of tests configuration ......................................................... 65
4.3. Analysis of the gradient effect ............................................................................................... 75
4.4. Influence of the maximum normal stress on the crack initiation process ...................... 83
4.5. Discussion of the analysis ...................................................................................................... 85
Chapter 5. Study of the size effect on fretting fatigue ............................................... 89
5.1. Introduction ............................................................................................................................. 89
5.2. Group II-a Tests: Study of the influence of the width of the specimens on fretting
fatigue ............................................................................................................................................... 90
5.3. Group II-b Tests: Influence of the damaged area on fretting fatigue .............................. 98
5.4. Post-failure investigation ..................................................................................................... 105
5.5. Determination of the volume’s influence using the Weibull’s theory ............................ 107
5.6. Discussion of the results ...................................................................................................... 112
Chapter 6. Conclusions ........................................................................................................ 115
6.1. Overview ................................................................................................................................. 115

Contents
xi
6.2. Main conclusions .................................................................................................................. 115
6.3. Suggestions for future work ................................................................................................. 117
References. ..................................................................................................................................... 121
Chapter 1 Introduction
1
Chapter 1. Introduction
1.1. Context of the study
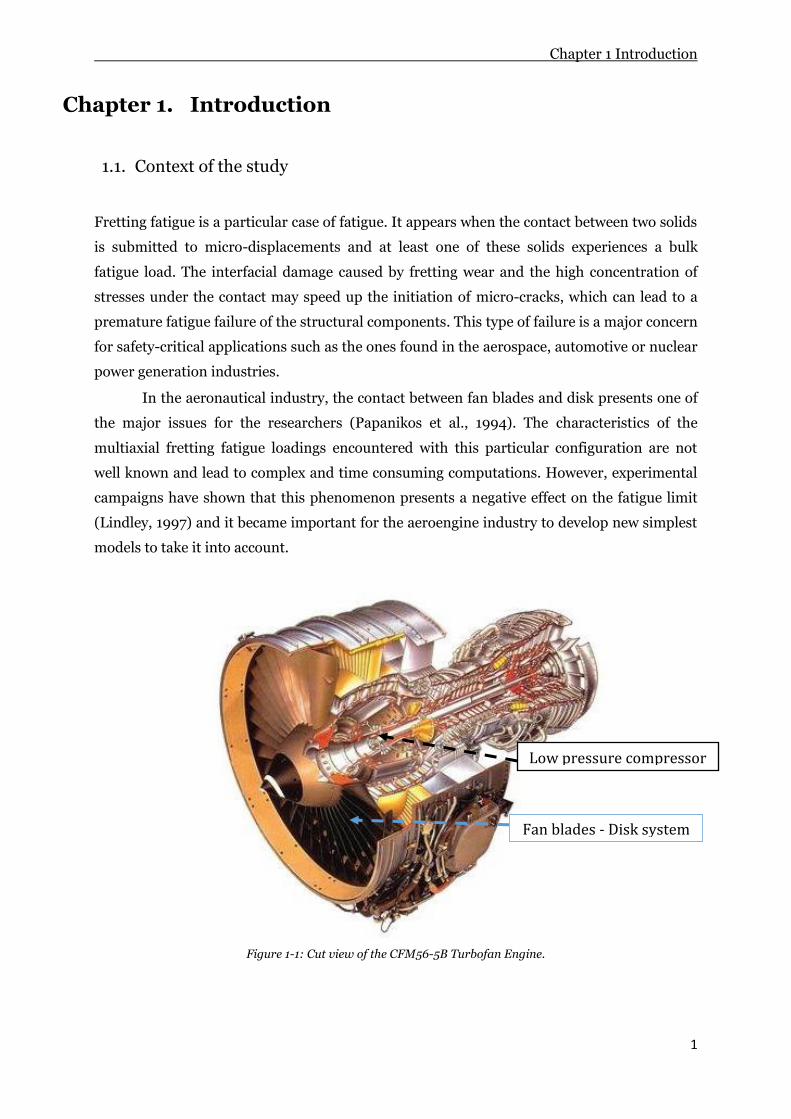
Fretting fatigue is a particular case of fatigue. It appears when the contact between two solids
is submitted to micro-displacements and at least one of these solids experiences a bulk
fatigue load. The interfacial damage caused by fretting wear and the high concentration of
stresses under the contact may speed up the initiation of micro-cracks, which can lead to a
premature fatigue failure of the structural components. This type of failure is a major concern
for safety-critical applications such as the ones found in the aerospace, automotive or nuclear
power generation industries.
In the aeronautical industry, the contact between fan blades and disk presents one of
the major issues for the researchers (Papanikos et al., 1994). The characteristics of the
multiaxial fretting fatigue loadings encountered with this particular configuration are not
well known and lead to complex and time consuming computations. However, experimental
campaigns have shown that this phenomenon presents a negative effect on the fatigue limit
(Lindley, 1997) and it became important for the aeroengine industry to develop new simplest
models to take it into account.
Figure 1-1: Cut view of the CFM56-5B Turbofan Engine.
Fan blades - Disk system
Low pressure compressor
Chapter 1 Introduction
2
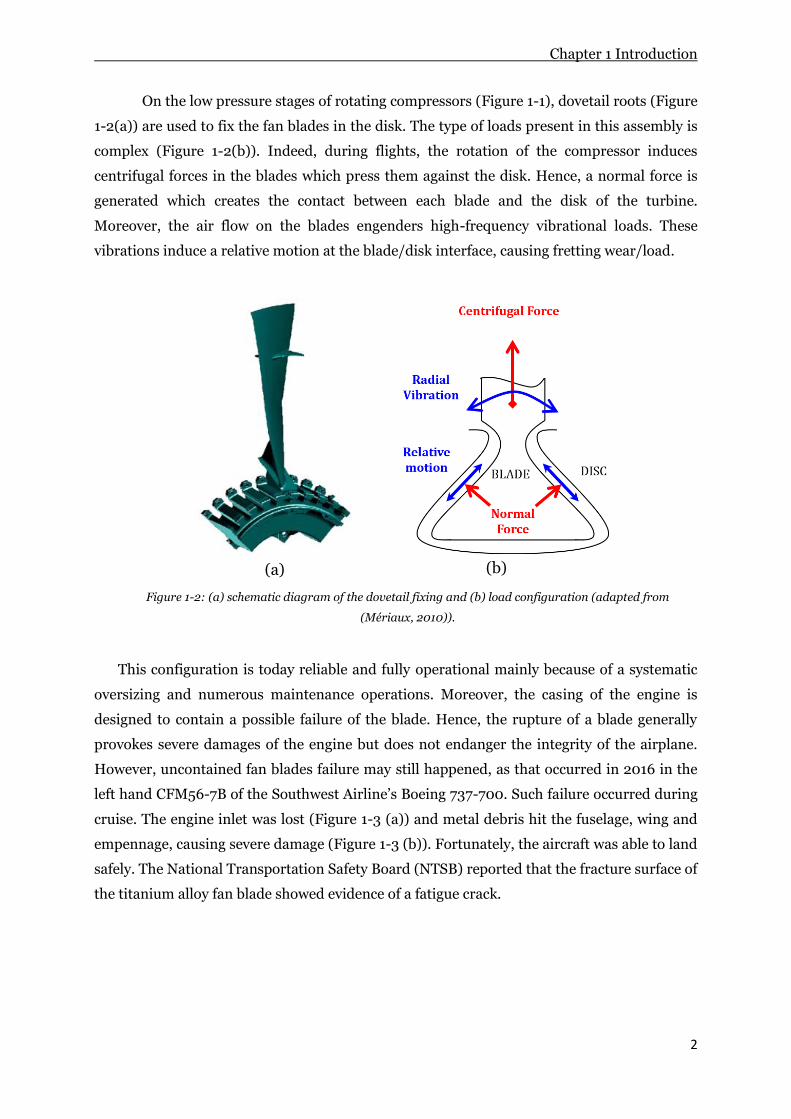
On the low pressure stages of rotating compressors (Figure 1-1), dovetail roots (Figure
1-2(a)) are used to fix the fan blades in the disk. The type of loads present in this assembly is
complex (Figure 1-2(b)). Indeed, during flights, the rotation of the compressor induces
centrifugal forces in the blades which press them against the disk. Hence, a normal force is
generated which creates the contact between each blade and the disk of the turbine.
Moreover, the air flow on the blades engenders high-frequency vibrational loads. These
vibrations induce a relative motion at the blade/disk interface, causing fretting wear/load.
(a)
(b)
Figure 1-2: (a) schematic diagram of the dovetail fixing and (b) load configuration (adapted from
(Mériaux, 2010)).
This configuration is today reliable and fully operational mainly because of a systematic
oversizing and numerous maintenance operations. Moreover, the casing of the engine is
designed to contain a possible failure of the blade. Hence, the rupture of a blade generally
provokes severe damages of the engine but does not endanger the integrity of the airplane.
However, uncontained fan blades failure may still happened, as that occurred in 2016 in the
left hand CFM56-7B of the Southwest Airline’s Boeing 737-700. Such failure occurred during
cruise. The engine inlet was lost (Figure 1-3 (a)) and metal debris hit the fuselage, wing and
empennage, causing severe damage (Figure 1-3 (b)). Fortunately, the aircraft was able to land
safely. The National Transportation Safety Board (NTSB) reported that the fracture surface of
the titanium alloy fan blade showed evidence of a fatigue crack.

Chapter 1 Introduction
3
(a)
(b)
Figure 1-3: Photographs of an aircraft (a) engine and (b) fuselage damage in a Southwest Airline’s Boeing 737-
700 in August, 27th 2016 near Pensacola (Photo: Peter Lemme).
However, failure of the disk may lead to much more critical accidents. For example, in
2010, a Sun Way IL76 suffered an uncontained disk failure leading to the crash of the aircraft
(Figure 1-4). All 6 crew members and 2 support engineers on board as well as 3 people on the
ground were killed. The Pakistan’s Safety Investigation Board (SIB) reported that they found
evidence of fatigue fracture on the second stage disk of the low-pressure compressor.
Figure 1-4: Photographs of the recovered low pressure compressor 2nd stage disk (Photo: SIB).
Safran Aircraft Engines, a French aeroengine manufacturer, has special interest on
the enhancement of their design methodologies against fretting fatigue. In this setting, it has
funded a research project denominated COGNAC (Competition between the Gradient effect
and the scale effect in Notch fatigue and Contact fatigue). This project has not only the
objective to improve the understanding of fretting fatigue, particularly the role of the
gradient and the size effects on the phenomenon, but also to promote the scientific

Chapter 1 Introduction
4
cooperation between the Fatigue, Fracture and Materials Research Group of the University of
Brasília, the Laboratory of Mechanic and Technology of the Paris-Saclay University and the
Department of Physics and Mechanics of Materials of the Institut P Prime.
1.2. Review of the state of the art
The first observations of fretting were reported by Eden et al. (1911). While doing
experiments on rotating beams he observed the formation of oxides debris on the steel grips
of the testing machine and the specimen. He concluded that this corrosion was due to the
varying stress between the test-specimen and its holder. However, it is only in 1927 that
Tomlinson (1927) developed the first fretting apparatus, a machine which generated small
relative relation between two rings. His work (Tomlinson et al., 1939) introduced also some
fundamental concepts for the fretting studies. In particular, he showed that the corrosion has
mechanical origin and in order to observe it some surface alternating slip is necessary. These
results were confirmed by McDowell (1953) who demonstrated that the pressure and the
amplitude of motion between surfaces have an impact on the presence of oxides debris and
on the severity of the fretting.
The effect of the fretting corrosion on the fatigue strength of materials was first shown
by Warlow-Davies et al. (1941). He carried out fatigue experiments on specimens with
fretting damages and he observed a reduction of 13% to 18% for the fatigue strength in
comparison with unfretted specimens. Later, Horger (1953) pointed that, in presence of
fretting, cracks initiate at very low stresses, which are not sufficient to lead to crack
propagation once the environment producing fretting is removed. Moreover, he found that
the necessary level to prevent crack initiation depends on the number of stress cycles
considered. Similar results were obtained by Fenner and Field (1958) who proved that
fretting has a great importance for the crack initiation process. Indeed, they suggested that
this reduction in the fatigue strength was linked to the slip amplitude.
In the last 60 years, fretting-fatigue has become a subject of great interest to
researchers and important advancements in the discipline were made. A rapid search in a
scientific data base such as Science Direct using the term fretting fatigue between 1960 and
2017 provided 7099 results. Much of the work from the sixties to the nineties was achieved in
material science departments to provide data about the resistance of materials to fretting
fatigue. A reasonable amount of data and analysis was also produced on the quantification of
propagation stage of a fretting crack. A good review of some of the most promising results
obtained in this period was organised by Waterhouse (1992). In 1994 arises one of the few
and most important books on fretting fatigue, by Hills & Nowell (1994). This book contains a
summary of the substantial research work produced by the Oxford team. It presents the

Chapter 1 Introduction
5
fundamentals to model and to solve the contact problem of two dimensional elastic contacts
under partial slip regime. The effect of the presence of a varying bulk load is also approached
as the tools to compute stress intensity factors and propagation life under fretting fatigue.
Little attention was paid to crack initiation.
From the middle end of the nineties most of the attention of the fretting community
seems to have turned to the crack initiation mechanisms. To the author’s best knowledge, the
first attempt to use a multiaxial fatigue criterion to predict the crack initiation was done by
Petiot et al. (1995). They used a numerical simulation to determine the stress field within the
contact and then they applied the Dang Van multiaxial fatigue criterion (Dang Van et al.,
1989) to predict whether or not the crack initiation can occur. Following this methodology,
they obtained good predictions for the crack nucleation. Thereafter, Szolwinski and Farris
(1996) applied a modified Smith Watson Topper criterion to take into account the effect of
the mean stress in order to predict both the initiation site and life of fretting-fatigue cracks.
These methods, based on the critical plane model, allowed not only to determine the
crack initiation site, but also the angle of propagation. Comparative studies were done by
Araújo (2000) for the Smith, Watson and Topper parameter (Smith et al., 1970) and the
Fatemi Socie criterion (Fatemi and Socie, 1988). While comparing estimated crack initiation
lives to the experimental ones, he obtained overly conservative predictions for smaller
contacts and satisfactory predictions for larger ones. He concluded that such a phenomenon
occurred mainly because of the stress gradient, which is stronger for smaller contacts. This
suggested that multiaxial fatigue criteria do not take into account the gradient effect
encountered in fretting-fatigue and so new methodologies had to be developed.
Methodologies to take into account the gradient effect on fretting-fatigue
Different methodologies were identified in the literature to cope with the gradient effect.
Araújo (2000, 2002) has proposed two methodologies to take the gradient effect into
account. First, he proposed to average multiaxial fatigue parameters over a characteristic
depth on the critical plane and secondly to average the stresses over a characteristic element
of volume (Figure 1-5). This first methodology takes advantages of the critical plane method
(Findley, 1959, Brown and Miller, 1973, Socie, 1987, Fatemi and Socie, 1988, and McDiarmid,
1991) to perform a two-dimensional analysis on the plane where the crack is expected to
initiate. He applied the first methodology by averaging two multiaxial fatigue parameters, the
Smith Watson Topper and the Fatemi and Socie parameters, along different characteristic
depths. The second method consisted in averaging stresses over a characteristic rectangular
element of volume under the contact. The fatigue parameters were evaluated at different

Chapter 1 Introduction
6
planes for each element of volume so that one could find their global maximum value. This
procedure provided then the location of crack initiation and the “average” critical plane
orientation (Figure 1-6). The numerical results were compared with experimental fretting
fatigue experiments carried out with a cylinder/plane contact configuration for Ti-6Al-4V
alloy and for an aluminium alloy. Both methodologies gave satisfactory life estimations by
using a constant critical depth of 20µm for the aluminium alloy and of 10µm for the Ti-6Al-
4V. Finally, he observed that although it was not possible to firmly conclude about the
physical nature of the critical length (i.e. whether it was a material parameter or a stress
gradient dependent quantity). The best fitting values of this length appeared to be of a similar
magnitude as the grain size for both materials.
Figure 1-5: Schematic description of the methodology 1 (Araújo, 2000)
Figure 1-6: Schematic description of the methodology 2 (Araújo, 2000)
Following this idea, Fouvry (2000) has suggested that it is possible to predict the
crack nucleation by averaging the loading state over a critical elementary volume, whose
characteristic length is more related to a physical constant dimension characteristic of the
microstructure than to the contact size. Later, he has shown that, for steel, the micro-volume

Chapter 1 Introduction
7
identified to find the experimental loading leading to the fretting initiation may be linked to a
characteristically dimension of the microstructure, as the grain size (Fouvry, 2002). This
aspect was discussed by Naboulsi and Mall (2003) by using finite elements computation for
three different multiaxial criteria: the Shear Stress Range (MSR), the modified Smith Watson
Topper parameter (SWT) and the Findley parameters. They used two approaches to average
the multiaxial parameters. First, they averaged the values of each parameter at different
points of a specified rectangular volume. Secondly, they averaged the values of stress and
strain over a specified radial volume and then computed the different parameters from these
average states of stress and strain. To investigate the effect of the stress gradient two radii of
cylindrical pads were considered: one of 50,8 mm and the other of 5,08mm. They observed
good predictions for the angle of crack initiation for both methods and both pad radii.
However, it exists a huge dependence of the size of the process zone on the average
parameters, and this dependence increases for higher stress gradients.
Another axis of research that has been followed to model fretting fatigue in the last
twenty years is the so called crack analogy method. By taking advantage of the similarities
between the singular stress and strain fields for sharp-edged contacts (Gladwell, 1980,
Johnson, 1985 and Hills, 1993) and for cracked bodies (Kanninen, 1985 and Anderson, 1995),
Giannakopoulos et al. (1998) suggested that there is a quantitative equivalence between a
fretting-fatigue and a cracked body under cyclic loadings. To perform the analysis of this
analogy, they first established a geometrical analogy between the radius of the contact zone
and the cracked specimen. Then, they found the stress and strain evolutions for both
configuration. They considered a cracked body subjected to a normal compressive load whose
magnitude is the same as the one used to press the punch on the flat specimen in the contact
configuration. Next, they expressed the stress fields of the contact configuration in terms of
KI and KII and then determined the expression of these two stress intensity factors for the
cracked body. Finally, they demonstrated the stress intensity factors computed previously are
identical in both cases. They established this analogy for two contact configurations: a two-
dimensional contact by considering a rectangular rigid punch pressed against a flat surface; a
three-dimensional contact with a cylinder pressed against a flat specimen. Then they
considered the limited case of complete stick under the contact. The pads considered are
pressed against the specimen by a fixed pressure P and submitted to a fluctuating tangential
force Q. The specimens are submitted to a uniform cyclic stress. The proof of the analogy
between contact and crack configuration allowed them to apply a prediction model for
fretting-fatigue based on this crack analogy. Comparing their numerical results with
experimental results from literature they found good predictions for the crack initiation angle
and growth. For the crack initiation angle they assumed initial direction given when the

Chapter 1 Introduction
8
amplitude of KII is null at the maximum value of the loading (complete stick condition). For
crack’s growth they used a long-crack threshold expressed in terms of the bulk stress.
Looking at these encouraging results Giannakopoulos et al. (2000) extended the
previous crack analogue model to a notch analogue model for two-dimensional contacts. In
this work they developed a new analytical solution for a rounded corner punch pressed
against a substrate submitted to a fretting-fatigue loading by using an analogy with fatigue
crack initiation at the notch tip. This methodology has shown to provide a direct connection
between this configuration of fretting-fatigue and the plain fatigue crack initiation of a
smooth specimen of the same material by considering the bulk stress of the fretting-fatigue
loading as a stress intensity factor. Indeed, the stress field induced by the contact appeared to
be very similar to the square-root singular stress field around an external crack and the bulk
stress to the T-stress in fracture mechanics terminology. The reduction factor between the
two configurations was predicted by deriving the analytical results. They carried out an
experimental validation of this model by using the results of Hutson et al. (1999, 2000)
obtained with a Ti-6Al-4V alloy. The average predictions for the maximum bulk stress have
shown a difference of 10% for a loading ratio R=0.1 and of 4% for R=0.5. They concluded that
crack initiation in fretting-fatigue for a bi-dimensional contact (flat on flat) can be predicted
using the so called “notch analogue model”.
Later Conner (2004) took advantages of the crack-analogue model, proposed by
Giannakopoulos (1998), to predict the total fatigue lives by computing the stress intensity
factors proposed on the model and by applying the Paris’ law. The results obtained with this
approach match the experimental results with an accuracy of ±30%. Based on these results
Chambon (2006) carried out an analysis of the model to assess its potential for futures
researches, but also its limitations in order to determine the improvement that can be made.
To do so he proposed a phenomenological model to describe each stage of crack propagation
based on the crack-analogue approach used to describe the contact problem through fracture
mechanics “tools”. He conclude that if such a description brings good qualitative and
quantitative predictions, some aspects of the fretting-fatigue already have to be incorporated
in the model, such as the residual stresses that may be presented because of the mechanical
treatment of the surface.
A first attempt to complete the original crack analogue model proposed by
Giannakopoulos (1998) was done by Ciavarella et al. (2003a) They observed that in the first
crack analogue model proposed, the bulk stress is only considered for the crack growth
condition. In order to improve the determination of the crack initiation condition, they
considered this stress also for the computation of the stress intensity factors KI and KII.
Lately, Ciavarella et al. (2017) provided a new estimation of the stress intensity factors used
in this model for the case of varying normal load. However, the whole demonstration for the

Chapter 1 Introduction
9
determination of these new stress intensity factors is based on the assumption that the
equation for full stick condition of a square-ended punch is still valid.
Another way to take advantage of the crack analogy was proposed by Dini (Dini et al.,
2006). He considered the classical analysis of notches based on critically stressed regions
approaches, such as point, line and area methods (Taylor, 1999, Lazzarin, 1997) and applied
them to fretting-fatigue. These analyses are constructed on the assumption that, in order for
failure to occur, the average stress must exceed the fatigue limit over some critical volume
surrounding the stress raiser. Thus, he formalised the idea developed by Araújo (2000, 2002)
and Fouvry (2000, 2002) of using a characteristic length to average the stresses under the
contact along a line or over a volume. This critical length is here well defined as a material
parameter, and its value is fixed by the El Haddad’s length parameter (El Haddad et al.,
1979). Moreover, the simplest approach of the Point Method may be applied, where it is
assumed that the value of the fatigue limit has to be calculated so that the total stress range at
the critical length equals the fatigue limit. This method was compared to experimental results
performed on aluminium alloys with different cylinder pad radii but by maintaining a
constant peak pressure. Such a set of experiments allows to highlight the gradient effect.
Good predictions of fretting-fatigue threshold were obtained, however, there are criticisms
with respect to the use of the El Haddad parameter as a material property (Castro et al.,
2009).
A proposition to express this fatigue limit in the case of the fretting-fatigue was done
by Araújo et al. (2007). They studied the application of the Modified Wöhler Curve Method
(MWCM) (Susmel and Taylor, 2003) in conjunction with the Theory of Critical Distance
(TCD). The MWCM assumes that fatigue damage depends on two parameters: the shear
stress amplitude, τa, computed with the Minimum Circumscribed Circle (Dang Van, 1973,
Papadopoulos, 1998) and the maximum normal stress, σn,max, on the critical plane of the
material, and is expressed in terms of τa, ρ and two material parameters: κ and λ. According to
this method, a threshold condition for crack initiation may be extracted from the expression
of the criterion at the critical distance of the material. In order to evaluate the accuracy of the
methodology, they proposed an experimental campaign for a cylinder/plane contact
configuration on AL4%Cu. The error index proposed by Papadopoulos (1995) was adopted to
evaluate the accuracy of the methodology. This error index is expressed in terms of τa, σn,max,
κ and λ, and if a negative value is obtained it means that fatigue failure should not occur up to
the number of cycles considered to compute the material parameters. Finally, this proposed
method was able to predict failure within an error interval of ±20%. An improvement of this
method was given recently by Araújo et al. (2017). First, to compute the shear stress
amplitude the Maximum Rectangular Hull (MRH) method (Mamiya et al., 2002, 2009 and
2014, Araújo et al., 2011 and 2014, Carpinteri et al., 2014) was used instead of the Minimum

Chapter 1 Introduction
10
Circumscribed Circle (MCC) (Papadopoulos, 1998). This modification was motivated because
the MRH showed to be able to provide more accurate endurance limit estimates when used in
conjunction with multiaxial models for some complex loading paths test programs.
Moreover, the critical distance was no longer consider as a material parameter as it was
defined for the Point Method by Taylor (Taylor, 1999). Indeed, some recent developments
(Susmel and Taylor, 2007 and 2008) have demonstrated that to correctly estimate the static
strength under fatigue loading, the critical distance should be calculated as a function of the
number of cycles to failure. While the first version of this methodology allowed only to
predict the fretting-fatigue limit, this new version could be used to estimate the fatigue lives
for fretting-fatigue tests within a factor of 2. Finally, it should be noted that this methodology
was applied to validate the analogy proposed between fretting and notch fatigue (Araújo et
al., 2016).
Returning to the description of the fretting-fatigue mechanisms by means of stress
intensity factors, a new model has been recently proposed by Montebello et al. (2016). This
model is based on the description of an approximate velocity field extracted at the proximity
of the contact edge with a Finite Element Analysis. The nonlocal intensity factors are
computed by a decomposition of this “velocity field”, and are used to build a crack initiation
map. One of the main advantages of this method is that it proved to be geometrically
independent, i.e. when the crack initiation map is expressed in terms of nonlocal stress
intensity factors, the gradient effect is taken into account and there is only one crack
initiation frontier for all geometries studied, for a particular material. In order to predict the
location of the crack initiation frontier by using only materials data, several multiaxial fatigue
criteria were coupled to the nonlocal stress intensity factors description. In particular, The
MWCM previously described was applied, and the comparison with experimental data of the
literature has shown a good prediction of the crack initiation frontier (Montebello, 2015).
However, the major part of the experimental validation was conducted with fretting results
and no study about the effect of the normal stress on the crack initiation frontier has been
achieved.
It is interesting to note the effort made by Montebello et al. (2015) to develop a
geometrical independent crack initiation map. This has been motivated by the industrial
need to transpose the results obtained on laboratory to real-scale industrial components. This
aspect highlights another issue encountered in fretting-fatigue problems, the possible size
effect that may exist between the laboratory contact configuration and industrial
components.
The size effect on fretting-fatigue

Chapter 1 Introduction
11
A number of authors have reported a size effect where a significant number of fatigue lives
are achieved below a contact zone (Hills et al., 1988, Bramhall, 1973). However, this
phenomenon has been investigated by Araújo et al. (1999) and appeared to be a stress
gradient issue, as the stress under the contact will decrease faster when smaller pad
configurations are used. Since this observation, very little work has been done to define
properly the contact size effects.
A recent work of Fouvry et al. (2013) tried to address this problem with a tribological
approach. His objective was to describe the influence of the contact size on the friction and
the wear rate. To do so he carried out numerous fretting tests with different contacts and
loads configurations. First, he conducted tests with sphere-plane contact and then tests with
spherical-plane contact, with different pad radii. To change the size of the contact area, he
studied different contact pressure for the sphere-plane configuration. The contact pressure of
the cylinder-plane configuration has been maintained constant as the modification of the pad
radii already change the size of the contact area. All the experiments were conducted on a
reference AISI52100/AISI52100 interface. The results were analysed regarding the evolution
of two different parameters: the mean coefficient of friction and the Archard wear rates
(Archard, 1953). The results have shown that, for this particular material, the sliding
amplitude and the contact pressure have little influence on the evolution of both parameters
considered. Hence, it was assumed that the major role was played by the contact size. Indeed,
it appears that with larger contact size there were a decrease of the mean coefficient of
friction and an increase of the wear rate. Two explanations of this phenomena cropped up.
First, it can be described by a tribological approach. Indeed, an increase of the contact size
helps to trap the debris created by the fretting process and so leads to a thicker third body
layer. This will easy the shear interface accommodation and provoke a reduction of the
coefficient of friction and of the wear rates. Secondly, it is also reminded that a larger contact
size means a softer stress gradient. The tribological approach was largely discussed in this
work and a model was proposed, an offset power law between a tribological parameter, i.e.
the mean friction coefficient or the Archard wear rates, and a contact size parameter, which
describe well the tough decrease of the two parameters studied with small contact conditions
and their quasi-constant evolution in larger contact domains. However, the way to use this
model for an extrapolation of the laboratory to the industrial issues has not been yet
proposed, and the influence of the gradient effect was not isolated.
Conclusion on the literature review and objective of the thesis
In recent decades, the gradient effect of the fretting fatigue has been often studied and
different models to describe the problem were proposed, but only a few approaches were

Chapter 1 Introduction
12
concerned to the extension of these design methodologies, usually validated under simple
laboratory conditions, to the industrial needs. As it was previously discussed, the model
proposed by Montebello (2015, 2016) seems appealing in this context, but it neither
addressed in details the effect of the mean stress on the crack initiation boundary nor
validated the model for a wider range of metallic materials under fretting-fatigue conditions.
One can also observe from our review of the state of the art that another issue which has
clearly received little attention from the scientific community in fretting-fatigue is the size
effect. The work presented in this thesis will therefore try to present new contributions to
address these problems. New experimental data will be generated considering a Ti-6Al-4V
alloy (used to produce fan blade and disks in aircraft engines) not only to further validate the
crack analogue model, but also to try to isolate and identify the role of the size effect on
fretting-fatigue.
1.3. Thesis scope
To answer the problematics of the thesis, both experimental and analytical work is necessary
and will be described in this manuscript.
In Chapter 1 the context of the work has been defined as well as the review of the state
of the art and the objectives of the thesis. In Chapter 2, the theoretical background on which
the analytical work is based on will be detailed. It consists on (i) the modelling of two
dimensional elastic contact mechanics under partial slip conditions and in the presence of
bulk fatigue loads, (ii) the presentation of the theory of critical distances (TCD) and (iii) the
fundamentals about the two models used on this work: The Multiaxial Wöhler Curve Method
the Crack Analogue Model (using nonlocal Stress Intensity Factors), both used in conjunction
with the TCD.
In Chapter 3, an overview of the material properties and of the experimental
methodologies and facilities will be presented. This will allow to gain insight on the
experimental results used in the following chapters as two groups of experimental tests will
be carried out.
In Chapter 4, the first group of experimental results will be used to test the ability of
the crack analogue model to deal with the gradient effect encountered on fretting-fatigue. The
advantages of this model, specifically the savings on computational time, are of great interest
for aeronautical companies. Indeed, if successful, this methodology could be implemented
industrially to study more complex geometry encountering likewise issues of fretting fatigue.
In Chapter 5, the second group of tests results will be detailed and analysed to
investigate the size effect. Indeed, it exists only a few study about this phenomenon and there
is an increasing demand for its understanding. The nonlocal multiaxial fatigue criterion of

Chapter 1 Introduction
13
the Multiaxial Wöhler Curve Method used in conjunction with the Critical Distance theory
will be used to investigate the influence of the width size of the specimens and the size of the
damage area on fretting-fatigue crack initiation.
Finally, in Chapter 6, general conclusions about this work and proposal for future
work will be presented.
Chapter 2 Theory
14
Chapter 2. Theory
2.1. Introduction
In order to analyse the experimental results, a theoretical background will be necessary.
The formulation of the stress state induced by fretting-fatigue loadings has been
completely formalised on the book of Hills and Nowell, “Mechanics of Fretting Fatigue” (Hills
and Nowell, 1994), and will be reproduced here for the experimental configuration chosen.
Two criteria will also be analysed and assessed. The Multiaxial Wöhler Curve Method
in conjunction with the theory of the critical distance, as proposed by Araújo et al. (2007) and
a crack analogue model based on nonlocal Stress Intensity Factor proposed by Montebello et
al. (2015, 2016).
2.2. Basic contact mechanic
Usual experimental contact configurations
Industrial components and structures usually show complex geometry which can hardly be
reproduced in laboratory. That’s why different simplifications of the contacts have been
developed to allow easier experiments (Figure 2-1). Three reference contacts are generally
defined:
- Spherical fretting pads loaded against a plane specimen. This contact geometry is
unidimensional and so does not require alignment (Kuno et al., 1989). Therefore it is
easier to implement experimentally. However, the computation for this
representation is more complicated because it is a 3 dimensional problem.
- Cylinder fretting pads loaded against a plane specimen. This two-dimensional contact
is regularly used even if it requires a cautious alignment of the pad. Moreover, it is
described by the Hertz theory (Hertz, 1981) and analytical solution already exists
(Hills and Nowell, 1994).
- Flat fretting pads loaded against a plane specimen. This the three-dimensional
configuration is the closest from the industrial configurations. However, it is scarcely
used because of the difficulty encountered for the alignment. Moreover, this geometry
is characterised by high discontinuities for the pressure and shearing’s profiles at the
bordering of the contact, nevertheless analytical solutions have been developed
(Alexandrov et al. (2001), Ciavarella et al. (2003b)).

Chapter 2 Theory
15
Figure 2-1: Geometries of the three reference contacts: (a) sphere/plane; (b) Cylindrical/plane; (c) Flat/plane
contact.
The industrial contact involved for the COGNAC project is complex to model.
However, the main objectives of this study are to improve the today knowledge about the
gradient effect and the size effect. Hence, a simplified geometry can be considered. The one
selected for this study is the cylinder/plane contact because its analytical solution is easy to
implement and different gradient of stress can be encountered by modifying the radius of the
pad. Thus, the methodology to obtain the subsurface stress field will be developed for this
configuration.
Determination of the surface traction for a fretting-fatigue loading
The determination of the internal fields is divided into two stages. First, the contact pressure
distribution has to be determined by solving the contact problem. Then, the internal stress,
strain and displacement field is found using the expressions of the surface tractions deduced
previously.

Chapter 2 Theory
16
Figure 2-2: Cylinder-plane contact subject to normal and tangential forces.
Plane monotonically problem: Figure 2-2 shows a cylindrical pad loaded by a normal force P
against a flat specimen. A tangential force, Q, is applied to the pad. The Hertz’s theory (Hertz,
1881) can be used as it is a non-conformal contact. Then, by applying the hypothesis of plane
strain, the stress state may be extracted with an Airy function solution of the bi-harmonic
equation (Timoshenko and Goodier, 1951):
(2.1)
(2.2)
(2.3)
The stress field may be find by using the Hooke’s law:
(2.4)
Chapter 2 Theory
17
(2.5)
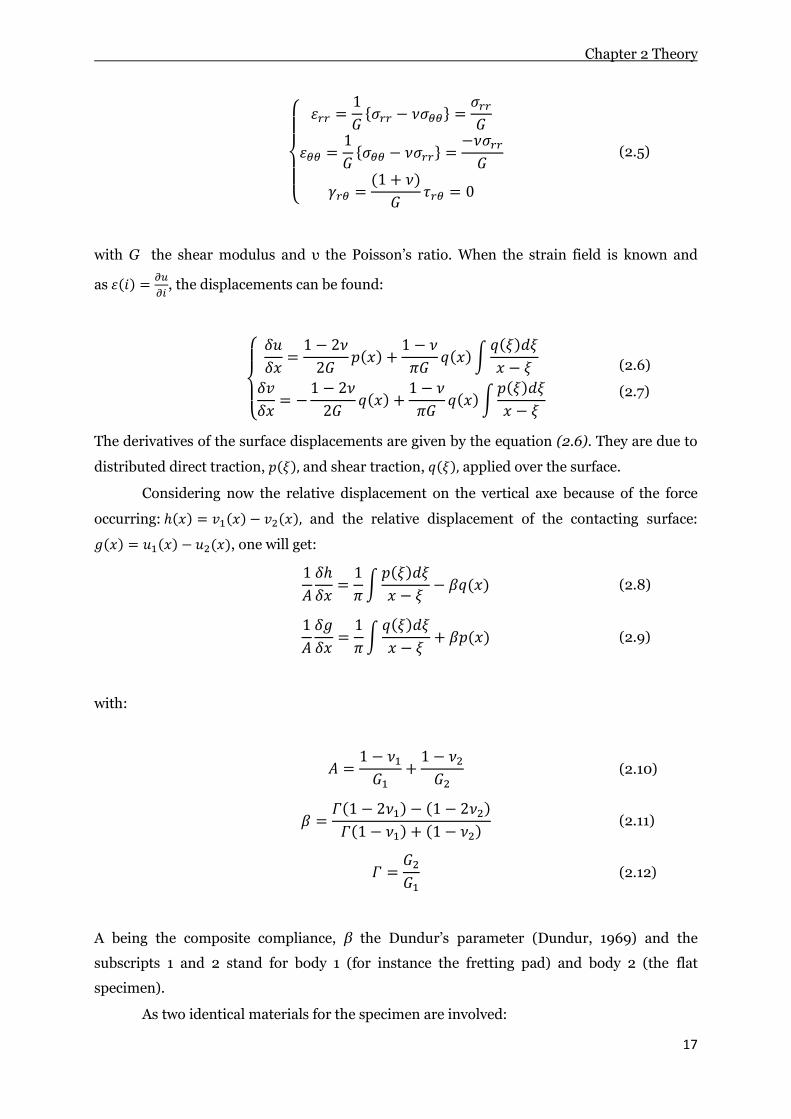
with G the shear modulus and υ the Poisson’s ratio. When the strain field is known and
as
, the displacements can be found:
(2.6)
(2.7)
The derivatives of the surface displacements are given by the equation (2.6). They are due to
distributed direct traction, and shear traction, applied over the surface.
Considering now the relative displacement on the vertical axe because of the force
occurring: and the relative displacement of the contacting surface:
, one will get:
(2.8)
(2.9)
with:
(2.10)
(2.11)
(2.12)
A being the composite compliance, β the Dundur’s parameter (Dundur, 1969) and the
subscripts 1 and 2 stand for body 1 (for instance the fretting pad) and body 2 (the flat
specimen).
As two identical materials for the specimen are involved:

Chapter 2 Theory
18
(2.13)
(2.14)
(2.15)
For the cylinder-plane contact problem, the Muskhelishvili’s solution (Muskhelishvili, 1953)
of the equation (2.7) is:
(2.16)
where p0 is the peak pressure:
(2.17)
and a is the semi width of contact:
(2.18)
where R is the equivalent radius:
(2.19)
and E* is the equivalent Young modulus:
(2.20)
The subscripts 1 and 2 stand for body 1 (for instance the fretting pad) and body 2 (tensile
specimen).
Chapter 2 Theory
19
The tangential load is, for its part, the solution of the equation (2.8) and has been
firstly described by Cattaneo (1938):
(2.21)
where the perturbation q’(x) is zero in the slip zone (c ≤ |x| ≤ a). In the stick zone, q’(x) can
be found by noticing there is no variation of the relative displacement between corresponding
points. Therefore, the complete solution for the cylinder-plane case has been find by Hills
and Nowell (1993):
(2.22)
The size of the stick zone is found by enforcing tangential equilibrium:
(2.23)
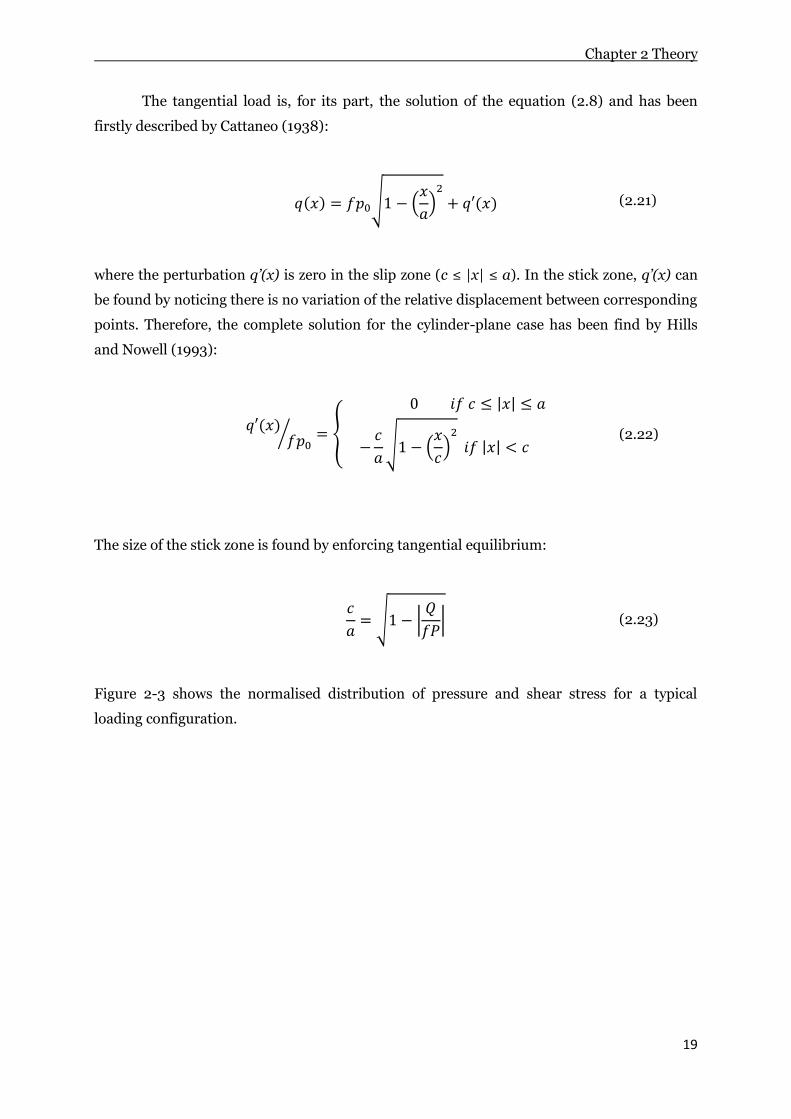
Figure 2-3 shows the normalised distribution of pressure and shear stress for a typical
loading configuration.
Chapter 2 Theory
20
Figure 2-3: Normalised distribution of pressure and shear stress for Q/fP=0,45 and σB/fp0=0.
Cyclic loading: Fretting experiments induce a cyclic tangential load between constant limits,
±Qmax (Figure 2-4). It follows that the expressions previously determined are validated only
for the extreme values of the loading. The expressions of the surface tractions for whole parts
of the loading will be given in this part.
The Amonton’s law (Wolfram, 1983) gives the relation between the shear traction and
the tangential load within the slip zone:
(2.24)
and the direction of the shear traction opposes the relative motion of the surfaces:
(2.25)
In the central region, where there is no relative slip between corresponding particles, the
shear traction must be less or equal to the limiting frictional value:
(2.26)

Chapter 2 Theory
21
Figure 2-4: Variation of shear load Q with the time
Returning to the determination of the shear traction, Figure 2-4 depicts the variation
of the tangential load among the time. When the load increases monotonically from 0 to Qmax,
the maximum amplitude of the tangential force, the shear traction is defined as described by
the equation (2.21) and (2.22)
Now consider that the load has been infinitesimally reduced from its maximum value,
point A, to point B. Hence, it will have a change of sign in the rate of the tangential
displacement , so the equation (2.3) is no longer valid and instantaneous stick must
occur over the entire contact.
If the fretting load is further reduced until the point C, a relative slip will appear at the
contact edges. In these new slip zones , the shear traction will have changed
from to . The corrective traction necessary to prevent this slip is:
(2.27)
Then, the net shear traction can be written as:
Chapter 2 Theory
22
(2.28)
As with the case of monotonic loading, the size of the new stick zone at the reversal of load is
obtained from the overall equilibrium:
(2.29)
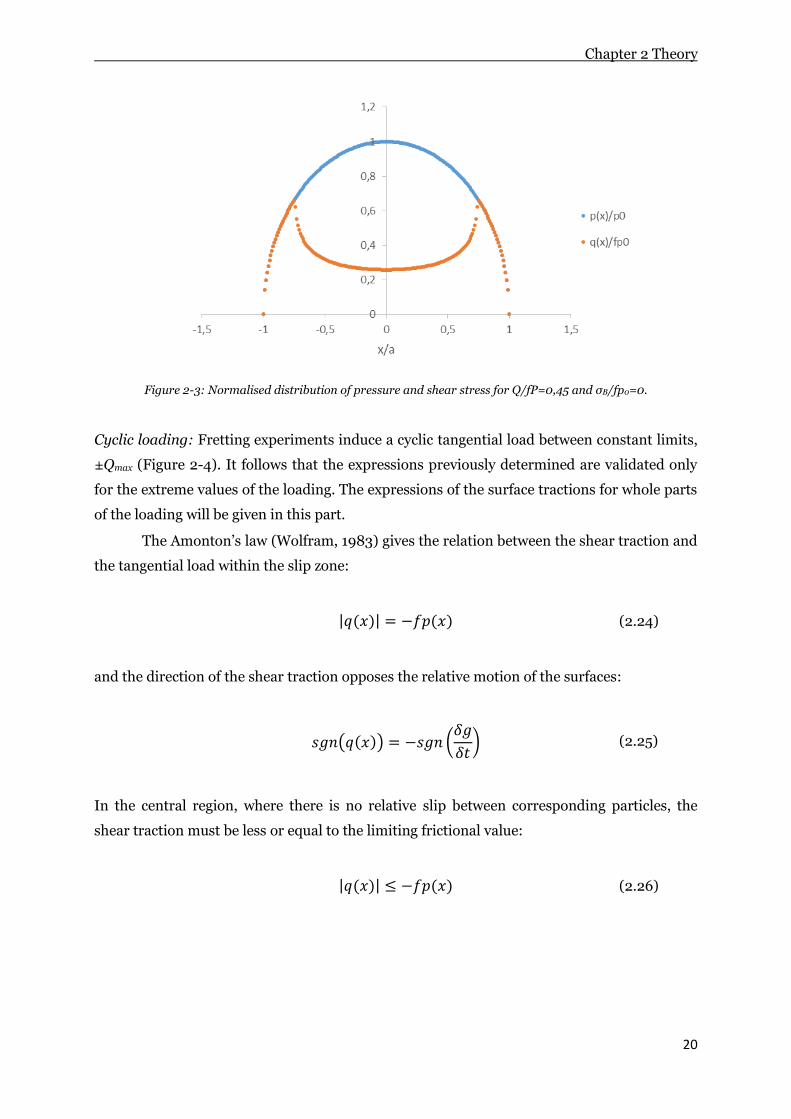
Figure 2-5 depicts the variation of shear tractions at different values of Q, corresponding to
points A, C, D, E and F of the fully reversed fretting cycle.
Figure 2-5: Variation of shear traction at different instants of the fully reversed fretting cycle. Q/fP varies
from +0.6 to -0.6.
Effect of the bulk load: In the present work, a fretting-fatigue loading is considered and so
the flat specimen is submitted to a bulk stress which modifies the classical Mindlin solution

Chapter 2 Theory
23
for the shear traction. This will be necessary as the bulk load will cause a strain in the
specimen that is not present in the pads. This mismatch in strain caused an additional term
in the tangential equation (2.8), and the resultant shear tractions will differ from those
arising in pure fretting configuration. Nowell’s experimental configuration is used to
illustrate this situation (Figure 2-6).
Figure 2-6: Schematic representation of the experimental contact configuration used by Nowell showing the
coordinate system chosen for the analysis.
In this case, the partial derivative of the relative tangential displacement is no longer zero in
the stick zones. The left hand side of the equation (2.8) can then be written in form of stress
yields:
(2.30)
The effect of the bulk stress, , is to offset the stick zone, which was centrally
positioned in the absence of bulk stress. The domain of the perturbation in the full solution
now becomes rather than the former symmetrical , where e is the offset of
the centre stick zone from the centre of the contact. Application of appropriate boundary
conditions in and outside of the stick zone together with the integration of the equation (2.7)
fix the value e:
(2.31)
Thus the perturbation term for the shear traction becomes:

Chapter 2 Theory
24
(2.32)
The solution developed above is satisfactory for moderate values of the bulk tension.
If larger values of tension are applied, one edge of the stick zone will approach the edge of the
contact. The current solution is therefore only valid for .
Determination of the stress field for a fretting-fatigue loading
Once the surface traction has been determined, it is possible to evaluate the stresses in the
specimen by superposing the effects of the normal pressure, the shear traction and the
specimen bulk load using Muskhelishvili’s potential theory (Muskhelishvili, 1953). For most
of the stress components, it is possible to use a half-plane assumption in the computation of
stresses due to the contact.
If the material remains elastic linear, the evaluation of the xx component of stress due to
the normal load can be obtained with the superposition of the results for the elliptical
tractions. Although, the shifted origins of the perturbations terms, q’(x) and q’’(x), will have
to be taken into account. It is particularly worthy to note that four different combinations of
superposition will be necessary to express the stress field at the maximum and minimum
load, and during unloading and reloading. For instance, the normalised xx components of
stress at each stages will be:
At maximum load:
(2.33)
During unloading:
(2.34)
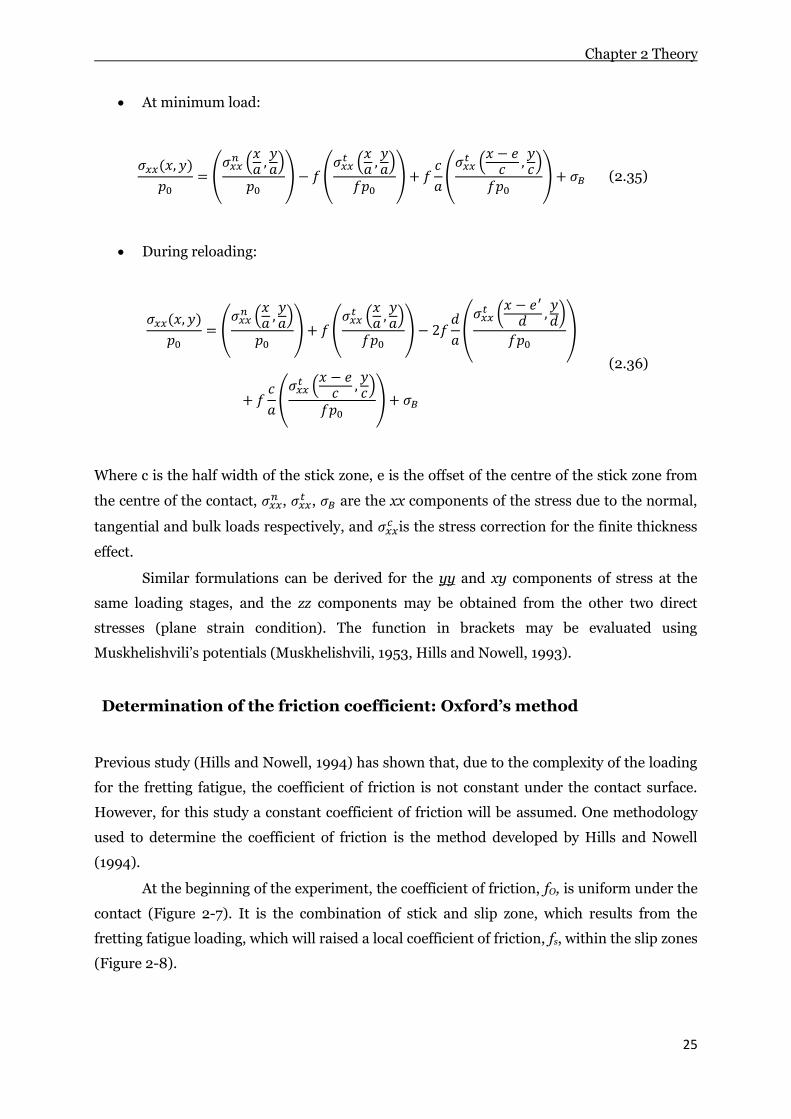
Chapter 2 Theory
25
At minimum load:
(2.35)
During reloading:
(2.36)
Where c is the half width of the stick zone, e is the offset of the centre of the stick zone from
the centre of the contact, ,
, are the xx components of the stress due to the normal,
tangential and bulk loads respectively, and is the stress correction for the finite thickness
effect.
Similar formulations can be derived for the yy and xy components of stress at the
same loading stages, and the zz components may be obtained from the other two direct
stresses (plane strain condition). The function in brackets may be evaluated using
Muskhelishvili’s potentials (Muskhelishvili, 1953, Hills and Nowell, 1993).
Determination of the friction coefficient: Oxford’s method
Previous study (Hills and Nowell, 1994) has shown that, due to the complexity of the loading
for the fretting fatigue, the coefficient of friction is not constant under the contact surface.
However, for this study a constant coefficient of friction will be assumed. One methodology
used to determine the coefficient of friction is the method developed by Hills and Nowell
(1994).
At the beginning of the experiment, the coefficient of friction, fO, is uniform under the
contact (Figure 2-7). It is the combination of stick and slip zone, which results from the
fretting fatigue loading, which will raised a local coefficient of friction, fs, within the slip zones
(Figure 2-8).

Chapter 2 Theory
26
Figure 2-7: Coefficient of friction under the contact at
the beginning of the experiment.
Figure 2-8: Coefficient of friction under the contact
after n cycles.
It is assumed that the coefficient of friction f(x) remains unknown in the interval c0 ≤ |x| ≤ cn,
but that it has to lie between f0 and fs. The size of this stick zone is given by:
(2.37)
When this step of the experiment is reached, the average coefficient of friction may be
measured by stopping the fretting and increasing gradually the tangential force until sliding
occurs. The value of the average coefficient of friction, fm, is given by:
(2.38)
which gives, after differentiation:
(2.39)
Then, the equation (2.38) may be rewrite as:
(2.40)
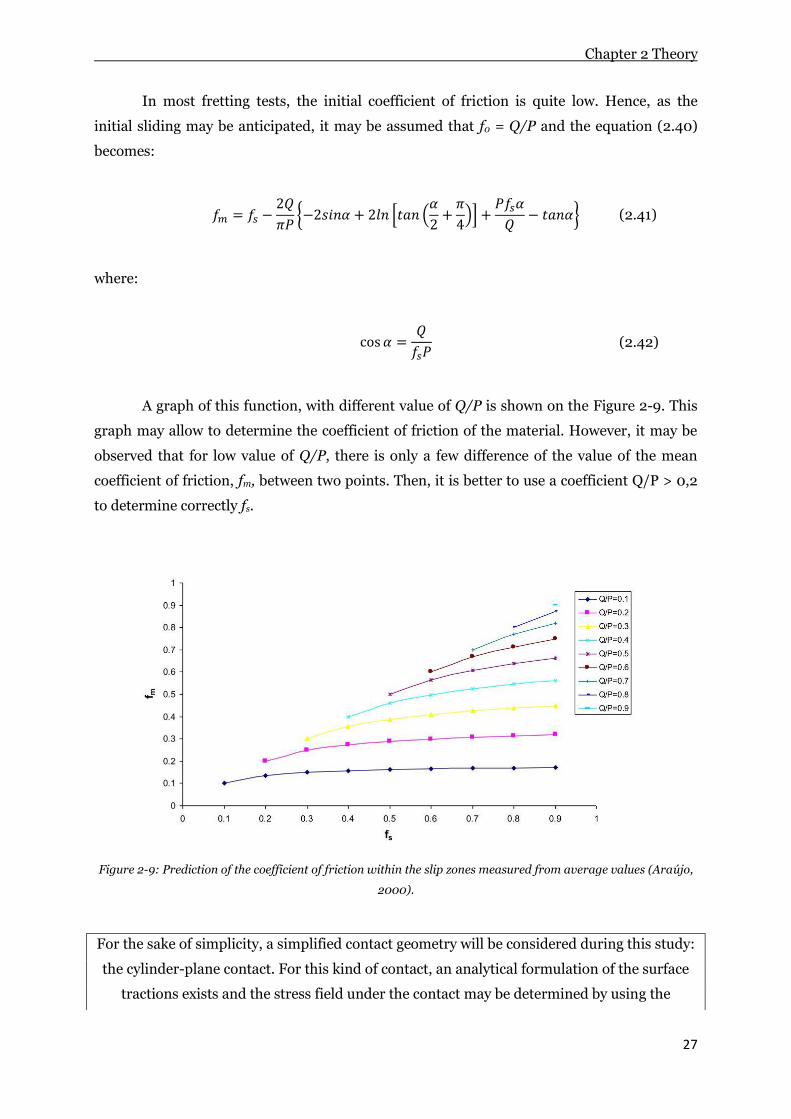
Chapter 2 Theory
27
In most fretting tests, the initial coefficient of friction is quite low. Hence, as the
initial sliding may be anticipated, it may be assumed that f0 = Q/P and the equation (2.40)
becomes:
(2.41)
where:
(2.42)
A graph of this function, with different value of Q/P is shown on the Figure 2-9. This
graph may allow to determine the coefficient of friction of the material. However, it may be
observed that for low value of Q/P, there is only a few difference of the value of the mean
coefficient of friction, fm, between two points. Then, it is better to use a coefficient Q/P > 0,2
to determine correctly fs.
Figure 2-9: Prediction of the coefficient of friction within the slip zones measured from average values (Araújo,
2000).
For the sake of simplicity, a simplified contact geometry will be considered during this study:
the cylinder-plane contact. For this kind of contact, an analytical formulation of the surface
tractions exists and the stress field under the contact may be determined by using the

Chapter 2 Theory
28
Muskhelishvili potential’s theory. This 2D analytical formulation of the contact problem will
be coded using a Python script, after the determination of the coefficient of friction
corresponding to our contact. This will allow a rapid computation of the stress field
corresponding to the different experiments which will be realised.
2.3. Multiaxial fatigue
The fracture of materials under service conditions depends on many factors which will
interact on each other’s. Some of these parameters are listed below:
- Material properties and microstructure;
- Load frequency;
- Load amplitude;
- Loading ratio;
- Stress concentration;
- Stress multiaxiality;
- Scale of structural components;
- Environment;
- Temperature;
- Material defects;
- …
Two regimes of fatigue can be observed: the Low Cycle Fatigue and the High Cycle
Fatigue. In the first case, the structure experiences high levels of loads. Plastic deformations
may be observed, due to that high level of forces, and the life is relatively short, under 105
cycles. In the other hand, for HCF, the level of solicitation stay low and elastic deformations
are firstly observed. In that case, concepts of infinite life and fatigue limit stress may be
defined. Usually, it will be considered that after 106 or 107 cycles the material will never
break.
In order to deal with all the issues listed above, different criteria have been formulated.
One of these criteria will be presented below, a criteria based on the critical plane.
The critical plane approach (Findley, 1959, Brown and Miller, 1973, Socie, 1987, Fatemi
and Socie, 1988, and McDiarmid, 1991), to identify the fatigue strength estimated of a
component, is really attractive from a mechanical point of view. This is because it will not
only give the fatigue strength of the component, but it will also provide information about the
location and the direction estimated for the crack initiation.
Cracks initiate in preferential material planes, usually associated with high shear stresses.
However, the normal mean stress plays also a role on the mechanism. It will keep the crack

Chapter 2 Theory
29
faces open and makes easier their growth. The idea behind the critical plane method is
therefore to find the plane which will experiencing the highest combination of some
equivalent normal and shear stress. There are several method to compute the equivalents
shear stress and normal stress. Dang Van (1973) and later Papadopoulos (1994) proposed
that the equivalent shear stress is given by the radius of the minimum circle circumscribing
the stress path. However, such a minimum circle does not exist for a non-convex polygonal
stress path. Improvement of this method were proposed later, Li et al. (2000) considered the
minimum ellipsoid enclosing the deviatoric stress path, but it may fails for some paths such
as the rectangular ones, and Mamiya et al. (2002) proposed a new definition of the minimum
ellipsoid based on its Frobenius norm and they observed that for elliptical paths this norm
was easily computed from the axes of rectangular Hull. Based on this observation, Mamiya et
al. (2009) proposed a new method: The Rectangular Hull.
Rectangular Hull Method
The Rectangular Hull Method, as proposed by Mamiya et al. (2009) in the deviatoric stress
space and later by Araújo et al. (2011) on the material plane, is a method to compute the
equivalent shear stress, , characterizing the fatigue damage under multiaxial loading. In the
first case, while working in the deviatoric space, some loading paths may need a rotation of
the Hull around up to five axes, which will require an optimizing algorithm. This is no longer
necessary if the Rectangular Hull Method is applied on the material planes. Indeed the
rotation of the hull is done on the material plane and so a simple rotation in two dimensions
is sufficient to calculate (Figure 2-10).

Chapter 2 Theory
30
Figure 2-10: Stress path ψ, its convex hull and the identification of the characteristic lengths used to compute
the shear stress amplitude in a material plane.
Thus, the first step to find the equivalent shear stress amplitude on a material plane
is to compute the halves size of the sides of a rectangular hull and :
(2.43)
Then, for each -oriented rectangular hull, the amplitude of the equivalent shear stress may
be defined as:
(2.44)
Finally, the equivalent shear stress which will be used is the one which maximises the
equation (2.43):
(2.45)
The Modified Wöhler Curve Method
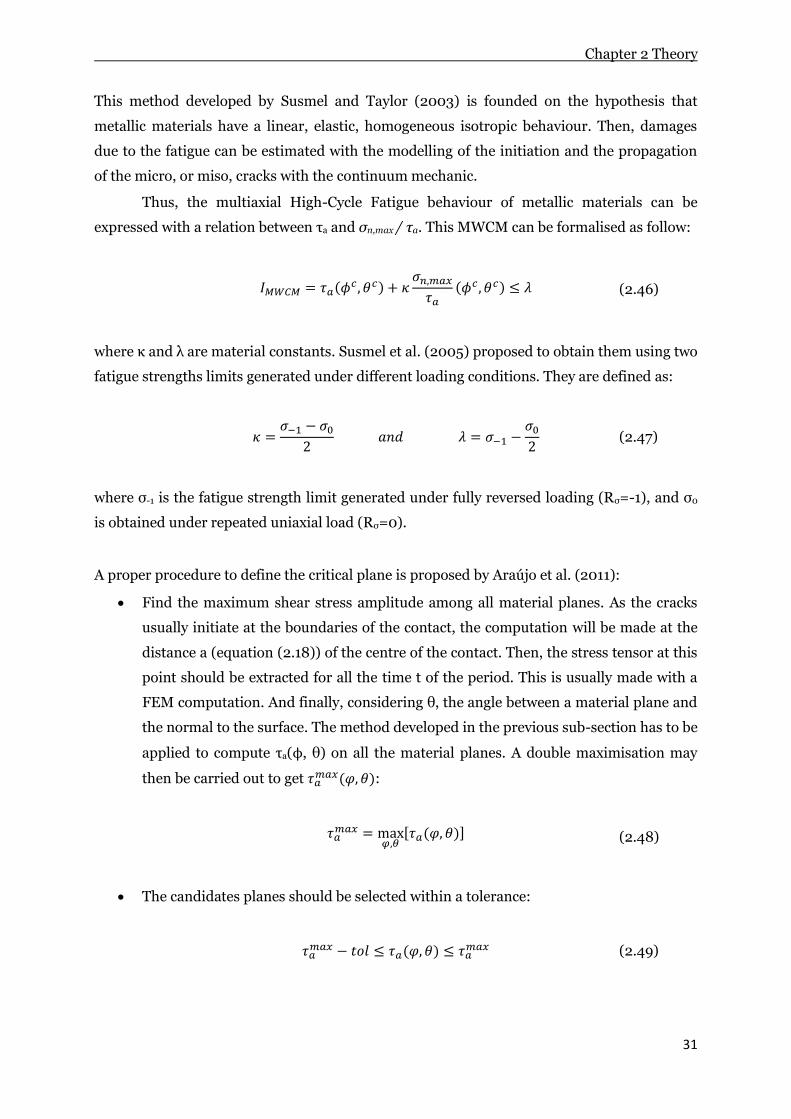
Chapter 2 Theory
31
This method developed by Susmel and Taylor (2003) is founded on the hypothesis that
metallic materials have a linear, elastic, homogeneous isotropic behaviour. Then, damages
due to the fatigue can be estimated with the modelling of the initiation and the propagation
of the micro, or miso, cracks with the continuum mechanic.
Thus, the multiaxial High-Cycle Fatigue behaviour of metallic materials can be
expressed with a relation between τa and σn,max / τa. This MWCM can be formalised as follow:
(2.46)
where κ and λ are material constants. Susmel et al. (2005) proposed to obtain them using two
fatigue strengths limits generated under different loading conditions. They are defined as:
(2.47)
where σ-1 is the fatigue strength limit generated under fully reversed loading (Rσ=-1), and σ0
is obtained under repeated uniaxial load (Rσ=0).
A proper procedure to define the critical plane is proposed by Araújo et al. (2011):
Find the maximum shear stress amplitude among all material planes. As the cracks
usually initiate at the boundaries of the contact, the computation will be made at the
distance a (equation (2.18)) of the centre of the contact. Then, the stress tensor at this
point should be extracted for all the time t of the period. This is usually made with a
FEM computation. And finally, considering θ, the angle between a material plane and
the normal to the surface. The method developed in the previous sub-section has to be
applied to compute τa(ϕ, θ) on all the material planes. A double maximisation may
then be carried out to get :
(2.48)
The candidates planes should be selected within a tolerance:
(2.49)

Chapter 2 Theory
32
The critical plane is the plane among the candidates’ planes where the maximum
normal stress is maximized.
(2.50)
As we have seen on the review of the state of the art, several multiaxial fatigue models exist
on the literature, and may be divided into two main categories: the criteria based on stress
invariants and the ones based on a critical plane approach. The non-linear nature of the
friction at the contact interface make difficult the application of such models because the
loading is likely to be non-proportional in the neighbourhood of the contact. Among all the
critical plane approach, the one proposed by Susmel and Taylor (2003) presents the
advantage to take into account the equivalent shear stress as well as the maximum normal
stress for the determination of the critical plane, which is what motivated our decision to use
this particular model.
2.4. Critical distance
There are three different ways to apply a force to allow a crack to propagate. Irwin (1958)
proposed a classification corresponding to these situations, or fracture modes, represented in
Figure 2-11. The mode I is connected to traction condition, with force normal to the crack
plane. The mode II and III correspond to shearing type loading conditions. For the mode II,
the shearing stress acts in parallel to the crack plane, while it acts in parallel to the crack tip
for the mode III. Generally, a mixed mode situation can be observed, with a superposition of
the modes. In the particular case of the cylinder/plane fretting fatigue configuration, cracks
will propagate with a combination of mode I and II.

Chapter 2 Theory
33
Figure 2-11: Illustration of the three propagation modes.
Stress Intensity Factor
Westergaard (1939) has found an Airy stress function that is the solution for the stress field
in an infinite plane containing a crack under an equibiaxial loading (Figure 2-12). This exact
solution, Z(z) is expressed as follow:
(2.51)
where a is the semi-width of the crack.
Later, Irwin (1957) expressed this exact solution in local coordinate ( and
gave the first order of the asymptotic expansion:
(2.52)
(2.53)
(2.54)
and he introduced the concept of the Stress Intensity Factor (SIF):
(2.55)

Chapter 2 Theory
34
where σxx, τyx and τyz are the near crack tip stresses and KI, KII and KIII are associated with the
three different crack opening modes (opening, shearing and tearing).
Figure 2-12: Crack in an infinite plane.
Critical distance theory
The first use of a critical distance theory was done by Neuber (1936, 1958) to predict the
fatigue strength of notched components. He assumed that to represent the real stress
damaging the fatigue process zone, the stress close to the stress raiser has to be an average of
the stress distribution close to the stress concentration. He formalised this idea in terms of
the so-called line method (LM) (Figure 2-13(b)). A few years later, Peterson (1959) suggested
a simplify way to apply this theory by observing that it exists a reference stress which, while
compared with the material plain fatigue limit, will indicate if the material would break or
run out. The theory he proposed is that this reference stress may be computed at a given
distance from the stress raiser. This distance being the critical distance computed with the
point method (PM) (Figure 2-13(a)).
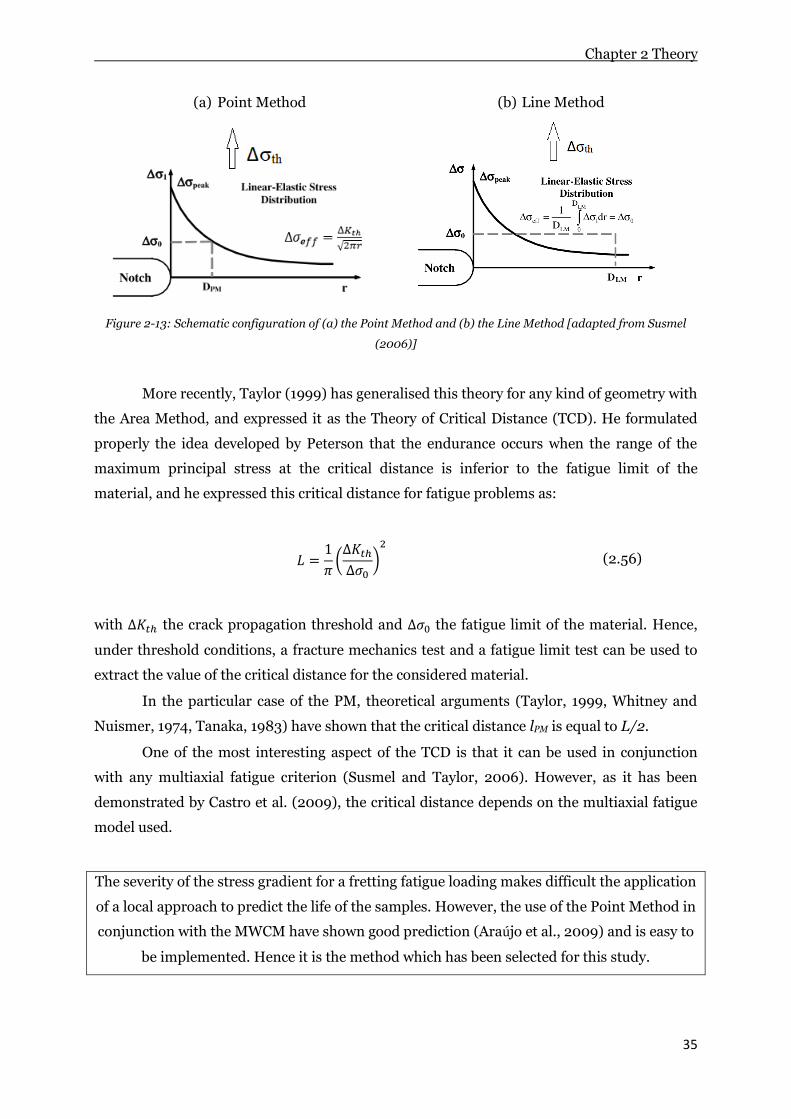
Chapter 2 Theory
35
(a) Point Method
(b) Line Method
Figure 2-13: Schematic configuration of (a) the Point Method and (b) the Line Method [adapted from Susmel
(2006)]
More recently, Taylor (1999) has generalised this theory for any kind of geometry with
the Area Method, and expressed it as the Theory of Critical Distance (TCD). He formulated
properly the idea developed by Peterson that the endurance occurs when the range of the
maximum principal stress at the critical distance is inferior to the fatigue limit of the
material, and he expressed this critical distance for fatigue problems as:
(2.56)
with the crack propagation threshold and the fatigue limit of the material. Hence,
under threshold conditions, a fracture mechanics test and a fatigue limit test can be used to
extract the value of the critical distance for the considered material.
In the particular case of the PM, theoretical arguments (Taylor, 1999, Whitney and
Nuismer, 1974, Tanaka, 1983) have shown that the critical distance lPM is equal to L/2.
One of the most interesting aspect of the TCD is that it can be used in conjunction
with any multiaxial fatigue criterion (Susmel and Taylor, 2006). However, as it has been
demonstrated by Castro et al. (2009), the critical distance depends on the multiaxial fatigue
model used.
The severity of the stress gradient for a fretting fatigue loading makes difficult the application
of a local approach to predict the life of the samples. However, the use of the Point Method in
conjunction with the MWCM have shown good prediction (Araújo et al., 2009) and is easy to
be implemented. Hence it is the method which has been selected for this study.

Chapter 2 Theory
36
2.5. Crack analogue
Non-conformal contact configurations submitted to fretting fatigue usually generate a strong
stress gradient at the vicinity of the contact. Hence, the comparison between the crack tip and
the contact’s edge shows not only a geometric similarity (Figure 2-14), but also stress
similarities as it has been demonstrated by Giannakopoulos (1998, 2000). Indeed, both
configurations present a severe and located stress gradient. Consequently, it is possible to use
a crack analogue model to study the fretting fatigue when the contact generates a stress
singularity at the contact tip, but this analogy is limited to contact with limited friction zone,
i.e. contact with sharp edges.
Based on this analogy and on the work of Pommier et al. (2007 and 2009) over the
description of the mixed mode cyclic-elastic plastic behaviour at the crack tip, Montebello et
al. (2016) take advantage of these similarities between crack and fretting fatigue to develop a
nonlocal model which can be applied for non-negligible slip zone, as long as this slip zone is
confined inside an elastic bulk.
Figure 2-14: Geometrical similarities between the contact edge and the crack tip.
Representation of fretting fatigue characteristics.
The geometry that will be studied for this work is the classical cylinder against plane under
partial slip conditions (Figure 2-15). The loading history is as follow: first a mean bulk load is
applied to the specimen, then the cylindrical pad is pressed against it. Once the contact
region is defined, the fretting and the bulk cyclic loads are applied in phase. Experimental
evidences (Araújo et al., 2007 and 2012, Proudhon et al., 2007) have shown that, for this
Chapter 2 Theory
37
particular configuration, cracks usually initiate at the vicinity of the contact edge. Moreover, a
strong stress gradient occurs at this particular location. Consequently, the local geometry will
impose the spatial distribution of the stress field and the macroscopic loads will induce the
intensity of the mechanical field. To solve this problem, a “fracture mechanics” approach has
been chosen through the decomposition of an approximate velocity field between reference
fields and nonlocal intensity factors:
(2.57)
Figure 2-15: FEM details and loading evolution used.
This approximate velocity field is extracted with respect to a reference system attached to
the crack tip (Figure 2-14). The first part of the equation, , corresponds to the linear elastic
response of the material and the second part, to the non-linear contributions due to
friction. The reference fields, (ds, da, dc), can also be identified, being ds, da and dc their
symmetrical, anti-symmetrical and complementary parts, respectively. It is defined by the
local geometry and forms the orthonormal basis of the approximate velocity field. This is a
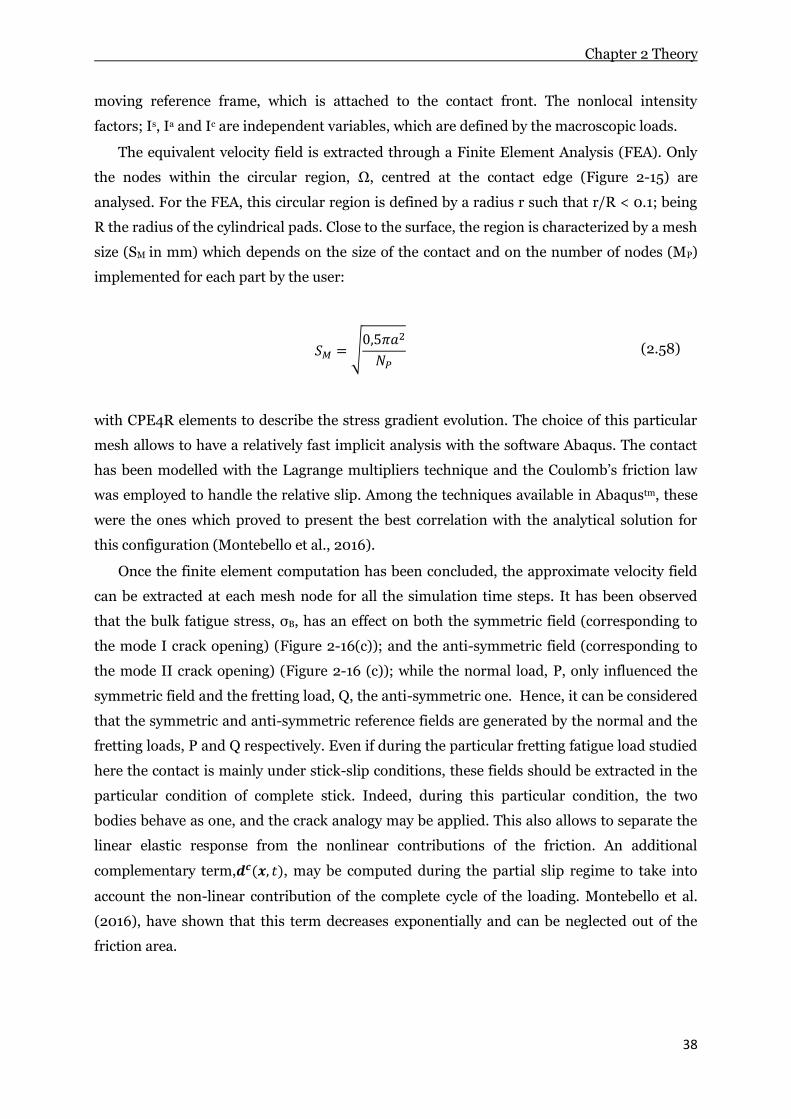
Chapter 2 Theory
38
moving reference frame, which is attached to the contact front. The nonlocal intensity
factors; Is, Ia and Ic are independent variables, which are defined by the macroscopic loads.
The equivalent velocity field is extracted through a Finite Element Analysis (FEA). Only
the nodes within the circular region, Ω, centred at the contact edge (Figure 2-15) are
analysed. For the FEA, this circular region is defined by a radius r such that r/R < 0.1; being
R the radius of the cylindrical pads. Close to the surface, the region is characterized by a mesh
size (SM in mm) which depends on the size of the contact and on the number of nodes (MP)
implemented for each part by the user:
(2.58)
with CPE4R elements to describe the stress gradient evolution. The choice of this particular
mesh allows to have a relatively fast implicit analysis with the software Abaqus. The contact
has been modelled with the Lagrange multipliers technique and the Coulomb’s friction law
was employed to handle the relative slip. Among the techniques available in Abaqustm, these
were the ones which proved to present the best correlation with the analytical solution for
this configuration (Montebello et al., 2016).
Once the finite element computation has been concluded, the approximate velocity field
can be extracted at each mesh node for all the simulation time steps. It has been observed
that the bulk fatigue stress, σB, has an effect on both the symmetric field (corresponding to
the mode I crack opening) (Figure 2-16(c)); and the anti-symmetric field (corresponding to
the mode II crack opening) (Figure 2-16 (c)); while the normal load, P, only influenced the
symmetric field and the fretting load, Q, the anti-symmetric one. Hence, it can be considered
that the symmetric and anti-symmetric reference fields are generated by the normal and the
fretting loads, P and Q respectively. Even if during the particular fretting fatigue load studied
here the contact is mainly under stick-slip conditions, these fields should be extracted in the
particular condition of complete stick. Indeed, during this particular condition, the two
bodies behave as one, and the crack analogy may be applied. This also allows to separate the
linear elastic response from the nonlinear contributions of the friction. An additional
complementary term, , may be computed during the partial slip regime to take into
account the non-linear contribution of the complete cycle of the loading. Montebello et al.
(2016), have shown that this term decreases exponentially and can be neglected out of the
friction area.

Chapter 2 Theory
39
Figure 2-16: (a) Loading history, (b) Contact configuration, (c) schemes of modes I and II cracks.
Figure 2-16 (a) illustrates a typical loading path found in fretting fatigue tests. As the
normal load is constant, in order to compute the symmetric velocity field, (equation
(2.59)), associated with such a load, it is necessary to artificially generate a small variation,
ΔP, on it from point a to point b in Figure 2-16 (a). Similarly, a variation ΔQ (from point c to
point d) allow us to extract the anti-symmetric reference field (equation (2.60)).
(2.59)
(2.60)
Where , , and are the positions of a node in the time instants , ,
and . Then, the reference fields are expressed in polar coordinates and a Karhunen-Loeve
decomposition (Karhunen, 1946) gives an expression of the fields as a product of f(r) and
g(θ). The comparison of the radial and tangential evolutions of ds(x) and da(x) and the
evolution of the displacement field at the crack tip (respectively for modes I and II) proved to
correlate well (Montebello et al., 2016). This validates the crack-tip analogy.
(2.61)
(2.62)
Chapter 2 Theory
40
Finally, the projection of the reference fields on the velocity field, v(x,t), gives the
expression of the symmetric and anti-symmetric parts of the nonlocal parameters.
Considering an analogy with the Linear Elastic Fracture Mechanics approach, IS and Ia
provide a measure of the magnitude of the velocity/displacement/stress field around the
contact edge under normal and shear load modes (Figure 2-16 (b)), just as KI and KII do for
Mode I and Mode II cracks (Figure 2-16 (c)).
(2.63)
(2.64)
Hence, the expression of the elastic part of the approximation of the velocity field is
obtained:
(2.65)
In the following of this study, it is suggested the hypothesis that the elastic nonlocal
intensity factors (Is, Ia) are sufficient to characterize the contact edge because the nonlinearity
is constrained inside an elastic bulk. Then, the methodology to obtain the complementary
part of the approximation of the velocity field will not be explained.
Application of the model to a multiaxial criterion
To isolate the safe from the failure zone, it is interesting to apply a multiaxial fatigue criterion
to the nonlocal parameters. A multiaxial fatigue model was chosen to take into account the
particularity of the present loading. Moreover, a model which deals with the effect of the
stress gradient and of the mean stress will yield better results. The methodology suggested by
Araujo et al. (2007) seems to contain all those characteristics.
This model consists of an association between the Theory of Critical Distance with the
Modified Wöhler Curve Method. It relies on the assumption that all the physical mechanisms
which lead to crack initiation are confined into a so-called critical volume and the
characteristic length of this volume, the critical distance, L/2, is independent of either the
Chapter 2 Theory
41
stress concentration feature or the complexity of the stress field as it has been defined by
Taylor (1999):
(2.66)
Considering this method, the principal mechanisms leading to the crack initiation are the
equivalent shear stress amplitude, τa, and the maximum normal stress in the critical plane,
:
(2.67)
τa is determined using the Maximum Rectangular Hull Method (Figure 2-10), κ and λ are the
material parameters:
(2.68)
To apply this model to the nonlocal method, it is necessary to express the stress
tensor in terms of nonlocal parameters. To do so, two observations can be made. Firstly, the
stress field evolution may be split between the symmetric and the anti-symmetric parts:
(2.69)
Secondly, the crack analogy allows to express the stress tensor in terms of the stress intensity
factor. For the sake of simplicity, in the equations that will follow .
The unitary value comes from the fact that the reference fields are normalized in order to
correspond to the displacement field obtained at the crack tip during an elastic loading phase
characterized by a stress intensity factor equal to 1.
(2.70)
Once this expression is obtained, the Rectangular Hull Method (Figure 2-10) may be
applied to calculate the equivalent shear stress amplitude and find the critical plane at the

Chapter 2 Theory
42
critical distance; then, the maximum normal stress to this plane. In terms of nonlocal stress
intensity factors, such variables can be expressed as:
(2.71)
To find the boundary between the safe and the failure zone, the expression of to get
the equality of the equation (2.67) has to be found. There are two values of which respect
this condition:
(2.72)
However, the result obtained for is negative and so does not respect physical
conditions for crack initiation. Then, the complete expression that defines the boundary
between the safe and the failure zones corresponds to .
In this study a shear stress based model was chosen because crack initiation in ductile
materials is usually associated with the formation of persistent slip bands, hence the
amplitude of the shear stress should play a major role in this process. The contribution of the
maximum normal stress to the crack initiation process depends on material and loading
conditions. In order to conduct a comparative study two scenarios will be considered. First,
the expression which defines the boundary between the safe and the failure zone will be
determined considering all the forces which happened during the fretting fatigue process
(equation (2.72)). Then, the contribution of the maximum normal stress will be discarded
(equation (2.73)), and so the contribution of the maximum normal stress for this specific
study will be highlighted.
(2.73)

Chapter 2 Theory
43
The nonlocal model proposed by Montebello (2015) is really interesting for an industrial
point of view. Indeed, it is easy to be implemented in an Abaqus environment and allows fast
computations for complex geometries. However, there is no fully validation of the model for
fretting fatigue experiments, even not for simple geometry such as cylinder-plane contact.

Chapter 3 Experimental work
44
Chapter 3. Material and methods
3.1. Introduction
The crack analogue model proposed by Montebello et al. (2016) to estimate crack
initiation threshold under fretting fatigue conditions is, in principle, capable to deal with the
stress gradient problem. However, to apply this kind of model to the aeronautical industry
further assessment considering specific materials and loading conditions are necessary. For
instance, in the fan blade root/disc assembly of aeroengines Ti-6Al-4V is the material to be
considered. The load history in such an assembly involves not only normal and shear loads at
the contact interface but also a remote fatigue load generated in the blade (by the centrifugal
force) and in the disc (by the circumferential stress due to its rotation). One should notice
that the validation of the crack analogue model for the Ti-6Al-4V data was essentially
conducted for data under pure fretting loading conditions (Montebello et al. 2016), without
the presence of a time varying bulk fatigue load. Therefore, one of the objectives of this
experimental campaign is to study the accuracy of such model under this more realistic and
challenging loading conditions. Additionally, to further exploit the capability of this model to
deal with the stress gradient phenomenon a set of tests was designed with three different pad
radii (20 mm, 50mm and 70mm). These tests were denominated Group I Tests.
A second set of tests, Group II Tests, was also proposed in this work to study aspects
related to the size effect in fretting fatigue. As previously seen in the literature review, few
works were carried out with this objective and most of these were either related to stress
gradient problems (Bramhall, 1973, Nowell, 1988) or were applied to consider tribological
issues (Fouvry et al., 2013) rather than mechanical ones. Thus, a new experimental protocol
has been here designed to tackle this problem. The tests will focus on the effect of two size
parameters on the fretting fatigue life/strength: the width of the specimens and the size of the
slip area within the contact zone. As far as the width of the specimen is concerned, the
hypothesis to be verified is whether the volume of material being stressed under the contact
plays a role in the fretting fatigue resistance keeping all the other relevant test parameters
constant. Similar hypothesis needs to be checked but varying now the size of the superficial
damaged area within the slip zones from test to test, but with all the other tests parameters
kept constant. Again, the material considered in these tests will be the Ti-6Al-4V alloy.
In this chapter the details on the common material and methods applied to conduct
these two Groups of Tests will be provided. The specific loads applied for each configuration
within Test Groups I and II and their resultant fretting lives will be reported in Chapters 4
and 5, respectively.

Chapter 3 Experimental work
45
3.2. Titanium alloy
Titanium alloys are commonly used for aeronautical engineering because of their interesting
properties (high mechanical properties to weight ratios, excellent corrosion resistance and
seawater fatigue strength regarding to its low density). In this section, the specific
characteristics of the titanium alloy used by Safran Aircraft Engines to manufacture the
blades and disks of an aero engine will be studied. The fabrication process, which plays a
major role for the characterisation of the microstructure and, hence, the fatigue properties of
the Ti-6Al-4V, will also be detailed.
Generality on the titanium alloy used
The characteristics of the Ti-6Al-4V are due to the balance presence of α and β phases (Figure
3-1). The α-stabiliser, aluminium representing around 6% of the mass, allows to increase
mechanical strength and creep resistance. The β-stabilizer, vanadium with around 4% of the
mass, increases the ductility at low temperature but decreases the oxidation resistance. The
composition of the Ti-6Al-4V used by Safran is listed in the Table 3-1. The presence of these
phases are due to the particular process implemented to form the alloy.
Elements Al (%) V (%) O (ppm) H (ppm)
Min Max Min Max Min Max Min Max
Specified
measured
5.5 6.75 3.5 4.5 - 2000 - 100
Table 3-1: Principal elements of TI-6Al-4V alloys manufactured for the Safran Snecma fan disc and blade.
.
This manufacturing process starts with the melting of the purified titanium with the
stabilizer, here the aluminium. For the discs and the blades of aeroengines, Ferré (2013)
explains that the material is first submitted to a vacuum induction melting and then to three
vacuum arc remelting. Those processes avoid the formation of oxides and ensure the
homogeneity of the alloy.
Thermo-mechanical treatment is then applied to the Ti-6Al-4V. The first stage is
usually a forge of the raw alloy in the β domain. In Safran this forge is operated at 940°C and
allows to reduce the β grain size. Then, a hot isostatic pressing is applied in the α+β domain.
Another treatment is also applied to make appear the grain in phase α and a
quenching to transform the β phase into a metastable α’ phase. Finally, an annealing process

Chapter 3 Experimental work
46
around 700°C is conducted to transform the α’ phase into a lamellar α+β grain, constituted of
αs platelets in a β matrix.
The β-transus temperature of the Ti-6Al-4V is around 1000°C and it can be noted that
all the temperatures used during the manufacturing process are lower than this. It is this
particularity which allows the control of the microstructure final part. As highlighted by
Crupi et al. (2017), the microstructure obtained here, with α grains embedded in a matrix of α
and β lamellae, has better mechanical properties and fatigue resistance than the
microstructure obtained by considering temperature higher than the β-transus one for the Ti-
6Al-4V. This has also been observed by other authors (e.g., Le Baviant et al. 2002).
Figure 3-1: Microstructure of the Ti-6Al-4V alloy used.
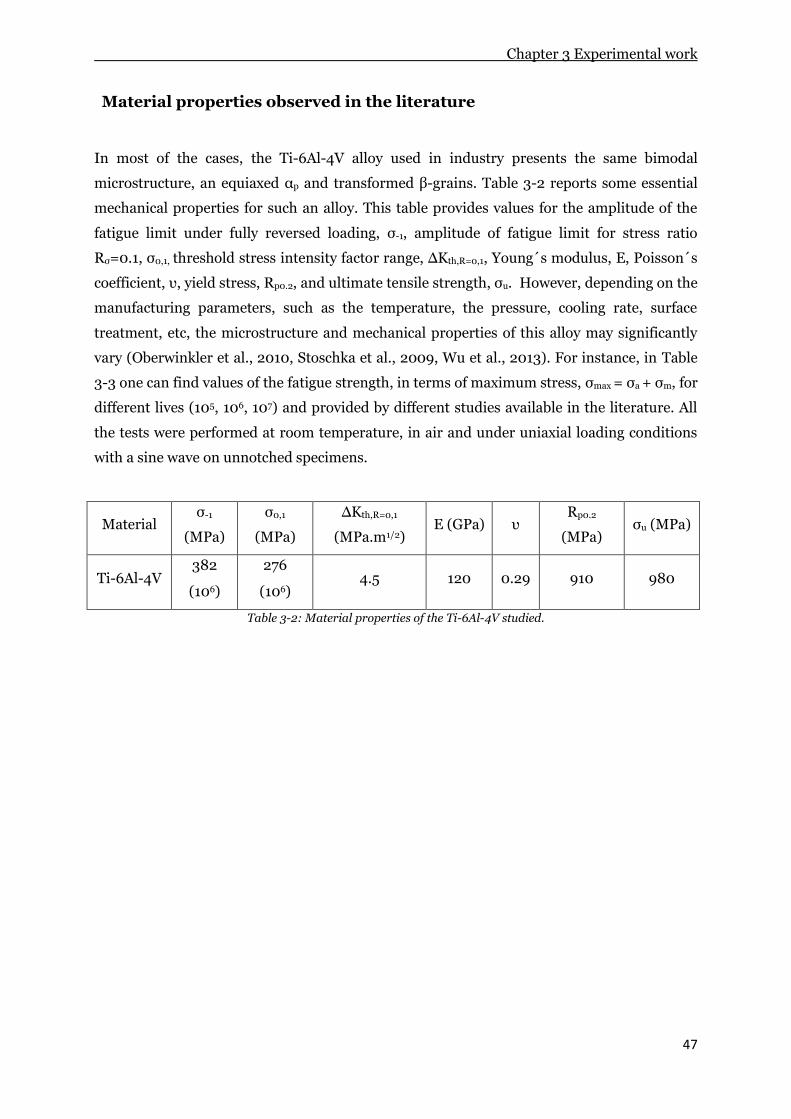
Chapter 3 Experimental work
47
Material properties observed in the literature
In most of the cases, the Ti-6Al-4V alloy used in industry presents the same bimodal
microstructure, an equiaxed αp and transformed β-grains. Table 3-2 reports some essential
mechanical properties for such an alloy. This table provides values for the amplitude of the
fatigue limit under fully reversed loading, σ-1, amplitude of fatigue limit for stress ratio
Rσ=0.1, σ0,1, threshold stress intensity factor range, ΔKth,R=0,1, Young´s modulus, E, Poisson´s
coefficient, υ, yield stress, Rp0.2, and ultimate tensile strength, σu. However, depending on the
manufacturing parameters, such as the temperature, the pressure, cooling rate, surface
treatment, etc, the microstructure and mechanical properties of this alloy may significantly
vary (Oberwinkler et al., 2010, Stoschka et al., 2009, Wu et al., 2013). For instance, in Table
3-3 one can find values of the fatigue strength, in terms of maximum stress, σmax = σa + σm, for
different lives (105, 106, 107) and provided by different studies available in the literature. All
the tests were performed at room temperature, in air and under uniaxial loading conditions
with a sine wave on unnotched specimens.
Material σ-1
(MPa)
σ0,1
(MPa)
ΔKth,R=0,1
(MPa.m1/2) E (GPa) υ
Rp0.2
(MPa) σu (MPa)
Ti-6Al-4V 382
(106)
276
(106) 4.5 120 0.29 910 980
Table 3-2: Material properties of the Ti-6Al-4V studied.

Chapter 3 Experimental work
48
Reference
Ra
tio
of
αp-g
rain
in
%
Av
era
ge
siz
e o
f α
p-g
rain
in
µ
m
Fre
qu
en
cy i
n H
z
Str
ess
ra
tio
HCF Fatigue limit σmax (MPa)
105 106 107
Nalla et al. 2002 64 20 25 0.1 700 600 540 Zuo et al. 2008a. 0.5 850 780 640
Nagai et al. 1993 55 10 20
000 -1 546 518
4 20 0 .01 800 720 640 4 800 720 690 2.8 800 740 720 -1 588 547 539
Peters et al. 1984 6 80 -1 710 675 675 Bellows 1999 60 13 60 -1 450 400 390
0.1 667 611 556 0.5 860 800 640 0.8 950 920 900
Hines and Lutjering 1999 35 7.5 90 -1 545 470 445 Ivanova et al. 2002 60.5 8 30 0.1 467
24.8 8.5 830
(3.104) 620
(2.106) 550
Nalla et al. 2003 64 20 5 -1 450 ZUo et al. 2008b 55 10 25 -1 570 530
Ivanova et al. 1999 60.5 8 30 -1 462 441 414 24.8 8.5 455 421 407 28.7 5.5 510 497 490 60.5 8 0.1 720 582 491 24.8 8.5 720 613 551 28.7 5.5 798 751 720
Lanning et al. 2005 -1 482 0.1 591
Araújo et al. 2007 65 5 0 596
(1.4.106)
-1 325
(1.4.106)
Ferré 2013 ; Mériaux 2010
60 30 -1 593.97
Delahaye 2014 -1 630
(2.105) 583
(2.106)
Moshier et al. 2001 60 20 Le Baviant et al. 2002 50 15 Lee and Mall 2004a. 60 10 Bantounas et al. 2010 80 15
Table 3-3: Literature review of bimodal macrostructure parameters and HCF data of Ti-6Al-4V titanium alloy.

Chapter 3 Experimental work
49
It exists a strong variation between the fatigue properties observed in the literature for the Ti-
6Al-4V alloy. This may be explained by the variability of the microstructure resulting from
the thermos-mechanical treatments. Moreover, test conditions and surface preparations of
the pads and specimens also affect the fatigue limits. In this work, we will use the values
determined by Bellecave (2015) which have shown a good correlation with the theory of the
critical distance for the Ti-6Al-4V used. For a life of 106 cycles the fatigue limits adopted will
be:
σ-1 = 382 MPa, σ0,1 = 276 MPa.
3.3. Group Tests
Group I tests
As previously mentioned, the experimental work carried out during this thesis was divided
into two groups. The first group of experiments has the objective to test the ability of the
crack analogue model detailed in section 2.5 to deal with the gradient effect encountered in
fretting-fatigue.
In order to generate different gradients, a variation of the pad radius will be
considered. Indeed, when the peak pressure p0, the ratio σfa/po and the ratio Qa/fP are
constant, the different radii of the pads will not affect the magnitude of the stress at the
surface, but will produce different stress decays with distance from the surface (Figure 3-2).
Indeed, from the equations (2.17) and (2.18), it follows that p0 is proportionate to and
a to .
In the framework of the COGNAC’s project, a previous experimental work with Ti-
6Al-4V alloy was carried out, under fretting fatigue loading conditions, by Bellecave (2015) at
the University of Brasilia. The configuration of his experimental campaign was based on
cylindrical fretting pads, with radii of 20mm and 70mm, loaded against a flat specimen. Both
pads and specimen had a width of 13mm. Experimental results of this work were obtained by
maintaining the stress state constant at the surface while varying the pad radius. The aim of
Bellecave’s experimental work was essentially to validate a T-stress based methodology to
estimate short crack arrest in fretting fatigue. Tests with the same stress magnitude at the
surface but with different stress gradients would produce different fatigue lives. Therefore
although these tests had the same severity at the surface some would break because a
reasonable level of stress could be sustained for a certain distance, while others would last
“forever” (Run-out conditions defined at 1 000 000 cycles) as short initiated cracks would
rapidly grow into a zone of low stresses, due to the strong stress gradient, and hence become

Chapter 3 Experimental work
50
dormant. Some of these experimental results were used for the present study, but the
theoretical analysis conducted is totally different.
Indeed, another approach of the gradient effect was used. A variation of the pad
radius was still considered, but among the experimental parameters, only the peak pressure
p0 has been maintained constant. New ratios σfa/po and Qa/fP have been sought in order to
obtain the same magnitude of the multiaxial index, in the sense of the Modified Wöhler
Curve Method (IMWCM), at the critical distance, computed with the Point Method (L/2), for
the different radii of the pads (Figure 3-3 (a)).
Then, according to the Modified Wöhler Curve Method (MWCM) applied in
conjunction with the Theory of Critical Distance (TCD), if different experiments have the
same magnitude of the multiaxial index at the critical distance, the same fretting fatigue life
is expected (Figure 3-3 (b)).
Finally, the aim of the Group I Tests is to verify the ability of the crack analogue
model presented in section 2.5 to take into account this gradient effect. To do so, the nonlocal
stress intensity factors, Is and Ia, are computed for all the loading and geometrical
configurations and they are plotted in the Is-Ia map. If this gradient effect is well incorporated
by the model, the experimental results having similar lifetimes are supposed to be correlated
in such a nonlocal map (Figure 3-3 (c)).
To achieve this objective, one took advantage of some experimental results carried out
by Bellecave (2015). Indeed, in his work, experimental data obtained with the same Ti-6Al-
4V are available for pad radii of 20mm and 70mm. Therefore, to validate the crack analogue
model considered, complementary fretting fatigue tests were carried out using a cylindrical
fretting pad with radius of 70mm, and new data were obtained with a pad radius of 50mm.
Details about the strategy to determine the loads applied in these tests are provided in the
section 4.2. The actual shape and dimensions of both specimen and pads used for this
analysis are available in Figure 3-4 and Figure 3-5.

Chapter 3 Experimental work
51
Figure 3-2: Illustration of the stress gradient: σxx for three pad radii (p0=500MPa, σB,max = 300MPa ad Q/fP =
0,46).
Figure 3-3: Methodology follows for the Group I Tests: (a) Illustration of the evolution of the Multiaxial Index
gradient studied in this work, (b) Excepting results with the application of the Theory of Critical Distance and
(c) Intended results after the application of the nonlocal criterion.

Chapter 3 Experimental work
52
Figure 3-4: Fretting fatigue specimen of the first group of experiment (dimension in mm).
Figure 3-5: Fretting pads of the first group of tests (dimension in mm).

Chapter 3 Experimental work
53
Group II Tests
The second group of experiments concerned an investigation on the size effect for fretting
fatigue. Two size parameters were investigated for this study: The volume stressed under the
contact and the size of the damaged area within the slip zones. To do so, the Group II Tests
was divided into two sub-groups:
- The Group II-a Tests whose objective was to isolate the effect of the width of
specimen, and so of the volume stressed under the contact zone.
- The Group II-b Tests whose objective was to study the impact of the damage area
within the slip zone under the contact.
The results of the Group I Tests yielded experimental data with a specimen width, W13
= 13mm. The surface damaged area within the slip zones for these 13 mm thickness
specimens can be computed as , being a13 the half-width of the
contact, which is constant for all experiments conducted with the same pad radius (because
the peak pressure was kept constant), and c13, the half-width of the stick zone, which is a
function of the tangential load applied.
The Group II-a Tests was designed so that two tests should have the same stress
gradient (i.e. the same multiaxial index I13 and I8 for the specimen widths of 13mm and 8mm
respectively) under the contact zone and the same fretting damaged area (being and
the specimen widths of 13mm and 8mm, respectively), but with a different volume of
material being stressed. In other words, two experiments with the same pad radius, but with
different widths of 13mm and 8mm, should be developed. Therefore, a loading configuration
needs to be calculated to provide these tests with the following characteristics (Figure 3-6
(a)):
i.
ii. at x=-a.
The Group II-b Tests was carried out to study the influence of the surface fretting
damaged area on fretting fatigue life/strength. It has been developed also considering a
smaller specimen width of 8mm for the comparative analysis. However, for this sub-group
of tests, the only parameter which remains constant for the two corresponding tests is the
multiaxial index under the surface for x=-a, being the fretted damage areas different, i.e.,
and
(Figure 3-6 (b)).
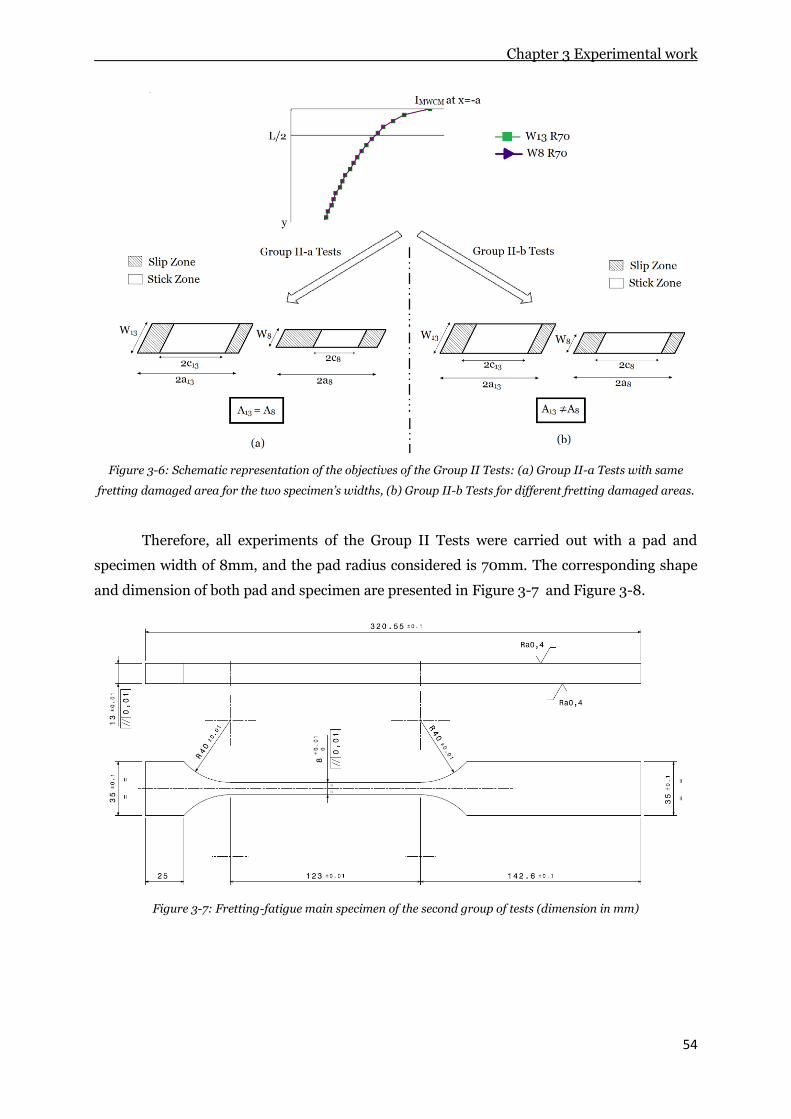
Chapter 3 Experimental work
54
Figure 3-6: Schematic representation of the objectives of the Group II Tests: (a) Group II-a Tests with same
fretting damaged area for the two specimen’s widths, (b) Group II-b Tests for different fretting damaged areas.
Therefore, all experiments of the Group II Tests were carried out with a pad and
specimen width of 8mm, and the pad radius considered is 70mm. The corresponding shape
and dimension of both pad and specimen are presented in Figure 3-7 and Figure 3-8.
Figure 3-7: Fretting-fatigue main specimen of the second group of tests (dimension in mm)

Chapter 3 Experimental work
55
Figure 3-8: Fretting pad of the second group of tests (dimension in mm).
All fretting-fatigue specimens and pads were machined from a real fan disk randomly taken
from production line by Safran Aircraft Engines in France. The specimens were then packed
and sent to our laboratory in the University of Brasilia. Dimensions and surface roughness
were controlled for the ground surfaces and for the cylindrical fretting pads with a confocal
microscope. A three dimensional metrology machine equipped with probe sensor was used to
measure the pad radii. Figure 3-9 depicts a photograph of main specimens and pads.
Figure 3-9: Photograph of fretting fatigue specimens and pads.
Chapter 3 Experimental work
56
Description of the two vertical-actuators fretting-fatigue rig of the UnB
To conduct the tests, a two independent vertical-actuators fretting-fatigue rig available at the
University of Brasília was used. A scheme with an overall view of such rig is shown in Figure
3-10. All its components were numbered and identified in the legend of such a Figure. Figure
3-11 depicts another schematic drawing now containing a detailed cut-view of the apparatus
in the region of the contact between pad and specimen. The main ‘dog-bone’ specimen (8) is
held between fixed and moveable jaws (6 and 7). The moveable jaw (7) is mounted to a load
cell (4) and to a hydraulic actuator (3) capable of applying loads up to 250kN. This is used to
apply the oscillatory fatigue load to the specimen. The cylindrical pad (11) and the roller
bearing (10) are clamped against the specimen (8) by an Enerpac static hydraulic actuator (9)
and a screw, respectively. This static actuator is connected by a hydraulic line to an external
pump (13). The useful area of this pump is known, A = 640mm², and by knowing the desired
pressure (in N), the pressure to apply (in bar) can be defined as follow:
(3.1)
A manometer (12) ensures the application of the correct pressure and an accumulator (12)
ensures a correct constant normal load during the experiment. The cylindrical pad (11) and
the roller bearing (10) are positioned on a carriage of the fretting-fatigue apparatus, which is
connected to the upper vertical actuator (1) by four cylindrical bars (14). This hydraulic
actuator (1), which can apply loads up to 100kN, is mounted to a load cell (2). Therefore, they
are used to apply and to control the prescribed oscillatory fretting loads. The main advantage
of using a two actuators fretting-fatigue rig, instead of a simple actuator one, as considered
elsewhere (Nowell, 1988, Bellecave, 2015), is that it allows not only a more refined control
and measurement of the fretting load, but also to apply the fatigue and fretting loads under
different frequencies and/or phases. Indeed, in the case of a single actuator fretting machine,
the fretting load is not applied directly to the pad carriage, but depends on a relation between
the bulk fatigue load and the stiffness of the apparatus. Therefore, it is not possible to change
the fretting load independently of the bulk load and there is limit value the fretting load can
reach that is associated to the apparatus stiffness. Figure 3-12 and Figure 3-13 show
photographs with a general and a detailed view of the fretting fatigue machine, respectively.
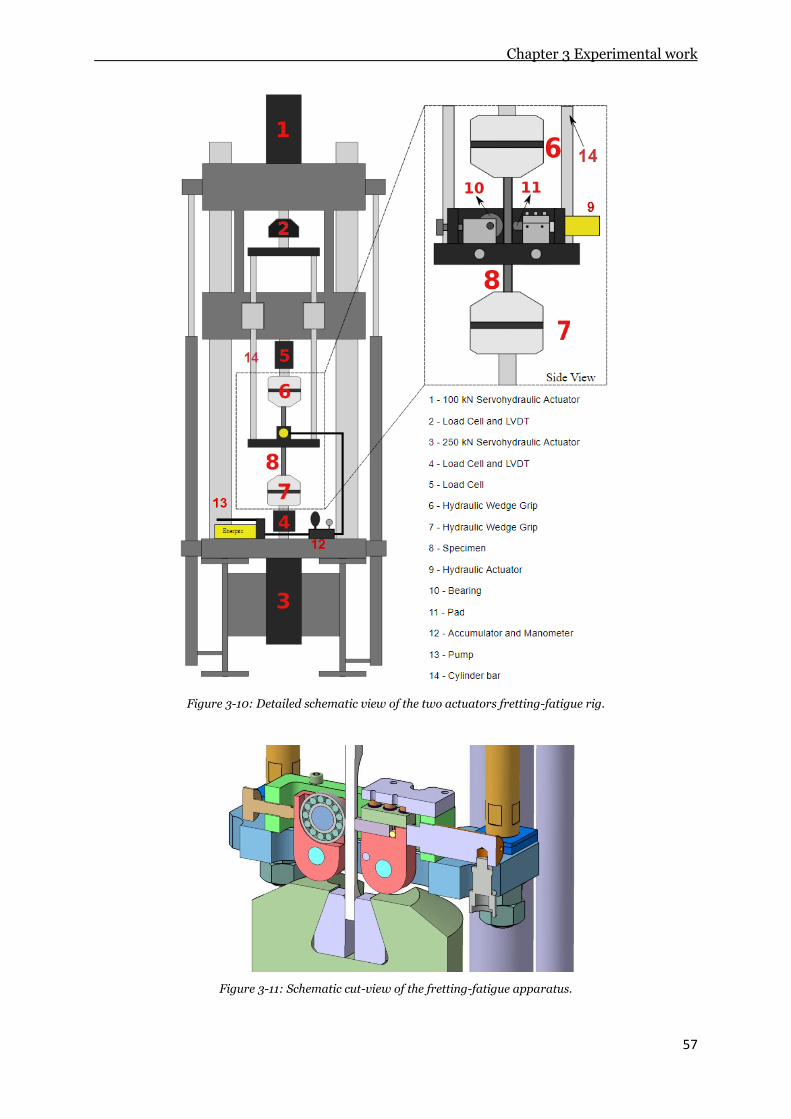
Chapter 3 Experimental work
57
Figure 3-10: Detailed schematic view of the two actuators fretting-fatigue rig.
Figure 3-11: Schematic cut-view of the fretting-fatigue apparatus.

Chapter 3 Experimental work
58
Figure 3-12: Photograph of the two vertical-actuators fretting fatigue rig of the UnB.
Figure 3-13: Photograph with a detailed view of the pad/specimen assembly in the two-actuator rig.
Methodology to conduct the fretting fatigue tests
1. Lateral screws
2. Superior screws
3. Pitch screws
4. Screw
5. Cylinder pad
6. Specimen
7. Enerpac actuator RC-51
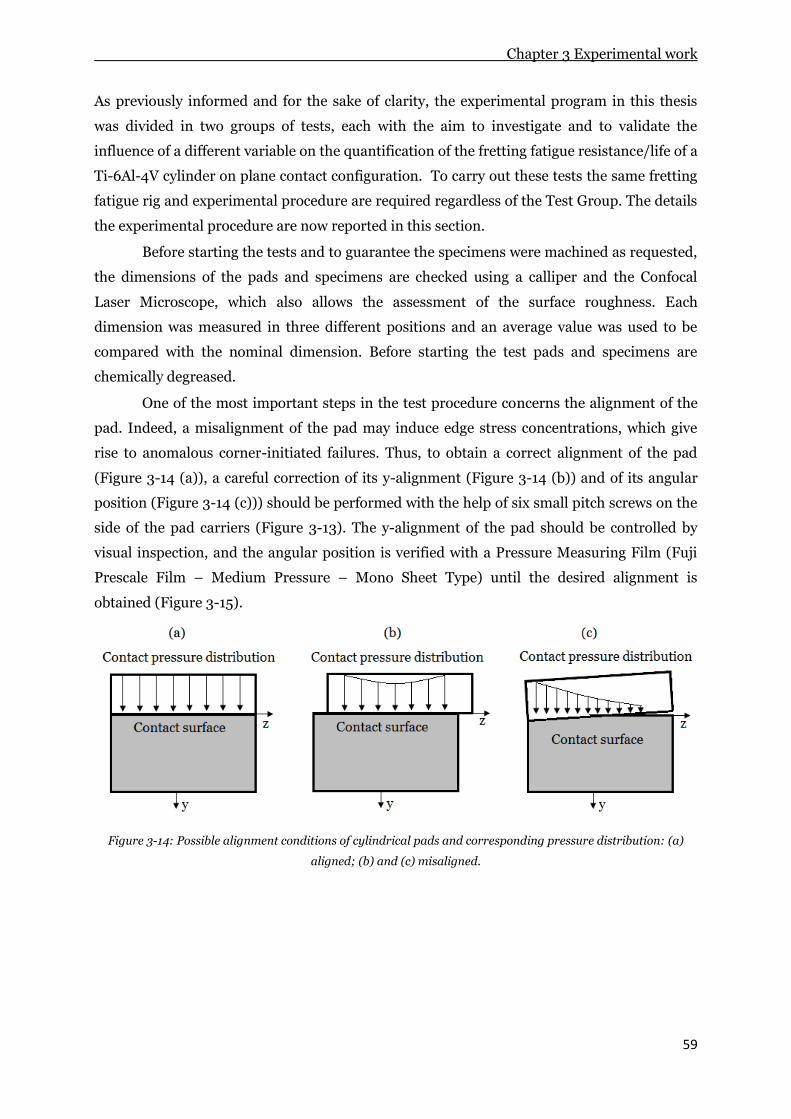
Chapter 3 Experimental work
59
As previously informed and for the sake of clarity, the experimental program in this thesis
was divided in two groups of tests, each with the aim to investigate and to validate the
influence of a different variable on the quantification of the fretting fatigue resistance/life of a
Ti-6Al-4V cylinder on plane contact configuration. To carry out these tests the same fretting
fatigue rig and experimental procedure are required regardless of the Test Group. The details
the experimental procedure are now reported in this section.
Before starting the tests and to guarantee the specimens were machined as requested,
the dimensions of the pads and specimens are checked using a calliper and the Confocal
Laser Microscope, which also allows the assessment of the surface roughness. Each
dimension was measured in three different positions and an average value was used to be
compared with the nominal dimension. Before starting the test pads and specimens are
chemically degreased.
One of the most important steps in the test procedure concerns the alignment of the
pad. Indeed, a misalignment of the pad may induce edge stress concentrations, which give
rise to anomalous corner-initiated failures. Thus, to obtain a correct alignment of the pad
(Figure 3-14 (a)), a careful correction of its y-alignment (Figure 3-14 (b)) and of its angular
position (Figure 3-14 (c))) should be performed with the help of six small pitch screws on the
side of the pad carriers (Figure 3-13). The y-alignment of the pad should be controlled by
visual inspection, and the angular position is verified with a Pressure Measuring Film (Fuji
Prescale Film – Medium Pressure – Mono Sheet Type) until the desired alignment is
obtained (Figure 3-15).
Figure 3-14: Possible alignment conditions of cylindrical pads and corresponding pressure distribution: (a)
aligned; (b) and (c) misaligned.
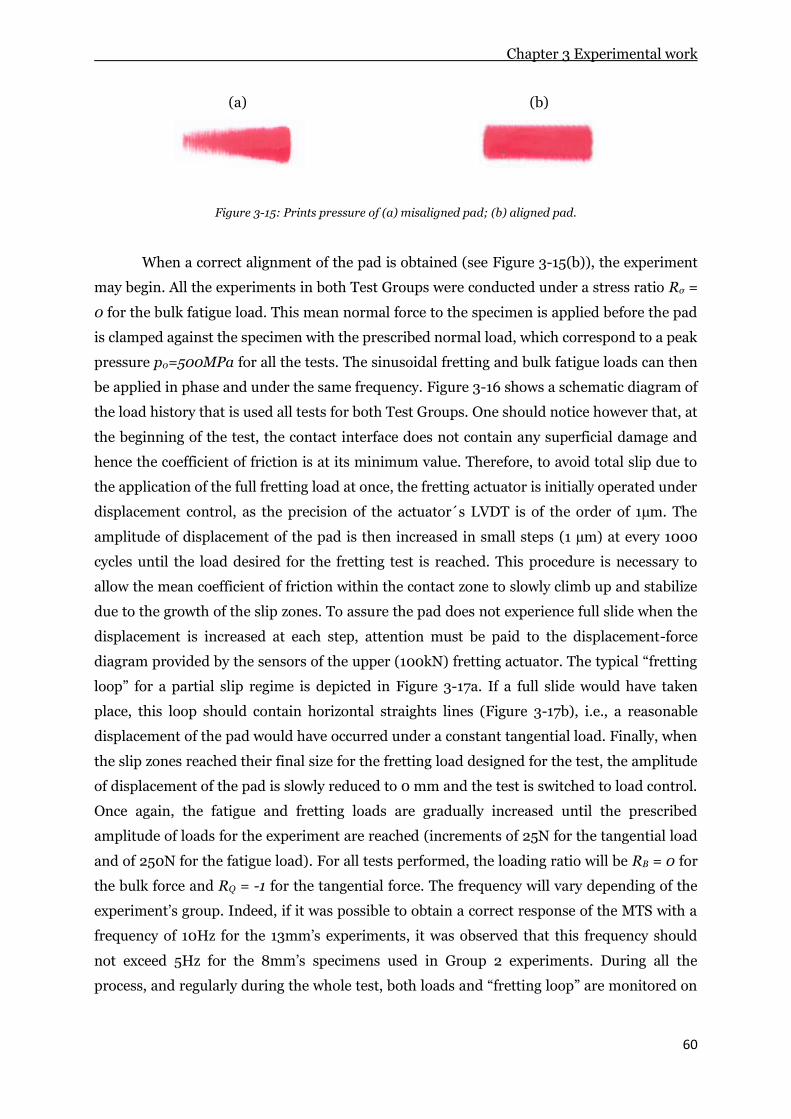
Chapter 3 Experimental work
60
(a)
(b)
Figure 3-15: Prints pressure of (a) misaligned pad; (b) aligned pad.
When a correct alignment of the pad is obtained (see Figure 3-15(b)), the experiment
may begin. All the experiments in both Test Groups were conducted under a stress ratio Rσ =
0 for the bulk fatigue load. This mean normal force to the specimen is applied before the pad
is clamped against the specimen with the prescribed normal load, which correspond to a peak
pressure p0=500MPa for all the tests. The sinusoidal fretting and bulk fatigue loads can then
be applied in phase and under the same frequency. Figure 3-16 shows a schematic diagram of
the load history that is used all tests for both Test Groups. One should notice however that, at
the beginning of the test, the contact interface does not contain any superficial damage and
hence the coefficient of friction is at its minimum value. Therefore, to avoid total slip due to
the application of the full fretting load at once, the fretting actuator is initially operated under
displacement control, as the precision of the actuator´s LVDT is of the order of 1µm. The
amplitude of displacement of the pad is then increased in small steps (1 µm) at every 1000
cycles until the load desired for the fretting test is reached. This procedure is necessary to
allow the mean coefficient of friction within the contact zone to slowly climb up and stabilize
due to the growth of the slip zones. To assure the pad does not experience full slide when the
displacement is increased at each step, attention must be paid to the displacement-force
diagram provided by the sensors of the upper (100kN) fretting actuator. The typical “fretting
loop” for a partial slip regime is depicted in Figure 3-17a. If a full slide would have taken
place, this loop should contain horizontal straights lines (Figure 3-17b), i.e., a reasonable
displacement of the pad would have occurred under a constant tangential load. Finally, when
the slip zones reached their final size for the fretting load designed for the test, the amplitude
of displacement of the pad is slowly reduced to 0 mm and the test is switched to load control.
Once again, the fatigue and fretting loads are gradually increased until the prescribed
amplitude of loads for the experiment are reached (increments of 25N for the tangential load
and of 250N for the fatigue load). For all tests performed, the loading ratio will be RB = 0 for
the bulk force and RQ = -1 for the tangential force. The frequency will vary depending of the
experiment’s group. Indeed, if it was possible to obtain a correct response of the MTS with a
frequency of 10Hz for the 13mm’s experiments, it was observed that this frequency should
not exceed 5Hz for the 8mm’s specimens used in Group 2 experiments. During all the
process, and regularly during the whole test, both loads and “fretting loop” are monitored on

Chapter 3 Experimental work
61
the scopes (Figure 3-18, Figure 3-19 and Figure 3-20) as well as the normal load in the
manometer to ensure the precision of the test.
Figure 3-16: Illustration of the typical loading of the tests.
Figure 3-17: Fretting fatigue loops (a) Partial slip, (b) Full slip
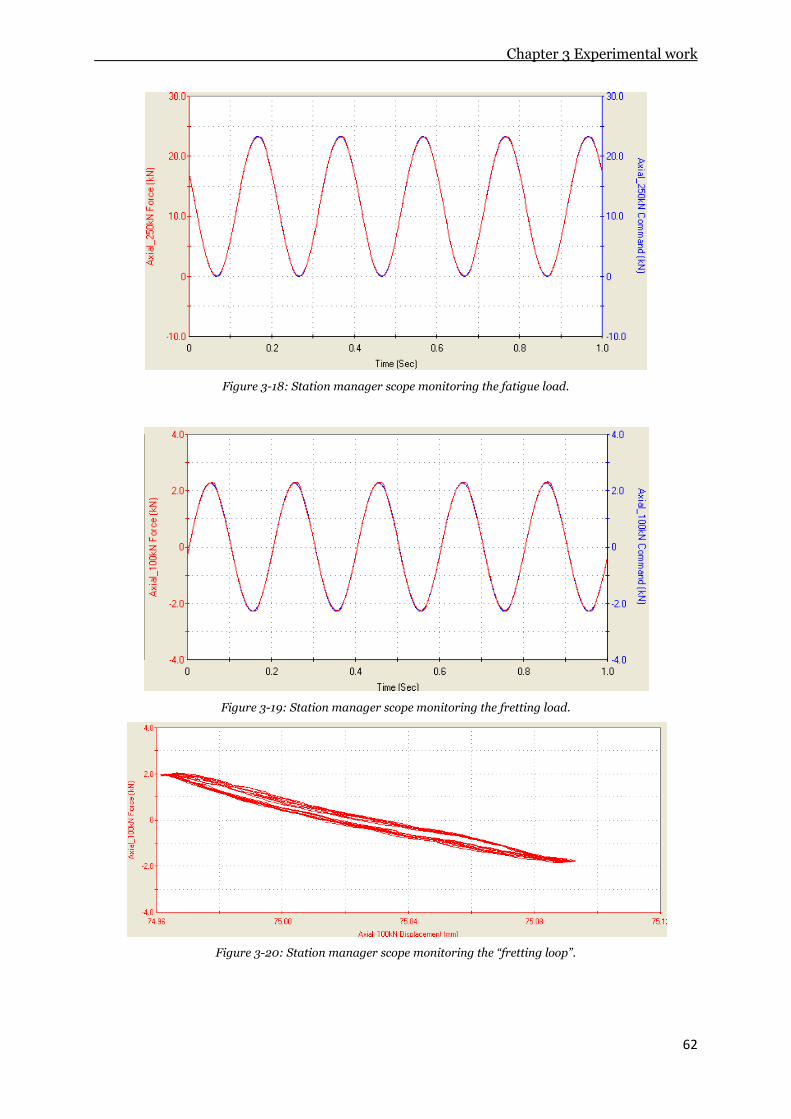
Chapter 3 Experimental work
62
Figure 3-18: Station manager scope monitoring the fatigue load.
Figure 3-19: Station manager scope monitoring the fretting load.
Figure 3-20: Station manager scope monitoring the “fretting loop”.

Chapter 3 Experimental work
63
Two group of tests will be carried out during this work. In the first group, experiments are
designed to test the ability of the crack analogue model, developed by Montebello (2015) as
part of the COGNAC project, to deal with the gradient effect encountered in fretting fatigue.
With the second group of tests, the aim was to investigate the size effect in fretting fatigue.
All experiments of this study were carried out by using a two vertical actuator fretting fatigue
rig available at the University of Brasilia.
Chapter 6 Conclusions and Future work
115
Chapter 6. Conclusions
6.1. Overview
Since the first observations of the fretting corrosion by Eden et al. (1911), over a century ago,
numerous studies have been carried out to better understand the fatigue phenomenon under
fretting conditions. In particular, the gradient effect generated at the contact interface of the
two bodies is now better understood and it exists a large amount of models to take it into
account (Dini et al., 2006, Araújo et al., 2007, Ferré et al., 2013, Fouvry et al., 2014).
However, the main parts of these studies were conducted under laboratory conditions and it
still remains difficult and numerically expensive to apply the existing models to industrial
configurations.
The general aim of this study was to investigate new ways to deal with the fretting
fatigue within industrial objectives. In this setting, a new crack analogue model was
challenged under more realistic fretting fatigue loading conditions for a titanium alloy, the
Ti-6Al-4V, widely used in the aeronautical industries. Furthermore, the role of the size effect
on fretting fatigue was perhaps systematically investigated for the first time. The new
experiments we have conducted to investigate such effect were designed so that the size effect
itself was addressed and not the stress gradient effect as studied by other authors elsewhere
(Bramhall, Nowell, 1988, Araújo 2000). These studies reported a “size” effect phenomenon,
which was in fact provoked by stress gradient effects/differences among tests. One should
notice here that effects of size on fretting fatigue have a strong interest in the industrial
context.
6.2. Main conclusions
Group I of Tests and Crack Analogue Model
The experimental program in this study was conducted using a two vertical and
independent actuators servo-hydraulic fretting fatigue machine in the Department of
Mechanical Engineering at the University of Brasília. As far as the author is aware, there are
only three laboratories in the world where such type of test rig is available, being the other
two located in Ecole Centrale de Lyon and in the University of Oxford. The fretting
configuration considered in our experiments was composed of a single cylindrical fretting
pad and a roller bearing loaded against a flat dogbone tensile test piece. The use of a two
Chapter 6 Conclusions and Future work
116
vertical actuators fatigue rig allows to apply the fatigue and fretting loads independently and
so to have a better control of them, besides allowing the application of phase differences or
the conduction of asynchronous tests. Here, in this section, we will present the main
conclusions of the Group I of Tests conducted with such experimental rig and contact
configurations.
The Group I of Tests was obtained using two different pad radii 50mm and 70mm)
and a “dog bone” tensile specimen, both with 13 mm width. Tests with a 20 mm pad radius
were available from the work of Bellecave (2015) and were considered for the analysis. The
loads for our tests were determined so that the value of the multiaxial index at the critical
distance was equal for both sets although they were different at the surface. Therefore, they
had different stress gradients and superficial stress levels at the hotspot, but the same
severity of loading in the so called critical distance according to the MWCM model. These
tests configurations resulted in similar lifetimes.
The crack analogue model, originally proposed by Montebello et al. (2016) was
challenged with these new fretting fatigue tests (results of Group I of tests). Also notice that
these tests used loading programs which considered the presence of a fatigue bulk load
applied to the Ti-6Al-4V specimens. The nonlocal stress intensity factors, Ia and Is, were
computed for three different stress gradients, obtained with pad radii of 20mm, 50mm and
70mm, and with loads designed to achieve different but specific fretting fatigue lifetimes. As
fretting crack initiation mechanisms usually represent the main part of the life (Hojjati-
Talemi et al., 2014), the experimental lives here obtained in terms of number of cycles to total
failure were used to validate the crack initiation model.
It was found that, when different stress gradients are considered but the resulting
lifetimes are similar, it seems to exist a clear correlation between the experimental results in
a nonlocal map (Is-Ia). For the broken tests, at around 200 000 cycles and 500 000 cycles,
this correlation was represented by a straight line. However, the results obtained for
unbroken specimens at 1 000 000 cycles presented a higher dispersion and we cannot
conclude that such a linear correlation can be extended to run-out tests.
In his work, Montebello (2016) has suggested that for run-out tests a crack initiation
boundary may be found by applying a multiaxial fatigue criterion to the nonlocal stress
intensity factors. In the original formulation of this crack initiation boundary (Montebello,
2016), the effect of the maximum normal stress was discarded and an over-conservative
frontier was obtained when we represented it for our experimental results. Consequently, we
decided to add the maximum normal stress to the formulation of the crack initiation
boundary. With this modification, we were able to predict the crack initiation frontier with a
precision of
±10%.
Chapter 6 Conclusions and Future work
117
Group II of Tests and Size Effect
The Group II of tests was carried out using a 70mm pad radius and a pad/specimen’s width
of 8mm and 13mm. In this group, two parameters representative of the size effect were
investigated, the volume of material, V, stressed under the contact and the fretted damaged
area, AD. During this study, experimental results obtained with two stressed volumes were
compared, the first obtained for a specimen’s width of 13mm, V13 = 361,17mm², and the
second for a specimen’s width of 8mm, V8 = 222,26mm². The tests were carried out by
maintaining the fretted damage area and the stress gradient roughly constant between two
corresponding tests (Group II-a). The experimental results have shown an increase of around
10% of the life when the stressed volume has been reduced by 39%. However, it existed a
small difference between the stress gradients developed between the 13 and 8mm specimens.
It was observed that the actual fretted damage areas for the lowest stressed volume were
smaller than the ones observed for the biggest stress volume. These differences, probably
associated to computation issues and to edge effects do not allowed us to firmly conclude that
the increase of the strength is only driven by the reduction of the stressed volume.
Then, in Group II-b, experiments were conducted by maintaining the peak pressure,
p0, the stress ratio σB/p0 and the load ratio Q/fP equal for the 8mm and 13 mm specimens. By
doing so, the stress gradient was exactly the same for both configurations, but now, not only
the resulting volume of material stressed under the contact changed, but also the damaged
area within the slip zones were reduced by approximately 39%. We did not observe
differences between the experimental results, in terms of fatigue lifetimes, obtained with the
different specimens widths for these tests. This methodology allowed us to separate the effect
of the stress gradient from the size effect and it showed that it does not seem to exist any size
effect for fretting fatigue under the partial slip conditions considered here. Moreover, the
decrease of the fretted damaged area between two corresponding tests allowed us to conclude
that the subsurface stress field have a stronger influence on the final fatigue life than the
superficial fretting damages.
6.3. Suggestions for future work
Chapter 6 Conclusions and Future work
118
Studies to extend the fretting fatigue model from laboratory scale to industrial configurations
are clearly important since in principle they are applied to provide a safe life design of critical
components of real structures. Strikingly, the specialised literature contains few reports on
this subject. The methodologies applied in this work to address this problem have shown
good preliminary results, however they should be confronted to different materials and
geometrical configurations to validate their application in practical situations.
Some authors (Fouvry et al., 2013, Shen et al., 2015, Li et al, 2015), suggest that
fretting fatigue crack initiation is influenced by the amount of damage in the slip zones and
have proposed models which included damage parameters to predict it. The author accepts
that when the study is carried out under gross slip conditions or reciprocal sliding
(O’Halloran et al, 2017), the large increase of superficial damage may motivate the use of
such models, which have shown an reasonable level of success in predicting the fretting crack
initiation life. Maybe a similar study as the one proposed in this work should be implemented
considering these loading conditions, i.e. gross slip and reciprocal sliding conditions, to
evaluate the real influence of the damaged area on the final fatigue life.
Finally, most of the studies and experimental work in fretting fatigue are conducted at
room temperature while the temperatures in aeroengines can reach up to 1700°C. Nalla et al.
(2003) have shown that the increase of the temperature have a negative effect on the fatigue
strength of the Ti-6Al-4V. Thus, a heating system may be implemented to the fretting
apparatus to carry out experiments at high temperature (Figure 6-1), as it has been proposed
by Saengsai et al. (2014). Others systems involving a local increase of the temperature at the
contact interface, using laser for example, can also be alternatives for a future work.

Chapter 6 Conclusions and Future work
119
Figure 6-1: Schematic view of a proposed experimental set-up for fretting fatigue tests at high temperatures in
air.

Chapter 6 Conclusions and Future work
120

121
References.
Alexandrov, V.M., Pozharskii, D. A. (2001). “Three-dimensional contact problems”.
Kluwer Academic Publishers.
Anderson, T.L. (1995). “Fracture Mechanics: Fundamentals and Applications”, 2nd
Edition, CRC Press, Boca Raton, FL.
Araújo, J.A. (2000). “On the Initiation and Arrest of the Fretting Fatigue Cracks”. PhD
thesis of the University of Oxford.
Araújo, J.A., Nowell, D. (2002). “The effect of rapidly varying contact stress fields on
fretting fatigue”. International Journal of Fatigue, 24(7), pp. 763-775.
Araújo, J.A., Susmel, L., Taylor, D., Ferro J.C.T., Mamiya E.N. (2007). “On the use of the
theory of critical distances and the Modified Wöhler curve method to estimate fretting
fatigue strength of cylindrical contacts”. International Journal of Fatigue, 29(1), pp. 95-107.
Araújo, J.A., Dantas, A. P., Castro, F. C., Mamiya, E. N., Ferreira, J. L. A. (2011). “On the
characterization of the critical plane with a simple and fast alternative measure of the shear
stress amplitude in multiaxial fatigue”. International Journal of fatigue, 33(8), pp. 1092-
1100.
Araújo, J.A., Castro, F. C. (2012). “A comparative analysis between multiaxial stress and
ΔK-based short crack arrest models on fretting fatigue”. Engineering Fracture Mechanics,
93, pp. 34–47.
Araújo, J.A., Carpinteri, A., Ronchei, C., Spagnoli, A., Vantadori, S. (2014). “An alternative
definition of the shear stress amplitude based on the maximum rectangular hull method and
application to the C-S (Carpinteri-Spagnoli) criterion”. Fatigue and Fracture Engineering
of Materials and Structures, 37(7), pp. 764-771.
Araújo, J.A., Castro, F. C., Pommier, S., Bellecave, J., Mériaux, J. (2016). “On the design
and test of equivalent configurations for notch and fretting fatigue”. Fatigue and Fracture
of Engineering Materials and Structures, 39(10), pp. 1241-1250.
Araújo, J.A., Susmel, L., Pires, M. S. T., Castro, F. C. (2017). “A multiaxial stress-based
critical distance methodology to estimate fretting fatigue life”. Tribology International, 108,
pp. 2-6.
Archard, J. F. (1953). “Contact and rubbing of flat surfaces”. Journal of Applied Physics,
24, pp. 981-988.
Bantounas, I., Dye, D., Lindley, T.C. (2010). “The role of microtexture on the faceted
fracture morphology in Ti-6Al-4V subjected to high-cycle fatigue”. Acta Materialia, 58(11),
pp. 3908-3918.

122
Bellecave, J. (2015). “Stress Gradients in Fretting Fatigue”. PhD thesis of the Ecole
Normale Supérieure de Cachan and the Universidade de Brasilia.
Bellows, S., Muju, S. Nicholas, T. (1999). “Validation of the step test method for
generating Haigh diagram for Ti-6Al-4V”. International Journal of Fatigue, 21(7), pp. 687-
697.
Bramhall, R. (1973). “Studies in fretting fatigue”. PhD thesis of the Oxford University.
Brown, M. W. and Miller, K. J. (1973). “A theory for fretting fatigue under multiaxial
stress-strain conditions”. Proc ImechE, 187(1), pp. 745-755.
Carpinteri, A., Ronchei, C., Spagnoli, A., Vantadori, S. (2014). “Lifetime estimation in the
low/medium-cycle regime using the Carpinteri-Spagnoli multiaxial fatigue criterion”.
Theoretical and Applied Fracture Mechanics, 73, pp. 120-127.
Castro, F. C., Araújo, J.A., Zouain, N. (2009). “On the application of multiaxial high-cycle
fatigue criteria using the theory of critical distances”. Engineering Fracture Mechanics,
76(4), pp. 512-524.
Cattaneo, C. (1938). “Sul contatto di due corpi elastici: Distribution locale dei sforzi”.
Rendiconti dell’Accademia nazionale dei Lincei 27, pp.342-348.
Chambon, L., Journet, B. (2006). “Modelling of fretting fatigue in a fracture-mechanics
framework”. Tribology International, 39(10), pp. 1220-1226.
Ciavarella, M., Macina, G. (2003a). “A note on the crack analogue mode for fretting
fatigue”. International Journal of Solid and Structures, 40(4), pp.807-825.
Ciavarella, M., Macina, G. (2003b). “New results for the fretting-induced stress
concentration on Hertzian and flat rounded contacts”. International Journal of Mechanical
Science, 45(3), pp. 449-467.
Ciavarella, M., Berto, F. (2017). “A simplified extension of the Crack Analogue model for
fretting fatigue with varying normal load”. Theoretical and Applied Fracture Mechanics, In
press, Corrected proof.
Conner, B. P., Lindley, T. C., Nicholas, T., Suresh, S. (2004). “Application of a fracture
mechanics based life prediction method for contact fatigue”. International Journal of
Fatigue, 26(5), pp. 511-520.
Crupi, V., Epasto, G., Guglielmino, E. (2017). “Influence of the microstructure [alpha +
beta and beta on very high cycle fatigue behaviour of Ti-6Al-4V alloy”. International
Journal of Fatigue, 95, pp. 64-75.
Dang Van, K. (1973). “ Sur la résistance à la fatigue des métaux”. Sci. Tech. L’armement,
(47), pp. 429–53.
123
Dang Van, K., Griveau, B., Message, O. (1989). “On a New Multiaxial Fatigue Limit
Criterion: Theory and Application”. Biaxial and Multiaxial Fatigue, EGF3 (Edited by M. W.
Brown and K. J. Miller), Mechanical Engineering Publications, London, pp. 479-496.
Delahaye, T. (2004). ‘’Développement d’une méthode probabiliste de calcul en fatigue
multiaxiale prenant en compte la répartition volumique des contraintes”. PhD thesis at the
Université de Bordeaux I.
Dini, D., Nowell, D., Igor N. Dyson (2006). “The use of notch and short crack approaches
to fretting fatigue threshold prediction: Theory and experimental validation”. Tribology
International, 39(10), pp. 1158-1165.
Dundur, J. (1969). “Discussion of edge-bonded dissimilar orthogonal elastic wedges under
normal and shear loading”, Journal of Applied Mechanic, 36, pp. 650-652.
Eden, E.M., Rose, W.N., Cunningham, F.L. (1911). “The endurance of metals”. Proceedings
of the Institute of Mechanical Engineering, 4, pp. 839-974.
El Haddad, M. H., Smith, K. N., Topper, T. H. (1979). “Fatigue crack propagation of short
cracks”. Transactions of the ASME, 101(1), pp. 42-46.
Endo, K., Goto, H. (1975). “Initiation and propagation of fretting fatigue cracks”. Wear, 38,
pp. 311-324.
Fatemi, A. and Socie, D. F. (1988). ‘A Critical Plane Approach to Multiaxial Fatigue
Damage Including Out of Phase Loading”. Fatigue Fracture of Engineering Materials and
Structures, 11(3), pp. 939-947.
Fenner, A.J., Field, J.E. (1960). “A study of the onset of the fatigue damage due to
fretting”. Transactions of the North East Coast Institution of Engineers and Shipbuilders,
pp. 1959-1960.
Fenner, A.J. and Field, J.E. (1958). "Fatigue under fretting conditions." Revue
Metallurgique, 55, pp. 475-478.
Ferré, R. (2013). “Etude expérimentale et modélisation de la durabilité d’un contact
aube/disque de soufflante grenaillé revêtu soumis à des chargements de
fretting/fatigue/usure’’. PhD thesis of the Ecole Centrale de Lyon.
Findley, W. N. (1959). “A theory for the effect of mean stress on fatigue of metals under
combined torsion and axial load or bending”. Journal of Engineering for Industry, B81, pp.
301-306.
Fleury, R. M. N., Hills, D. A., Ramesh, R., Barber, J. R. (2017). “Incomplete contacts in
partial slip subject to varying normal and shear loading, and their representation by
asymptotes”. Journal of the Mechanics and Physics of Solids, 99, pp. 178-191.
Fouvry, S., Kapsa, P., Vincent, L. (2000). “A multiaxial fatigue analysis of fretting contact
taking into account the size effect”. Fretting Fatigue: Current Technology and Practices,

124
ASTM STP 1367, D. W. Hoeppner, V. Chandrasekaran, and C. B. Elliott, Eds., American
Society for Testing and Materials, West Conshohocken, PA.
Fouvry, S., Elleuch, K., Simeon, G. (2002). “Prediction of crack nucleation under partial
slip fretting conditions”. The Journal of Strain Analysis for Engineering Design.
Fouvry, S., Merhej, R. (2013). “Introduction of a power law formulation to quantify the
contact size effects on friction and wear responses of dry oscillating sliding contacts:
Application to a chromium steel interface”, Wear, 301(1-2), pp. 34-46.
Freudenthal, A. M. (1968). “Statistical approach to brittle fatigue”. Fracture, an
Advanced Treatise, II, pp. 591-619.
Gladwell, G.M.L. (1980). “Contact Problems in the Classical Theory of Elasticity”, Sijthoff
and Noordhoff, Alphen aan den Rijn.
Giannakopoulos, A.E., Lindley, T.C., Suresh, S. (1998). “Aspects equivalence between
contact mechanics and fracture mechanics: theoretical connections and a life-prediction
methodology for fretting-fatigue”. Acta Materialia, 46(9), pp.2955-2968
Giannakopoulos, A. E., Lindley, T. C., Suresh, S., Chenut, C. (2000). “Similarities of
stress concentrations in contact at round punches and fatigue at notches: implications to
fretting fatigue crack initiation”. Fatigue and Fracture of Engineering Materials and
Structures, 23(7), pp. 561-571.
Giner, E., Sabsabi, M., Fuenmayor, F. J. (2011). “Calculation of KII in crack faces contacts
using X-FEM. Application to fretting fatigue.” Engineering Fracture Mechanics, 78, pp.
428-445.
Hertz, R. (1881). “Über die berührung fester elastischer körper”. Journal für die reine und
angewandte Mathematik, 92, pp.156-171
Hills, D. A., Nowell, D., O Connor, J. J. (1988). “On the mechanics of fretting fatigue”.
Wear, 125(1-2), pp. 129-146.
Hills, D.A., Nowell, D., Sackfield, A. (1993). “Mechanics of Elastic Contacts”, Butterworth
Heinemann, Oxford
Hills, D.A., Nowell, D. (1994). “Mechanics of fretting fatigue”. Kluwer academic
publishers.
Hines, J.A., Lutjering, G. (1999). “Propagation of microcracks at stress amplitudes below
the conventional fatigue limit in Ti-6Al-4V”. Fatigue and Fracture and Engineering
Materials and Structures, 22(8), pp. 657-665.
Hojjati-Talemi, R., Wahab, M.A., De Pauw, J., De Baets, P. (2014). “Prediction of fretting
fatigue crack initiation and propagation lifetime for cylindrical contact configuration”.
Tribology International, 76, pp. 73-91.

125
Horger, J. H. (1953). “Influence of Fretting Corrosion on the Fatigue Strength of Fitted
Members”, Symposium on Fretting Corrosion, STP 144, ASTM, Philadelphia.
Hutson, A. L., Nicholas, T., Goodman, R. (1999). “Fretting fatigue of TI-6Al-4V under a
flat-on-flat contact”. International Journal of Fatigue, 21(7), pp. 663-670
Hutson, A. L., Nicholas, T. (2000). “Fretting fatigue behaviour of TI-6Al-4V against Ti-
6AL-4V under flat-on-flat contact with blending radii”. Fretting Fatigue: Current
Technology and Practices, ASTM STP (Edited by D. W. Hoeppner, V. Chandrasekaran and
C. B. Elliot), Am. Soc. for Testing and Materials, West Conshohoken, PA, USA, pp. 308–321.
Irwin, G. R. (1957). “Analysis of stresses and strains near the end of a crack traversing
plate”. Journal of Applied Mechanics, 1.24, pp. 361-364.
Irwin, G. R. (1958). “Elasticity and Plasticity / Elastizität und Plastizität”. Handbuch der
Physik / Encyclopaedia of Physics, Ed. by S. Flügge, Vol. 3/6, Berlin, Heidelberg: Springer
Berlin Heidelberg.
Ivanova, S.G., Cohen, F.S., Biederman, R.R., Sisson Jr. R.D. (1999). “Role of the
microstructure in the mean stress dependence of fatigue strength in Ti-6Al-4V alloy”.
English.
Ivanova, S.G., Biederman, R.R., Sisson Jr., R.D. (2002). “Investigation of Fatigue Crack
Initiation in Ti-6Al-4V during Tensile-Tensile Fatigue”. Journal of Materials Engineering
and performance, 11(2), pp. 226-231.
Johnson, K.L. (1985). “Contact Mechanics”, Cambridge University Press, Cambridge
Kanninen, M.F., Popelar, C.H. (1985). “Advanced Fracture Mechanics”. Oxford
engineering Science Series, Oxford University Press, 1985.
Karhunen, K. (1946). “Uber lineare methoden in der wahrscheinlichkeitsrechnung,” Ann.
Acad. Sri. Fennicae, ser. Al. Math. Phys., vol. 37.
Kuno, M., Waterhouse, R.B., Nowell, D., Hills, D.A. (1989). “Initiation and growth of
fretting fatigue cracks in the partial slip regime”, Fatigue and Fracture of Engineering of
Materials and Structures, 12(5), pp. 387-398.
Lanning, D.B., Nicholas, T., Haritos, G.K. (2005). “On the use of critical distance theories
for the prediction of the high cycle fatigue limit stress in notched Ti-6Al-4V”. International
Journal of Fatigue, 27(1), pp. 45-57.
Lazzarin, P., Milani, V., Quaresimin, M. (1997). “Scatter bands summarizing the fatigue
strength of aluminium alloy bolted joints”. International Journal of Fatigue, 19(5), pp. 401-
407.
Le Baviant, K., Pommier, S., Prioul, C. (2002). “Local texture and fatigue crack initiation
in a Ti-6AL-4V titanium alloy”. Fatigue and Fracture of Engineering Materials and
Structures, 25(6), pp.527-545.

126
Lee. H., Mall, S. (2004). “Effect of dissimilar mating materials and contact force on fretting
fatigue behaviour of Ti-6Al-4V”. Tribology International, 37(1), pp. 35-44.
Li, B., Santos, J. L. T., de Freitas, M. (2000). “A unified numerical approach for multiaxial
fatigue limit evaluation”. International Journal of Mechanics of Structures and Machines,
28 (2000), pp. 85-103.
Li, X., Zuo, Z., Qin, W. (2015). “A fretting related damage parameter for fretting fatigue life
prediction”. International Journal of Fatigue, 73, pp. 110-118.
Liu, H.W., Corten, H.T., Sinclair, G. M. (1956). “Fretting fatigue strength of titanium alloy
RC 130B. Department of Theoretical and Applied Mechanics, University of Illinois.
Lindley, T. (1997). “Fretting fatigue in engineering alloys”, International Journal of
Fatigue, 19(93), pp. 39-49.
Mamiya, E. N., Araújo, J.A. (2002). “Fatigue limit under multiaxial loadings: on the
definition of the equivalent shear stress”. Mechanics Research Communications, 29(2-3),
pp. 141-151.
Mamiya, E. N., Castro, F. C., Araújo, J.A. (2009). “Prismatic hull: A new measure of shear
stress amplitude in multiaxial high cycle fatigue”. International Journal of Fatigue, 31(7),
pp. 1144-1153.
Mamiya, E. N., Castro, F. C., Araújo, J.A. (2014). “Recent developments on multiaxial
fatigue: the contribution of the University of Brasília”. Theoretical and Applied Fracture
Mechanics, 73, pp. 48-59.
McColl, I. R., Ding, J., Leen, S. B. (2004). “Finite element simulation and experimental
validation of fretting wear”. Wear, 256, pp. 114-1127.
McDiarmid, D. L. (1991). “A general criterion for high cycle multiaxial fatigue failure”.
Fatigue and Fracture of Engineering Materials and Structures, 14(4), pp. 429-453.
McDowell, J.R. (1953). “Fretting Corrosion Tendencies of Several Combinations of
Materials”, Symposium on Fretting Corrosion, STP 144, ASTM, Philadelphia, pp. 24-39.
Mériaux, J. (2010). “Etude expérimentale et modélisation de l’endommagement d’un
contact aube/disque de soufflante soumis à des chargements de fretting fatigue”. PhD
Thesis of the Ecole Centrale de Lyon.
Mindlin, R. D. (1949). “Compliance of elastic bodies in contact”, Journal of Applied
Mechanics, 16, pp. 259-268.
Mindlin, R. D., Deresciewicz, H. (1953). “Elastic spheres in contact under varying oblique
forces.” Journal of Applied Mechanics, 20, pp. 327-344.
Montebello C. (2015). “Analysis of the stress gradient effect in Fretting Fatigue through a
description based on nonlocal intensity factors”. PhD thesis of the Ecole Normale
Supérieure de Cachan.
127
Montebello, C., Pommier, S., Demmou, K., Leroux, J., Mériaux, J. (2016). ‘’Analysis of
stress gradient effect in fretting fatigue trough nonlocal intensity factors”. International
Journal of Fatigue, 82, pp.188-98.
Moshier, M.A., Nicholas, T., Hillberry, B.M. (2001). “Load history effects on fatigue crack
growth threshold for Ti-6Al-4V and Ti-17 titanium alloys”. International Journal of
Fatigue, 23, Supple. 0, pp. 253-258.
Muskhelishvili (1953). Some basic problems of mathematical theory of elasticity.
Noordhoff, Groningen.
Naboulsi, S. and Mall, S. (2003). “Fretting fatigue crack initiation behaviour using
process volume approach and finite element analysis”, Tribology International, 36(2), pp.
121-131.
Nagai, K., Yuri, T., Umeza, O., Ogata, T., Ishikawa, K., Ito, Y. (1993). “High cycle fatigue
properties of Ti-6Al-4V alloys at cryogenic temperatures”. Titanium, ED. By Caplan IL
Froes FH. Warrendale (PA), pp.1827-1834.
Nalla, R.K., Boyce, B.L., Campbell, J.P., Peters, J.O., Ritchie, R.O. (2002). “Influence of
microstructure on high-cycle fatigue of Ti-6Al-4V: Bimodal vs. lamellar structures”.
Metallurgical and Materials Transactions”, 33(13), pp.899-918.
Nalla, R.K., Altenberger, I., Noster, U., Liu, G.Y., Scholtes, B., Ritchie, R.O. (2003). “On
the influence of mechanical surface treatments – deep rolling and laser shot peening – on
the fatigue behaviour of Ti-6Al-4V at ambient and elevated temperatures”. Material Science
and Engineering, 355(1-2), pp.216-230.
Neuber, H. (1936). “Theorie der technischen Formzahl”. Forschung auf des Gebiete des
Ingenieurwesens, 7 (6), pp. 271-274.
Neuber H. (1958). “Theory of Notch Stresses”. Kerbspannungslehre.
Nishioka, K., Hirakawa, K. (1969). “Fundamental investigations of fretting fatigue (part4)
– The effect of mean stress”. Bulletin of JSME, 12(51), pp.408-414.
Nowell, D. (1988). “An analysis of fretting fatigue”. PhD thesis.
Oberwinkler, B., Riedler, M., Eichlseder, W. (2010). “Importance of local microstructure
for damage tolerant light weight design of Ti-6Al-4V forgings”. International Journal of
Fatigue, 32(5), pp.808-814.
O’Halloran, S. M., Shipway, P. H., Connaire, A. D., Leen, S. B., Marte, A. M. (2017). “A
combined wear-fatigue design methodology for fretting in the pressure armour layer of
flexible marine risers”. Tribology International, 2017, 108, pp. 7-15.
Papadopoulos, I. V. (1994). “A new criterion of fatigue strength for out-of phase bending
and torsion of hard metals”. International Journal of Fatigue, 16, pp. 377–84.

128
Papadopoulos, I. V. (1995). “A high-cycle fatigue criterion applied in biaxial and triaxial
out-of-phase stress conditions”. Fatigue and Fracture of Engineering Materials and
Structures, 18(1), pp. 79-91.
Papadopoulos, I. V. (1998). “Critical plane approaches in high-cycle fatigue: on the
definition of the amplitude and mean value of the shear stress acting on the critical plane”.
Fatigue and Fracture of Engineering Materials and Structures, 21(3), pp. 269-285.
Papanikos, P., Meguid, S.A. (1994). “Theoretical and experimental studies of fretting-
initiated fatigue failure of aeroengine compressors discs”, Fatigue and Fracture of
Engineering of Materials and Structures, 17(5), pp. 539–550.
Peters, M., Gysler, A., Lutjering, G. (1984). “Influence of texture on fatigue properties of
Ti-6Al-4V”. Metallurgical Transactions, 15(8), pp. 1597-1605.
Peterson, R. E. (1959). “Notch sensitivity”. Metal Fatigue, pp. 293-306.
Petiot, C., Vincent, L., Van, K.D., Maouche, N., Foulquier, J., Journet, B. (1995). “An
analysis of fretting-fatigue failure combined with numerical calculations to predict crack
nucleation”. Wear, 181, pp.101-111.
Pommier, S., Hamam, R. (2007). “Incremental model for fatigue crack growth based on a
displacement partitioning hypothesis of mode I elastic-plastic displacement fields”. Fatigue
and Fracture of Engineering Materials and Structures, 30 (7) (2007), pp. 582–598.
Pommier, S., Lopez-Crespo, P., Decreuse, P. (2009). “A multiscale approach to condense
the cyclic elastic-plastic behaviour of the crack tip region into an extended constitutive
model”. Fatigue and Fracture of Engineering Materials and Structures, 32 (11), pp. 899–
915.
Proudhon, H., Buffière, J.-Y., Fouvry, S. (2007). “Three-dimensional study of a fretting
crack using synchrotron x-ray micro-tomography”. Engineering Fracture Mechanic, 74(5),
pp. 782–793
Sá, M. V. C., Ferreira, J. L. A., Araújo, J.A (2017). “Notched multiaxial fatigue of Al7050-
T7451: on the need for an equivalent process zone size”. Frattura ed Integrità Stutturale,
41, pp. 90-97.
Saengsai, A., Otsuka, Y., Mutoh, Y. (2014). “Fretting fatigue behavior of SUS304 stainless
steel under pressurized hot water”. Tribology International, 79, pp. 52-58.
Shen, F., Hu, W., Voyiadjis, G. Z., Meng, Q. (2015). “Effects of fatigue damages and wear
on fretting fatigue under partial slip condition”. Wear, 338-339, pp. 394-405.
Smith, K. N., Watson, P., Topper, T. H. (1970). “A Stress-Strain Function for the Fatigue of
Metals”. Journal of Materials, 5(4), pp. 767-778.
Socie, D. F. (1987). “Multiaxial Fatigue Damage Models”. Transactions of the ASME.
Journal of Engineering Materials and Technology, 109(4), pp. 293-298.

129
Stoschka, M., Tan, W., Eichlseder, W., Stockinger, M. (2009). “Introduction to an
approach based on the (α+β) microstructure of elements of alloy Ti-6Al-4V”. Procedia
Engineering, 1(1), pp.31-34.
Susmel, L. and Taylor, D. (2003). “Two methods for predicting the multiaxial fatigue
limits of sharp notches”. Fatigue and Fracture of Engineering Materials and Structures,
26(9), pp. 821-833.
Susmel, L., Tovo, R., Lazzarin, P. (2005). “The mean stress effect on the high-cycle fatigue
strength from a multiaxial fatigue point of view”. International Journal of Fatigue, 28(8),
pp.928-943.
Susmel, L. and Taylor, D. (2007). “A novel formulation of the theory of critical distances
to estimate lifetime of notched components in the medium-cycle fatigue regime”. Fatigue
and Fracture of Engineering Materials and Structures, 30(7), pp. 567-581.
Susmel, L. and Taylor, D. (2008). “The Modified Wöhler curve method applied along
with the theory of critical distances to estimate finite life of notched components subjected
to complex multiaxial loading paths”. Fatigue and Fracture of Engineering Materials and
Structures, 31(12), pp. 1047-1064.
Szolwinski, M. P. and Farris T. N. (1996). “Mechanics of Fretting Fatigue Crack
Formation”. Wear, 198(1-2), pp. 93-107.
Tanaka, K. (1983). “Engineering formulae for fatigue strength reduction due to crack-like
notches”. International Journal of Fatigue, 22, pp. R39-R45.
Taylor, D. (1999). “Geometrical effects in fatigue: a unifying theoretical model”.
International Journal of Fatigue, 21(5), pp. 413-420.
Timoshenko, S.P., Goodier, J.N. (1951). “Theory of Elasticity”, McGraw-Hill, New-York.
Tomlinson, G.A. (1927). “The Rusting of Steel Surfaces in Contact”, Proceedings of the
Royal Society, 115(771), pp. 472-483.
Tomlinson, G.A., Thorpe, P.L., Gough, H.J. (1939). “An investigation of the Fretting
Corrosion of Closely Fitting Surfaces”, Proceedings of the Institution of Mechanical
Engineers, 141(1), pp. 223-249.
Venkatesh, T. A., Conner, B. P., Lee, C. S., Giannakopoulos, A. E., Lindley, T. C., Suresh,
S. (2001). “AN experimental investigation of fretting fatigue in Ti-6Al-4V: the role of contact
conditions and microstructure”. Metallurgical and Materials transactions, 32A, pp. 1131-
1146.
Warlow-Davies, F.J. (1941). “Fretting Corrosion and Fatigue Strength”, Proceedings of
the Institute of Mechanical Engineers, 146(1), pp. 32.
Waterhouse, R. B. (1992). “Fretting Fatigue”, International Materials Reviews, 37(1),
pp. 77-98.

130
Westergaard, H. M. (1939). “Bearing Pressure and Cracks”. Journal of Applied
Mechanics”. pp. 49-53.
Weibull, W. (1951). “Wide applicability”. Journal of applied mechanics, 103(730), pp.
293-297
Whitney, J. M., Nuismer, R. J. (1974). “Stress fracture criteria for laminated composites
containing stress concentrations”. Journal of Composite Materials, 8, pp. 253-265.
Wolfram, L. J. (1983). “Friction of skin”. Journal of the Society of Cosmetic Chemists,
34(8), pp. 465-476.
Wu, G.Q., Shi, C.L., Sha, W., Sha, A.X., Jiang, H.R. (2013). “Effect of microstructure on the
fatigue properties of Ti-6Al-4V titanium alloys”. Materials and Design, 46, pp.668-674.
Zuo, J.H., Wang, Z.G., Han, E.H. (2008a). “Effect of microstructure on ultra-high cycle
fatigue behaviour of Ti-6Al-4V”. Material Science and Engineering, 473(1-2), pp. 14-152.
Zuo, J.H., Wang, Z.G., Han, E.H. (2008b). “Fatigue behaviour of Ti-6Al-4V alloy in
vacuum and at low temperature”. Advanced Materials Research, Vol. 41-42, pp. 83-90.