Study of the Potential Impacts of Hydraulic Fracturing … of the Potential Impacts of Hydraulic...
31
Photo image area measures 2” H x 6.93” W and can be masked by a collage strip of one, two or three images. The photo image area is located 3.19” from left and 3.81” from top of page. Each image used in collage should be reduced or cropped to a maximum of 2” high, stroked with a 1.5 pt white frame and positioned edge-to-edge with accompanying images. Study of the Potential Impacts of Hydraulic Fracturing on Drinking Water Resources Office of Research and Development January 23, 2014 Jeanne Briskin, Research Coordinator
Transcript of Study of the Potential Impacts of Hydraulic Fracturing … of the Potential Impacts of Hydraulic...

Photo image area measures 2” H x 6.93” W and can be masked by a
collage strip of one, two or three images.
The photo image area is located 3.19” from left and 3.81” from top of page.
Each image used in collage should be reduced or cropped to a maximum of
2” high, stroked with a 1.5 pt white frame and positioned edge-to-edge with
accompanying images.
Study of the Potential Impacts of Hydraulic Fracturing on Drinking Water Resources
Office of Research and Development
January 23, 2014
Jeanne Briskin, Research Coordinator

Presentation Outline
•Study Background
•Technical Goals: HF Water Cycle
•Progress
•Stakeholder Engagement
•Draft Report
1

Study Background
The study purpose is to:
• Assess whether hydraulic fracturing can impact
drinking water resources
• Identify driving factors that affect the severity and
frequency of any impacts
In 2010, Congress urged EPA to study the relationship
between hydraulic fracturing and drinking water.
2

3
Hydraulic Fracturing Water Cycle
Large volume water withdrawals
from ground and surface waters? Water Acquisition
Surface spills on or near well pads
of hydraulic fracturing fluids? Chemical Mixing
Surface spills on or near well pads
of flowback and produced water?
Flowback and
Produced Water
Inadequate treatment of
hydraulic fracturing wastewaters?
Wastewater
Treatment and Waste
Disposal
The injection and fracturing process? Well Injection
What are the potential impacts on drinking water resources of:

Water Acquisition
4
What are the potential impacts of large volume water withdrawals
from ground and surface waters on drinking water resources?
ANALYSIS OF EXISTING DATA Literature Review | Service Company Analysis
Well File Review | FracFocus Analysis
SCENARIO EVALUATIONS Water Availability Modeling
Research Projects Underway

Water Availability Modeling
Semi-Arid: Upper Colorado River Basin Humid: Susquehanna River Basin
• Modeling the potential impact of hydraulic fracturing on drinking
water availability in semi-arid and humid river basins under different
water usage scenarios
• Future water use scenarios include: business-as-usual, full
development and “recycling plus” 5

What are the possible impacts of surface spills on or near well
pads of hydraulic fracturing fluids on drinking water resources?
Chemical Mixing
6
Research Projects Underway
ANALYSIS OF EXISTING DATA Literature Review | Spills Database Analysis
Service Company Analysis Well File Review | FracFocus Analysis
LABORATORY STUDIES Analytical Method Development
TOXICITY ASSESSMENT
RETROSPECTIVE CASE STUDIES

FracFocus Analysis
• Data submitted to FracFocus with fracture dates
between January 1, 2011, and February 28, 2013 will
be summarized
• Main topics expected to be described in report
–Water use
–Proppants
–Chemical use
• Summary statistics are expected to be calculated for
nationwide data and selected counties
7

FracFocus Analysis
• Counties will be selected
that show diversity in water
use and chemical use as a
function of geography,
geology, and production
type
– Tabular data and GIS data
used to select “example”
counties
8
4,150 – 143,000,000
143,000,001 – 505,000,000
505,000,001 – 968,000,000
968,000,001 – 1,840,000,000
1,840,000,001 – 3,710,000,000
Preliminary data subject
to change following
QA review
What are the possible impacts of the injection and fracturing
process on drinking water resources?
Well Injection
9
Research Projects Underway
ANALYSIS OF EXISTING DATA Literature Review
Service Company Analysis Well File Review RETROSPECTIVE CASE STUDIES
SCENARIO EVALUATIONS Subsurface Migration Modeling

Proposed Graph for Analysis
10
Generic Well Diagram
Cem
ent
Cem
ent
Cem
ent C
em
ent
Vertical
Separation
HF
Zone
Vertical Separation between HF Zone and
Top of Cement (Bar Graph)
Nu
mb
er
of
Wells
Distance (feet)
Inherent Protectiveness LESS MORE
If multiple zones are fractured,
distance between top of cement and
uppermost zone is graphed
Diagram not to scale
Top of Cement

Proposed Graph for Analysis
11
Generic Well Diagram
Cem
ent
Cem
ent
Cem
ent C
em
ent
Vertical
Separation
HF
Zone
Vertical Separation between HF Zone and
Ground Surface (Bar Graph)
Nu
mb
er
of
Wells
Distance (feet)
Inherent Protectiveness LESS MORE
If multiple zones are fractured,
distance between ground surface and
uppermost zone is graphed
Diagram not to scale
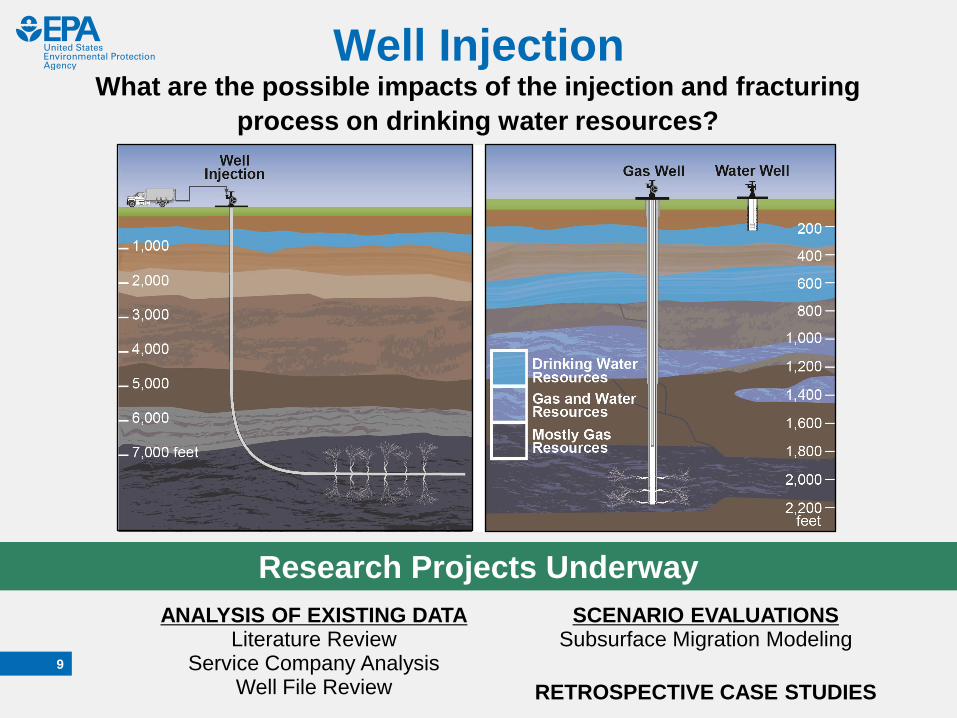
Proposed Graph for Analysis
12
Generic Well Diagram
Cem
ent
Cem
ent
Cem
ent C
em
ent
HF
Zone
Distribution of Cement Bond Indices
(Box and Whiskers Plot)
Cem
en
t B
on
d I
nd
ex
Distance Interval Above
Uppermost Perforation (feet)
Diagram not to scale
Cement Bond Index
Measure of bond quality
(0-100%) obtained from
cement bond logs
0%
100%
Zonal isolation indicated
LESS
MORE

Proposed Graph for Analysis
13
Generic Well Diagram
Cem
ent
Cem
ent
Cem
ent C
em
ent
HF
Zone
Zones and Degree of Cement
(Bar Graph)
Perc
en
t o
f A
ll C
asin
g S
trin
gs
Inherent Protectiveness MORE LESS
Diagram not to scale
Partially- or Un-Cemented
Interval • Are water zones present?
• Are hydrocarbon (HC)
zones present?
Fully
Cemented
No HC
or water
HC Only Water
Only
HC and
Water
Zones in Partially- or
Un-Cemented Intervals

Flowback and Produced Water
14
Research Projects Underway
What are the possible impacts of surface spills on or near well pads of
flowback and produced water on drinking water resources?
ANALYSIS OF EXISTING DATA Literature Review
Spills Database Analysis Service Company Analysis
Well File Review
LABORATORY STUDIES Analytical Method Development
TOXICITY ASSESSMENT
RETROSPECTIVE CASE STUDIES

Spills Database Analysis
15
Federal Source National Response Center National Response Center (NRC) Freedom of Information Act (FOIA) Data
States* Source Pennsylvania Pennsylvania Department of Environmental Protection Compliance
Reporting Database
Colorado Colorado Oil and Gas Conservation Commission COGIS - Spill/Release
Database
New Mexico New Mexico Energy, Minerals and Natural Resources Department Spills and
Pit Data
Wyoming Wyoming Oil and Gas Conservation Commission Spill Database
Texas Texas Railroad Commission H8 Spill Records
Lousiana Louisiana Department of Environmental Quality
Arkansas Arkansas Department of Environmental Quality Complaints and Inspections
Database
Oklahoma Oklahoma Corporation Commission
Utah Utah DERR Division of Drinking Water
North Dakota No publically available spills database
Additional Data obtained from 9 HF service companies and 9 oil and gas operators by EPA
*States were selected based on those with the largest number of hydraulically fractured wells.

Wastewater Treatment and Waste Disposal
16
What are the possible impacts of inadequate treatment of hydraulic
fracturing wastewater on drinking water resources?
ANALYSIS OF EXISTING DATA Literature Review | Well File Review
FracFocus Analysis
LABORATORY STUDIES Source Apportionment Studies Wastewater Treatability Studies
Br-DBP Precursor Studies SCENARIO EVALUATIONS
Surface Water Modeling
Research Projects Underway

Sample Drinking Water Intake
Discharge Point Discharge includes hydraulic
fracturing wastewater, coal-
fired power plant effluents,
mining effluent, and road salt
Sample Upstream
ISCO Sampler
Sample Downstream
Sample Discharge
Source Apportionment
17
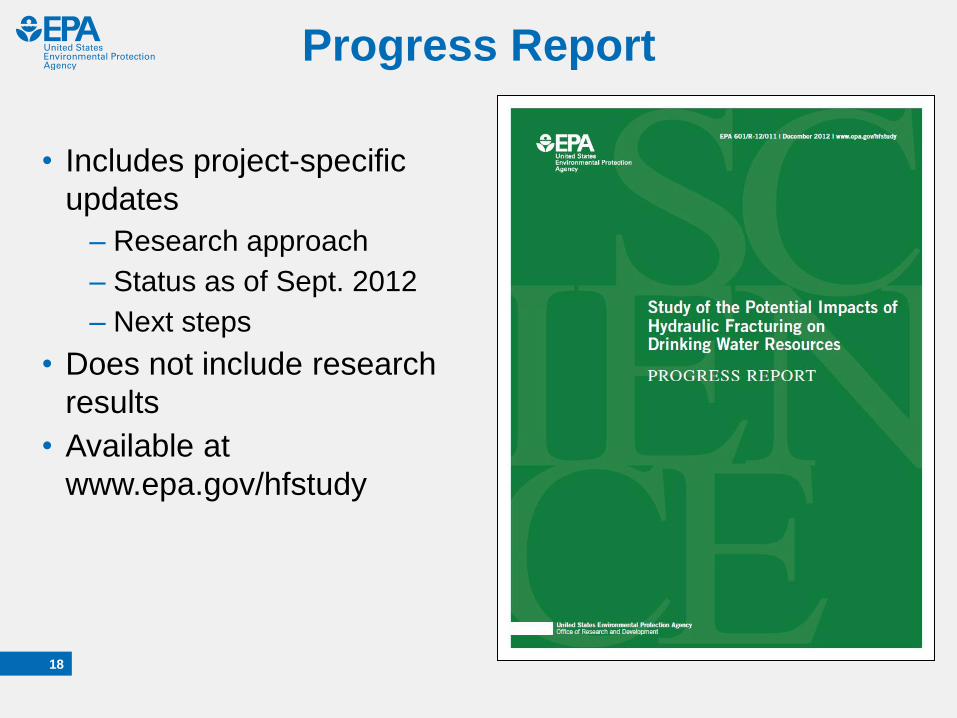
Progress Report
18
• Includes project-specific
updates
– Research approach
– Status as of Sept. 2012
– Next steps
• Does not include research
results
• Available at
www.epa.gov/hfstudy

Research Projects and Products
19
17 research projects are expected to produce >30
peer-reviewed journal papers or EPA reports
• Most will undergo an internal (EPA) and an external (journal or
letter) peer review
• To date, 5 papers have been published in scientific journals
– Subsurface migration modeling (3)
– Analytical method development (2)
These products will be considered together with
scientific literature in the draft assessment report
• Draft assessment report is a HISA

Peer Reviewed Publications
Analytical method development: • DeArmond, P. D. and DiGoregorio, A. L. 2013. Characterization of liquid
chromatography-tandem mass spectrometry method for the determination of
acrylamide in complex environmental samples. Analytical and Bioanalytical Chemistry
405 (12): 4159-66.
• DeArmond, P. D. and DiGoregorio, A. L. 2013. Rapid liquid chromatography-tandem
mass spectrometry-based method for the analysis of alcohol ethoxylates and
alkylphenol ethoxylates in environmental samples. Journal of Chromatography A
1305:154-63.
Subsurface migration modeling: • Rutqvist, J., Rinaldo, A. P., Cappa, F., Moridis, G.J. 2013. Modeling of fault
reactivation and induced seismicity during hydraulic fracturing of shale-gas reservoirs.
Journal of Petroleum Science and Engineering 107: 31-44.
• Kim, J. and Moridis, G. J. 2013. Development of the T+M coupled flow–
geomechanical simulator to describe fracture propagation and coupled flow–thermal–
geomechanical processes in tight/shale gas systems. Computers and Geosciences
60: 184-198.
• Moridis, G. J. and Freeman, C. M. 2013. The RealGas and RealGasH2O Options of
the TOUGH+ Code for the Simulation Of Coupled Fluid And Heat Flow in Tight/Shale
Gas Systems. Computers and Geosciences. (Accepted/ currently in press.
Manuscript available online)
20

Study Timeline
21
US Congress urges the EPA to conduct a study
Meetings with stakeholders to identify
concerns and study scope
(July – August 2010)
Peer review of draft study plan*
(February – August 2011)
Release final study plan
(November 2011)
Technical workshops
(February – March 2011)
Peer review of
draft report
Technical roundtables* / information request
(November 2012)
Technical workshops*
(Spring/Summer 2013)
Technical roundtable*
(December 2013)
Final report
Planning Conduct Research Report of Results
Release progress report*
(December 2012)
*Webinars conducted to
provide updates
Individual reports
and papers
Continued stakeholder
engagement

Stakeholder Engagement
• Public meetings
• One-on-one meetings
• Technical meetings (workshops and roundtables)
• Public dockets
• Responses to information requests
22
EPA has received input through a variety of mechanisms
at different stages of the study:

Technical Meetings
23
• Interact with experts outside of EPA
• Keep up-to-date on changes in technology and practice
• Obtain feedback on current research
• Engage with subject-matter
experts on
– Analytical chemistry methods
– Well construction/operation and
subsurface modeling
– Wastewater treatment and related
modeling
– Water acquisition modeling
– Case studies
• February — March 2011
• February — June 2013
Technical Workshops
• Consult with a broad and
balanced panel of experts
– Oil and gas industry, water
industry, non-governmental
organizations, state/local
governments, tribes, academia
• November 2012
• December 2013
Technical Roundtables
Technical Meetings
24
• Described variability in industry and operational
practices, many of which can be dependent on shale
basin geology
• Discussed trends toward treatment and reuse of
wastewater for subsequent fracturing operations
• Supplied information for EPA to consider as it conducts
subsurface modeling and analytical method
development
Examples of technical input include:
Draft Report
25
Sources of information:
• Peer-reviewed literature and reports
• Government reports and technical papers
• Results from the agency’s ongoing research
activities
• Information submitted by stakeholders – Technical meetings
– EPA docket
– Comments submitted to the Science Advisory Board

Draft Report
26
Impacts evaluated:
• Impacts related to normal operations
reflecting modern typical practices
• Potential and actual accidents or unintended
events
• Potential immediate, short-term, and long-
term impacts

Draft Report
27
Spatial Scope:
• National: Evaluating available information for
multiple regions
• Evaluating potential impacts at multiple
scales:
– Single well
– Cluster of wells
– Watershed
– Shale plays

Draft Report
28
Intended Use:
• Contribute to understanding of potential
impacts of hydraulic fracturing on drinking water
resources
• Identify pathways of greatest concern
• Inform and promote dialogue among federal,
tribal, state, and local government entities,
industry, NGOs and other stakeholders
• Identify knowledge gaps and information needs
Next Steps
EPA will continue to conduct research, analyze
information and literature, and engage stakeholders
• Completed research will undergo peer review
• Exchange information with industry, academia,
states, NGOs, tribes, and public
• Update SAB panel on publications and research
(anticipated Summer 2014)
• Release draft report in late 2014
–The SAB Panel will peer review the draft report
–The public will have an opportunity to provide written and
oral comments
29

Questions?
For more information:
www.epa.gov/hfstudy
30