Study of the Hydrodynamics, Mass Transfer and Energy ...
108
Western University Western University Scholarship@Western Scholarship@Western Electronic Thesis and Dissertation Repository 11-27-2015 12:00 AM Study of the Hydrodynamics, Mass Transfer and Energy Study of the Hydrodynamics, Mass Transfer and Energy Requirements of a Rectangular Air-lift Bioreactor for Electrical Requirements of a Rectangular Air-lift Bioreactor for Electrical Power Generation Power Generation Stanimir S. Drandev, The University of Western Ontario Supervisor: Dr. Dimitre Karamanev, The University of Western Ontario A thesis submitted in partial fulfillment of the requirements for the Master of Engineering Science degree in Chemical and Biochemical Engineering © Stanimir S. Drandev 2015 Follow this and additional works at: https://ir.lib.uwo.ca/etd Recommended Citation Recommended Citation Drandev, Stanimir S., "Study of the Hydrodynamics, Mass Transfer and Energy Requirements of a Rectangular Air-lift Bioreactor for Electrical Power Generation" (2015). Electronic Thesis and Dissertation Repository. 3349. https://ir.lib.uwo.ca/etd/3349 This Dissertation/Thesis is brought to you for free and open access by Scholarship@Western. It has been accepted for inclusion in Electronic Thesis and Dissertation Repository by an authorized administrator of Scholarship@Western. For more information, please contact [email protected].
Transcript of Study of the Hydrodynamics, Mass Transfer and Energy ...
Western University Western University
Scholarship@Western Scholarship@Western
Electronic Thesis and Dissertation Repository
11-27-2015 12:00 AM
Study of the Hydrodynamics, Mass Transfer and Energy Study of the Hydrodynamics, Mass Transfer and Energy
Requirements of a Rectangular Air-lift Bioreactor for Electrical Requirements of a Rectangular Air-lift Bioreactor for Electrical
Power Generation Power Generation
Stanimir S. Drandev, The University of Western Ontario
Supervisor: Dr. Dimitre Karamanev, The University of Western Ontario
A thesis submitted in partial fulfillment of the requirements for the Master of Engineering
Science degree in Chemical and Biochemical Engineering
© Stanimir S. Drandev 2015
Follow this and additional works at: https://ir.lib.uwo.ca/etd
Recommended Citation Recommended Citation Drandev, Stanimir S., "Study of the Hydrodynamics, Mass Transfer and Energy Requirements of a Rectangular Air-lift Bioreactor for Electrical Power Generation" (2015). Electronic Thesis and Dissertation Repository. 3349. https://ir.lib.uwo.ca/etd/3349
This Dissertation/Thesis is brought to you for free and open access by Scholarship@Western. It has been accepted for inclusion in Electronic Thesis and Dissertation Repository by an authorized administrator of Scholarship@Western. For more information, please contact [email protected].

STUDY OF THE HYDRODYNAMICS, MASS TRANSFER AND ENERGY REQUIREMENTS OF A RECTANGULAR AIR-LIFT BIOREACTOR FOR
ELECTRICAL POWER GENERATION
(Thesis format: Monograph)
by
Stanimir S. Drandev
Graduate Program in Chemical and Biochemical Engineering
A thesis submitted in partial fulfillment of the requirements for the degree of
Master of Engineering Science
The School of Graduate and Postdoctoral Studies The University of Western Ontario
London, Ontario, Canada
© Stanimir S. Drandev 2015

Abstract
Despite the increasing importance of air-lift reactors, very little published information is
available on how the ratio of aerated to non-aerated cross-sectional areas (Ad/Ar) of the
reactor, and the aerating system affect the oxygen mass transfer, energy efficiency and other
performance characteristics. The main goal of this work was to define the optimal operating
conditions in terms of oxygen mass transfer, hydrodynamics and energy utilization in a
rectangular air-lift reactor for use in a biological fuel cell by identifying its oxygen mass
transfer coefficient and liquid circulation behavior. A new empirical model for the
dependence of the mass transfer coefficient on the non-aerated to aerated compartment ratio
in the air-lift reactor was developed and used for optimization of the operating conditions.
We believe that this work may be useful for the design and optimization of biochemical and
other processes that require air-lift reactors.
Keywords
Air-lift reactor, volumetric oxygen mass-transfer coefficient, downcomer to riser ratio,
hydrodynamic characteristics; energy efficiency
ii
Co-Authorship Statement
Stanimir Drandev was the principal author. The supervisor Dr. Dimitre Karamanev made
revisions and recommendations. Based on some portions of results in this thesis, one paper is
submitted, and another one is under preparation for submission to peer reviewed journals.
The contribution of each author is given below:
1. Study of the hydrodynamics and mass transfer in a rectangular air-lift bioreactor.
Submitted to Chemical Engineering Science
Authors: Stanimir S. Drandev, Kalin I. Penev, Dimitre Karamanev
Experimental work and data analysis were performed by Stanimir Drandev. Kalin Penev
contributed to the development of the empirical model of the system. Dimitre Karamanev
and Kalin Penev provided consultation regarding experimental work and data analysis. The
manuscript was written and revised by Stanimir Drandev and reviewed by Dimitre
Karamanev and Kalin Penev.
2. Energy consumption and energy balance in rectangular air-lift reactor for power
generation in a microbial fuel cell.
Prepared for publishing in Biotechnology Letters
Authors: Stanimir S. Drandev, Dimitre Karamanev
Experimental work and data analysis were performed by Stanimir Drandev. Dimitre
Karamanev provided consultation regarding experimental work and data analysis. The
manuscript was written and revised by Stanimir Drandev, and reviewed by Dimitre
Karamanev.
iii
Acknowledgments
My sincerest gratitude to my supervisor, Dr. Dimitre Karamanev for providing me the
opportunity to work on this exciting project, and whose inspirational words and faithful
support were always guiding me. I would like to extend my appreciation to Dr. Kalin Penev
for his admirable assistance during the project. Special thanks to Mr. Lyudmil Marinov for
his advises and help in conducting liquid velocity measurement. In addition, I would like to
thank Ms. Karen Nygard for her assistance with SEM analysis. Finally, I would like to thank
my friends Mr. Abedin Abedin, Mr. Boris Nikolov for their friendship and support.
Last but not least, I am grateful to my wife, Emmanuelle, for her trust and support. Her
infinite patience and spirit have always encouraged me to go further.
iv

Table of Contents
Abstract ............................................................................................................................... ii
Co-Authorship Statement................................................................................................... iii
Acknowledgments.............................................................................................................. iv
Preface............................................................................................................................... xii
Chapter 1 ............................................................................................................................. 1
1 Introduction .................................................................................................................... 1
1.1 Motivation ............................................................................................................... 1
1.2 Objectives ............................................................................................................... 6
1.3 Thesis Outline ......................................................................................................... 7
Chapter 2 ............................................................................................................................. 9
2 Background and Literature Review ............................................................................... 9
2.1 Ferrous Iron Biooxidation – Principles and Applications....................................... 9
2.2 Fundamentals of the BioGenerator ....................................................................... 11
2.2.1 Idea ............................................................................................................ 11
2.2.2 Structure and reactions .............................................................................. 11
2.2.3 Bioreactor .................................................................................................. 13
2.2.4 Volumetric oxygen mass transfer coefficient ........................................... 16
2.3 Summary ............................................................................................................... 18
Chapter 3 ........................................................................................................................... 20
3 Materials and Methods ................................................................................................. 20
3.1 Reactor .................................................................................................................. 20
3.2 Gas Distributors .................................................................................................... 23
3.3 Scanning Electron Microscopy (SEM) ................................................................. 26
v

3.4 Dissolved oxygen measurement ........................................................................... 27
3.5 Determination of kLa ............................................................................................. 31
3.6 Gas Holdup Measurement..................................................................................... 33
3.7 Liquid Velocity and Mean Circulation Time ........................................................ 37
3.8 Error Analysis ....................................................................................................... 40
Chapter 4 ........................................................................................................................... 42
4 Results and Discussion ................................................................................................. 42
4.1 Outlook ................................................................................................................. 42
4.2 Influence of the DO Probe Position on kLa Determination ................................... 49
4.3 Effect of the Ad/Ar Ratio on kLa ............................................................................ 52
4.4 Effect of the Orifices Orientation of the Aerating Device on kLa ......................... 54
4.5 Effect of the Liquid Level Above the Partition Board on kLa .............................. 55
4.6 Empirical Correlations for kLa .............................................................................. 56
4.7 Effect of the Different Gas Distributors on the Energy Consumption .................. 60
4.8 Effect of the Gas Holdup on kLa ........................................................................... 66
4.9 Effect of the Mean Circulation Time of the Liquid on kLa ................................... 67
Chapter 5 ........................................................................................................................... 71
5 Conclusions and Recommendations ............................................................................ 71
5.1 Conclusions ........................................................................................................... 71
5.2 Recommendations ................................................................................................. 72
References ......................................................................................................................... 76
Appendices ........................................................................................................................ 85
Curriculum Vitae .............................................................................................................. 92
vi

List of Tables
Table 3.1 Gas distributor types and Ad/Ar ratios used at the experiment ............................... 23
vii

List of Figures
Figure 1.1 Schematic diagram of integrating renewable energies to electrical grids using
hydrogen as intermedia ............................................................................................................. 4
Figure 2.1 Schematic diagram of the BioGenerator ............................................................... 13
Figure 2.2 Air-lift reactor types .............................................................................................. 16
Figure 3.1 Schematic diagram of the rectangular air-lift reactor, used in the experiment: (1)
column; (2) partition board; (3) gas distributor; (4) manometer; (5) filter; (6) rotameter; (7)
valves; (8) DO probe; (9) Pt-electrodes; (10) threated rod ..................................................... 22
Figure 3.2 SEM image of a finely perforated rubber tube distributor (Marineland Aquarium
Products) ................................................................................................................................. 24
Figure 3.3 SEM image of an Aeos™ ePTFE Extruded Special gas distributor ..................... 25
Figure 3.4 Schematic diagram of the aerating devices with diameter of orifices 2 mm
consisting of: (A) 40 orifices; (B) 80 orifices; (C) 160 orifices; (D) 200 orifices .................. 26
Figure 3.5 Scheme of an electron scanning microscope (SEM) (based on Schweitzer n.d.) . 27
Figure 3.6 Schematic diagram, illustrating the change of oxygen concentration in time when
applying the dynamic method of absorption ........................................................................... 29
Figure 3.7 Orion 3 Star DO Benchtop meter, equipped with Orion 081010MD oxygen probe
................................................................................................................................................. 31
Figure 3.8 Schematic diagram of determination the volumetric oxygen mass transfer
coefficient ............................................................................................................................... 32
Figure 3.9 Scheme of the inverted U-tube manometer arrangement ...................................... 34
Figure 3.10 Scheme of the liquid velocity measurement arrangement ................................... 38
viii
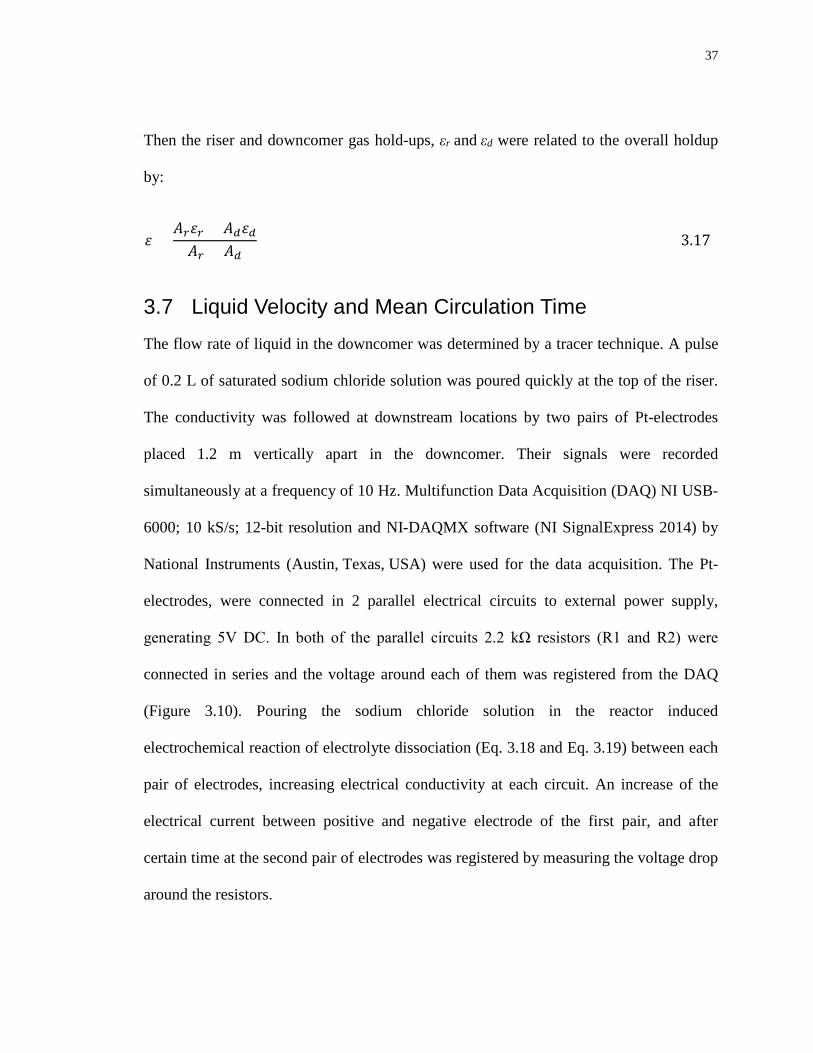
Figure 3.11 Typical response of the Pt-electrodes to pulse input of tracer the air-lift reactor.
The red curve corresponds to the signal from the first couple of electrodes, whereas the white
shows the respond from the second couple............................................................................. 39
Figure 4.1 Dependence of oxygen transfer rate (OTR) on volumetric mass transfer coefficient
and hydrodynamic parameters in bioreactors (based on Garcia-Ochoa and Gomez, 2009) ... 42
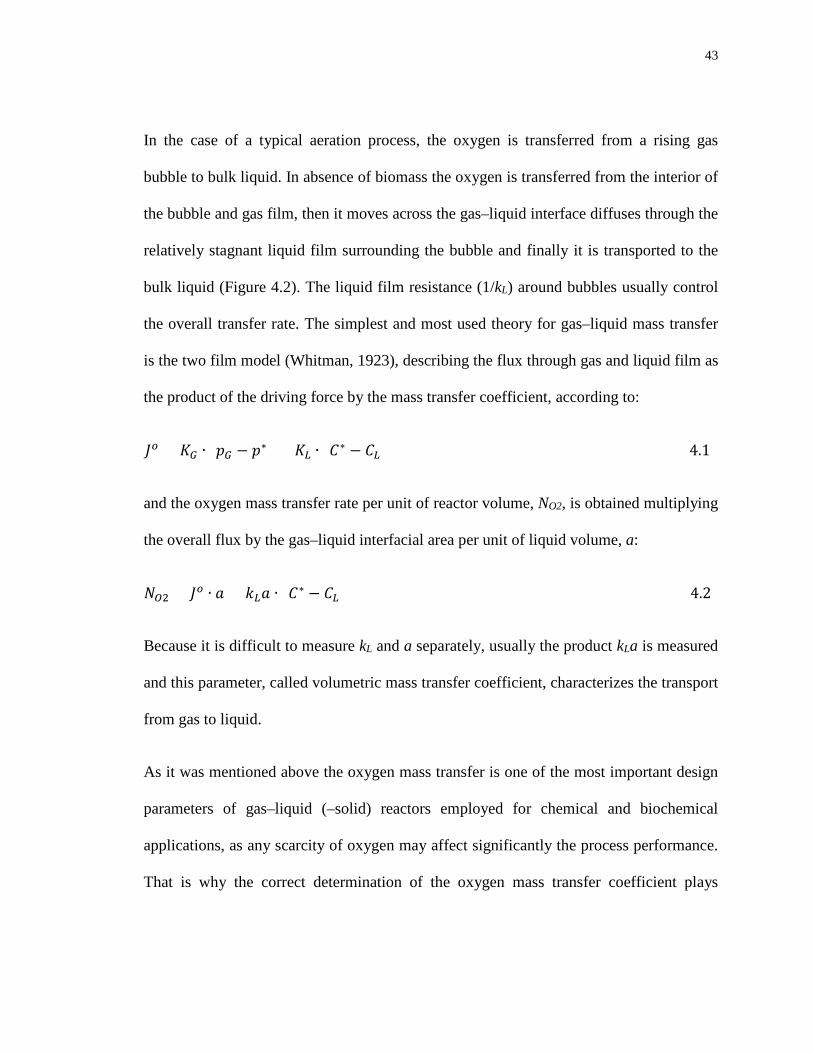
Figure 4.2 Steps and resistances for oxygen transfer from gas bubble to bulk liquid at the
absence of living organisms: (1) transfer from the interior of the bubble and gas film; (2)
movement across the gas–liquid interface; (3) diffusion through the relatively stagnant liquid
film surrounding the bubble; (4) transport through the bulk liquid ........................................ 44
Figure 4.3 Relationship between cross-sectional area ratio and the width of the liquid flow
channels ratio for rectangular split-vessel and concentric draught tube air-lift reactors with
the equal reactor cross-sectional areas .................................................................................... 47
Figure 4.4 Schematic diagram of the concentric draught tube (left-hand side) and rectangular
split-vessel ALRs with equal cross-sectional areas at the same Ad/Ar ratio............................ 47
Figure 4.5 Typical response of the DO probe, inserted at different horizontal positions in the
downcomer with the gradually change of the Ad/Ar ratio at 4.8 m3/h (0.017VVM) using an
aerating device with 200 orifices, (a) for the orifices facing upwards, (b) for the orifices
facing downwards ................................................................................................................... 51
Figure 4.6 Variations of the oxygen mass-transfer coefficient at the same position of the
probe with the change of the non-aerated to aerated surface areas ratio at the different
superficial gas velocities in the riser using an aerating device with 200 orifices, (a) for the
orifices facing upwards, (b) for the orifices facing downwards ............................................. 53
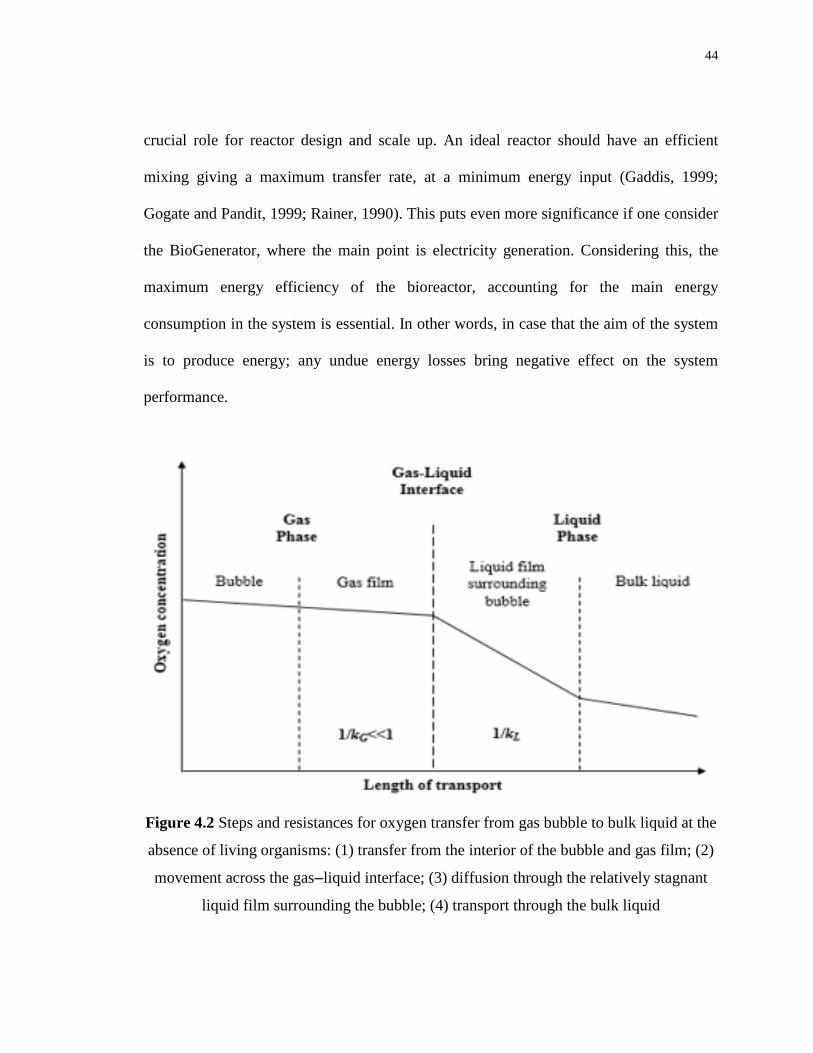
Figure 4.7 Variations of the volumetric mass transfer coefficient with changing the
superficial gas velocity in the riser at five different overall gas velocities ............................. 55
Figure 4.8 Comparison between the results for oxygen mass-transfer coefficient obtained at
different liquid headspace above the partition board .............................................................. 56
ix
Figure 4.9 Variations of the oxygen mass-transfer coefficient with the change of effective
superficial gas velocity for the different Ad/Ar ratios .............................................................. 58
Figure 4.10 Volumetric mass-transfer coefficient as a function of Ad/Ar ratio for the two
main cases occurring for the system ....................................................................................... 59
Figure 4.11 Predicted (Eq. (12)) vs. measured kLa for the different Ad/Ar ratios ................... 60
Figure 4.12 Variations of the oxygen mass-transfer coefficient with the changing the number
of the orifices of the aerating device ....................................................................................... 61
Figure 4.13 Variations of the theoretical electric power obtained and pressure loss at the
different effective superficial gas velocities used ................................................................... 64
Figure 4.14 Variations of the theoretical electric power received and pressure loss compared
to the values of volumetric mass-transfer coefficient obtained .............................................. 65
Figure 4.15 Volumetric mass-transfer coefficient as a function of energy efficiency ............ 66
Figure 4.16 Variations of the volumetric mass-transfer coefficient with the increased overall
gas holdup ............................................................................................................................... 67
Figure 4.17 Effect of the liquid circulation time on the mass transfer coefficient ................. 69
x

List of Appendices
Appendix A: Typical graphs from DO measurements (a), and kLa determination (b), obtained
for the same Ad/Ar ratio using five different aeration rates. .................................................... 85
Appendix B: Sample excel sheet used for calculation the error of the method of kLa
determination .......................................................................................................................... 87
Appendix C: Sample excel sheet used for calculation the error of the method of gas holdup, ɛ
determination .......................................................................................................................... 88
xi
Preface
Access to clean and renewable energy is one of the greatest challenges facing the humanity.
Nature can inspire innovative solutions for sustainable energy systems and technology
design, which is subject of the BIONICS. Some renewable energy technologies already
imitate processes found in nature. Such a processes of imitation of the models, systems, and
elements of nature for the purpose of solving complex human problems is called biomimetics
or biomimicry.
One particular example, which demonstrates both approaches is the integration of a ferrous
iron oxidizing microorganisms in the presence of an electron acceptor, and a biological fuel
cell into a single electricity generation system known as BioGenerator. In this case molecular
oxygen is used as a final electron acceptor. In the nature molecular oxygen is mainly
biogenic – a by-product of the most common type of photosynthesis, which is a part of
natural surroundings of the microorganisms, as long as the microorganisms can never be a
closed system. However, when processes from the nature are replicated, oxygen has to be
supplied continuously to the system in order to maintain it as close as it is possible to its
innate conditions. It is this urge of the research of conditions, necessary to provide the
environment closer to the natural that is central to the current work.
xii

Nomenclature
A Cross-sectional area (m2)
a Gas-liquid interfacial area per unit of liquid volume (m-1)
C Concentration (mg·L−1)
d Diameter (mm)
Eo Standard oxidation-reduction potential
F Faraday constant (C·mol−1)
h Height (m)
I Electrical current (A)
JO Molar flux of oxygen (mol·m−2·s−1)
K Overall mass transfer coefficient (m∙s-1)
kLa Volumetric mass transfer coefficient (s−1)
L Length (m)
M Molar mass (g·mol−1)
m Mass (g)
N All values from a population (–)
NO2 Oxygen mass transfer rate per unit of reactor volume (mol·m−3·s−1)
n Number (–)
P Power density (W·m−3)
p Pressure (Pa)
s Standard deviation based on the sample (–)
Q Total electric charge passed through the substance (C)
q Specific uptake rate of microorganisms (mol·m−3·s−1)
t Time (s)
U Superficial velocity (m·s−1) xiii
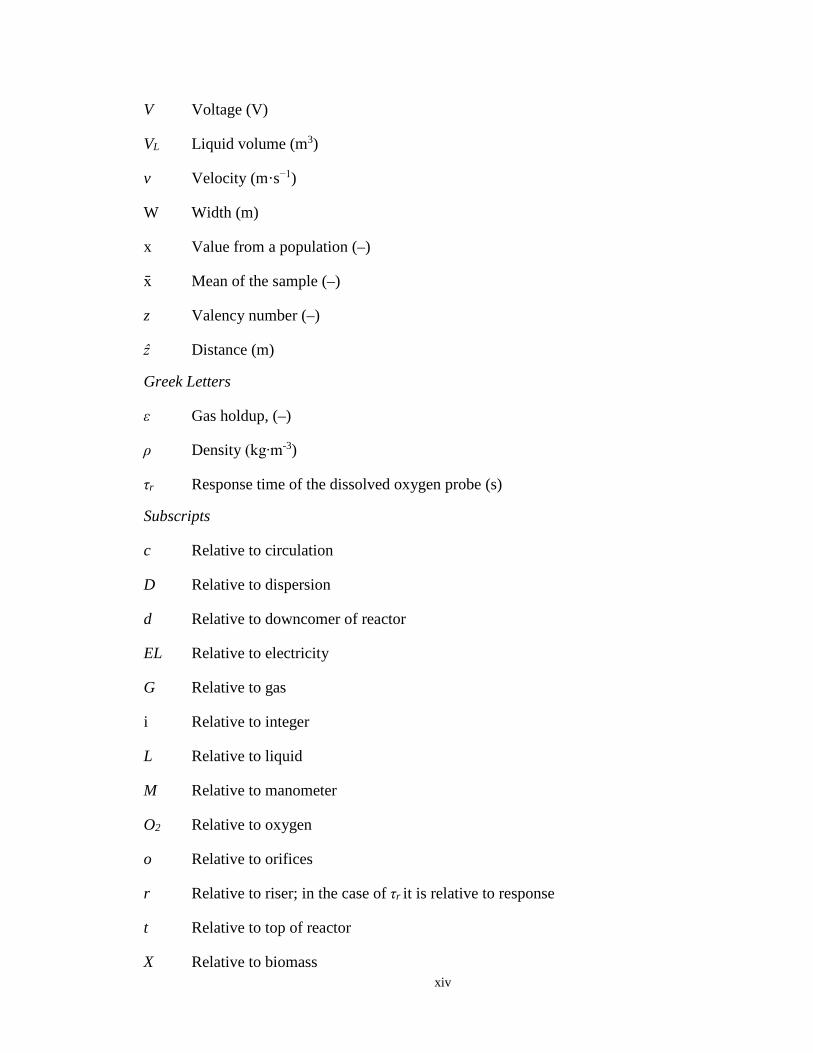
V Voltage (V)
VL Liquid volume (m3)
v Velocity (m·s−1)
W Width (m)
x Value from a population (–)
x̄ Mean of the sample (–)
z Valency number (–)
ẑ Distance (m)
Greek Letters
ε Gas holdup, (–)
ρ Density (kg∙m-3)
τr Response time of the dissolved oxygen probe (s)
Subscripts
c Relative to circulation
D Relative to dispersion
d Relative to downcomer of reactor
EL Relative to electricity
G Relative to gas
i Relative to integer
L Relative to liquid
M Relative to manometer
O2 Relative to oxygen
o Relative to orifices
r Relative to riser; in the case of τr it is relative to response
t Relative to top of reactor
X Relative to biomass xiv

Superscripts
* Equilibrium value in each phase
Abbreviations
ALR Air-lift reactor
AMD Acid mine drainages
DO Dissolved oxygen
DI Deionized (water)
ESS Energy storage system
FIB Ferrous iron biooxidation
IOM Iron oxidizing microorganisms
OTR Oxygen transfer rate (mol O2·m−3·s−1)
OUR Oxygen uptake rate (mol O2·m−3·s−1)
PEM Proton exchange membrane
SE Standard error (–)
CI Confidence interval (–)
xv
1
Chapter 1
1 Introduction
1.1 Motivation Humanity is on the verge of a profound shift in the way it generates and uses energy.
With fossil fuels resources depletion and pollution increase, producers and law makers
are looking forward to develop alternative energy technologies that are more
environmentally sound and renewable (Bang et al., 2000). Nowadays, worldwide power
generation is responsible for more pollution than any other single activity (Dunn, 1997).
However according to Farhar (1996), the humanity is beginning to recognize the link
between energy use and environmental degradation.
In the last few years a steady growth in the share of renewables for the electricity
generation, heat, and fuel production was achieved. In respect to the electricity
generation, renewables fall into two major categories: hydropower and new renewables
(Renewables 2015 Global Status Report, 2015). The rapid growth of global electricity
generation from renewable energy sources at the end of 2014 accounted for 16.6% and
6.2% respectively for hydropower and other renewables (Renewables 2015 Global Status
Report, 2015). The other renewable on the other hand can be wind and solar power, bio-
power, geothermal power and ocean (tidal) power (Twidell and Weir, 2006; Natural
Resources Canada – Government of Canada, 2015). The wind and sun are the most
important sources for electricity generation on a global scale due to their unlimited

2
quantity and environmentally friendly nature. Only in 2014, the power generated from
photovoltaic panels and wind turbines rose respectively by 30% and 16%, thus
accounting for almost 65% of the worldwide electricity generation from non-hydro
renewable sources of energy (Renewables 2015 Global Status Report 2015).
Unfortunately there is a significant drawback of taking advantage from fictitiously
unlimited capacity of wind and solar energies for electricity generation. It comes from the
fact that, unlike conventional power units, wind and solar power produced varies over
time and weather conditions. The power supply from those sources is out-of-control and
greatly unpredictable (Ambec and Crampes, 2010). It depends on weather conditions that
are hardly forecasted more than five days ahead (Baranes et al., 2014). The intermittency
of electricity supplied from windmills and solar photovoltaic panels makes power
dispatch even more challenging, because such a power cannot be introduced to the
electrical grid without smoothing. For example a high perforation of wind power, caused
by the nature of wind uncertainty raises a system instability. The integration of an energy
storage system (ESS) is one of the best solutions to assure the stability and power quality
of an energy system with facilitating perforation of distributed wind and solar resources
(Sahithi and Madhusudhan Rao, 2015). Nowadays, a number of new and promising
methods based on old concepts, or completely new ideas have been proposed. Some of
the most important energy storage methods available or under development today for
renewable-based power plants include supercapacitors and flywheels, pumped hydro,
compressed air storage, hydrogen storage or rechargeable and redox flow batteries

3
(Hadjipaschalis et al., 2009). Of these technologies, the only commercially proven large
scale and currently the most cost effective technique in means of storing large amounts of
electrical energy on an operating basis is pumped hydro, but unfortunately the capital
costs and the presence of appropriate geography are critical drawback factors (Deane et
al., 2010). In a mid- to long-term the use of hydrogen as an energy carrier is considered
as the most promising method, as the hydrogen systems can provide viable, sustainable
options for meeting the world's energy requirements (Elam et al., 2003). The hydrogen-
based electricity production includes as a first step conversion of surplus electricity to
hydrogen by electrolysis. The next stage is storage of the produced hydrogen as
compressed gas or cryogenic liquid in physical storage systems, or solid-state storage
systems based on chemical or physical binding of hydrogen to a solid material, which can
potentially store more hydrogen per unit volume (Momirlan and Veziroglu, 2005). Yet,
the main challenge in hydrogen-based energy production is the conversion of the stored
hydrogen back to electricity in a time-controlled manner, cause of the absence of well-
established, reliable H2-to-electricity conversion technology (Karamanev, 2012). A
schematic diagram of electricity-hydrogen-electricity conversion is shown at Figure 1.1.
4
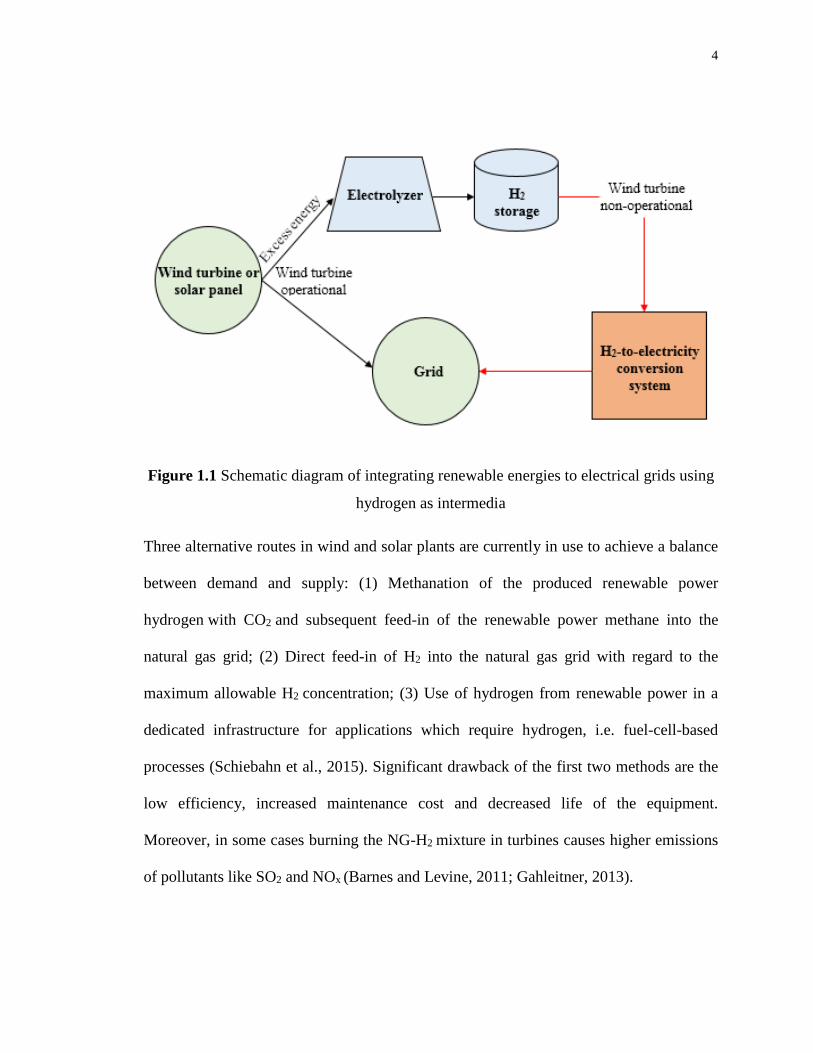
Figure 1.1 Schematic diagram of integrating renewable energies to electrical grids using
hydrogen as intermedia
Three alternative routes in wind and solar plants are currently in use to achieve a balance
between demand and supply: (1) Methanation of the produced renewable power
hydrogen with CO2 and subsequent feed-in of the renewable power methane into the
natural gas grid; (2) Direct feed-in of H2 into the natural gas grid with regard to the
maximum allowable H2 concentration; (3) Use of hydrogen from renewable power in a
dedicated infrastructure for applications which require hydrogen, i.e. fuel-cell-based
processes (Schiebahn et al., 2015). Significant drawback of the first two methods are the
low efficiency, increased maintenance cost and decreased life of the equipment.
Moreover, in some cases burning the NG-H2 mixture in turbines causes higher emissions
of pollutants like SO2 and NOx (Barnes and Levine, 2011; Gahleitner, 2013).

5
In the third scenario the hydrogen is used as an intermediate fuel. In such a case the fuel
cells are widely regarded as a key solution for H2-to-electricity conversion systems.
However, this technology involves significant scientific, technological and
socioeconomic barriers to the commercialization of hydrogen and fuel cells as clean
energy technologies of the future. The main obstacles associated with fuel cells that must
be overcome are the high cost and the short life cycle (Edwards et al., 2008). It comes
mainly from the fact that it is almost impossible to run a conventional fuel cell with non-
or low- platinum electrocatalyst due to the extremely slow oxygen reduction reaction
(Shao, 2013). The solution is to increase significantly the latter process.
The BioGenerator is the first biologically based H2-to-electricity conversion system. It is
a promising alternative of the conventional fuel cells, capable to generate successfully
power densities over 1800 W∙m-2 on a laboratory scale (Karamanev et al. 2013). The
BioGenerator is a microbial hydrogen redox flow fuel cell, in the cathode of which the
oxygen reduction is replaced with the reduction of ferric ions which are continuously
regenerated by aerobic oxidation of special types of chemolithoautotrophic and/or
mixotropic microorganisms such as Leptospirillum genus, Ferroplasma genus,
Sulfobacillus genus, Alicyclobacilus, and any combination between them (Hojjati et al.,
2013). Moreover the electrical generation is coupled with the consumption of carbon
dioxide from atmosphere and its transformation to single-cell protein into microbial cells.
In such a case the use of any noble metal catalyst in the cathodic reaction is avoided thus
overcoming the high price as a main obstacle at the commercialization of the fuel cells
6
(Neef, 2009). The inimitable design of the BioGenerator makes it suitable for stationary
applications for smoothing the output of wind and solar power plants. In the light of the
above the BioGenerator seems to offer a sustainable and cost effective solution of the
problems associated with the conventional fuel cells. However, the bottleneck in the
course of commercialization of this technology is to minimize even further the energy
losses of the system. It is unacceptable to generate electricity having high energy losses.
The major energy input, consequently losses of energy are due to the regeneration of the
oxidant, ferric ions in the bioreactor. Supplying the iron oxidizing microorganisms with
substrates, necessary for their normal functioning is performed in a bioreactor, where the
oxygen and carbon dioxide are introduced with air in order to secure suitable conditions
for proper functioning of the microorganisms. That is how the suitable environment for
functioning of the microorganisms is created. Introduction of air to the bioreactor by
aeration is indeed the most energy-consuming process of the entire BioGenerator.
Therefore optimization of the operating conditions in the bioreactor is necessary in order
to minimize the energy requirements of the BioGenerator.
1.2 Objectives In light of the above findings, the main objectives of this work are:
1. To examine the volumetric liquid-phase oxygen mass-transfer coefficient in a
rectangular, split-vessel air-lift reactor (ALR), to be used in the BioGenerator that
meets the unique requirements of this system.

7
2. To study the effects of different gas distributors on the volumetric mass transfer
coefficient, considering the net energy input and the subsequent energy produced
from the BioGenerator.
3. To study the hydrodynamic characteristics, such as the gas holdup and the liquid
circulation time and their effect on the performance characteristics of ALR,
respectively the BioGenerator.
1.3 Thesis Outline Based on the objectives, this thesis is presented in the following chapters as follows:
Chapter 1 is an introduction. It discusses background of the work, and outlines the
objectives of the present study.
Chapter 2 introduces the BioGenerator by discussing its fundamentals, constitutive
components, and involved reactions, and further describes the fundamentals of
bioreactor. Following that, different types of bioreactors are reviewed and appropriate
type is chosen. At the end, methods for determination of volumetric oxygen mass-transfer
coefficient are briefly assessed.
Chapter 3 describes the materials and methods of fabrication, different measurements and
the set up used in the development as well as study of the volumetric oxygen mass-
transfer coefficient and other important characteristics of the bioreactor.

8
Chapter 4 shows the results obtained in this study. It starts with analysing the influence of
a stepwise change of non-aerated-to-aerated cross-sectional areas ratio on the volumetric
oxygen mass-transfer coefficient, gas holdup, liquid velocity, and mean liquid circulation
time. Appropriate approach for determination of the volumetric oxygen mass-transfer
coefficient by investigating the effect of mixing in the bioreactor by measuring levels of
dissolved oxygen in the transverse to velocity vector planes in the system was considered
in that case. In addition, it discusses the effect from decreased liquid level in the system
on volumetric oxygen mass-transfer coefficient obtained. Finally, in this chapter the
effect of using different aerating devices on the hydrodynamic characteristics and energy
performance of BioGenerator are discussed.
Chapter 5 summarizes the conclusions obtained in this study and by providing
recommendations, directs the reader towards future research on the development of
bioreactor for the purposes of BioGenerator.

9
Chapter 2
2 Background and Literature Review
2.1 Ferrous Iron Biooxidation – Principles and Applications As stated in the Introduction, replacing the oxygen at the cathode reaction with ferric ions
and their subsequent regeneration by iron oxidizing microorganisms is the main idea
behind the BioGenerator. The ferrous iron biooxidation (FIB) agents, known better as
iron oxidizing microorganisms (IOMs) comprise a diverse group of prokaryotes. Their
natural habitats are sites where iron and sulphide-containing minerals are exposed to the
atmospheric influence and moisture, such as abandoned and partially flooded coal or
sulphide ore mines, mine tailings (waste from the mining process) unless in extremely
arid climate (Johnson and Hallberg, 2003). However, the process was not recognized as
microbial until the middle of the 20th century when a small rod-shaped Gram-negative
bacterium was discovered in the acid mine drainages (AMD) and linked to the leaching
of the sulphide minerals. The microorganism was called Ferrobacillus ferrooxidans,
synonymous with Thiobacillus ferrooxidans (Silverman and Lundgren, 1959), and
recently reclassified as Acidithiobacillus (At.) ferrooxidans in the year 2000 (Kelly and
Wood 2000). Long time after its discovery At. ferrooxidans was widely considered the
most important IOM. However, lately attention has been shifted to other IOMs, i.e. the
bacteria of genus Leptospirillum (Rawlings et al., 1999) and archaea from the genus
Ferroplasma. The reason is that the sulphide minerals undergo slow abiotic oxidation,
accompanied by acidification of the site once exposed to the atmospheric moisture and

10
oxygen. The conditions for growth of chemolithotrophic microorganisms arise with the
drop of abiotic chemical oxidation rate when the pH drops below 4-3 (Johnson and
Hallberg 2003; Rohwerder et al., 2003). That is, why microorganisms, tolerating lower
pH are preferable. They obtain the necessary energy for their growth in the form of
electrons from biooxidation of the ferrous iron (Eq. 2.1) and oxidation of various
inorganic sulphur compound, such as thiosulfate (Eq. 2.2):
2𝐹𝐹𝑒𝑒2+ + 0.5𝑂𝑂2 + 2𝐻𝐻+ → 2𝐹𝐹𝑒𝑒3+ + 𝐻𝐻2𝑂𝑂 (2.1)
𝑆𝑆2𝑂𝑂32− + 2𝑂𝑂2 + 𝐻𝐻2𝑂𝑂 → 2𝐻𝐻+ + 2𝑆𝑆𝑂𝑂42− (2.2)
The process was used at the second century BC by Chinese, and a few centuries later by
Romans for extraction of dissolved by microorganisms copper from AMDs using
chemical reduction of the copper ion with metallic iron (Ehrlich et al., 2001).The process
is known as “cementation”, and is still one of the most important biohydrometalurgical1
methods for extraction of metals from low grade ores. The method can be used
successfully for pre-treatment of precious metal ores (Olson et al., 2003),
desulphurization of coal and treatment of H2S gases and AMDs (Jordan et al., 1996;
1Biohydrometallurgy is “that branch of biotechnology [which] deals with the study and application of the economic potential of the interactions between the microbial world and the mineral kingdom” (Rossi, 1990).

11
Nemati et al., 1998). Generally novel potential application of the FIB can be found in the
microbial fuel cells (Karamanev et al, 2005). The following section is dedicated to the
BioGenerator – an integrated unit, consisting of a fuel cell and a bioreactor for ferrous
iron biooxidation.
2.2 Fundamentals of the BioGenerator
2.2.1 Idea
The main idea behind the invention of the BioGenerator was to improve sluggish kinetics
associated with the oxygen reduction reaction on the cathode of the most popular proton-
exchange membrane (PEM) hydrogen-oxygen fuel cells. Indeed, the BioGenerator uses
the capability of microorganisms for sustainable regeneration of oxidants employed at the
reduction reaction in fuel cell (Karamanev et al., 2013).
It continuously produces electricity from hydrogen fuel and atmospheric oxygen in a
system, consisting of two major units: a fuel cell and a bioreactor. That is, why it is
considered the first biologically based system for H2-to-electricity conversion, which has
capability to serve as part of the intermediate energy storage in integration of renewable
power to electrical grid.
2.2.2 Structure and reactions
Hydrogen fuel enters the anode compartment of the fuel cell of the BioGenerator, where
it is electrochemically split into protons and electrons through an electrocatalytic
oxidation reaction (Eq. 2.3). Knowing that the electricity is directed flow of electrons,
12
another reaction that consumes these generated electrons has to be run on the other side
of the electrical circuit. The oxidant, ferric ions (Fe3+) consume these electrons at the
cathode and the electromotive force stimulates the anodic reaction to produce more
electrons, which increases the electrical current. In other words in the cathode reaction,
ferric ions accept electrons on the surface of graphite felt (cathode) and are converted to
ferrous ions (Fe2+) (Eq. 2.4). The formed ferrous ions, are recirculated to the bioreactor
with the catholyte (i.e. the solution, which passes through the cathodic compartment),
where through a microbial reaction, are oxidized back into ferric ions, thus completing
the bioregenerative cycle of the oxidant supply to the fuel cell (Eq. 2.5 and Figure 2.1).
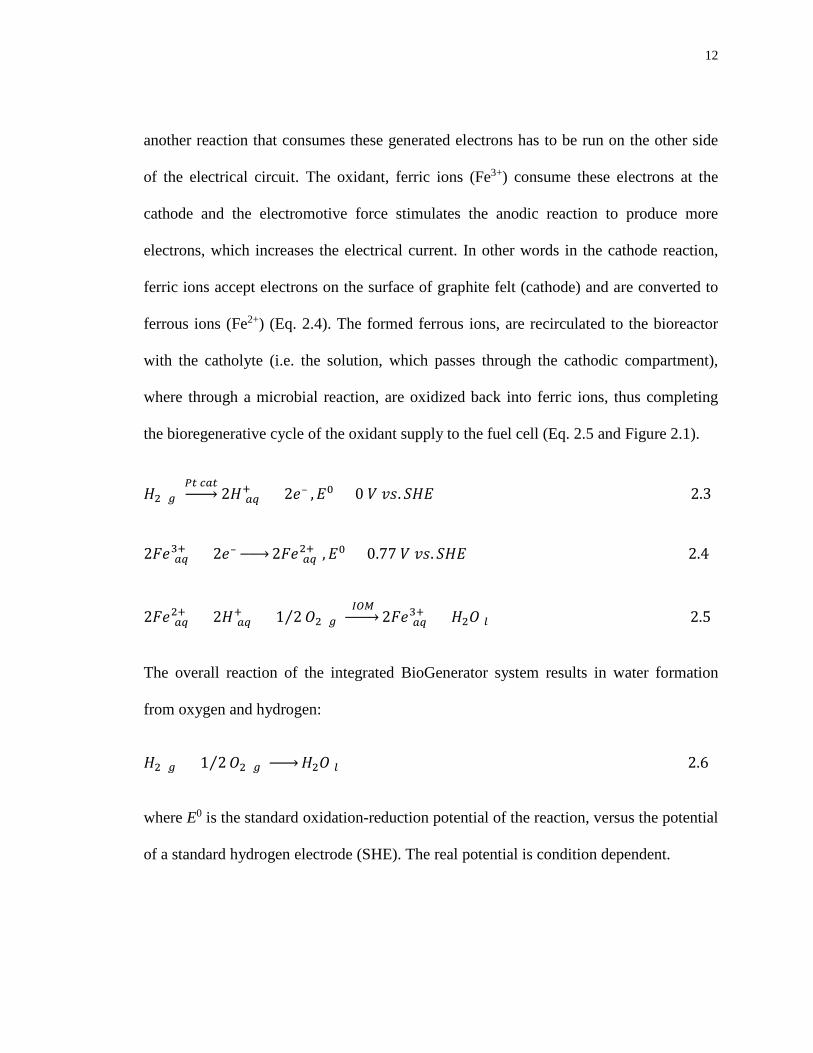
𝐻𝐻2 (𝑔𝑔)𝑃𝑃𝑃𝑃 𝑐𝑐𝑐𝑐𝑃𝑃�⎯⎯� 2𝐻𝐻(𝑐𝑐𝑎𝑎)
+ + 2𝑒𝑒– ,𝐸𝐸0 = 0 𝑉𝑉 𝑣𝑣𝑣𝑣. 𝑆𝑆𝐻𝐻𝐸𝐸 (2.3)
2𝐹𝐹𝑒𝑒(𝑐𝑐𝑎𝑎)3+ + 2𝑒𝑒–
�⎯⎯�2𝐹𝐹𝑒𝑒(𝑐𝑐𝑎𝑎)2+ ,𝐸𝐸0 = 0.77 𝑉𝑉 𝑣𝑣𝑣𝑣. 𝑆𝑆𝐻𝐻𝐸𝐸 (2.4)
2𝐹𝐹𝑒𝑒(𝑐𝑐𝑎𝑎)2+ + 2𝐻𝐻(𝑐𝑐𝑎𝑎)
+ + 1 2⁄ 𝑂𝑂2 (𝑔𝑔) 𝐼𝐼𝐼𝐼𝐼𝐼 �⎯⎯⎯� 2𝐹𝐹𝑒𝑒(𝑐𝑐𝑎𝑎)
3+ + 𝐻𝐻2𝑂𝑂(𝑙𝑙) (2.5)
The overall reaction of the integrated BioGenerator system results in water formation
from oxygen and hydrogen:
𝐻𝐻2 (𝑔𝑔) + 1 2⁄ 𝑂𝑂2 (𝑔𝑔) �⎯⎯�𝐻𝐻2𝑂𝑂(𝑙𝑙) (2.6)
where E0 is the standard oxidation-reduction potential of the reaction, versus the potential
of a standard hydrogen electrode (SHE). The real potential is condition dependent.

13
Figure 2.1 Schematic diagram of the BioGenerator
2.2.3 Bioreactor
According to IUPAC a bioreactor is: “An apparatus used to carry out any kind of
bioprocess; examples include fermenter or enzyme reactor.”. In other words any
manufactured or engineered device or system that supports a biologically active
environment could be named this way. A bioreactor may be a vessel in which a chemical
process, which involves organisms or biochemically active substances derived from such
organisms is carried out. This process can either be aerobic or anaerobic. In most of the
cases these bioreactors are cylindrical, ranging in size from litres to cubic metres. In the
case of tissue engineering or biochemical engineering, a bioreactor refers to a device or
system meant to grow cells, or tissues in the context of cell culture.
14
Based on the mode of operation the bioreactors are classified as batch, fed batch or
continuous. Organisms growing in bioreactors may be free suspended in liquid medium,
or may be attached (immobilized) to the surface of a solid medium. Immobilization can
be applied to various types of bioprocesses, including enzymes, cellular organelles,
microbial, animal and plant cells (Peinado et al., 2006). It is useful in the cases of
continuous modes of operation, since it prevents washing out the microorganisms with
the reactor effluent. However, the main limitation of the method is the restricted active
surface. Suspension bioreactors can use wider variety of organisms, and can operate at
much larger scales than that of immobilized ones. In that case the microorganisms leave
the vessel with the effluent flow.
One of the fastest growing type of bioreactors are the air-lift reactors (ALRs). They have
been gradually entering the industrial biotechnology and different multiphase chemical
processes, because of the improved hydrodynamics and mass transfer performance,
comparing to the traditional stirred-tank vessels and bubble columns (Margaritis and
Sheppard, 1981; Joshi et al., 1990; Schugerl, 1990; Chang et al., 1994; Fontana et al.,
2009). Just like bubble columns they are type of pneumatically agitated reactors (Choi et
al., 1996). According to Merchuk (1990) ALRs can be divided in two main types based
on their structure: (1) internal loop ALRs, in which pertinent baffles are placed in the
reactor, in order to create compartments necessary for circulation, and (2) external loop
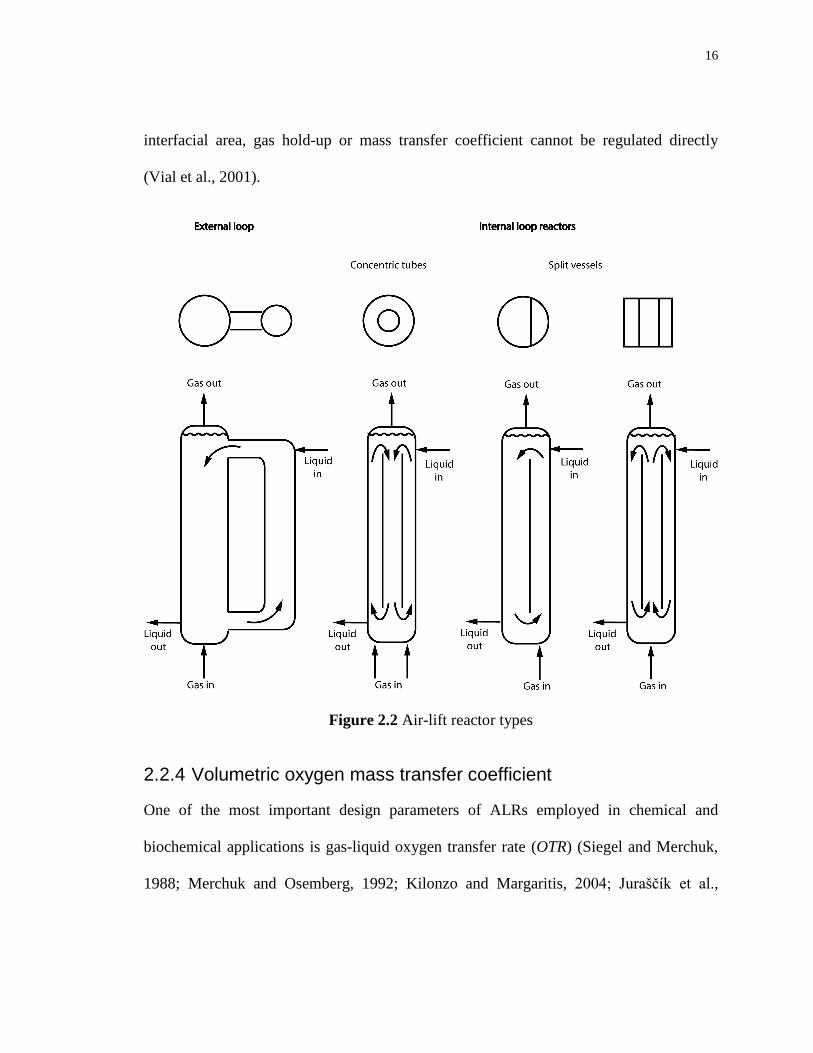
ALRs, where the circulation pattern is through separate and distinct limbs (Figure 2.2).
Further modifications on either type can be performed for purposes of changing direction

15
of the circulation, extent of gas disengagement from the liquid phase and flow rate of the
distinct phases (Margaritis and Sheppard, 1981; Lazarova et al., 1997; Lu et al., 2000).
Regardless of the configuration ALRs have four distinct compartments with different
flow characteristics, which provide different mass and heat transfer, namely: (1) riser; (2)
gas separator; (3) downcomer, and (4) base. Gas is injected at the base of the riser
(aerated zone), where it flows mainly upwards, passes through the top of reactor,
disengaging the part of the gas and entering the downcomer (non-aerated zone) where it
descends to the base. The driving force for the liquid recirculation is the hydrostatic
pressure difference between riser and the downcomer, whereas the resisting force is the
frictional pressure drop around the flow circuit. However, the main feature that
distinguishes an air-lift reactor from a bubble column is the controlled liquid recirculation
through a downcomer after partial or total disengagement of the gas at the top of the
column, whereas the circulation is induced in the system by permanently injecting gas in
the riser, thus creating a net density difference between the riser and downcomer of the
reactor. Amongst the advantages that ALRs offer are: simple construction, absence of
mechanically moving parts, regular fluid flow, good mass transfer properties, high
thermal stability, low energy consumption which determine low building and operation
costs (Majeed and Békásy-Molnár, 1995; Couvert et al., 2004; Winterbottom, 2007).
Despite of the fact that parameters like geometry, type, architecture of the gas distributor,
gas and liquid flow rate can be designed and controlled, another crucial parameters like
16
interfacial area, gas hold-up or mass transfer coefficient cannot be regulated directly
(Vial et al., 2001).
Figure 2.2 Air-lift reactor types
2.2.4 Volumetric oxygen mass transfer coefficient
One of the most important design parameters of ALRs employed in chemical and
biochemical applications is gas-liquid oxygen transfer rate (OTR) (Siegel and Merchuk,
1988; Merchuk and Osemberg, 1992; Kilonzo and Margaritis, 2004; Juraščík et al.,

17
2006). The rate of oxygen transfer from the gas phase to the liquid, the rate at which
oxygen is transported into the cells, and the oxygen uptake rate (OUR) by the
microorganism for growth, maintenance and production determine the dissolved oxygen
concentration in a suspension of aerobic microorganisms. The rate of oxygen
consumption by microorganisms in latter processes is high, compared with the solubility
of oxygen in the media. That is why any interruption in oxygen supply may affect
significantly the process performance, which requires a fairly good estimation of oxygen
mass transfer, especially when reactor design improvement and scale-up are considered
(García-Ochoa and Gómez, 1998; García-Ochoa et al., 2000; Badino et al., 2001; Çalik et
al., 2004; Martin et al., 2004; Puthli et al., 2005; Kocabaş et al., 2006; Liu et al., 2006;
Garcia-Ochoa et al. 2010).
The rate of oxygen concentration change in the liquid phase is related to the volumetric
mass-transfer coefficient (kLa):
𝑑𝑑𝑑𝑑𝑑𝑑𝑑𝑑
= 𝑘𝑘𝐿𝐿𝑎𝑎 · (𝑑𝑑∗ − 𝑑𝑑) − 𝑞𝑞𝐼𝐼2 · 𝑑𝑑𝑋𝑋 = 𝑂𝑂𝑂𝑂𝑂𝑂 − 𝑂𝑂𝑂𝑂𝑂𝑂 (2.7)
where dC/dt is oxygen accumulation rate in the liquid phase, OTR represents the oxygen
transfer rate from the gas to the liquid, and OUR is the oxygen uptake rate in the presence
of microorganisms; the driving force for the oxygen mass transfer is the difference
between C* and C, which are respectively the equilibrium and the available oxygen
concertation in the solution; and, OUR can be expressed as the product between the
18
specific oxygen uptake rate of the microorganisms (𝑞𝑞𝐼𝐼2) and the biomass concentration
(𝑑𝑑𝑋𝑋). Several methods, based on chemical, physical or biological principles, have been
developed for experimental determination of the oxygen transfer rate in bioreactors
(Garcia-Ochoa and Gomez, 2009; Moutafchieva et al., 2013). The first that became
adopted were chemical methods, to which belong Sodium sulfite oxidation method
(Cooper et al., 1944) and Absorption of CO2 proposed by Danckwerts and Gillham
(1966). However, the most commonly used nowadays methods for oxygen transfer
measurement are the physical methods, in particular: Dynamic method (Baird et al., 1993;
Nocentini et al., 1993; García-Ochoa and Gómez, 1998; Sanchez et al., 2000; Clarke et
al., 2006; Zhang et al., 2006) and Gas phase analysis (Van’t Riet, 1979). Other methods
for measuring the volumetric mass transfer coefficient have been also proposed for
improvement some aspects of the classical methods, based on chemical (Ortiz-Ochoa et
al., 2005; Hill, 2006) or physical principles (Gauthier et al.,1991; Pedersen et al., 1994;
Carbajal and Tecante, 2004).
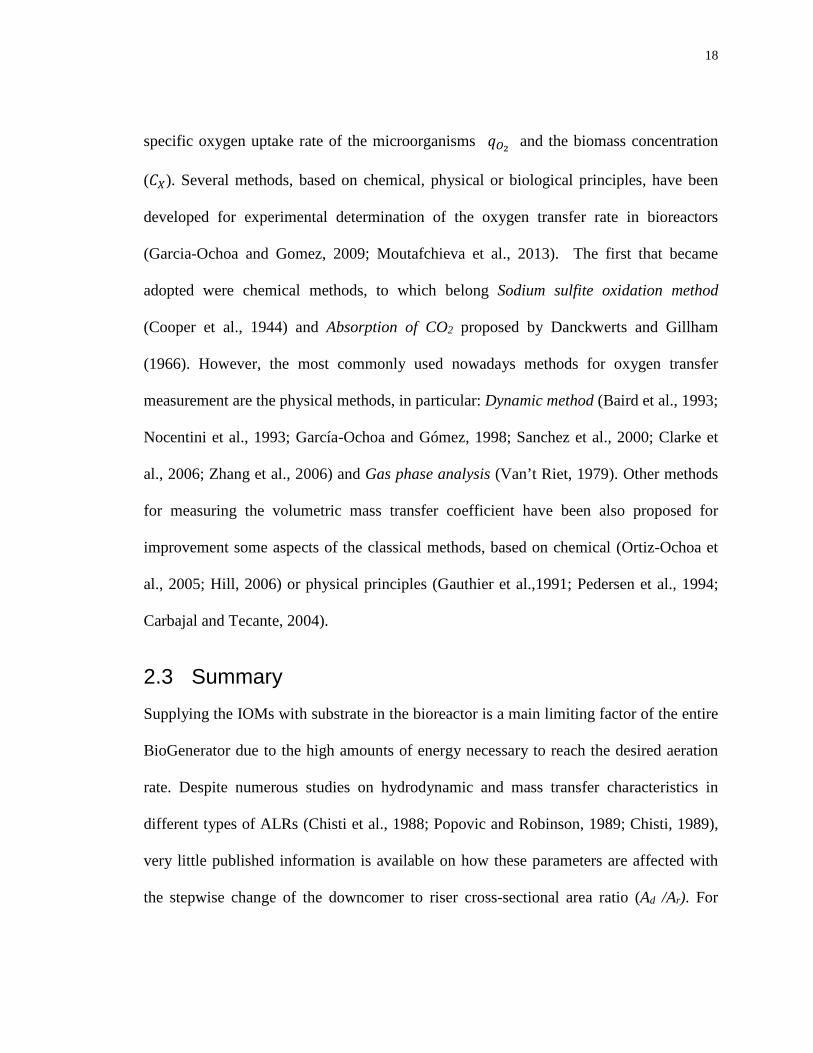
2.3 Summary Supplying the IOMs with substrate in the bioreactor is a main limiting factor of the entire
BioGenerator due to the high amounts of energy necessary to reach the desired aeration
rate. Despite numerous studies on hydrodynamic and mass transfer characteristics in
different types of ALRs (Chisti et al., 1988; Popovic and Robinson, 1989; Chisti, 1989),
very little published information is available on how these parameters are affected with
the stepwise change of the downcomer to riser cross-sectional area ratio (Ad /Ar). For

19
example, some authors report increasing of the overall gas holdup (ɛ) and kLa with
decreasing Ad /Ar (Koide et al., 1983); whereas, others detect the opposite effect (Al-Azzi
and Al-Kuffe, 2010; Sanjari et al., 2014). In all previous studies, experiments were
performed in concentric draft tube air-lift reactors with limited number of Ad /Ar ratios
(maximum of 5), originating from the innate hinders, associated with the cylindrical
cross-sectional area. By contrast, ALRs with rectangular cross-section are more versatile,
and give better performance characteristics for a given oxygen transfer rate (Merchuk and
Gluz, 2002). Moreover big rectangular vessels are usually easier to build than cylindrical
reactors (Couvert et al., 1999; Petersen and Margaritis, 2001). However, even less
attention has been paid for the change of the kLa and hydrodynamic characteristics with
stepwise change of Ad /Ar ratio of rectangular ALRs. Some of the works published are
from Gourich et al., 2006; Siegel and Merchuk, 1988; Tobajas et al., 1999, where the
maximum ratios used were even less (maximum of 3).
In light of the above findings, the aim of this work is to examine the changes of the
volumetric liquid-phase mass-transfer coefficient of oxygen in a rectangular, split-vessel
ALR with gradually changing of the downcomer to riser cross-sectional area ratio at
different aeration flow rates using the dynamic (“gas on, gas off”) method. The effects of
different gas distributors on the volumetric mass transfer coefficient, considering the net
energy input, and hydrodynamic characteristics, such as the gas holdup and the liquid
circulation time were determined.
20
Chapter 3
3 Materials and Methods In the present study, the following design parameters of the air-lift reactor were held
constant: (1) reactor length, width and height; (2) partition board height and distance
from the reactor base, i.e. bottom clearance; (3) air distributor position and height from
the reactor base for a constant ungassed liquid height; (4) liquid height above the partition
board (ht), except for the case when ht was the examined parameter. The following
parameters were varied in the study of the performance characteristics of the air-lift
reactor: (1) ratio of the riser to downcomer areas (Ad/Ar); (2) liquid circulation path
within the air-lift reactor; (3) horizontal position of the dissolved oxygen (DO) probe; (4)
type of the gas-distributor and the orifice size of the air jets (do).
3.1 Reactor The reactor consisted of a poly(methyl methacrylate) (acrylic glass) column (17 mm wall
thickness) with a rectangular cross-section, flat bottom and a total volume of 0.202 m3
(0.300×0.273×2.470 m) (Figure 3.1). Two circular flanges (0.14 m diameter) were
situated on the two opposite walls at 0.110 m from the bottom to their central axes for
servicing the bottom compartment of the reactor, where the gas distributor was fixed.
Through a drilled hole in one of the flanges a flexible tube providing gas for the
distributor was inserted.

21
A partition board made of acrylic glass (0.011×0.273×1.242 m) was fixed in the reactor
in order to separate the column into aerated and non-aerated compartments. The support
for the partition board was secured by six threaded rods made by 316L grade stainless
steel screwed in threaded holes drilled in the board (Figure 3.1 B). Thus, different
positions of the partition board with respect to the vertical walls (different Ad/Ar ratios)
were achieved by screwing (unscrewing) the rods in different directions into the partition
board. The rods were equipped with rubber bushes at each end for a tight grip to the
reactor walls to assure the vertical position of the baffle in the reactor. This way riser-to-
downcomer ratios of 0.2 to 5.0 were achieved (Table 3.1). Separate ports were drilled for
the dissolved oxygen (DO) probe and two pairs of platinum electrodes (1.20 m apart) in
the reactor wall on the downcomer side of the reactor.
All experiments were carried out with deionized (DI) water at room temperature and
atmospheric pressure. A static liquid height of 1.44 m, which gives liquid volume of
114.4 L, was chosen for all the experiments except for one, in which it was decreased to
1.39 m (113.6 L) in order to observe the change in kLa with decreasing the liquid
headspace to 0.05 m above the partition board.
.

22
Figure 3.1 Schematic diagram of the rectangular air-lift reactor, used in the experiment:
(1) column; (2) partition board; (3) gas distributor; (4) manometer; (5) filter; (6)
rotameter; (7) valves; (8) DO probe; (9) Pt-electrodes; (10) threated rod
The distance from the bottom of the reactor to the lower end of the partition board (base)
was chosen to be 0.1 m, the same as the distance from the top of the partition board to the
static liquid height level (Chisti, 1989) for all the experiments, except one in which the
headspace was decreased to 0.05 m, as it was taken into account that at the vast majority
of air-lift designs the bottom connection zone between the riser and downcomer is very
simple and usually not considered to significantly affect the overall reactor behavior
(Merchuk et al. 1996). However, the design of this section can influence gas holdup,
liquid velocity and if applicable- solid phase flow.
23
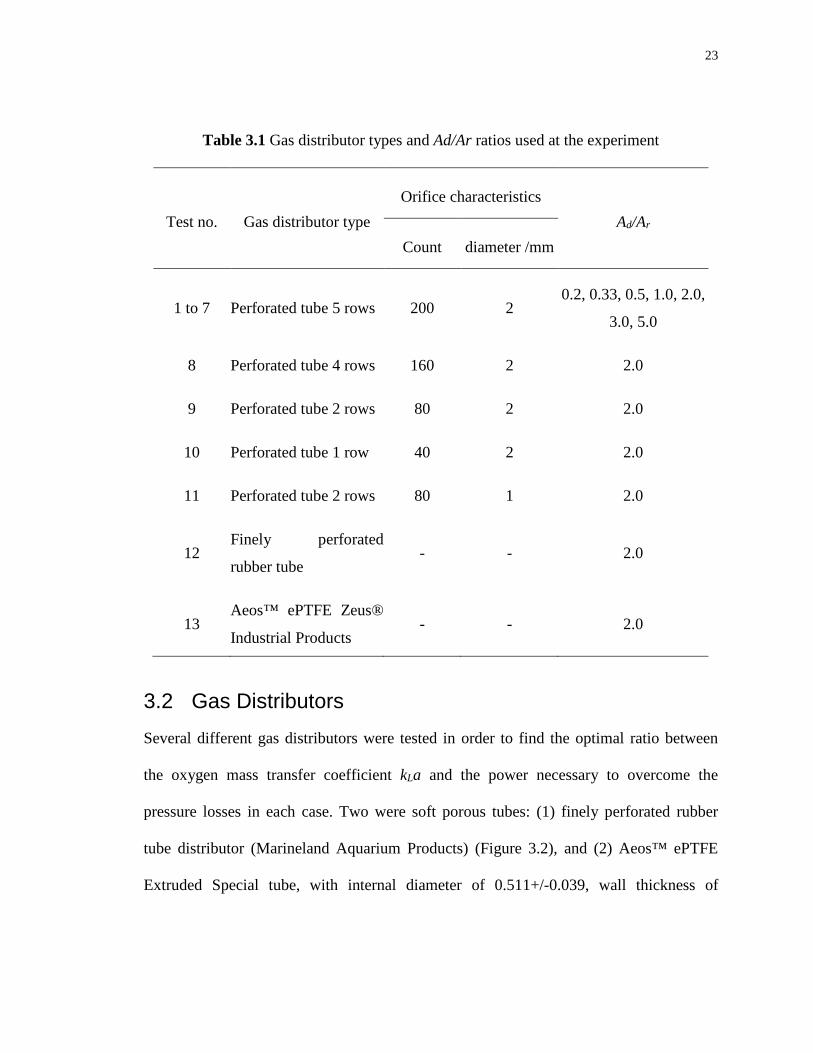
Table 3.1 Gas distributor types and Ad/Ar ratios used at the experiment
Test no. Gas distributor type Orifice characteristics
Ad/Ar
Count diameter /mm
1 to 7 Perforated tube 5 rows 200 2 0.2, 0.33, 0.5, 1.0, 2.0,
3.0, 5.0
8 Perforated tube 4 rows 160 2 2.0
9 Perforated tube 2 rows 80 2 2.0
10 Perforated tube 1 row 40 2 2.0
11 Perforated tube 2 rows 80 1 2.0
12 Finely perforated
rubber tube - - 2.0
13 Aeos™ ePTFE Zeus®
Industrial Products - - 2.0
3.2 Gas Distributors Several different gas distributors were tested in order to find the optimal ratio between
the oxygen mass transfer coefficient kLa and the power necessary to overcome the
pressure losses in each case. Two were soft porous tubes: (1) finely perforated rubber
tube distributor (Marineland Aquarium Products) (Figure 3.2), and (2) Aeos™ ePTFE
Extruded Special tube, with internal diameter of 0.511+/-0.039, wall thickness of

24
0.045+/–0.005, and microporous structure (average area of the pores 6 μm2), made by
expanded polytetrafluoroethylene (PTFE) with 0.28g/cm3 density and 90% porosity by
Zeus® Industrial Products, Inc. (Orangeburg, USA) (Figure 3.3).
Figure 3.2 SEM image of a finely perforated rubber tube distributor (Marineland
Aquarium Products)
The five other distributors were made from rigid PTFE tubes with internal diameter of
5/8″ and a wall thickness of 1/16″. The length of the gas distributors was chosen 230 mm
in order to take up as much of the riser length as it is possible, and the external diameter
was selected the way it fits at the riser compartment, when minimum Ar was used (see
Section 3.1). One row of orifices (2.0 mm diameter, do) with inter-orifice distance of 5.0
mm were drilled at the first one. The number of orifices (no) was 40. The second
distributor had two rows orifices with the same geometry and dimensions as the first one,
angle of 44° between the rows and no of 80. The third gas distributor had two rows of
25
orifices with do of 1 mm at a distance of 5 mm between them and the same angle of 44°
between the rows giving the total number of 80 jets. The last two types of gas distributors
used were respectively with four and five rows orifices with do = 2 mm with 5 mm
distance between the orifices and 44° angle between the rows, assuring a total of 160 and
200 gas jets (Figure 3.4). All the parameters for the used gas distributors are shown in
Table 3.1.
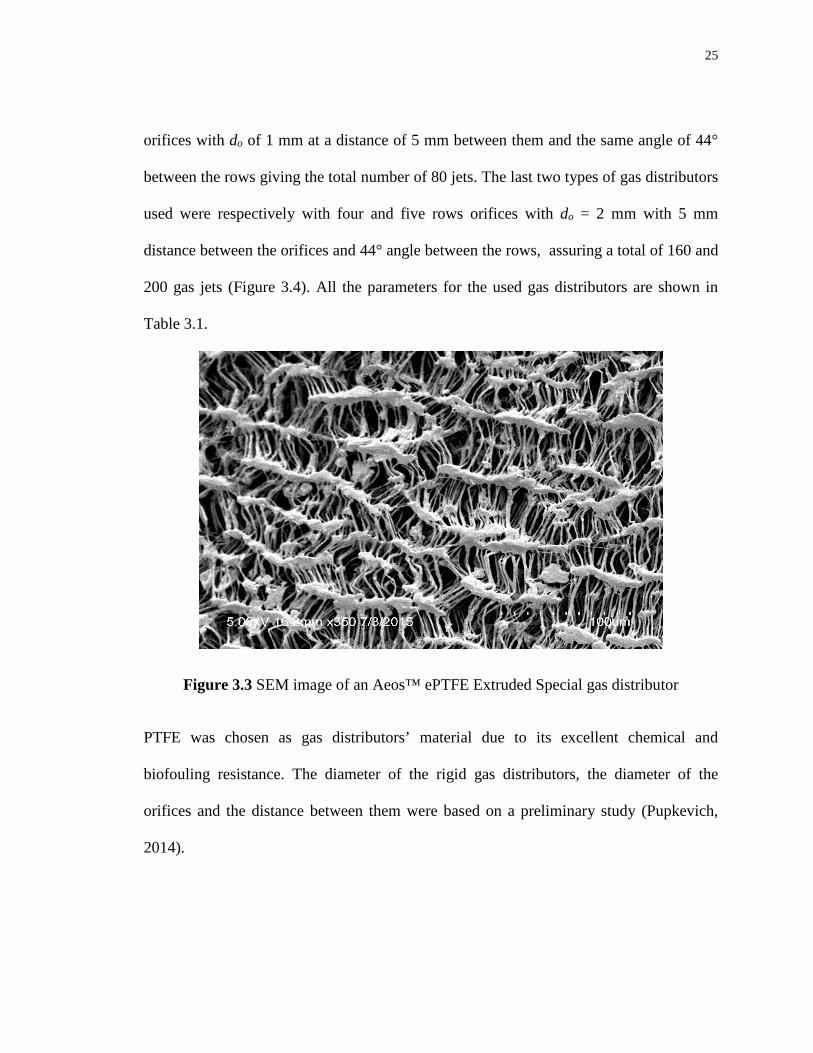
Figure 3.3 SEM image of an Aeos™ ePTFE Extruded Special gas distributor
PTFE was chosen as gas distributors’ material due to its excellent chemical and
biofouling resistance. The diameter of the rigid gas distributors, the diameter of the
orifices and the distance between them were based on a preliminary study (Pupkevich,
2014).

26
Figure 3.4 Schematic diagram of the aerating devices with diameter of orifices 2 mm
consisting of: (A) 40 orifices; (B) 80 orifices; (C) 160 orifices; (D) 200 orifices
3.3 Scanning Electron Microscopy (SEM) Scanning Electron Microscopy (SEM) was the technique used to produce high-resolution
images of a surface of the porous materials used as gas distributors in this study. In SEM
technique the high-powered indirect microscope produces an image by bombarding a
sample with a beam of high-energy electrons. Signals are generated as a result of sample-
electrons interactions containing useful information about the microstructure, surface
morphology orientation of constitutive materials and chemical compositions of the
sample. This information includes surface morphology, chemical composition,
orientation of constitutive materials and chemical compositions (Egerton, 2005). Figure
3.5 shows how a scanning electron microscope works.
27
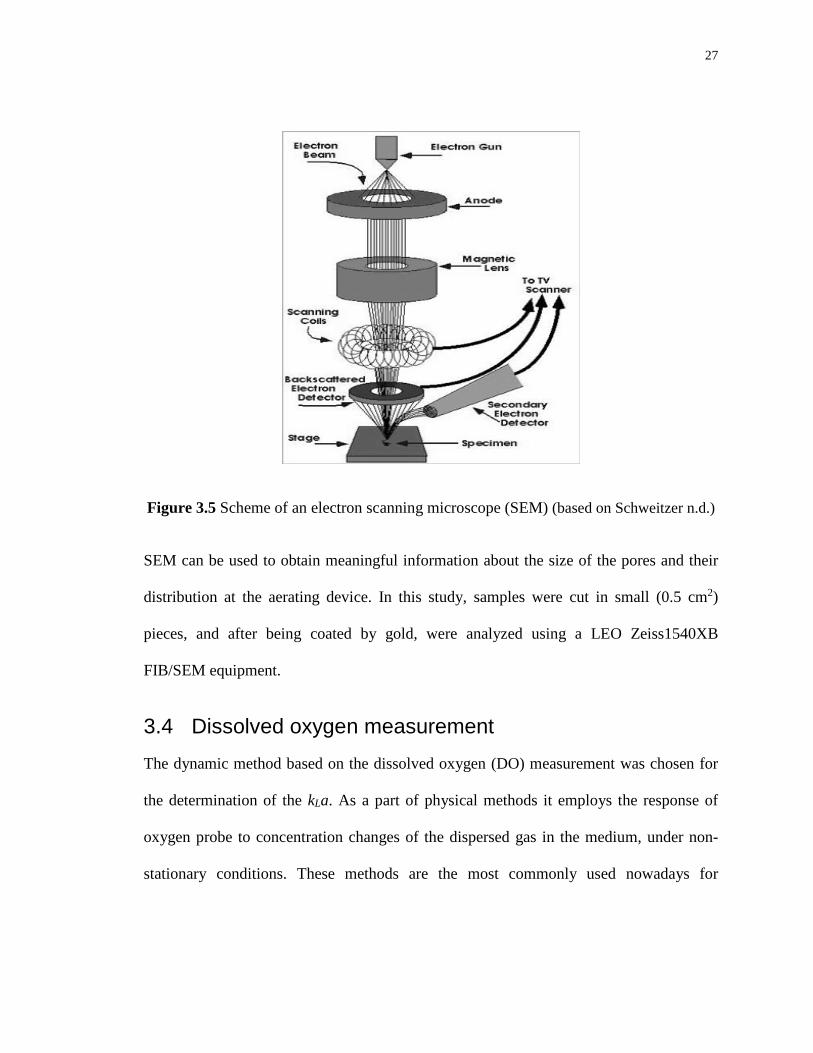
Figure 3.5 Scheme of an electron scanning microscope (SEM) (based on Schweitzer n.d.)
SEM can be used to obtain meaningful information about the size of the pores and their
distribution at the aerating device. In this study, samples were cut in small (0.5 cm2)
pieces, and after being coated by gold, were analyzed using a LEO Zeiss1540XB
FIB/SEM equipment.
3.4 Dissolved oxygen measurement The dynamic method based on the dissolved oxygen (DO) measurement was chosen for
the determination of the kLa. As a part of physical methods it employs the response of
oxygen probe to concentration changes of the dispersed gas in the medium, under non-
stationary conditions. These methods are the most commonly used nowadays for

28
estimation of oxygen transfer, as they are based on the measurement of dissolved oxygen
concentration in the liquid during its absorption or desorption in the solution. The
technique is very convenient for analyzing the influence of operational conditions on the
volumetric mass transfer coefficient, and is well described in the literature ( Baird et al.,
1993; Nocentini et al., 1993; Benyahia and Jones, 1997; García-Ochoa and Gómez, 1998;
Tobajas and García-Calvo, 2000; Sanchez et al., 2000; Clarke et al., 2006; Zhang et al.,
2006). The method consists of continuous measurement of the dissolved oxygen
concentration during its absorption or desorption in the aqueous solution after a step
change in the concentration in the inlet gas (Garcia-Ochoa and Gomez, 2009). (1) The
dynamic technique of desorption includes supplying air in the reactor until the oxygen
saturation concentration in the liquid for the certain conditions is reached. At the next
stage, nitrogen is introduced downwards into the vessel and the decrease of dissolved
oxygen concentration is recorded as a function of time.
(2) The dynamic technique of absorption was used in this study. It incorporates the
elimination of oxygen from the liquid phase of the reactor, for example by bubbling
nitrogen or by the addition of sodium sulfite, until the oxygen concentration in the
solution reaches zero. At the next step, the liquid is put again in contact with air, and the
increase of the oxygen concentration is measured in time as shown in Figure 3.6.

29
Figure 3.6 Schematic diagram, illustrating the change of oxygen concentration in time
when applying the dynamic method of absorption
The experiments in the present work were conducted using DI water in the absence of
microorganisms. In such cases, biochemical reactions do not take place and the Oxygen
Uptake Rate (OUR) expressed by the last term of Eq. (2.7) is equal to zero, and the
oxygen accumulation rate in the liquid phase- dC/dt is represented only by the Oxygen
Transfer Rate (OTR):
𝑑𝑑𝑑𝑑𝑑𝑑𝑑𝑑
= 𝑘𝑘𝐿𝐿𝑎𝑎 · (𝑑𝑑∗ − 𝑑𝑑) = 𝑂𝑂𝑂𝑂𝑂𝑂 (3.1)
At the start of each measurement, nitrogen gas was bubbled trough the liquid until the
oxygen concentration decreased to a reasonable minimum, usually 5-10% of saturation
oxygen concentration. Then, the liquid was put in contact with air bubbles, and the
variation (increase) of the oxygen concentration was measured as a function of time.

30
Seven geometric configurations (i.e. Ad/Ar ratios) were used: 0.2, 0.33, 0.5, 1.0, 2.0, 3.0
and 5.0, each at five different air flow-rates (1.2, 3.0, 3.9, 4.8 and 6.0 m3/h), giving the
total number of 35 sets (Table 3.1, test nos. 1-7). The five air-flow rates correspond to
aeration rates of 0.18, 0.44, 0.57, 0.70 and 0.87 VVM (volume air per volume liquid per
minute), or expressed as effective superficial gas velocity (UG): 0.004, 0.011, 0.014,
0.017 and 0.021 m/s, calculated on the basis of the total reactor cross-sectional area. DO
measurements with the gas distributor consisting of five rows of orifices (see Table 3.1)
were performed with the orifices facing upwards and also, by flipping the distributor,
with the orifices facing downwards. The experiments with all other perforated tube
distributors were performed with the orifices facing downwards for all the latter range of
gas flow rates, using Ad/Ar of 2.0 since highest values of kLa were obtained for that ratio.
The experiments with the porous type gas distributors were performed at the same Ad/Ar
ratio of 2.0. The concentration of the dissolved oxygen in the liquid phase was measured
by an Orion 3 Star DO Benchtop meter (Thermo Fischer Scientific, Waltham MA, USA)
equipped with Orion 081010MD oxygen probe (Figure 3.7). The analog signal was
digitalized and registered by Star Plus Navigator 21TM software. The oxygen probe was
inserted horizontally at 1.1 m from the bottom of the reactor in the downcomer, giving
the response to concentration changes of the dispersed gas in the liquid medium, under
non-stationary conditions (see Figure 3.1). For each Ad/Ar ratio, three different horizontal
positions of the DO probe, relative to the distance between the reactor wall and the

31
partition board in the downcomer, were used: at the reactor wall, 1/4 in, and at the mid-
point (1/2 in) between the reactor wall and the partition board.
Figure 3.7 Orion 3 Star DO Benchtop meter, equipped with Orion 081010MD oxygen
probe
The filling solution of the probe was replaced and the probe was calibrated before every
set of the experiment.
3.5 Determination of kLa The oxygen concentration was recorded as a function of time, and Eq. (2.7) was used
after integration:
𝑙𝑙𝑙𝑙(𝑑𝑑∗ − 𝑑𝑑) = −𝑘𝑘𝐿𝐿𝑎𝑎 · 𝑑𝑑 (3.2)
32
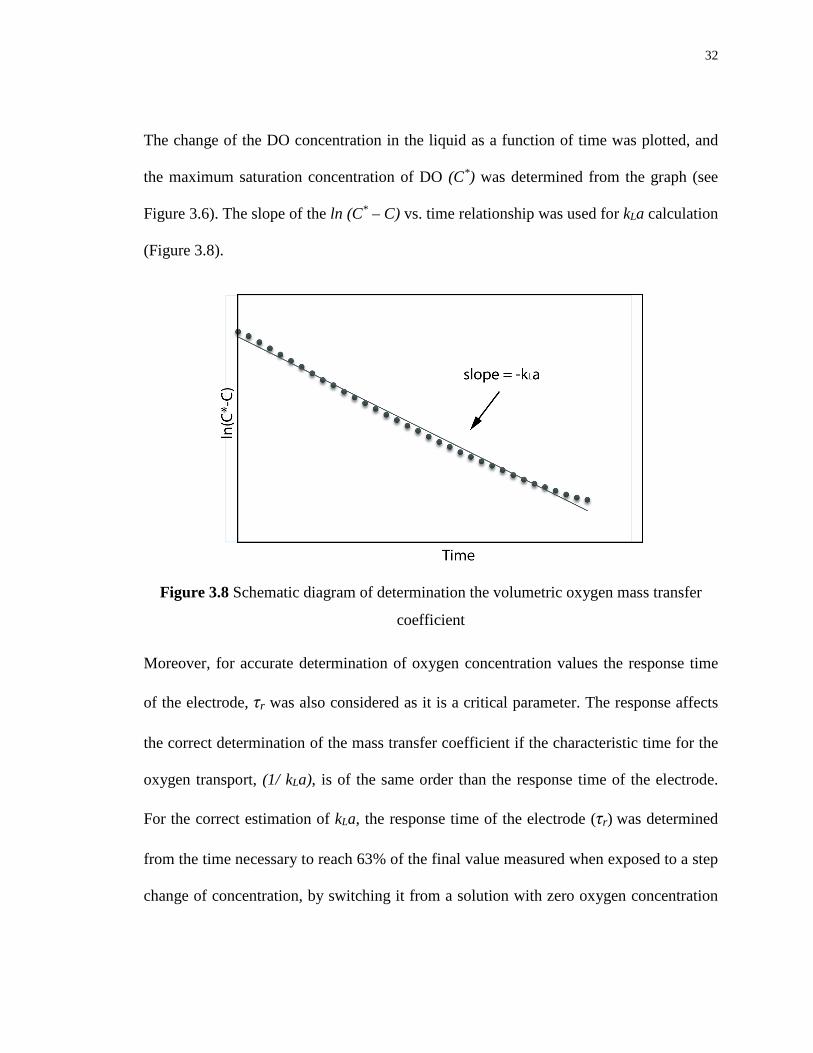
The change of the DO concentration in the liquid as a function of time was plotted, and
the maximum saturation concentration of DO (C*) was determined from the graph (see
Figure 3.6). The slope of the ln (C* – C) vs. time relationship was used for kLa calculation
(Figure 3.8).
Figure 3.8 Schematic diagram of determination the volumetric oxygen mass transfer
coefficient
Moreover, for accurate determination of oxygen concentration values the response time
of the electrode, τr was also considered as it is a critical parameter. The response affects
the correct determination of the mass transfer coefficient if the characteristic time for the
oxygen transport, (1/ kLa), is of the same order than the response time of the electrode.
For the correct estimation of kLa, the response time of the electrode (τr) was determined
from the time necessary to reach 63% of the final value measured when exposed to a step
change of concentration, by switching it from a solution with zero oxygen concentration

33
(1g sodium sulfite and 50 µl cobalt nitrate, as a catalyst in 100 ml of water) to 100%
oxygen saturated solution (Van’t Riet, 1979). It was found that the characteristic time of
the probe was less than 7 s, and therefore τr << (1/ kLa), in such a case according to
Garcia-Ochoa and Gomez (2009) no correction in the response model was needed.
However, in order to avoid any errors due to the response time of the electrode the first
measurement of the DO was registered 30 s after the start of the gassing. For the same
purpose the last 5% of each run was truncated as the error of the difference C* – C (from
which kLa was obtained) became very large at values of C very close to C*.
3.6 Gas Holdup Measurement By definition the gas holdup, known also as gas void fraction is the volume fraction of
gas-phase in the gas-liquid (or slurry) dispersion. The overall gas holdup (ε) refers to the
reactor as a whole:
𝜀𝜀 =𝑉𝑉𝐺𝐺
𝑉𝑉𝐺𝐺 + 𝑉𝑉𝐿𝐿 (3.3)
where VG and VL are, respectively, the volumes of the gas and liquid (or slurry) in the
reactor. In air-lift reactors, the individual riser and downcomer gas holdups, εr and εd,
respectively, can be identified individually and related to the overall holdup.
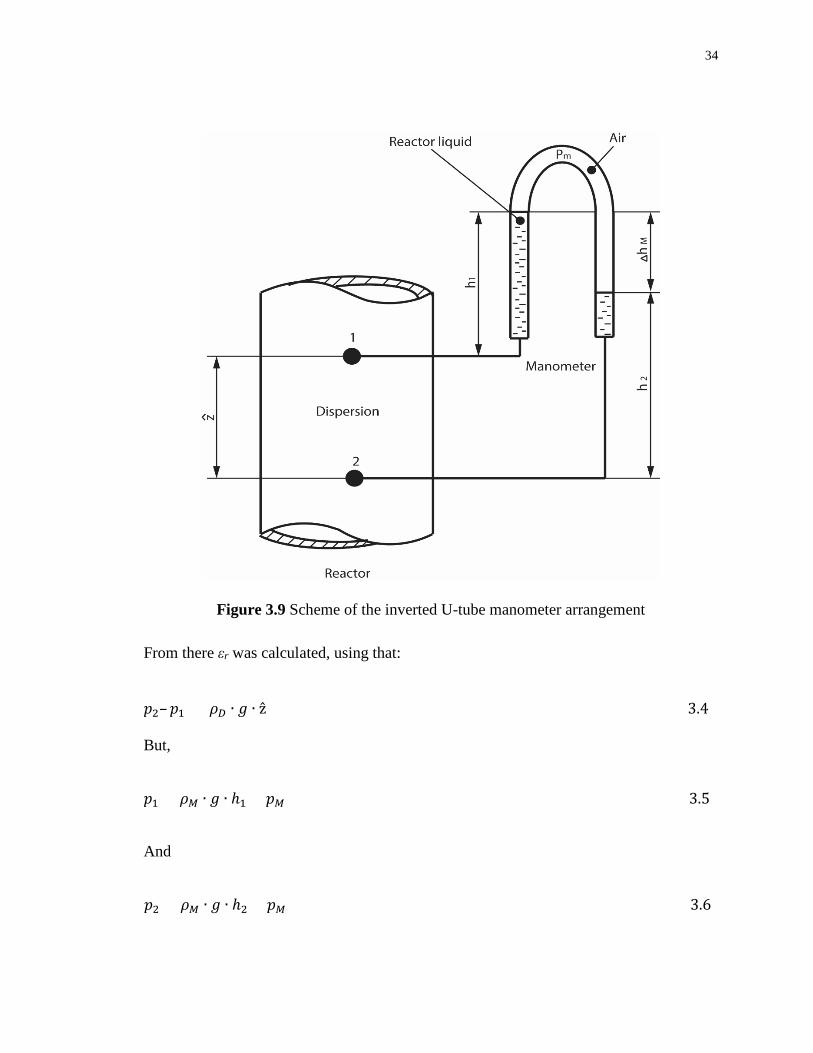
An inverted U-tube manometer was used for calculating the gas hold-up in the riser (εr)
of the air-lift reactor by measuring the pressure difference between two points situated at
1.1 m apart (Figure 3.9).
34
Figure 3.9 Scheme of the inverted U-tube manometer arrangement
From there εr was calculated, using that:
𝑝𝑝2–𝑝𝑝1 = 𝜌𝜌𝐷𝐷 ∙ 𝑔𝑔 ∙ ẑ (3.4)
But,
𝑝𝑝1 = 𝜌𝜌𝐼𝐼 ∙ 𝑔𝑔 ∙ ℎ1 + 𝑝𝑝𝐼𝐼 (3.5)
And
𝑝𝑝2 = 𝜌𝜌𝐼𝐼 ∙ 𝑔𝑔 ∙ ℎ2 + 𝑝𝑝𝐼𝐼 (3.6)

35
Therefore,
𝑝𝑝2–𝑝𝑝1 = 𝜌𝜌𝐼𝐼 ∙ 𝑔𝑔 ∙ (ℎ2– ℎ1) (3.7)
But,
ẑ + ℎ1 = ℎ2 + ∆ℎ𝐼𝐼 (3.8)
Therefore,
ℎ2–ℎ1 = ẑ –∆ℎ𝐼𝐼 (3.9)
The substitution of Eq. 3.9 in Eq. 3.7 leads to
𝑝𝑝2–𝑝𝑝1 = 𝜌𝜌𝐼𝐼 ∙ 𝑔𝑔 ∙ �ẑ –∆ℎ𝐼𝐼� (3.10)
Equating Eq. 3.4 and Eq. 3.10 after subsequent rearrangement yields
𝜌𝜌𝐷𝐷 =𝜌𝜌𝐼𝐼 ∙ (ẑ –∆ℎ𝐼𝐼)
ẑ (3.11)
But,
𝜌𝜌𝐷𝐷 = 𝜌𝜌𝐿𝐿 ∙ (1 − 𝜀𝜀𝑟𝑟) + 𝜌𝜌𝐺𝐺 ∙ 𝜀𝜀𝑟𝑟 (3.12)
From Eq. 3.11 and Eq. 3.12 and the fact that 𝜌𝜌𝐼𝐼 = 𝜌𝜌𝐿𝐿 follows that:
𝜀𝜀𝑟𝑟 =𝜌𝜌𝐿𝐿
𝜌𝜌𝐿𝐿 − 𝜌𝜌𝐺𝐺 ∆ℎ𝐼𝐼ẑ
(3.13)

36
where, p1 and p2 were the pressures at points 1 and 2; pM was the gauge pressure of the
gas used for the manometer (air at atmospheric pressure); g- the gravity acceleration; ρM,
ρD, ρL and ρG were consecutively the densities of liquid in the manometer, gas-liquid
dispersion inside the reactor, liquid and gas used in the experiment; ∆hM was the
difference between the two liquid levels in the inverted U-tube manometer, and ẑ was the
distance between the two measurement points.
Because of the difficulties in measuring the gas hold-up in the downcomer (εd), it was
calculated using the fact that typically the height of the gas-liquid dispersion, hD is equal
at the riser and downcomer:
ℎ𝐷𝐷,𝑟𝑟𝑟𝑟𝑟𝑟𝑟𝑟𝑟𝑟 = ℎ𝐷𝐷,𝑑𝑑𝑑𝑑𝑑𝑑𝑑𝑑𝑐𝑐𝑑𝑑𝑑𝑑𝑟𝑟𝑟𝑟 = ℎ𝐷𝐷 (3.14)
And from the balance equation for the amount of the gas in the reactor:
Total volume of gas in the reactor = Volume of the gas in the riser + Volume of the gas
in the downcomer, or:
𝑉𝑉𝐷𝐷 ∙ 𝜀𝜀 = 𝑉𝑉𝐷𝐷𝑟𝑟 ∙ 𝜀𝜀𝑟𝑟 + 𝑉𝑉𝐷𝐷𝑑𝑑 ∙ 𝜀𝜀𝑑𝑑 (3.15)
Which for reactors with the uniform cross-sections of the riser and the downcomer can be
written as:
ℎ𝐷𝐷 ∙ (𝐴𝐴𝑟𝑟 + 𝐴𝐴𝑑𝑑) ∙ 𝜀𝜀 = ℎ𝐷𝐷 ∙ 𝐴𝐴𝑟𝑟 ∙ 𝜀𝜀𝑟𝑟 + ℎ𝐷𝐷 ∙ 𝐴𝐴𝑑𝑑 ∙ 𝜀𝜀𝑑𝑑 (3.16)
37
Then the riser and downcomer gas hold-ups, εr and εd were related to the overall holdup
by:
𝜀𝜀 =𝐴𝐴𝑟𝑟𝜀𝜀𝑟𝑟 + 𝐴𝐴𝑑𝑑𝜀𝜀𝑑𝑑𝐴𝐴𝑟𝑟 + 𝐴𝐴𝑑𝑑
(3.17)
3.7 Liquid Velocity and Mean Circulation Time The flow rate of liquid in the downcomer was determined by a tracer technique. A pulse
of 0.2 L of saturated sodium chloride solution was poured quickly at the top of the riser.
The conductivity was followed at downstream locations by two pairs of Pt-electrodes
placed 1.2 m vertically apart in the downcomer. Their signals were recorded
simultaneously at a frequency of 10 Hz. Multifunction Data Acquisition (DAQ) NI USB-
6000; 10 kS/s; 12-bit resolution and NI-DAQMX software (NI SignalExpress 2014) by
National Instruments (Austin, Texas, USA) were used for the data acquisition. The Pt-
electrodes, were connected in 2 parallel electrical circuits to external power supply,
generating 5V DC. In both of the parallel circuits 2.2 kΩ resistors (R1 and R2) were
connected in series and the voltage around each of them was registered from the DAQ
(Figure 3.10). Pouring the sodium chloride solution in the reactor induced
electrochemical reaction of electrolyte dissociation (Eq. 3.18 and Eq. 3.19) between each
pair of electrodes, increasing electrical conductivity at each circuit. An increase of the
electrical current between positive and negative electrode of the first pair, and after
certain time at the second pair of electrodes was registered by measuring the voltage drop
around the resistors.

38
𝑁𝑁𝑎𝑎𝑑𝑑𝑙𝑙(𝑟𝑟)𝐻𝐻2𝐼𝐼(𝑙𝑙)�⎯⎯�𝑁𝑁𝑎𝑎𝑑𝑑𝑙𝑙(𝑐𝑐𝑎𝑎) (3.18)
𝑁𝑁𝑎𝑎𝑑𝑑𝑙𝑙(𝑐𝑐𝑎𝑎)𝐻𝐻2𝐼𝐼(𝑙𝑙)�⎯⎯�𝑁𝑁𝑎𝑎(𝑐𝑐𝑎𝑎)
+ + 𝑑𝑑𝑙𝑙(𝑐𝑐𝑎𝑎)− (3.19)
Figure 3.10 Scheme of the liquid velocity measurement arrangement
From the difference between the first moments of the two conductivity signals, i.e.
triggering of the picks (Figure 3.11), and the distance between the electrodes the liquid
velocity in the downcomer (vLd) was calculated:
𝑣𝑣𝐿𝐿𝑑𝑑 =ℎ𝑟𝑟𝑙𝑙𝑟𝑟𝑐𝑐𝑃𝑃𝑟𝑟𝑑𝑑𝑑𝑑𝑟𝑟𝑑𝑑𝑝𝑝𝑟𝑟𝑐𝑐𝑝𝑝𝑟𝑟
(3.20)
where h represents the distance between two couples of electrodes, and t is the time
between two peaks.
39
Figure 3.11 Typical response of the Pt-electrodes to pulse input of tracer the air-lift
reactor. The red curve corresponds to the signal from the first couple of electrodes,
whereas the white shows the respond from the second couple
The superficial liquid velocity in the riser (ULr) and the mean circulation time (tc) in the
reactor were calculated using the relationships:
𝑣𝑣𝐿𝐿𝑟𝑟 = 𝑣𝑣𝐿𝐿𝑑𝑑𝐴𝐴𝑑𝑑(1 − 𝜀𝜀𝑑𝑑)𝐴𝐴𝑟𝑟(1 − 𝜀𝜀𝑟𝑟) (3.21)
𝑣𝑣𝐿𝐿𝑟𝑟 =𝑂𝑂𝐿𝐿𝑟𝑟
1 − 𝜀𝜀𝑟𝑟 (3.22)
40
𝑑𝑑𝑐𝑐 =𝐿𝐿𝑟𝑟𝑂𝑂𝐿𝐿𝑟𝑟
+𝐿𝐿𝑑𝑑𝑂𝑂𝐿𝐿𝑑𝑑
(3.23)
where vLr was the liquid velocity in the riser, Lr and Ld were respectively the length of the
riser and downcomer.
3.8 Error Analysis To estimate the error of the measurements, used in this study statistical analysis based on
the line error were performed after each set of experiments for kLa determination. For the
experiments, giving the highest statistical error (highest Ugr used) (see Section 3.4), five
repetitive determinations of the measured value were performed at Ad/Ar of 2.0 while
keeping the other parameters of the system constant. This way the error of the method
was defined. For correct estimation of the gas holdup, ɛ the number six measurements-
were performed also at each Ugr.
The (sample) standard deviation was calculated using:
𝑣𝑣 = �1
𝑁𝑁 − 1�(𝑥𝑥𝑟𝑟 − x�𝑁𝑁
𝑟𝑟=1
)2 (3.24)
where x1, x2,…, xN denote all N values from a population, and x̄ is the mean of the
sample.
Then the standard error was determined by:
41
𝑆𝑆𝐸𝐸x� =𝑣𝑣√𝑁𝑁
(3.25)
Finally the approximate confidence intervals for the mean was calculated:
Upper 95% limit = x̄ + (SE ∙ 1.96), and
Lower 95% limit = x̄ – (SE ·1.96) (3.26)

42
Chapter 4
4 Results and Discussion
4.1 Outlook The performance of air-lift reactor is highly dependent on its internal configuration, the
type of the aerating device used, consecutively the different gas and liquid flow patterns,
physical properties of the gas and liquid, and the operational conditions which determine
the reactor hydrodynamic characteristics (Figure 4.1).
Figure 4.1 Dependence of oxygen transfer rate (OTR) on volumetric mass transfer
coefficient and hydrodynamic parameters in bioreactors (based on Garcia-Ochoa and
Gomez, 2009)
43
In the case of a typical aeration process, the oxygen is transferred from a rising gas
bubble to bulk liquid. In absence of biomass the oxygen is transferred from the interior of
the bubble and gas film, then it moves across the gas–liquid interface diffuses through the
relatively stagnant liquid film surrounding the bubble and finally it is transported to the
bulk liquid (Figure 4.2). The liquid film resistance (1/kL) around bubbles usually control
the overall transfer rate. The simplest and most used theory for gas–liquid mass transfer
is the two film model (Whitman, 1923), describing the flux through gas and liquid film as
the product of the driving force by the mass transfer coefficient, according to:
𝐽𝐽𝑑𝑑 = 𝐾𝐾𝐺𝐺 ∙ (𝑝𝑝𝐺𝐺 − 𝑝𝑝∗) = 𝐾𝐾𝐿𝐿 ∙ (𝑑𝑑∗ − 𝑑𝑑𝐿𝐿) (4.1)
and the oxygen mass transfer rate per unit of reactor volume, NO2, is obtained multiplying
the overall flux by the gas–liquid interfacial area per unit of liquid volume, a:
𝑁𝑁𝐼𝐼2 = 𝐽𝐽𝑑𝑑 ∙ 𝑎𝑎 = 𝑘𝑘𝐿𝐿𝑎𝑎 ∙ (𝑑𝑑∗ − 𝑑𝑑𝐿𝐿) (4.2)
Because it is difficult to measure kL and a separately, usually the product kLa is measured
and this parameter, called volumetric mass transfer coefficient, characterizes the transport
from gas to liquid.
As it was mentioned above the oxygen mass transfer is one of the most important design
parameters of gas–liquid (–solid) reactors employed for chemical and biochemical
applications, as any scarcity of oxygen may affect significantly the process performance.
That is why the correct determination of the oxygen mass transfer coefficient plays
44
crucial role for reactor design and scale up. An ideal reactor should have an efficient
mixing giving a maximum transfer rate, at a minimum energy input (Gaddis, 1999;
Gogate and Pandit, 1999; Rainer, 1990). This puts even more significance if one consider
the BioGenerator, where the main point is electricity generation. Considering this, the
maximum energy efficiency of the bioreactor, accounting for the main energy
consumption in the system is essential. In other words, in case that the aim of the system
is to produce energy; any undue energy losses bring negative effect on the system
performance.
Figure 4.2 Steps and resistances for oxygen transfer from gas bubble to bulk liquid at the
absence of living organisms: (1) transfer from the interior of the bubble and gas film; (2)
movement across the gas–liquid interface; (3) diffusion through the relatively stagnant
liquid film surrounding the bubble; (4) transport through the bulk liquid

45
In bioreactor, both the oxidant (O2) and liquid (H2O) are fluids under standard conditions.
The solubility of the oxygen in water is only about 8.4 mg/L at 24o C. This dissolved
oxygen has to be maintained at the maximum level in the bioreactor, where it is
consumed during the respiration process of the microorganisms. That brings the necessity
of more air bubbles with smaller diameter to be produced at the aerating device, giving
higher gas-liquid interfacial area (a), thus increasing the overall volumetric mass transfer
coefficient (kLa). The latter can be achieved using the huge variety of micro-porous
materials developed nowadays. This sounds promising when dealing with big batches of
products having high final price (i.e. medicine, food industry). However, there is one big
difference; this solution may not be viable in the case of BioGenerator where the energy
used for aeration has to be minimized. There is a tradeoff between the performance and
energy efficiency. In other words, not all the changes targeted to increase the
performance, i.e. the rate of oxygen mass transfer, can enhance the cost price of the
product, in this case- electrical energy.
Another factor to be considered for system optimization is the capital cost of the
BioGenerator system. It comes from the fact that the BioGenerator requires large
volumes of the ALR and non-conventional materials for its components (Pupkevich,
2014). Based on the latter, the rectangular shape of the bioreactor is preferable due to the
simplicity of its construction. Although it has some disadvantages originating from the
presence of eventual dead zones it suits very well on the specifics of the BioGenerator
system. Moreover, such a geometry facilitates servicing and maintenance of the reactor.

46
Nonetheless, the rectangular shape of the bioreactor gives us practically unlimited
number of ratios between aerated and non-aerated compartment of the ALR.
Last but not least, using rectangular vessel reveals one big advantage: in general, the
concentric draft tube design differs significantly from the rectangular split vessel one. If
one assume that the annular section of the draught tube reactor is the downcomer, one can
define the “width” of the downcomer as the distance between the external wall and the
draught tube, Wd and the “width” of the riser as the diameter of the draught tube, Wr,
whereas for the rectangular airlift, the widths of the riser and the downcomer are the
distances between the partition board and the opposing external walls of the reactor.
Comparing the ratio of width of downcomer to riser, Wd/Wr for a rectangular split-vessel
and a concentric draught tube ALRs shows that for rectangular apparatus Ad/Ar = Wd/Wr,
which is not the case when using concentric draught tubes, where
𝐴𝐴𝑑𝑑𝐴𝐴𝑟𝑟
= (𝑊𝑊𝑑𝑑+𝑊𝑊𝑟𝑟)2
𝑊𝑊𝑟𝑟2 − 1. For example, for Ad/Ar of 5, in the rectangular ALR, Wd/Wr is
5:1. However, for the same Ad/Ar ratio, Wd/Wr for a concentric tube airlift is 1.45:1 as it
can be seen from Figure 4.3. From that can be concluded that the at the same Ad/Ar ratio
rectangular split vessel ALRs provide wider channel for one of the compartments (i.e.
downcomer), than the concentric draught tubes ALRs (Figure 4.4), which helps to avoid
the wall effects, and as can be seen further in this chapter improves the mass transfer and
hydrodynamic limitations coming from narrowing the downcomer.

47
Figure 4.3 Relationship between cross-sectional area ratio and the width of the liquid
flow channels ratio for rectangular split-vessel and concentric draught tube air-lift
reactors with the equal reactor cross-sectional areas
Figure 4.4 Schematic diagram of the concentric draught tube (left-hand side) and
rectangular split-vessel ALRs with equal cross-sectional areas at the same Ad/Ar ratio
0.00
1.00
2.00
3.00
4.00
5.00
6.00
0 1 2 3 4 5 6
Wd/
Wr
Ad/Ar
Rectangular ALRDraught tube ALR

48
The BioGenerator, in particular, experiences difficulties for assuring sufficient aeration in
the bioreactor, necessary for the aerobic respiration of the iron oxidizing microorganisms
(IOM) at low energy input. Due to the simplicity and versatility of the latter described
construction of the ALR used in this study, oxygen mass transfer, hydrodynamic
characteristics, and energy requirements of the system can be extensively investigated.
As mentioned earlier, the main factors on which depend the desired performance of the
ALR are: (1) the internal configuration of the air-lift; (2) the type and geometry of the
aerating device used; and (3) the energy input into the air-lift. Based on the above, in this
chapter, the main goal was to enhance the oxygen mass transfer and minimize the energy
losses. Therefore, the following steps and experiments were implemented and comprise
the content of this chapter:
• The importance of DO probe placement in the depth of the reactor was examined
for correct determination of the kLa in the ALR and the factors causing different
measurement results were investigated to find the most reliable result.
• The results of the different orientation of the apertures of the aerating device was
compared, and the higher kLa resulting from the both cases: (1) jets running
upwards and (2) jets running upwards was determined.
• The effect of variety of Ad/Ar ratios on kLa was explored, and based on that best
position of the partition board inside the reactor was established.

49
• Using the results from the above experiments, an empirical model, describing the
system behavior at different flow rates was developed giving the relation between
Ad/Ar ratio and kLa for each case.
• The influence of the decreased liquid headspace above the partition board was
estimated.
• Comparison of different types of aerating devices was performed based on the
aeration rates achieved; further the pressure drop of each of the aerating devices
was measured and compared with the corresponding aeration rate in order to find
the best solution for the studied system.
• The dependence of the gas holdup- ɛ on kLa was studied.
• In order to better understand the hydrodynamic behavior of the system, the
obtained results for kLa were compared with the liquid circulation times for Ad/Ar
ratios used.
4.2 Influence of the DO Probe Position on kLa Determination
Considering that the volumetric mass transfer coefficient is a global characteristic of the
reactor, its determination should be independent on the position of the DO probe.
However, the data presented in Figure 4.5 shows clear dependence of measured kLa value
on the position of the DO probe relative to the width of the downcomer. The effect can be
seen in all cases, but is most obvious at the lower aeration rates used (1.2, 3.0 and 3.9
m3/h). This difference was found to be most prominent for the value of Ad/Ar of 2.0 for

50
each position of the DO probe, whereas the difference between the results obtained at all
the three different positions of the probe was found to diminish at the lower Ad/Ar ratios
(left hand side of Figure 4.5). The latter behavior could be explained with the different
flow regimes that occurred at the adjacent vertical planes of the downcomer, more
distinctly with increasing of the downcomer cross-sectional area. It can be deduced that
there is insufficient mixing in the downcomer, particularly near the walls of the reactor,
and attention should be paid when comparing kLa results for different systems and/or
conditions. Assuming that best mixing is achieved in the zones farthest from the walls of
the non-aerated compartment, in the following sections we have considered only the kLa
measured at the center (“1/2 in”) of the downcomer. Thus the better mixing at the areas
close to the geometrical center of the non-aerated compartment was defined, comparing
to the areas closer to the walls due to different liquid flow formations (e.g. swirls and
eddies) away from the center. To estimate the error of the method, six experiments at QG
= 6 m3/h and Ad/Ar = 2.0 were performed, giving a standard deviation (s) of 11.8%, with
a 95%-confidence interval of +/-10.4%.

51
(a)
(b)
Figure 4.5 Typical response of the DO probe, inserted at different horizontal positions in
the downcomer with the gradually change of the Ad/Ar ratio at 4.8 m3/h (0.017VVM)
using an aerating device with 200 orifices, (a) for the orifices facing upwards, (b) for the
orifices facing downwards
0
20
40
60
80
100
120
0 1 2 3 4 5 6
k La,
h-1
Ad/Ar
1/2 in1/4 inat the wall
0
20
40
60
80
100
120
140
0 1 2 3 4 5 6
k La,
h-1
Ad/Ar
1/2 in1/4 inat the wall

52
4.3 Effect of the Ad/Ar Ratio on kLa The influence of Ad/Ar ratio on the volumetric mass-transfer coefficient was observed
with gradual change the proportion of non-aerated to aerated compartment of the reactor.
In contrast to previous works reporting a limited number of Ad/Ar ratios (maximum 5)
using concentric draught tube ALR (Al-Azzi and Al-Kuffe, 2010; Chisti et al., 1988;
Onken and Weiland, 1980), the design of our reactor allowed virtually unlimited number
of Ad/Ar ratios giving the complete picture for the effect of that parameter (see Section
4.1). A maximum of nine Ad/Ar ratios were used it this work, spanning between 0.2 and
5.0. Summarized information about change of the kLa with Ad/Ar ratio for the different
values of UG is given in Figure 4.6. Additional confirmation for the influence of Ad/Ar
ratio can be observed at Figure 4.5 and Figure 4.7. It can be seen that systematically
higher values of kLa were obtained at Ad/Ar of 0.5 and 2.0 with a distinct maximum at
Ad/Ar = 2.0 for all values of UG used. This finding contradicts the results obtained by
Tobajas, Siegel, and Apitz (1999), that the downcomer to riser cross-sectional area ratio
exhibits only a slight influence on kLa. However, in the latter study experiments were
conducted over a limited range of downcomer to riser cross-sectional area ratios (Ad/Ar =
0.65 to 1.0), using concentric draught tube ALR which does not describe completely the
behavior of system used.

53
(a)
(b)
Figure 4.6 Variations of the oxygen mass-transfer coefficient at the same position of the
probe with the change of the non-aerated to aerated surface areas ratio at the different
superficial gas velocities in the riser using an aerating device with 200 orifices, (a) for the
orifices facing upwards, (b) for the orifices facing downwards
0
20
40
60
80
100
120
140
160
0 1 2 3 4 5 6
kLa
(h-1
)
Ad/Ar
UG = 0.021UG = 0.017UG = 0.014UG = 0.011UG = 0.004
0
20
40
60
80
100
120
140
160
0 1 2 3 4 5 6
kLa
(h-1
)
Ad/Ar
UG = 0.021UG = 0.017UG = 0.014UG = 0.011UG = 0.004

54
4.4 Effect of the Orifices Orientation of the Aerating Device on kLa
In some industrial reactors the orifices of the aerating device are facing downwards in
order to avoid filling the aerating device with liquid, which may affect the gas bubble
distribution. For that reason we compared the characteristics of the air-lift reactor when
the aeration orifices were facing upwards and downwards. Figure 4.5, 4.6 and 4.7 show
that in the case of the gas distributor with orifices facing downwards the resulting values
for kLa were about 13% higher than when the orifices face upwards, for the whole range
of the air flow-rates used. The maximum kLa obtained was 146 h-1, as shown at Figure
4.6-b, for orifices facing downwards at Ad/Ar = 2. The higher kLa, obtained with the
aerating device with orifices facing downwards could be explained by better mixing at
the dead zones around the bottom corners of the reactor. In this case, the air-jets formed
at the aerating device are running downwards, and with increasing UG the mixing
improves. That is why the results for the kLa obtained with this type of aerating device
with orifices facing downwards were chosen to compare with other types of aerating
devices in the following experiments.
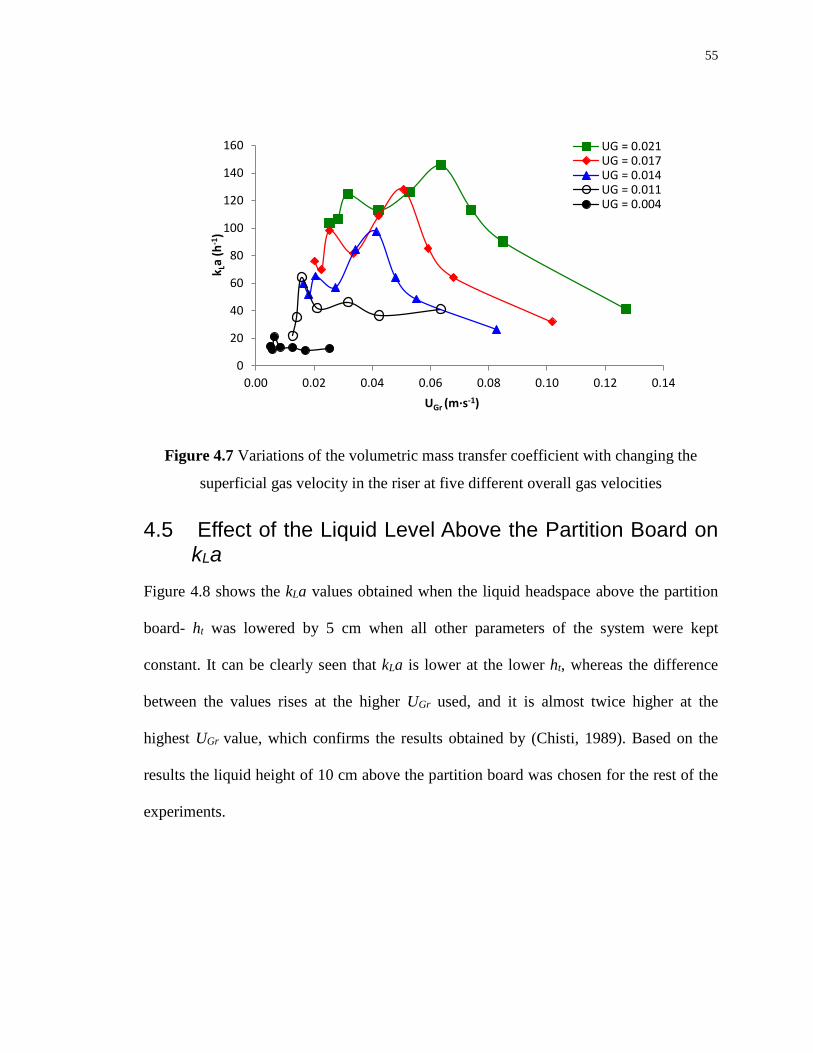
55
Figure 4.7 Variations of the volumetric mass transfer coefficient with changing the
superficial gas velocity in the riser at five different overall gas velocities
4.5 Effect of the Liquid Level Above the Partition Board on kLa
Figure 4.8 shows the kLa values obtained when the liquid headspace above the partition
board- ht was lowered by 5 cm when all other parameters of the system were kept
constant. It can be clearly seen that kLa is lower at the lower ht, whereas the difference
between the values rises at the higher UGr used, and it is almost twice higher at the
highest UGr value, which confirms the results obtained by (Chisti, 1989). Based on the
results the liquid height of 10 cm above the partition board was chosen for the rest of the
experiments.
0
20
40
60
80
100
120
140
160
0.00 0.02 0.04 0.06 0.08 0.10 0.12 0.14
k La
(h-1
)
UGr (m·s-1)
UG = 0.021UG = 0.017UG = 0.014UG = 0.011UG = 0.004
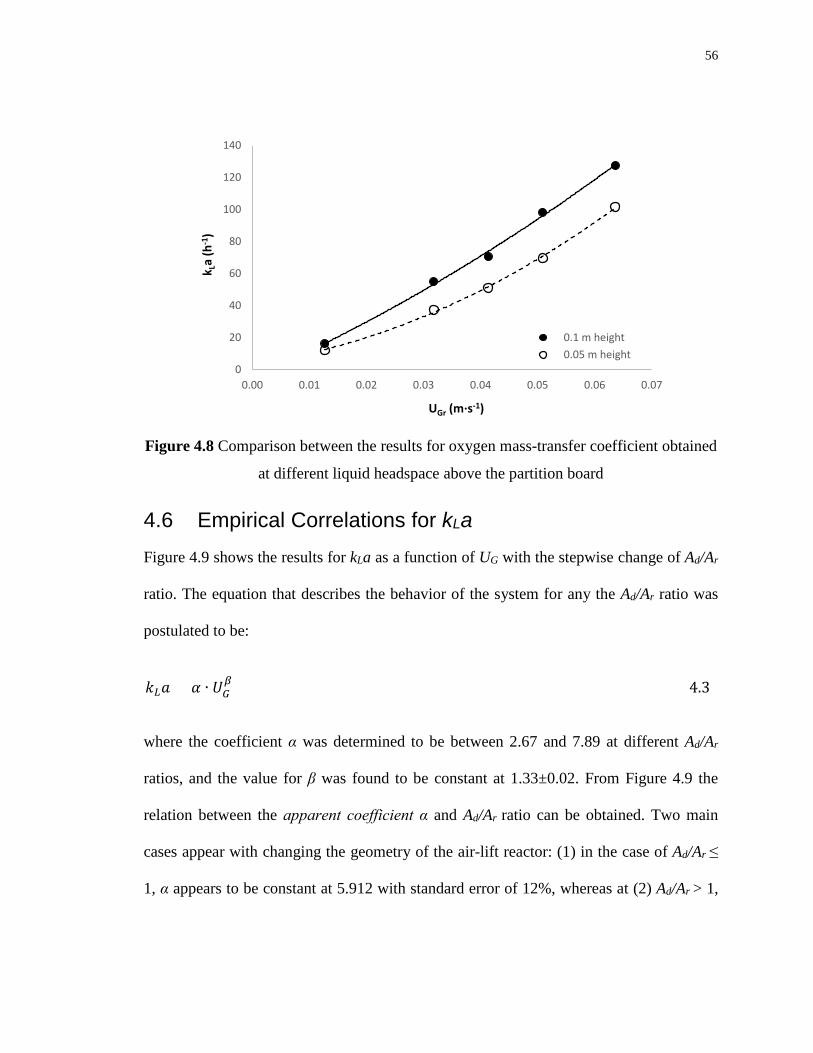
56
Figure 4.8 Comparison between the results for oxygen mass-transfer coefficient obtained
at different liquid headspace above the partition board
4.6 Empirical Correlations for kLa Figure 4.9 shows the results for kLa as a function of UG with the stepwise change of Ad/Ar
ratio. The equation that describes the behavior of the system for any the Ad/Ar ratio was
postulated to be:
𝑘𝑘𝐿𝐿𝑎𝑎 = 𝛼𝛼 ∙ 𝑂𝑂𝐺𝐺𝛽𝛽 (4.3)
where the coefficient α was determined to be between 2.67 and 7.89 at different Ad/Ar
ratios, and the value for β was found to be constant at 1.33±0.02. From Figure 4.9 the
relation between the apparent coefficient α and Ad/Ar ratio can be obtained. Two main
cases appear with changing the geometry of the air-lift reactor: (1) in the case of Ad/Ar ≤
1, α appears to be constant at 5.912 with standard error of 12%, whereas at (2) Ad/Ar > 1,
0
20
40
60
80
100
120
140
0.00 0.01 0.02 0.03 0.04 0.05 0.06 0.07
k La
(h-1
)
UGr (m·s-1)
0.1 m height0.05 m height

57
α gradually decreases. There is an apparent discontinuity at kLa as a function of Ad/Ar.
That discontinuity can be explained with the role of the riser and downcomer in the main
mass-transfer process with changing the Ad/Ar ratio. In the case of Ad/Ar ≤ 1 the residence
time of the gas-liquid dispersion in the riser is higher than in the downcomer. In addition,
the higher number of the air bubbles in the riser provides higher contact surface between
the gas and the liquid phase. That is why the main mixing, and therefore the main mass-
transfer process takes place in the riser. In such cases the Ad/Ar ratio does not have strong
impact on kLa and the air-lift reactor behaves more as a bubble column (left hand-side of
Figure 4.10). In the second case, Ad/Ar ˃1 the higher liquid velocity in the riser implies
shorter contact time between the gas bubbles and the liquid, which results in the more
significant mass-transfer in the downcomer. Thus, at Ad/Ar ˃1 there is a strong influence
of Ad/Ar ratio on kLa, which can be seen at the right-hand side of Figure 4.10.
Considering the difference in the two distinct regimes that occur at Ad/Ar ≤ 1 and Ad/Ar ˃1,
two relations describe the behavior of the system at every Ad/Ar ratio. The final model of
the system is shown in Eq. (4.4).
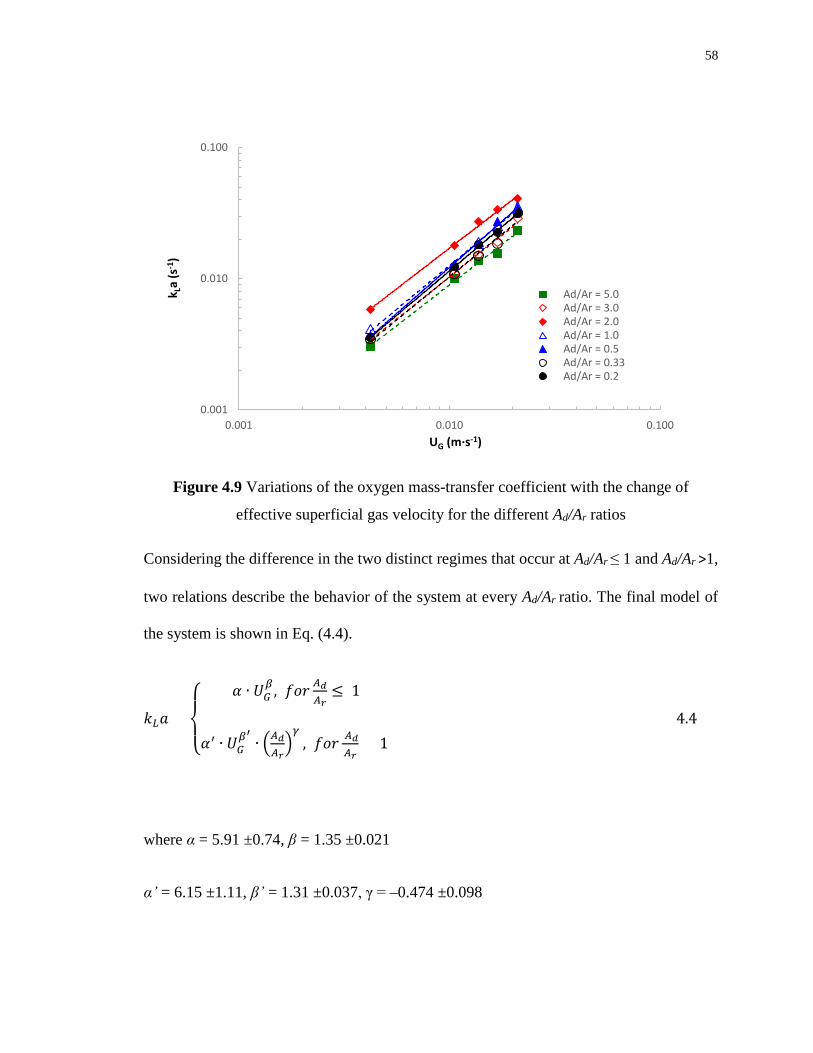
58
Figure 4.9 Variations of the oxygen mass-transfer coefficient with the change of
effective superficial gas velocity for the different Ad/Ar ratios
Considering the difference in the two distinct regimes that occur at Ad/Ar ≤ 1 and Ad/Ar ˃1,
two relations describe the behavior of the system at every Ad/Ar ratio. The final model of
the system is shown in Eq. (4.4).
𝑘𝑘𝐿𝐿𝑎𝑎 =
⎩⎨
⎧ 𝛼𝛼 ∙ 𝑂𝑂𝐺𝐺𝛽𝛽 , 𝑓𝑓𝑓𝑓𝑓𝑓 𝐴𝐴𝑑𝑑
𝐴𝐴𝑟𝑟≤ 1
𝛼𝛼′ ∙ 𝑂𝑂𝐺𝐺𝛽𝛽′ ∙ �𝐴𝐴𝑑𝑑
𝐴𝐴𝑟𝑟�𝛾𝛾
, 𝑓𝑓𝑓𝑓𝑓𝑓 𝐴𝐴𝑑𝑑𝐴𝐴𝑟𝑟
> 1 (4.4)
where α = 5.91 ±0.74, β = 1.35 ±0.021
α’ = 6.15 ±1.11, β’ = 1.31 ±0.037, γ = –0.474 ±0.098
0.001
0.010
0.100
0.001 0.010 0.100
k La
(s-1
)
UG (m·s-1)
Ad/Ar = 5.0Ad/Ar = 3.0Ad/Ar = 2.0Ad/Ar = 1.0Ad/Ar = 0.5Ad/Ar = 0.33Ad/Ar = 0.2

59
The predictions of Eq. (4.4) agreed with the measured data within ±13% standard error,
or within ±25% (95% CI) (Figure 4.11). Exclusions can be observed for the higher kLa
values at Ad/Ar ratio of 5.0 correlated with the equation which are in the zone with high
value of the standard error.
Figure 4.10 Volumetric mass-transfer coefficient as a function of Ad/Ar ratio for the two
main cases occurring for the system
1
10
0.1 1.0 10.0
k La/
UG
β
Ad/Ar
Ad/Ar ≤ 1Ad/Ar > 1

60
Figure 4.11 Predicted (Eq. (4.4)) vs. measured kLa for the different Ad/Ar ratios
4.7 Effect of the Different Gas Distributors on the Energy Consumption
Figure 4.12 compares the kLa obtained, using different perforated tube gas distributors
(see Table 3.1). The Ad/Ar ratio of 2.0 was used for all the sets of experiments. It can be
clearly seen that kLa increases with the increasing the number of the orifices with the
same do = 2 mm. Comparison of two identical gas distributors with the same number of
the orifices and different orifice diameters was also done. About 16% higher values of
kLa for the device with do = 1 mm were obtained, compared with the values using the
device with do = 2 mm, yet the pressure losses for the aerating device with do = 1 mm
were found to increase at the same order of magnitude.
0
0.005
0.01
0.015
0.02
0.025
0.03
0.035
0.04
0.045
0.05
0 0.005 0.01 0.015 0.02 0.025 0.03 0.035 0.04 0.045
k La
calc
ulat
ed (s
-1)
kLa experimental (s-1)
Ad/Ar = 5.0Ad/Ar = 3.0Ad/Ar = 2.0Ad/Ar = 1.0Ad/Ar = 0.5Ad/Ar = 0.33Ad/Ar = 0.2
y = x
+25%
-25%

61
Figure 4.12 Variations of the oxygen mass-transfer coefficient with the changing the
number of the orifices of the aerating device
Figure 4.13 shows the relation between the theoretical electric power obtained per unit
volume, PEL, and the total pressure drop, PG as functions of effective superficial gas
velocity, UG. The power obtained per unit volume of the reactor, PEL was calculated as
the theoretical electric power per unit volume VL, which could be achieved at reduction of
the oxygen supplied with the aerating air to Hybrid Fe(II)/Fe(III) Redox Flow Fuel Cell
System (Hojjati et al., 2013), with reversible cell potential Er0 = 0.788 V. PG showed the
pressure losses for our system using different aerating devices. Three different aerating
devices were used in the experiment. The first one was finely perforated rubber tube, the
second one was AeosTM porous tube and the last one was the teflon tube with 200 orifices
(see Section 3.2). The Ad/Ar ratio of 2 was chosen (see Section 4.3). Faraday’s law was
used to calculate PEL:
0
20
40
60
80
100
120
140
160
0.00 0.01 0.02 0.03 0.04 0.05 0.06 0.07
k La
(h-1
)
UG r (m·s-1)
no = 200/do = 2mmno = 160/do = 2mmno = 80/do = 1mmno = 80/do = 2mmno = 40/do = 2mm

62
𝑚𝑚 =𝑄𝑄𝐹𝐹∙𝑀𝑀𝑧𝑧
(4.5)
after rearrangement and differentiation with respect to time gives:
𝑑𝑑𝑄𝑄𝑑𝑑𝑑𝑑
=𝑑𝑑𝑑𝑑𝑑𝑑�𝑚𝑚𝑀𝑀∙ 𝐹𝐹 ∙ 𝑧𝑧� =
𝐹𝐹 ∙ 𝑧𝑧𝑀𝑀
∙𝑑𝑑𝑚𝑚𝑑𝑑𝑑𝑑
(4.6)
where m is the mass of the substance liberated at an electrode in grams; Q is the total
electric charge passed through the substance; F = 96485 C mol−1 is the Faraday constant;
M is the molar mass of the substance; z is the valency number of ions of the substance
(electrons transferred per ion).
But,
𝑑𝑑𝑄𝑄𝑑𝑑𝑑𝑑
= 𝐼𝐼 (4.7)
And
⎩⎪⎨
⎪⎧𝑑𝑑𝑚𝑚𝑑𝑑𝑑𝑑
=𝑑𝑑𝑑𝑑𝑑𝑑
(𝑑𝑑 ∙ 𝑉𝑉𝐿𝐿) = 𝑉𝑉𝐿𝐿𝑑𝑑𝑑𝑑𝑑𝑑𝑑𝑑
𝑑𝑑𝑑𝑑𝑑𝑑𝑑𝑑
= 𝑘𝑘𝐿𝐿𝑎𝑎 ∙ (𝑑𝑑∗ − 𝑑𝑑)
(4.8)
Or
𝑑𝑑𝑚𝑚𝑑𝑑𝑑𝑑
= 𝑉𝑉𝐿𝐿 ∙ 𝑘𝑘𝐿𝐿𝑎𝑎 ∙ (𝑑𝑑∗ − 𝑑𝑑) (4.9)

63
Substituting Eq. (4.7) and Eq. (4.9) in Eq. (4.6), and assuming that for time t0 = 0 to t1 = t
the dissolved oxygen concentration in the liquid changes from C0 = 0 to C = C* gives the
relation between the electrical current and the OTR:
𝐼𝐼 = 𝐹𝐹 ∙𝑧𝑧𝑀𝑀
· 𝑉𝑉𝐿𝐿 · 𝑘𝑘𝐿𝐿𝑎𝑎 ∙ 𝑑𝑑∗ (4.10)
𝑃𝑃𝐸𝐸𝐿𝐿 =𝐼𝐼𝑉𝑉𝐿𝐿∙ 𝑉𝑉 (4.11)
The power, necessary to overcome the total pressure drop for the system, PG was
calculated by multiplying the pressure drop at the aerating device, pG by the air flow-rate,
QG per unit liquid volume, VL for the all five air flow-rates used in the experiment.
𝑃𝑃𝐺𝐺 =𝑝𝑝𝐺𝐺 ∙ 𝑄𝑄𝐺𝐺 𝑉𝑉𝐿𝐿
(4.12)
It was found that the highest PEL was obtained when using the finely perforated rubber
tube, about 22% higher than PEL obtained with Aeos tube, and almost 33% higher than
PEL obtained with the perforated tube at the same UG. However, the energy losses in this
case were 16% higher than theoretically received energy, which is significant in the case
of using the air-lift reactor for energy production, where the aim is to minimize the
energy input to the system (Pupkevich, 2014). It can be seen also that the Aeos tube
showed satisfactory results. In that case PG was 8% of PEL, which is a significant decrease
of the energy losses of the system. However the best ratio PG/PEL was obtained with the
perforated teflon tube. As shown the PG was only 4.5% of PEL at the highest UG used.

64
Figure 4.13 Variations of the theoretical electric power obtained and pressure loss at the
different effective superficial gas velocities used
As it is shown in Figure 4.14 the highest values of kLa at a certain UG were obtained
using the perforated rubber tube, whereas the results for kLa for the other two types of
aerating devices were quite similar. Despite of that the best PG/PEL ratio at the highest kLa
values was observed using the perforated teflon tube.
More detailed information about energy efficiency of the system, expressed as PG/PEL,
using different aerating devices specified for the values of kLa is shown at Figure 4.15.
The shape of the curve for the perforated rubber tube can be explained with the elasticity
and the structure of the material used (see Figure 3.2). The small crevices at the surface
of the material and its bubbly structure do not allow uniform formation of bubbles. In
other words, at the lower Ug used air accumulates inside the caverns, which are in the
0.0
0.1
0.2
0.3
0.4
0.5
0.0
0.5
1.0
1.5
2.0
2.5
3.0
3.5
4.0
4.5
0.000 0.005 0.010 0.015 0.020 0.025
P G(k
W·m
-3)
P EL
(kW
·m-3
)
UG (m·s-1)
P EL - Rubber tubeP EL - Aeos tubeP EL - Perforated tubeP G - Rubber tubeP G - Aeos tubeP G - Perforated tube
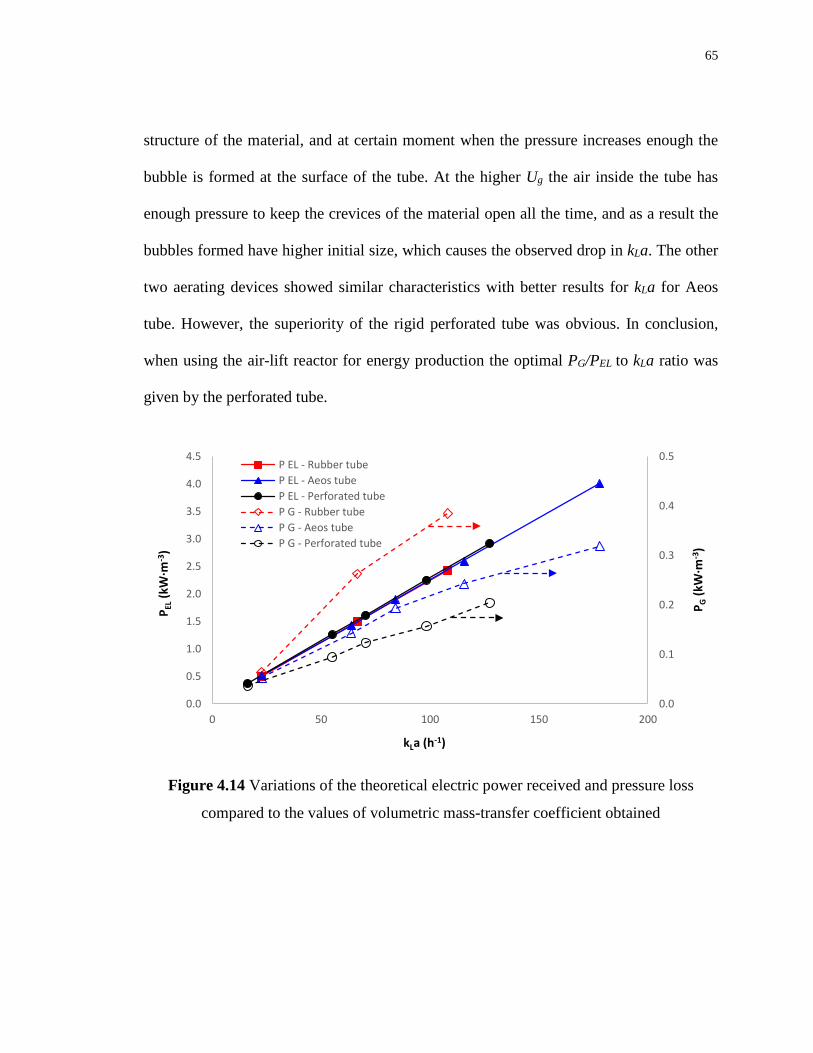
65
structure of the material, and at certain moment when the pressure increases enough the
bubble is formed at the surface of the tube. At the higher Ug the air inside the tube has
enough pressure to keep the crevices of the material open all the time, and as a result the
bubbles formed have higher initial size, which causes the observed drop in kLa. The other
two aerating devices showed similar characteristics with better results for kLa for Aeos
tube. However, the superiority of the rigid perforated tube was obvious. In conclusion,
when using the air-lift reactor for energy production the optimal PG/PEL to kLa ratio was
given by the perforated tube.
Figure 4.14 Variations of the theoretical electric power received and pressure loss
compared to the values of volumetric mass-transfer coefficient obtained
0.0
0.1
0.2
0.3
0.4
0.5
0.0
0.5
1.0
1.5
2.0
2.5
3.0
3.5
4.0
4.5
0 50 100 150 200
P G(k
W·m
-3)
P EL
(kW
·m-3
)
kLa (h-1)
P EL - Rubber tubeP EL - Aeos tubeP EL - Perforated tubeP G - Rubber tubeP G - Aeos tubeP G - Perforated tube

66
Figure 4.15 Volumetric mass-transfer coefficient as a function of energy efficiency
4.8 Effect of the Gas Holdup on kLa Figure 4.16 shows the change of the kLa with the change of the overall gas-holdup (ɛ) for
the aerating device with 200 orifices facing upwards at the different Ad/Ar ratios. The rise
of ɛ, resulting from the increasing of UG contributes for higher kLa values. The highest
kLa values can be seen again at the ratio of Ad/Ar of 2.0. Six repetitive measurements at
each Ad/Ar ratio were performed in order to obtain meaningful statistical information for
each experimental point shown, resulting in maximum standard deviation (STD) of
14.1% with a 95% CI (confidence interval) of +/-11.3%. The latter confirms the
conclusions, made from Figure 4.5–Figure 4.7. Noticeable effect of the partition board
location on gas holdup was observed. This disagrees with the small influence of the area
or diameter ratios of downcomer and riser on gas holdup in internal loop airlift reactors in
0
20
40
60
80
100
120
140
160
180
200
0.00 0.02 0.04 0.06 0.08 0.10 0.12 0.14 0.16 0.18 0.20
k La
(h-1
)
PG/PEL
Aeos tubeRubber tubePerforated tube

67
water, salt solution and other low viscosity media, described by Weiland (1984) and
confirmed later by Tobajas et al. (1999).
Figure 4.16 Variations of the volumetric mass-transfer coefficient with the increased
overall gas holdup
4.9 Effect of the Mean Circulation Time of the Liquid on kLa According to some authors the type of the gas distributor has negligible effect on liquid
circulation rate (Onken and Weiland, 1980; Merchuk, 1986) if the cross-section of the
riser is uniformly sparged; however Chakravarty et al., 1974 express an opposite opinion.
The influence of gas distributor on liquid circulation could appear eventually if either its
operating regime or the distributor type contributes in a high degree to the total energy
input brought with the kinetic energy of the gas jet into the reactor, which is not usually
0
20
40
60
80
100
120
140
160
0.00 0.01 0.02 0.03 0.04 0.05 0.06 0.07
k La
(h-1
)
ɛ (-)
Ad/Ar = 5.0Ad/Ar = 3.0Ad/Ar = 2.0Ad/Ar = 1.0Ad/Ar = 0.5Ad/Ar = 0.33Ad/Ar = 0.2

68
the case in air-lift reactors. The perforated aerating device with 200 orifices facing
downwards was chosen for this experiment. The effect of the mean liquid circulation
time, tc on the volumetric mass-transfer coefficient for a given downcomer to riser area
ratio is shown in Figure 4.17. The different Ad/Ar ratios affected the liquid and gas
circulation patterns inside the air-lift reactor, yet also gave different riser and downcomer
areas available for flow. As shown in Figure 4.17, the small Ad/Ar ratios resulted in
considerably higher tc and lower kLa values, whereas tc values appeared to be very close
to each other for ratios of Ad/Ar from 0.5 to 5.0, giving also closer values for kLa. It was
easy again to recognize the two main mixing regimes, resulting from changing the
internal geometry of the air-lift reactor (see Section 4.3). As seen at that section, at the
lower dowcomer to riser are ratios the air-lift behaves more as a bubble-column reactor,
the flow pattern throughout the downcomer is not well defined and a lot of back mixing
occurs in the riser. As a sequence, the values of UGR and vLR are lower at the same air-
flow rates, comparing with the cases with higher Ad/Ar ratio, which in combination with
the higher back mixing in the riser implies that not all the air-water dispersion circulates
throughout the downcomer which results in higher mean liquid circulation times.
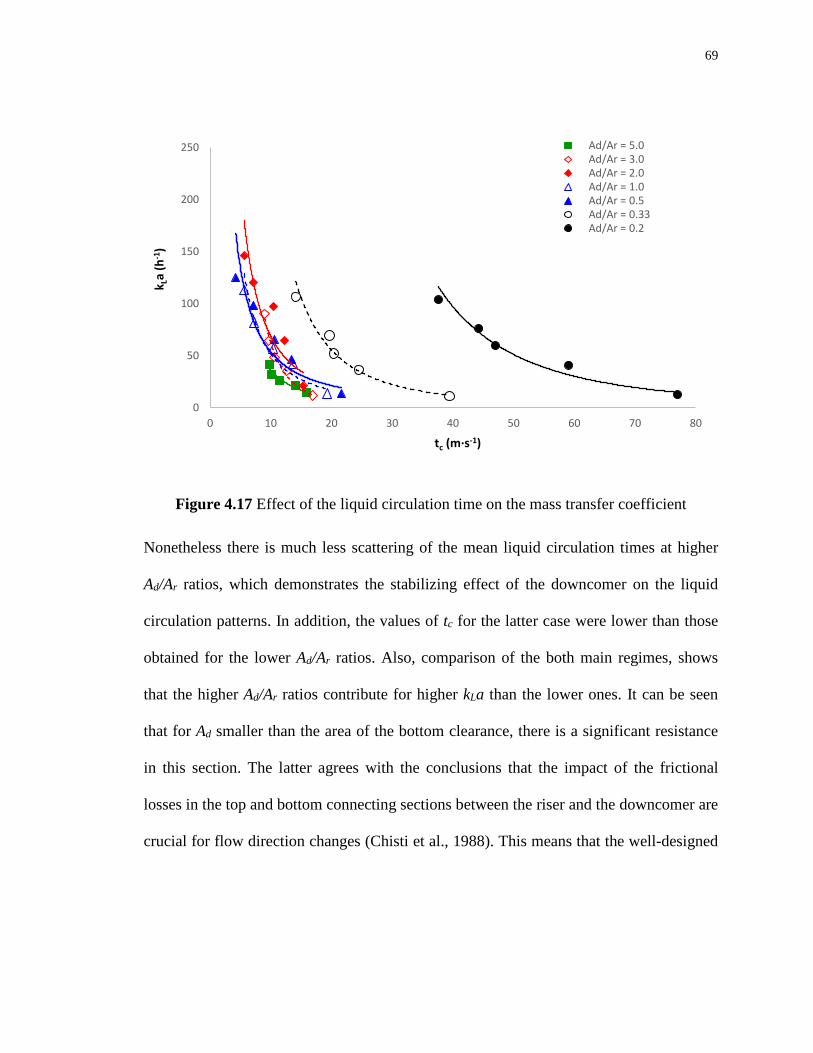
69
Figure 4.17 Effect of the liquid circulation time on the mass transfer coefficient
Nonetheless there is much less scattering of the mean liquid circulation times at higher
Ad/Ar ratios, which demonstrates the stabilizing effect of the downcomer on the liquid
circulation patterns. In addition, the values of tc for the latter case were lower than those
obtained for the lower Ad/Ar ratios. Also, comparison of the both main regimes, shows
that the higher Ad/Ar ratios contribute for higher kLa than the lower ones. It can be seen
that for Ad smaller than the area of the bottom clearance, there is a significant resistance
in this section. The latter agrees with the conclusions that the impact of the frictional
losses in the top and bottom connecting sections between the riser and the downcomer are
crucial for flow direction changes (Chisti et al., 1988). This means that the well-designed
0
50
100
150
200
250
0 10 20 30 40 50 60 70 80
k La
(h-1
)
tc (m·s-1)
Ad/Ar = 5.0Ad/Ar = 3.0Ad/Ar = 2.0Ad/Ar = 1.0Ad/Ar = 0.5Ad/Ar = 0.33Ad/Ar = 0.2
70
internal configuration can improve significantly the mass transfer and hydrodynamic
characteristics of the air-lift reactor.

71
Chapter 5
5 Conclusions and Recommendations
5.1 Conclusions The position of the DO probe in the depth of the reactor played significant role, and
attention should be paid when comparing kLa results for different systems and/or
conditions.
The two directions of the orifices of a conventional aerating device, showed superiority
of the method when its air-jets were directed downwards at constant other conditions.
The reason was that the orientation downwards of the air-jets provided additional mixing
of the liquid at the dead zones around the bottom of the reactor, thus improving mass
transfer and hydrodynamic characteristics of the ALR.
Although porous aerating devices showed enhanced mass transfer characteristics, their
energy efficiency was way lower, compared with the perforated ones.
Changing the position of the partition board revealed the ratio between the downcomer to
riser areas of 2.0, for which highest values of the volumetric mass transfer coefficient
were obtained. The effect of the partition board was to stabilize the liquid circulation
pattern as indicated by less variance in the circulation times. Based on that, two distinct
flow regimes were examined. The poorly defined liquid circulation patterns resulting at
low Ad/Ar ratios led to generally longer circulation times, and lower kLa values than those

72
obtained at higher Ad/Ar ratios. It can be considered that at very low Ad/Ar ratios (when
the width of the riser is lower or equal to the height of the base), the liquid circulation
rate is insufficient for adequate oxygen mass transfer. Depending on the orifice/pore size
and airflow rate used, the pressure drop across the orifices/pores may constitute a
significant part to the total pressure drop and must be included if power consumption
calculations are made. The power efficiency for oxygen transfer was found to be
profoundly influenced by the orifice/pore size, and there was less effect due to varying
the number of orifices.
We have characterized the oxygen mass transfer and liquid circulation behavior in a
rectangular air-lift reactor and have found the optimal operating conditions in terms of
oxygen mass transfer and energy utilization. A new empirical model for the dependence
of the mass transfer coefficient on the position of the partition board in the air-lift reactor
was developed and used for optimization of the operating conditions. We believe that this
work may be useful for the design and optimization of biochemical and other processes
that require air-lift reactors.
5.2 Recommendations The bioreactor plays a crucial role in overall performance of BioGenerator. Due to the
unique structure and designation of the system, specific aspects of bioreactor
performance characteristics have to be improved. That is why, future work could be done

73
in continuing the current study or develop new elements and approaches to achieve high
performance and low energy consumption of the bioreactor used for BioGenerator.
• The ratio of non-aerated to aerated compartment (Ad/Ar) is a crucial parameter that
affects the overall performance of bioreactor. Based on the results, presented in
this study, more profound research might be conducted in determining the exact
position of the partition board inside the ALR. The Ad/Ar ratio influences mass
transfer and hydrodynamic characteristics of the bioreactor. In addition, it affects
the liquid circulation time, thus changing the behavior of the whole system. That
is why the effect of these parameters in long-term operations can contribute to
minimize the overall energy input of ALR by significantly decreasing the volumes
of the aerating gas to the reactor.
• The liquid headspace of gas separator compartment and the bottom opening at
base of ALR are among the parameters that can influence the performance of the
bioreactor for both short-term and long-term operations. Other than controlling
the mass transport, these connections play another important role by driving the
liquid circulation pattern in the reactor. Not all the parameters that help decrease
the input energy at the reactor can have a positive effect on the oxygen mass
transfer. As observed in this work, lowering the liquid headspace above the
partition board could help decrease the aerating gas volumes but had a negative
effect on kLa. On the other hand the closer the bottom opening area is to the area
74
of the downcomer, the worse the circulation times are. Therefore, based on the
demand, one should consider exploring the change of the overall ALR
performance characteristics with the stepwise change of both gas separator and
base compartment parameters. This may be of considerable importance to the
oxygen transfer by increasing the gas holdup (residence time) of the gas bubbles,
thereby increasing the efficiency of oxygen utilization.
• One of the challenges of studying the oxygen mass transfer for any bioreactor is
the optimal ratio between kLa, obtained and the energy, necessary to overcome the
pressure at the orifices/pores of the aerating device. This ratio is even more
important in the case, when the bioreactor is used for energy production (i.e.
BioGenerator), where every aspect of energy loses affects negatively the
efficiency of the system. In other words, the smaller bubbles are produced at
aerating device, the higher contact surface between the gas and the liquid is
achieved. This increases the volumetric oxygen mass transfer coefficient (kLa),
but at the same time increases the pressure losses at the aerating device too. That
can become very energy consuming. Depending on the orifice/pore size and
airflow rate used, the pressure drop across the orifices/pores may constitute a
significant part to the total pressure drop and must be included when power
consumption calculations are made. The power efficiency for oxygen transfer was
found to be profoundly influenced by the orifice/pore size, and there was less
effect due to varying the number of orifices. Therefore, an extended study on

75
different materials use for aerating devices could be considered for further
research.
• More work could be done to create detailed fluid-flow model of the present air-lift
reactor for study the effect of the changes of the internal geometry on its
performance characteristics for the future scale up.
• One can think of replacing the current structure of the ALR with trickling bed
reactor. This might bring us at least three advantages. One is eliminating the
necessity of recirculating high volumes of liquid, which will decrease the energy
input into the reactor. Second is the immobilization of the microorganisms on the
surface of the fill, which has some opportunities versus free suspended
microorganisms. Last but not the least it can facilitate the maintenance of the
bioreactor compared with the case with free suspended culture.
76
References
Al-Azzi, A.A.-R., Al-Kuffe, L.S.S., 2010. Influence of Draft Tube Diameter on Operation Behavior of Air Lift Loop Reactors. Al-Khwarizmi Eng. J. 6, 21–32.
Ambec, S., Crampes, C., 2010. Decarbonizing Electricity Generation with Intermittent Sources of Energy. TSE Work. Pap. 33, 0–32.
Badino, A.C., Facciotti, M.C.R., Schmidell, W., 2001. Volumetric oxygen transfer coefficients (kLa) in batch cultivations involving non-Newtonian broths. Biochem. Eng. J. 8, 111–119.
Baird, M.H.I., Rao, N.V.R., Shen, Z.J., 1993. Oxygen absorption in a baffled tank agitated by delta paddle impeller. Can. J. Chem. Eng. 71, 195–201.
Bang, H.-K., Ellinger, A.E., Hadjimarcou, J., Traichal, P.A., 2000. Consumer concern, knowledge, belief, and attitude toward renewable energy: an application of the reasoned action theory. Psychol. Mark. 17, 449–468.
Baranes, E., Jacqmin, J., Poudou, J.-C., 2014. Renewable and non-renewable intermittent energy sources : friends and foes ? 33, 1–26.
Barnes, F., Levine, J., 2011. Large energy storage systems. CRC Press Taylor & Francis Group, Boca Raton.
Benyahia, F., Jones, L., 1997. Scale effects on hydrodynamic and mass transfer characteristics of external loop airlift reactors. J. Chem. Technol. Biotechnol. 69, 301–308.
Çalik, P., Yilgör, P., Ayhan, P., Demir, A.S., 2004. Oxygen transfer effects on recombinant Benzaldehyde lyase production. Chem. Eng. Sci. 59, 5075–5083.
Carbajal, R.I., Tecante, A., 2004. On the applicability of the dynamic pressure step method for kLa determination in stirred Newtonian and non-Newtonian fluids, culture media and fermentation broths. Biochem. Eng. J. 18, 185–192.
Chang, C.-M., Lu, W.J., Own, K.S., Hwang, S.-J., 1994. Comparison of airlift and stirred tank reactors for immobilized enzyme reactions. Process Biochem. 29, 133–138.
77
Chisti, M.Y., 1989. Techniques for Bioreactors, in: Airlift Bioreactors. Elsevier Applied Science, London, pp. 87–131.
Chisti, M.Y., Halard, B., Moo-Young, M., 1988. Liquid circulation in airlift reactors. Chem. Eng. Sci. 43, 451–457.
Choi, K.H., Chisti, Y., Moo-Young, M., 1996. Comparative evaluation of hydrodynamics and gas-liquid mass transfer characteristics in bubble column and airlift slury reactors. Chem. Eng. J. 62, 223–229.
Clarke, K.G., Williams, P.C., Smit, M.S., Harrison, S.T.L., 2006. Enhancement and repression of the volumetric oxygen transfer coefficient through hydrocarbon addition and its influence on oxygen transfer rate in stirred tank bioreactors. Biochem. Eng. J. 28, 237–242.
Cooper, C.M., Fernstrom, G.A., Miller, S.A., 1944. Performance of Agitated Gas-Liquid Contactors. Ind. Eng. Chem. 36, 504–509.
Couvert, A., Bastoul, D., Roustan, M., Chatellier, P., 2004. Hydrodynamic and mass transfer study in a rectangular three-phase air-lift loop reactor. Chem. Eng. Process. Process Intensif. 43, 1381–1387.
Couvert, A., Roustan, M., Chatellier, P., 1999. Two-phase hydrodynamic study of a rectangular air-lift loop reactor with an internal baffle. Chem. Eng. Sci. 54, 5245–5252.
Danckwerts, P. V., Gillham, A.J., 1966. The design of gas absorbers. I. Methods for predicting rates of adsorption with chemical reaction in packed columns, and tests with 1.5 in Raschig rings. Trans. Inst. Chem. Eng. 44, 42–54.
Deane, J.P., Ó Gallachóir, B.P., McKeogh, E.J., 2010. Techno-economic review of existing and new pumped hydro energy storage plant. Renew. Sustain. Energy Rev. 14, 1293–1302.
Dunn, S., 1997. Power of Choice. World Watch 30–35.
Edwards, P.P., Kuznetsov, V.L., David, W.I.F., Brandon, N.P., 2008. Hydrogen and fuel cells: Towards a sustainable energy future. Energy Policy 36, 4356–4362.
78
Egerton, R.F., 2005. Physical Principles of Electron Microscopy. Springer US, Boston, MA.
Ehrlich, H.L., Oremland, R.S., Zehr, J.P., 2001. Biogeochemical Cycles, in: Encyclopedia of Life Sciences. John Wiley & Sons, Ltd, Chichester, pp. 1–10.
Elam, C.C., Padró, C.E.G., Sandrock, G., Luzzi, A., Lindblad, P., Hagen, E.F., 2003. Realizing the hydrogen future: The International Energy Agency’s efforts to advance hydrogen energy technologies. Int. J. Hydrogen Energy 28, 601–607.
Farhar, B.C., 1996. Energy and the Environment: The Public View. Renew. Energy Policy Proj. Issue Br. 1–11.
Fontana, R.C., Polidoro, T.A., Silveira, M.M.D., 2009. Comparison of stirred tank and airlift bioreactors in the production of polygalacturonases by Aspergillus oryzae. Bioresour. Technol. 100, 4493–4498.
Gaddis, E.S., 1999. Mass transfer in gas-liquid contactors. Chem. Eng. Process. Process Intensif. 38, 503–510.
Gahleitner, G., 2013. Hydrogen from renewable electricity: An international review of power-to-gas pilot plants for stationary applications. Int. J. Hydrogen Energy 38, 2039–2061.
García-Ochoa, F., Castro, E.G., Santos, V.E., 2000. Oxygen transfer and uptake rates during xanthan gum production. Enzyme Microb. Technol. 27, 680–690.
Garcia-Ochoa, F., Gomez, E., 2009. Bioreactor scale-up and oxygen transfer rate in microbial processes: An overview. Biotechnol. Adv. 27, 153–176.
García-Ochoa, F., Gómez, E., 1998. Mass transfer coefficient in stirred tank reactors for xanthan gum solutions. Biochem. Eng. J. 1, 1–10.
Garcia-Ochoa, F., Gomez, E., Santos, V.E., Merchuk, J.C., 2010. Oxygen uptake rate in microbial processes: An overview. Biochem. Eng. J. 49, 289–307.
Gauthier, L., Thibault, J., LeDuy, A., 1991. Measuring kLa with randomly pulsed dynamic method. Biotechnol. Bioeng. 37, 889–893.
79
Gogate, P.R., Pandit, A.B., 1999. Survey of measurement techniques for gas-liquid mass transfer coefficient in bioreactors. Biochem. Eng. J. 4, 7–15.
Gourich, B., Azher, N. El, Vial, C., Soulami, M.B., Ziyad, M., 2006. Study of Hydrodynamics , Mixing and Gas-Liquid Mass Transfer in a Split-Rectangular Airlift Reactor 84, 539–547.
Hadjipaschalis, I., Poullikkas, A., Efthimiou, V., 2009. Overview of current and future energy storage technologies for electric power applications. Renew. Sustain. Energy Rev. 13, 1513–1522.
Hill, G.A., 2006. Measurement of overall volumetric mass transfer coefficients for carbon dioxide in a well-mixed reactor using a pH probe. Ind. Eng. Chem. Res. 45, 5796–5800.
Hojjati, H., Penev, K., Pupkevich, V.R., Karamanev, D.G., 2013. Modeling, Simulation, and Optimization of Hybrid Fe(II)/Fe(III) Redox Flow Fuel Cell System. AIChE J. 59, 1844–1854.
IUPAC, n.d. Bioreactor, in: IUPAC Compendium of Chemical Terminology. IUPAC, Research Triagle Park, NC.
Johnson, D.B., Hallberg, K.B., 2003. The microbiology of acidic mine waters. Res. Microbiol. 154, 466–473.
Jordan, M.A., McGinness, S., Phillips, C.V., 1996. Acidophilic bacteria—their potential mining and environmental applications. Miner. Eng. 9, 169–181.
Joshi, J.B., Ranade, V. V., Gharat, S.D., Lele, S.S., 1990. Sparged loop reactors. Can. J. Chem. Eng. 68, 705–741.
Juraščík, M., Blažej, M., Annus, J., Markoš, J., 2006. Experimental measurements of volumetric mass transfer coefficient by the dynamic pressure-step method in internal loop airlift reactors of different scale. Chem. Eng. J. 125, 81–87.
Karamanev, D.G., 2012. BioGenerator - a novel bio-technology for the conversion of hydrogen to electricity. Nanotech 3, 637–340.

80
Karamanev, D.G., Glibin, V.P., Dobreff, P.V., 2005. Fuel cell bioreactor. US8450015 B2.
Karamanev, D.G., Pupkevich, V.R., Hojjati, H., 2013. Bio-fuel cell system. US 8455144 B2.
Kelly, D.P., Wood, A.P., 2000. Reclassification of some species of Thiobacillus to the newly designated genera Acidithiobacillus gen. nov., Halothiobacillus gen. nov. and Thermithiobacillus gen. nov. 511–516.
Kilonzo, P.M., Margaritis, A., 2004. The effects of non-Newtonian fermentation broth viscosity and small bubble segregation on oxygen mass transfer in gas-lift bioreactors: A critical review. Biochem. Eng. J. 17, 27–40.
Kocabaş, P., Çalik, P., Özdamar, T.H., 2006. Fermentation characteristics of l-tryptophan production by thermoacidophilic Bacillus acidocaldarius in a defined medium. Enzyme Microb. Technol. 39, 1077–1088.
Koide, K., Sato, H., Iwamoto, S., 1983. Gas Holdup and Volumetric Liquid-Phase Mass Transfer Coefficient in Bubble Column With Draught Tube and With Gas Dispersion Into Annulus. J. Chem. Eng. Japan 16, 407–413.
Lazarova, V., Meyniel, J., Duval, L., Manem, J., 1997. A novel circulating bed reactor: hydrodynamics, mass transfer and nitrification capacity. Chem. Eng. Sci. 52, 3919–3927.
Liu, Y.-S., Wu, J.-Y., Ho, K., 2006. Characterization of oxygen transfer conditions and their effects on Phaffia rhodozyma growth and carotenoid production in shake-flask cultures. Biochem. Eng. J. 27, 331–335.
Lu, X., Ding, J., Wang, Y., Shi, J., 2000. Comparison of the hydrodynamics and mass transfer characteristics of a modified square airlift reactor with common airlift reactors. Chem. Eng. Sci. 55, 2257–2263.
Majeed, J.G., Békásy-Molnár, E., 1995. Design correlations of an air-lift tube reactor. Gas Sep. Purif. 9, 101–109.
Margaritis, A., Sheppard, J.D., 1981. Mixing time and oxygen transfer characteristics of

81
double draft tube airlift fermentor. Biotechnol. Bioeng. 23, 2117–2135.
Martin, A.B., Alcon, A., Santos, V.E., Garcia-Ochoa, F., 2004. Production of a biocatalyst of Pseudomonas putida CECT5279 for dibenzothiophene (DBT) biodesulfurization for different media compositions. Energy and Fuels 18, 851–857.
Merchuk, C., 1990. Why use air-lift bioreactors? TIBTECH 8, 66–71.
Merchuk, J.C., 1986. Gas hold-up and liquid velocity in a two-dimensional air lift reactor. Chem. Eng. Sci. 41, 11–16.
Merchuk, J.C., Gluz, M., 2002. Air-lift Reactors. Encycl. Bioprocess Technol. 1, 320–353.
Merchuk, J.C., Ladwa, N., Cameron, A., Bulmer, M., Berzinb, I., Pickett, A.M., 1996. Liquid Flow and Mixing in Concentric Tube Air- Lift Reactors. J. Chem. Technol. Biotechnol. 66, 174–182.
Merchuk, J.C., Osemberg, G., Siegel, M., Shacham, M., 1992. A method for evaluation of mass transfer coefficients in the different regions of air lift reactors. Chem. Eng. Sci. 47, 2221–2226.
Momirlan, M., Veziroglu, T.N., 2005. The properties of hydrogen as fuel tomorrow in sustainable energy system for a cleaner planet. Int. J. Hydrogen Energy 30, 795–802.
Moutafchieva, D., Popova, D., Dimitrova, M., Tchaoushev, S., 2013. Experimental determination of the volumetric mass transfer coefficient. J. Chem. Technol. Metall. 48, 351–356.
Natural Resources Canada- Government of Canada [WWW Document], 2015. URL http://www.nrcan.gc.ca/energy/renewable-electricity/7295
Neef, H.-J., 2009. International overview of hydrogen and fuel cell research. Energy 34, 327–333.
Nemati, M., Harrison, S.T.L., Hansford, G.S., Webb, C., 1998. Biological oxidation of ferrous sulphate by Thiobacillus ferrooxidans: a review on the kinetic aspects.
82
Biochem. Eng. J. 1, 171–190.
Nocentini, M., Fajner, D., Pasquali, G., Magelli, F., 1993. Gas-Liquid Mass Transfer and Holdup in Vessels Stirred with Multiple Rushton Turbines : Water and Water-Glycerol Solutions. 19–26.
Olson, G.J., Brierley, J. a., Brierley, C.L., 2003. Bioleaching review part B: Appl. Microbiol. Biotechnol. 63, 249–257.
Onken, U., Weiland, P., 1980. Hydrodynamics and mass transfer in an airlift loop fermentor. Eur. J. Appl. Microbiol. Biotechnol. 10, 31–40.
Ortiz-Ochoa, K., Doig, S.D., Ward, J.M., Baganz, F., 2005. A novel method for the measurement of oxygen mass transfer rates in small-scale vessels. Biochem. Eng. J. 25, 63–68.
Pedersen, A.G., Andersen, H., Nielsen, J., Villadsen, J., 1994. A novel technique based on 85Kr for quantification of gas-liquid mass transfer in bioreactors. Chem. Eng. Sci. 49, 803–810.
Peinado, R. a., Moreno, J.J., Villalba, J.M., González-Reyes, J. a., Ortega, J.M., Mauricio, J.C., 2006. Yeast biocapsules: A new immobilization method and their applications. Enzyme Microb. Technol. 40, 79–84.
Petersen, E.E., Margaritis, A., 2001. Hydrodynamic and mass transfer characteristics of three-phase gaslift bioreactor systems., Critical reviews in biotechnology.
Popovic, M.K., Robinson, C.W., 1989. Mass transfer studies of external-loop airlifts and a bubble column. AIChE J. 35, 393–405.
Pupkevich, V., 2014. Scale-up and study of the BioGenerator. The University of Western Ontario.
Puthli, M.S., Rathod, V.K., Pandit, A.B., 2005. Gas-liquid mass transfer studies with triple impeller system on a laboratory scale bioreactor. Biochem. Eng. J. 23, 25–30.
Rainer, B.W., 1990. Determination methods of the volumetric oxygen transfer coefficient kLa in bioreactors. Chem. Biochem. Eng. Q. 4, 185–196.

83
Rawlings, D.E., Tributsch, H., Hansford, G.S., 1999. Reasons why “Leptospirillum”-like species rather than Thiobacillus ferrooxidans are the dominant iron-oxidizing bacteria in many commercial processes for the biooxidation of pyrite and related ores. Microbiology 145, 5–13.
Renewables 2015 global status report, 2015.
Rohwerder, T., Gehrke, T., Kinzler, K., Sand, W., 2003. Bioleaching review part A: Appl. Microbiol. Biotechnol. 63, 239–248.
Rossi, G., 1990. Biohydrometallurgy: a sustainable technology in evolution. Cagliari.
Sahithi, K., Madhusudhan Rao, A., 2015. Economic Allocation for Energy Storage System using MOPSO - Wind Power Distribution 04, 7326–7331.
Sanchez, A., Garcıa, F., Gomez, A.C., Molina Grima, E., Chisti, Y., Sánchez Mirón, A., García Camacho, F., Contreras Gómez, A., Grima, E.M., 2000. Bubble-column and airlift photobioreactors for algal culture. AIChE J. 46, 1872–1887.
Sanjari, S., Vahabzadeh, F., Naderifar, A., Pesaran, M., 2014. Hydrodynamics and mass transfer coefficients of airlift reactors with net draft tubes of different sizes: Production of cyclodextrin glucanotransferase using Bacillus sp. DSM 2523. Starch - Stärke 66, 935–946.
Schiebahn, S., Grube, T., Robinius, M., Tietze, V., Kumar, B., Stolten, D., 2015. Power to gas: Technological overview, systems analysis and economic assessment for a case study in Germany. Int. J. Hydrogen Energy 40, 4285–4294.
Schugerl, K., 1990. Comparison of the performances of stirred tank and airlift tower loop reactors. J. Biotechnol. 13, 251–256.
Shao, M., 2013. Electrocatalysis in Fuel Cells: A Non- and Low- Platinum Approach. Spronger, London.
Siegel, M.H., Merchuk, J.C., 1988. Mass transfer in a rectangular air-lift reactor: effects of geometry and gas recirculation. Biotechnol. Bioeng. 32, 1128–1137.
Silverman, M.P., Lundgren, D.G., 1959. Studies on the chemoautotrophic iron bacterium
84
Ferroobacillus ferrooxidans: II. Manometric studies. J. Bacteriol. 78, 326–331.
Tobajas, M., García-Calvo, E., 2000. Comparison of experimental methods for determination of the volumetric mass transfer coefficient in fermentation processes. Heat Mass Transf. 36, 201–207.
Tobajas, M., Siegel, M.H., Apitz, S.E., 1999. Influence of geometry and solids concentration on the hydrodynamics and mass transfer of a rectangular airlift reactor for marine sediment and soil bioremediation. Can. J. Chem. Eng. 77, 660–669.
Twidell, J., Weir, T., 2006. Renewable Energy Resources, 2nd ed, Management. Taylor & Francis, New York.
Van’t Riet, K., 1979. Review of Measuring Methods and Results in Nonviscous Gas-Liquid Mass Transfer in Stirred Vessels. Ind. Eng. Chem. Process Des. Dev. 18, 357–364.
Vial, C., Poncin, S., Wild, G., Midoux, N., 2001. A simple method for regime identification and flow characterisation in bubble columns and airlift reactors. Chem. Eng. Process. 40, 135–151.
Weiland, P., 1984. Influence of Draught Tube Diameter on Operation Behaviour of Airlift Loop Reactors. Ger. Chem. Eng. 374–385.
Whitman, W.G., 1923. Preliminary experimental confirmation of the two-film theory of gas absorption. Chem. Met. Eng. 29, 146–9.
Winterbottom, J.M., 2007. Bubble column reactors. Book Review. By Wolf-Dieter Deckwer. John Wiley & Sons Ltd, Chichester, 1992 J. Chem. Technol. Biotechnol. 58, 403–404.
Zhang, T., Wang, T., Wang, J., 2006. Analysis and Measurement of Mass Transfer in Airlift Loop Reactors. Chinese J. Chem. Eng. 14, 604–610.

85
Appendices
Appendix A: Typical graphs from DO measurements (a), and kLa determination (b),
obtained for the same Ad/Ar ratio using five different aeration rates.
(a)
0
1
2
3
4
5
6
7
8
9
10
0 2 4 6 8 10 12 14 16
DO c
once
ntra
tion
(mg/
L)
Time, t (min)
0.175 VVM0.437 VVM0.568 VVM0.699 VVM0.874 VVM

86
(b)
y = -0.2314x + 2.0996R² = 0.9981
y = -0.6549x + 1.911R² = 0.9996
y = -0.9126x + 1.8398R² = 0.9987
y = -1.1462x + 1.7485R² = 0.9987
y = -1.7645x + 1.5659R² = 0.997
-1.5
-1
-0.5
0
0.5
1
1.5
2
2.5
0 2 4 6 8 10 12 14
ln (C
*-C)
Time, t (min)
0.175 VVM0.437 VVM0.568 VVM0.699 VVM0.874 VVM

87
Appendix B: Sample excel sheet used for calculation the error of the method of kLa
determination
O2 Sparging T=23 C max DO mg/l=8.56 O2 Sparging T=22 C max DO mg/l=8.72114.37 Volume of Reactor (L) 114.37
Volume of the Riser (L) 37.79 Volume of the Riser (L) 37.79Max flow (L/min)
Scale flow (mm)
Approx flow (L/min)
VVM Riser (L/(L*min))
Max flow (L/min)
Scale flow (mm)
Approx flow (L/min)
VVM Riser (L/(L*min))
100.000 100 100 2.646 100.000 100 100 2.64606714
Time(s)Measured O2 Conc (mg/L) Ln(C*-C) Kla (1/hr) Time(s)
Measured O2 Conc (mg/L) Ln(C*-C) Kla (1/hr)
0 2.147 0.02 2.163323030.000 4.23 1.466 125.623 0.000 4.65 1.404 147.5630.008 7.04 0.419 207.365 0.008 7.53 0.174 #NUM!0.017 8.29 -1.309 #NUM! 0.017 8.720.025 8.56 0.0250.133 Kla/h 166.494 0.133 Kla/h 147.563
R2 0.980 R2 1.000
Volume of Reactor (L)
O2 Sparging T=23 C max DO mg/l=8.56 O2 Sparging T=23 C max DO mg/l=8.56Volume of Reactor (L) 114.37 Volume of Reactor (L) 114.37Volume of the Riser (L) 37.79 Volume of the Riser (L) 37.79Max flow (L/min)
Scale flow (mm)
Approx flow (L/min)
VVM Riser (L/(L*min))
Max flow (L/min)
Scale flow (mm)
Approx flow (L/min)
VVM Riser (L/(L*min))
100.000 100 100 2.646 100.000 100 100 2.646
Time(s)Measured O2 Conc (mg/L) Ln(C*-C) Kla (1/hr) Time(s)
Measured O2 Conc (mg/L) Ln(C*-C) Kla (1/hr)
0.000 0.02 2.145 0.06 2.1400.008 5.5 1.118 197.526 0.000 4.63 1.369 179.5770.017 7.97 -0.528 #NUM! 0.008 7.68 -0.128 #NUM!0.025 8.56 0.017 8.560.033 0.025
Kla/h 197.526 0.133 Kla/h 179.577R2 1 R2 1
O2 Sparging T=23 C max DO mg/l=8.56Volume of Reactor (L) 114.37Volume of the Riser (L) 37.79Max flow (L/min)
Scale flow (mm)
Approx flow (L/min)
VVM Riser (L/(L*min))
Average k L a
STD (s) k L a
SEkLa 95% CI
100.000 100 100 2.646 177.386 20.955 9.371 18.368
Time(s)Measured O2 Conc (mg/L) Ln(C*-C) Kla (1/hr)
0.03 2.1440.000 4.88 1.303 195.7700.008 7.84 -0.329 #NUM!0.017 8.560.0250.133 Kla/h 195.770
R2 1

88
Appendix C: Sample excel sheet used for calculation the error of the method of gas holdup,
ɛ determination
Ad/Ar=0.2 Diff. Diff. Diff. Diff. Diff.
STD (s) ɛ % max
0.007 0.017 0.027 0.032 0.043
14.075 0.008 0.018 0.029 0.034 0.046
0.008 0.019 0.03 0.036 0.049
SEɛ % max 0.009 0.02 0.031 0.038 0.051
5.746
0.009 0.02 0.032 0.04 0.054 0.01 0.022 0.034 0.046 0.062
95% CI % max STD (s) ɛ 0.0010 0.0018 0.0024 0.0050 0.0067
11.263
SEɛ 0.0004 0.0007 0.0010 0.0020 0.0027 95% CI 0.0008 0.0014 0.0019 0.0040 0.0053 STD (s) ɛ % 12.3389 9.0579 7.9639 13.1855 13.1328 SEɛ % 5.0373 3.6979 3.2513 5.3830 5.3614 95% CI % 9.8732 7.2478 6.3725 10.5506 10.5084
Ad/Ar=0.33 Diff. Diff. Diff. Diff. Diff. 0.005 0.024 0.033 0.034 0.059
0.005 0.025 0.034 0.036 0.064 0.005 0.025 0.035 0.038 0.066 0.006 0.026 0.036 0.04 0.068 0.006 0.026 0.037 0.044 0.07 0.006 0.027 0.038 0.046 0.072 STD (s) ɛ 0.0005 0.0010 0.0019 0.0046 0.0046 SEɛ 0.0002 0.0004 0.0008 0.0019 0.0019 95% CI 0.0004 0.0008 0.0015 0.0037 0.0037 STD (s) ɛ % 9.9586 4.1130 5.2699 11.6804 6.9726 SEɛ % 4.0656 1.6791 2.1514 4.7685 2.8466 95% CI % 7.9685 3.2911 4.2168 9.3462 5.5793
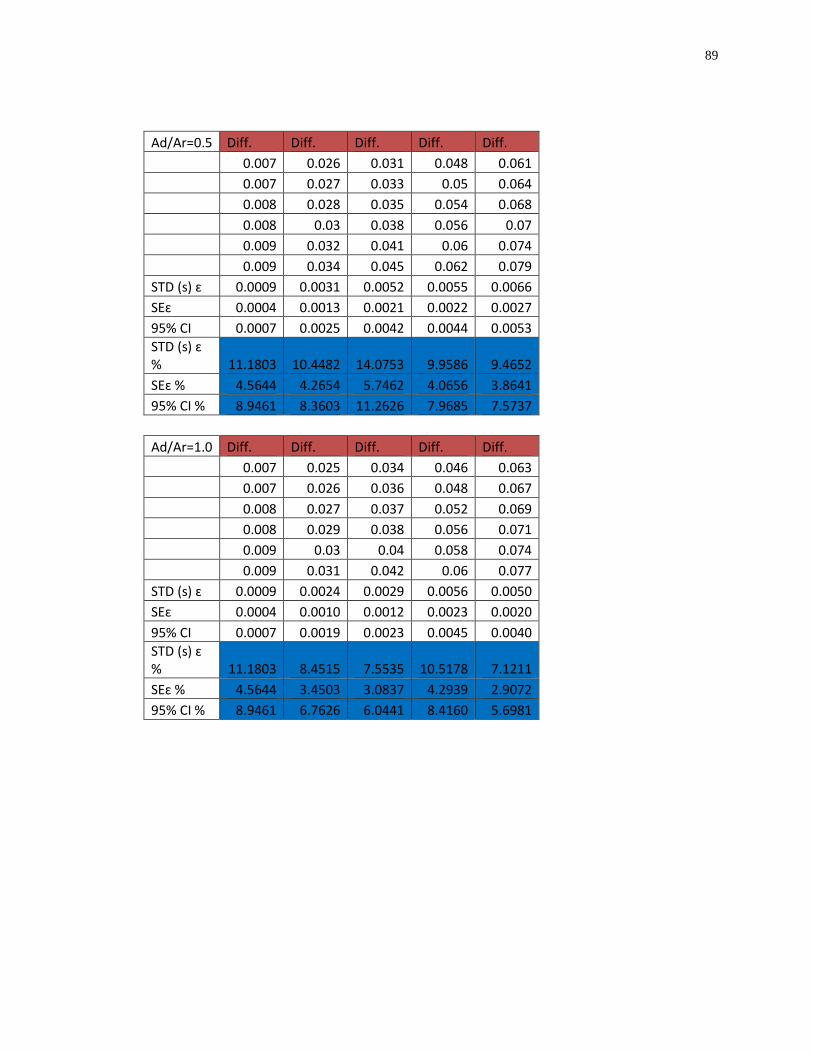
89
Ad/Ar=0.5 Diff. Diff. Diff. Diff. Diff. 0.007 0.026 0.031 0.048 0.061 0.007 0.027 0.033 0.05 0.064 0.008 0.028 0.035 0.054 0.068 0.008 0.03 0.038 0.056 0.07 0.009 0.032 0.041 0.06 0.074 0.009 0.034 0.045 0.062 0.079 STD (s) ɛ 0.0009 0.0031 0.0052 0.0055 0.0066 SEɛ 0.0004 0.0013 0.0021 0.0022 0.0027 95% CI 0.0007 0.0025 0.0042 0.0044 0.0053 STD (s) ɛ % 11.1803 10.4482 14.0753 9.9586 9.4652 SEɛ % 4.5644 4.2654 5.7462 4.0656 3.8641 95% CI % 8.9461 8.3603 11.2626 7.9685 7.5737
Ad/Ar=1.0 Diff. Diff. Diff. Diff. Diff. 0.007 0.025 0.034 0.046 0.063 0.007 0.026 0.036 0.048 0.067 0.008 0.027 0.037 0.052 0.069 0.008 0.029 0.038 0.056 0.071 0.009 0.03 0.04 0.058 0.074 0.009 0.031 0.042 0.06 0.077 STD (s) ɛ 0.0009 0.0024 0.0029 0.0056 0.0050 SEɛ 0.0004 0.0010 0.0012 0.0023 0.0020 95% CI 0.0007 0.0019 0.0023 0.0045 0.0040 STD (s) ɛ % 11.1803 8.4515 7.5535 10.5178 7.1211 SEɛ % 4.5644 3.4503 3.0837 4.2939 2.9072 95% CI % 8.9461 6.7626 6.0441 8.4160 5.6981

90
Ad/Ar=2.0 Diff. Diff. Diff. Diff. Diff. 0.012 0.028 0.036 0.048 0.061 0.012 0.028 0.038 0.052 0.065 0.014 0.03 0.04 0.056 0.069 0.015 0.03 0.042 0.058 0.073 0.016 0.032 0.044 0.06 0.075 0.016 0.034 0.048 0.062 0.079 STD (s) ɛ 0.0018 0.0023 0.0043 0.0052 0.0067 SEɛ 0.0007 0.0010 0.0018 0.0021 0.0027 95% CI 0.0015 0.0019 0.0035 0.0042 0.0053 STD (s) ɛ % 12.9519 7.7080 10.4528 9.3131 9.4597 SEɛ % 5.2876 3.1468 4.2673 3.8021 3.8619 95% CI % 10.3637 6.1677 8.3640 7.4521 7.5693
Ad/Ar=3.0 Diff. Diff. Diff. Diff. Diff. 0.007 0.024 0.028 0.037 0.047 0.007 0.026 0.03 0.039 0.052 0.008 0.028 0.032 0.041 0.057 0.008 0.028 0.034 0.043 0.061 0.009 0.03 0.038 0.044 0.065 0.009 0.032 0.04 0.044 0.068 STD (s) ɛ 0.0009 0.0028 0.0046 0.0029 0.0079 SEɛ 0.0004 0.0012 0.0019 0.0012 0.0032 95%CI 0.0007 0.0023 0.0037 0.0023 0.0064 STD (s) ɛ % 11.1803 10.1015 13.7620 6.9561 13.6139 SEɛ % 4.5644 4.1239 5.6183 2.8398 5.5579 95% CI % 8.9461 8.0829 11.0119 5.5660 10.8934

91
Ad/Ar=5.0 Diff. Diff. Diff. Diff. Diff. 0.016 0.038 0.054 0.062 0.07 0.017 0.04 0.056 0.066 0.074 0.018 0.042 0.058 0.068 0.078 0.018 0.042 0.058 0.072 0.082 0.019 0.044 0.06 0.076 0.084 0.02 0.046 0.062 0.078 0.088 STD (s) ɛ 0.0014 0.0028 0.0028 0.0061 0.0067 SEɛ 0.0006 0.0012 0.0012 0.0025 0.0027 95 CI 0.0011 0.0023 0.0023 0.0049 0.0053 STD (s) ɛ % 7.8567 6.7344 4.8766 8.7028 8.3865 SEɛ % 3.2075 2.7493 1.9909 3.5529 3.4238 95% CI % 6.2867 5.3886 3.9021 6.9637 6.7106

92
Curriculum Vitae
Name: Stanimir S. Drandev Post-secondary The University of Western Ontario Education and London, Ontario, Canada Degrees: 2013-2015 M.E.Sc
University “Prof. D-r Asen Zlatarov” Burgas, Bulgaria 1995-2000 M.E.Sc
Honours and Bulgarian Government Scholarship for Superior Results Awards: 1996-1998 Related Work Teaching Assistant Experience The University of Western Ontario
2014-2015 Multiple Engineering Positions LUKOIL Neftochim Burgas Ltd. 2001-2010
Publications: Drandev, S.S., Penev, K.I., Karamanev, D. (2015). Study of the hydrodynamics and mass transfer in a rectangular air-lift bioreactor. Chemical Engineering Science (submitted). Drandev, S.S., Karamanev, D. (2015). Energy consumption and energy balance in rectangular air-lift bioreactor for power generation in a microbial fuel cell. Biotechnology Letters (prepared for publishing).