Study of the Fear of Crime in the Municipality of Trbovlje … Rok Hacin, Katja Eman: Study of the...
17
Revija za kriminalistiko in kriminologijo / Ljubljana 65 / 2014 / 4, 299–315 299 1 Introduction 1 2 e development of crime mapping in Slovenia intensi- fied in the 1990’s, and over the last two decades, Geographical information systems (GIS) developed into the main crime mapping tool, through which advance functions enables the creation of manageable maps and detailed analyses of crimi- nal acts. e present study focuses on studying the connec- tions between crime rates and the perception of safety by the population in the municipality of Trbovlje. e study aims to combine crime mapping with the study of fear of crime, which stands for the fear of people of acts creating fear. e article defines the basic concepts, includes a review of past crime mapping research, fear of crime mapping, and crime mapping in Slovenia. e main part of the article focuses on the case study carried out in the municipality of Trbovlje, where po- lice statistics and a questionnaire on the perception of safety was used among the population to identify crime clusters and 1 Rok Hacin, Ph.D. student, Assistant and Junior Researcher, Facul- ty of Criminal Justice and Security, University of Maribor, Slove- nia. E-mail: [email protected] 2 Katja Eman, Ph.D., Assistant Professor of Criminology, Faculty of Criminal Justice and Security, University of Maribor, Slovenia. E- mail: [email protected] levels of fear of crime in local communities, and presented the identified occurrences on crime maps using the soſtware tool ArcGIS. e review of results at the end of the article also in- cludes proposals for the improvement of the situation in local communities in the municipality of Trbovlje. 2 Studying Fear of Crime Studies on the fear of crime date back to the 1960’s, when “e Challenge of Crime in a Free Society” 3 was published. Variables, such as race, social status, gender, age and prior vic- timisation were found to have an impact on the fear of crime. Brooks (1974) claims that fighting the fear of crime is more difficult than fighting crime itself due to the irrational charac- teristics of fear itself (Doran & Burgess, 2012). e fear of crime has an important impact on the qual- ity of life. How fear impacts the reactions of an individual is visible in physical and psychological changes as well as behav- 3 e Challenge of Crime in a Free Society – a collection of research on the fear of crime in the USA conducted by several American researchers. e results showed that the fear of crime has a negative impact on the quality of life in the USA (Doran & Burgess, 2012: 1). Study of the Fear of Crime in the Municipality of Trbovlje Using Crime Mapping Tools Rok Hacin, 1 Katja Eman 2 e purpose of the article is to show the crime rate in the year 2012 in the municipality of Trbovlje using the mapping program ArcGIS and to identify a possible link between density of crime and the level of fear of crime in local communities in Trbovlje. e analysis was conducted using official police statistics and geo-data on crime, and additionally, a descriptive method was used for the explanation of basic concepts and review of past studies. e bulk of the research is marked by a case study in the municipality of Trbovlje, where a questionnaire was used assess fear of crime. In the municipality of Trbovlje, the prevalent crime is crimes against property. e findings and the comparison of the area of distribution of fear of crime in local communities and of crime density show that the level of fear among the population of individual local communities is proportionate to the distribution of crime. e results showed that gender does not have a significant effect on the perceptions of fear of crime; on the contrary, the main differences were identified in two factors: consequences of possible victimization and the capability of property insurance. e distribution of fear of crime by age groups differs from the distribution in conventional models, as the highest levels were observed in the group of middle-aged individuals (26–45 years), followed by the oldest group of the population, those over 75. e applicability of the findings is in assisting the police in identifying crime hot spots and hot areas and locations with a higher level of the fear of crime. On the basis of these results, the police can take appropriate action in the municipality of Trbovlje. Keywords: crime mapping, fear of crime, municipality of Trbovlje, local communities UDC: 343.9
Transcript of Study of the Fear of Crime in the Municipality of Trbovlje … Rok Hacin, Katja Eman: Study of the...

Revija za kriminalistiko in kriminologijo / Ljubljana 65 / 2014 / 4, 299–315
299
1 Introduction1 2
The development of crime mapping in Slovenia intensi-fied in the 1990’s, and over the last two decades, Geographical information systems (GIS) developed into the main crime mapping tool, through which advance functions enables the creation of manageable maps and detailed analyses of crimi-nal acts. The present study focuses on studying the connec-tions between crime rates and the perception of safety by the population in the municipality of Trbovlje. The study aims to combine crime mapping with the study of fear of crime, which stands for the fear of people of acts creating fear. The article defines the basic concepts, includes a review of past crime mapping research, fear of crime mapping, and crime mapping in Slovenia. The main part of the article focuses on the case study carried out in the municipality of Trbovlje, where po-lice statistics and a questionnaire on the perception of safety was used among the population to identify crime clusters and
1 Rok Hacin, Ph.D. student, Assistant and Junior Researcher, Facul-ty of Criminal Justice and Security, University of Maribor, Slove-nia. E-mail: [email protected]
2 Katja Eman, Ph.D., Assistant Professor of Criminology, Faculty of Criminal Justice and Security, University of Maribor, Slovenia. E-mail: [email protected]
levels of fear of crime in local communities, and presented the identified occurrences on crime maps using the software tool ArcGIS. The review of results at the end of the article also in-cludes proposals for the improvement of the situation in local communities in the municipality of Trbovlje.
2 Studying Fear of Crime
Studies on the fear of crime date back to the 1960’s, when “The Challenge of Crime in a Free Society”3 was published. Variables, such as race, social status, gender, age and prior vic-timisation were found to have an impact on the fear of crime. Brooks (1974) claims that fighting the fear of crime is more difficult than fighting crime itself due to the irrational charac-teristics of fear itself (Doran & Burgess, 2012).
The fear of crime has an important impact on the qual-ity of life. How fear impacts the reactions of an individual is visible in physical and psychological changes as well as behav-
3 The Challenge of Crime in a Free Society – a collection of research on the fear of crime in the USA conducted by several American researchers. The results showed that the fear of crime has a negative impact on the quality of life in the USA (Doran & Burgess, 2012: 1).
Study of the Fear of Crime in the Municipality of Trbovlje Using Crime Mapping ToolsRok Hacin,1 Katja Eman2
The purpose of the article is to show the crime rate in the year 2012 in the municipality of Trbovlje using the mapping program ArcGIS and to identify a possible link between density of crime and the level of fear of crime in local communities in Trbovlje. The analysis was conducted using official police statistics and geo-data on crime, and additionally, a descriptive method was used for the explanation of basic concepts and review of past studies. The bulk of the research is marked by a case study in the municipality of Trbovlje, where a questionnaire was used assess fear of crime. In the municipality of Trbovlje, the prevalent crime is crimes against property. The findings and the comparison of the area of distribution of fear of crime in local communities and of crime density show that the level of fear among the population of individual local communities is proportionate to the distribution of crime. The results showed that gender does not have a significant effect on the perceptions of fear of crime; on the contrary, the main differences were identified in two factors: consequences of possible victimization and the capability of property insurance. The distribution of fear of crime by age groups differs from the distribution in conventional models, as the highest levels were observed in the group of middle-aged individuals (26–45 years), followed by the oldest group of the population, those over 75. The applicability of the findings is in assisting the police in identifying crime hot spots and hot areas and locations with a higher level of the fear of crime. On the basis of these results, the police can take appropriate action in the municipality of Trbovlje.
Keywords: crime mapping, fear of crime, municipality of Trbovlje, local communities
UDC: 343.9

Revija za kriminalistiko in kriminologijo / Ljubljana 65 / 2014 / 4, 299–315
300
ioural adaptations, such as avoidance and protective behav-iour, which affect the individual and society in the economic area. The theoretical connection between fear of crime on the one hand, and chaos and crime on the other was established with the Broken Windows Theory4 (Wilson & Kelling, 1982) and the Disorder and Decline Theory 5 (Doran & Burgess, 2012; Skogan, 1990).
Criminology includes four groups of theories (victi-misation, demographic, social and environmental theories), which explain reasons for the occurrence of the fear of crime. Victimisation theory (Routine Activities Theory) surmises that a rationally motivated offender commits a crime against a potential victim if the opportunity (time, space) arises and in the absence of a capable guardian (Cohen & Felson, 1979). Demographic theories study the fear of crime based on past experiences with crime or feelings of vulnerability. Demographic theories are divided into: 1) Direct victimisa-tion theory, 2) Indirect victimisation theory (media and fear of crime, interpersonal communication and fear of crime), and 3) Vulnerability theory (Doran & Burgess, 2012: 25). Social theories explain the fear of crime as a reflection of the general state of anxiety caused by a sudden change in society or a change in its factors. This state is evident in feelings of insecurity or uncertainty, fear of destruction of the social or-ganization of community, fear of the unknown, fear of poor social integration and the deterioration of the community, as well as fears caused by rapid social changes.
Social theories are divided into: 1) Risk Society Theory, and 2) Social Disorganization Theory (subculture diversity, social integration/cohesion in the community, concern for the community and social change) (Doran & Burgess, 2012). Environmental theories focus on external environmental factors that cause fear of crime. Signs of disorder and other factors in dangerous/disorderly environments may cause fear of crime. Environmental theories include: 1) Disorder and decline theory, 2) Crime signs theory, and 3) Theory of dan-
4 Broken windows theory – is a criminological theory of the norm-setting and signalling effect of urban disorder and vandalism on the development of crime and asocial behaviour. The theory states that monitoring and preserving an urban environment might pre-vent vandalism and escalation into more serious crime (Doran & Burgess, 2012: 11–13).
5 Disorder and decline theory – a criminological theory that studies the concept of disorder referring to minor offences and other forms of disturbing behaviour and conditions with a potential impact on the quality of life in the community. The theory states that minor offences, which are overlooked, could escalate into more serious crime that would result in the fear of crime among residents and could lead to the destabilization of the community due to adapted behaviour by residents (Doran & Burgess, 2012: 13–16).
gerous/disorderly and safe/orderly environments (Doran & Burgess, 2012).
The conventional models of police activities do not focus on fear of crime. Consequently, this area is covered by prob-lem-oriented, zero-tolerance and community-oriented mod-els. According to the problem-oriented model, police work fo-cuses primarily on prevention (annulment of problems before crime occurs).
The prevention process is carried out on the basis of the SARA model (scanning, analysis, response and assessment) in cooperation with public agencies and the private sector. Police activity based on the zero-tolerance model aims to prevent disorder from escalating into crime or causing fear of crime, and assumes that police intervention against disorder reduces criminal activities and the deterioration of the com-munity. Community-oriented police activity is evident in a partnership between the police and the community, proactive problem solving, and the inclusion of the community in the settlement of problems associated with crime, fear of crime and other problems in the community (Doran & Burgess, 2012: 51–56).
The Crime Prevention Through Environmental Design (CPTED) strategies are based on the theory that the “correct” design/architecture and effective use of the physical environ-ment reduces the possibility of incidents and the emergence of fear of crime, and contribute to a better quality of life (Crowe, 1991: 81). The goals of the strategies are to change the physical environment in a way that reduces criminal activity (and con-sequently reduces fear of crime) and to encourage individuals to use public space, which they avoided in the past (Doran & Burgess, 2012: 61).
Fear of crime is defined as an emotional reaction – con-cern about crime or a reaction to symbols an individual as-sociates with crime. This definition of fear of crime alludes to the fact that certain forms of recognizing potential danger, called perceived risks, are necessary for evoking fear (Ferraro, 1995). Defining fear as an emotion is important for differen-tiating between otherwise related emotional and cognitive reactions to crime, which are conceptually different. Carlson and Hatfield (1992) define emotion as a specific mental state, which includes physical responses that stimulate or slow down motivated behaviour. Skogan (1999) understands cog-nitive evaluation as an individual’s judgments of crime (as-sessment of personal risk and general concern about crime). Ferraro and LaGrange (1987) were the first to present the dif-ference between emotional and cognitive perceptions in their Taxonomy (see Table 1) (Doran & Burgess, 2012: 67–68).

301
Rok Hacin, Katja Eman: Study of the Fear of Crime in the Municipality of Trbovlje Using Crime Mapping Tools
Fear of crime manifests itself in two dimensions, whereby the first refers to the type of victimisation (personal or prop-erty), and the second focuses on the subject of victimisation (personal or altruistic). Garofalo (1981) claims that the level of fear and reactions to fear vary, based on physical threats that af-fect an individual or property (Doran & Burgess, 2012: 71–72).
Research on fear of crime is based on three approaches: cognitive, affective and behavioural. The cognitive approach consists of the global measurement, based on the perception of risks, and the measurement of values and fears, which evalu-ates opinions of individuals on the gravity of crime in their communities. In contrast to the cognitive approach, which is based on an individual’s perception of safety, the affective ap-proach focuses on the emotional reaction and tries to measure the fear of crime in the “literal sense”. Lastly, the behavioural approach is an emotion-based measurement focusing on the specific type of crime. The behavioural approach studies pro-tective measures and avoidance strategies of individuals, who try to reduce their fear of crime. Protective measures include strategies of personal control and collective action. Avoidance strategies, on the other hand, include actions that reduce expo-sure to crime by distancing oneself from situations that repre-sent high victimisation risks (Doran & Burgess, 2012).
Traditional statistical techniques, including bivariate analyses, Pearson correlation coefficient, Spearman’s correla-tion coefficient, and Chi-squared test and complex analyses, are used for analysing fear of crime (Doran & Burgess, 2012). Due to the need for visual presentations of areas with a high occurrence of crime, the first attempts at crime mapping (in-cluding fear of crime) took place in the mid 19th century.
3 Crime Mapping – Advantages and Weak-nesses
Mapping crime and other deviations dates back to the 19th century, when criminologists of the Cartographic School studied regions in connection with social factors and socio-
economic status. Adriano Balbi and André Michael Guerry prepared the first map that showed crime against health in France (Weisburd & McEven, 1997). In the same period, Adolpho Quetelet used maps to analyse the connection be-tween crime, trade routes, and education levels, as well as ethnic and cultural variations (Boba Santos, 2013: 10). The first complex spatial crime analysis was carried out by urban sociologists in the 1920’s and 1930’s in Chicago. By combin-ing crime mapping with other demographic characteristics of the population, researchers tried to find a link between crime, criminal activities and social factors (Shaw & McKay, 1942). Phillips (1972) presents in detail, the development of map-ping among sociologists and criminologists, and classifies the spatial research of deviation since 1830 into three main schools: cartography/geographic school6, typological school7 and socio-environmental school8.
In the 1980’s, Brantingham and Brantingham (1991) de-veloped the environmental crime approach that focuses on the physical and social environment, and research within the environmental criminology approach led to the development of computational criminology.9 Eck and Liu (2008) claim that environmental criminology relies heavily on computational criminology, which they define as the application of computer
6 Cartography/geographic school – dominated in the period from 1830 to 1880, started in France (André Michael Guerry) and de-veloped further in England (Henry Mayhew). The school is based on social data collected by governments. Research focused on the impact of variables, such as wealth and density of population on the crime rate (Phillips, 1972).
7 Typological school – dominated in the period around 1880 and at the beginning of the 20th century. The school focused on the rela-tion between mental and physical features of people and crime.
8 Socio-environmental school – focuses on geographic differences in social conditions based on the assumption that they are related to crime patterns (Phillips, 1972).
9 Computational criminology – an approach that tries to solve crim-inological problems with the application of mathematics, com-puter science and criminology. Methods include algorithms, data research, data structure and software development (Phillips, 1972).
Table 1: Taxonomy of crime perceptions
Type of perception: cognitive and affective
Level Judgment Values Emotions
General A. Risk for others: crime or safety evaluations
B. Fear of how crime affects others C. Fear of the victimisation of others
Personal D. Personal risk: personal safety E. Fear of how crime affects the individual: personal intolerance
F. Fear of personal victimisation
Source: Ferraro & LaGrange (1987)

Revija za kriminalistiko in kriminologijo / Ljubljana 65 / 2014 / 4, 299–315
302
simulation of crime patterns that reveals hidden crime pro-cesses in urban environments, whereby the interdisciplinary approach combines criminology, computing and geographi-cal information system into an extensive data source. Within criminology, supporters of computational criminology divide themselves into two branches: 1) criminologists, who use the methods of computer simulations for justifying and develop-ing theory (Brantingham & Brantingham, 2004; Eck, 2005; Groff, 2007) and, 2) criminologists, who use the methods of computer simulations to support police activities (Perez et al., 2005). In their study, Brantingham and Brantingham (1998) compared maps with the distribution of violent crime in cities in British Columbia based on three characteristics of crime: 1) number, 2) level, and 3) local quotients of crime (LQC)10. The study revealed the advantages of using local quotients of crime as opposed to using the number of criminal acts, which is based on official police statistics that often deviates. The local quotient of crime was calculated using the following formula:
where n = research area, N = all areas, = number of crimi-nal activities included in the research, and = number of all criminal activities (Brantingham & Brantingham, 1998). The “hot spots” analysis11 became an important part of crimi-nology, analyses and crime prevention, which was also con-firmed by Brantingham and Brantingham (1999) in their study that on the basis of information from the Vancouver police (Canada) exposes specific elements of hot spots based on the characteristics of the living environment, Routine Activities theory (Cohen & Felson, 1979), the Life style theory (Hindelang, Gottfredson, & Garofalo, 1978), Rational choice theory (Coleman & Ferraro, 1992) and crime sample theory (Brantingham & Brantingham, 1999). Crime mapping and hot spots discussions took the hot spots theory (Block, 1998) to a different level. Brantingham and Brantingham (2008) an-alysed crime on multiple levels of integration by applying the topological organisation technique12 (Uludag, Lui, Nahrstedt, & Brewster, 2007).
10 LQC (Local quotients of Crime) – quotients of crime locations, show data on differences between areas, for the purpose of re-search and introduction of prevention and control (Brantingham & Brantingham, 1998).
11 Crime hot spot – location or small area with significant crime con-centration and a more or less identifiable border (point, line or area) (Anselin, Cohen, Cook, Gorr, & Tita, 2000).
12 Topological organisation technique – technique that enables the understanding of target selection by perpetrators during their movement through urban settlements (Uludag et al., 2007).
The study exposed the issue of standardized artificial bor-ders of spatial units, which limit the implementation of de-tailed analyses of spatial samples and algorithms of soft/blurry topology13 (Brantingham & Brantingham, 2008). The results of the study stressed the importance of initiating crime analysis in small spatial units (individual address), and a progressive transition to larger units (streets, neighbourhoods, cities, re-gions, states). This is necessary due to the occurrence of un-accountable factors in large unit analyses. Frank et al. (2010) presented the TOPO sampling model, which uses an algorithm to integrate the geographic approach and cognitive psychol-ogy in criminology. The application of topology enables spa-tial identification of crime concentration, deviations of crime and gradual fusion with bordering areas. The results revealed the applicability of the new TOPO model and confirmed prior findings that the majority of crime is concentrated in border ar-eas between neighbourhoods. Song, Frank, Brantingham, and LeBeau (2012) developed the visualisation technique, which enables the display of entire paths made by delinquents based on which samples are determined (connection between the residence of delinquents and locations of crime). The results of the study showed that delinquents focus on major transport routes, and their movements are concentrated to the city centre and a rather high frequency of movements between cities (for delinquents, who do not perform crime only in their city).
When studying the geographic characteristics of crime, criminologists use geographic information systems (hereinaf-ter: GIS), which is a computer tool used to establish the studied characteristics of crime and enables the testing of criminologi-cal theories as well as the planning of police activities within the framework of problem-oriented police work (Cordner & Perkins Biebel, 2005). Burrough and McDonnell (1998) define GIS as a set of tools that enables the capture, storage, search, transformation and presentation of spatial data. By applying the geographic approach to crime mapping, GIS systems en-able the identification of: 1) the place of residence of the per-petrators, 2) the location of the most vulnerable communities, 3) the movement/transport patterns of perpetrators to their targets, 4) reasons for the occurrence of crime in specific ar-eas, and 5) problematic areas with a high crime rate (Chainey, 2001). Information on crime is presented as thematic maps divided into quantitative (showing numeric information on studied locations) and qualitative (indicating qualitative char-acteristics of individual locations) data. The second classifica-tion divides thematic maps into statistical (which show raw data by individual units), point (uses points to show individual
13 Soft topology – mathematical science studying sets (in which an element can be a partial part of a series, contrary to traditional topology, in which an element either is or is not a part of a series), connection, no connection (Brantingham & Brantingham, 2008).
∑ ∑

303
Rok Hacin, Katja Eman: Study of the Fear of Crime in the Municipality of Trbovlje Using Crime Mapping Tools
crimes or combines crimes that occur more frequently), ho-roplet (which show separate distributions for specific admin-istrative areas), izoplet (which connect areas of equal values with lines), and linear maps (which show linear symbols pre-sented with a different lines) (Klinkon & Meško, 2005). In regards to crime mapping, Clarke and Eck (2008) distinguish between acute and chronic crime hot spots, whereby they de-termined three basic forms of chronic crime hot spots, which were defined in detailed by Ratcliffe (2004): 1) hot dots, 2) hot lines, and 3) hot areas. Crime mapping is a supporting activ-ity, which facilitates the implementation of police activities: 1) call response, 2) collecting information at crime locations, 3) use of patrols and focused response, 4) analysis and acquisition of police intelligence, 5) data exchange with partner agencies, and 6) reassuring the public (Home Office, 2005).
The advantages of crime mapping are: 1) support for the implementation of police activities, 2) visual presentation and communication, 3) overcoming inaccurate perceptions of prob-lem areas, 4) developing a comprehensive approach to crime analysis in an integrated police information system, 5) easier establishment of connections between crime and other fac-tors (demographics, location characteristics, socio-economic situation), and 6) the knowledge-based crime prevention in the future (Home Office, 2005; Klinkon & Meško, 2005). Despite numerous advantages of this approach, there are several weak-nesses or possible errors, among them: 1) generalization errors, 2) irregularities in the preparation of maps with the aim to con-ceal certain information, 3) manipulation of statistical data, 4) irregularities in the preparation of maps due to the poor quality of data obtained from selective submission of data, and 5) the so-called “GIGO” (Garbage In, Garbage Out)14 phenomenon (Quinion, 2005). All advantages and weaknesses are noticeable while mapping crime and fear of crime.
4 Mapping Crime and the Fear of Crime
Crime mapping has a long tradition, while mapping fear of crime was only introduced recently. Numerous methodologi-cal issues, which affected the development of crime mapping, also represent a challenge for mapping fear of crime that repre-sents an even larger problem from the point of view of validity and reliability. This is because it comes before crime as an emo-tional response; concern about crime or a reaction to symbols an individual associates with crime (Ferraro, 1995). This defi-
14 Garbage In, Garbage Out (GIGO) – process from the field of computer science, information and communication technology, which refers to the fact that computers will blindly process unin-tended/nonsensical data entries (Garbage In) and produce unde-sired/nonsensical data (Garbage Out) (Quinion, 2005).
nition of the fear of crime communicates that the perception of a victimization risk is necessary for the occurrence of fear of a specific form of potential danger. The review of studies on the fear of crime revealed that there are only a handful on mapping fear of crime. Park et al. (2011) studied ways of measuring fear of crime, whereby we find the use of a virtual environment and studying behavioural reactions of studied persons interesting. The experiment was carried out on a sample of elderly people, which could choose different paths through China town (a known problem area in Vancouver) to reach their destination in the virtual world. The results showed the applicability of the new method, above all with regards to the measurement of the fear of crime among the elderly, because the experiment high-lighted which signs of a potential threat participants paid more attention to and which had a considerable impact on their path selection (behavioural adaptation).
Doran and Burgess (2012) provided insight into the di-mensions of the fear of crime and the characteristics of the local environment through the application of GIS in con-junction with behavioural geography techniques (cognitive mapping), and analyses of dairies of activities of the partici-pants in the research. The analysis was carried out using four approaches: 1) questionnaire and an analysis of the fear of crime, 2) disorder evaluation, 3) spatial analysis of crime, and 4) combinatorial spatial analysis. These established that an individual’s cognitive map affect his/her behaviour. This part of the study revealed characteristics of collective behavioural forms, which point to avoidance strategies. Activity diaries disclosed the time dimension of movements of people in spe-cific areas and their self-protective behaviour. In combination with data on reported crime and the perception of social15 and physical disorder,16 they established that crime hot spots and reactions of people have different patterns, which differ over the course of a work day. In the study carried out in the King Cross area in Sydney, Doran and Burgess (2012) continued to develop techniques for the mapping of perceptions of so-cial and physical disorder in combination with the behaviour of people (avoidance of dangerous areas due to the belief on possible victimisation), in which they studied spatial and time-related data on an individual’s fear of physical injuries, personal assault and robbery. Their study reviewed environ-mental factors, which cause fear among people and trigger an avoidance reaction, because they sought to determine if spatial avoidance visualisation provides new insights into the
15 Social disorder – form of disorder usually visible as: public drink-ing, vagrancy, begging, groups of adolescents roaming the city, harassment, sale and use of drugs in public places (Meško, 2006).
16 Physical disorder – form of disorder usually visible as: uncleanli-ness, rundown buildings, trash, graffiti, vandalism and abandoned cars (Meško, 2006).
Revija za kriminalistiko in kriminologijo / Ljubljana 65 / 2014 / 4, 299–315
304
fear of crime in public places. The occurrence of a different fear level among studied individuals due to different envi-ronmental factors and more intensive avoidance behaviour during the night was confirmed on two-dimensional maps. These maps, which present avoidance behaviour, confirmed that environmental factors match the locations of crime hotspots. Behavioural patterns presented in the maps indicate that roads/streets are an important marker between safe and dangerous areas. On the basis of four environmental factors: 1) drug users, 2) prostitutes, 3) areas offering hideouts, and 4) gangs, 3D maps of avoidance behaviour were prepared and show the differences in avoidance patterns at a micro level, based on the impacts of environmental factors.
The results were presented in separate maps for men/women and residents/visitors of King Cross. Researchers at University College London, through the application of spatial and time data on the perception of safety in the urban envi-ronment (London), are currently carrying out a study in which they are attempting to identify the characteristics and a connec-tion between fear of crime and other factors on everyday routes used by people in London (University College London, 2013).
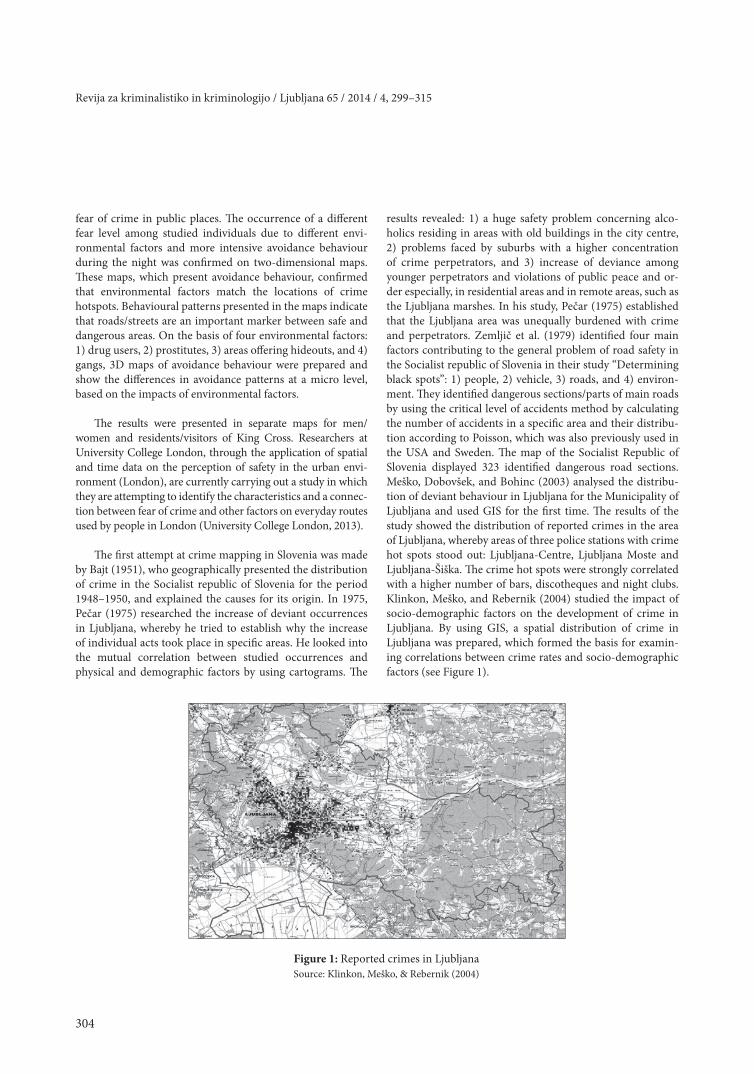
The first attempt at crime mapping in Slovenia was made by Bajt (1951), who geographically presented the distribution of crime in the Socialist republic of Slovenia for the period 1948–1950, and explained the causes for its origin. In 1975, Pečar (1975) researched the increase of deviant occurrences in Ljubljana, whereby he tried to establish why the increase of individual acts took place in specific areas. He looked into the mutual correlation between studied occurrences and physical and demographic factors by using cartograms. The
results revealed: 1) a huge safety problem concerning alco-holics residing in areas with old buildings in the city centre, 2) problems faced by suburbs with a higher concentration of crime perpetrators, and 3) increase of deviance among younger perpetrators and violations of public peace and or-der especially, in residential areas and in remote areas, such as the Ljubljana marshes. In his study, Pečar (1975) established that the Ljubljana area was unequally burdened with crime and perpetrators. Zemljič et al. (1979) identified four main factors contributing to the general problem of road safety in the Socialist republic of Slovenia in their study “Determining black spots”: 1) people, 2) vehicle, 3) roads, and 4) environ-ment. They identified dangerous sections/parts of main roads by using the critical level of accidents method by calculating the number of accidents in a specific area and their distribu-tion according to Poisson, which was also previously used in the USA and Sweden. The map of the Socialist Republic of Slovenia displayed 323 identified dangerous road sections. Meško, Dobovšek, and Bohinc (2003) analysed the distribu-tion of deviant behaviour in Ljubljana for the Municipality of Ljubljana and used GIS for the first time. The results of the study showed the distribution of reported crimes in the area of Ljubljana, whereby areas of three police stations with crime hot spots stood out: Ljubljana-Centre, Ljubljana Moste and Ljubljana-Šiška. The crime hot spots were strongly correlated with a higher number of bars, discotheques and night clubs. Klinkon, Meško, and Rebernik (2004) studied the impact of socio-demographic factors on the development of crime in Ljubljana. By using GIS, a spatial distribution of crime in Ljubljana was prepared, which formed the basis for examin-ing correlations between crime rates and socio-demographic factors (see Figure 1).
Figure 1: Reported crimes in Ljubljana Source: Klinkon, Meško, & Rebernik (2004)

305
Rok Hacin, Katja Eman: Study of the Fear of Crime in the Municipality of Trbovlje Using Crime Mapping Tools
Researchers compared the results with the opinion of re-spondents and tried to determine areas with a higher crime rate (see Figure 2), based the perception of the problem among residents. Results revealed different crime levels in in-dividual areas of the Municipality of Ljubljana, and the impact of the socio-demographic structure in Ljubljana on different levels and types of crimes (Meško, Dvoršek, Dobovšek, Umek, & Bohinc, 2003).
Meško, Maver, and Klinkon (2010), by using crime map-ping for the purpose of crime investigation, analysed the in-crease in the number of specific crimes (theft, burglary, rob-bery) in Ljubljana in 2003 and 2004. They used the Kernel density estimation,17 which revealed the increase of these specific crimes in the centre of the Slovenian capital and their expansion towards the outskirts of the city. A concentration of crime was determined in the shopping and entertainment area, which features large parking places and a high fluctua-
17 Kernel density estimation – a statistical method for estimating the probability density function of a random variable (Botev, Grotowski, & Kroese, 2010).
tion of people; in the city centre with the main railway and bus stations, in park Tivoli (park and sports objects), in Tabor (neighbourhood in the city centre, close to the methadone centre and a known gathering place for young people) and in other neighbourhoods on the outskirts of the city, like Remiza, Trnovski pristan and Nove Fužine. Eman, Meško, and Ivančić (2012) looked into forms of environmental crime in the area of police administration Murska Sobota. Using
GIS and prepared maps of concentrations of environmental crime in Pomurje, they analysed this based on police statis-tics for the period 2008–2010. The results showed that the highest numbers of environmental crimes are concentrated in remote areas close to the border, in the Mura river basin and in the proximity of settlements located next to the main traffic routes between Gornja Radgona and Lendava. The lat-est research in Slovenia on crime mapping by Eman, Györkös, Lukman, and Meško (2013), presents GIS use in Slovenia in two studies: 1) analysis of hot spots of crimes against property in Ljubljana and Maribor in 2010, and 2) project krimistat.si. The results of the first study revealed a concentration of crimes against property in city centres and their expansion
Figure 2: Map of the perception of crime in Ljubljana by respondentsSource: Klinkon, Meško, & Rebernik (2004)

Revija za kriminalistiko in kriminologijo / Ljubljana 65 / 2014 / 4, 299–315
306
via the main roads towards the outskirts of the cities. At the same time, they detected a higher number of crimes against property in shopping centres and entertainment areas. Project Krimistat.si is an online application, which combines data from police statistics using the Google maps application. The purpose of the project was to create an application which would be widely accessible and user-friendly, but the protec-tion of personal data prevents the use of the online application Krimistat.si. General dilemmas in detecting crime are evident in the lack of knowledge of administrative units by people and the strength of connecting the perception of crime with the residence and daily activities.
A study to attempt to measure crime and the fear of crime in Slovenia was carried out by Klinkon, Meško, and Rebernik (2004), while other studies measured only crime itself. By us-ing crime mapping, we studied crime and the fear of crime in the municipality of Trbovlje, where we looked for a connec-tion between the distribution of crime in local communities in 2012, and the level of the fear of crime among those resi-dents. We also identified locations which raise the highest fear of crime levels among residents.
5 Study in the Municipality of Trbovlje
The Zasavje region consists of three formerly industrial towns: Zagorje ob Savi, Trbovlje, and Hrastnik. We decided to perform the study in a difficult environment such as Trbovlje, because the poor economic and social standard in the cities of the Zasavje region is most visible here. Compared to the oth-er two cities, Trbovlje has the highest crime rate18 (Trbovlje: 292.5, Zagorje ob Savi: 213.0 and Hrastnik: 172.9), the highest number of criminal offences (Trbovlje: 494, Zagorje ob Savi: 360 and Hrastnik: 170) and the highest unemployment level (Trbovlje: 16%, Zagorje ob Savi: 10.7% and Hrastnik: 13.5%) (Statistical Office of the Republic of Slovenia, 2013).
The municipality of Trbovlje, which is controlled by Police station Trbovlje, is part of Police Administration Ljubljana and encompasses 57.6 km2. The municipality has 10 local commu-nities (Alojz Hohkraut, Center, Franc Fakin, Franc Salamon, Ivan Keše, Fric Keršič, Klek, Zasavje, Čeče, Dobovec) with 16.888 residents (Municipality of Trbovlje, 2013). The major-ity of the population lives in the urban area, in the 7 km-long valley of the stream Trboveljščica, which flows into the river Sava. Only 10% of the population lives in suburban areas.
18 The crime rate is calculated using the formula no. of criminal of-fences/no. of population x 10,000 residents.
Because the recognition of patterns and crime hot spots is an important factor in the prevention of crime and the imple-mentation of prevention activities, crime mapping is becom-ing one of the most important police tasks. Experience of for-eign security bodies (other police forces) confirm the central role of crime mapping in the prevention of crime and provi-sion of valuable experience and models/methods for mapping fear of crime. Based on the results of former studies, we pre-pared a study on crime mapping and mapping fear of crime in the municipality of Trbovlje. We were interested in the visu-alisation and actual distribution of crime in the local commu-nities within the municipality of Trbovlje in 2012; therefore, we analysed data on crime in the area of the municipality and transferred it onto the map of the municipality using GIS. The study of the perception of safety among the population in the municipality was carried out using a questionnaire that also identified local communities with the highest detected level of fear of crime. Through GIS, we transferred the data onto a map of the municipality and compared it to the distribution of crime in local communities, as presented below.
5.1 The Process of Data Gathering and Processing
From the crime data base for 2012, we selected crimi-nal offences that occurred in the municipality of Trbovlje, and analysed the general classification with regard to the lo-cal communities. The coordinates of criminal offences were transferred onto the map of the municipality by using soft-ware tool ArcGIS. We analysed the data and also defined the areas in those local communities with the highest number of criminal offences. Due to imperfections in provided coordi-nates on criminal offences, we were unable to define around five per cent of detected criminal offences in crime mapping, and could not show them on the map. They were, however, in-cluded in the analysis of crime in the municipality of Trbovlje.
The study included all local communities in the munici-pality, and the sample included 350 adult respondents from ten local communities. The results of the questionnaire were analysed by using a statistical software tool, presented on the map of the municipality and compared with the distribution of crime in local communities.
5.2 Presentation of Results
Statistics on crime in the municipality of Trbovlje show that 494 criminal offences (see Table 2) were recorded in 2012. The classification of criminal offences by area followed the classification of the Statistical Office of the Republic of Slovenia, which is based on the provisions of the Penal Code of the Republic of Slovenia (Jacović, 2005).

307
Rok Hacin, Katja Eman: Study of the Fear of Crime in the Municipality of Trbovlje Using Crime Mapping Tools
Table 2 shows the distribution and types of criminal of-fences in 2012 in the municipality of Trbovlje. It is evident that criminal offences against property and criminal offences against marriage, family and youth are predominant, but the number of considered cases on the annual level is low.19 The
19 In 2012, the municipalities of Škofja Loka, Murska Sobota, Izola and Jesenice, which are comparable to the municipality of Trbov-
table also includes data for all considered criminal offences in Slovenia, which were compared to data on all types of criminal offences committed in the municipality of Trbovlje. When compared to the entire country, around 0.54 per cent
lje as regards size and population, recorded a higher number of criminal offences (Škofja Loka – 662, Murska Sobota – 996, Izola – 601 and Jesenice – 506).
Table 2: Number of crimes per resident and crime rate in the municipality of Trbovlje and the entire country in 2012
Municipality Trbovlje
(no. of criminal offences)
Municipality Trbovlje
(crime rate)**
Slovenia(no. of criminal
offences)
Slovenia (crime rate)**
Criminal offences in the municipality compared
to the entire Slovenia (%)
Crime against human rights
31 18.4 2652 12.8 1.17
Crime against human health
16 9.5 1812 8.8 0.88
Crime against employment and social security
2 1.9 908 4.4 0.22
Crime against economy 8 4.7 5400 26.2 0.15
Crime against public peace and order
6 3.6 1087 5.3 0.55
Crime against legal tran-sactions
5 2.9 1706 8.3 0.29
Crime against justice administration
3 1.8 299 1.5 1.00
Crime against property 320 189.5 66600 320.6 0.48
Crime against the general safety of people and property
3 1.8 337 1.6 0.89
Crime against inviolability of sexual integrity
3 1.8 472 2.3 0.64
Crime against official duty and powers conferred by public law
2 1.9 282 1.4 0.71
Crime against marriage, family and youth
76 45.0 2574 12.5 2.95
Crime against life and person
19 11.3 2864 13.9 0.66
TOTAL 494 292.5 90700* 440.5 0.54
* The number shows all criminal offences that occurred in Slovenia in 2012.** The crime rate is calculated according to the formula no. of criminal offences/no. of residents x 10,000.Source: General Police Directorate, Department for Planning and Analytics (2013); Jacović (2005)

Revija za kriminalistiko in kriminologijo / Ljubljana 65 / 2014 / 4, 299–315
308
of all criminal offences are committed in the municipality of Trbovlje. The comparison of crime rates for individual groups of criminal offences in the municipality of Trbovlje and the entire country shows that the crime rate in the municipality of Trbovlje is higher in nearly 50% of cases. Trbovlje also records high crime rates of crimes against property (189.5), crimes against marriage, family and youth (45.0) and crimes against human rights (18.4). The crime rate for crimes against mar-riage, family and youth in Trbovlje is nearly four times higher than for the entire Slovenia. On the other hand, we established
that the crime rate for crimes against the economy is nearly six times lower in Trbovlje (4.7) than in Slovenia (26.2).
In addition to the presented ratios between the number of crimes in the municipality of Trbovlje and Slovenia as a whole, we also compared the distribution of individual crimes, clas-sified according to the Penal Code of the Republic of Slovenia (Jacović, 2005) for local communities in the municipality of Trbovlje, as shown in Table 3 below.
Table 3: Number of crimes in local communities in the municipality of Trbovlje in 2012
Alojz Hohkraut Center Čeče Dobovec Franc
FakinFranc
SalamonFric
KeršičIvan Keše Klek Zasavje TOTAL
Crime against human rights 15 8 4 3 1 31
Crime against human health 2 3 2 2 6 1 16
Crime against employment and social security
1 1 2
Crime against economy 5 1 2 8
Crime against public peace and order
1 2 1 2 6
Crime against legal transactions 3 1 1 5
Crime against justice admini-stration
2 1 3
Crime against property 30 131 4 3 36 21 30 14 5 46 320
Crime against the general safety of people and property
1 2 3
Crime against inviolability of sexual integrity
2 1 3
Crime against official duty and powers conferred by public law
2 2
Crime against marriage, family and youth
13 5 5 19 33 1 76
Crime against life and person 2 4 2 2 3 2 1 3 19
TOTAL 48 174 6 3 58 23 61 60 7 54 494
Crime rate* 264.2 503.2 115.1 64.8 164.1 404.2 219.0 234.4 113.8 954.1 292.5
* The crime rate is calculated according to the formula no. of criminal offences/no. of residents x 10,000.Source: General Police Directorate, Department for Planning and Analytics (2013); Jacović (2005)

309
Rok Hacin, Katja Eman: Study of the Fear of Crime in the Municipality of Trbovlje Using Crime Mapping Tools
Table 3 reveals the pattern of reported crime in the mu-nicipality of Trbovlje. Next to crimes against property, the main crimes include crimes against marriage, family and youth, as well as crimes against human rights. Of all the crimes, those against employment and social security as well as crimes against official duty and powers conferred by public law, were the least frequent in 2012. The majority of criminal offences was re-corded in the area of local community (hereinafter: LC) Center, followed by LC Fric Keršič and Ivan Kerše. All three local com-munities are located in a more urban part of the municipality. Of all the local communities, the lowest frequency of criminal
offences was recorded in Dobovec and Čeče, which are more rural settlements on the outskirts of the municipality. The crime rate is the highest in LC Center, LC Franc Salamon and LC Zasavje. Local communities Franc Salamon and Zasavje are not ranked high as regards the number of registered criminal acts, but the crime rate is high due to a small number of residents.
All criminal offences mentioned above were presented on a map of the municipality of Trbovlje using GIS. The visual presentation of crime in the municipality in 2012 yielded the following figure.
Legend: - criminal offence, - objects
Figure 3: Crime distribution in the local communities in the municipality of Trbovlje in 2012

Revija za kriminalistiko in kriminologijo / Ljubljana 65 / 2014 / 4, 299–315
310
In the research on the feelings of safety among the resi-dents of the municipality of Trbovlje, we used an adapted questionnaire that was previously used in the pilot study on fear of crime in Ljubljana (Meško & Šifrer, 2008; Meško, Šifrer, & Vošnjak, 2012; Vošnjak, 2011). The questionnaire includes three sets of questions: 1) a modified integral model, 2) modi-
fied Van der Wurff socio-demographic model and the socio-psychological model, and 3) demographic data (Hirtenlehner, Meško, & Vošnjak, 2009). The sample consisted of 350 adult respondents from ten local communities in the municipality of Trbovlje (see Table 4), who answered questions on social cohesion in the neighbourhood, physical and social disorder
in the neighbourhood, feeling of safety at night, safety of loca-tions in Trbovlje, victimisation possibilities, property protec-
tion, health condition, physical fitness, consequences of vic-timisation, previous victimisation, and shared victimisation. The number of criminal offences, the crime rate and average values of answers provided by respondents regarding the fear of crime are presented in Table 5 by local community.
Table 4 includes data on the number of respondents by local community and the calculated shares with regard to the overall number of residents. In continuation, we will present the crime rate and the rate of fear among residents of local communities (Table 5).
Data in Table 6 on the rate of the fear of crime by local community is presented in Figure 4.
Table 4: Share of respondents per local community in the municipality of Trbovlje
Local community No. of respondents No. of residents Share (%)
KS Alojz Hohkraut 43 1817 2.37KS Center 59 3458 1.71KS Čeče 8 521 1.54KS Dobovec 9 463 1.94KS Franc Fakin 67 3534 1.89KS Franc Salamon 19 569 3.33KS Fric Keršič 50 2785 1.79KS Ivan Keše 60 2560 2.34KS Klek 20 615 3.25KS Zasavje 15 566 2.65
SKUPAJ 350 16888 2.07
Source: Statistical Office of the Republic of Slovenia (2013)
Table 5: Crime rate and the rate of fear among residents of local communities in the municipality of Trbovlje
Local community Number of cri-minal offences Crime rate Average values of
the fear of crime (M) Standard deviation
KS Alojz Hohkraut 48 264.2 2.0051 0.5174KS Center 174 503.2 1.9368 0.5466KS Čeče 6 115.1 1.7487 0.5452KS Dobovec 3 64.8 1.6352 0.4883
KS Franc Fakin 58 164.1 1.9112 0.5699
KS Franc Salamon 23 404.2 1.7948 0.5768KS Fric Keršič 61 219.0 1.9147 0.5554KS Ivan Keše 60 234.4 1.9349 0.5512KS Klek 7 113.8 1.7694 0.5265KS Zasavje 54 954.1 2.0806 0.4745POVPREČJE 494 292.5 1.8732 0.5352

311
Rok Hacin, Katja Eman: Study of the Fear of Crime in the Municipality of Trbovlje Using Crime Mapping Tools
The intensity of the fear of crime is presented with differ-ent colours: 1) red – high fear of crime (average values of the crime rate exceed 2.0000), 2) orange – medium fear of crime (average values of the crime rate range between 1.9000 and 2.0000) and yellow – low fear of crime (average values of the fear of crime range between 1.6000 and 1.8999).
6 Discussion
By analysing the collected data, we presented the results on a map showing the fear levels in the local communities of the municipality of Trbovlje. Findings show that the pres-ence of fear in local communities on the outskirts of the mu-nicipality (LC Čeče, LC Dobovec, LC Franc Salamon and LC Klek) was lower than in those local communities located closer to the centre. We identified a higher presence of the fear of crime in local communities with a higher crime rate (Alojz Hohkraut, Center, Ivan Keše and Zasavje). The highest fear of crime rates were recorded in local communities Alojz Hohkraut and Zasavje, both show signs of physical and social disorder as they are full of decrepit and abandoned buildings,
mostly factories and warehouses. At the same time, these local communities have many apartment buildings built during the socialist period, which enabled entry to everyone and which lack burglary prevention facilities. By using discriminant analysis, we established that the indexes, which were inquir-ing about the protection of property (average value of the in-dex: 2.3000) and consequences of likely victimisation (average value of the index: 2.7100), differentiated the most between fear of crime. The indexes of past victimisation (overall aver-age of the index: 1.0746) and the safety of locations at night (overall average of the index: 1.2607) differentiated the least between fear of crime.
When asked which location respondents deemed the most dangerous in Trbovlje, 29.7% said no location seems danger-ous, 12.6% said the city park was the most dangerous location in the city, followed by locations with forests (11.1%) and bars (9.4%). The results also showed that 72% of respondents be-lieve the city is safe at night and that they would not fear to go alone anywhere. At the same time, 6.5% of respondents think the city park is the location they would not dare to visit alone at night. The results of further analyses showed that fear
Legend: - objects
Figure 4: Rate of the fear of crime in the local communities in the municipality of Trbovlje in 2013

Revija za kriminalistiko in kriminologijo / Ljubljana 65 / 2014 / 4, 299–315
312
was higher among the female population of the municipality of Trbovlje (average value of the fear of crime: 1.9331) than among the male population (average value of the fear of crime: 1.8927). The considerable difference among the two groups is also the result of indexes: 1) feeling of safety at night, 2) pos-sibility of victimisation and 3) consequences of possible victi-misation. No differences between the male and female popula-tions (both provided approximately the same answers) were noticed for the other indexes. The analysis of fear of crime by age groups revealed the highest among the age group 26-45 (average value of the fear of crime rate: 1.9676), followed by age group above 75 (average value of the fear of crime rate: 1.9452) and age group 61-75 (average value of the fear of crime rate: 1.9207). The age groups 46-60 (average value of the fear of crime rate: 1.8662) and 18-25 (average value of the fear of crime rate: 1.8921) are at the bottom of the ranking, because the fear of crime is the lowest in these age groups.
We must emphasise that this is a pilot study20 of mapping fear of crime, because the previous studies in Slovenia focused only on measuring fear of crime or mapping crime respective-ly specific criminal offences. The present study represents a step forward compared to the research conducted by Klinkon, Meško and Rebernik in Ljubljana in 2004, which studied the impact of socio-demographic factors on the development of crime in Ljubljana, as it focused on the impact of the crime rate on the fear of crime among residents of local commu-nities in the municipality of Trbovlje. Similarities with the above-mentioned research can be seen in the application of GIS tools for the preparation of a spatial distribution of crime.
7 Conclusion
Mapping fear of crime is different from other areas of studying crime, as it combines an objective technical side evident in the formation of maps, and a subjective element identified in the answers provided by residents or, in our case, respondents. Due to the lack of research on crime mapping, we could not rely on the results or findings from previous re-searches, while at the same time we could be innovative in our reviews and presentation of data. The graphic presentation of identified areas with higher crime rates and the distribution of the fear of crime, however, facilitates their comparison (for instance: search for overlapping), which contributes to exist-ing research in the field of studying fear of crime. The inter-pretation of findings presented on the maps is simpler and more comprehensible, just like mapping also enables the pre-
20 Due to the unpreparedness of residents of individual local com-munities in the municipality of Trbovlje to answer the question-naire the analysed sample includes only 350 people.
sentation of different factors on selected maps. This facilitates comparison and the establishment of mutual impacts of de-mographic, environmental and other factors for researchers.
The study in the municipality of Trbovlje showed that a higher crime rate coincides with a higher fear of crime. The graphic presentation of distribution of the fear of crime re-vealed that the fear of crime is lower in suburban local com-munities with lower urbanization levels and fewer residents compared to local communities closer to the city centre. The area of the city park was defined as the most dangerous loca-tion in the municipality by the residents. We explain this oc-currence with the presence of signs of social disorder factors (alcohol consummation by young people gathering in the city park) and physical disorder (broken glass, garbage left behind by young people). We also established that gender is a fac-tor that does not have a considerable impact on the fear of crime in the municipality. The factors of property insurance and consequences of possible victimisation had the largest impact on the differences in the fear of crime in individual lo-cal communities. The rate of property insurance was relatively high in local communities with perceived highest rate of the fear of crime, as these two local communities have residents with a lower social status, who cannot afford dispossession, destruction or damage to property. The consequences of pos-sible victimisation is an index that has considerable impact on differentiation among groups as residents of local communi-ties with a higher living standard would have fewer problems continuing their lives if they were victims of robbery or theft. All groups have in common that residents would have a diffi-cult time continuing with their life if they were victims of any form of physical attack. Last but not least, the maps depicting the distribution of crime and fear of crime in Trbovlje repre-sent a good starting point for the continuation of mapping of the fear of crime and for the planning of subsequent work of police officers in the municipality. A greater emphasis should be given on formal social control and prevention or in other words community-oriented police work (Meško, 2001; Meško, 2002). Police officers should focus on their visibility, accessi-bility and predictability (Meško et al., 2000). With regard on the theory we argue that focusing on community-oriented police work would significantly contribute to the reduction of the fear of crime in general and in local communities (Meško, 1999; Meško & Areh, 2003; Meško, Fallshore, & Jevšek, 2007). Future in-depth research would enable analyses on the distri-bution of crime for a longer period of time and increased fo-cus on residential quarters as opposed to local communities. A higher validity of results could be assured with repetition and studies of bigger samples.

313
Rok Hacin, Katja Eman: Study of the Fear of Crime in the Municipality of Trbovlje Using Crime Mapping Tools
References
1. Anselin, L., Cohen, J., Cook, D., Gorr, W., & Tita, G. (2000). Spatial analysis of crime. Criminal Justice, 4. Retrieved from http://www.ncjrs.org/criminal_justice2000/vol_4/04e.pdf
2. Bajt, F. (1951). Geografski prikaz kriminalitete v Sloveniji [Geographic presentation of crime in Slovenia]. Kriminalistična služba, 2(8–9), 287–304.
3. Block, R. A. (1998). Psychological time and the processing of spa-tial information. In M. Egenhofer, & R. Golledge (Eds.), Spatial and temporal reasoning in geographic information systems (pp. 119–130). New York: Oxford University Press.
4. Boba Santos, R. (2013). Crime analysis with crime mapping. Los Angeles: Sage.
5. Botev, Z. I., Grotowski, J. F., & Kroese, D. P. (2010). Kernel density estimation via diffusion. Annals of Statistics, 38(5), 2916–2957.
6. Brantingham, P. J., & Brantingham, P. L. (1991). Environmental criminology. Prospect Heights: Waveland Press.
7. Brantingham, P. L., & Brantingham, P. J. (1998). Mapping crime for analytic purposes: Location quotients, counts and rates. Retrieved from http://www.popcenter.org/library/crimeprevention/volume_08/09-Brantingham.pdf
8. Brantingham, P. L., & Brantingham, P. J. (1999). A theoretical model of crime hot spot generation. Studies on Crime and Crime Prevention, 8(1), 7–26.
9. Brantingham, P. L., & Brantingham, P. J. (2004). Computer simula-tion as a tool for environmental criminologists. Security Journal, 17(1), 21–30.
10. Brantingham, P. L., & Brantingham, P. J. (2008). Crime analysis at multiple scales of aggregation: A topological approach. V D. Weisburd, W. Bernasco, & G. J. N. Bruinsma (Ed.), Putting crime in its place (pp. 87–107). New York: Springer.
11. Brooks, J. (1974). The fear of crime in the United States. Crime and Delinquency, 20(3), 241–245.
12. Burrough, P. A., & McDonnell, R. A. (1998). Principles of geograph-ic information systems. New York: Oxford University Press.
13. Carlson, J., & Hatfield E. (1992). Psychology of emotion. Texas: Harcout Brace Jovanovich College Publishers.
14. Chainey, S. (2001). GIS and crime mapping. California: UCL Jill Dando Institute.
15. Clarke, R., & Eck, J. E. (2008). Priročnik za policijske (kriminalistične) analitike - v 60 korakih do rešitve problema [Manual for police ana-lytics - 60 steps to solve the problem]. Ljubljana: Fakulteta za var-nostne vede.
16. Cohen, L. E., & Felson, M. (1979). Social change and crime rate trends: A routine activity approach. American Sociological Review, 44(1), 588–608.
17. Coleman, J., & Ferraro, T. (1992). Rational choice theory. London: Sage.
18. Cordner, G., & Perkins Biebel, E. (2005). Problem-oriented polic-ing in practice. Criminology & Public Policy, 4(2), 155–180.
19. Crowe, T. D. (1991). Safer schools by design. Security Management, 35(9), 81–86.
20. Doran, B. J., & Burgess, M. B. (2012). Putting fear of crime on the map. London: Springer.
21. Eck, J. E. (2005). Using crime pattern simulations to elaborate theo-ry. Toronto: American Society of Criminology.
22. Eck, J. E., & Liu, L. (2008). Artificial crime analysis systems: Using computer simulations and geographic information systems. Hershey: IGI Global.
23. Eman, K., Meško, G., & Ivančić, D. (2012). Ekološka kriminal-iteta v Pomurju [Environmnetal crime in Pomurje]. Varstvoslovje, 14(1), 113–131.
24. Eman, K., Györkös, J., Lukman, K., & Meško, G. (2013). Crime mapping for the purpose of policing in Slovenia: Recent develop-ments. Revija za kriminalistiko in kriminologijo, 64(3), 287–308.
25. Ferraro, K. F. (1995). Fear of crime: Interpreting victimisation risk. Albany: State University of New York Press.
26. Ferraro, K. F., & LaGrange, R. (1987). The measurement of fear of crime. Sociological Review, 57(1), 70–101.
27. Frank, R., Park, A. J., Brantingham, P. L., Claire, J., Wuschke, J. C., & Vajihollahi, M. (2010). Identifying high risk crime areas using topology. In 2010 IEEE International Conference on Intelligence and security informatics (pp. 13–18). Retrieved from http://ieeeexplore.info/xpl/login.jsp?tp=&arnumber=5484782&url=http%3A%2F%2Fieeeexplore.info%2Fstamp%2Fstamp.jsp%3Ftp%3D%26arnumber%3D5484782
28. General Police Directorate, Department for Planning and Analytics. (2013). Geospatial crime data. Ljubljana: GPU.
29. Groff, E. R. (2007). ‘Situating’ simulation to model human spatio-temporal interactions: An example using crime events. Transactions in GIS, 11(4), 507–530.
30. Garofalo, J. (1981). The fear of crime: Causes and consequences. Journal of Criminal Law and Criminology, 72(2), 839–857.
31. Hindelang, M. J., Gottfredson, M. R., & Garofalo, J. (1978). Victims of personal crime: An empirical foundation for a theory of a personal victimization. Cambridge: Ballinger.
32. Hirtenlehner, H., Meško, G., & Vošnjak, L. (2009). Die problem-atische Beziehung von Opfererfahrungen und Sicherheitsgefühl [The problematic relationship of victimization and feelings of threat]. Monatsschrift für Kriminologie und Strafrechtsreform, 92(5), 423–446.
33. Home Office. (2005). Crime mapping: Improving performance. Retrieved from http://www.ucl.ac.uk/scs/people/academic-re-search-staff/spencerchainey/Slides/Home_Office_CrimeMapping
34. Jacović, A. (2005). Šifrant kaznivih dejanj: Kazenski zakonik Republike Slovenije [Criminal offences code list: Penal Code of the Republic of Slovenia]. Ljubljana: Statistični urad RS.
35. Klinkon, I., & Meško, G. (2005). Uporaba geografskih informaci-jskih sistemov pri analizi kriminalitete [Use of geographic infor-mation systems in crime analysis]. Varstvoslovje, 7(2), 133–149.
36. Klinkon, I., Meško, G., & Rebernik, D. (2004). Vpliv socialnode-mografskih dejavnikov na razvoj kriminalitete v Ljubljani: rezultati preliminarnega raziskovanja [The impact of socio-demographic factors on the development of crime in Ljubljana: Results of pre-liminary exploration]. In B. Lobnikar (Ed.), 5. slovenski dnevi varst-voslovja (pp. 836–847). Ljubljana: Fakulteta za varnostne vede.
37. Meško, G. (1999). Občutki ogroženosti, strah pred kriminaliteto in policijsko preventivno delo [Feelings of threat, fear of crime and police preventive work]. Varstvoslovje, 1(1), 30–34.
38. Meško, G. (2001). V skupnost usmerjeno policijsko delo – izziv za Slovensko policijo [Community policing – a challenge for the Slovenian police]. Teorija in praksa, 38(2), 272–289.
39. Meško, G. (2002). Osnove preprečevanja kriminalitete [The basics of crime prevention]. Ljubljana: Visoka policijsko-varnsotna šola.
40. Meško, G. (2006). Kriminologija [Criminology]. Ljubljana: Fakulteta za varnostne vede.
41. Meško, G., & Areh, G. (2003). Strah pred kriminaliteto v urbanih okoljih [Fear of crime in urban environment]. Revija za kriminal-istiko in kriminologijo, 54(3), 256–264.

Revija za kriminalistiko in kriminologijo / Ljubljana 65 / 2014 / 4, 299–315
314
42. Meško, G., & Šifrer, J. (2008). Strah pred kriminaliteto v mest-nem okolju: raziskava [Fear of crime in urban settings: Research]. Varstvoslovje, 10(4), 539–560.
43. Meško, G., Dobovšek, B., & Bohinc, U. (2003). Izhodišča za preučevanje prostorskih dejavnikov kriminalitete [Starting-point for the study of spatial factors of crime]. In G. Meško (Ed.), Analiza porazdelitve nekaterih odklonskih pojavov v Ljubljani (pp. 12–63). Ljubljana: Fakulteta za policijsko-varnostne vede.
44. Meško, G., Fallshore, M., & Jevšek, A. (2007). Policija in strah pred kriminaliteto [Police and fear of crime]. Revija za kriminalistiko in kriminologijo, 58(4), 340–351.
45. Meško, G., Maver, D., & Klinkon, I. (2010). Urban crime and crim-inal investigation in Slovenia. In G. W. Cordner, A. M. Cordner, & D. K. Das (Eds.), Urbanization, policing, and security: Global per-spectives (pp. 301–322). Boca Raton: CRC Press.
46. Meško, G., Šifrer, J., & Vošnjak, L. (2012). Strah pred kriminaliteto v mestnih in vaških okoljih v Sloveniji [Fear of crime urban and rural environments in Slovenia]. Varstvoslovje, 14(3), 259–276.
47. Meško, G., Dvoršek, A., Dobovšek, B., Umek, P., & Bohinc, U. (2003). Analiza porazdelitve nekaterih odklonskih pojavov v Ljubljani [Analysis of distribution of some forms of crime in Ljubljana]. Ljubljana: Fakulteta za policijsko-varnostne vede.
48. Meško, G., Umek, P., Dobovšek, B., Gorenak, V., Mikulan, M., Žaberl, M., et al. (2000). Strah pred kriminaliteto, policijsko preven-tivno delo in javno mnenje o Slovenski policiji [Fear of crime, pre-ventive police work and public opinion on the Slovenian police]. Ljubljana: Visoka policijsko-varnostna šola.
49. Municipality of Trbovlje. (2013). Krajevne skupnosti [Local com-munities]. Retrieved from http://www.trbovlje.si/vsebina/krajev-na%20skupnost/10
50. Park, A., Hwang, J. E., Spicer, V., Cheng, C., Brantingham, P. L., & Sixsmith, A. (2011). Testing elderly people’s fear of crime using a virtual environment. Retrieved from http://www.sfu.ca/content/dam/sfu/icurs/Publications/2011/Park%2C%20Hwang%2C%20Spicer%2C%20Cheng%2C%20Brantingham%2C%20Sixsmith.pdf
51. Pečar, J. (1975). Gostitve nekaterih deviantnih pojavov v Ljubljani [Density of some deviance phenomena in Ljubljana]. Ljubljana: Inštitut za kriminologijo pri Pravni fakulteti.
52. Perez, P., Dray, A., Ritter, A., Dietze, P., Moore, T., & Mazerolle, L. (2005). SimDrug: Exploring the complexity of heroin use in Melbourne. Retrieved from https://ndarc.med.unsw.edu.au/sites/default/files/ndarc/resources/11%20SimDrug.pdf
53. Phillips, P. D. (1972). A prologue to the geography of crime. Proceedings of the Association of American Geographers, 4(1), 86–91.
54. Quinion, M. (2005). Garbage in, garbage out. Retrieved from http://www.worldwidewords.org/qa/qa-gar1.htm
55. Ratcliffe, J. H. (2004). The hotspot matrix: A framework for the spatio-temporal targeting of crime reduction. Police Practice and Research, 5(1), 5–23.
56. Shaw, C. R., & McKay, H. D. (1942). Juvenille delinquecy in urban areas. Chicago: University of Chicago Press.
57. Skogan, W. G. (1990). Disorder and decline: Crime and the spiral decay in American neighbourhoods. Los Angeles: University of California Press.
58. Skogan, W. G. (1999). Measuring what matters: crime, disorder and fear. In R. H. Langworthy (Ed.), Measuring what matters: Proceedings from the police research institute meetings (pp. 37–54). Washington: National Institute of Justice.
59. Song, J., Frank, R., Brantingham, P. L., & LeBeau, J. (2012). Visualizing the spatial movement patterns of offenders. Retrieved from http://rfrank.no-ip.org:6220/Publications/2012%20-%20SIGSPATIAL%20-%20Spatial%20Movement.pdf
60. Statistical Office of the Republic of Slovenia. (2013). Prebivalci po krajevnih skupnostih občine Trbovlje [Residents in the local com-munities of the municipality Trbovlje]. Retrieved from http://www.stat.si/krajevnaimena/default.asp?txtIme=TRBOVLJE&selNacin=celo&selTip=naselja&ID=4624
61. University College London. (2013). Mapping fear of crime. London: UCL. Retrieved from https://www.ucl.ac.uk/excites/projects/affili-ated-projects/mapping-crime/fear-of-crime
62. Uludag, S., Lui, K. S., Nahrstedt, K., & Brewster, G. B. (2007). Analysis of topology aggregation tehniques for QoS routing. ACM Computing Surveys 39(7), 1–35.
63. Vošnjak, L. (2011). Strukturalna analiza socio-demografskega, socialnopsihološkega in celostnega modela zaskrbljenosti ljudi glede kriminalitete in sodobnih oblik negotovosti [A structural analysis of socio-demographic, social psychological, and holistic model of people’s anxiety regarding crime and contemporary forms of inse-curity] (Doctoral dissertation). Ljubljana: Fakulteta za varnostne vede.
64. Weisburd, D., & McEven, T. (1997). Crime mapping and crime prevention. In D. Weisburd, & T. McEwen (Eds.), Crime map-ping and crime prevention (pp. 1–26). Cambridge: Cambridge University Press.
65. Wilson, J. Q., & Kelling, G. L. (1982). The police and neighbour-hood safety: Broken windows. The Atlantic Monthly, 249(3), 29–38.
66. Zemljič, V., Kastelic, T., Šibenik, T., Zajec, I., Bogataj, M., Brvar, B., et al. (1979). Ugotavljanje črnih točk na magistralnih ces-tah SR Slovenije [Identification of black spots on the main roads in the Socialist Republic of Slovenia]. Ljubljana: FAGG, Prometnotehniški inštitut.

315
Rok Hacin, Katja Eman: Study of the Fear of Crime in the Municipality of Trbovlje Using Crime Mapping Tools
Študija o strahu pred kriminaliteto v občini Trbovlje z uporabo orodja za kartiranje kriminalitete
Rok Hacin, doktorski študent, asistent in mladi raziskovalec, Fakulteta za varnostne vede Univerze v Mariboru. E-pošta: [email protected]
Dr. Katja Eman, docentka za kriminologijo, Fakulteta za varnostne vede Univerze v Mariboru. E-pošta: [email protected]
Namen članka je prikazati stopnjo kriminalitete v občini Trbovlje v letu 2012 z uporabo programskega orodja ArcGIS za kartiranje ter ugotoviti morebitno povezavo med gostoto pojava kriminalitete in stopnjo strahu pred kriminaliteto v lokalnih skupnostih v Trbovljah. Analizirali smo uradne statistične podatke policije in geolokacijske podatke o kriminaliteti ter nadalje uporabili opisno metodo za razlago osnovnih pojmov in pregled preteklih študij. Večina raziskav je označena kot študija primera. V občini Trbovlje smo za ocenjevanje strahu pred kriminaliteto uporabili anketni vprašalnik. V občini Trbovlje prevladujočo obliko kriminaliteto predstavljajo kazniva dejanja zoper premoženje. Ugotovitve in primerjava območij distribucije strahu pred kriminaliteto v lokalnih skupnostih in gostitve kriminalitete kažejo, da je stopnja strahu prebivalcev posameznih lokalnih skupnosti sorazmerna z distribucijo kriminalitete. Rezultati kažejo, da spol nima pomembnega vpliva na dojemanje strahu pred kriminaliteto. Ravno nasprotno pa smo identificirali glavne razlike pri dveh dejavnikih: posledice morebitne viktimizacije ter sposobnost zavarovanja premoženja. Porazdelitev strahu pred kriminaliteto glede na starostne skupine se razlikuje od distribucije običajnih modelov. Najvišja stopnja je bila identificirana pri skupini posameznikov srednjih let (26–45 let), kateri sledi najstarejša skupina prebivalcev, starih nad 75 let. Avtorji uporabnost ugotovitev vidijo z vidika pomoči policiji pri odkrivanju kriminalnih žarišč in območij gostitev kaznivih dejanj ter območij z višjo stopnjo strahu pred kriminaliteto. Na podlagi teh rezultatov lahko policija sprejme ustrezne ukrepe v občini Trbovlje.
Ključne besede: kartiranje kriminalitete, strah pred kriminaliteto, občina Trbovlje, lokalne skupnosti
UDK: 343.9