Study of the Eutectoid Transformation in Nodular Cast ...
12
HAL Id: hal-01677364 https://hal.archives-ouvertes.fr/hal-01677364 Submitted on 8 Jan 2018 HAL is a multi-disciplinary open access archive for the deposit and dissemination of sci- entific research documents, whether they are pub- lished or not. The documents may come from teaching and research institutions in France or abroad, or from public or private research centers. L’archive ouverte pluridisciplinaire HAL, est destinée au dépôt et à la diffusion de documents scientifiques de niveau recherche, publiés ou non, émanant des établissements d’enseignement et de recherche français ou étrangers, des laboratoires publics ou privés. Study of the Eutectoid Transformation in Nodular Cast Irons in Relation to Solidification Microsegregation Alexandre Freulon, Philippe (de) Parseval, Claudie Josse, Jacques Bourdie, Jacques Lacaze To cite this version: Alexandre Freulon, Philippe (de) Parseval, Claudie Josse, Jacques Bourdie, Jacques Lacaze. Study of the Eutectoid Transformation in Nodular Cast Irons in Relation to Solidification Microsegregation. Metallurgical and Materials Transactions A, Springer Verlag/ASM International, 2016, vol. 47 (n° 11), pp. 5362-5371. 10.1007/s11661-016-3692-3. hal-01677364
Transcript of Study of the Eutectoid Transformation in Nodular Cast ...
HAL Id: hal-01677364https://hal.archives-ouvertes.fr/hal-01677364
Submitted on 8 Jan 2018
HAL is a multi-disciplinary open accessarchive for the deposit and dissemination of sci-entific research documents, whether they are pub-lished or not. The documents may come fromteaching and research institutions in France orabroad, or from public or private research centers.
L’archive ouverte pluridisciplinaire HAL, estdestinée au dépôt et à la diffusion de documentsscientifiques de niveau recherche, publiés ou non,émanant des établissements d’enseignement et derecherche français ou étrangers, des laboratoirespublics ou privés.
Study of the Eutectoid Transformation in Nodular CastIrons in Relation to Solidification Microsegregation
Alexandre Freulon, Philippe (de) Parseval, Claudie Josse, Jacques Bourdie,Jacques Lacaze
To cite this version:Alexandre Freulon, Philippe (de) Parseval, Claudie Josse, Jacques Bourdie, Jacques Lacaze. Studyof the Eutectoid Transformation in Nodular Cast Irons in Relation to Solidification Microsegregation.Metallurgical and Materials Transactions A, Springer Verlag/ASM International, 2016, vol. 47 (n°11), pp. 5362-5371. �10.1007/s11661-016-3692-3�. �hal-01677364�
Open Archive TOULOUSE Archive Ouverte (OATAO) OATAO is an open access repository that collects the work of Toulouse researchers andmakes it freely available over the web where possible.
This is an author-deposited version published in : http://oatao.univ-toulouse.fr/Eprints ID : 18103
To link to this article : DOI:10.1007/s11661-016-3692-3URL : http://dx.doi.org/10.1007/s11661-016-3692-3
To cite this version : Freulon, Alexandre and Parseval, Philippe
(de) and Josse, Claudie and Bourdie, Jacques and Lacaze, Jacques
Study of the Eutectoid Transformation in Nodular Cast Irons inRelation to Solidification Microsegregation. (2016) Metallurgical andMaterials Transactions A, vol. 47 (n° 11). pp. 5362-5371. ISSN 1073-5623
Any correspondence concerning this service should be sent to the repository
administrator: [email protected]

Study of the Eutectoid Transformation in NodularCast Irons in Relation to SolidificationMicrosegregation
ALEXANDRE FREULON, PHILIPPE DE PARSEVAL, CLAUDIE JOSSE,JACQUES BOURDIE, and JACQUES LACAZE
Eutectoid transformation in cast irons may proceed in the stable or the metastable systemsgiving ferrite and graphite for the former and pearlite for the latter. The present workdemonstrates that composition profiles across ferrite/pearlite boundaries are smooth and similarto those issued from the solidification step. No trace of long-range diffusion of substitutionalsolutes due to austenite decomposition could be observed. In turn, this ascertains that bothstable and metastable transformations proceed with the product matrix—either ferrite orpearlite—inheriting the parent austenite content in substitutional solutes. This result sustains aphysical model for eutectoid transformation based on the so-called local para-equilibrium whichis commonly used for describing solid-state transformation in steels.
DOI: 10.1007/s11661-016-3692-3
I. INTRODUCTION
THE final matrix of common nodular cast ironsresults from the eutectoid decomposition of high-tem-perature austenite and consists in either ferrite, pearlite,or a mixture of ferrite and pearlite. The former eutectoidtransformation proceeds in the stable system (austen-ite fi ferrite+graphite), the latter in the metastable sys-tem (austenite fi ferrite+ cementite). In practice, a lowcooling rate is used during the eutectoid reaction inorder to ensure a fully ferritic matrix. On the opposite,pearlite promoter elements such as Cu, Mn, Sb, or Snare added to cast iron alloys for getting a fully pearliticmatrix even at quite low cooling rate.
Mastering of cooling conditions and alloy composi-tion for obtaining a desired microstructure is made com-plicated because of chemical heterogeneities build-upduring solidification, the so-called microsegregations.Heterogeneities in carbon are easily handled becausethis element diffuses quite fast in austenite. On thecontrary homogenization of all elements but C and Ncannot be carried out by any practical means, so that theeutectoid transformation takes place locally under
conditions that change at the microstructure scale.[1–3]
The first aim of this work was to characterize thedistribution of the elements at the local scale and toinvestigate if the eutectoid transformation may haveaffected the distribution issued from solidification.Very little of tin or antimony, meaning less than 0.1
mass pct, is effective in decreasing the amount of ferrite,when 0.5 to 1.0 mass pct of copper and/or manganese isnecessary to significantly decrease it. This suggests thatthe pearlite promoter effect of these various elementsproceeds by different mechanisms. While a mechanismhas been proposed for explaining the role of copper andmanganese,[4] it has been observed that tin proceeds in adifferent way[5] and it is suspected that antimony affectsthe eutectoid transformation as tin does. The presentwork was also carried out to look for similarities withtin in case of low antimony addition.In the present study a common nodular cast iron
without and with a small addition of antimony wasprepared and cast in blocks. The as-cast microstructureclearly showed the effect of antimony and this suggestedusing differential thermal analysis (DTA) to recordeutectoid transformation temperatures during cooling atvarious rates after reaustenitization. As-cast samplesand DTA samples were then investigated with opticalmicroscopy (OM), focused ion beam (FIB) coupledwith energy dispersive analysis (EDS), and electronmicroprobe.
II. EXPERIMENTAL DETAILS
The two alloys considered in this study were obtainedfrom the same base melt, with the second one modifiedwith a small addition of antimony (the target was 0.01mass pct Sb). The first alloy will be called reference alloyin the following, the second one Sb-bearing alloy. The
ALEXANDRE FREULON, Technician, and JACQUESLACAZE, Senior Scientist, are with CIRIMAT, Universite deToulouse, ENSIACET, CS 44362, 31030 Toulouse, France. Contacte-mail: [email protected] PHILIPPE DE PARSEVAL, Re-search Engineer, is with GET, UMR 5563 CNRS, Universite deToulouse, 14 Avenue Edouard Belin, 31400 Toulouse, France, andalso with the Centre de Microcaracterisation Raimond Castaing,Universite de Toulouse, UMS 3623, 3 rue Caroline Aigle, 31400Toulouse, France. CLAUDIE JOSSE, Engineer, is with the Centre deMicrocaracterisation Raimond Castaing, Universite de Toulouse,France. JACQUES BOURDIE, Ph.D. Student, is with CIRIMAT,Universite de Toulouse, and also with Saint-Gobain Pont-a-Mousson,21 avenue C. Cavallier, 54700 Pont-a-Mousson, France.
melt was prepared in a 250 kg induction furnace with pigiron for the charge and addition of ferro-silicon alloy(Fe75Si) for adjusting the silicon content. After super-heating to 1773 K (1500 �C), the melt was poured in a 30kg capacity transfer ladle at the bottom of which thenodulizing alloy had been placed covered with steelscrap. This nodulizing alloy was an FeSiMg alloycontaining 8 mass pct Mg and added in an amount of1.3 pct of the melt weight. Antimony addition was alsoachieved by depositing pure Sb at the bottom of thetransfer ladle together with the nodulizing alloy. Themelt was then poured in 2.5 kg blocks (40 9 50 9 175mm3). Inoculation was achieved by adding 0.2 pct of themelt weight of a commercial inoculant at the bottom ofeach block and a thermocouple was placed into themold in order to record the temperature evolutionduring solidification and cooling. The solidification timewas in the range of 2 minutes and the cooling rate justbefore the eutectoid transformation about 7 K/min.
Carbon and sulfur were analyzed by combustion on amedal taken from the base melt. Other analyses werecarried out on samples taken from the cast blocks.Silicon was quantified by gravimetric method and allother elements considered were analyzed by inductivecoupled plasma spectroscopy after acid dissolution. Thecompositions of the two alloys are listed in Tables I andII, respectively. The content in Ba, Ce, and La was alsomeasured and found lower than the detection limit at0.0005 mass pct for all three elements.
DTA experiments have been performed using a Setsys16/18 Setaram apparatus on small cylindrical samples(3.8 mm in diameter, 5 mm in height) machined outfrom the blocks. The samples were heated to 1223 K(950 �C), held at that temperature for carbon homog-enization, then cooled to 873 K (600 �C) and reheatedagain to 1223 K (950 �C), and finally cooled down toroom temperature. All heating sequences were per-formed at 20 K/min while various rates were used forcooling: in the so-called ‘‘short’’ cycle, the cooling ratewas successively 20 and 5 K/min while in the ‘‘long’’cycle they were 10 and 2 K/min. A new sample was used
for each cycle, which means that two DTA samples wereavailable for each alloy.One sample from each block and the four DTA
samples were then prepared by standard metallographictechniques for further investigation by optical micro-scopy, focused ion beam, and microprobe analysis.Cross section of the as-cast samples have been
obtained by FIB, on a FEG-SEM/FIB FEI HELIOS600i coupled with an EDX Oxford Instruments analyzerAztec Advanced equipped with an SDD detector. Thesample was tilted (52 deg) towards the FIB column suchthat the ion beam was normally incident on the samplesurface. The region to be analyzed was first protected bya Pt deposit, then a hole was milled in front of it creatinga flat surface perpendicular to sample surface. A highGa+ ion beam current was initially used to rapidly millthe area to a depth of 20 to 50 lm, and then a finer beamwith a much smaller beam current was applied to polishone face of the cross section. The polished face wasimaged directly with the scanning electron microscope(SEM) and its composition analyzed by EDS with a 10keV accelerating voltage. These chemical analyses areonly qualitative because of the sample tilt.Microprobe analyses were carried on all six samples.
After metallographic preparation, these samples wereetched and micro-hardness marks were made so as toeasily locate appropriate areas afterwards. The sampleswere then slightly polished to remove etching marks andintroduced into the microprobe. Quantitative analyseswere performed using a Cameca SX Five with thefollowing operating conditions: accelerating voltage 15kV; beam current 50 nA; counting time on peak of 20seconds for Al Ka, Mg Ka, Si Ka, Mn Ka and Cu Ka,30 seconds for Cr Ka and P Ka, and 60 seconds for SbLa. The background was measured on both sides ofevery peak during a time half of that used for the peak.The following standards were used: periclase (MgO),corundum (Al2O3), wollastonite (SiCaO3), pyrophanite(MnTiO3), and pure metals for Cr, Cu, and Sb. Aftermeasurements, the apparent contents were correctedwith the software PeakSight 5.1 to account for
Table I. Composition (Mass Pct) of the Reference Alloy
C Si Mg Mn Ti Al Sb S
3.80 1.91 0.025 0.198 0.031 0.012 0.0006 0.014
V Cr Mo Ni Cu Ca P Fe
0.007 0.035 0.008 0.032 0.052 0.0025 0.061 balance
Table II. Composition (Mass Pct) of the Sb-Bearing Alloy
C Si Mg Mn Ti Al Sb S
3.80 2.10 0.025 0.186 0.027 0.015 0.0087 0.014
V Cr Mo Ni Cu Ca P Fe
0.007 0.032 0.007 0.030 0.053 0.0024 0.059 balance

absorption and fluorescence. In this step, Fe wascalculated by difference to 100 pct, which may lead toslight biases as carbon was not accounted for. For allanalyzed elements and every measurement, the softwareindicates the detection limit and the standard deviationr.
Microprobe measurements were realized in the spotmode along lines selected on the basis of the OMmicrostructure observations. According to the condi-tions used for analysis, the beam has a diameter slightlylower than 2 lm at the surface of the sample. Each spotlets a mark where the beam hits the sample that is due tocracking of residual gas by the accelerated electrons.Lines of analysis points may then be easily located byOM microscopy and have been photographed. Whenneeded, a new etching was performed to ensure wherethe microprobe lines went through. On the whole, 21microprobe lines were realized in about 30 hours. Thesettings of the microprobe were checked regularlyduring this time.
III. RESULTS
Figure 1 compares the as-cast microstructure of thereference and Sb-bearing alloys after Nital etching. Thegraphite nodules in dark contrast are well formed andencapsulated in ferrite that appears in light contrast,while the remaining of the matrix in gray contrast ispearlite. It is seen that a much larger amount of pearliteis present in the Sb-bearing alloy than in the referencealloy.
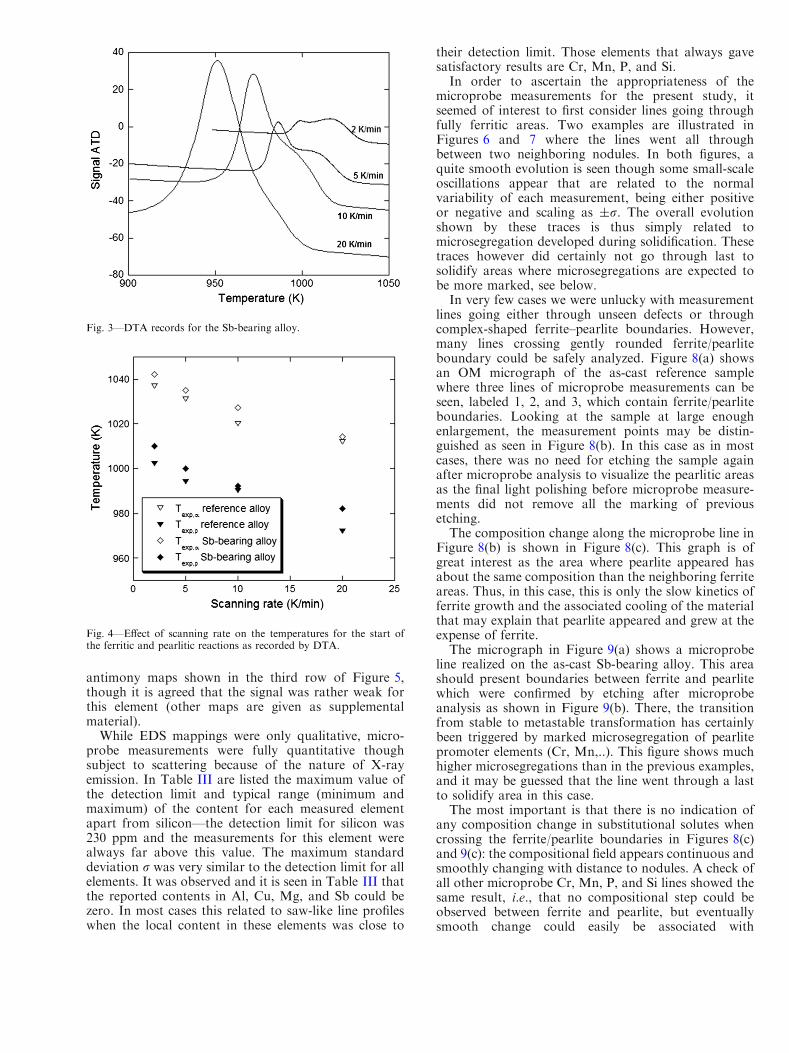
Figure 2 shows the DTA records for the referencealloy and Figure 3 for the Sb-bearing alloy for thevarious cooling rates used in the present study. Allcurves show that the transformation takes place in twosteps which appear better differentiated as the coolingrate is decreased. The thermal arrest at higher temper-ature relates to the development of ferrite, and the oneat lower temperature to the formation of pearlite.[6]
Using the time derivative of the signal, the experimentaltemperatures for the start of the ferritic reaction, Texp,a,and for the start of the pearlitic reaction, Texp,p, could beestimated, they are plotted in Figure 4. As can be
observed, the temperatures for both the stable andmetastable reactions appear slightly higher for theSb-bearing alloy than for the reference alloy. This goesin line with the effect of antimony predicted bythermodynamic calculations as described in appendix,though here it may rather be due to the slight differencein silicon content between the two alloys. This will bediscussed further later in this paper.The first row in Figure 5 shows micrographs of a fully
pearlitic and of a ferrito-pearlitic area of the Sb-bearingalloy and the second row is of the same areas after FIB.EDS mapping was performed in the rectangular zonesmarked on these latter micrographs. The signal of C, O,Mg, Al, Si, S, Ti, Cr, Mn, Fe, Ni, and Sb was mapped. Itwas observed that O and Mg are apparently present inhigher amount in graphite than in the matrix, while thisis the reverse for all the other elements. Furthermore,what is clear from these maps is that there is no build-upof any element at the interface between graphite and thematrix. This is illustrated by the example of the
Fig. 1—OM micrograph of Nital etched as-cast samples of the reference alloy (a) and the Sb-bearing one (b).
Fig. 2—DTA records for the reference alloy.
antimony maps shown in the third row of Figure 5,though it is agreed that the signal was rather weak forthis element (other maps are given as supplementalmaterial).
While EDS mappings were only qualitative, micro-probe measurements were fully quantitative thoughsubject to scattering because of the nature of X-rayemission. In Table III are listed the maximum value ofthe detection limit and typical range (minimum andmaximum) of the content for each measured elementapart from silicon—the detection limit for silicon was230 ppm and the measurements for this element werealways far above this value. The maximum standarddeviation r was very similar to the detection limit for allelements. It was observed and it is seen in Table III thatthe reported contents in Al, Cu, Mg, and Sb could bezero. In most cases this related to saw-like line profileswhen the local content in these elements was close to
their detection limit. Those elements that always gavesatisfactory results are Cr, Mn, P, and Si.In order to ascertain the appropriateness of the
microprobe measurements for the present study, itseemed of interest to first consider lines going throughfully ferritic areas. Two examples are illustrated inFigures 6 and 7 where the lines went all throughbetween two neighboring nodules. In both figures, aquite smooth evolution is seen though some small-scaleoscillations appear that are related to the normalvariability of each measurement, being either positiveor negative and scaling as ±r. The overall evolutionshown by these traces is thus simply related tomicrosegregation developed during solidification. Thesetraces however did certainly not go through last tosolidify areas where microsegregations are expected tobe more marked, see below.In very few cases we were unlucky with measurement
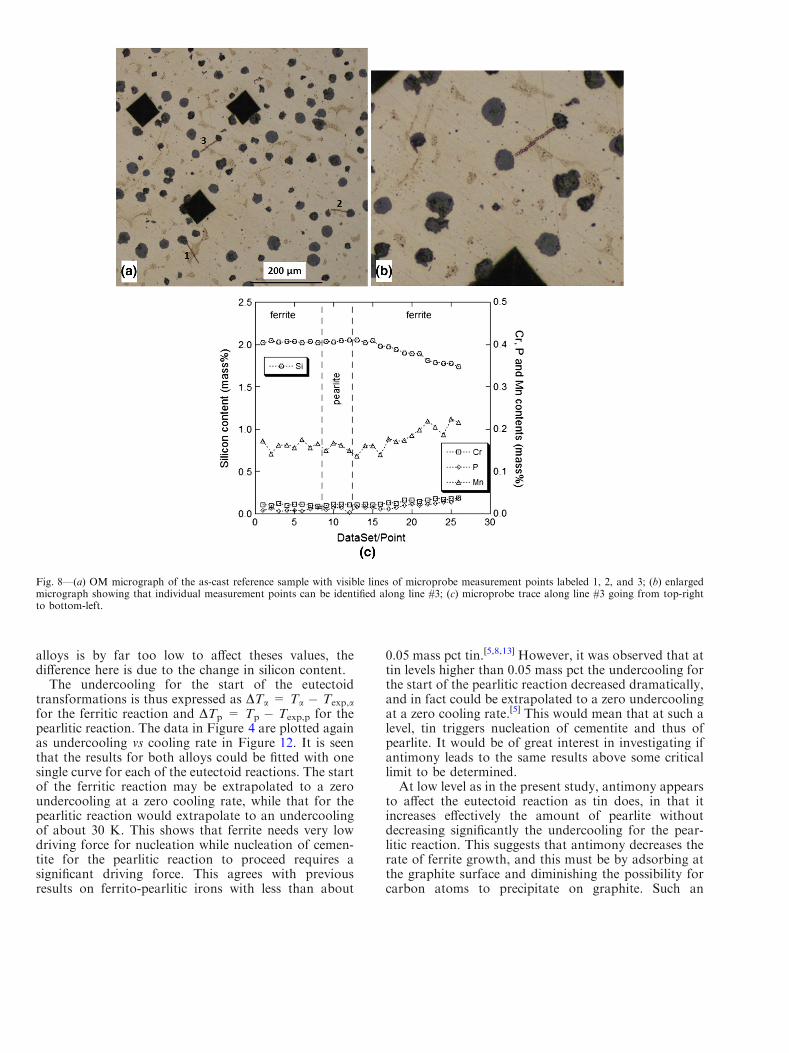
lines going either through unseen defects or throughcomplex-shaped ferrite–pearlite boundaries. However,many lines crossing gently rounded ferrite/pearliteboundary could be safely analyzed. Figure 8(a) showsan OM micrograph of the as-cast reference samplewhere three lines of microprobe measurements can beseen, labeled 1, 2, and 3, which contain ferrite/pearliteboundaries. Looking at the sample at large enoughenlargement, the measurement points may be distin-guished as seen in Figure 8(b). In this case as in mostcases, there was no need for etching the sample againafter microprobe analysis to visualize the pearlitic areasas the final light polishing before microprobe measure-ments did not remove all the marking of previousetching.The composition change along the microprobe line in
Figure 8(b) is shown in Figure 8(c). This graph is ofgreat interest as the area where pearlite appeared hasabout the same composition than the neighboring ferriteareas. Thus, in this case, this is only the slow kinetics offerrite growth and the associated cooling of the materialthat may explain that pearlite appeared and grew at theexpense of ferrite.The micrograph in Figure 9(a) shows a microprobe
line realized on the as-cast Sb-bearing alloy. This areashould present boundaries between ferrite and pearlitewhich were confirmed by etching after microprobeanalysis as shown in Figure 9(b). There, the transitionfrom stable to metastable transformation has certainlybeen triggered by marked microsegregation of pearlitepromoter elements (Cr, Mn,..). This figure shows muchhigher microsegregations than in the previous examples,and it may be guessed that the line went through a lastto solidify area in this case.The most important is that there is no indication of
any composition change in substitutional solutes whencrossing the ferrite/pearlite boundaries in Figures 8(c)and 9(c): the compositional field appears continuous andsmoothly changing with distance to nodules. A check ofall other microprobe Cr, Mn, P, and Si lines showed thesame result, i.e., that no compositional step could beobserved between ferrite and pearlite, but eventuallysmooth change could easily be associated with
Fig. 3—DTA records for the Sb-bearing alloy.
Fig. 4—Effect of scanning rate on the temperatures for the start ofthe ferritic and pearlitic reactions as recorded by DTA.

solidification microsegregation as described by Boeriand Weinberg[7] among others.
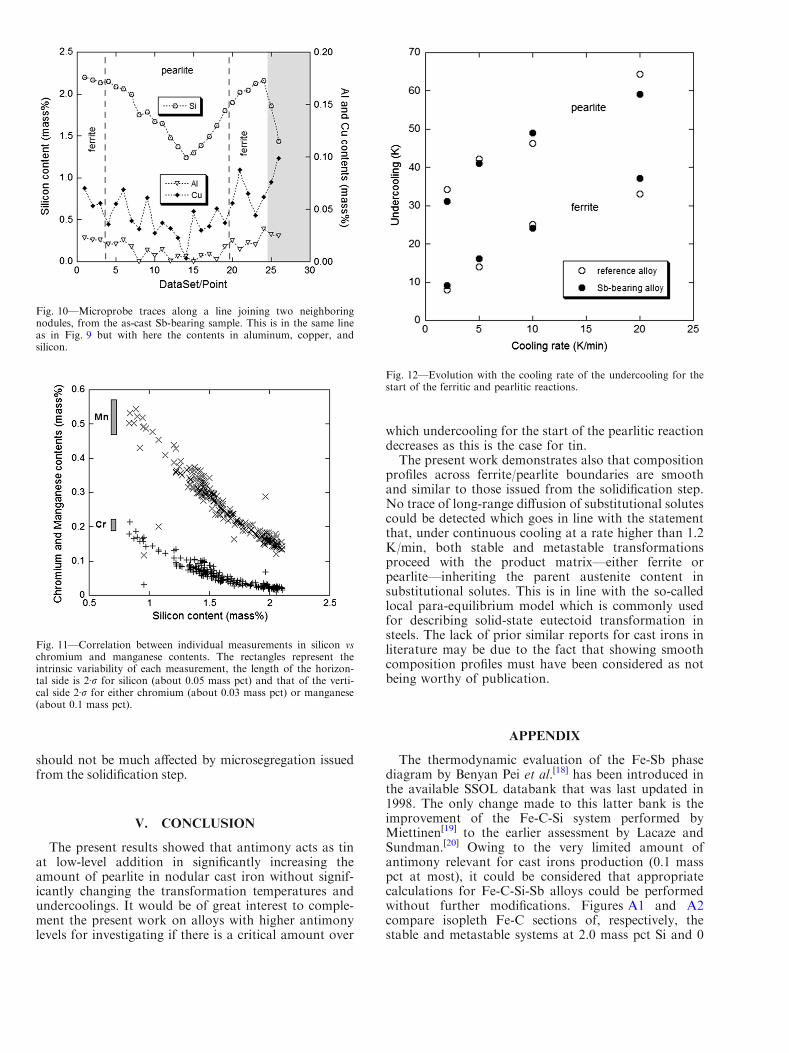
Figure 10 compares the composition profiles in sili-con, aluminum, and copper for the same line as inFigure 9(c). Though the distributions of aluminum andcopper are seen to be parallel to that of silicon, it isobserved how the statistical variation of the measure-ments for these elements gives a saw-like profile thatmade them of little use for the present study.
IV. DISCUSSION
As stressed previously,[4,8] the diffusion rate of sub-stitutional solutes in austenite is so low that nolong-range redistribution can take place during theeutectoid transformation under continuous cooling—forcooling rates higher than about 1.2 K/min.[9] This is verymuch as para-equilibrium described in steel transforma-tion as described since the mid of the last century[10] and
Fig. 5—SEM micrographs of two areas of the Sb-bearing alloy showing a fully pearlitic area (a, b, and c) and a ferritic–pearlitic one (d, e, and f)before drilling (first row) and after (second row). Maps of Sb distribution (third row) in the areas indicated as thin rectangles in the middle rowimages.
Table III. Maximum Value of the Microprobe Detection Limit for the Analyzed Elements, Standard Deviation of a Measurement,
and Typical Minimum and Maximum Contents Recorded Along the Lines (ppm Per Mass)
Element Al Cr Mg P Mn Cu Sb
Detection limit 220 140 290 190 530 1000 660Minimum content 0 60 0 40 40 0 0Maximum content 1500 1500 300 1500 3500 1200 250

was already considered by Venugopalan[11] in the case ofcast irons though without experimental support.Accordingly, both the stable and metastable transforma-tions proceed with the product—either ferrite orpearlite—inheriting the content in substitutional solutesof the parent austenite as observed with the presentexperimental results. The single reference found in theliterature reporting compositional change between fer-rite and austenite, ferrite and pearlite, and also pearliteand austenite is due to Guo and Stefanescu.[12] Thoughnot giving much detail, the authors indicate that someeutectic carbides were present in the as-cast materialthey investigated which may better explain the abrupt
compositional changes they sometimes observed thanthe solid-state eutectoid transformations.One further experimental proof that there is no
composition change between parent austenite andeither ferrite or pearlite is by looking at the correlationbetween the content in two elements. Figure 11 showsa plot of chromium and manganese contents vs siliconcontent for the short-cycle DTA sample of the refer-ence alloy. The grayed rectangles in this figure representthe intrinsic variability of each measurement, the lengthof the horizontal side is 2Ær for silicon (about 0.05 masspct) and that of the vertical side 2Ær for eitherchromium (about 0.03 mass pct) or manganese (about0.1 mass pct). Similar plots that would exactly super-impose to this one were obtained for all five othersamples. It is seen that the measurement points show acontinuous evolution when separate clouds of pointsshould have appeared if any abrupt compositionalchange had taken place during the eutectoidtransformation.If there is no compositional change between the
parent austenite and either ferrite or pearlite, theeutectoid transformations can well be described in aFe-C isopleth section of the relevant stable andmetastable phase diagrams as those shown in appendix.It has been proposed that the upper temperature atwhich these transformations can proceed lies on thelower limit of the three-phase field.[4,8] These referencetemperatures are denoted Ta in the stable system(Figure A1) and Tp in the metastable one (Figure A2).Using the thermodynamic calculations presented inappendix, the effect of antimony on the referencetemperatures in the stable and metastable eutectoidreactions is estimated respectively to 7.1 and 6.1 K/masspct. The relations linking the Ta and Tp referencetemperatures (K) to composition have been previouslyestimated based on phase diagram calculations,[9] theyare here complemented with the effect of antimony as:
Ta ¼ 273:15þ 739þ 18:4wSi þ 2:0ðwSiÞ2
� 14:0wCu � 45:0wMn þ 2:0wMo
� 24:0wCr � 27:5wNi þ 7:1 � wSb
½1�
Tp ¼ 273:15þ 727þ 21:6 � wSi þ 0:023 � ðwSiÞ2
� 21:0 � wCu � 25:0 � wMn þ 8:0 � wMo
þ 13:0 � wCr � 33:0 � wNi þ 6:1 � wSb;
½2�
where wi is the mass pct content in i element in austenite.Note that, for a given cast iron, the reference
temperatures are to be calculated with the nominalelement contents multiplied by about 1.05 to account forgraphite precipitation assuming it is pure carbon.[4,8]
For the reference and Sb-bearing alloys respectively, thisleads to 1045.2 K and 1051.2 K (772.0 �C and 778.1 �C)for Ta and 1036.5 K and 1041.3 K (763.3 �C and 768.1�C) for Tp. The differences between these temperaturesare in excellent agreement with those seen in Figure 4. Itshould be stressed that the amount of antimony in both
Fig. 6—Microprobe traces along a line joining two neighboring nod-ules, from the DTA short-cycle sample of the reference alloy. Thematrix was fully ferritic in this area. The grayed area on the rightcorresponds to a measurement point located partly on the graphitenodule.
Fig. 7—Microprobe traces along a line joining two neighboring nod-ules, from the DTA long-cycle sample of the Sb-bearing alloy. Thematrix was fully ferritic in this area.
alloys is by far too low to affect theses values, thedifference here is due to the change in silicon content.
The undercooling for the start of the eutectoidtransformations is thus expressed as DTa = Ta � Texp,a
for the ferritic reaction and DTp = Tp � Texp,p for thepearlitic reaction. The data in Figure 4 are plotted againas undercooling vs cooling rate in Figure 12. It is seenthat the results for both alloys could be fitted with onesingle curve for each of the eutectoid reactions. The startof the ferritic reaction may be extrapolated to a zeroundercooling at a zero cooling rate, while that for thepearlitic reaction would extrapolate to an undercoolingof about 30 K. This shows that ferrite needs very lowdriving force for nucleation while nucleation of cemen-tite for the pearlitic reaction to proceed requires asignificant driving force. This agrees with previousresults on ferrito-pearlitic irons with less than about
0.05 mass pct tin.[5,8,13] However, it was observed that attin levels higher than 0.05 mass pct the undercooling forthe start of the pearlitic reaction decreased dramatically,and in fact could be extrapolated to a zero undercoolingat a zero cooling rate.[5] This would mean that at such alevel, tin triggers nucleation of cementite and thus ofpearlite. It would be of great interest in investigating ifantimony leads to the same results above some criticallimit to be determined.At low level as in the present study, antimony appears
to affect the eutectoid reaction as tin does, in that itincreases effectively the amount of pearlite withoutdecreasing significantly the undercooling for the pear-litic reaction. This suggests that antimony decreases therate of ferrite growth, and this must be by adsorbing atthe graphite surface and diminishing the possibility forcarbon atoms to precipitate on graphite. Such an
Fig. 8—(a) OM micrograph of the as-cast reference sample with visible lines of microprobe measurement points labeled 1, 2, and 3; (b) enlargedmicrograph showing that individual measurement points can be identified along line #3; (c) microprobe trace along line #3 going from top-rightto bottom-left.

adsorption has not been seen in the present FIB analysisbut it has been reported by Johnson and Kovacs[14] onalloys containing higher additions at 0.07 mass pct Sband 0.11 mass pct Sn. Interestingly enough, Bofan andLanger[15] observed antimony accumulated in graphitelamellas as compared to the matrix in an alloy contain-ing 0.25 mass pct Sb, while Kovacs[16] could not find anadsorption layer in lamellar irons with up to 0.055 masspct Sb and up to 0.061 mass pct Sn while these elementsare also pearlite promoters for these alloys. Thesecontradictions stress the interest of performing morework in this area. Secondary ion mass spectroscopy(SIMS) is expected to give better results for such a goalthan EDS or Auger analyses which have a detection
limit of at best 0.2 to 0.3 mass pct for the most usualalloying elements in cast irons even when quantitativeanalysis is looked for.The present results illustrated also the interplay between
cooling rate and microsegregation issued from the solid-ification step. In the last to solidify areas, these microseg-regations strongly favor the formation of pearlite becauseof the decrease in the silicon content and the increase in,e.g., the manganese and chromium contents. However, ithas been shown that in common cast irons microsegrega-tions affect the local reference temperatures only in the partof the alloy that relates to the last 20 pct to solidify.[17]
Accordingly, the start temperatures for the stable andmetastable eutectoid transformations as reported here
Fig. 9—(a) OM micrograph of the as-cast Sb-bearing sample with visible line of microprobe measurement points; (b) view of the same zone afteretching; (c) microprobe trace along a line joining two neighboring nodules, carried out from bottom-left to top-right. The grayed area on theright corresponds to two measurement points located on the graphite nodule.
should not be much affected by microsegregation issuedfrom the solidification step.
V. CONCLUSION
The present results showed that antimony acts as tinat low-level addition in significantly increasing theamount of pearlite in nodular cast iron without signif-icantly changing the transformation temperatures andundercoolings. It would be of great interest to comple-ment the present work on alloys with higher antimonylevels for investigating if there is a critical amount over
which undercooling for the start of the pearlitic reactiondecreases as this is the case for tin.The present work demonstrates also that composition
profiles across ferrite/pearlite boundaries are smoothand similar to those issued from the solidification step.No trace of long-range diffusion of substitutional solutescould be detected which goes in line with the statementthat, under continuous cooling at a rate higher than 1.2K/min, both stable and metastable transformationsproceed with the product matrix—either ferrite orpearlite—inheriting the parent austenite content insubstitutional solutes. This is in line with the so-calledlocal para-equilibrium model which is commonly usedfor describing solid-state eutectoid transformation insteels. The lack of prior similar reports for cast irons inliterature may be due to the fact that showing smoothcomposition profiles must have been considered as notbeing worthy of publication.
APPENDIX
The thermodynamic evaluation of the Fe-Sb phasediagram by Benyan Pei et al.[18] has been introduced inthe available SSOL databank that was last updated in1998. The only change made to this latter bank is theimprovement of the Fe-C-Si system performed byMiettinen[19] to the earlier assessment by Lacaze andSundman.[20] Owing to the very limited amount ofantimony relevant for cast irons production (0.1 masspct at most), it could be considered that appropriatecalculations for Fe-C-Si-Sb alloys could be performedwithout further modifications. Figures A1 and A2compare isopleth Fe-C sections of, respectively, thestable and metastable systems at 2.0 mass pct Si and 0
Fig. 10—Microprobe traces along a line joining two neighboringnodules, from the as-cast Sb-bearing sample. This is in the same lineas in Fig. 9 but with here the contents in aluminum, copper, andsilicon.
Fig. 11—Correlation between individual measurements in silicon vschromium and manganese contents. The rectangles represent theintrinsic variability of each measurement, the length of the horizon-tal side is 2Ær for silicon (about 0.05 mass pct) and that of the verti-cal side 2Ær for either chromium (about 0.03 mass pct) or manganese(about 0.1 mass pct).
Fig. 12—Evolution with the cooling rate of the undercooling for thestart of the ferritic and pearlitic reactions.

and 1 mass pct Sb. According to these figures, 1 masspct antimony shifts slightly both the stable andmetastable eutectoid ranges to higher temperature.The Ta and Tp reference temperatures used in themain text are shown in Figures A1 and A2,respectively.
ELECTRONIC SUPPLEMENTARY MATERIAL
The online version of this article (doi:10.1007/s11661-016-3692-3) contains supplementary material,which is available to authorized users.
REFERENCES1. E. Dorazil: High Strength Austempered Ductile Cast Iron, Ellis
Horwood Ltd. and Academia, Praha, 1991, pp. 13–23.2. J.M. Schissler: Hommes et Fonderie, 1986, pp. 13–23.3. K.B. Rundman: Proc. of 101 Casting Congress, 1997, AFS, paper
97-117.4. J. Lacaze: ASM Handbook, Cast Irons, vol. 1A, 2016 (to appear).5. J. Lacaze and J. Sertucha: Inter. J. Cast Met. Res., 2016, vol. 29,
pp. 74–78.6. U. Ekpoom and R.W. Heine: AFS Trans., 1978, vol. 86,
pp. 281–86.7. R. Boeri and F. Weinberg: Cast Met., 1993, vol. 6, pp. 153–58.8. J. Lacaze, C. Wilson, and C. Bak: Scand. J. Metall., 1994, vol. 23,
pp. 151–63.9. V. Gerval and J. Lacaze: ISIJ Int., 2000, vol. 40, pp. 386–92.10. A. Hultgren: Trans. ASM, 1947, vol. 39, pp. 915–1005.11. D. Venugopalan: Proceedings of the International Symposium on
Fundamentals and applications of ternary diffusion, G.R. Purdy,ed., Hamilton, Canada, 1990, pp. 173–83.
12. X. Guo and D.M. Stefanescu: IJCMR, 1999, vol. 11, pp. 437–41.13. J. Lacaze, A. Boudot, V. Gerval, D. Oquab, and H. Santos: Me-
tall. Mater. Trans., 1997, vol. 28A, pp. 2015–25.14. W.C. Johnson and B.V. Kovacs: Metall. Trans. A, 1978, vol. 9,
pp. 219–29.15. Z. Bofan and E.W. Langer: Scand. J. Metall., 1984, vol. 13,
pp. 23–31.16. B.V. Kovacs: AFS Trans., 1980, vol. 89, pp. 79–96.17. V. Gerval and J. Lacaze: Proceedings of SP97, 4th Decennial
International Conference on Solidification Processing, eds J. Beechand H. Jones, University of Sheffield, 1997, pp. 506–10.
18. B. Pei, B. Bjorkman, B. Sundman, and B. Jansson: CALPHAD,1995, vol. 19, pp. 1–15.
19. J. Miettinen: CALPHAD, 1998, vol. 22, pp. 231–56.20. J. Lacaze and B. Sundman: Metall. Trans. A, 1991, vol. 22A,
pp. 2211–23.
Fig. A1—Isopleth Fe-C section of the stable Fe-C-Si-Sb phase dia-gram at 2.0 mass pct Si and 0 and 1 mass pct Sb in the temperaturerange of the eutectoid transformation. The Ta reference temperaturefor the alloy at 1 mass pct Sb is indicated with an arrow.
Fig. A2—Isopleth Fe-C section of the metastable Fe-C-Si-Sb phasediagram at 2.0 mass pct Si and 0 and 1 mass pct Sb in the tempera-ture range of the eutectoid transformation. The Tp reference temper-ature is assumed to be on the extrapolation of the c/a equilibriumline as indicated with an arrow for the alloy at 1 mass pct Sb.