Study of Staphylococcus aureus phage ISP and derived proteins · opportunity to do a part of my...
156
Study of Staphylococcus aureus phage ISP and derived proteins potential use as antibacterial therapeutics and anti-inflammatory properties Jonas Van Belleghem Master’s dissertation submitted to obtain the degree of Master of Biochemistry and Biotechnology Major Microbial Biotechnology Academic year 2012-2013 Promoter: Prof. Dr. Mario Vaneechoutte Scientific supervisor: Dr. Pieter Deschaght Faculty of Medicine and Healt sciences Department of Clinical Chemistry, Microbiology and Immunology Laboratory Bacteriology Research Promoter: Dr. Bjorn Vergauwen Faculty of Sciences Department of Biochemistry and Microbiology Laboratory for Protein Biochemistry & Biomolecular Engineering
Transcript of Study of Staphylococcus aureus phage ISP and derived proteins · opportunity to do a part of my...
Study of Staphylococcus aureus phage ISP
and derived proteins
potential use as antibacterial therapeutics and anti-inflammatory properties
Jonas Van Belleghem
Master’s dissertation submitted to obtain the degree of Master of Biochemistry and Biotechnology
Major Microbial Biotechnology Academic year 2012-2013
Promoter: Prof. Dr. Mario Vaneechoutte Scientific supervisor: Dr. Pieter Deschaght
Faculty of Medicine and Healt sciences Department of Clinical Chemistry, Microbiology and Immunology Laboratory Bacteriology Research
Promoter: Dr. Bjorn Vergauwen
Faculty of Sciences Department of Biochemistry and Microbiology Laboratory for Protein Biochemistry & Biomolecular Engineering


i
Acknowledgment
As an embryonic scientist, I could not imagine how hard it would be to do research. More
experiments failed than I wish to remember. One of the major things I learned was that experiments
explained in literature take more time and effort to perform than one would first think. Luckily, as
Oprah Winfrey once said: “I do not believe in failure. It is not failure if you enjoyed the process.” I
believe this is especially true for my experiences during my master thesis.
First of all, I would like to thank my promoter, Prof. Dr. Mario Vaneechoutte, for giving me
the opportunity to do my master thesis with him (and in his laboratory) and to introduce and guide
me into the fascinating world that is academic research. I would also like to thank him for his
optimism, even when my experiments did not give the expected results, and to always show me that
there is light at the end of the tunnel.
Secondly, I would like to thank Dr. Pieter Deschaght for the fruitful collaboration and for
guiding me during my thesis. May your journey at Ablynx be a good one! Thank you Dr. Maya
Merabishvili for showing me some of the wonders of bacteriophage research. Thank you everybody
else in the lab for making this thesis a pleasant, and sometimes delicious, experience.
I would also like to thank Prof. Dr. Savvas Savvides and Dr. Bjorn Vergauwen for giving me the
opportunity to do a part of my thesis in their lab and, moreover, for sharing their most helpful
insights.
Frédéric Clement and his colleagues Leen, Sabrina, Mieke and Peter at CEVAC are gratefully
thanked to teach me the art of isolation and stimulation of PBMCs.
The persons I probably need to thank the most are my parents, thank you for all the
opportunities you have given me and for your endless support in everything I try to accomplish. I
would also like to thank my brother Steven for keeping an unbelievable interest in my thesis and to
keep me thinking critically about my experiments and results, but also, together with Marnix, to keep
me ‘physically and mentally healthy’.
Finally, I would like to end this section with a few words of the phage father himself:
“I travelled through the land of the invisible, I discovered the most curious of its inhabitants, the
parasite of microbes ... I described its habits, its behaviour, its comportment, without ever having
seen it.”
Felix d’Herelle, Perigrinations d’Un Microbiologist, cited in Kuchment 2012
Jonas Van Belleghem
Gent, June 2013

ii
iii
Table of contents Acknowledgment ................................................................................................................................ i
Table of contents ............................................................................................................................... iii
List of abbreviations .......................................................................................................................... vii
Samenvatting ..................................................................................................................................... xi
Summary ......................................................................................................................................... xiii
1. Introduction ............................................................................................................................... 1
1.1. History ................................................................................................................................... 1
1.1.1. The Phage Father ........................................................................................................ 1
1.1.2. Downfall of the Phage ................................................................................................. 2
1.1.3. Return of the Phage .................................................................................................... 3
1.2. Bacteriophages ....................................................................................................................... 4
1.2.1. Different Types ........................................................................................................... 4
1.2.2. The Phage Lifecycle ..................................................................................................... 7
1.3. Phage Therapy........................................................................................................................ 8
1.3.1. Purpose ...................................................................................................................... 8
1.3.2. Applications ................................................................................................................ 8
1.3.3. Perils ........................................................................................................................... 9
1.3.4. Immunomodulatory effects......................................................................................... 9
1.4. Methicillin-resistant Staphylococcus aureus...........................................................................10
1.4.1. Infection course .........................................................................................................10
1.4.2. Peptidoglycan layer ....................................................................................................12
1.5. Antibiotics .............................................................................................................................14
1.5.1. Antibiotic resistance ..................................................................................................15
1.6. Phage ISP (Intravenous Staphylococcal Phage) ......................................................................17
1.6.1. The Genome of Phage ISP ..........................................................................................17
1.6.2. Endolysin ...................................................................................................................18
1.6.3. Holin ..........................................................................................................................21
2. Aims ......................................................................................................................................23
3. Results and discussion ...............................................................................................................25
3.1. BLAST analysis of phage ISP genome......................................................................................25
3.2. Cloning of four ISP ORFs ........................................................................................................25
3.2.1. Polymerase chain reaction (PCR) ................................................................................26
3.2.2. Topo TA cloning .........................................................................................................26
iv
3.2.3. Restriction ligation ..................................................................................................... 27
3.3. Sequencing of pET15b-ORF201 and pET15b-ORF204 ............................................................. 28
3.4. Expression optimization ........................................................................................................ 29
3.5. Protein purification ............................................................................................................... 34
3.6. Phage titre determination ..................................................................................................... 37
3.7. Immunological assay ............................................................................................................. 38
3.7.1. SEB titration ............................................................................................................... 39
4. Conclusions ............................................................................................................................... 45
4.1. Protein expression ................................................................................................................ 45
4.2. Immunology .......................................................................................................................... 47
4. Conclusies ................................................................................................................................. 49
4.1. Eiwit-expressie ...................................................................................................................... 49
4.2. Immunologie ......................................................................................................................... 51
5. Material and methods ............................................................................................................... 53
5.1. Bacterial strains ..................................................................................................................... 54
5.2. Polymerase chain reaction .................................................................................................... 54
5.3. Cloning .................................................................................................................................. 54
5.3.1. Topo TA cloning ......................................................................................................... 54
5.3.2. Plasmid purification ................................................................................................... 55
5.3.3. Ligation dependent cloning ........................................................................................ 55
5.4. Sequencing of pET15b-ORF201 and pET15b-ORF204 vectors ................................................. 55
5.4.1. PCR amplification of ORF 201 and ORF 204 fragments ............................................... 55
5.4.2. ExoSap purification of PCR products .......................................................................... 55
5.4.3. Cycle sequencing ....................................................................................................... 56
5.4.4. Ethanol precipitation ................................................................................................. 56
5.4.5. Sequence determination ............................................................................................ 56
5.5. Preparation of electrocompetent cells................................................................................... 56
5.6. Protein expression ................................................................................................................ 57
5.7. Protein purification ............................................................................................................... 57
5.7.1. Nickle-nitriloacetic acid (NiNTA) purification .............................................................. 57
5.7.2. Desalting.................................................................................................................... 58
5.7.3. Concentrating protein sample and thrombin digest ................................................... 58
5.7.4. Size exclusion chromatography .................................................................................. 58
5.7.5. Determining protein concentration ............................................................................ 58
v
5.8. SDS-PAGE ..............................................................................................................................58
5.9. Western blot .........................................................................................................................58
5.10. Phage multiplication ..............................................................................................................59
5.11. Centrifugation of phages .......................................................................................................59
5.12. Determination of phage titre .................................................................................................59
5.13. Endotoxin purification ...........................................................................................................59
5.14. PBMCs isolation and stimulation ...........................................................................................59
5.14.1. Determining cell viability ............................................................................................60
5.14.2. Staphylococcal Enterotoxin B (SEB) stimulation ..........................................................60
5.15. RNA extraction ......................................................................................................................62
5.16. DNase digest .........................................................................................................................62
5.17. cDNA synthesis ......................................................................................................................62
5.18. Reverse transcriptase quantitative polymerase chain reaction (RT-qPCR) ..............................62
5.18.1. Data analysis ..............................................................................................................63
References ........................................................................................................................................65
Addendum: Virus families .................................................................................................................79
I. Virus families not assigned to an order ..................................................................................79
i. Microviridae ......................................................................................................................79
ii. Corticoviridae ....................................................................................................................79
iii. Tectiviridae ........................................................................................................................79
iv. Leviviridae .........................................................................................................................79
v. Cystoviridae .......................................................................................................................79
vi. Inoviridae ..........................................................................................................................80
vii. Plasmaviridae ................................................................................................................80
Addendum: Gene sequences.............................................................................................................81
Addendum: RT-qPCR SEB titration data .............................................................................................83
Addendum: Protocols .......................................................................................................................85
1. TOPO cloning .........................................................................................................................85
2. Electroporation .....................................................................................................................86
3. Colony PCR ............................................................................................................................87
4. Preparation of E. coli BL21 (DE3) cells ....................................................................................88
5. Preparation of plasmids .........................................................................................................89
6. Restriction digest...................................................................................................................90
7. DNA extraction from agarose gel slices ..................................................................................91

vi
8. Ligation reaction ................................................................................................................... 92
9. Electroporation ..................................................................................................................... 93
10. ExoSap purification................................................................................................................ 94
11. Cycle Sequencing .................................................................................................................. 96
12. Ethanol Precipitation ............................................................................................................. 98
13. Optimization of recombinant protein expression ................................................................. 100
13.1. Day 1: Electroporation ............................................................................................. 100
13.2. Day 2: Pre-culture .................................................................................................... 101
13.3. Day 3: Expression test .............................................................................................. 102
13.4. Day 4: SDS-PAGE ...................................................................................................... 104
14. 12 % SDS-PAGE gel .............................................................................................................. 105
15. Western Blot ....................................................................................................................... 107
16. ORF XXX overexpression and Purification ............................................................................ 109
16.1. Day 1: Electroporation ............................................................................................. 109
16.2. Day 2: Pre-culture .................................................................................................... 110
16.3. Day 3: Expression ..................................................................................................... 111
16.5. Day 5: Concentration and thrombine digest ............................................................. 115
16.6. Day 6: Gel sizing ....................................................................................................... 116
17. Determination of bacteriophage titer .................................................................................. 117
18. Multiplication of phages ...................................................................................................... 118
19. Concentration of phages by centrifugation .......................................................................... 121
20. Removal of endotoxins from phage solutions, Hyglos EndoTrap blue (cat. No. 311063) ....... 122
21. Isolation of PBMCs from a buffy coat ................................................................................... 125
22. Titration of stimulation of PBMCs with SEB. ........................................................................ 127
23. RNA extraction – PureLink RNA mini kit (Invitrogen, cat. No. 12183018A) and Qiazol .......... 130
24. PureLink DNase (Invitrogen, Cat. No. 12185-010) ................................................................ 132
25. cDNA synthesis – QuantiTec Reverse Transcription (Qiagen, cat. no. 205311) ..................... 134
26. Quantitative PCR (qPCR) ...................................................................................................... 136
vii
List of abbreviations µl Microlitre
µm Micrometer
A Adenine
ANOVA Analysis of variance
APS Alternative Protein Source
ATP Adenosine-5'-triphosphate
BFC Bacteriophage cocktail
BLAST Basic Local Alignment Search Tool
bp Base pair
C Cytosine
CD4 Cluster of differentiation 4, is a glycoprotein found on the surface of immune cells such as T helper cells, monocytes, macrophages and dendritic cells.
CD40L CD40 ligand, also called CD154. It binds to CD40 on antigen-presenting cells.
CD8 Cluster of differentiation 8 is a transmembrane glycoprotein that serves as a co-receptor for the T cell receptor (TCR).
cfu Colony forming units
CHAP Cysteine, histidine-dependent aminohydrolase/peptidase
ddNTP Dideoxynucleotide triphosphate
DMSO Dimethylsulfoxide
DNA Deoxyribonucleic acid
dNTP Deoxynucleotide triphosphate
DPBS Dulbecco's Phosphate-Buffered Saline
ECM Extracellular matrix
EDTA Ethylenediaminetetraacetic acid
EPA The U.S. Environmental Protection Agency (EPA or sometimes USEPA) is an agency of the United States federal government which was created for the purpose of protecting human health and the environment by writing and enforcing regulations based on laws passed by Congress.
ER Endoplasmatic reticulum
FACS Fluorescence-activated cell sorting
FDA The Food and Drug Administration (FDA or USFDA) is an agency of the United States Department of Health and Human Services, one of the United States federal executive departments. The FDA is responsible for protecting and promoting public health through the regulation and supervision of food safety, tobacco products, dietary supplements, prescription and over-the-counter pharmaceutical drugs (medications), vaccines, biopharmaceuticals, blood transfusions, medical devices, electromagnetic radiation emitting devices (ERED), and veterinary products.
FPLC Fast Protein Liquid Chromatography
G Guanine

List of abbreviations
viii
GlcNAc N-acetyl glucosamine
h Hour
HCl Hydrogen chloride
ICAM Intercellular adhesion molecules
ICS Intracellular cytokine staining
IFNγ Interferon γ
IL Interleukin
IL-10 Interleukin 10
IL-2 Interleukin 2
IMAC Immobilized metal affinity chromatography
IPTG Isopropyl β-D-1-thiogalactopyranoside
ISP Intravenous Staphylococcal Phage
k(Da) Kilo (Dalton)
KGD Lys-Gly-Arg
LB Luria Bertani
M Molar
min Minute
ml Millilitre
mM Millimolar
mm Millimeter
MRSA Methicillin-resistant Staphylococcus aureus
MurNAc N-acetyl muramic acid
NAG N-acetylglucosamine
NAM N-acetylmuramic acid
NCBI National Center for Biotechnology Information
ng Nanogram
NiNTA Nickel-nitrilotriacetic acid
NK cells Natural killer cells
nm Nanometer
OD600nm Optical density at 600 nm
ORF Open Reading Frame
PAGE Poly Acrylamide Gel Electrophoresis
pBLAST Protein-protein BLAST
PBMC Peripheral blood mononuclear cell
PBP Penicillin binding protein
PBS Phosphate Buffered Saline
PCR Polymerase chain reaction
PFT Platelet–fibrin thrombi
pfu Plaque-forming-units
pH Measure of activity of the solvated hydrogen ion
PI Propidium iodide
PMN Polymorphonuclear leukocyte
qPCR Quantitative (real time) polymerase chain reaction
RNA Ribonucleic acid
RT Reverse transcriptase
SAgs Superantigens
List of abbreviations
ix
SDS Sodium dodecyl sulphate
SDS-PAGE Sodium dodecyl sulphate polyacrylamide gel electrophoresis
SEB Staphylococcal Enterotoxin B
SEC Size Exclusion Chromatography
sec Second
SH3 Src homology region 3
ssDNA Single stranded DNA
ssRNA Single stranded RNA
T Thymine
TNF-α Tumor necrosis factor α
Tris Tris(hydroxymethyl)aminomethane
U The enzyme unit (U) is a unit for the amount of a particular enzyme. One U is defined as the amount of the enzyme that catalyzes the conversion of 1 micro mole of substrate per minute.
USDA The United States Department of Agriculture (informally the Agriculture Department or USDA) is the United States federal executive department responsible for developing and executing U.S. federal government policy on farming, agriculture and food. It aims to meet the needs of farmers and ranchers, promote agricultural trade and production, work to assure food safety, protect natural resources, foster ruralcommunities and end hunger in the United States and abroad.
VCAM Vascular-cell adhesion molecules
WHO The World Health Organization (WHO) is a specialized agency of the United Nations (UN) that is concerned with international public health. It was established on 7 April 1948, with headquarters in Geneva, Switzerland, and is a member of the United Nations Development Group. WHO is responsible for the World Health Report, a leading international publication on health, the worldwide World Health Survey, and World Health Day.

x
xi
Samenvatting
Één van de grootste wetenschappelijke verwezenlijkingen van de twintigste eeuw was de
ontwikkeling van antibiotica. Antibioticaresistentie vormt echter een steeds groter wereldwijd
probleem. Daarenboven maakt de kost voor het ontwikkelen van nieuwe antibiotica, gecombineerd
met de gelimiteerde opbrengst, het bijna onmogelijk om een nieuw antibioticum op de markt te
brengen. Het is daarom aangeraden om in een nieuwe richting te zoeken voor antibacteriële
therapie, zoals die van bacteriofagen en bacteriofaag afgeleide endolysines. Bacteriofagen zijn
virussen die bacteriën van nature infecteren en dus gebruikt kunnen worden voor de behandeling
van bacteriële infecties, inclusief infecties met multi-drug resistente bacteriën.
Bacteriofagen kunnen onderverdeeld worden, naast hun morfologische classificatie, in 2
groepen volgens hun levenscyclus. Lytische fagen (waarbij zelfproliferatie synchroon gebeurt met het
vernietigen van de bacterie) en lysogene fagen (waarbij het faaggenoom zich integreert zich in het
bacteriële genoom). Endolysines zijn peptidoglycaan degraderende enzymen die geproduceerd
worden gedurende de late fase van genexpressie in de lytische cyclus. De mogelijkheid van
endolysines om de celwand af te breken (voornamelijk in Gram-positieve bacteriën, zoals
Staphylococcus aureus) wanneer ze als exogeen recombinant eiwit worden toegepast laat toe hen te
gebruiken als alternatieve antibiotica. Holines zijn noodzakelijk om de endolysines hun target te laten
bereiken en worden ook geproduceerd gedurende de late fase in de lytische cyclus. Endolysines
kunnen voor verschillende toepassingen gebruikt worden, inclusief de eliminatie van bacteriële
kolonisatie van muceuze membranen en het behandelen van bacteriële infecties. Om het potentieel
van deze endolysine en holine eiwitten te achterhalen, hebben we twee vermoedelijke endolysines
en een holine van bacteriofaag ISP (dewelke Staphylococcus aureus infecteert, een typische
multidrug resistente pathogeen) geïdentificeerd, en we hebben getracht deze eiwitten recombinant
te expresseren en op te zuiveren.
Meer dan een decennium geleden werd gesuggereerd dat bacteriofagen ook interageren
met het immuunsysteem van de zoogdiergastheer van de bacteriële species die ze infecteren, en dat
ze immunomodulaire eigenschappen bezitten. Dergelijke potentiële immunomodulatoire
eigenschappen, momenteel nog onbestudeerd, zou bacteriofaag gebaseerde antibacteriële therapie
kunnen ondersteunen, maar kan ook leiden tot nieuwe anti-inflammatoire producten, met mogelijk
minder neveneffecten dan de bestaande. Tijdens deze master thesis zijn we daarom gestart met de
ontwikkeling van een assay om de potentiële immunomodulaire eigenschappen van bacteriofagen te
kunnen testen. We gebruikten daartoe periphere bloed mononucleaire cellen (PBMCs) om de
transcriptie van specifieke cytokine mRNAs (i.e. IL-10 en TNF-α) te meten.
Ook al hebben we kunnen aantonen – door het sequeneren van de vectoren - dat alle
voorbereidende stappen (d.w.z. identificatie van de vermoedelijke endolysine en holine eiwitten,
evenals een mogelijk immunomodulair eiwit, amplifcatie van deze genen door PCR en productie van
expressie vectoren) succesvol waren, waren we niet instaat om de endolysines en het holine
recombinant te expresseren. Alternatieve methodes om deze eiwitten tot expressie te brengen
zullen verder worden onderzocht. In een tweede luik van deze master thesis waren we in staat een
deel van de RT-qPCR assay te ontwikkelen, maar door tijdsgebrek waren we echter niet in staat om
deze assay te testen tegen verschillende bacteriofagen of om zijn reproduceerbaarheid of
betrouwbaarheid na te gaan.

xii

xiii
Summary
One of the greatest scientific achievements of the twentieth century was the development and
mass production of antibiotics. However, antibiotic resistance is an increasing worldwide health
problem. The cost for the development of new antibiotics, combined with the limited revenues,
makes it almost impossible to market a new antibiotic. Therefore, it may be advisable to search in
new directions for antibacterial therapies, i.e. that of bacteriophages and phage-derived endolysins.
Bacteriophages are viruses that naturally infect bacteria and could therefore be used to treat
bacterial infections, including infections with multi-drug resistant bacteria.
Bacteriophages can be divided, aside from the morphological classification system, into roughly
two groups according to their life cycle. Lytic or virulent phages (in which self-proliferation is
synchronous with the destruction of bacteria) and lysogenic or temperate phages (whereby the
phage genome can be integrated into the bacterial genome or resides in the bacterial cytoplasm).
Endolysins are peptidoglycan degrading enzymes that are produced during the late phase of gene
expression in the lytic cycle. The capability of lysins to digest the cell wall (especially in Gram-positive
bacteria, such as Staphylococcus aureus) when applied as recombinant proteins, exogenously to
bacterial cells, has enabled their use as alternative antibiotics. However, in Gram-negatives their
efficacy is jeopardized by the outer membrane which hinders the accessibility to the peptidoglycane
layer. Holins are necessary for the endolysin to reach their target and are also produced during the
late phase of phage gene expression. Endolysins could be used for different applications, including
the elimination of bacterial colonization of mucous membranes and the treatment of bacterial
infections. To assess the potential of these endolysins and holin proteins, we identified two putative
endolysins and one putative holin from phage ISP (which infects Staphylococcus aureus, a typical
multidrug resistant pathogen), which we tried to recombinantly express and purify.
Furthermore, it has been hypothesized, more than a decade ago, that bacteriophages can
interact with the immune system of the mammalian host of the bacterial species they infect, i.e. that
they have immunomodulatory properties. At present, the ability of phages to modulate the immune
system is still unexplored, although their putative immunomodulatory abilities might not only
support the application of phage-based antibacterial therapy, but it might also lead to new (more
natural) anti-inflammatory products, possibly with less side effects than existing ones. For this
purpose, we tried to develop, during this master thesis, an RT-qPCR assay to determine the
immunological potential of different bacteriophages by using peripheral blood mononuclear cells
(PBMCs) and measuring the transcription of specific cytokine mRNAs (i.e. IL-10 and TNF-α).
Although we could show that all the preparative steps (i.e. identification of putative endolysin and
holin proteins, as well as a possible immunomodulating protein, amplification of these genes by PCR
and production of expression vectors) succeeded, and confirmed this by sequencing of the
constructs, it was not possible to express recombinant phage ISP endolysins and holin. Alternative
methods to express these proteins will be applied in future research. In a second part of this master
thesis we were able to set up a PBMC stimulation assay and assess inflammatory effects with
intracellular cytokine staining. We also started with the development of an RT-qPCR assay, but due to
time limitations, we were not able to test this assay on different bacteriophages or test its reliability
or reproducibility.

xiv
1
1. Introduction
Antibiotic resistance is an increasing worldwide health problem. Because of the problems with
antibiotic resistance, research is also being directed to alternative antibacterial treatments such as
bacteriophage therapy. Bacteriophages are viruses that naturally infect bacteria and could therefore
be used to treat bacterial infections, including infections with multi-drug resistant bacteria.
Bacteriophages are specifically adapted to infect certain bacterial species. Therefore, phages could
be applied as narrow spectrum anti-microbial agents. Not only purified phages but also phage-
derived proteins could provide possible therapeutic applications.
In part one of the introduction, the history of bacteriophages is briefly summarized, illuminating
how they were discovered and why they were forgotten. Next, the taxonomy of bacteriophages is
briefly discussed. In the third part the therapeutic potential of phages is discussed, together with
their purposes, applications and perils. The fourth part considers antibiotic resistance, dealing with
the origin of antibiotic resistance and why it is hard to get rid of this problem. Part five focuses on the
problems caused by methicillin-resistant Staphylococcus aureus (MRSA) and its infection course. The
sixth part discusses how phage ISP - which forms the subject of the research carried out during this
master thesis - as a whole or phage ISP derived proteins (i.e. endolysins and holin) might provide a
solution for the problems caused by MRSA.
1.1. History
1.1.1. The Phage Father
To grasp the importance of bacteriophages it is valuable to understand the history of their
discovery and applications. The discovery of bacteriophages can essentially be attributed to Félix
d’Herelle and Frederick William Twort. Félix d’Herelle (Figure 1) was an enigmatic personality, born in
1873 near Montreal. He was raised by his mother in Holland and France. He was essentially a self-
educated man (Summers, 2011). During a study of an invasion of locusts in Mexico, in 1910, d’Herelle
observed a strange phenomenon (d’Herelle, 1911a). While studying the bacteria, which he
designated as ‘Coccobacillus’, that caused septicaemia in locusts in Mexico, he observed the
formation of clear plaques (‘taches claires’) in the bacterial cultures (d’Herelle, 1911b). When he
scraped the surface of the agar in the transparent patches and viewed them under the microscope
he did not see anything (d’Herelle, 1918). He assumed that there was something causing the clear
spots and he found that it was small enough to be filtered through a Chamberland filter, which was
known for holding back all bacteria (Chamberland, 1884; Dublanchet & Bourne, 2007). In August
1915, d’Herelle returned to Paris where he investigated an epidemic of dysentery (i.e. an
inflammatory disorder of the intestine, especially of the colon, that results in severe diarrhea
containing mucus and/or blood in the feces with fever and abdominal pain) in a cavalry squadron in
Maisons-Lafitte near Paris (d’Herelle, 1916). Filtered emulsions of the feces of the sick were placed
on dysentery bacilli cultures and spread on nutritive agar on Petri dishes. Once again, the clear spots
were observed (d’Herelle, 1917). D’Herelle interpreted his plaque-forming agent as an ultravirus that
infected the bacteria (Summers, 2011). A note from d’Herelle was presented to the Académie des
Sciences by Dr Emile Roux on September 15, 1917 in which the invisible microbial antagonist of
dysentery bacillus was introduced to the medical community. This antagonist was named
‘bacteriophage’, from 'bacteria' and Greek phagein "to devour" (d’Herelle, 1917).

1. Introduction
2
Figure 1: Félix d’Herelle (seated) and George Eliava (right), adopted from Stone (2002).
Besides d’Herelle there was a second discoverer of bacteriophages. Like d’Herelle, Frederick
William Twort, a British pathologist in London, was studying something else (i.e. growth of Vaccinia
virus on cell-free agar) when he noticed that the contaminating micrococci in his Vaccinia
preparations sometimes exhibited a patchy dissolution of the colonies. This effect could be
transmitted to fresh colonies by transfer with a sterile needle. Twort was unable to follow up on his
observation. After only two publications on his observation, Twort moved on to other work
(Summers, 2011; Twort, 1915).
A third important person in the history of bacteriophages is George Eliava (Figure 1). After
spending five years in Paris with d’Herelle, he returned to Tbilisi in Georgia (part of the USSR back
then) where he founded the ‘George Eliava Institute of Bacteriophage, Microbiology and Virology’ in
1923, with the blessing of Soviet dictator Josef Stalin. In 1933, Eliava’s phage program got a big
boost, when d’Herelle left Yale University to join his protégé in Tbilisi. D’Herelle stayed here until the
dead of Eliava (Stone, 2002). The Eliava institute still exists today.
There are constant debates on whether the discovery of bacterial viruses should be attributed to
Félix d’Herelle or to Frederick William Twort (Duckworth, 1976). As it often happens in science, it is
not enough to discover something new. It is equally important to see the possible applications of a
new discovery. Félix d’Herelle clearly recognized the viral nature of his agent and devoted the rest of
his scientific life to it. He also pioneered several principle lines of bacteriophage research by
introducing phage treatment of bacterial infections, and by hinting that bacteriophages are suitable
for research on the nature of the gene (D’Herelle, 1921; D’Herelle, 1931). It is therefore that he can
be seen as the true ‘phage father’.
1.1.2. Downfall of the Phage
There are many possible explanations for the initial failure of bacteriophage therapy. In 1932,
Larckum, an American health officer stated that “because of conflicting experimental observations,
enthusiastic and poorly controlled clinical application and rapidly expanding commercial exploitation,
a situation is developing which will, unless guided and checked, lead to the ultimate rejection of
bacteriophage by all who make any pretence to the practice of scientific medicine” (Larckum, 1932).
The rejection of phage therapy began with the misuse of phages and became complete with the
emergence of antibiotics during World War II. One of the greatest scientific achievements of the
1. Introduction
3
twentieth century was the development and mass production of antibiotics, such as the discovery of
penicillin by Alexander Fleming. For more than 60 years, antibiotics have comprised Western
medicine’s primary defence against bacterial disease. Initially antibiotics were cheap, widely available
and extremely effective against nearly all bacterial diseases. The golden age of antibiotics let to the
discarding of phage therapy by the West as an unnecessary approach to an already solved problem
(Keen, 2012).
In 1932, a team of German scientists of the chemical company Bayer strung together two
improbable compounds and found that they could kill streptococci. The new drug was Sulfanilamide
(later called sulfa drugs), a unique combination of sulphur and red dye that would usher in the age of
synthetic superdrugs. As compared to bacteriophages, sulfa drugs produced results that were
relatively uniform and simple to reproduce in the lab (Kuchment, 2012). Sulfadrugs used against
staphylococcal septicemia in 1941 resulted in a 65 % success rate (Torrey & Julianelle, 1941). This
was in strong contrast to an extensive bacteriophage study of the same disease in 1936. In this study,
100 patients were injected with bacteriophages every 24 to 48 hours and administered
bacteriophages intravenously for several days. In the end, there was only a 25 % success rate
(MacNeal & Frisbee, 1936). Another reason for the downfall of the phage was that the drug
preparation did not require the time-consuming procedure of isolation and culturing of the phages
specifically for the bacterial strains affecting the patient (Ho, 2001).
There were at least 270 antibiotics reported by 1953. These drugs were required to have a broad
antibiotic spectrum in order to be considered generally useful. They also had to be minimally
allergenic, to retain activity even in the presence of pus, serum and large numbers of bacteria, to be
obtainable on an industrial scale from biosynthesis or chemical synthesis in a process that would not
require the individual handling of the separate cultures, to be water-soluble and to be stable against
destruction by heat, acid, alkali an light (Pratt & Dufrenoy, 1953). Many of these properties cannot be
found in bacteriophages.
1.1.3. Return of the Phage
Although antibiotics have saved millions of lives, our chemical shield has become increasingly
leaky, see 1.5 Antibiotics (Keen, 2012). The director-general of the World Health Organization
warned that the world is on the brink of losing these miracle cures (i.e. antibiotics). The world could
be heading into a post-antibiotic era where many infections will no longer have a cure (Liljeqvist et al,
2012; National Health and Medical Research Council, 2008). The number of newly approved
antibiotics in the United States of America has steadily declined. Despite increased awareness and
redoubled efforts, the current research and development (R&D) pipelines remain largely dry
(Hughes, 2011). Even when effective antibiotics are available, it is becoming increasingly apparent
that broad-spectrum antibiotics can have sustained and harmful effects on the body’s communities
of beneficial bacteria (Buffie et al, 2012). According to a growing body of research, these beneficial
bacteria play a vital role in human nutrition and immunity (O'Hara & Shanahan, 2006; Rupa & Mine,
2012; Wallace et al, 2011; Yan & Polk, 2004). Rather than to continuing to focus solely on chemical
solutions to drug-resistance, which are static responses to a dynamic system, scientists started to
seek approaches that can keep pace with the bacteria they are designed to kill (Keen, 2012). Phage
therapy might provide an alternative to disease prevention in an era of antibiotic-resistant bacteria
(Carlton, 1999; Dublanchet & Bourne, 2007).
1. Introduction
4
Phages also have several advantages over antibiotics: they are ecologically safe (i.e. harmless to
humans, plants and animals), and phage preparations are readily producible, easy to apply and show
no apparent adverse reaction to multi-component phage preparation (sometimes called ‘cocktails’)
(Kutateladze & Adamia, 2010). Phages have exceptional qualities as antibacterial agents. They
possess the ability to multiply exponentially in the presence of bacteria, hereby increasing their titre,
in contrast to antibiotics whose titre decreases once administered. Also phages have a high
selectivity, therefore not affecting the commensal microbiome (Fruciano & Bourne, 2007). In
addition, phages can rapidly adapt and initiate their action against bacteria. This means that it is
possible to select new phages to infect bacteriophage resistant bacteria (Carlton, 1999; Merril et al,
2003; Sulakvelidze et al, 2001; Thacker, 2003). Phages have also no known side effects and can be
produced as a low-cost treatment (Thiel, 2004). Although bacteria can become resistant to phages,
phage-resistance is not nearly as worrisome as drug-resistance. Like bacteria but unlike antibiotics,
phages mutate and therefore can evolve to counter phage-resistant bacteria (Matsuzaki et al, 2005).
The pros and cons of phage therapy will be discussed in more detail in part three.
1.2. Bacteriophages
Phages are known in over 140 bacterial genera. They occur in Archaea (archaeoviruses) and
Bacteria, in cyanobacteria, in endospore formers, spirochetes, mycoplasmas and chlamydias, in
aerobes, anaerobes, budding, gliding, ramified, sheathed or stalked bacteria (Ackermann, 2003). In
the following discussion we shall focus on bacteriophages of Bacteria.
1.2.1. Different Types
According to d’Herelle there was only one bacteriophage species with many races, the
Bacteriophagum intestinale (d’Hérelle, 1918). Lwoff, Horne and Tournier published a system of
viruses based an morphology and nucleic acid type (Lwoff et al, 1962). A further milestone was the
recognition of six basic types: tailed phages, filamentous phages and cubic phages with ssDNA or
ssRNA (Bradley, 1967). This simple scheme is still the basis of present phage classification. In its first
report, the International Committee for Taxonomy of Viruses, ICTV, classified phages into six genera
corresponding essentially to Bradley’s basic types (Wildy, 1971).
The ICTV presently classifies viruses into 6 orders, 94 families, 22 subfamilies, 395 genera and
2480 species. Bacteriophages constitute one order, 13 families and 40 genera (King et al, 2011). Most
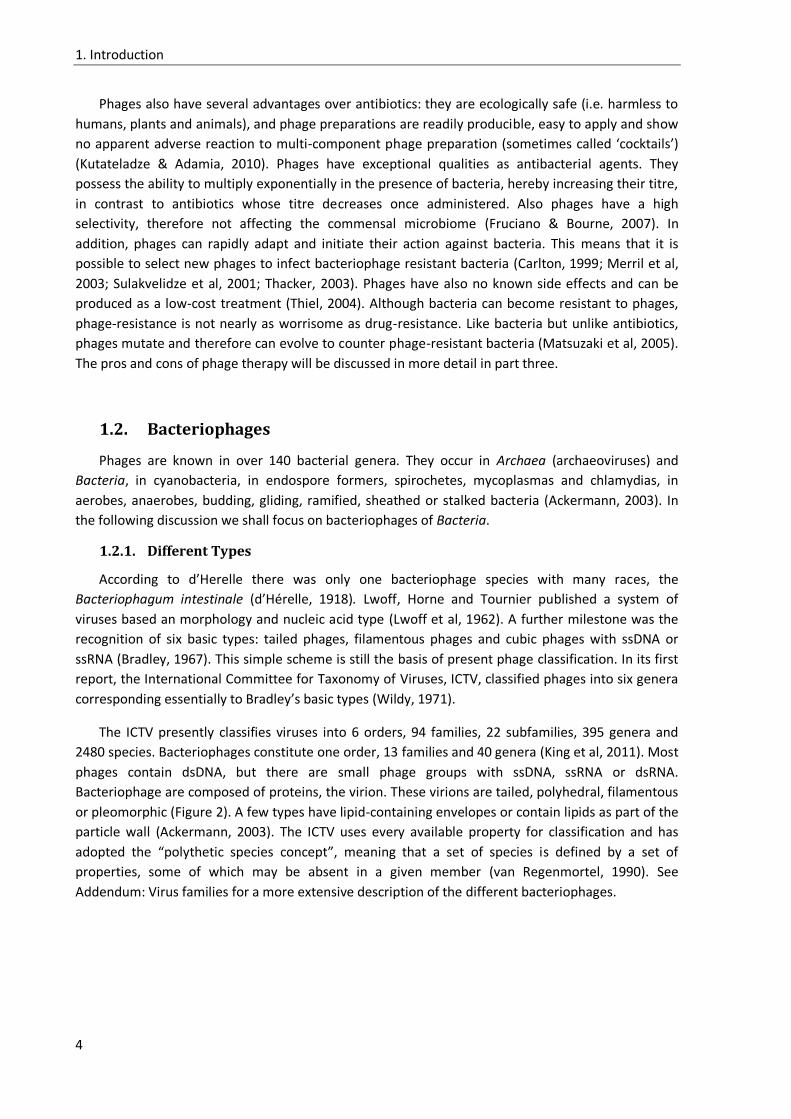
phages contain dsDNA, but there are small phage groups with ssDNA, ssRNA or dsRNA.
Bacteriophage are composed of proteins, the virion. These virions are tailed, polyhedral, filamentous
or pleomorphic (Figure 2). A few types have lipid-containing envelopes or contain lipids as part of the
particle wall (Ackermann, 2003). The ICTV uses every available property for classification and has
adopted the “polythetic species concept”, meaning that a set of species is defined by a set of
properties, some of which may be absent in a given member (van Regenmortel, 1990). See
Addendum: Virus families for a more extensive description of the different bacteriophages.
1. Introduction
5
1.2.1.1. Caudovirales
Caudovirales are the typical tailed phages, the particles consist of a head with cubic symmetry
and a helical tail (Lwoff et al, 1962). They possess no membrane envelope and usually consist of
protein and DNA alone. The head-tail structure is unique in virology. Tail-like structures do occur in
other viruses, e.g. Tectiviridae and some algal viruses, but these are inconstant and do not compare
with the permanent, regular tails of tailed phages (Ackermann, 1998). The heads are icosahedra or
elongated derivatives thereof. The capsid is formed out of basic subunits, called capsomers. The tails
are helical or consist of stacked disks and carry in most cases terminal fixation structures such as
base plates, spikes or fibres. The genome is a single, linear, double-DNA strand (Ackermann, 2003).
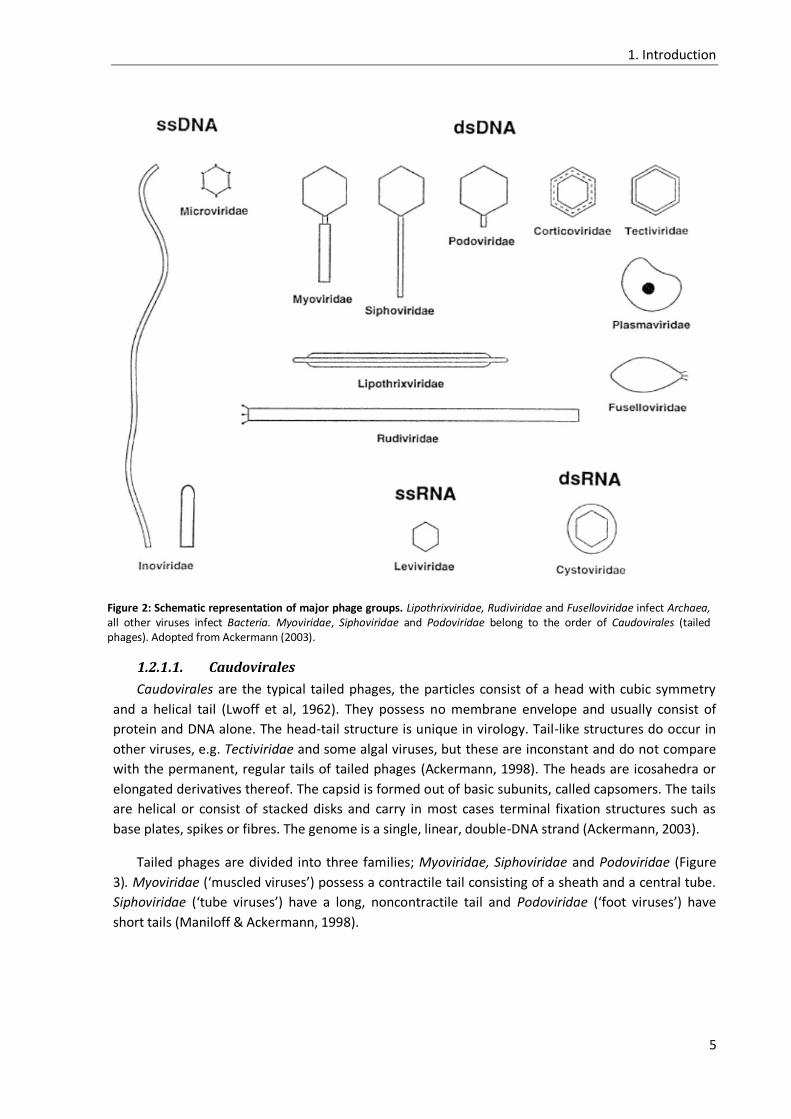
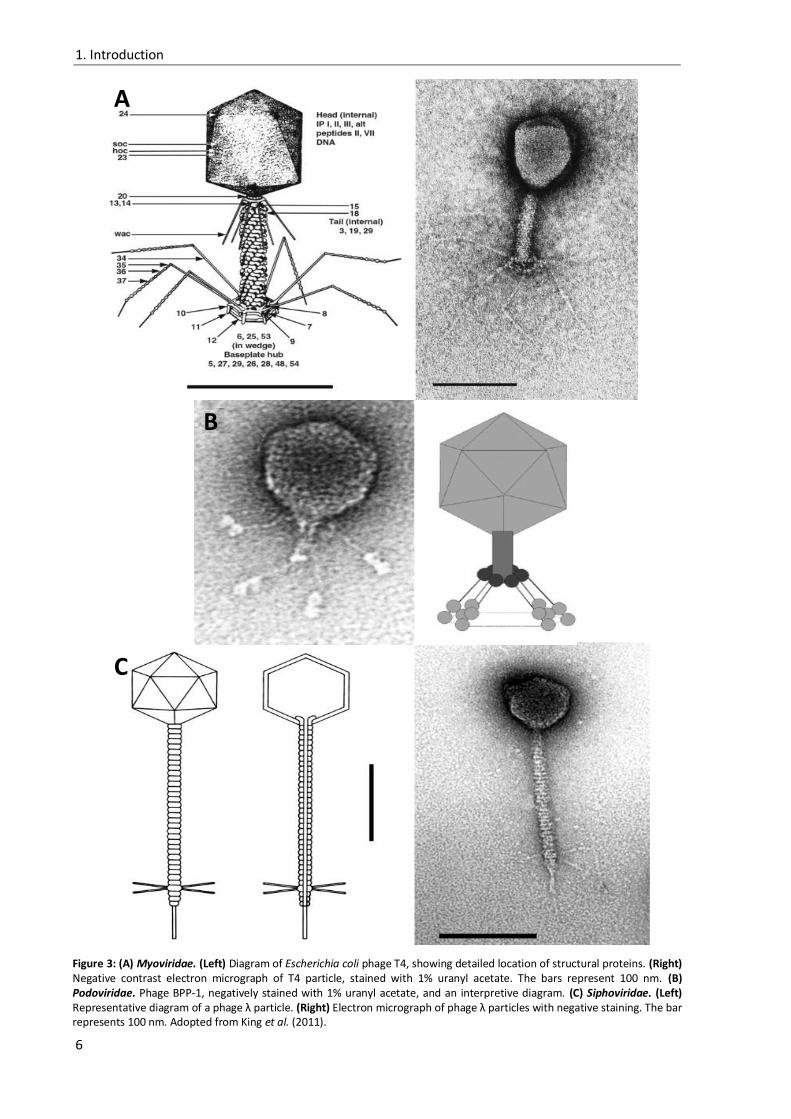
Tailed phages are divided into three families; Myoviridae, Siphoviridae and Podoviridae (Figure
3). Myoviridae (‘muscled viruses’) possess a contractile tail consisting of a sheath and a central tube.
Siphoviridae (‘tube viruses’) have a long, noncontractile tail and Podoviridae (‘foot viruses’) have
short tails (Maniloff & Ackermann, 1998).
Figure 2: Schematic representation of major phage groups. Lipothrixviridae, Rudiviridae and Fuselloviridae infect Archaea, all other viruses infect Bacteria. Myoviridae, Siphoviridae and Podoviridae belong to the order of Caudovirales (tailed phages). Adopted from Ackermann (2003).
1. Introduction
6
C
B
A
Figure 3: (A) Myoviridae. (Left) Diagram of Escherichia coli phage T4, showing detailed location of structural proteins. (Right) Negative contrast electron micrograph of T4 particle, stained with 1% uranyl acetate. The bars represent 100 nm. (B) Podoviridae. Phage BPP-1, negatively stained with 1% uranyl acetate, and an interpretive diagram. (C) Siphoviridae. (Left) Representative diagram of a phage λ particle. (Right) Electron micrograph of phage λ particles with negative staining. The bar represents 100 nm. Adopted from King et al. (2011).
1. Introduction
7
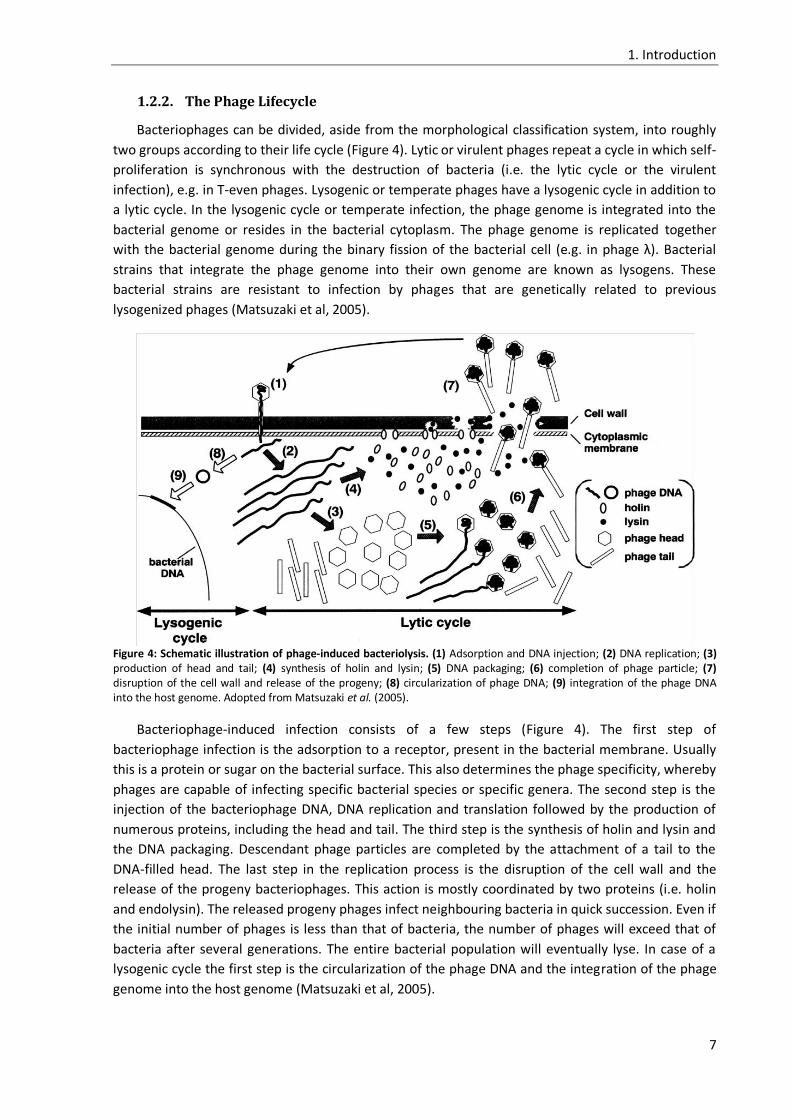
1.2.2. The Phage Lifecycle
Bacteriophages can be divided, aside from the morphological classification system, into roughly
two groups according to their life cycle (Figure 4). Lytic or virulent phages repeat a cycle in which self-
proliferation is synchronous with the destruction of bacteria (i.e. the lytic cycle or the virulent
infection), e.g. in T-even phages. Lysogenic or temperate phages have a lysogenic cycle in addition to
a lytic cycle. In the lysogenic cycle or temperate infection, the phage genome is integrated into the
bacterial genome or resides in the bacterial cytoplasm. The phage genome is replicated together
with the bacterial genome during the binary fission of the bacterial cell (e.g. in phage λ). Bacterial
strains that integrate the phage genome into their own genome are known as lysogens. These
bacterial strains are resistant to infection by phages that are genetically related to previous
lysogenized phages (Matsuzaki et al, 2005).
Figure 4: Schematic illustration of phage-induced bacteriolysis. (1) Adsorption and DNA injection; (2) DNA replication; (3) production of head and tail; (4) synthesis of holin and lysin; (5) DNA packaging; (6) completion of phage particle; (7) disruption of the cell wall and release of the progeny; (8) circularization of phage DNA; (9) integration of the phage DNA into the host genome. Adopted from Matsuzaki et al. (2005).
Bacteriophage-induced infection consists of a few steps (Figure 4). The first step of
bacteriophage infection is the adsorption to a receptor, present in the bacterial membrane. Usually
this is a protein or sugar on the bacterial surface. This also determines the phage specificity, whereby
phages are capable of infecting specific bacterial species or specific genera. The second step is the
injection of the bacteriophage DNA, DNA replication and translation followed by the production of
numerous proteins, including the head and tail. The third step is the synthesis of holin and lysin and
the DNA packaging. Descendant phage particles are completed by the attachment of a tail to the
DNA-filled head. The last step in the replication process is the disruption of the cell wall and the
release of the progeny bacteriophages. This action is mostly coordinated by two proteins (i.e. holin
and endolysin). The released progeny phages infect neighbouring bacteria in quick succession. Even if
the initial number of phages is less than that of bacteria, the number of phages will exceed that of
bacteria after several generations. The entire bacterial population will eventually lyse. In case of a
lysogenic cycle the first step is the circularization of the phage DNA and the integration of the phage
genome into the host genome (Matsuzaki et al, 2005).

1. Introduction
8
1.3. Phage Therapy
Bacteriophage therapy involves the use of phages or their products as bioagents for the
treatment or prophylaxis of bacterial infectious diseases (Matsuzaki et al, 2005).
1.3.1. Purpose
Bacteriophage therapy has many advantages over chemotherapy. It is effective against
multidrug-resistant pathogenic bacteria because the mechanisms by which phages induce
bacteriolysis differ completely from those of antibiotics. It can also respond rapidly to the
appearance of phage-resistant mutants because the phages themselves can mutate. The cost of
developing a phage system is relatively cheaper than that of developing a new antibiotic. Side effects
from phages per se are uncommon, because phages or their products do not effect eukaryotic cells
(Matsuzaki et al, 2005). Bacteriophage therapy can therefore offer a possible alternative to
conventional antibiotic treatments for bacterial infections (Gorski et al, 2009). Bacteriophages have
several characteristics that make them potentially attractive therapeutic agents. Phages are highly
specific and very effective in lysing targeted pathogenic bacteria. Phages are also safe, as
underscored by their extensive clinical use in Eastern Europe and the former Soviet Union and the
commercial sale of phages in the 1940s in the United States (Sulakvelidze et al, 2001).
1.3.2. Applications
Although phage therapy trails in the United States and most of Western Europe ceased after
World War II, basically as a consequence of the widespread success and availability of antibiotics,
phage therapy was still actively pursued in the Soviet Union and some other Eastern European
countries. The institute founded by George Eliava and d’Herelle in Tbilisi was and still is one of the
main centres for phage production and application (Summers, 2001).
The clinical use of phage therapy is faced with long product development and approval timelines
in Western regulatory frameworks. As a result, many companies and researchers have pursued food
safety, agricultural, industrial and clinical diagnostic applications instead. Several companies have
successfully developed phage-based products with EPA, USDA and FDA approval. Such products have
established a favourable regulatory precedent in which individual components of phage cocktails can
be fine-tuned towards bacterial targets (Lu & Koeris, 2011). Besides these non-therapeutic products,
there are no current approvals in the Western world for phage therapeutics. In order to achieve
clinical use, rigorous trials to validate safety and efficacy need to be established. Animal studies have
generally supported the utility and safety of bacteriophage therapy against bacterial pathogens, such
as Pseudomonas aeruginosa (McVay et al, 2007b; Soothill, 1994), Staphylococcus aureus (Wills et al,
2005), vancomycin-resistant Enterococcus faecium (Biswas et al, 2002), Clostridium difficile (Ramesh
et al, 1999) and Klebsiella pneumoniae (Vinodkumar et al, 2005).
Increasing interest in phage therapy in the Western world has led to several safety and efficacy
trials in humans. These clinical trials have used between one and eight bacteriophages at levels
between 105 to 3 X 10⁹ plaque-forming-units (pfu). This corresponds to doses in the low nanogram to
microgram range (Harper & Enright, 2011; Matsuzaki et al, 2005; Merril et al, 2003; Stone, 2002).
Merabishvili et al. (2009) recently described a complete protocol for the isolation,
characterization, manufacturing, purification and quality control of bacteriophages for clinical use.
This protocol included the use of a commercially available endotoxin removal kit and was able to
obtain sufficient purity for use in a European clinical trial (Merabishvili et al, 2009). Such processes
1. Introduction
9
will continue to be optimized and up scaled if more commercial entities enter into phage therapy and
positive regulatory precedents are set (Lu & Koeris, 2011).
1.3.3. Perils
There exist a number of problems comprising phage therapy that still need to be resolved and
which thwart the current use of phage therapy: the inactivation of administered phages or lysin by a
neutralizing antibody and allergic reactions to them, appearance of mutants resistant to phages, and
capture and transfer of bacterial toxin genes by phages (Matsuzaki et al, 2005). Regarding the first
problem, decreases in the therapeutic effect with multiple administrations have not been shown, nor
have side effects such as allergies been observed for phages or lysin. Although, antibodies against
phages have been detected in mouse blood (Cheng et al, 2005; Yoong et al, 2004). Resistance of
bacteria to phages is often caused by changes in the phage-receptor molecules in Gram-negative
bacteria. In phages of Gram-negative bacteria, host-range mutant phages, which restore the ability to
adsorb to the host, are easily isolated from the original phage population (Drexler et al, 1991; Drexler
et al, 1989; Montag et al, 1987). The problem of capture of bacterial toxin or antibiotic-resistant
genes by phages may be overcome by selection of virulent, i.e. non temperate (non-lysogenic)
phages which do not have naturally generalized or specialized transduction abilities, or by
construction of genetically modified mutant phages (Schoolnik et al, 2004).
The obstacles to phage therapy are not purely scientific: manufacturing, production, and
redistribution concerns relating to the scalability of phage therapy have also been discussed (Lu &
Koeris, 2011). To date, the FDA has essentially grafted its traditional antibiotic regulatory protocols
onto phage therapy, meaning that all components of a phage cocktail must go through individual
clinical trials and that the composition of these cocktails cannot be altered without re-approval
(Thiel, 2004). This policy does not reflect the fundamental differences between phages and
antibiotics, and would, if perpetuated, likely render phage therapy both prohibitively expensive and
significantly less effective (Keen, 2012).
There exists at least one regulatory precedent that could be appropriately applied to phage
therapy, rather than regulate phage cocktails as it does drug cocktails. The FDA could instead
regulate phage cocktails in a manner analogous to the FluMist® influenza vaccine. Each year,
FluMist®, a live-virus vaccine comprising a cocktail of three or four attenuated influenza strains, is
reformulated to most effectively counter circulating flu strains (Marwick, 2000). Rather than
mandate separate clinical trials for each season’s vaccine, the FDA has instead approved the process
by which FluMist® is developed. Such a regulatory model could also be applied to phage cocktails,
rather than requiring separate trials for each component of a preparation. The FDA could instead set
stringent guidelines on the process by which those cocktails are produced. The FDA could, for
instance, establish formal standards for the screening of phages, the purification of phage
preparations and the selection of appropriate phages for patients’ unique infections. It is argued that
if the FDA were to modernize its current stance on phage therapy, scientific certainties, not
regulatory uncertainties, could determine the future of this promising treatment (Keen, 2012).
1.3.4. Immunomodulatory effects
It has been hypothesized, more than a decade ago, that bacteriophages can also interact with
the immune system of the mammalian host of the bacterial species they infect, i.e. that they have
immunomodulatory properties (Gorski et al, 2012a; Gorski et al, 2003; Mcvay et al, 2007a). The
hypothesis of the group of Gorski is based on the presence of the KGD (Lys-Gly-Arg) motif on certain

1. Introduction
10
phage proteins, a motif known to interact with β3 integrins on e.g. platelets and monocytes (Gorski
et al, 2003). This opens the possibility that phages not only have direct antibacterial activity, but also
display immunomodulatory activity, with broader therapeutic potential.
1.4. Methicillin-resistant Staphylococcus aureus
Staphylococci are inherently susceptible to most antibiotics except those with purely anti-Gram-
negative spectra. Nevertheless, staphylococci remain frequent causes of morbidity and mortality,
having proved adept at developing resistance, both by mutation and by DNA transfer. The spread of
antibiotic resistance among strains of S. aureus is a major concern in the treatment of staphylococcal
infections. It is well known that the organism acquires resistance soon after the introduction of new
antibiotics (Lyon & Skurray, 1987). Penicillin-resistant S. aureus was reported within 4 years after the
introduction of penicillin G into clinical use in 1941. In 1946, over 94% of S. aureus isolates were
susceptible, meaning that 6 % produced a penicillinase (β-lactamase). By 1950, half were resistant
(Livermore, 2000). Other antibiotics such as erythromycin, tetracycline and aminoglycosides were
used for the treatment of patients infected by penicillinase-producing S. aureus only to result in the
appearance of multidrug resistant S. aureus by the 1950s (Ito et al, 2003). Methicillin was developed
in 1960 for the treatment of such multi-drug resistant S. aureus. However, in the same year, Jevons
discovered methicillin-resistant S. aureus (MRSA), which by 1970s became spread all over the world
(Jevons et al, 1963).
In Europe the prevalence of methicillin-resistant strains varies from country to country. This
fluctuates from more than 30 % in the United Kingdom, France, Italy, Spain and Portugal, to less than
2 % in the Netherlands and Scandinavian countries which already had very stringent policies to begin
with. In Belgium the proportion of patients with S. aureus bacteremia (i.e. the presence of bacteria in
the blood) who had MRSA ranged from 10 % in 1984 to 30 % in 1992. The proportion of MRSA strains
in contrast to the S. aureus isolates declined from 24 % in 1994 to 14 % in 1998. In 1999 the ratio
increased again to 24 % (Volksgezondheid, 2004).
1.4.1. Infection course
Staphylococcus aureus is a classical pathogen, causing infections at many sites (Lowy, 1998b;
Waldvogel, 1995). Despite its pathogenicity, S. aureus is also carried innocuously by ca. 30 % of the
population, usually on the moist skin in the nose, axillae and perineum. It survives well on drier skin
and inanimate surfaces, facilitating cross-colonisation and cross-infection (Solberg, 1965). Skin and
soft tissue infections are frequent and range from minor eruptions through infected ulcers and
cellulitis to servere impetigo. Staphylococcus aureus is also a frequent invader of surgical and other
wounds, sometimes leading to sepsis (Reacher et al, 2000). Staphylococcal bone and joint infections
can arise through contamination in orthopaedic surgery, and S. aureus is the most common pathogen
in this setting. Other surgical sites can be invaded as well: S. aureus is one of the more common
causes of prosthetic valve endocarditis (i.e. an inflammation of the inner layer of the heart,
the endocardium) and an occasional agent of post-neurosurgical meningitis. Native valve
endocarditis can also arise, mostly among intravenous narcotic abusers (Livermore, 2000). S. aureus
is an infrequent but serious cause of pneumonia, mostly in debilitated patients on ventilators, or
following influenza (Lowy, 1998b; Waldvogel, 1995).
S. aureus has a diverse arsenal of components and products that contribute to the pathogenesis
of infection. These components and products have overlapping roles and can act either in concert or
alone. A great deal is known about the contribution of these bacterial factors to the development of

1. Introduction
11
infection (Marrack & Kappler, 1990; Waldvogel, 1995). Infections are initiated when a breach of the
skin or mucosal barrier allows staphylococci to access the adjoining tissues or the bloodstream.
Whether an infection is contained or spreads depends on a complex interplay between S. aureus
virulence determinants and the host defense mechanisms (Lowy, 1998a).
Staphylococcal bacteremia may be complicated by endocarditis or sepsis. The endothelial cell is
central to these pathogenic processes. Not only is it a potential target for injury, its activation also
contributes to the progression of endovascular disease. Staphylococci avidly adhere to endothelial
cells and bind through adhesin-receptor interactions (Ogawa et al, 1985; Tompkins et al, 1990;
Vercellotti et al, 1984). In vitro studies demonstrate that after adherence, staphylococci are
phagocytized by endothelial cells (Hamill et al, 1986; Ogawa et al, 1985). The intracellular
environment protects staphylococci from host defence mechanisms as well as the bactericidal effects
of antibiotics (Proctor et al, 1995; Vesga et al, 1996).
Staphylococcal strains that cause endocarditis are resistant to serum, adhere to both damaged
and undamaged native valvular surfaces, are resistant to platelet microbial proteins and elaborate
proteolytic enzymes that facilitate spread to adjacent tissues (Wu et al, 1994). The adherence of
staphylococci to the platelet-fibrin thrombus that forms on damaged valvular surfaces may involve
the adherence to endothelial cells directly or by means of bridging ligands that include serum
constituents such as fibrinogen. The invasion of endothelial cells by S. aureus may initiate the cellular
alterations, including the expression of tissue factor, that promote the formation of vegetation
(Figure 5)(Drake & Pang, 1988; Hamill et al, 1986; Ogawa et al, 1985; Tompkins et al, 1990).
The cellular events leading to septic shock in staphylococcal infections are similar in infections
with Gram-negative bacteria. Monocytes and macrophages have, in both cases, a central role,
although polymorphonuclear leukocytes, endothelial cells and platelets also play a part. The
monocytes release tumor necrosis factor α (TNF- α) and interleukin-1 (IL-1), interleukin-6 (IL-6) and
interleukin-8 (IL-8) after contact with intact staphylococci or peptidoglycan (Heumann et al, 1994;
Timmerman et al, 1993). The expression of IL-1 and IL-6 by endothelial cells requires bacterial
phagocytosis (Yao et al, 1995). As a result of cytokine and cellular activation the complement and
coagulation pathways are activated, arachidonic acid is metabolized and platelet-activating factor is
released. These events, in turn, cause fever, hypotension, capillary leak, depression of myocardial
function and multi-organ dysfunction. Several staphylococcal components appear to be capable of
initiating the sepsis syndrome (Bone, 1994).
The typical pathological finding of staphylococcal disease is abscess formation. Leukocytes are
the primary host defence against S. aureus infection (Verdrengh & Tarkowski, 1997). The migration of
leukocytes to the site of infection results from the orchestrated expression of adhesion molecules to
endothelial cells. This cytokine-mediated process is triggered by bacteria and tissue-based
macrophages. After infection, cytokines are first demonstrable within vessels, extending into the
tissue as inflammatory cells migrate to the sites of infection (Yao et al, 1997). S. aureus can cause
different diseases, such as bacteremia, endocarditis, sepsis and toxic shock syndrome (Lowy, 1998a).

1. Introduction
12
Figure 5: Pathogenesis of staphylococcal invasion of tissue. The sequence of events progresses from left to right. Circulating staphylococci bind to sites of endovascular damage where platelet–fibrin thrombi (PFT) have formed. The bacteria may adhere to endothelial cells directly or by means of bridging ligands that include serum constituents such as fibrinogen. Modifications of the endothelium resulting from microenvironmental changes (such as alterations in the extracellular matrix [ECM]) can signal changes in cellular susceptibility to infection. After phagocytosis by endothelial cells, the bacteria excrete proteolytic enzymes that facilitate the spread to adjoining tissues and the release of staphylococci into the bloodstream. Once in the adjoining subepithelial tissues, the bacteria elicit an inflammatory response that results in abscess formation. This sequence of events contributes to the establishment of endocarditis when cardiac endothelium is involved. After phagocytosis, endothelial cells express Fc receptors and adhesion molecules (vascular-cell adhesion molecules [VCAM] and intercellular adhesion molecules [ICAM]) and release interleukin-1, interleukin-6, and interleukin-8. As a result, leukocytes adhere to endothelial cells, with diapedesis to the site of infection. Changes in the conformation of endothelial cells result in increased vascular permeability, with transudation of plasma proteins. Both tissue-based macrophages and circulating monocytes release interleukin-1, interleukin-6, interleukin-8 and tumor necrosis factor α (TNF-α) after exposure to staphylococci. Macrophage activation occurs after the release of interferon-γ by T cells. PMN denotes polymorphonuclear leukocyte. Adopted from Lowy (1998).
1.4.2. Peptidoglycan layer
For S. aureus cells to multiply in an environment with a lower external pressure (compared to the
high osmotic pressure in the cell), they must keep synthesizing a strong extracellular structure called
peptidoglycan (or murein) to prevent the cells from rupturing (Hiramatsu, 2001). The staphylococcal
cell wall is 50 % peptidoglycan by weight. Peptidoglycan consists of alternating polysaccharide
subunits of N-acetylglucosamine (NAG) and N-acetylmuramic acid (NAM) with β-1,4 linkages. The
peptidoglycan chains are cross-linked by tetrapeptide chains bound to N-acetylmuramic acid and by a
pentaglycine bridge specific for Gram positives. Peptidoglycan may have endotoxin-like activity,
stimulating the release of cytokines by macrophages, activation of complement and aggregation of
platelets (Lowy, 1998a). To produce peptidoglycan, its monomeric component (NAM-NAG-
tetrapeptide) must be synthesized inside the cell, and transferred to the outside by a lipid carrier
(bactroprenol) present in the cytoplasmic membrane (Hiramatsu, 2001).
Two enzymes located in the cytoplasmatic membrane, glycosyltransferase and transpeptidase,
assemble the murein monomer into a gigantic structure of peptidoglycan. Before these two enzymes
can do their work, the peptidoglycan layer must be opened to allow new building blocks to enter the
structure. This is done by autolysins. Glycosyltransferase polymerizes murein monomers with β-1,4
glycosidic links to produce nascent peptidoglycan chains. Then, transpeptidases, also known as

1. Introduction
13
penicillin-binding proteins (PBP), link the newly formed nascent peptidoglycan chains to pre-existing
peptidoglycan layers of the S. aureus cells. In this step, PBP recognizes the terminal D-alanyl-D-
alanine residues of the tetrapeptide moiety of the murein monomer, cuts in between the two D-
alanines and ligates the penultimate D-alanine to the tip of a pentaglycine chain protruding from pre-
existing peptidoglycan layers (Figure 6A). When the interpeptide bridge is formed, the terminal D-
alanine of the murein monomer is lost from the completed peptidoglycan. However, it is known that
about 20 % of D-alanyl-D-alanine residues remain unprocessed by PBPs. As a result, as many as 6 x
106 unprocessed D-alanyl-D-alanine residues remain in the cell wall of a single S. aureus cell
(Hiramatsu, 1998; Hiramatsu, 2001). Besides enzymes that help form the peptidoglycanlayer,
bacteria also possess enzymes that help degraded the cell wall. These enzymes, autolysins, play an
important role in the growth of the bacterial cell wall and belong to the N-Acetylmuramyl-L-Alanine
amidases (see 1.6.2) (Vollmer et al, 2008).
Figure 6: Cell-wall peptidoglycan synthesis in S. aureus. (A) Assembly of peptidoglycan viewed from outside of the cell. Cytoplasmic membrane is depicted in blue. Glycosyltransferase polymerizes the murein monomer to produce a nascent peptidoglycan single chain. Penicillin-binding protein (PBP) binds covalently at the D-alanyl-D-alanine residues of the stem peptide and cleaves in between the residues to ligate the penultimate D-alanine to the pentaglycine of the neighbouring peptidoglycan chain. The twisting of peptidoglycan chains is omitted from the illustration for visual simplicity. (B) Action of beta-lactam antibiotic: Beta-lactam (purple double cubes) is a structural analogue of D-alanyl-D-alanine residues. It inactivates S. aureus PBPs (in red), but cannot bind to PBP2 (in green; MRSA-specific PBP) with high affinity. Therefore, MRSA can continue peptidoglycan synthesis in the presence of beta-lactams whereas meticillin-susceptible S. aureus cannot. Adopted from Hiramatsu et al. (2001).
PBP is the target of β-lactam antibiotics such as penicillin. Beta-lactam is a structural analogue of
D-alanyl-D-alanine, and it covalently binds to the S. aureus PBP (depicted in Figure 6B, in red) at its D-
alanyl-D-alanine-binding pocket. This inactivates the PBP and inhibits the cross-bridge formation step
of peptidoglycan synthesis, causing the cell to rupture from the peptidoglycan mesh. However, MRSA
produces a unique PBP, designated PBP2’ (depicted in green in Figure 6B), which has an extremely
low binding affinity to β-lactam antibiotics (Hartman & Tomasz, 1984; Utsui & Yokota, 1985). As a
result, the PBP2’ can keep on synthesising the peptidoglycan even in the presence of β-lactam
antibiotics. This is the basis of β-lactam resistance in MRSA (Hiramatsu, 2001). The unique PBP2’ is
the product of the exogenous gene called mecA carried by a mobile genetic element, SCCmec, which
S. aureus has acquired from an as yet unknown bacterial species by lateral gene transfer (Katayama
et al, 2000; Zhaxybayeva & Doolittle, 2011).
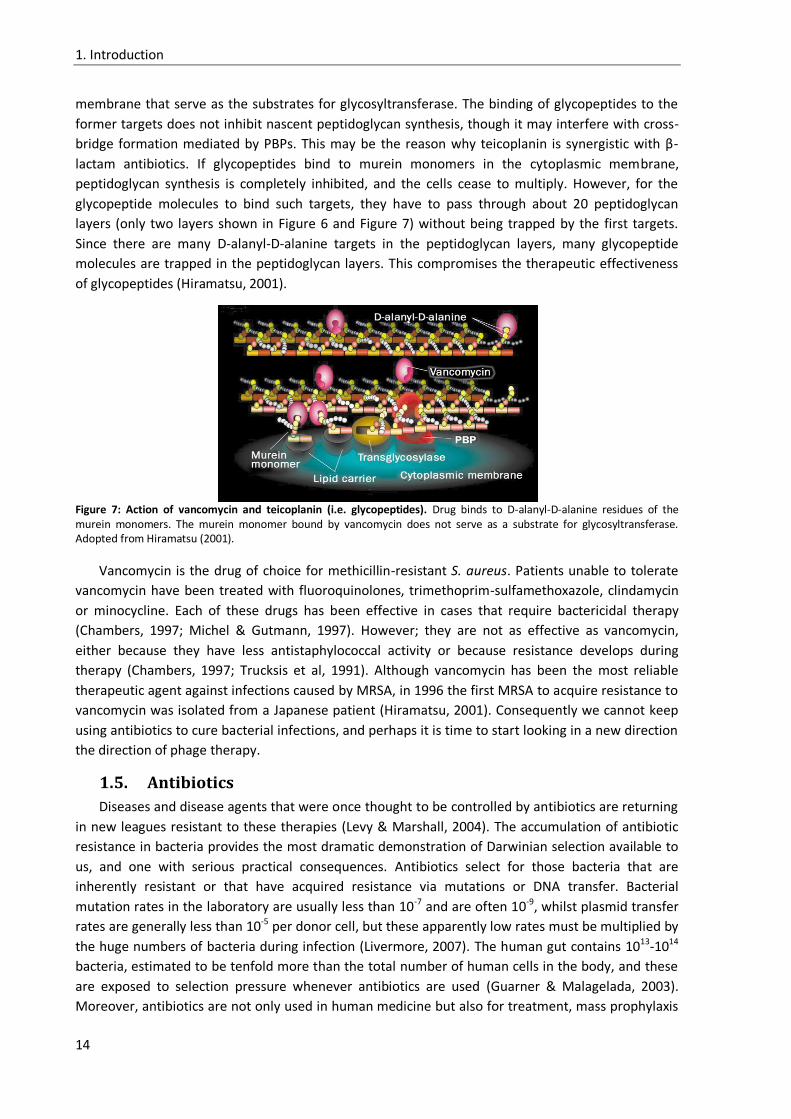
In contrast with β-lactams, glycopeptides (such as vancomycin or teicoplanin) bind to D-alanyl-D-
alanine residues of the murein monomer (Figure 7). There are two classes of binding targets in the S.
aureus cell: firstly, D-alanyl-D-alanine residues in the completed peptidoglycan layers or on the
nascent peptidoglycan chain; and secondly, the murein monomers located in the cytoplasmatic
1. Introduction
14
membrane that serve as the substrates for glycosyltransferase. The binding of glycopeptides to the
former targets does not inhibit nascent peptidoglycan synthesis, though it may interfere with cross-
bridge formation mediated by PBPs. This may be the reason why teicoplanin is synergistic with β-
lactam antibiotics. If glycopeptides bind to murein monomers in the cytoplasmic membrane,
peptidoglycan synthesis is completely inhibited, and the cells cease to multiply. However, for the
glycopeptide molecules to bind such targets, they have to pass through about 20 peptidoglycan
layers (only two layers shown in Figure 6 and Figure 7) without being trapped by the first targets.
Since there are many D-alanyl-D-alanine targets in the peptidoglycan layers, many glycopeptide
molecules are trapped in the peptidoglycan layers. This compromises the therapeutic effectiveness
of glycopeptides (Hiramatsu, 2001).
Figure 7: Action of vancomycin and teicoplanin (i.e. glycopeptides). Drug binds to D-alanyl-D-alanine residues of the murein monomers. The murein monomer bound by vancomycin does not serve as a substrate for glycosyltransferase. Adopted from Hiramatsu (2001).
Vancomycin is the drug of choice for methicillin-resistant S. aureus. Patients unable to tolerate
vancomycin have been treated with fluoroquinolones, trimethoprim-sulfamethoxazole, clindamycin
or minocycline. Each of these drugs has been effective in cases that require bactericidal therapy
(Chambers, 1997; Michel & Gutmann, 1997). However; they are not as effective as vancomycin,
either because they have less antistaphylococcal activity or because resistance develops during
therapy (Chambers, 1997; Trucksis et al, 1991). Although vancomycin has been the most reliable
therapeutic agent against infections caused by MRSA, in 1996 the first MRSA to acquire resistance to
vancomycin was isolated from a Japanese patient (Hiramatsu, 2001). Consequently we cannot keep
using antibiotics to cure bacterial infections, and perhaps it is time to start looking in a new direction
the direction of phage therapy.
1.5. Antibiotics
Diseases and disease agents that were once thought to be controlled by antibiotics are returning
in new leagues resistant to these therapies (Levy & Marshall, 2004). The accumulation of antibiotic
resistance in bacteria provides the most dramatic demonstration of Darwinian selection available to
us, and one with serious practical consequences. Antibiotics select for those bacteria that are
inherently resistant or that have acquired resistance via mutations or DNA transfer. Bacterial
mutation rates in the laboratory are usually less than 10-7 and are often 10-9, whilst plasmid transfer
rates are generally less than 10-5 per donor cell, but these apparently low rates must be multiplied by
the huge numbers of bacteria during infection (Livermore, 2007). The human gut contains 1013-1014
bacteria, estimated to be tenfold more than the total number of human cells in the body, and these
are exposed to selection pressure whenever antibiotics are used (Guarner & Malagelada, 2003).
Moreover, antibiotics are not only used in human medicine but also for treatment, mass prophylaxis
1. Introduction
15
and (outside the European Union) growth promotion in animals, with resistant bacteria passed to
humans via the food chain (Livermore, 2007). It should be stressed that antimicrobial resistance is
also evident in other microorganisms, namely parasites, fungi and viruses (Levy & Marshall, 2004). It
should also be noted that antibiotics also induce transformation and hypermutation, increasing the
likelihood that resistance genes are picked up (transformation) or resistance mutations are
generated (Bayliss & Moxon, 2002; Prudhomme et al, 2006; Schlacher et al, 2006; Thomas & Nielsen,
2005).
Drug-resistant strains initially appeared in hospitals, where most antibiotics were being used
(Levy, 1998). Sulfoanimide-resistant Streptococcus pyogenes emerged in military hospitals in the
1930s (Levy, 1982). London civilian hospitals were confronted with penicillin-resistant Staphylococcus
aureus very soon after the introduction of penicillin in the 1940s (Barber & Rozwadowska-Dowzenko,
1948). The long-term use of a single antibiotic (i.e. for more than ten days, even when there is no
infection present) will select for bacteria that are resistant not only to the antibiotic, but to several
others (Levy, 1985). This phenomenon was found to occur after the prolonged use of tetracycline for
urinary tract infections and for acne (Datta et al, 1971; Moller et al, 1977).
1.5.1. Antibiotic resistance
The resistance problem can be seen as an equation with two main components: the antibiotic or
antimicrobial drug, which inhibits susceptible organisms and selects for resistant ones, and the
genetic resistance determinant in microorganisms selected by the antimicrobial drug (Levy, 1994;
Levy, 2002b). Drug resistance only emerges when the two components come together in an
environment or host, which can lead to a clinical problem. Selected resistance genes and their hosts
spread and propagate under continued antimicrobial selection to amplify and extend the problem to
other hosts and other geographic locations (Levy & Marshall, 2004). There are more than 15 classes
of antibiotics whose targets are involved in essential physiological or metabolic functions of the
bacterial cell. None has escaped a resistance mechanism (Levy, 2002a).
The many mechanisms that bacteria exhibit to protect against antibiotics can be classified into
four basic types (Figure 8). Antibiotic modification is the best known: the resistant bacteria retain the
same sensitive target as antibiotic sensitive strains, but the antibiotic is prevented from reaching it.
This happens, for example, with β lactamases. The β lactamases enzymatically cleave the four
membered β lactam ring, rendering the antibiotic inactive. Some antibiotic resistant bacteria protect
the target of antibiotic action by preventing the antibiotic from entering the cell or by pumping it out
faster than it can flow in (Levy, 1992; Nikaido, 1996). Bacteria may be protected against antibiotics by
the production of an alternative target (i.e. usually an enzyme) that is resistant to inhibition by the
antibiotic while continuing to produce the original sensitive target. This allows bacteria to survive in
the face of selection. The alternative enzyme bypasses the effect of the antibiotic. The best known
example of this mechanism is probably the alternative penicillin binding protein (PBP2a), which is
produced in addition to the “normal” penicillin binding proteins by MRSA. The final mechanism
concerns alterations in the primary site of action. This may mean that the antibiotic penetrates the
cell and reaches the target site but is unable to inhibit the activity of the target because of structural
changes in the molecule (Hawkey, 1998; Levy & Marshall, 2004).

1. Introduction
16
Figure 8: Biological mechanisms of resistance. Resistance mechanisms vary. Some are directly interfering with the antibiotic: enzymes such as β-lactamases destroy penicillins and cephalosporins, and modifying enzymes inactivate chloramphenicol and aminoglycosides such as streptomycin and gentamicin. Others target how the drug is transported, e.g. an active efflux of drug mediates resistance to the tetracyclines, chloramphenicol and the fluoroquinolones or the porines changed so that there is no uptake (Levy, 1992; Nikaido, 1996). A third type of mechanism (not shown) alters the intracellular target of the drug making the drug unable to inhibit a vital function in the microbial cell; e.g. the ribosome, metabolic enzymes or proteins involved in DNA replication or cell wall synthesis. The fourth mechanism are alterations in the primary site of action (not shown), whereby the antibiotic penetrates the cell and reaches the target site but is unable to inhibit the activity of the target because of structural changes in the molecule. Adopted from Levy and Marshall (2004).
Resistance in bacteria can be intrinsic or acquired. Intrinsic resistance is a naturally occurring trait
arising from the biology of the organism, e.g. vancomycin resistance in Echerichia coli. Cell wall
thickness plays an important role in vancomycin resistance, this results in more vancomycin
molecules being trapped in the peptidoglycan layer (see 1.4.2)(Hiramatsu, 2001). Acquired resistance
occurs when a bacterium that has been sensitive to antibiotics develops resistance, this may happen
by mutation or by acquisition of new DNA (Hawkey, 1998). Drug resistance is mobile, the genes for
resistance traits can be transferred among bacteria of different taxonomic and ecological groups by
means of mobile genetic elements such as plasmids (by transconjugation), bacteriophages (by
transduction), naked DNA (by transformation) or by transposons within genomes or plasmids (by
transposition) (Levy & Miller, 1989). These genes are generally directed against a single family or type
of antibiotic, although multiple genes, each bearing a single drug resistance trait, can accumulate in
the same organism. In the absence of plasmid and transposons (which may mediate high-level
resistance), a step-wise progression from low-level to high-level resistance occurs in bacteria through
sequential mutations in chromosomes (Schneiders et al, 2003; Wang et al, 2001).
Resistant bacteria may rapidly appear in the host or environment after antibiotic use, but they
are difficult to get rid of, even in the absence of the selecting antibiotic. This phenomenon reflects
the minimal survival cost to the emerging resistant strains. In addition, resistance genes are often
linked with genes specifying resistance to other antimicrobials or toxic substances on the same
plasmid: cross resistance (Summers, 2002). The presence of multi-drug resistant plasmids assures
maintenance of the plasmid as long as any one of the resistances provides a survival advantage to
the host bacterium. This principle also applies to determinants of resistance to biocides such as
1. Introduction
17
quaternary ammonium compounds, because biocide efflux genes can be found in plasmids bearing
genes for resistance to antibiotics in S. aureus (Levy & Marshall, 2004; Sidhu et al, 2002).
Although drug resistance has been recognized since the early 1940s, and despite many national
and international reports, including that of the World Health Organization, urging ways to curtail it,
the problem continues to increase (Levy & Marshall, 2004; WHO, 2001). The discovery and
development of new antibiotics remain vital. Therefore, the fact that many pharmaceutical
companies have quit the field is disturbing. This withdrawal is partly the result of companies merging
into larger companies; as a result, the turnover that they seek per product has increased to around
$1 billion (roughly €780 million) per annum. For an injectible antibiotic, this turnover translates into
10-12 % of the worldwide market, a target unlikely to be achieved if the drug has a narrow spectrum
or if it is only to be used against strains resistant to existing agents. Even if wide usage is achieved the
drug generates no long-term consumers, and may be compromised by emerging resistance (Projan,
2003). Biotechnology companies do seek to develop antibiotics with projected turnovers of much
less than $1 billion, but, so far, these mostly depend on venture capital (i.e. is financial capital
provided to early-stage, high-potential, high risk, growth startup companies), not sales income. The
development of an antibiotic is estimated to cost $500-800 million (roughly €390-620 million),
whereby most of the budget is consumed by phase II/III clinical trials. In principle, this barrier can be
overcome by the biotech company joining with a major pharmaceutical company for phase II/III
development, but this strategy hits the problem of the declining interest in antibiotics by the big
pharmaceutical companies (Livermore, 2005).
1.6. Phage ISP (Intravenous Staphylococcal Phage)
Phage ISP was originally isolated in the 1920s from an unknown source in Tbilisi (Georgia) by the
Eliava institute of Bacteriophage, Microbiology and Virology and has been selected as a therapeutic
phage based on a host range study on burn wound isolates (Vandersteegen et al, 2011). ISP is a
member of the Myoviridae and is closely related to phage G1 (Kwan et al, 2005). Merbabishvili et al.
(2009) evaluated the safety and efficacy of bacteriophage therapy with standardized quality
controlled small-scale production of the phage cocktail BFC-1. This cocktail contains two phages
infecting Pseudomonas aeruginosa (14/1 and PNM), and one phage infecting S. aureus (i.e. ISP),
which are both frequent pathogens in burn wound infections. The physicochemical properties and
the pyrogenicity of the phage cocktail, and hence of the ISP preparation, are conform to the
European Pharmacopoeia standards (i.e. the directions for the identification of samples and the
preparation of compound medicines, published by the authority of a government or a medical or
pharmaceutical society). The cocktail showed no cytotoxicity for human neonatal foreskin
keratinocytes (Merabishvili et al, 2009).
1.6.1. The Genome of Phage ISP
Vandersteegen et al. (2011) have performed an extensive microbiological and molecular
examination of this therapeutically important phage, which included stability assays, genome and
virion analysis and an extensive host range screening. They were able to predict 215 open reading
frames in the genome of phage ISP. Phage ISP has its genes organized, as was earlier described for
phages K and Twort (Kwan et al, 2005; O'Flaherty et al, 2004), in three major modules, encoding
structural proteins, components of the replication and transcription machinery, and proteins
responsible for cell lysis. For the purpose of phage therapy, the ISP genome encodes no potential
gene products resembling known virulence or toxic proteins. Phage ISP does not encode an RNA
1. Introduction
18
polymerase, which implies its dependency on the host RNA polymerase for transcription. In this
context, phage ISP encodes a sigma factor-binding polypeptide, Gp47, first identified in phage G1
(Dehbi et al, 2009), which displays a growth-inhibitory effect when overexpressed in S. aureus, and
considered to be one of the crucial components in the phage strategy to redirect the host RNA
polymerase to the transcription of phage DNA.
1.6.2. Endolysin
Bacteriophages have developed two basic strategies for releasing their progeny from bacterial
cells. Filamentous phages (e.g. M13) are ‘chronic phages’, which are continuously extruded from
bacterial cells without lysing the host (Russel et al, 1997). Nonfilamentous bacteriophages (e.g.
Caudovirales) induce lysis of the host cell. Lysis is the result of abrupt damage to the bacterial cell
wall by means of specific lysis proteins, and can be accomplished in two different ways: inhibition of
peptidoglycan synthesis by a single protein (bacteriophages with small single-stranded RNA or DNA
genomes) or enzymatic cleavage of peptidoglycan by a holin-endolysin system (phages containing
large double-stranded DNA genomes) (Bernhardt et al, 2001a; Bernhardt et al, 2001b; Young et al,
2000; Ziedaite et al, 2005).
Endolysins are dsDNA bacteriophage-encoded enzymes that are produced during the late phase
of gene expression in the lytic cycle to degrade peptidoglycan (Loessner, 2005; Young et al, 2000).
The name of endolysin was coined in 1958 to designate a probably proteinaceous lytic substance
synthesized in bacterial cells during phage multiplication and acting on the cell wall from inside the
cell (Jacob & Fuerst, 1958). Lysins should be clearly distinguished from the lytic enzymes, which, in
some phages, are an integral component of the virion and that locally digest the cell wall from the
outside to enable the phage genome to be injected into the host cell, e.g. the tail lysozyme of
bacteriophage T4 (Kanamaru et al, 2005). The capability of lysins to digest the cell wall (especially in
Gram-positive bacteria) when applied as recombinant proteins exogenously to bacterial cells has
enabled their use as alternative antibiotics (Borysowski et al, 2006). In Gram-negatives their efficacy
is jeopardized by the outer membrane which hinders the accessability to the peptidoglycane layer.
1.6.2.1. Mode of action
As discussed above, peptidoglycan is composed of the repeat polymer of the aminoacid sugars N-
acetylglucosamine and N-acetylmuramic acid, linked by β-1,4 glycoside bonds, and tetrapeptide side
chains attached to the lactyl group of muramic acid by amide bonds. Adjacent tetrapeptides may be
cross-linked by an interpeptide bond (in Gram-negative bacteria) or by an interpeptide bridge (in
Gram-positieve bacteria). In Gram-positive bacteria, the cell wall is thick and consists of several layers
of peptidoglycan associated with teichoic acids. In contrast, the cell wall of Gram-negative bacteria is
relatively thin and is composed of a single layer of peptidoglycan surrounded by the outer membrane
(Hiramatsu, 2001).
Endolysins can be divided into five main classes (Figure 9), depending on the enzymatic
specificity; N-acetylmuramidases (i.e. lysozymes), endo-β-N-acetylglucosaminidases and lytic
transglycosylases, which all cleave the sugar moiety of peptidoglycan. Endopeptidases cleave the
peptide moiety and N-acetylmuramoyl-L-alanine amidases cut the amide bond between both
moieties. Of these, muramidases and amidases seem to be the most numerous. With the exception
of transglycosidases, all endolysins are hydrolases (Loessner, 2005; Young et al, 2000). Endolysin-
mediated peptidoglycan cleavage leads to the formation of holes in the cell wall, through which the
intracellular osmotic pressure extrudes the cytoplasmic membrane, which ultimately results in

1. Introduction
19
hypotonic lysis of the bacterial cell, this was revealed by thin-section electron microscopy (Fenton et
al, 2010; Fischetti, 2003).
Figure 9: Typical peptidoglycan structure of Gram-positive bacteria, showing lysin cleavage sites. The cleavage sites are indicated: (1) N-acetylmuramidases; (2) N-acetyl-β-D-glucosaminidases and transglycosidases; (3) N-acetylmuramoyl-L-alanine amidases; (4) L-alanoyl-D-glutamate endopeptidases and interpeptide bridge-specific endopeptidases. Abbreviations: GlcNAc (N-acetyl glucosamine), MurNAc (N-acetyl muramic acid). Adopted from Fenton et al. (2010).
Typically, one endolysin displays only one kind of muralytic activity, i.e. it is either a muramidase,
a transglycosylase, a glucosaminidase, an endopeptidase or an amidase. However, at least four
bifunctional lysins have been reported, i.e. enzymes harbouring two independent muralytic activities.
These endolysins are encoded by Streptococcus agalactiae bacteriophage B30 (muramidase and
endopeptidase), S. aureus phage φ11 (endopeptidase and amidase), S. agalactiae phage NCTC 11261
(endopeptidase and muramidase) and S. warneri M phage φWMY (endopeptidase and
amidase)(Cheng et al, 2005; Navarre et al, 1999; Pritchard et al, 2004; Yokoi et al, 2005).
Generally, endolysins lack secretory signals. Their access to the peptidoglycan from inside the cell
is dependent on small hydrophobic proteins, termed holins, which enable endolysin molecules to
cross the inner membrane (Borysowski et al, 2006). Three endolysins, from Oenococcus oeni phage
fOg44, coliphage P1 and Lactobacillus plantarum phage φg1e, have been found to contain an N-
terminal secretory signal and to be translocated across the cytoplasmic membrane by the host sec
system rather than by holin lesions. In this case, the pre-exported endolysins may be activated by
membrane disruption and depolarization mediated by holins (Xu et al, 2005; Xu et al, 2004).
Typically, the genes encoding lysis proteins are clustered to form a so-called lysis cassette, in which
the holin gene is located immediately upstream of the endolysin gene (Young et al, 2000; Young,
2002). Endolysin activity is not essential for killing a bacterial cell by a bacteriophage. After entering
bacteria, phages kill their host in the course of multiplication. Lysin is a means of destroying the cell
wall, thereby enabling progeny virions to be released (Matsuda et al, 2005; Thiel, 2004).
The majority of endolysins, when applied exogenously to bacterial cells (as recombinant
proteins), display a narrow spectrum of lytic activity, which may be determined by at least three
distinct factors: unique linkages to be cleaved in the cell wall, specific enzyme activation by
components present exclusively in or on the cell wall, and specificity in substrate recognition and cell

1. Introduction
20
wall binding (Loessner et al, 1997). This spectrum is often restricted to the host bacterial species of
the phage from which a certain endolysin was derived. In some cases it is genus specific (Loeffler et
al, 2001; Loessner et al, 2002; Loessner et al, 1997; Schuch et al, 2002). However, amidases have
been suggested to display a broader spectrum of antibacterial activity than other classes of
endolysins because of the frequent presence of the amide bond between N-acetylmuramic acid and
L-alanine in peptidoglycan (Navarre et al, 1999).
1.6.2.2. Structure
A typical feature of endolysins is their modular structure, that is, they are composed of at least
two distinct functional domains (i.e. modules), with the catalytic domain typically situated at the N-
terminus and the cell wall-binding domain at the C-terminus (Fischetti, 2003; Loessner, 2005;
Loessner et al, 2002). This modular structure can be experimentally demonstrated by analysis of
enzymatic and cell wall-binding functions of deletion mutants, the creation of functional chimeric
enzymes, site-directed mutagenesis and x-ray crystallography (Hermoso et al, 2003; Lopez et al,
1997; Morita et al, 2001; Navarre et al, 1999; Pritchard et al, 2004). It should be noted that not all
lysins possess a modular structure, with as an example T7 lysozyme, which is a single-domain,
globular protein (Cheng et al, 1994).
The C-terminal domain, although responsible for targeting the bacterial cell wall, is not always
essential for endolysin antibacterial activity. In some cases the truncated endolysins exhibit a higher
bacteriolytic activity than the full-length enzyme molecule (Gaeng et al, 2000; Vasala et al, 1995). A
possible explanation is that, in some endolysins, an additional role of the C-terminal domain might be
the inhibition of the catalytic activity of the N-terminal domain when not bound to the cognate cell
wall. This inhibitory effect might be removed on high-affinity binding of the cell wall by the C-
terminal domain (Low et al, 2005).
The modular structure of endolysins seems to be an advantage because it enables one to alter
their binding specificity and enzymatic activity independently by replacing either domain with the
corresponding domain from another enzyme (Croux et al, 1993; Lopez et al, 1997; Sheehan et al,
1996). The major task of endolysins is to enable progeny virions to be released from the host cell. In
this regard, to ensure the effective liberation of phages, the cell wall-binding domain may have
evolved to target some unique and essential component of the cell wall of the host bacterium. This
would explain the variability of this module and the highly selective lytic activity of endolysins and
would imply that resistance should develop rarely (Fischetti, 2003).
Endolysins could be used for different applications, including the elimination of bacterial
colonization of mucous membranes, the treatment of bacterial infections, the biocontrol of bacteria
in food, and the protection of plants against phytopathogenic bacteria (Borysowski et al, 2006). One
of the potential obstacles to endolysin therapy seems to been a humoral immune response induced
after both systemic and mucosal administration (Fischetti, 2005). Such a response could reduce or
completely block its antibacterial activity, especially after repeated injections, for instance, during
the treatment of a chronic infection. Nevertheless, it has been shown that previous intravenous
exposure of mice to Cpl-1 (i.e. a pneumococcal phage lytic enzyme) did not significantly diminish its
therapeutic efficacy in vivo, and hyperimmune rabbit serum only modestly inhibited its activity in
vitro (Loeffler et al, 2003). Furthermore, antibodies against streptococcal and anthrax phage
endolysins obtained from hyperimmunized rabbits did not neutralize their antibacterial activity, likely
because of the very high affinity of the enzymes to their substrates in the cell wall (Fischetti, 2005).
1. Introduction
21
As mentioned earlier, the development of resistance to lysins is quite unlikely, because these
enzymes, being essential for the release of phage progeny, may have evolved to target unique
molecules in the cell wall that are essential for bacterial viability. The theory derives support from
the fact that the receptor for pneumococcal phage lysins is choline, an amino alcohol found to be
necessary for pneumococcal viability (Fischetti, 2003; Loeffler et al, 2001).
Phage ISP contains two endolysins closely together in the genome (ORF 201 and ORF 203) and
one lysozyme-like protein (ORF 197)(Vandersteegen et al, 2011).
1.6.3. Holin
As indicated above (1.6.2.1), holins are necessary for the endolysin to reach their target. Both
holins and endolysins are produced during the late phase of phage gene expression. The folded
endolysin molecules accumulate in the cytosol and at a genetically determined moment start to pass
through the membrane, likely through homo-oligomeric membrane pores formed by holins
(Borysowski et al, 2006). According to a recent report, holin oligomers may further accumulate in the
membrane to form rafts, which would lead to a more generalized membrane disruption than
previously thought (Wang et al, 2003). Phage ISP contains one Holin (ORF 204) close to the two
endolysins in the genome (Vandersteegen et al, 2011).
Holins comprise the most diverse functional group of proteins known. They are small
bacteriophage-encoded proteins that accumulate during the period of late-protein synthesis after
infection and cause lysis of the host cell at a precise, genetically programmed time. Holins are
encoded by genes in at least 35 different families with no orthologous relationships. After
accumulating and oligomerizing in the membrane throughout the period of late-gene expression,
holins suddenly trigger to form a lesion that permeabilizes the membrane. This event ends
macromolecular synthesis. Moreover, the disruption of the membrane directly leads to lysis by
allowing endolysin to attack the peptidoglycan. Holin function is thus the sole direct determinant of
the length of the infective cycle and the yield of progeny phage. The longer the time before lysis, the
more progeny phages there will be produced (Grundling et al, 2001).
Holins are subject to opposing evolutionary forces. On the one hand, there is pressure to extend
the vegative cycle to allow continued accumulation of virions at a linear rate. On the other hand,
there is pressure to trigger lysis earlier to release progeny phage particles that can infect new hosts
and potentially yield exponential increases in phage numbers (Wang et al, 2000; Young et al, 2000).
There are at least three different membrane topologies adopted by holins. Two major classes are
class I holins and class II holins (Figure 10). Class I holins have three transmembrane domains, with N-
terminus outwards and the C-terminus inwards, whereas class II holins have two transmembrane
domains with the N-terminus and C-terminus inwards. Both class I and II holins are largely
hydrophobic, with the helical transmembranes defining two-thirds of the primary structures (Young,
2002).
Many of the genes for class I and class II holins encode two proteins. For example, the coding
sequence of the λ S gene (derived from phage λ, infecting E. coli) begins with codons specifying the
Met-Lys-Met sequence. Both methionine codons are used for translation initiation, giving rise to two
proteins, S107 and S105, named for their length in amino acid residues (Blasi et al, 1990; Blasi et al,
1989; Raab et al, 1988). These two different proteins differ only at their N-termini, where S107 has a
Met-Lys extension with respect to S105. This small difference has a profound effect on the function
of the two proteins; S105 is the holin for phage λ, whereas S107 inhibits membrane disruption by
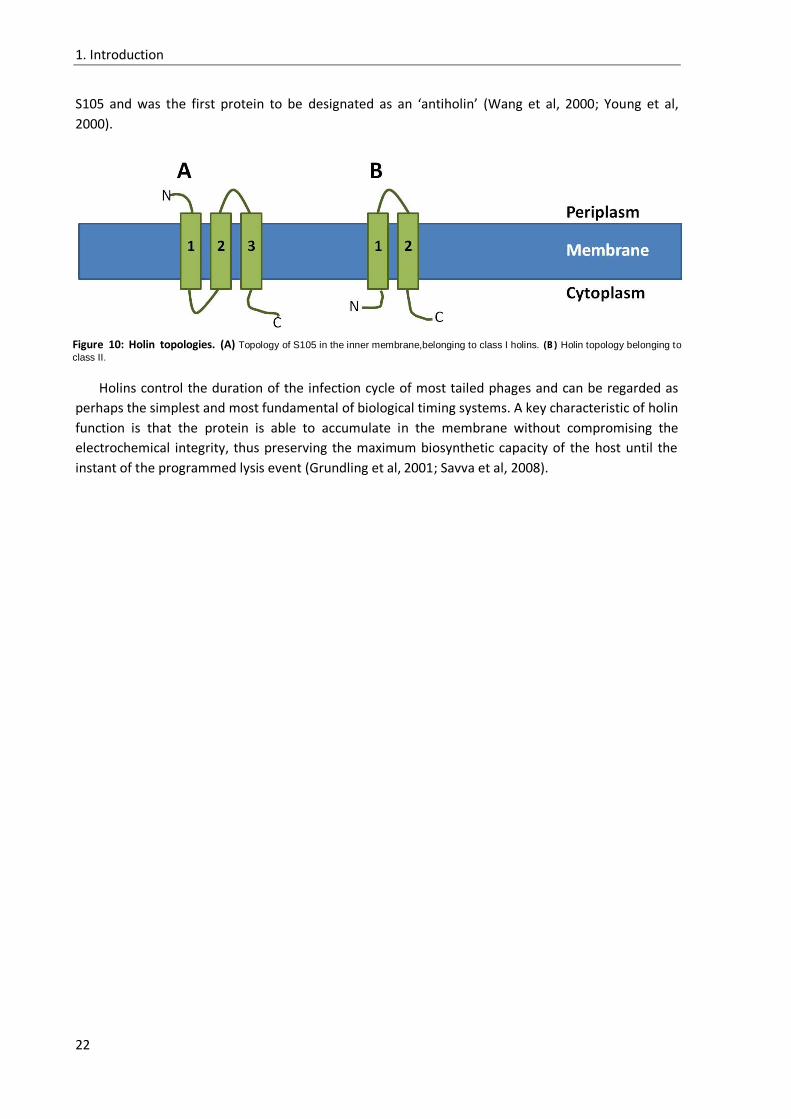
1. Introduction
22
S105 and was the first protein to be designated as an ‘antiholin’ (Wang et al, 2000; Young et al,
2000).
Holins control the duration of the infection cycle of most tailed phages and can be regarded as
perhaps the simplest and most fundamental of biological timing systems. A key characteristic of holin
function is that the protein is able to accumulate in the membrane without compromising the
electrochemical integrity, thus preserving the maximum biosynthetic capacity of the host until the
instant of the programmed lysis event (Grundling et al, 2001; Savva et al, 2008).
Figure 10: Holin topologies. (A) Topology of S105 in the inner membrane,belonging to class I holins. (B) Holin topology belonging to
class II.

23
2. Aims
As discussed in the introduction, the antibiotic resistance of many bacterial strains is an
increasing problem (Andersson & Hughes, 2010; Levy & Marshall, 2004). The cost for the
development of new antibiotics, combined with the limited revenue, makes it almost impossible to
market a new antibiotic (Livermore, 2005; Projan, 2003). Therefore, it may be advisable to search in
new directions for antibacterial therapies, i.e. that of bacteriophages and endolysins. Endolysins have
the capability to degrade the peptidoglycan layer, as a result of the intracellular osmotic pressure the
cytoplasmic membrane is pushed to the outside. This eventually leads to a hypotonic lysis of the
bacterial cell (Fenton et al, 2010; Fischetti, 2003). In this master thesis, we will enquire whether it is
possible to target the antibiotic resistant bacteria MRSA with purified endolysins, derived from a
bacteriophage that naturally infects S. aureus, i.e. phage ISP or whether the same endolysins could
be used to kill other bacteria as well. The proteins that will be studied are endolysins or endolysin-
like proteins. For this, we will try to clone and purify phage ISP endolysins. If we are able to express
these recombinant proteins, it will be investigated whether these endolysins work synergistically
with other antibiotics or the phage itself. Different physiological conditions (i.e. temperature and pH)
of the endolysins will be investigated, if possible.
Next, certain phages may have the ability to induce anti-inflammatory cytokines, such as IL-10
(Gorski et al, 2012b). At present, the ability of phages to modulate the immune system is still
unexplored, although their putative immunomodulatory abilities might not only support the
application of phage-based antibacterial therapy, but it might also lead to new (more natural) anti-
inflammatory products, possibly with less side effects. In order to do this we will try to develop an
assay to evaluate the pro- and anti-inflammatoire responses of peripheral blood mononuclear cells
(PBMCs), within one assay. For this purpose Staphylococcal Enterotoxin B (SEB) will be used to bring
the PBMCs in an anti-inflammatoire immune state. A later stimulation with different antigens could
possibly lead to a possible reduction of TNF-α or increase in IL-10. This immune response will be
analyzed by RT-qPCR of IL-10 (anti-inflammatoire) and TNF-α (pro-inflammatoire), this type of assay
is currently not available or described in literature. If we are able to develop this assay we will try to
examine the immunomodulatory properties of different bacteriophages (i.e. E. coli phage S3, S.
aureus phage ISP and P. aeruginosa phages PNM and 14/1 ) and purified phage ISP proteins (i.e.
endolysins and holin) on PBMCs.

24
25
3. Results and discussion
During this master thesis, we were interested in 2 aspects of bacteriophages, i.e. their
bacteriolytic activity (and the responsible proteins) and their possible immunomodulatory properties,
as had been hypothesized by the group of Andrej Gorski (Gorski et al, 2012a; Gorski et al, 2003;
McVay et al, 2007b). During this master thesis, two genes were cloned in a pET15b vector and two
were commercially cloned, also in a pET15b vector. These commercially cloned vectors were codon
optimized to lead to possible better translation in E. coli. To analyse the potential immunological
effect of the bacteriophage (proteins), an immunological assay was developed. This assay builds
upon a pro-inflammatory stimulation of peripheral blood mononuclear cells (PBMCs) with
Staphylococcus enterotoxin B (SEB). This assay will enable us to evaluate the immunological response
of four different phages: Escherichia coli phage 3S, S. aureus phage ISP (Myoviridae) and
Pseudomonas aeruginosa phage 14/1 (Myoviridae) and PNM (Podoviridae). These last three phages
were chosen because they are the major ingredients of the phage cocktail used in a previous clinical
study by Maya Merabishvili (Merabishvili et al, 2009).
3.1. BLAST analysis of phage ISP genome
Vandersteegen et al. (2011) performed a complete microbiological and genetic assessment of
phage ISP. This lead to the prediction of 215 open reading frames (ORFs). To identify possible
bacteriolytic proteins (i.e. endolysins and holins), a protein-protein BLAST (pBLAST) of all 215 ORFs
was performed against the non-redundant protein sequences databank. Two putative endolysins, i.e.
ORF 201 and ORF 203, homologous to the lysine LysK of Staphylococcus phage 676Z (E-value = 5e-152
and 0.0, respectively) and one holin, i.e. ORF 204, homologous to the putative holin of
Staphylococcus phage K (E-value = 5e-116) were identified. Finally, ORF 197 was identified as a
homologue of the immunodominant antigen A of Staphylococcus phage JD007 (E-value = 2e-121).
Although ORF 197 has no similarity with known lysins or holins, it might posses an
immunomodulating property which will be tested in the immunological assay.
These four genes were further analysed, using InterProScan (i.e. a software package that allows
users to search their sequences against the InterPro database's predictive protein signatures). We
were able to determine that ORF 201 contains an N-terminal N-acetylmuramoyl-L-alanine amidase
activity and a C-terminal SH3 domain. The SH3 (i.e. Src homology region 3) domain is a protein
interacting module. It binds with moderate affinity and selectivity to proline-rich ligands. These
domains play a critical role in a wide variety of biological processes ranging from regulation of
enzymes by intramolecular interactions increasing the local concentration or altering the subcellular
localization of components of signalling pathways (Mayer, 2001). The InterProScan analysis of ORF
203 determined that this protein contains a C-terminal N-acetylmuramoyl-L-alanine amidase activity
and an N-terminal cysteine, histidine-dependent aminohydrolase/peptidase (CHAP) domain. The
analysis of ORF 204 showed the presence of two transmenbrane domains and a holin 1 domain.
There were no domains identified for ORF 197.
3.2. Cloning of four ISP ORFs
Four genes were selected from the phage ISP genome as described in 3.1. Two genes (ORF 197
and ORF 203) were commercially cloned in the pET15b by GenScript (Piscataway, NJ) and were codon
optimised for protein expression in E. coli. The other two genes (ORF 201 and ORF 204) were cloned
in a pET15b vector. This vector contains a T7-RNA polymerase promoter and an N-terminal 6xHis-tag
followed by a thrombin site and various cloning sites. The T7-RNA promoter is followed by a lac

3. Results and discussion
26
operator, which is recognized and by a lac repressor under high-glucose conditions to block
transcription of the lactose catabolism operon. When Isopropyl β-D-1-thiogalactopyranoside (IPTG) is
added, this binds to the lac repressor and changes its conformation such that the affinity for the
operator site is lost enabiling the T7-RNA polymerase to initiate the transcription.
3.2.1. Polymerase chain reaction (PCR)
The two genes chosen for cloning were ORF 201 and ORF 204 (an endolysin and holin,
respectively). For these two genes, forward and reverse primers (see 5.2 Table 6) were constructed
containing a NcoI or NdeI site, respectively, in the forward primer and a BamHI site in the reverse
primer. These restriction sites are important for the later restriction-ligation reaction, whereby the
pET15B vector contains the same restriction sites. This leads to the cloning of the ORFs in the right
direction. For the PCR, two template DNAs (containing genomic DNA of phage ISP) were used,
designated Sb1 and ISP. These template DNAs were diluted tenfold. For the PCR amplification of ORF
201, which was carried out later than that of ORF 204, only one type of template (i.e. ISP) was used,
because both templates provided a good amplification for ORF 204. After PCR amplification, 6 µl of
sample was added to 1.5 µl of loading dye and loaded on a 1 % agarose gel to verify the efficiency of
the PCR reaction (Figure 11). The genomic DNA of phage ISP was provided by Maya Merabishvili.
After PCR amplification, the PCR products were purified using a QiaQuick PCR purification kit
(Qiagen, Valencia, CA). The nucleic acid concentrations, as determined by Nanodrop, were 48 ng/µl
and 49 ng/µl for the ORF 201 and ORF 204 – ISP 1/10 dilutions respectively.
3.2.2. Topo TA cloning
TOPO TA cloning was performed because it was impossible to directly perfom a restriction digest
on the PCR fragments followed by subsequent ligation in the pET15b vector. This is because the
restriction enzymes are not able to bind to the ends of the PCR fragments directly.
Figure 11: Agarose gel electrophoresis (1 %) of PCR amplified ORF 201 (630 bp) (A) and ORF 204 (504 bp) (B). For ORF 204, two different template DNAs were used (i.e. ISP and Sb1). In panel A, primer dimers are visible.
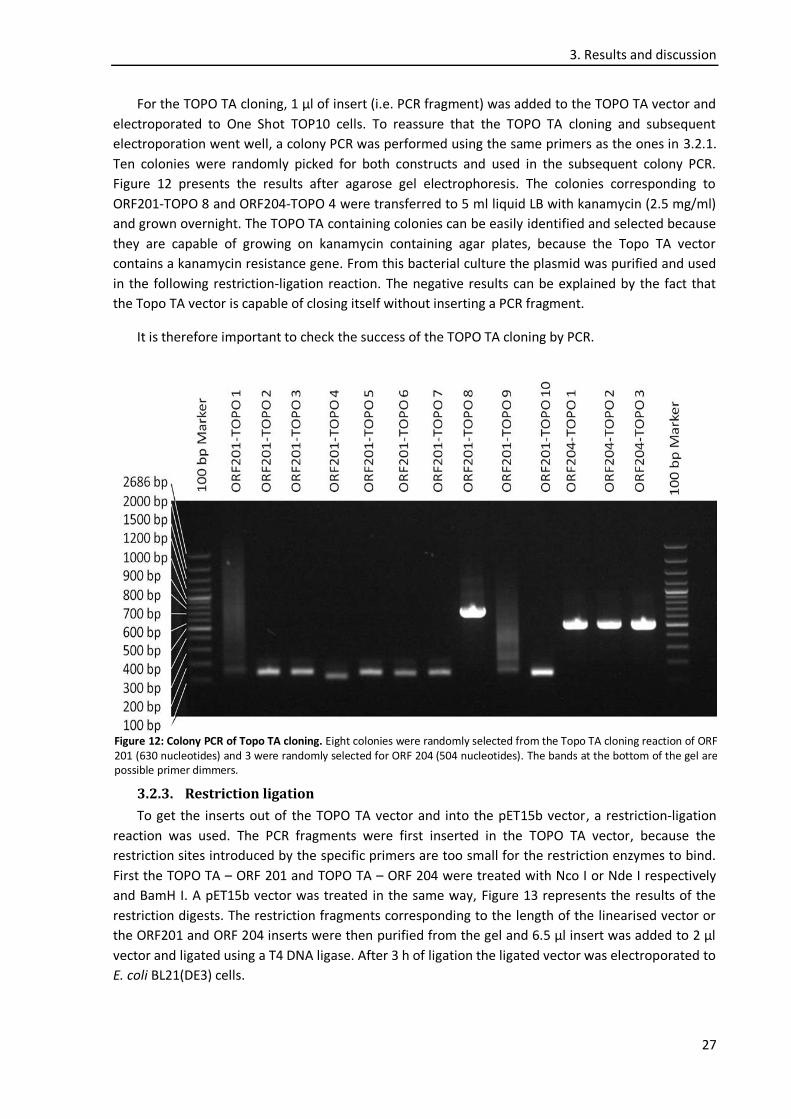
3. Results and discussion
27
For the TOPO TA cloning, 1 µl of insert (i.e. PCR fragment) was added to the TOPO TA vector and
electroporated to One Shot TOP10 cells. To reassure that the TOPO TA cloning and subsequent
electroporation went well, a colony PCR was performed using the same primers as the ones in 3.2.1.
Ten colonies were randomly picked for both constructs and used in the subsequent colony PCR.
Figure 12 presents the results after agarose gel electrophoresis. The colonies corresponding to
ORF201-TOPO 8 and ORF204-TOPO 4 were transferred to 5 ml liquid LB with kanamycin (2.5 mg/ml)
and grown overnight. The TOPO TA containing colonies can be easily identified and selected because
they are capable of growing on kanamycin containing agar plates, because the Topo TA vector
contains a kanamycin resistance gene. From this bacterial culture the plasmid was purified and used
in the following restriction-ligation reaction. The negative results can be explained by the fact that
the Topo TA vector is capable of closing itself without inserting a PCR fragment.
It is therefore important to check the success of the TOPO TA cloning by PCR.
3.2.3. Restriction ligation
To get the inserts out of the TOPO TA vector and into the pET15b vector, a restriction-ligation
reaction was used. The PCR fragments were first inserted in the TOPO TA vector, because the
restriction sites introduced by the specific primers are too small for the restriction enzymes to bind.
First the TOPO TA – ORF 201 and TOPO TA – ORF 204 were treated with Nco I or Nde I respectively
and BamH I. A pET15b vector was treated in the same way, Figure 13 represents the results of the
restriction digests. The restriction fragments corresponding to the length of the linearised vector or
the ORF201 and ORF 204 inserts were then purified from the gel and 6.5 µl insert was added to 2 µl
vector and ligated using a T4 DNA ligase. After 3 h of ligation the ligated vector was electroporated to
E. coli BL21(DE3) cells.
Figure 12: Colony PCR of Topo TA cloning. Eight colonies were randomly selected from the Topo TA cloning reaction of ORF 201 (630 nucleotides) and 3 were randomly selected for ORF 204 (504 nucleotides). The bands at the bottom of the gel are possible primer dimmers.

3. Results and discussion
28
To check for the success of the ligation and electroporation, a colony PCR was performed on 10
randomly selected electroporated E. coli BL21 (DE3) cells. Four colonies were positive for ORF 201
and one colony for ORF 204 (Figure 14). Only one positive colony was used for plasmid purification
(see 5.3.2).
3.3. Sequencing of pET15b-ORF201 and pET15b-ORF204
To ensure that there are no mutations or frame shifts in the two homemade constructs (i.e.
pET15b-ORF201 and pET15b-ORF204), the two constructs were sequenced using the Sanger
sequencing principle or cycle sequencing. The first step of the cycle sequencing (5.4.1) consist of a
PCR amplification of the two genes, and for this purpose two different primers were used as
compared to the construction of the expression vectors, namely the T7 promoter primer (forward)
and T7 terminator primer (reverse). These two primers enable the amplification of the recombinant
Figure 13: Agarose gel (1%) electrophoresis of restriction digests. The pET15b vector was digested with BamHI and NcoI or NdeI, respectively. The ORF201-TOPO vector was digested with BamH I and Nco I and the ORF204-TOPO vector was digested with BamH I and Nde I. The bands corresponding to the expected size of the vector or the ORF 201 and ORF 204 insert were cut out of the gel and purified.
Figure 14: Agarose gel (1%) electrophoresis of colony PCR of the ligation reaction. Ten colonies were randomly selected.
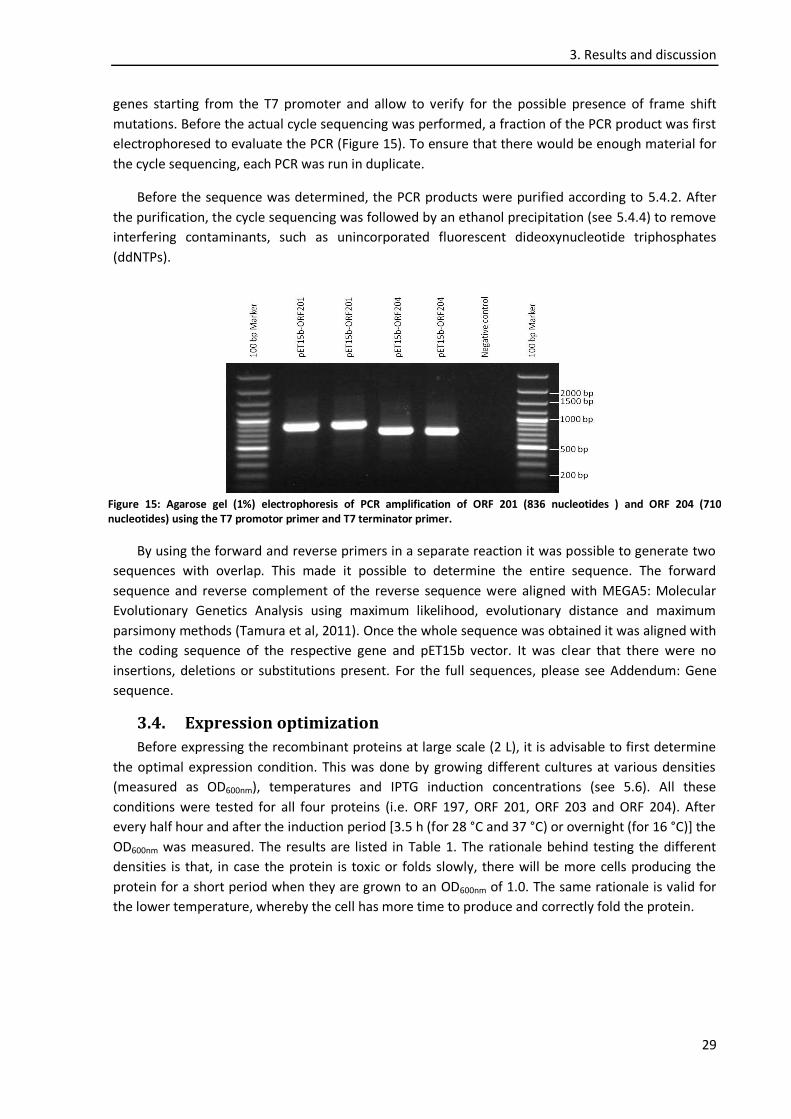
3. Results and discussion
29
genes starting from the T7 promoter and allow to verify for the possible presence of frame shift
mutations. Before the actual cycle sequencing was performed, a fraction of the PCR product was first
electrophoresed to evaluate the PCR (Figure 15). To ensure that there would be enough material for
the cycle sequencing, each PCR was run in duplicate.
Before the sequence was determined, the PCR products were purified according to 5.4.2. After
the purification, the cycle sequencing was followed by an ethanol precipitation (see 5.4.4) to remove
interfering contaminants, such as unincorporated fluorescent dideoxynucleotide triphosphates
(ddNTPs).
By using the forward and reverse primers in a separate reaction it was possible to generate two
sequences with overlap. This made it possible to determine the entire sequence. The forward
sequence and reverse complement of the reverse sequence were aligned with MEGA5: Molecular
Evolutionary Genetics Analysis using maximum likelihood, evolutionary distance and maximum
parsimony methods (Tamura et al, 2011). Once the whole sequence was obtained it was aligned with
the coding sequence of the respective gene and pET15b vector. It was clear that there were no
insertions, deletions or substitutions present. For the full sequences, please see Addendum: Gene
sequence.
3.4. Expression optimization
Before expressing the recombinant proteins at large scale (2 L), it is advisable to first determine
the optimal expression condition. This was done by growing different cultures at various densities
(measured as OD600nm), temperatures and IPTG induction concentrations (see 5.6). All these
conditions were tested for all four proteins (i.e. ORF 197, ORF 201, ORF 203 and ORF 204). After
every half hour and after the induction period [3.5 h (for 28 °C and 37 °C) or overnight (for 16 °C)] the
OD600nm was measured. The results are listed in Table 1. The rationale behind testing the different
densities is that, in case the protein is toxic or folds slowly, there will be more cells producing the
protein for a short period when they are grown to an OD600nm of 1.0. The same rationale is valid for
the lower temperature, whereby the cell has more time to produce and correctly fold the protein.
Figure 15: Agarose gel (1%) electrophoresis of PCR amplification of ORF 201 (836 nucleotides ) and ORF 204 (710 nucleotides) using the T7 promotor primer and T7 terminator primer.

3. Results and discussion
30
Before IPTG induction and after induction (3.5 h or overnight, respectively), 1 ml of culture was
taken and centrifuged, from which the pelleted cells were loaded on a 15 % SDS-PAGE. This made it
possible to identify the optimal condition for protein expression. In Figure 16, only the gels that gave
a positive result are represented (indicated with an asterisk). From all the tested conditions, 28 °C
was the optimal temperature for ORF 197 (24.8 kDa) and ORF 201 (23 kDa), and both gave an
expression with 1.0 mM IPTG at an OD600nm of 0.6 or 1.0. For ORF 203 (29.7 kDa) and ORF 204 (18
kDa), the optimal temperature was 37 °C. For ORF 203, recombinant protein expression occurred at
an OD600nm of 0.6 and 1.0 and an IPTG concentration of 0.1 and 1.0. The last protein, ORF 204, gave
protein expression at 0.1 mM IPTG. It is also clear from Table 1 that ORF 204 (i.e. the holin, a
transmembrane protein) is toxic for the cell, because there is a clear drop in growth. These
expression conditions were subsequently used in the following large scale protein expression and
protein purification. However, at these small volumes, only ORF 201 gave strong expression (Figure
16B). The other proteins did not express well. ORF 197 migrated slower than expected for a 24.8 kDa
protein (Figure 16A, lanes 2, 4, 6 and 8), which might be explained if the protein does not fold
globular or forms disulfide bridges. All positive conditions were confirmed by western blot, using
anti-His-HRP antibodies (Figures not shown).

3. Results and discussion
31
Figure 16: SDS PAGE (15%) electrophoresis of proteins after different recombinant protein expression conditions from 50 ml cultures. (A) The recombinant protein ORF 197 (24.8 kDa) gave the best expression result at 28 °C and 0.1 or 1.0 mM IPTG at an OD600nm of 0.6 and 1.0. (B) For ORF 201 (23 kDa), the optimal expression condition was 28 °C, 1 mM IPTG and an OD600nm of 0.6 and 1.0. (C) The optimal expression condition for ORF 203 (29.7 kDa) was 37 °C, 0.1 or 1.0 mM IPTG and an OD600nm of 0.6 and 1.0. (D) ORF 204 (18.1 kDa) only gave expression at 37 °C with 0.1 mM IPTG at an OD600nm of 0.1. All overexpression bands are indicaded with an asterisk at their right hand side. On both sides of the gels, a 10 – 250 kDa protein marker (BioRad, Nazareth, Belgium) was loaded. Following conditions were used in the large scale expression, ORF 197: 28 °C, 1 mM IPTG and OD600nm of 1.0; ORF 201: 28 °C, 1 mM IPTG and an OD600nm of 1.0; ORF 203: 37 °C, 1 mM IPTG and an OD600nm of 1.0; ORF 204: 37 °C, 0.1 mM IPTG and an OD600nm of 0.6.
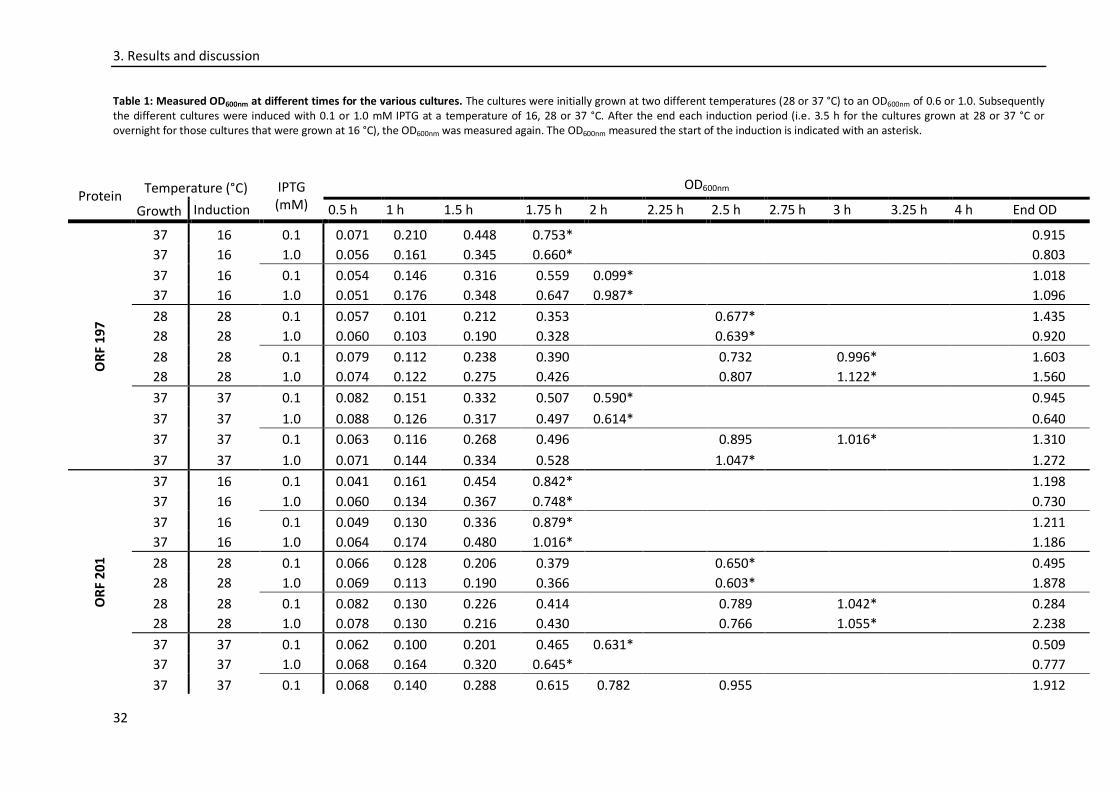
3. Results and discussion
32
Table 1: Measured OD600nm at different times for the various cultures. The cultures were initially grown at two different temperatures (28 or 37 °C) to an OD600nm of 0.6 or 1.0. Subsequently the different cultures were induced with 0.1 or 1.0 mM IPTG at a temperature of 16, 28 or 37 °C. After the end each induction period (i.e. 3.5 h for the cultures grown at 28 or 37 °C or overnight for those cultures that were grown at 16 °C), the OD600nm was measured again. The OD600nm measured the start of the induction is indicated with an asterisk.
Protein Temperature (°C) IPTG
(mM)
OD600nm
Growth Induction 0.5 h 1 h 1.5 h 1.75 h 2 h 2.25 h 2.5 h 2.75 h 3 h 3.25 h 4 h End OD
OR
F 1
97
37 16 0.1 0.071 0.210 0.448 0.753*
0.915
37 16 1.0 0.056 0.161 0.345 0.660*
0.803
37 16 0.1 0.054 0.146 0.316 0.559 0.099*
1.018
37 16 1.0 0.051 0.176 0.348 0.647 0.987*
1.096
28 28 0.1 0.057 0.101 0.212 0.353
0.677*
1.435
28 28 1.0 0.060 0.103 0.190 0.328
0.639*
0.920
28 28 0.1 0.079 0.112 0.238 0.390
0.732
0.996*
1.603
28 28 1.0 0.074 0.122 0.275 0.426
0.807
1.122*
1.560
37 37 0.1 0.082 0.151 0.332 0.507 0.590*
0.945
37 37 1.0 0.088 0.126 0.317 0.497 0.614*
0.640
37 37 0.1 0.063 0.116 0.268 0.496
0.895
1.016*
1.310
37 37 1.0 0.071 0.144 0.334 0.528
1.047*
1.272
OR
F 20
1
37 16 0.1 0.041 0.161 0.454 0.842*
1.198
37 16 1.0 0.060 0.134 0.367 0.748*
0.730
37 16 0.1 0.049 0.130 0.336 0.879*
1.211
37 16 1.0 0.064 0.174 0.480 1.016*
1.186
28 28 0.1 0.066 0.128 0.206 0.379
0.650*
0.495
28 28 1.0 0.069 0.113 0.190 0.366
0.603*
1.878
28 28 0.1 0.082 0.130 0.226 0.414
0.789
1.042*
0.284
28 28 1.0 0.078 0.130 0.216 0.430
0.766
1.055*
2.238
37 37 0.1 0.062 0.100 0.201 0.465 0.631*
0.509
37 37 1.0 0.068 0.164 0.320 0.645*
0.777
37 37 0.1 0.068 0.140 0.288 0.615 0.782
0.955
1.912
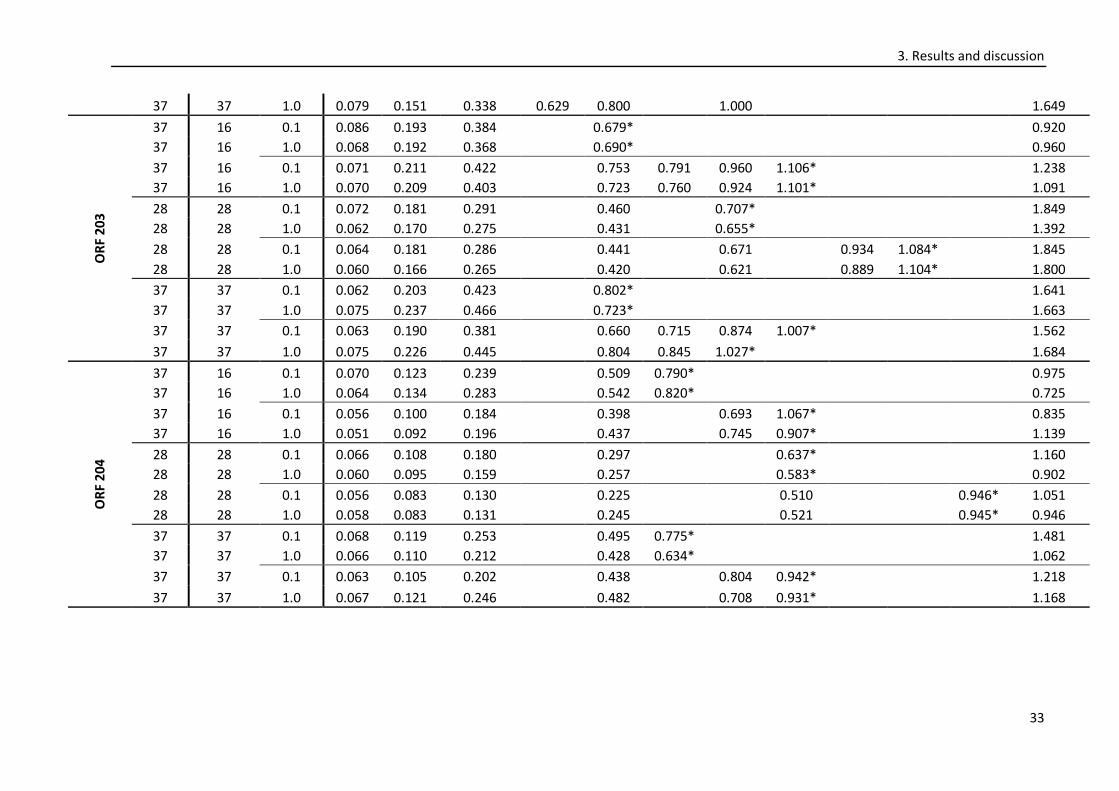
3. Results and discussion
33
37 37 1.0 0.079 0.151 0.338 0.629 0.800
1.000
1.649 O
RF
20
3
37 16 0.1 0.086 0.193 0.384
0.679*
0.920
37 16 1.0 0.068 0.192 0.368
0.690*
0.960
37 16 0.1 0.071 0.211 0.422
0.753 0.791 0.960 1.106*
1.238
37 16 1.0 0.070 0.209 0.403
0.723 0.760 0.924 1.101*
1.091
28 28 0.1 0.072 0.181 0.291
0.460
0.707*
1.849
28 28 1.0 0.062 0.170 0.275
0.431
0.655*
1.392
28 28 0.1 0.064 0.181 0.286
0.441
0.671
0.934 1.084*
1.845
28 28 1.0 0.060 0.166 0.265
0.420
0.621
0.889 1.104*
1.800
37 37 0.1 0.062 0.203 0.423
0.802*
1.641
37 37 1.0 0.075 0.237 0.466
0.723*
1.663
37 37 0.1 0.063 0.190 0.381
0.660 0.715 0.874 1.007*
1.562
37 37 1.0 0.075 0.226 0.445
0.804 0.845 1.027*
1.684
OR
F 20
4
37 16 0.1 0.070 0.123 0.239
0.509 0.790*
0.975
37 16 1.0 0.064 0.134 0.283
0.542 0.820*
0.725
37 16 0.1 0.056 0.100 0.184
0.398
0.693 1.067*
0.835
37 16 1.0 0.051 0.092 0.196
0.437
0.745 0.907*
1.139
28 28 0.1 0.066 0.108 0.180
0.297
0.637*
1.160
28 28 1.0 0.060 0.095 0.159
0.257
0.583*
0.902
28 28 0.1 0.056 0.083 0.130
0.225
0.510
0.946* 1.051
28 28 1.0 0.058 0.083 0.131
0.245
0.521
0.945* 0.946
37 37 0.1 0.068 0.119 0.253
0.495 0.775*
1.481
37 37 1.0 0.066 0.110 0.212
0.428 0.634*
1.062
37 37 0.1 0.063 0.105 0.202
0.438
0.804 0.942*
1.218
37 37 1.0 0.067 0.121 0.246
0.482
0.708 0.931*
1.168
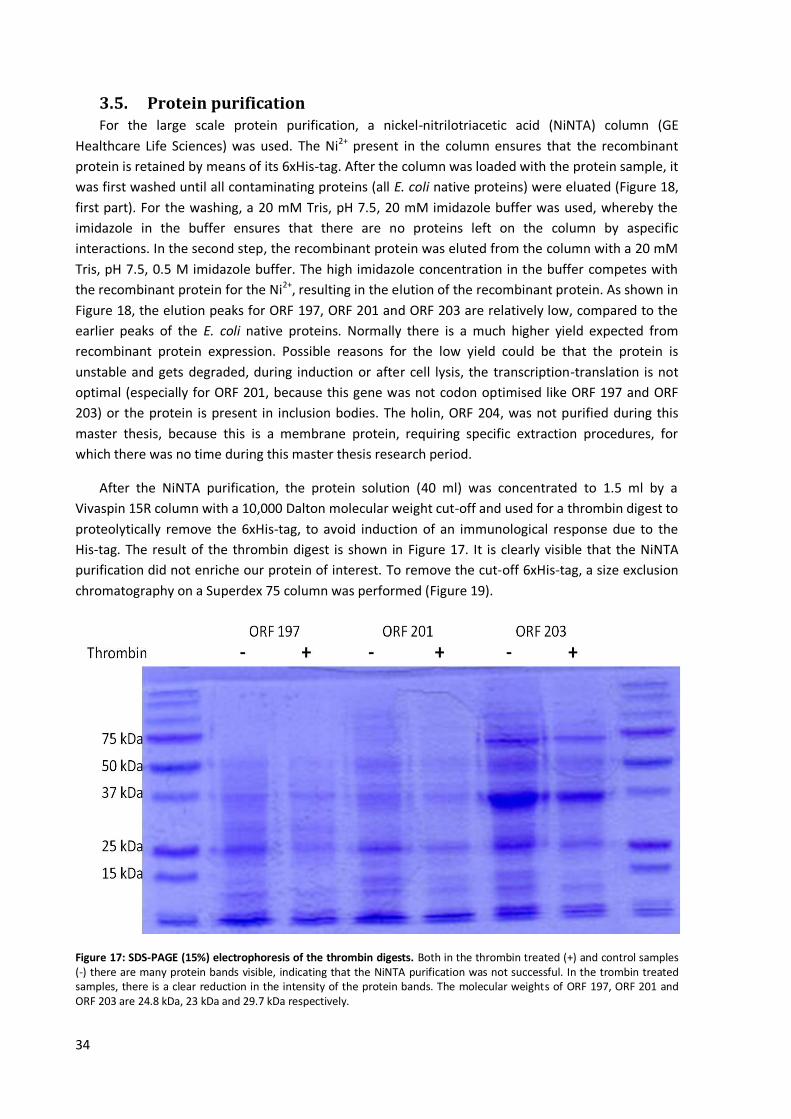
34
3.5. Protein purification For the large scale protein purification, a nickel-nitrilotriacetic acid (NiNTA) column (GE
Healthcare Life Sciences) was used. The Ni2+ present in the column ensures that the recombinant
protein is retained by means of its 6xHis-tag. After the column was loaded with the protein sample, it
was first washed until all contaminating proteins (all E. coli native proteins) were eluated (Figure 18,
first part). For the washing, a 20 mM Tris, pH 7.5, 20 mM imidazole buffer was used, whereby the
imidazole in the buffer ensures that there are no proteins left on the column by aspecific
interactions. In the second step, the recombinant protein was eluted from the column with a 20 mM
Tris, pH 7.5, 0.5 M imidazole buffer. The high imidazole concentration in the buffer competes with
the recombinant protein for the Ni2+, resulting in the elution of the recombinant protein. As shown in
Figure 18, the elution peaks for ORF 197, ORF 201 and ORF 203 are relatively low, compared to the
earlier peaks of the E. coli native proteins. Normally there is a much higher yield expected from
recombinant protein expression. Possible reasons for the low yield could be that the protein is
unstable and gets degraded, during induction or after cell lysis, the transcription-translation is not
optimal (especially for ORF 201, because this gene was not codon optimised like ORF 197 and ORF
203) or the protein is present in inclusion bodies. The holin, ORF 204, was not purified during this
master thesis, because this is a membrane protein, requiring specific extraction procedures, for
which there was no time during this master thesis research period.
After the NiNTA purification, the protein solution (40 ml) was concentrated to 1.5 ml by a
Vivaspin 15R column with a 10,000 Dalton molecular weight cut-off and used for a thrombin digest to
proteolytically remove the 6xHis-tag, to avoid induction of an immunological response due to the
His-tag. The result of the thrombin digest is shown in Figure 17. It is clearly visible that the NiNTA
purification did not enriche our protein of interest. To remove the cut-off 6xHis-tag, a size exclusion
chromatography on a Superdex 75 column was performed (Figure 19).
Figure 17: SDS-PAGE (15%) electrophoresis of the thrombin digests. Both in the thrombin treated (+) and control samples (-) there are many protein bands visible, indicating that the NiNTA purification was not successful. In the trombin treated samples, there is a clear reduction in the intensity of the protein bands. The molecular weights of ORF 197, ORF 201 and ORF 203 are 24.8 kDa, 23 kDa and 29.7 kDa respectively.

3. Results and discussion
35
Figure 18: NiNTA purification of ORF 197, ORF 201 and ORF 203. The first part of the graph shows the proteins that are not retained on the column, the second part of the graph represents the proteins that are retained on the column (i.e. the recombinant protein). It is visible that the second peak, corresponding to the recombinant protein, is much lower compared to the first peak, corresponding to E. coli native proteins. Possible reasons for the low yield could be that the protein is unstable and gets degraded, during induction or after cell lysis, the transcription-translation is not optimal or the protein is present in inclusion bodies. * represents the point of injection, ** represents the start of the wash with 20 mM tris, pH 7.5, 20 mM imidazole. *** indicates the start of the elution, with 20 mM tris, pH 7.5, 0.5 M imidazole.

3. Results and discussion
36
Figure 19: Size exclusion chromatography of all three ORFs (i.e. ORF 197, ORF 201 and ORF203). Protein ORF 197 does not elute as a single peak, indicating that the protein may have been degrading during storage at 4 °C or this could be background noise due to the absence of the recombinant protein. Protein ORF 201 and ORF 203 elute as a single peak. The elution peaks are relatively low. All three samples were injected at volume 0.
3. Results and discussion
37
With size exclusion chromatography the larger proteins are eluted first followed by the smaller
ones. It is clearly visible in Figure 19 that the proteins ORF 201 and ORF 203 elute as one peak, in
contrast to the protein ORF 197 which does not elute as one peak. The latter could be explained as
background noise due to the absence of the recombinant protein. This might also indicate protein
degradation after purification or during the thrombin digest. All three protein purifications show a
low yield. The protein concentrations of the peaks was determined by NanoDrop (Thermo Scientific)
and shown in Table 2.
Table 2: Protein concentration after size exclusion chromatography
Protein Concentration (mg/ml)
ORF 197 0.050
ORF 201 0.047
ORF 203 0.010
Because the protein yields after size exclusion chromatography are relatively low, the whole
protein purification protocol was verified. This was done by loading all effluent (from NiNTA,
Desalting, concentrating and size exclusion chromatography) on SDS-PAGE. No protein bands were
visible in all samples except the NiNTA effluent (Figure not shown). This leads to the conclusion that
the recombinant protein was not present in the protein samples and that the expression conditions
need to be further optimized. Unfortunately we were not able to further optimize the expression
conditions during this master thesis. Possible alternative routes are discussed in 4.1.
3.6. Phage titre determination
For the immunological tests, different phages will be used, i.e. E. coli K12 phage 3S, S.aureus
phage ISP, P. aeruginosa phage 14/1 and P. aeruginosa phage PNM. These last three phages
formed the BFC-1 phage cocktail used by Merabishvili et al. in a clinical study in 2009. The titre
was determined as described in 5.12, The results are shown in Table 3. All five different phages gave
a different plaque morphology. S.aureus phage ISP and E. coli K12 phage 3S gave small plaques, P.
aeruginosa phage 14/1 also gave small plaques but with a halo. Pseudomonas aeruginosa phage
PNM gave the largest plaques (> 5 mm diameter) with a halo.
For the preparation of a phage ISP stock, three phage preparations were used: ISP-
APS_centrifuged_LPS-free, ISP-APS_centrifuged and ISP-APS, all three phage preparations were
prepared using animal free media. From these three preparations, the titre was determined as
described in 5.12. A new phage stock was prepared from the ISP-APS_centrifuged preparation,
because it gave the highest titre. To prepare the stock (see 5.10 and 5.11), the phage solution was
diluted to 1/105, to obtain webbing (Figure 20). Webbing occurs when a phage solution is diluted to
the extent that it gives maximal lysis of the bacterial host culture, whereby individual plaques still can
be observed. To prepare a phage stock with a high titre (i.e. high amount of plaque forming units),
ten plates with bacterial webbing were used. Once the phage stock was prepared, the titre was
determined again, according to 5.12. The result is shown in Table 3. This phage stock was not used
for the subsequent endotoxin removal

3. Results and discussion
38
For immunological purposes, endotoxins were removed from the different phage preparations
by using the Hyglos EndoTrap blue kit (see 5.13). After this purification the titre was determined
again, according to 5.12, to determine the effect of the endotoxin removal on the phage titre. Results
are shown in Table 3. Because there was only 1 ml of the E. coli K12 phage 3S preparation this was
diluted tenfold, which explains the reduction in titre of the E. coli K12 phage 3S preparation after
endotoxin removal compared to the titre before endotoxin removal (indicated by an asterisk in Table
3). It is clearly visible from Table 3 and Table 3 that the endotoxin removal does not have an
influence on the phage titre.
Table 3: Phage titre of 5 different phage preparations before and after endotoxin removal. The asterisk represents a tenfolded dilution.
Phage preparation Titre (1010 pfu/ml)
Before endotoxin removal After endotoxin removal
S.aureus phage ISP 3 3
E. coli K12 phage 3S 10 1*
P. aeruginosa phage 14/1 10 10
P. aeruginosa phage PNM 15 15
S.aureus phage ISP Stock 20 /
3.7. Immunological assay
Peripheral Blood Mononuclear Cells (PBMCs) were isolated from 50 ml buffycoat (Rode Kruis
Vlaanderen) as described in 5.14. This led to the isolation of 1.1x10⁹ cells as determined by Sysmex
KX-12. These were stored at -80 °C in heat inactivated fetal calf serum with 10 % dimethylsulfoxide
(DMSO) at a concentration of 5x10⁷ cells/ml. Dimethylsulfoxide is a cryoprotectant that, when added
to the cell media, reduces the formation of ice crystals, thereby preventing cell death during the
freezing process. Approximately 10% may be used with a slow-freeze method, the cells were frozen
at −80 °C or stored in liquid nitrogen.
Figure 20: Picture of bacterial webbing of P. aeruginosa phage PNM. When a phage solution with a titre of log 11 of P. aeruginosa phage PNM was diluted 10-9, this resulted in bacterial webbing. Webbing occurs when a phage solution is diluted to the extent that it gives maximal lysis of the bacterial host culture, whereby individual plaques still can be observed.

3. Results and discussion
39
3.7.1. SEB titration
A Staphylococcal Enterotoxin B (SEB) titration was performed to determine the optimal SEB
concentration and induction time that leads to a reversible TNF-α production (as a measure for the
pro-inflammatory response). This reversible TNF-α production is important for the later
bacteriophage stimulation were we evaluate their immunomodulatory capacities, i.e. the ability to
reduce the pro-inflammatory response.
Before the SEB stimulation, one vial of 5 x 10⁷ cells/ml was thawed in a water bath at 37 °C. The
total cell count after thawing was determined by Sysmex KX-12 (see 5.14.1) after the cells were
resuspended in 5 ml Hank’s Balanced Salt Solution, without calcium and magnesium (HBSS)
(Invitrogen). In total, there were 5 x 10⁷ cells/ml present, i.e. both living and dead cells.
Storing cells at -80 °C will inevitably lead to a small cell loss. For this reason the cell viability was
determined with fluorescence-activated cell sorting (FACS) as described in 5.14.1. To determine the
cell viability, the dead cells were labelled with propidium iodide (PI), which is a fluorescent molecule
that intercalates with dsDNA. This interaction is only possible with dead or permeabilized cells,
because PI cannot cross intact cell membranes. From the 5 x 10⁷ cells/ml, 97.1 % of the cells were
viable. Subsequently the cells were centrifuged at 350g and resuspended in 16.1 ml complete RPMI
1640 (as developed by Moore et al. at Roswell Park Memorial Institute, hence the acronym RPMI).
For the SEB titration 3 x 10⁵ cells/100 µl were needed. The experimental setup is described in
5.14.2.1. After the SEB stimulation, the cells were stored at -20 °C in 1 ml Qiazol (Qiagen). The
relative amount of TNF-α that was produced was determined by RT-qPCR (3.7.1.2).
3.7.1.1. Intracellular cytokine staining
Parallel to SEB titration for RNA extraction, an intracellular cytokine staining (ICS) experiment
was performed using 1, 10 and 100 ng/100 µl SEB (the same concentrations used in the RT-qPCR SEB
titration). This experiment formed an extra control to evaluate the production of different cytokins,
including TNF-α.
The PBMCs were labelled in 2 groups by using two differently labelled antibodies that recognise
CD4 and CD8 respectively. Both are glycoproteins that are found on the cell surface of immune cells,
CD4 is found on T helper cells, monocytes, macrophages, and dendritic cells. The CD8 glycoprotein is
predominantly found on the surface of cytotoxic T cells, but can also be found on natural killer cells
(NK cells), cortical thymocytes and dendritic cells. By using the FACS Canto it was possible to identify
the lymphocytes and to separate them into two populations (Figure 21).
Figure 21: Fluorescence-activated cell sorting (FACS) result of three differently labeled PBMCs, (A) 1 ng/100 µl, (B) 10 ng/100 µl and (C) 100 ng/100 µl. Two different cell populations are present. The CD8 cells are represented in red, the CD4 in blue. APC-Cy7-A refers to the chromophore linked to the CD8 antibody, PerCP-Cy55-A refers the CD4 antibody linked chromophore.
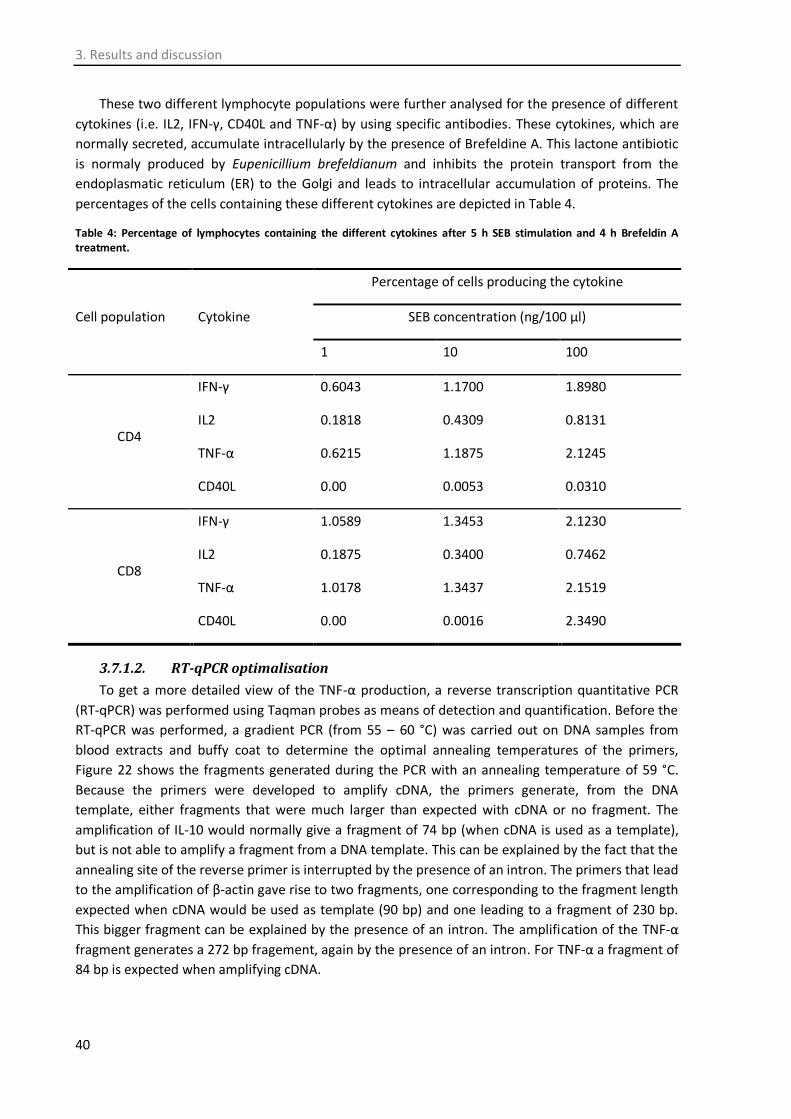
3. Results and discussion
40
These two different lymphocyte populations were further analysed for the presence of different
cytokines (i.e. IL2, IFN-γ, CD40L and TNF-α) by using specific antibodies. These cytokines, which are
normally secreted, accumulate intracellularly by the presence of Brefeldine A. This lactone antibiotic
is normaly produced by Eupenicillium brefeldianum and inhibits the protein transport from the
endoplasmatic reticulum (ER) to the Golgi and leads to intracellular accumulation of proteins. The
percentages of the cells containing these different cytokines are depicted in Table 4.
Table 4: Percentage of lymphocytes containing the different cytokines after 5 h SEB stimulation and 4 h Brefeldin A treatment.
Cell population Cytokine
Percentage of cells producing the cytokine
SEB concentration (ng/100 µl)
1 10 100
CD4
IFN-γ 0.6043 1.1700 1.8980
IL2 0.1818 0.4309 0.8131
TNF-α 0.6215 1.1875 2.1245
CD40L 0.00 0.0053 0.0310
CD8
IFN-γ 1.0589 1.3453 2.1230
IL2 0.1875 0.3400 0.7462
TNF-α 1.0178 1.3437 2.1519
CD40L 0.00 0.0016 2.3490
3.7.1.2. RT-qPCR optimalisation
To get a more detailed view of the TNF-α production, a reverse transcription quantitative PCR
(RT-qPCR) was performed using Taqman probes as means of detection and quantification. Before the
RT-qPCR was performed, a gradient PCR (from 55 – 60 °C) was carried out on DNA samples from
blood extracts and buffy coat to determine the optimal annealing temperatures of the primers,
Figure 22 shows the fragments generated during the PCR with an annealing temperature of 59 °C.
Because the primers were developed to amplify cDNA, the primers generate, from the DNA
template, either fragments that were much larger than expected with cDNA or no fragment. The
amplification of IL-10 would normally give a fragment of 74 bp (when cDNA is used as a template),
but is not able to amplify a fragment from a DNA template. This can be explained by the fact that the
annealing site of the reverse primer is interrupted by the presence of an intron. The primers that lead
to the amplification of β-actin gave rise to two fragments, one corresponding to the fragment length
expected when cDNA would be used as template (90 bp) and one leading to a fragment of 230 bp.
This bigger fragment can be explained by the presence of an intron. The amplification of the TNF-α
fragment generates a 272 bp fragement, again by the presence of an intron. For TNF-α a fragment of
84 bp is expected when amplifying cDNA.
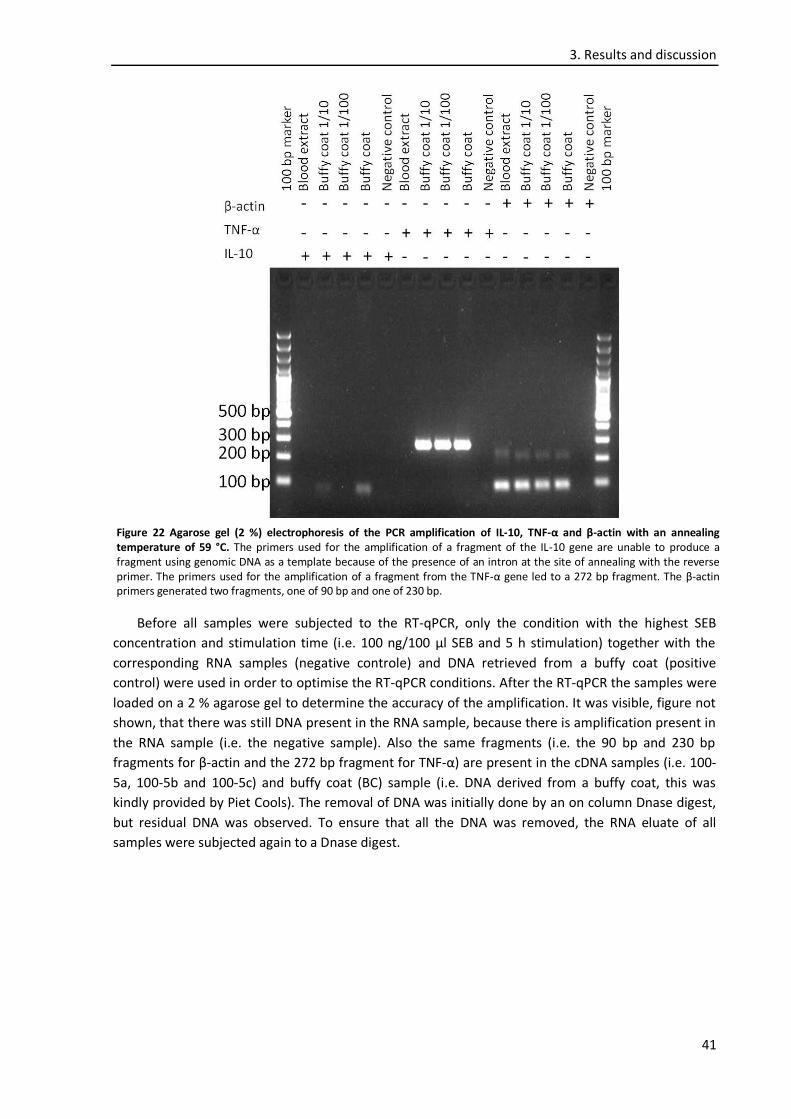
3. Results and discussion
41
Before all samples were subjected to the RT-qPCR, only the condition with the highest SEB
concentration and stimulation time (i.e. 100 ng/100 µl SEB and 5 h stimulation) together with the
corresponding RNA samples (negative controle) and DNA retrieved from a buffy coat (positive
control) were used in order to optimise the RT-qPCR conditions. After the RT-qPCR the samples were
loaded on a 2 % agarose gel to determine the accuracy of the amplification. It was visible, figure not
shown, that there was still DNA present in the RNA sample, because there is amplification present in
the RNA sample (i.e. the negative sample). Also the same fragments (i.e. the 90 bp and 230 bp
fragments for β-actin and the 272 bp fragment for TNF-α) are present in the cDNA samples (i.e. 100-
5a, 100-5b and 100-5c) and buffy coat (BC) sample (i.e. DNA derived from a buffy coat, this was
kindly provided by Piet Cools). The removal of DNA was initially done by an on column Dnase digest,
but residual DNA was observed. To ensure that all the DNA was removed, the RNA eluate of all
samples were subjected again to a Dnase digest.
Figure 22 Agarose gel (2 %) electrophoresis of the PCR amplification of IL-10, TNF-α and β-actin with an annealing temperature of 59 °C. The primers used for the amplification of a fragment of the IL-10 gene are unable to produce a fragment using genomic DNA as a template because of the presence of an intron at the site of annealing with the reverse primer. The primers used for the amplification of a fragment from the TNF-α gene led to a 272 bp fragment. The β-actin primers generated two fragments, one of 90 bp and one of 230 bp.

3. Results and discussion
42
Once the DNA was removed from the samples (by means of a Dnase digest see 5.16), the RNA
was converted to cDNA by reverse transcription and subjected to a new RT-qPCR (see 5.17). The
amplification of the targets was visualized by using Taqman probes. These are hydrolysis probes that
are designed to increase the specificity of the qPCR. For this purpose the cDNA was diluted to
determine the specificity of the RT-qPCR. Figure 23 clearly shows that the higher the dilution, the
lower the fluorescence signal becomes. With each dilution step of 10 the difference in CT-value is
approximately 3.33 cycles. Alternatively, SybrGreen could be used, which interacts with double
stranded DNA, but the major disadvantage of SybrGreen is that it interacts with all dsDNA. This was a
major problem in our RT-qPCR due to the presence of primer dimers.
To determine the specificity of the RT-qPCR, the samples were loaded on a 2 % agarose gel
(Figure 24). It could be observed that there was no genomic DNA present in the cDNA and RNA
samples. The amplification also led to the production of 1 fragment (i.e. 84 bp for TNF-α and 90 bp
Figure 23: Amplification curves of (A) β–actin and (B) TNF-α of 105 PBMCs stimulated with 100 ng SEB for 5 h. Each dilution of 10 gives rise to approximately 3.33 cycles difference. The RNA sample does not give rise to a detectable signal, from which it can be concluded that there is no genomic DNA present in the RNA sample. In the 1/1000 dilution (dark blue line) there is cDNA present in the sample, but the concentration is too low to be detected in the qPCR.
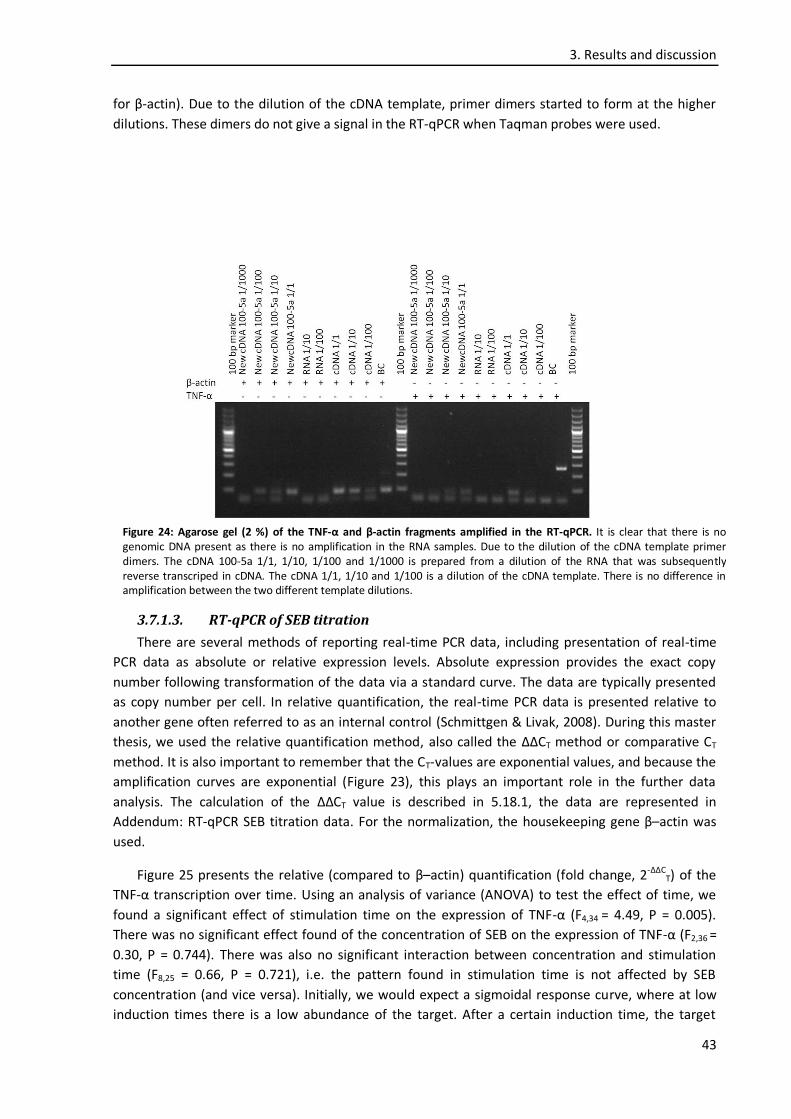
3. Results and discussion
43
for β-actin). Due to the dilution of the cDNA template, primer dimers started to form at the higher
dilutions. These dimers do not give a signal in the RT-qPCR when Taqman probes were used.
3.7.1.3. RT-qPCR of SEB titration
There are several methods of reporting real-time PCR data, including presentation of real-time
PCR data as absolute or relative expression levels. Absolute expression provides the exact copy
number following transformation of the data via a standard curve. The data are typically presented
as copy number per cell. In relative quantification, the real-time PCR data is presented relative to
another gene often referred to as an internal control (Schmittgen & Livak, 2008). During this master
thesis, we used the relative quantification method, also called the ΔΔCT method or comparative CT
method. It is also important to remember that the CT-values are exponential values, and because the
amplification curves are exponential (Figure 23), this plays an important role in the further data
analysis. The calculation of the ΔΔCT value is described in 5.18.1, the data are represented in
Addendum: RT-qPCR SEB titration data. For the normalization, the housekeeping gene β–actin was
used.
Figure 25 presents the relative (compared to β–actin) quantification (fold change, 2-ΔΔCT) of the
TNF-α transcription over time. Using an analysis of variance (ANOVA) to test the effect of time, we
found a significant effect of stimulation time on the expression of TNF-α (F4,34 = 4.49, P = 0.005).
There was no significant effect found of the concentration of SEB on the expression of TNF-α (F2,36 =
0.30, P = 0.744). There was also no significant interaction between concentration and stimulation
time (F8,25 = 0.66, P = 0.721), i.e. the pattern found in stimulation time is not affected by SEB
concentration (and vice versa). Initially, we would expect a sigmoidal response curve, where at low
induction times there is a low abundance of the target. After a certain induction time, the target
Figure 24: Agarose gel (2 %) of the TNF-α and β-actin fragments amplified in the RT-qPCR. It is clear that there is no genomic DNA present as there is no amplification in the RNA samples. Due to the dilution of the cDNA template primer dimers. The cDNA 100-5a 1/1, 1/10, 1/100 and 1/1000 is prepared from a dilution of the RNA that was subsequently reverse transcriped in cDNA. The cDNA 1/1, 1/10 and 1/100 is a dilution of the cDNA template. There is no difference in amplification between the two different template dilutions.

3. Results and discussion
44
abundance would rise exponentially until it reaches a certain plateau. It is clear that there is an initial
increase in TNF-α production after 2 h induction, for an SEB concentration of 1 ng/100 µl, 10 ng/100
µl and 100 ng/100 µl, after which (except for the 100 ng/100 µl SEB concentration) there is a decline
in TNF-α transcription. This decline may be explained as the result of mRNA degradation after the
protein is produced, as a means of controlling the TNF-α production (i.e. negative feedback).
Due to time constraints, we were not able to repeat the experiment to check its reproducibility
or reliability. Although we could observe a clear increase in TNF-α transcription after 2 hours (16-20
fold for all three SEB concentrations), and a clear overall decrease, reaching a minimum after 24
hours, it needs to be checked whether the variability between the different SEB concentrations over
the different time points, is due to differences in cell numbers in the initial wells, to differences in the
efficiency of the RNA extraction or due to differences in the RT-qPCR.
0
5
10
15
20
25
0 2 3 4 5 24
2-Δ
ΔC
T
Induction time (h)
1 ng/100 µl SEB
10 ng/100 µl SEB
100 ng/100 µl SEB
Figure 25: Relative TNF-α transcription (normalized to β–actin) of PBMCs, stimulated with three different concentrations of SEB (1, 10 and 100 ng/100 µl), during 5 different induction periods (2, 3, 4, 5 and 24 hours). The error bars represent the standard deviation of each conditions. Initially there is a clear rise in TNF-α production after 2 h stimulation, followed by a decline. The x-axis represents the induction time, the y-axis represents the fold change (2
-ΔΔCT). A fold change of 1
means that there is no TNF-α expression.
45
4. Conclusions
4.1. Protein expression
Although protein expression is carried out routinely in some laboratories, it often takes much
time and effort to find the condition or the expression host to achieve optimal protein expression.
Although all the preparative steps, such as identification of putative endolysin and holin proteins in
the genome of phage ISP and the construction of expression plasmids were successful, as could be
illustrated by sequencing of the final constructs, to date we have not succeeded to recombinantly
express the different phage ISP proteins in E. coli BL21(DE3). Initially we were able the express the
different phage ISP proteins at small scale, but we were unable to reproduce these results on larger
scale. Although bacteriophages replicate in bacteria, this does not assure the success of recombinant
protein expression. It is also important to remember that in this master thesis we tried to express
phage ISP genes, which infects the Gram-positive bacteria S. aureus, in the Gram-negative bacteria E.
coli.
Escherichia coli is a commonly used host for recombinant protein expression, since it represents
a simple system that offers a wide choice in expression systems. However, expression of foreign
proteins in E. coli often results in various problems, such as the formation of inclusion bodies
(aggregates of insoluble or misfolded proteins) and protease degradation of the recombinant
protein. These issues often are a result of improper folding of the expressed proteins and are
problems frequently encountered in protein function research. Although initially protein expression
could be observed, we were not able to purify the recombinant proteins. This could indicate that the
recombinant protein is either proteolytically degraded or that is present in inclusion bodies. Which of
both problems was at hand could have been checked by distinguishing the soluble and insoluble
protein fraction. This could have been done by lysing the cells, ultracentrifuge them and load the
supernatant and pellet on SDS-PAGE. Alternatively, a small fraction of the culture could be analysed
under the microscope were inclusion bodies can be easily identified at the edge of the cell. This is
planned in forthcoming research.
Recovery of biologically active products from aggregated state is typically accomplished by
unfolding with chaotropic agents followed by dilution/dialysis into optimized refolding buffers.
Optimization of the refolding procedure however, requires time consuming efforts and is not
conductive to high protein yields (Sorensen & Mortensen, 2005). Thus, for maximizing the yields of
recombinant proteins in a soluble and active form in vivo (i.e. in the cell itself) becomes an
alternative to in vitro folding (i.e. refolding of a purified protein).
A number of approaches for the redirection of proteins from inclusion bodies into the soluble
fraction are described in literature. Modification of cultivation conditions to changing a host cell, or
use of fusion partners are some of the methods. Molecular chaperones and other folding catalysts
have long been known to aid the protein-folding pathway (Figure 26). Manipulation of these folding
modulators to increase the refolding efficacy in vitro in combination with immobilization technology
has been explored recently (Jhamb et al, 2008). The effect of co-expression of molecular chaperones
in vivo in increasing the solubility of recombinant proteins has been well documented (Cui et al,
2011; Martinez-Alonso et al, 2010; Nishihara et al, 1998; Nishihara et al, 2000; Sonoda et al, 2010;
Thomas et al, 1997; Zelena et al, 2012). However, the success of chaperone co-overproduction
depends on the relative affinities of the chaperone system to the folding intermediates and the

4. Conclusions
46
folding and aggregation kinetics of such species. These parameters are difficult to predict and as
such, the application of molecular chaperones rely on trial and error experiments (Schlieker et al,
2002). Another fact that needs consideration is that the suitability of any chaperone combination is
target protein specific (de Marco & De Marco, 2004). Hence, fine tuning of the expression of both the
target protein and chaperones is required in order to improve the amount of soluble protein (Jhamb
& Sahoo, 2012). The most abundant and physiologically important chaperones in E. coli include DnaK,
DnaJ, GrpE, GroEL and GroES (Nishihara et al, 1998). Several lines of evidence have indicated that the
two major chaperone teams, DnaK-DnaJ-GrpE and GroEL-GroES, play distinct but cooperative roles in
the protein folding in vivo (Gragerov et al, 1992; Hartl, 1996; Kusukawa & Yura, 1988). Plasmids
containing these chaperones are commercially available from Takara Bio Inc., Tokyo, Japan. Although
these chaperones may provide the solution to the expression of our recombinant protein, it is also
important to remember that the introduction of extra plasmids provides a metabolic burden on the
host strain. This might result in a slower growth of the host culture.
Alternatively, it is possible to obtain a soluble, secreted protein by the attachment of a sequence
coding for a signal peptide targeting the heterologous product to the periplasm. The periplasmatic
space is rich in foldases which may catalyse important modifications, such as disulfide bond
formation, and shows less peptidase activity compared to the cytoplasm (Fahnert et al, 2004;
Jonasson et al, 2002). Furthermore, recombinant protein purification is simpler due to fewer
contaminating proteins in the periplasm.
Besides these aspects, the protein purification itself could be further optimized. For instance, it
would be advisable to use smaller columns for the affinity purification. The smaller the column, the
Figure 26: Possible model for chaperone-assisted protein folding in E. coli. Different molecular chaperones are represented in the figure: Tf (Trigger factor), DnaK, DnaJ, GrpE, GroES and GroEL. Adopted from Thomas et al. (1997).
4. Conclusie
47
less aspecific proteins will be retained on the column, a problem that was clearly visible during this
master thesis.
4.2. Immunology
During this master thesis we also aimed to develop an assay that could be used for a rough
determination of the immune response on PBMCs, i.e. to relatively quantify the amount of IL-10 and
TNF-α mRNA after specific antigen stimulation. Currently we were able to develop part of such an
assay by using SEB to stimulate PBMCs into an pro-inflammatory response. To analyse this
inflammatory state, Intracellular Cytokine Staining and RT-qPCR was used to relatively quantify
specific cytokines (i.e. TNF-α). The analysis of IL-10 was still under development at the end of this
master thesis.
By using RT-qPCR, the amount of cellular RNA is determined as a measure to what extent a
particular gene is being expressed. For many genes, the expression level may change dramatically
from cell to cell or during various experimental conditions. Real-time PCR (qPCR) has been used in
gene expression studies for the validation of protein levels (Kim et al, 2008), for the validation of the
extent of transcription of a gene (Pal et al, 2007), to study the difference in the expression of a
specific gene between a diseased state and a normal/healthy state (Ren et al, 2007), and to
determine the change in gene expression during cell differentiation or development (Higashibata et
al, 2006). Real-time PCR has also been used to analyse the change in expression for cells that are
exposed to a chemical substance (e.g. drugs, toxins, hormones or cytokines) (Schmittgen & Livak,
2008; Woods et al, 2008).
Real-time RT-PCR is a powerful technique to quantify the expression of different target genes.
The quantitative endpoint for qPCR is the threshold cycle (CT). The CT is defined as the PCR cycle at
which the fluorescent signal of the reporter dye crosses an arbitrarily placed threshold. By presenting
the data as the CT, one ensures that the PCR is in the exponential phase of the amplification. The
numerical value of the CT is inversely related to the amount of amplicon in the reaction (i.e. the
higher the CT value, the lower the amount of amplicon). There are several methods of reporting qPCR
data, including the presentation of qPCR data as absolute or relative expression levels.
Currently there are several methods to present the relative gene expression. The efficiency
correction method calculates the relative expression ratio from the qPCR efficiencies and the CT
(Pfaffl, 2001). Alternatively, qPCR data can also be analyzed using the so-called sigmoidal curve fitting
methods that fit the experimental data to an empirical equation and results in the prediction of the
PCR efficiency and an estimate of the initial copy number of the amplicon (Liu & Saint, 2002;
Rutledge, 2004). A final method to present the relative gene expression, and the one that was used
during this master thesis, is the comparative CT method (also known as the 2-ΔΔCT method) (Livak &
Schmittgen, 2001). The comparative CT method makes several assumptions, including that the
efficiency of the PCR is close to 1 and that the PCR efficiency of the target gene is similar to the
internal control gene.
There are advantages and disadvantages to each of the methods to analyze the relative qPCR
data. An advantage of the efficiency correction method is that the PCR efficiency of the target and
internal control genes are included in the equation and therefore differences in the efficiency
between target and internal control will be accounted for in the calculation (Pfaffl, 2001). The
sigmoidal curve fitting models have the advantage that the PCR efficiency does not need to be
calculated by a separate experiment and is estimated during the analysis (Liu & Saint, 2002;
4. Conclusions
48
Rutledge, 2004). Finally, the comparative CT method has as major advantage that it is easy to use and
has the ability to present the data as a ‘fold change’ in expression. A major disadvantage of the
comparative CT method includes that the assumptions of PCR efficiency must hold (Schmittgen &
Livak, 2008).
It is evident from our RT-qPCR results that that SEB induces a pro-inflammatory response in
PBMCs and that the best concentration to obtain a reversible TNF-α production is a 2 h stimulation
with 100 ng/100 µl SEB.
The first step that will be undertaken to determine the immunomodulatory effect of different
bacteriophages is further optimization of the RT-qPCR of the SEB titration. Once that assay is
perfectly optimized one could perform an immunological assay whereby PBMCs are first treated with
SEB to induce an inflammatory state. Subsequently these treated PBMCs could be treated with
different bacteriophages (or combinations thereof) to determine if they induce a reduction in the
inflammatory state of the PBMCs. The use of PBMCs has as advantage that we look at a group of
different cells, which have the ability to communicate with one another to produce an optimal
immune response. The disadvantage of the PBMCs is that the detected immune response could be
blood donor specific, and it is therefore recommended to reperform the SEB titration whenever
PBMCs are used from a new donor.
The development of such an assay could help provide a better understanding of the interaction
of bacteriophages with the immune system of the host of the bacterial species they infect. In a much
later stadia such discoveries could help in the production of more natural, less toxic, anti-
inflammatory compounds. It could also help as an extra advantage related to the approval
bacteriophage therapy in the future and help in getting a better regulatory agreement. It is
important to note that the described assay is rudimentary by which we only look at two immune
markers, i.e. TNF-α and IL-10, and a group of different cells (we do not know which cells interact with
the bacteriophages and are responsible for the immune response). The assay provides a first clue at
which bacteriophages possess immunomodulatory properties, which could in a later stage be further
analysed by RNA-seq to get a more clearer view at what is happening to the cells. Further prospects
in this research could be to pinpoint which bacteriophage proteins are responsible for the interaction
with the mammalian cells and which are the mammalian cells and cell receptors responsible for the
interaction.

49
4. Conclusies
4.1. Eiwit-expressie
Hoewel eiwit-expressie bijna routinematig uitgevoerd wordt in sommige laboratoria, vergt deze
techniek nog steeds veel tijd en inspanningen om tot de optimale expressie condities te komen of de
optimale expressie-gastheer te vinden. Alle voorbereidende stappen, zoals de identificatie van
vermeende endolysine en holine eiwitten in het genoom van bacteriofaag ISP en de constructie van
expressie-plasmiden waren succesvol, zoals aangetoond kon worden door het sequeneren van de
finale constructen, maar toch waren we niet in staat om de verschillende bacteriofaag ISP
recombinant-eiwitten te expresseren in E. coli BL21(DE3). Initieel konden we echter wel de
verschillende bacteriofaag ISP-eiwitten expresseren op kleine schaal, maar we waren niet in staat
deze resultaten te reproduceren op grotere schaal. Hoewel bacteriofagen repliceren in bacteriën,
verzekert dit niet het succes van recombinante eiwit-expressie. Een mogelijke reden voor dit falen is
dat we genen van faag ISP, die de Gram-positieve bacterie S. aureus infecteert, probeerden tot
expressie te brengen in de Gram-negatieve bacterie E. coli.
Escherichia coli is een van de meest gebruikte gastheren voor recombinante eiwit-expressie, E.
coli vormt immers een eenvoudig systeem dat een brede keuze aan expressiesystemen levert. De
expressie van vreemde eiwitten in E. coli resulteert vaak in verschillende problemen, zoals de
vorming van inclusielichamen (aggregaten van onoplosbare of fout opgevouwen eiwitten) en
degradatie van het recombinante eiwit door proteases. Deze frequent voorkomende problemen zijn
vaak het resultaat van het fout opvouwen van het recombinante eiwit. Hoewel er initieel
eiwitexpressie was, zijn we er niet in geslaagd het recombinante eiwit op te zuiveren. Dit kan wijzen
op ofwel proteolytische degradatie van het eiwit of de vorming van inclusielichamen. Helaas is er
gedurende deze master thesis geen duidelijk onderscheid gemaakt tussen de oplosbare en
onoplosbare eiwitfractie. Dit zou gedaan kunnen worden door het lyseren van de cellen, het lysaat
aan ultracentrifugatie te onderwerpen en zowel het supernatans als de pellet aan SDS-PAGE te
onderwerpen. Als alternatief zou een kleine hoeveelheid van de celcultuur geanalyseerd kunnen
worden onder een lichtmicroscoop waar inclusielichamen geïdentificeerd kunnen worden aan het
uiteinde van de cel.
Het herwinnen van biologisch actieve eiwitten uit een geaggregeerde staat wordt typisch gedaan
door de eiwitten te ontvouwen met behulp van chaotrope agentia gevolgd door verdunning of
dialyse in geoptimaliseerde heropvouwingsbuffers. Optimalisatie van het heropvouwings procedure
vereist echter tijdrovende inspanningen en leidt vaak tot lagere eiwitopbrengsten (Sorensen &
Mortensen, 2005). Dus, voor het maximaliseren van de recombinante eiwitopbrengst in een
oplosbare en actieve vorm vormt in vivo opvouwing (m.a.w. in de cel zelf) een alternatief voor de in
vitro opvouwing (m.a.w. heropvouwing van opgezuiverde eiwitten).
In de literatuur zijn verschillende aanpakken beschreven om eiwitten in een oplosbare vorm te
krijgen in plaats van in inclusielichamen. Modificatie van de kweekcondities, het gebruik van een
andere gastheer, of het gebruik van een fusiepartner zijn enkele van de gebruikte methodes.
Moleculaire chaperones en andere opvouwingskatalysten zijn eveneens een hulpmiddel in de eiwit-
opvouwings pathways (Figuur 1). Manipulatie van deze opvouwingsmodulatoren om de in vivo
heropvouwingsefficiëntie te verbeteren in combinatie met immobilizatie-technologie is recent
beschreven (Jhamb et al, 2008). Het effect van co-expressie van moleculaire chaperones in vivo in het
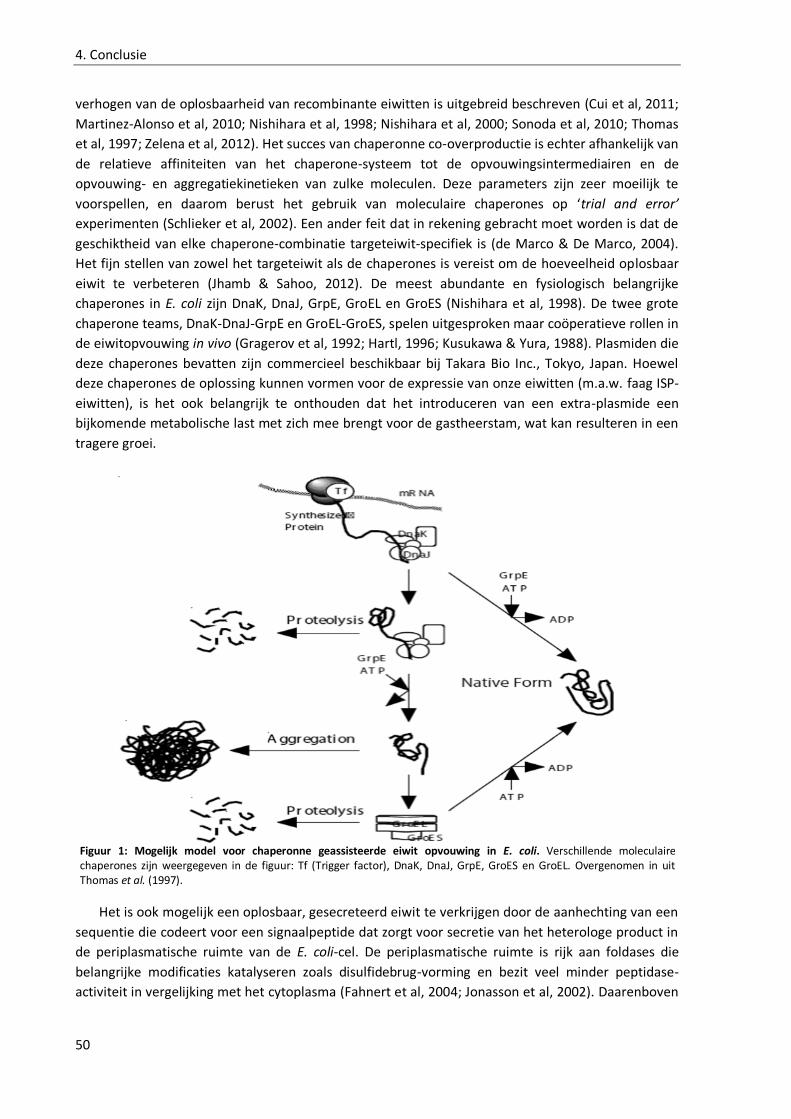
4. Conclusie
50
verhogen van de oplosbaarheid van recombinante eiwitten is uitgebreid beschreven (Cui et al, 2011;
Martinez-Alonso et al, 2010; Nishihara et al, 1998; Nishihara et al, 2000; Sonoda et al, 2010; Thomas
et al, 1997; Zelena et al, 2012). Het succes van chaperonne co-overproductie is echter afhankelijk van
de relatieve affiniteiten van het chaperone-systeem tot de opvouwingsintermediairen en de
opvouwing- en aggregatiekinetieken van zulke moleculen. Deze parameters zijn zeer moeilijk te
voorspellen, en daarom berust het gebruik van moleculaire chaperones op ‘trial and error’
experimenten (Schlieker et al, 2002). Een ander feit dat in rekening gebracht moet worden is dat de
geschiktheid van elke chaperone-combinatie targeteiwit-specifiek is (de Marco & De Marco, 2004).
Het fijn stellen van zowel het targeteiwit als de chaperones is vereist om de hoeveelheid oplosbaar
eiwit te verbeteren (Jhamb & Sahoo, 2012). De meest abundante en fysiologisch belangrijke
chaperones in E. coli zijn DnaK, DnaJ, GrpE, GroEL en GroES (Nishihara et al, 1998). De twee grote
chaperone teams, DnaK-DnaJ-GrpE en GroEL-GroES, spelen uitgesproken maar coöperatieve rollen in
de eiwitopvouwing in vivo (Gragerov et al, 1992; Hartl, 1996; Kusukawa & Yura, 1988). Plasmiden die
deze chaperones bevatten zijn commercieel beschikbaar bij Takara Bio Inc., Tokyo, Japan. Hoewel
deze chaperones de oplossing kunnen vormen voor de expressie van onze eiwitten (m.a.w. faag ISP-
eiwitten), is het ook belangrijk te onthouden dat het introduceren van een extra-plasmide een
bijkomende metabolische last met zich mee brengt voor de gastheerstam, wat kan resulteren in een
tragere groei.
Het is ook mogelijk een oplosbaar, gesecreteerd eiwit te verkrijgen door de aanhechting van een
sequentie die codeert voor een signaalpeptide dat zorgt voor secretie van het heterologe product in
de periplasmatische ruimte van de E. coli-cel. De periplasmatische ruimte is rijk aan foldases die
belangrijke modificaties katalyseren zoals disulfidebrug-vorming en bezit veel minder peptidase-
activiteit in vergelijking met het cytoplasma (Fahnert et al, 2004; Jonasson et al, 2002). Daarenboven
Figuur 1: Mogelijk model voor chaperonne geassisteerde eiwit opvouwing in E. coli. Verschillende moleculaire chaperones zijn weergegeven in de figuur: Tf (Trigger factor), DnaK, DnaJ, GrpE, GroES en GroEL. Overgenomen in uit Thomas et al. (1997).
4. Conclusions
51
is de opzuivering van het recombinante eiwit veel eenvoudiger door de kleinere hoeveelheid aan
contaminerende eiwitten in het periplasma.
4.2. Immunologie
Het was ook de bedoeling om gedurende deze masterthesis een assay te ontwikkelen die
gebruikt zou kunnen worden voor een ruwe bepaling van de immuunrespons van perifere bloed
mononucleaire cellen (PBMCs), m.a.w. een test die zou toelaten om een relatieve kwantificatie van
de hoeveelheid IL-10 en TNF-α mRNA transcriptie na specifieke antigenstimulatie uit te voeren. We
zijn er in geslaagd om dergelijke assay deels te ontwikkelen door gebruik te maken van stafylococcen
enterotoxine B (SEB) om de PBMCs in een pro-inflammatoire toestand te brengen. Om deze
inflammatoire toestand te analyseren werd gebruik gemaakt van RT-qPCR voor de kwantificatie van
specifieke cytokines (m.a.w. TNF-α), relatief t.o.v. een huishoudgen (β-actine). De analyse van IL-10
was nog onder ontwikkeling op het einde van deze masterthesis.
Door gebruik te maken van RT-qPCR meet men de hoeveelheid RNA, en is men in staat om de
mate van expressie van een bepaald gen te bepalen. Voor vele genen verandert het expressieniveau
sterk van cel tot cel of gedurende verschillende experimentele condities. Real-time PCR (qPCR) werd
reeds gebruikt in genexpressie-studies als validatie voor het eiwitniveau (Kim et al, 2008), voor een
validatie van de mate van transcriptie van een gen (Pal et al, 2007), voor de studie van de verschillen
in expressie van een specifiek gen tussen een ziektetoestand en een normale/gezonde toestand (Ren
et al, 2007), voor de bepaling van verandering in genexpressie gedurende celdifferentiatie of -
ontwikkeling (Higashibata et al, 2006), en voor de analyse van de verandering in expressie van cellen
die blootgesteld zijn aan een chemische substantie, zoals antibiotica, toxines, hormonen of cytokines
(Schmittgen & Livak, 2008; Woods et al, 2008).
qPCR is een krachtige techniek voor de kwantificatie van de expressie van verschillende target-
genen. Het kwantitatieve eindpunt voor een qPCR is de threshold cycle (CT). De CT is gedefinieerd als
de PCR cyclus waarbij het fluorescente signaal van een reporter dye (bvb. SybrGreen, geeft pas een
fluorescent signaal wanneer het intercallerd met dsDNA) een bepaalde drempel overstijgt, bij het
begin van het exponentiële deel van de amplificatie curve. Door de data weer te geven als de CT
verzekert men dat de PCR zich in de exponentiële fase van de amplificatie bevindt. De numerieke
waarde van de CT is omgekeerd gerelateerd tot de hoeveelheid van het amplicon in de reactie (m.a.w.
hoe hoger de CT-waarde, hoe lager de hoeveelheid van het target dat initieel aanwezig was). Er
bestaan verschillende methodes voor het rapporteren van de qPCR data, inclusief het weergeven van
de qPCR data als absolute of relatieve expressie niveaus.
Momenteel zijn er verschillende methodes voor het weergeven van de relatieve gen-expressie.
De efficiëntie-correctiemethode is er één van en berekent de relatieve expressieverhoudingen aan
de hand van de qPCR-efficiënties en de CT (Pfaffl, 2001).
Alternatief kunnen de qPCR-data ook geanalyseerd worden door gebruik te maken van de
zogenoemde sigmoïdale curve fittingmethode, die tracht de experimentele data te fitten in een
empirische formule en resulteert in de voorspelling van de PCR-efficiëntie en een schatting van het
initiële kopienummer van het amplicon (Liu & Saint, 2002; Rutledge, 2004). Een laatste methode voor
het weergeven van de relatieve genexpressie, en de methode die gebruikt is gedurende deze
masterthesis, is de vergelijkende CT-methode (ook gekend als de 2-ΔΔCT methode) (Livak & Schmittgen,
2001). De vergelijkende CT-methode berust op de assumpties dat de efficiëntie van de PCR dicht bij 1
4. Conclusie
52
moet zijn en dat de PCR-efficiëntie van het targetgen gelijk moet zijn aan die van het interne
controle-gen (meestal een huishoudgen met constitutieve transcriptie/expressie).
Er zijn voor- en nadelen voor elk van deze methodes voor het analyseren van de relatieve qPCR-
data. Een voordeel van de efficiëntie-correctiemethode is dat de PCR-efficiëntie van de target- en
interne controle genen opgenomen worden in de formule, zodat verschillen in de efficiëntie tussen
target en interne controle in rekening gebracht worden gedurende de berekeningen (Pfaffl, 2001).
De sigmoïdale curve fitting-modellen hebben als voordeel dat de PCR-efficiëntie niet berekend
moeten worden voor elk individueel experiment en geschat wordt gedurende de analyse (Liu & Saint,
2002; Rutledge, 2004). De vergelijkende CT-methode heeft als belangrijkst voordeel het
gebruiksgemak en de mogelijkheid om de data als een ‘fold change’ in expressie weer te geven. Een
groot nadeel van de vergelijkende CT-methode zijn de bovenvermelde PCR-efficiëntie vereisten, die
verregaande PCR-optimalisatie veronderstellen (Schmittgen & Livak, 2008).
Uit onze resultaten blijkt duidelijk dat, aangetoond met behulp van een qPCR, SEB pro-
inflammatoire respons veroorzaakt in PBMCs en dat de beste van de geteste condities om een
reversibele TNF- α productie te verkrijgen een stimulatie van 100 ng/100 µl SEB is gedurende 2 h.
De volgende stap in het onderzoek naar de immunomodulatorische effecten van verschillende
bacteriofagen op PBMCs, is een verdere optimalisatie van de qPCR van de SEB-titratie. Eens die assay
optimaal is, zouden we een immunologische assay kunnen uitvoeren waarbij de PBMCs eerst
behandeld worden met SEB om een reversiebele inflammatie te induceren. Vervolgens zouden deze
PBMCs behandeld kunnen worden met verschillende bacteriofagen (of combinaties daarvan) om te
achterhalen of deze werkelijk in staat zijn om te zorgen voor een reductie in de inflammatoire
toestand van PBMCs. Het gebruik van PBMCs heeft als voordeel dat we kijken naar een verzameling
van verschillende cellen, die de mogelijkheid hebben om met elkaar te communiceren om zo tot een
optimale immuun-respons te komen. Het nadeel van het gebruik van PBMCs is dat de gedetecteerde
immuunrespons donorspecifiek kan zijn. Daarom is het aangeraden om de SEB-titratie telkens
opnieuw uit te voeren wanneer PBMCs gebruikt worden van een nieuwe donor. Een ander nadeel
van het gebruik van PBMCs is dat het niet mogelijk is om te bepalen welk celtype verantwoordelijk is
voor de putatieve anti-inflammatoire respons. Daartoe zou in een verder stadium moeten gewerkt
worden met cellijnen.
De ontwikkeling van dergelijke assay zou kunnen helpen om een beter begrip krijgen van de
interactie van bacteriofagen met het immuunsysteem van de gastheer van de bacteriële species die
zij infecteren. In een veel later stadium zouden dergelijke ontdekkingen kunnen helpen in de
productie van meer natuurlijke, minder toxische, anti-inflammatoire verbindingen. Het zou ook
kunnen helpen als een extra voordeel bij het goedkeuren van bacteriofaagtherapieën in de toekomst
en bij het helpen om betere regulatorische overeenkomsten te verkrijgen. Het is echter belangrijk te
onthouden dat de beschreven assay een rudimentaire assay is, waarbij we enkel kijken naar twee
immuunmerkers, met name TNF-α en IL-10, en dit voor een mengsel van verschillende celtypes. De
assay levert een eerste aanwijzing voor welke bacteriofagen mogelijke immunomodulatorische
eigenschappen bezitten, zodat die in een later stadie verder geanalyseerd kunnen worden door RNA
seq om een duidelijker beeld te krijgen van wat er allemaal in de cel gebeurt. Verdere vooruitzichten
in dit onderzoek betreft het beter definiëren van welke bacteriofaageiwitten verantwoordelijk zijn
voor de interactie met de zoogdiercellen en welke zoogdiercellen en celreceptoren verantwoordelijk
zijn voor de interactie.

53
5. Material and methods
Figure 27 is a schematic representation of the different experimental steps that have been
carried out during this master thesis.
Figure 27: Schematic representation of the different steps in this master thesis. (1) BLAST analysis for the identification of endolysins, holins and potential immunomodulating proteins present in the genome of phage ISP. (2) Cloning of the identified genes. (3) Phage multiplication (i.e. E. coli phage S3, S. aureus phage ISP and P. Aeruginosa phages PNM and 14/1). (4) Expression optimization of the cloned genes. (5) Recombinant protein expression on large scale (2 L). (6) Protein purification. (7) Quantification of TNF-α and IL-10 production by peripheral blood mononuclear cells (PBMCs). PBMCs, isolated from a buffy coat, will first be stimulated with Staphylococcal enterotoxin B (SEB) to determine the optimal SEB concentration to induce a reversible inflammatory response (TNF-α production). This will be determined by reverse transcriptase quantitative PCR (RT-qPCR). In a subsequent experiment the PBMCs will be stimulated with SEB followed by stimulation with different bacteriophages, *not performed during this master thesis.

5. Material and methods
54
5.1. Bacterial strains
The host used for propagation of the ISP phage was S. aureus subsp. Rosenbach ATCC 6538, for E.
coli phage S3 was E. coli K12 and for the Pseudomonas phage 14/1 and PNM was Pseudomonas
aeruginosa strain 573. These were kindly provided by Maya Merabishvili (Department of Clinical
Chemistry, Microbiology and Immunology, Ghent University, Belgium).
For cloning and subsequent recombinant protein expression Escherichia coli TOP10 cells
(Invitrogen Life Technologies, Carlsbad, CA) and E. coli BL21 (DE3) (Invitrogen) were used. The
genotypes of these E. coli strains are listed in Table 5.
Table 5: Genotypes of the different E. coli strains used in this master thesis.
E. coli strain Genotype
TOP10 F-mcrA ∆(mrr-hsdRMS-mcrBC) Φ80lacZ∆M15 ∆lacΧ74 recA1 araD139 ∆(ara-leu)7697 galU galK rpsL (StrR) endA1 nupG
BL21 (DE3) F- ompT hsdSB(rB-mB
-) gal dcm (λclts857 ind1 sam7 nin5 lacUV5-T7 gene 1)
5.2. Polymerase chain reaction
Selected bacteriophage genes, i.e. ORF 201 and ORF 204, were amplified by polymerase chain
reaction (PCR), using 50 ng of purified phage ISP DNA (provided by Maya Merabishvili) as template
and ORF 201, respectively ORF 204 primers (Table 2). Reactions were performed with 2 U FastStart
Taq DNA polymerase (Roche Applied Science, Vilvoorde, Belgium). The initial denaturation at 95 °C
took 5 min, this was followed by 45 rounds of denaturation at 95 °C for 30 sec, annealing at 50 °C for
30 sec and elongation at 72 °C for 1 min. A final elongation at 72 °C for 5 min was performed at the
end of the PCR program. The resulting PCR products were purified using a QiaQuick PCR purification
kit (Qiagen, Valencia, CA). The nucleic acid concentration was determined with NanoDrop (Thermo
Scientific, Wilmington, DE). All primers with corresponding details are summarised in Table 6.
Table 6: Primers used for cloning of phage proteins. The specific restriction sites, used in the later cloning are underlined. NcoI (5’ – CCATGG – 3’), NdeI (5’ – CATATG – 3’) and BamHI (5’ – GGATCC – 3’).
5.3. Cloning
5.3.1. Topo TA cloning
The linearized pCR4-TOPO vector (Invitrogen) allows direct cloning, catalyzed by the covalently
bound topoisomerase I. TOPO TA cloning was performed according to the manufacturer’s protocol.
Four µl of purified PCR fragments were added to 1 µl of vector DNA and incubated for 5 minutes at
room temperature. Subsequently, 1 µl of this preparation was transferred to 60 µl of One Shot
TOP10 Electrocompetent E. coli (Invitrogen) on ice and electroporated (2.5 V, MicroPulser
Electroporator, Bio Rad, Hercules, CA). After one hour of incubation in 1 ml LB at 37 °C, 50 µl and 200
µl was spread on kanamycin (2.5 mg/ml) containing agar plates.
Gene Name Sequence (5’ –> 3’)
ORF 201 ORF201_Forward CCATGGGCAGCAGCCATCATCATCATCATCACAGCAGCGGCCT
GGTGCCGCGCGGCAGCATGAGTGCTAGTGATGCTCAATTCC ORF201_Reverse GGATCCCTATTTGAATACTCCCCAGG
ORF 204 ORF203_Forward CATATGGCTAATGAAACTAAACAACC ORF203_Reverse GGATCCTTACTTAACTTCCTCCTCTGC

5. Material and methods
55
5.3.2. Plasmid purification
After electroporation, one colony was picked and transferred to 50 ml LB with 2.5 mg/ml
kanamycin and incubated at 37 °C. For plasmid purification, the innuPREP Plasmid Minikit (Life
Science Analytik Jena, Jena, Germany) was used. The whole culture was centrifuged at 10000g for
one minute. The cell pellet was subsequently lysed and the plasmids were purified as described by
the manufacturer. The purified plasmids were stored at -20 °C.
5.3.3. Ligation dependent cloning
The TOPO® TA cloned fragments possess specific restriction sites introduced through
incorporation of the primers during the PCR (see 5.2). A restriction digest was performed at 37 °C for
one hour on the TOPO® TA vectors using 1 unit of the specific restriction enzymes (NcoI and BamHI
or NdeI and BamHI respectively) for the removal of the genes. The gene fragments were purified
from agarose gel using an InnuPREP doublepure Kit (Life Science Analytik Jena), following the
manufacturer’s protocol. The same protocol was used for the linearization of the pET15b vector, this
vector was provided by Ann Dansercoer (Departement of structural biology and biophysics, Ghent
University, Belgium). These fragments were then ligated in a linearised pET15b vector, using NcoI
and BamHI or NdeI and BamHI respectively, in 50 mM Tris-HCl (pH 7.5), 10 mM MgCl2, 1 mM ATP, 25
μg/ml BSA and 1 unit T4 DNA ligase (New England Biolabs Inc., Whitby, Ontario) for 3 hours at 25 °C.
Finally, the ORF x – pET15b was electroporated to electrocompetent BL21 (DE3) E. coli cells. After
one hour of incubation in 1 ml LB at 37 °C, 50 µl and 200 µl was spread on carbenicillin (100 µg/ml)
containing agar plates. Plasmids were purified as described in 5.3.2.
5.4. Sequencing of pET15b-ORF201 and pET15b-ORF204 vectors
5.4.1. PCR amplification of ORF 201 and ORF 204 fragments
To be sure that there were no mutations or frame shifts in the two constructs, they were
sequenced using the T7 forward and reverse primers (i.e. T7 promoter primer and T7 terminator
primer, respectively) (Table 7). The use of the T7 primers ensures the amplification of the construct
starting from the start codon and makes it possible to determine the presence of frame shift
mutations.
Reactions were performed with 2 U FastStart Taq DNA polymerase (Roche Applied Science,
Vilvoorde, Belgium). The initial denaturation at 95 °C took 5 min, followed by 45 rounds of
denaturation at 95 °C for 30 sec, annealing at 50 °C for 30 sec and elongation at 72 °C for 1 min. A
final elongation at 72 °C for 5 min was performed at the end of the PCR program.
Table 7: Primers used for the sequencing of the expression constructs.
Name Sequence (5’ -> 3’)
T7 promoter primer (forward) TAATACGACTCACTATAGGG
T7 terminator primer (reverse) GCTAGTTATTGCTCAGCGG
5.4.2. ExoSap purification of PCR products
Before the cycle sequencing can be performed, the PCR products must be purified of primers and
dNTPs. This removal is important because these contaminants can interfere in the cycle sequence
reaction. The ExoSap purification utilizes an Exonuclease I (Fermentas, Thermo Scientific, Waltham,
MA) that breaks down single stranded DNA in a 3’ – 5’ direction and alkaline phosphatase that breaks
down residual, unused dNTPs.
5. Material and methods
56
For the removal of these contaminants 0.05 µl Exonuclease I (10 U), 0.20 µl FastAP
Thermosensitive Alkaline Phosphate (1 U) and 0.75 µl H20 was used per sample. This mixture was
added to 5 µl of the PCR sample and incubated for 15 min at 37 °C, 20 min at 80 °C and finally cooled
to 4 °C.
5.4.3. Cycle sequencing
Cycle sequencing is based on the Sanger principle to determine the base sequence of a single
stranded DNA. The major difference between a regular PCR and cycle sequencing is the use of 3’
fluorescent dideoxynucleotide triphosphates (ddNTPs), whereby each of these ddNTPs is labeled
with a different fluorescent colour. During the cycle sequencing reaction, the elongation of a nascent
strand will be terminated upon (random) incorporation of a ddNTP instead of the corresponding
dNTP. The reaction will result in a mixture of complementary DNA strands with different lengths, but
ending with one certain ddNTP.
For the cycle sequencing, the BigDye Direct cycle sequencing kit (Invitrogen, Life Sciences) was
used. For each sample, 2 µl of the BigDye master mix was added to 7 µl BigDye buffer and 20 µl H2O.
This mixture was subsequently divided in two. To each of these reactions 2.5 µl of the forward or the
reverse primer (2 µM) was added. In a final step, 3 µl of the purified PCR product was added to these
reaction mixtures and incubated for 30 times 10 sec at 96 °C, 5 sec at 50 °C and 4 min at 60 °C.
5.4.4. Ethanol precipitation
Finally, ethanol precipitation of the cycle sequenced mixture was carried out to precipitate the
DNA strands so that they do not contain interfering components, such as primers and not
incorporated dNTPs and ddNTPs from the cycle sequencing reaction.
To each sequencing product, a total volume of 50 µl of 3 M sodiumacetate and 95 % ethanol was
added. This solution was centrifuged for 30 min at maximum speed. All supernatant was removed
and 70 µl of 70 % ethanol was added and the solution was centrifuged for 5 min at maximum speed.
Subsequently, all ethanol was removed and the DNA pellet was resuspended in 25 µl HiDi formamide
(Invitrogen, Life Technologies). In a final step the samples were denatured by heating the samples to
95 °C.
5.4.5. Sequence determination
The HiDi formamide resuspended sample was transferred to a 96 optical well plate (Applied
Biosystems, Grand Island, NY) and analysed by a ABI3130XL Genetic Analyzer (Invitrogen, Life
Technologies). This allows the separation of the different fragments on the basis of their length, by
means of capillary electrophoreses. At the end of the caplillaries the fluorescent signals of each
fragment is measured. This will then lead to the sequence of the fragments.
5.5. Preparation of electrocompetent cells
Electrocompetent cells were prepared according to Tung and Chow (Tung & Chow, 1995). A
bacterial culture of electrocompetent BL21 (DE3) E. coli cells was grown to an OD600nm = ± 0.6 and
harvested by centrifugation at 5000g for 3 min. The pelleted cells were washed three times in 10
% ice cold glycerol and stored in aliquots of 60 µl at -80 °C.
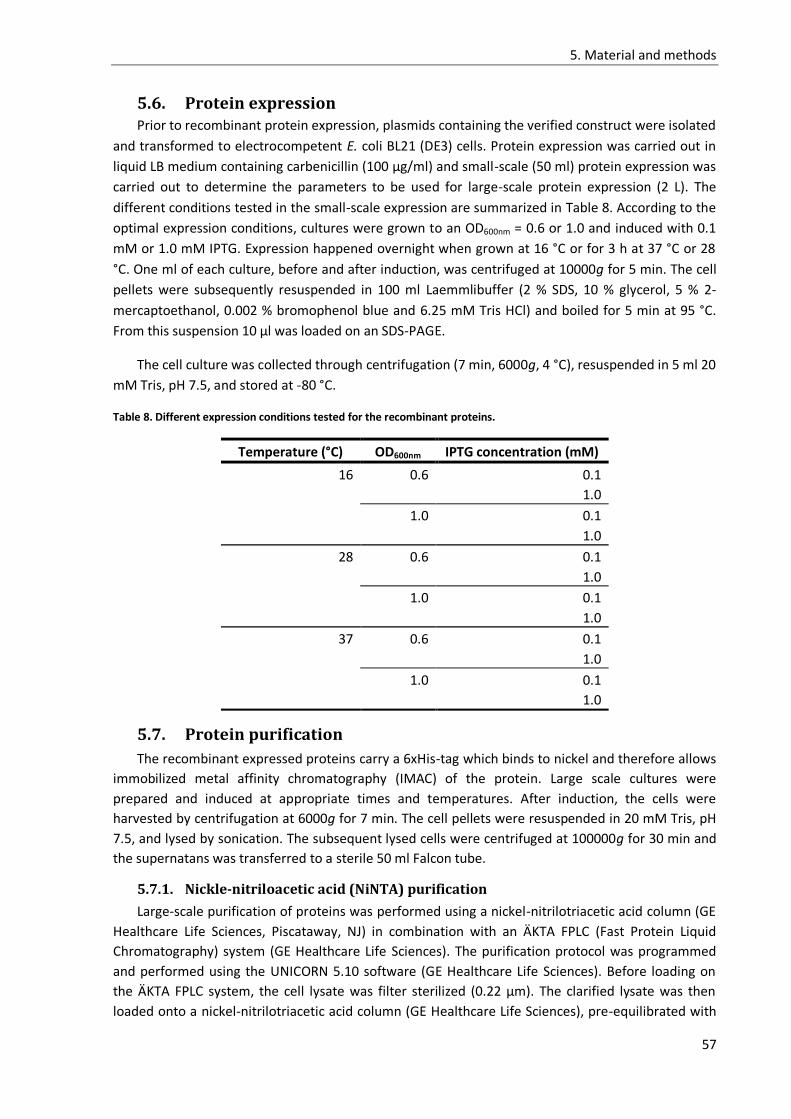
5. Material and methods
57
5.6. Protein expression Prior to recombinant protein expression, plasmids containing the verified construct were isolated
and transformed to electrocompetent E. coli BL21 (DE3) cells. Protein expression was carried out in
liquid LB medium containing carbenicillin (100 µg/ml) and small-scale (50 ml) protein expression was
carried out to determine the parameters to be used for large-scale protein expression (2 L). The
different conditions tested in the small-scale expression are summarized in Table 8. According to the
optimal expression conditions, cultures were grown to an OD600nm = 0.6 or 1.0 and induced with 0.1
mM or 1.0 mM IPTG. Expression happened overnight when grown at 16 °C or for 3 h at 37 °C or 28
°C. One ml of each culture, before and after induction, was centrifuged at 10000g for 5 min. The cell
pellets were subsequently resuspended in 100 ml Laemmlibuffer (2 % SDS, 10 % glycerol, 5 % 2-
mercaptoethanol, 0.002 % bromophenol blue and 6.25 mM Tris HCl) and boiled for 5 min at 95 °C.
From this suspension 10 µl was loaded on an SDS-PAGE.
The cell culture was collected through centrifugation (7 min, 6000g, 4 °C), resuspended in 5 ml 20
mM Tris, pH 7.5, and stored at -80 °C.
Table 8. Different expression conditions tested for the recombinant proteins.
Temperature (°C) OD600nm IPTG concentration (mM)
16 0.6 0.1
1.0
1.0 0.1
1.0
28 0.6 0.1
1.0
1.0 0.1
1.0
37 0.6 0.1
1.0
1.0 0.1
1.0
5.7. Protein purification
The recombinant expressed proteins carry a 6xHis-tag which binds to nickel and therefore allows
immobilized metal affinity chromatography (IMAC) of the protein. Large scale cultures were
prepared and induced at appropriate times and temperatures. After induction, the cells were
harvested by centrifugation at 6000g for 7 min. The cell pellets were resuspended in 20 mM Tris, pH
7.5, and lysed by sonication. The subsequent lysed cells were centrifuged at 100000g for 30 min and
the supernatans was transferred to a sterile 50 ml Falcon tube.
5.7.1. Nickle-nitriloacetic acid (NiNTA) purification
Large-scale purification of proteins was performed using a nickel-nitrilotriacetic acid column (GE
Healthcare Life Sciences, Piscataway, NJ) in combination with an ÄKTA FPLC (Fast Protein Liquid
Chromatography) system (GE Healthcare Life Sciences). The purification protocol was programmed
and performed using the UNICORN 5.10 software (GE Healthcare Life Sciences). Before loading on
the ÄKTA FPLC system, the cell lysate was filter sterilized (0.22 μm). The clarified lysate was then
loaded onto a nickel-nitrilotriacetic acid column (GE Healthcare Life Sciences), pre-equilibrated with
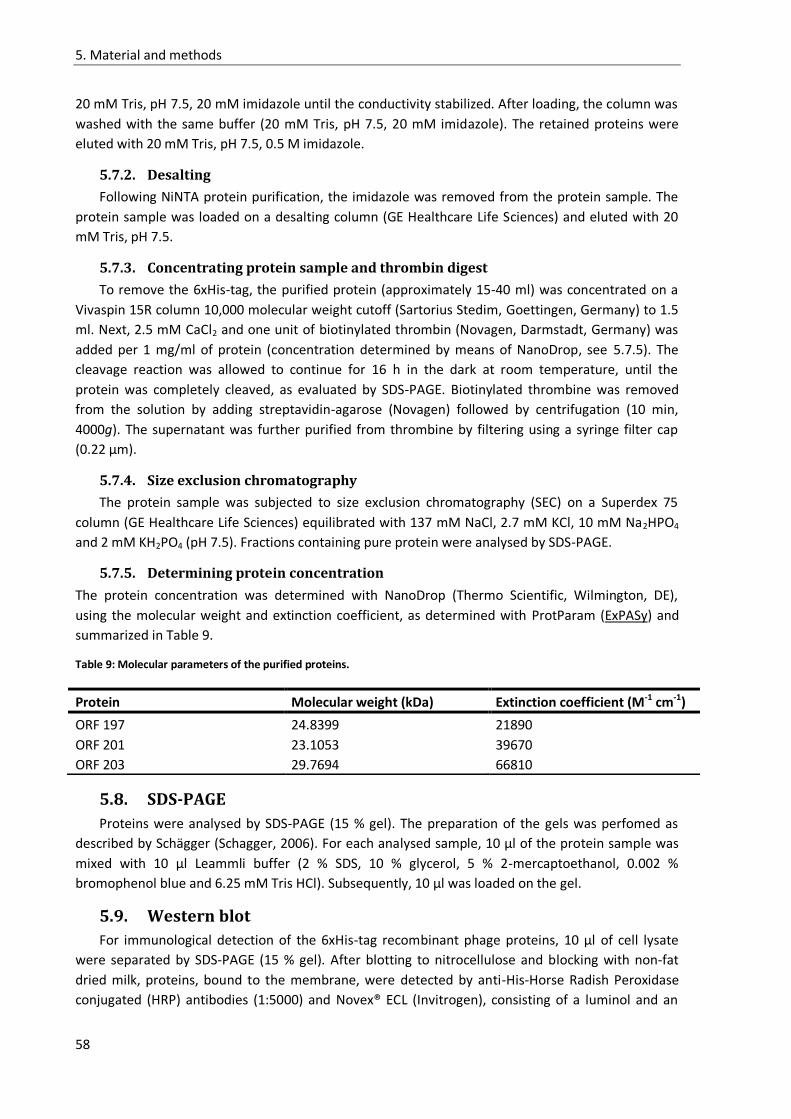
5. Material and methods
58
20 mM Tris, pH 7.5, 20 mM imidazole until the conductivity stabilized. After loading, the column was
washed with the same buffer (20 mM Tris, pH 7.5, 20 mM imidazole). The retained proteins were
eluted with 20 mM Tris, pH 7.5, 0.5 M imidazole.
5.7.2. Desalting
Following NiNTA protein purification, the imidazole was removed from the protein sample. The
protein sample was loaded on a desalting column (GE Healthcare Life Sciences) and eluted with 20
mM Tris, pH 7.5.
5.7.3. Concentrating protein sample and thrombin digest
To remove the 6xHis-tag, the purified protein (approximately 15-40 ml) was concentrated on a
Vivaspin 15R column 10,000 molecular weight cutoff (Sartorius Stedim, Goettingen, Germany) to 1.5
ml. Next, 2.5 mM CaCl2 and one unit of biotinylated thrombin (Novagen, Darmstadt, Germany) was
added per 1 mg/ml of protein (concentration determined by means of NanoDrop, see 5.7.5). The
cleavage reaction was allowed to continue for 16 h in the dark at room temperature, until the
protein was completely cleaved, as evaluated by SDS-PAGE. Biotinylated thrombine was removed
from the solution by adding streptavidin-agarose (Novagen) followed by centrifugation (10 min,
4000g). The supernatant was further purified from thrombine by filtering using a syringe filter cap
(0.22 µm).
5.7.4. Size exclusion chromatography
The protein sample was subjected to size exclusion chromatography (SEC) on a Superdex 75
column (GE Healthcare Life Sciences) equilibrated with 137 mM NaCl, 2.7 mM KCl, 10 mM Na2HPO4
and 2 mM KH2PO4 (pH 7.5). Fractions containing pure protein were analysed by SDS-PAGE.
5.7.5. Determining protein concentration
The protein concentration was determined with NanoDrop (Thermo Scientific, Wilmington, DE),
using the molecular weight and extinction coefficient, as determined with ProtParam (ExPASy) and
summarized in Table 9.
Table 9: Molecular parameters of the purified proteins.
5.8. SDS-PAGE
Proteins were analysed by SDS-PAGE (15 % gel). The preparation of the gels was perfomed as
described by Schägger (Schagger, 2006). For each analysed sample, 10 µl of the protein sample was
mixed with 10 µl Leammli buffer (2 % SDS, 10 % glycerol, 5 % 2-mercaptoethanol, 0.002 %
bromophenol blue and 6.25 mM Tris HCl). Subsequently, 10 µl was loaded on the gel.
5.9. Western blot
For immunological detection of the 6xHis-tag recombinant phage proteins, 10 µl of cell lysate
were separated by SDS-PAGE (15 % gel). After blotting to nitrocellulose and blocking with non-fat
dried milk, proteins, bound to the membrane, were detected by anti-His-Horse Radish Peroxidase
conjugated (HRP) antibodies (1:5000) and Novex® ECL (Invitrogen), consisting of a luminol and an
Protein Molecular weight (kDa) Extinction coefficient (M-1 cm-1)
ORF 197 24.8399 21890
ORF 201 23.1053 39670
ORF 203 29.7694 66810
5. Material and methods
59
enhancer for the detection of horse radish peroxidase. The proteins were visualised with
autoradiophotography.
5.10. Phage multiplication
Bacteriophage stocks were prepared using the double-agar overlay method as described in
Merabishvili et al. (2009). One millilitre of the phage preparation containing 105 plaque forming units
(pfu) of bacteriophages was mixed with 3 ml molten (45 °C) Select Alternative Protein Source (APS)
Luria Bertani (LB) (Becton Dickinson, Erembodegem, Belgium) top agar (0.6 %) and the host strain
suspension (end concentration of 108 cfu/ml) in a sterile 14 ml tube (Falcon, Becton Dickinson). This
mixture was plated onto freshly made ten 90 mm diameter Petri dishes (Plastiques Gosselin, Menen,
Belgium), filled with a bottom layer of 1.5 % APS LB agar and incubated aerobically at 32-37 °C for 16
h. Subsequently, 200 µl of chloroform was added to the lids of the Petri dishes and the plates were
further incubated at 4 °C for 1 h. The top layer was scraped off using a sterile Drigalski spatulum and
transferred to a sterile 14 ml tube.
5.11. Centrifugation of phages
The above harvested phages were centrifuged for 20 min at 6000g at 4 °C. The supernatant was
aspirated using a sterile 10 ml syringe (BD Plastipak, Becton Dickinson) with a 30 G sterile needle (BD
Microlance 3, Becton Dickinson) and passed through a 0.45 µm membrane filter (Sartorius Stedim).
The phage preparation was stored at 4 °C for at least 3 – 4 h or preferably overnight before
determining the phage titre. The titre of the phage lysate should, preferably, be checked on another
day which allows phage particles to disengage that may have clumped together during centrifugation
steps.
5.12. Determination of phage titre
The bacteriophage titre was determined by assaying decinormal serial dilutions (log(0) to log(-
12)) of the bacteriophage suspension with the overlay method (Merabishvili et al, 2009). One ml of
each dilution was mixed with 3 ml molten (45 °C) LB (Becton Dickinson, Erembodegem, Belgium) 0.6
% top agar (Bacto agar, Becton Dickinson) and the host strain (end concentration of 108 cfu/ml) in a
sterile 14 ml tube. This mixture was plated in triplicate onto 90 mm diameter Petri dishes filled with a
bottom layer of 1.5 ml LB agar and incubated for 16 h at 37 °C. To estimate the original
bacteriophage concentration, plates with one to 100 dinstinguishable homogenous plaques were
counted. The mean was then calculated for the triplicate plates.
5.13. Endotoxin purification
The different phage preparations were purified from endotoxins using a commercially available
kit (Endotrap Blue, Hyglos, Bernried am Starnberger Seen, Germany), according to the instructions of
the manufacturer. The endotoxin purified phage solution was collected in a 15 ml sterile Falcon.
Following endotoxin purification, the titre and sterility of the phage solution was determined.
5.14. PBMCs isolation and stimulation
Peripheral Blood Mononuclear Cells (PBMCs) were isolated from buffycoat (Rode Kruis
Vlaanderen), using a Lymphoprep (Axis-Shield, Dundee, Scotland) gradient. Fifty ml of the buffycoat
was added to 100 ml Hank’s Balanced Salt Solution, no calcium and no magnesium (HBSS)
(Invitrogen). Of this dilution, six aliquots of 25 ml were each added to 15 ml Lymphopreps, per 50 ml
Falcon tube. These mixtures were subsequently centrifuged at 500g for 20 min at room temperature.
The density gradient lead to a three phase solution: a lower red phase containing erythrocytes, a

5. Material and methods
60
transparent middle phase containing the lymphoprep and an upper layer containing the semi-
transparent plasma phase. The inner whitish ring of PBMCs, present between the lymphoprep and
plasma phase, was removed with a Pasteur pipette and transferred to 25 ml HBSS and centrifuged at
450g for 10 min at room temperature. The supernatans was removed and the cell pellet was
resuspended in 10 ml HBSS. All resuspended cells were pooled in a 50 ml Falcon tube and HBSS was
added to a total volume of 50 ml. A small fraction of this cell solution was used to count the number
of cells present, before it was centrifuged again at 350g for 10 min at room temperature.
The total number of cells was counted at a 1/20 dilution with a Bürker chamber and at a 10x40x
microscopic magnification, alternatively a Sysmex KX-12 can be used. The cell pellet was
resuspended in Heat inactivated fetal calf serum with 10 % dimethylsulfoxide (DMSO) to a
concentration 5x10⁷ cells/ml and divided in 1 ml aliquots before storing them in liquid nitrogen.
Dimethylsulfoxide can be used as a cryoprotectant, because, when added to the cell media, it
reduces the formation of ice crystals, thereby preventing cell death during the freezing process.
Approximately 10% may be used with a slow-freeze method, and the cells may be frozen at −80 °C or
stored in liquid nitrogen safely.
5.14.1. Determining cell viability
For the Staphylococcal Enterotoxin B (SEB) and bacteriophage stimulation, respectively one vial
of 5 x 10⁷ cells/ml was thawed in a water bath at 37 °C. Once the cells were thawed, they were
transferd to 9 ml HBSS, no calcium and no magnesium, and centrifuged at 350g for 10 min, to
remove the toxic DMSO. The cells were subsequently resuspended in 5 ml HBSS prior to the
determination of the total cell count and viability. The cells were counted with the Sysmex KX-12 (as
described by manufacturer) and the cell viability was determined with the propidium iodide (PI)
method.
To determine the cell viability, 80 µl of the cell suspension was added to 150 µl FACS flow and 25
µl propidium iodide (PI). Propidium iodide is a fluorescent molecule that intercalates with dsDNA,
whereby it can only bind DNA from dead and permeabilized cells. The complete mixture was
analysed with a FACS Canto (BD Biosciences, Franklin Lakes, New Jersey).
5.14.2. Staphylococcal Enterotoxin B (SEB) stimulation
The Staphylococcal Enterotoxin B (SEB) stimulation was performed at the Center for Vaccinology
(CEVAC), Ghent University Hospital (UZ Gent). Staphylococcal Enterotoxin B (SEB) is a superantigen
that causes the immune system to release a large amount of cytokines that lead to significant
inflammation. Microbial Superantigens (SAgs) are a family of proteins with particular structural and
sequence features that result in the shared ability to bypass the mechanisms of conventional, MHC-
restricted, antigen processing (Marrack & Kappler, 1990). Conventional antigens are processed
within antigen-presenting cells such as monocytes into peptide fragments that are loaded into the
peptide binding groove of the MHC class II molecule for presentation at the cell surface to T cells. T
cells will only respond if they recognise the class II molecule through CD4 and the specific peptide
being presented. Thus only a tiny fraction of the host's T-cell repertoire (<0.01%) will be activated. By
contrast, Superantigens bind, as intact proteins, directly to the MHC class II molecule and to the T-
cell receptor, extracellularly, at sites away from conventional peptide-binding sites.
By binding to the T-cell receptor and the MHC class II molecule on antigen-presenting cells,
superantigens trigger T-cell activation that results in the release of proinflammatory cytokines,
initially tumour necrosis factor alpha (TNF-α), followed by interleukin 6 (IL-6), interferon gamma (IFN-
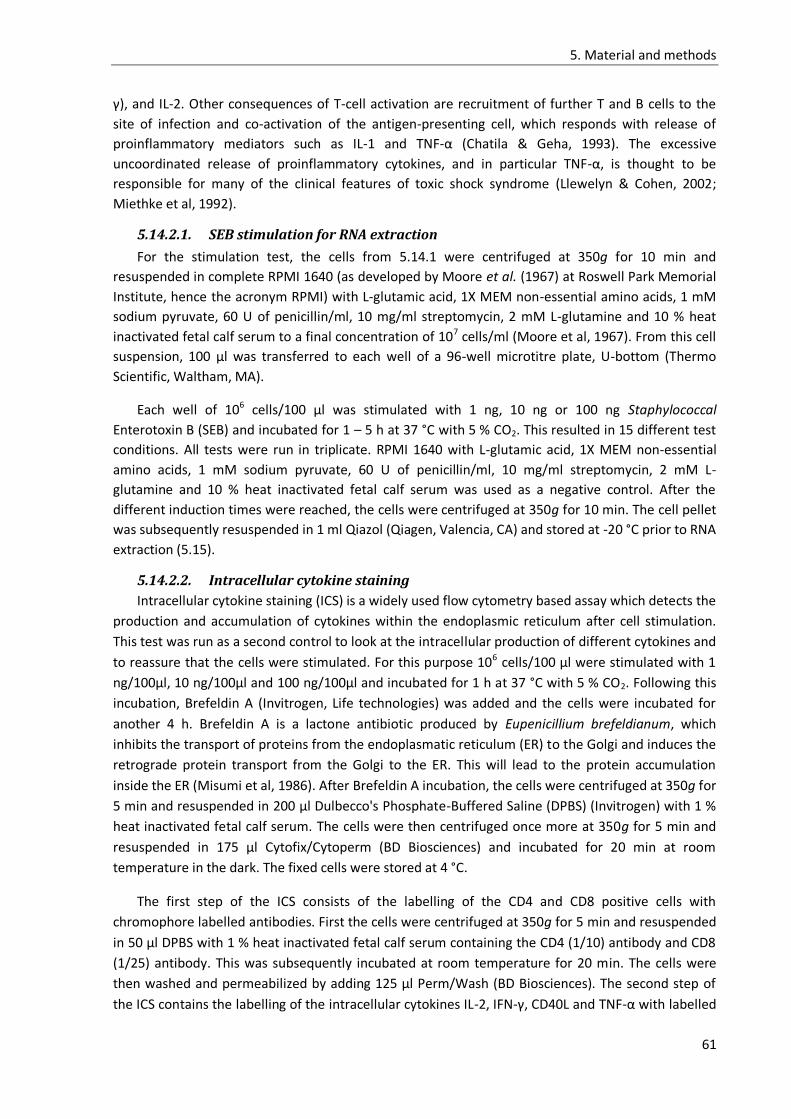
5. Material and methods
61
γ), and IL-2. Other consequences of T-cell activation are recruitment of further T and B cells to the
site of infection and co-activation of the antigen-presenting cell, which responds with release of
proinflammatory mediators such as IL-1 and TNF-α (Chatila & Geha, 1993). The excessive
uncoordinated release of proinflammatory cytokines, and in particular TNF-α, is thought to be
responsible for many of the clinical features of toxic shock syndrome (Llewelyn & Cohen, 2002;
Miethke et al, 1992).
5.14.2.1. SEB stimulation for RNA extraction
For the stimulation test, the cells from 5.14.1 were centrifuged at 350g for 10 min and
resuspended in complete RPMI 1640 (as developed by Moore et al. (1967) at Roswell Park Memorial
Institute, hence the acronym RPMI) with L-glutamic acid, 1X MEM non-essential amino acids, 1 mM
sodium pyruvate, 60 U of penicillin/ml, 10 mg/ml streptomycin, 2 mM L-glutamine and 10 % heat
inactivated fetal calf serum to a final concentration of 107 cells/ml (Moore et al, 1967). From this cell
suspension, 100 µl was transferred to each well of a 96-well microtitre plate, U-bottom (Thermo
Scientific, Waltham, MA).
Each well of 106 cells/100 µl was stimulated with 1 ng, 10 ng or 100 ng Staphylococcal
Enterotoxin B (SEB) and incubated for 1 – 5 h at 37 °C with 5 % CO2. This resulted in 15 different test
conditions. All tests were run in triplicate. RPMI 1640 with L-glutamic acid, 1X MEM non-essential
amino acids, 1 mM sodium pyruvate, 60 U of penicillin/ml, 10 mg/ml streptomycin, 2 mM L-
glutamine and 10 % heat inactivated fetal calf serum was used as a negative control. After the
different induction times were reached, the cells were centrifuged at 350g for 10 min. The cell pellet
was subsequently resuspended in 1 ml Qiazol (Qiagen, Valencia, CA) and stored at -20 °C prior to RNA
extraction (5.15).
5.14.2.2. Intracellular cytokine staining
Intracellular cytokine staining (ICS) is a widely used flow cytometry based assay which detects the
production and accumulation of cytokines within the endoplasmic reticulum after cell stimulation.
This test was run as a second control to look at the intracellular production of different cytokines and
to reassure that the cells were stimulated. For this purpose 106 cells/100 µl were stimulated with 1
ng/100µl, 10 ng/100µl and 100 ng/100µl and incubated for 1 h at 37 °C with 5 % CO2. Following this
incubation, Brefeldin A (Invitrogen, Life technologies) was added and the cells were incubated for
another 4 h. Brefeldin A is a lactone antibiotic produced by Eupenicillium brefeldianum, which
inhibits the transport of proteins from the endoplasmatic reticulum (ER) to the Golgi and induces the
retrograde protein transport from the Golgi to the ER. This will lead to the protein accumulation
inside the ER (Misumi et al, 1986). After Brefeldin A incubation, the cells were centrifuged at 350g for
5 min and resuspended in 200 µl Dulbecco's Phosphate-Buffered Saline (DPBS) (Invitrogen) with 1 %
heat inactivated fetal calf serum. The cells were then centrifuged once more at 350g for 5 min and
resuspended in 175 µl Cytofix/Cytoperm (BD Biosciences) and incubated for 20 min at room
temperature in the dark. The fixed cells were stored at 4 °C.
The first step of the ICS consists of the labelling of the CD4 and CD8 positive cells with
chromophore labelled antibodies. First the cells were centrifuged at 350g for 5 min and resuspended
in 50 µl DPBS with 1 % heat inactivated fetal calf serum containing the CD4 (1/10) antibody and CD8
(1/25) antibody. This was subsequently incubated at room temperature for 20 min. The cells were
then washed and permeabilized by adding 125 µl Perm/Wash (BD Biosciences). The second step of
the ICS contains the labelling of the intracellular cytokines IL-2, IFN-γ, CD40L and TNF-α with labelled

5. Material and methods
62
specific antibodies. The cells were centrifuged at 350g for 5 min and resuspended in 50 µl
Perm/Wash with the antibodies IL-2 (1/400), IFN-γ (1/200), CD40L (1/20) and TNF-α (1/20). This cell
suspension was incubated in the dark for 20 min at room temperature. The cells were washed by
adding 125 µl Perm/Wash, centrifuged at 350g for 5 min and resuspended in 150 µl DPBS with 1 %
heat inactivated fetal calf serum. This cell suspension was analysed on a FACS Canto.
5.15. RNA extraction
The frozen cell lysate was thawed on ice. To this 1 ml suspension, 0.2 ml chloroform was
added. This mixture was vigorously shaken by hand for 10 seconds. This mixture was incubated at
room temperature for 2 min before centrifugation at 12000g for 15 min. This leads to 2 phases,
where the upper aqueous phase contains the nucleic acids (i.e. RNA). This upper phase
(approximately 600 µl) was transferred to a sterile, RNase free 1.5 ml Eppendorf tube and an equal
volume of 70 % ethanol was added. This entire preparation was loaded on a Spin Cartridge (PureLink
RNA mini kit, Invitrogen), as described by the manufacturer. To remove contaminating DNA, an on
column DNase treatment was performed. For this purpose, 3 U/µl was added to DNase Reaction
buffer and RNase Free water in a final volume of 80 µl, as described by the manufacturer (Promega,
Madison, Wisconsin). Before eluating the RNA, the column was washed, as described by the
manufacturer to remove the DNase. The RNA was finally eluated in 30 µl RNase free water and
stored at -20 °C or immediately used for reverse transcription (RT), see 5.17.
Alternatively, before the RNA was eluated and without a DNase digest, the column was
washed, as described by the manufacturer to remove contaminants such as DNA. The RNA was finally
eluated in 30 µl RNase free water and stored at -20 °C or immediately used in a separate DNase
digest (see 5.16).
5.16. DNase digest
To remove DNA contaminants from the RNA sample, a DNase digest (Promega, Mannheim,
Germany) was performed. From the RNA sample, 5 µl was taken and added to 1 µl of DNase (1 U/µl),
1 µl 10X DNase reaction buffer and finally RNase free H2O was added up to a final volume of 10 µl.
This mixture was incubated for 30 min at 37 °C. The DNase reaction was terminated by adding 1 µl of
DNase Stop Solution and incubating the mixture at 65 °C for 10 min. The DNA digested RNA sample
was subsequently used for reverse transcription (see 5.17).
5.17. cDNA synthesis
The cDNA synthesis was performed using the Quantitec reverse transcription kit (Qiagen). As
described by the manufacturer, 1 µg of RNA was used in a total reaction volume of 20 µl. The reverse
transcriptase allows the production of cDNA from an RNA template. The reverse transcription was
performed at 42 °C for 15 min, followed by an inactivation of the reverse transcriptase by heating at
95 °C for 3 min. The cDNA template was stored at -20 °C before use in the reverse transcriptase
quantitative PCR (RT-qPCR) (5.18).
5.18. Reverse transcriptase quantitative polymerase chain reaction (RT-
qPCR)
To determine the amount of cytokines (i.e. IL-10 and TNF-α) that are produced, a
comparative reverse transcriptase quantitative polymerase chain reaction (RT-qPCR) was performed.
Hereby, the different test conditions are normalized against a household gene (i.e. β-actin). From the
cDNA (see 5.17), 2.5 µl was added to a mixture of 5 µl of LC 480 Probes Master mix (Roche Applied
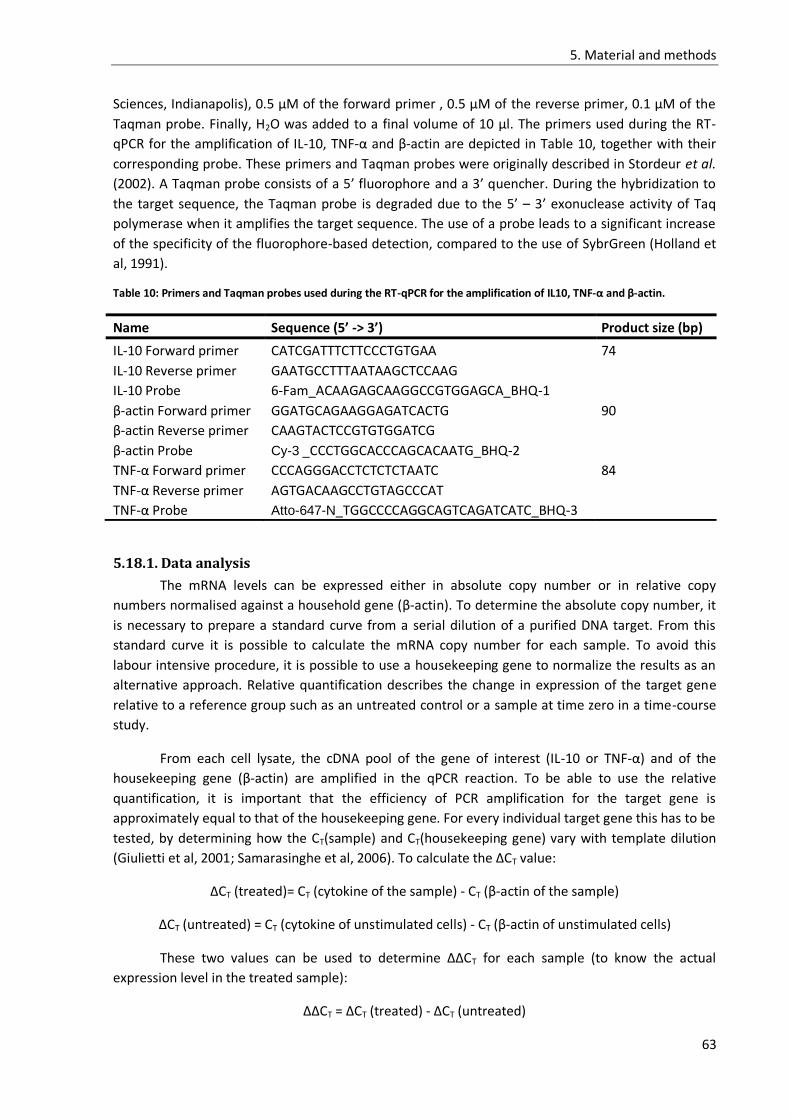
5. Material and methods
63
Sciences, Indianapolis), 0.5 µM of the forward primer , 0.5 µM of the reverse primer, 0.1 µM of the
Taqman probe. Finally, H2O was added to a final volume of 10 µl. The primers used during the RT-
qPCR for the amplification of IL-10, TNF-α and β-actin are depicted in Table 10, together with their
corresponding probe. These primers and Taqman probes were originally described in Stordeur et al.
(2002). A Taqman probe consists of a 5’ fluorophore and a 3’ quencher. During the hybridization to
the target sequence, the Taqman probe is degraded due to the 5’ – 3’ exonuclease activity of Taq
polymerase when it amplifies the target sequence. The use of a probe leads to a significant increase
of the specificity of the fluorophore-based detection, compared to the use of SybrGreen (Holland et
al, 1991).
Table 10: Primers and Taqman probes used during the RT-qPCR for the amplification of IL10, TNF-α and β-actin.
Name Sequence (5’ -> 3’) Product size (bp)
IL-10 Forward primer CATCGATTTCTTCCCTGTGAA 74
IL-10 Reverse primer GAATGCCTTTAATAAGCTCCAAG
IL-10 Probe 6-Fam_ACAAGAGCAAGGCCGTGGAGCA_BHQ-1
β-actin Forward primer GGATGCAGAAGGAGATCACTG 90
β-actin Reverse primer CAAGTACTCCGTGTGGATCG
β-actin Probe Cy-3 _CCCTGGCACCCAGCACAATG_BHQ-2
TNF-α Forward primer CCCAGGGACCTCTCTCTAATC 84
TNF-α Reverse primer AGTGACAAGCCTGTAGCCCAT
TNF-α Probe Atto-647-N_TGGCCCCAGGCAGTCAGATCATC_BHQ-3
5.18.1. Data analysis
The mRNA levels can be expressed either in absolute copy number or in relative copy
numbers normalised against a household gene (β-actin). To determine the absolute copy number, it
is necessary to prepare a standard curve from a serial dilution of a purified DNA target. From this
standard curve it is possible to calculate the mRNA copy number for each sample. To avoid this
labour intensive procedure, it is possible to use a housekeeping gene to normalize the results as an
alternative approach. Relative quantification describes the change in expression of the target gene
relative to a reference group such as an untreated control or a sample at time zero in a time-course
study.
From each cell lysate, the cDNA pool of the gene of interest (IL-10 or TNF-α) and of the
housekeeping gene (β-actin) are amplified in the qPCR reaction. To be able to use the relative
quantification, it is important that the efficiency of PCR amplification for the target gene is
approximately equal to that of the housekeeping gene. For every individual target gene this has to be
tested, by determining how the CT(sample) and CT(housekeeping gene) vary with template dilution
(Giulietti et al, 2001; Samarasinghe et al, 2006). To calculate the ΔCT value:
ΔCT (treated)= CT (cytokine of the sample) - CT (β-actin of the sample)
ΔCT (untreated) = CT (cytokine of unstimulated cells) - CT (β-actin of unstimulated cells)
These two values can be used to determine ΔΔCT for each sample (to know the actual
expression level in the treated sample):
ΔΔCT = ΔCT (treated) - ΔCT (untreated)
5. Material and methods
64
To compare the different treatments:
The relative number of target mRNAs (fold change) = 2(-ΔΔCT
)
This formula is only valid when the amplification efficiency of both fragments is
approximately equal. This is determined by a serial dilution of the cDNA. The dilution is plotted in the
X-axis, whereas the CT is plotted in the Y axis. If the absolute value of the slope is close to one, the
efficiencies of the target and reference gene are similar, and the ΔΔCT calculation for the relative
quantification of the target may be used (Livak & Schmittgen, 2001; Stordeur et al, 2002).
Using the 2(-ΔΔCT
) calculation, the data are presented as the fold change in gene expression
normalized to an endogenous reference gene and relative to an untreated control. For the untreated
control sample, ΔΔCT equals zero and 20 equals one, so that the fold change in gene expression
relative to the untreated control equals 1, by definition. For treated samples, the calculation of 2(-
ΔΔCT
) indicates the fold change in gene expression relative to the untreated control. Normalizing to an
endogenous reference provides a method for correcting results for differing amounts of input mRNA.
One hallmark of the 2(-ΔΔCT
) method is that it uses data generated as part of the real-time PCR
experiment to perform this normalization function (Livak & Schmittgen, 2001).
To test the effect of concentration and time on the expression (fold change) of TNF-α, we
performed an analysis of variance (ANOVA) (SAS v9.3). For this test the ΔΔCT values were calculated
for each replicate separately.
65
References Ackermann HW (1998) Tailed bacteriophages: the order caudovirales. Adv Virus Res 51: 135-201
Ackermann HW (2003) Bacteriophage observations and evolution. Res Microbiol 154: 245-251
Andersson DI, Hughes D (2010) Antibiotic resistance and its cost: is it possible to reverse resistance? Nat Rev Microbiol 8: 260-271
Bamford DH, Caldentey J, Bamford JK (1995) Bacteriophage PRD1: a broad host range DSDNA tectivirus with an internal membrane. Adv Virus Res 45: 281-319
Bamford JK, Bamford DH, Li T, Thomas GJ, Jr. (1993) Structural studies of the enveloped dsRNA bacteriophage phi 6 of Pseudomonas syringae by Raman spectroscopy. II. Nucleocapsid structure and thermostability of the virion, nucleocapsid and polymerase complex. J Mol Biol 230: 473-482
Barber M, Rozwadowska-Dowzenko M (1948) Infection by penicillin-resistant staphylococci. Lancet 2: 641-644
Bayliss CD, Moxon ER (2002) Hypermutation and bacterial adaptation. Asm News 68: 549-555
Bernhardt TG, Struck DK, Young R (2001a) The lysis protein E of phi X174 is a specific inhibitor of the MraY-catalyzed step in peptidoglycan synthesis. J Biol Chem 276: 6093-6097
Bernhardt TG, Wang IN, Struck DK, Young R (2001b) A protein antibiotic in the phage Qbeta virion: diversity in lysis targets. Science 292: 2326-2329
Biswas B, Adhya S, Washart P, Paul B, Trostel AN, Powell B, Carlton R, Merril CR (2002) Bacteriophage therapy rescues mice bacteremic from a clinical isolate of vancomycin-resistant Enterococcus faecium. Infect Immun 70: 204-210
Blasi U, Chang CY, Zagotta MT, Nam KB, Young R (1990) The lethal lambda S gene encodes its own inhibitor. EMBO J 9: 981-989
Blasi U, Nam K, Hartz D, Gold L, Young R (1989) Dual translational initiation sites control function of the lambda S gene. EMBO J 8: 3501-3510
Bone RC (1994) Gram-positive organisms and sepsis. Arch Intern Med 154: 26-34
Borysowski J, Weber-Dabrowska B, Gorski A (2006) Bacteriophage endolysins as a novel class of antibacterial agents. Exp Biol Med (Maywood) 231: 366-377
Bradley DE (1967) Ultrastructure of bacteriophage and bacteriocins. Bacteriol Rev 31: 230-314
Buffie CG, Jarchum I, Equinda M, Lipuma L, Gobourne A, Viale A, Ubeda C, Xavier J, Pamer EG (2012) Profound alterations of intestinal microbiota following a single dose of clindamycin results in sustained susceptibility to Clostridium difficile-induced colitis. Infect Immun 80: 62-73
Carlton RM (1999) Phage therapy: past history and future prospects. Arch Immunol Ther Exp (Warsz) 47: 267-274

References
66
Chamberland C (1884) Sur un filtre donnant de l’eau physiologiquement pure. Compt Rend Acad Sc Paris 49: 247
Chambers HF (1997) Methicillin resistance in staphylococci: molecular and biochemical basis and clinical implications. Clinical Microbiology Reviews 10: 781-791
Chatila T, Geha RS (1993) Signal transduction by microbial superantigens via MHC class II molecules. Immunol Rev 131: 43-59
Cheng Q, Nelson D, Zhu S, Fischetti VA (2005) Removal of group B streptococci colonizing the vagina and oropharynx of mice with a bacteriophage lytic enzyme. Antimicrob Agents Chemother 49: 111-117
Cheng X, Zhang X, Pflugrath JW, Studier FW (1994) The structure of bacteriophage T7 lysozyme, a zinc amidase and an inhibitor of T7 RNA polymerase. Proc Natl Acad Sci U S A 91: 4034-4038
Croux C, Ronda C, Lopez R, Garcia JL (1993) Interchange of functional domains switches enzyme specificity: construction of a chimeric pneumococcal-clostridial cell wall lytic enzyme. Mol Microbiol 9: 1019-1025
Cui SS, Lin XZ, Shen JH (2011) Effects of co-expression of molecular chaperones on heterologous soluble expression of the cold-active lipase Lip-948. Protein Expres Purif 77: 166-172
d’Herelle F (1911a) Sur une épizootie de nature bactérienne sévissant sur les sauterelles au Mexique. Comptes rendus Acad Sci Paris 152: 1413-1415
d’Herelle F (1911b) Sur une épizootie de nature bactérienne sévissant sur les sauterelles au Mexique. J d’Agricult tropicale 11: 238-240
d’Herelle F (1916) Contribution à l’étude de la dysentérie. Nouveaux bacilles dysentériques, pathogènes pour les animaux d’expérience. Bulletin de l’Académie de Médecine 76: 425-428
d’Herelle F (1917) Sur un microbe invisible antagoniste des bacilles dysentériques. Comptes rendus Acad Sci Paris 165: 373-375
d’Herelle F (1918) Technique de la recherche du microbe filtrant bactériophage (Bacteriophagum intestinale). Comptes rendus Soc biol Paris 81: 1060-1062
D’Herelle F (1921) Le bactériophage - son rôle dans l’immunité. Paris: Masson et Cie Editeurs
D’Herelle F (1931) Bacterial mutations. Yale J Biol Med 4: 455-461
d’Hérelle F (1918) Technique de la recherche du microbe filtrant bactériophage (Bacteriophagum intestinale). C R Soc Biol 81: 1160–1162
Datta N, Faiers MC, Reeves DS, Brumfitt W, Orskov F, Orskov I (1971) R Factors in Escherichia coli in faeces after oral chemotherapy in general practice. Lancet 1: 312-315
de Marco A, De Marco V (2004) Bacteria co-transformed with recombinant proteins and chaperones cloned in independent plasmids are suitable for expression tuning. J Biotechnol 109: 45-52
References
67
Dehbi M, Moeck G, Arhin FF, Bauda P, Bergeron D, Kwan T, Liu J, McCarty J, Dubow M, Pelletier J (2009) Inhibition of transcription in Staphylococcus aureus by a primary sigma factor-binding polypeptide from phage G1. J Bacteriol 191: 3763-3771
Drake TA, Pang M (1988) Staphylococcus aureus induces tissue factor expression in cultured human cardiac valve endothelium. J Infect Dis 157: 749-756
Drexler K, Dannull J, Hindennach I, Mutschler B, Henning U (1991) Single mutations in a gene for a tail fiber component of an Escherichia coli phage can cause an extension from a protein to a carbohydrate as a receptor. J Mol Biol 219: 655-663
Drexler K, Riede I, Montag D, Eschbach ML, Henning U (1989) Receptor specificity of the Escherichia coli T-even type phage Ox2. Mutational alterations in host range mutants. J Mol Biol 207: 797-803
Dublanchet A, Bourne S (2007) The epic of phage therapy. Can J Infect Dis Med Microbiol 18: 15-18
Duckworth DH (1976) "Who discovered bacteriophage?". Bacteriol Rev 40: 793-802
Fahnert B, Lilie H, Neubauer P (2004) Inclusion bodies: formation and utilisation. Adv Biochem Eng Biotechnol 89: 93-142
Fenton M, Ross P, McAuliffe O, O'Mahony J, Coffey A (2010) Recombinant bacteriophage lysins as antibacterials. Bioeng Bugs 1: 9-16
Fischetti VA (2003) Novel method to control pathogenic bacteria on human mucous membranes. Ann N Y Acad Sci 987: 207-214
Fischetti VA (2005) Bacteriophage lytic enzymes: novel anti-infectives. Trends Microbiol 13: 491-496
Fruciano DE, Bourne S (2007) Phage as an antimicrobial agent: d'Herelle's heretical theories and their role in the decline of phage prophylaxis in the West. Can J Infect Dis Med Microbiol 18: 19-26
Gaeng S, Scherer S, Neve H, Loessner MJ (2000) Gene cloning and expression and secretion of Listeria monocytogenes bacteriophage-lytic enzymes in Lactococcus lactis. Appl Environ Microbiol 66: 2951-2958
Gautier M, Rouault A, Sommer P, Briandet R (1995) Occurrence of Propionibacterium freudenreichii bacteriophages in swiss cheese. Appl Environ Microbiol 61: 2572-2576
Giulietti A, Overbergh L, Valckx D, Decallonne B, Bouillon R, Mathieu C (2001) An overview of real-time quantitative PCR: applications to quantify cytokine gene expression. Methods 25: 386-401
Gorski A, Miedzybrodzki R, Borysowski J, Dabrowska K, Wierzbicki P, Ohams M, Korczak-Kowalska G, Olszowska-Zaremba N, Lusiak-Szelachowska M, Klak M, Jonczyk E, Kaniuga E, Golas A, Purchla S, Weber-Dabrowska B, Letkiewicz S, Fortuna W, Szufnarowski K, Pawelczyk Z, Rogoz P, Klosowska D (2012a) Phage as a Modulator of Immune Responses: Practical Implications for Phage Therapy. Advances in Virus Research, Vol 83: Bacteriophages, Pt B 83: 41-71
Gorski A, Miedzybrodzki R, Borysowski J, Dabrowska K, Wierzbicki P, Ohams M, Korczak-Kowalska G, Olszowska-Zaremba N, Łusiak-Szelachowska M, Kłak M, Jonczyk E, Kaniuga E, Gołas A, Purchla S, Weber-Dabrowska B, Letkiewicz S, Fortuna W, Szufnarowski K, Pawełczyk Z, Rogoz P, Kłosowska D (2012b) Advances in Virus Research, Vol. Vol. 83: Elsevier.
References
68
Gorski A, Miedzybrodzki R, Borysowski J, Weber-Dabrowska B, Lobocka M, Fortuna W, Letkiewicz S, Zimecki M, Filby G (2009) Bacteriophage therapy for the treatment of infections. Curr Opin Investig Drugs 10: 766-774
Gorski A, Nowaczyk M, Weber-Dabrowska B, Kniotek M, Boratynski J, Ahmed A, Dabrowska K, Wierzbicki P, Switala-Jelen K, Opolski A (2003) New insights into the possible role of bacteriophages in transplantation. Transplant Proc 35: 2372-2373
Gragerov A, Nudler E, Komissarova N, Gaitanaris GA, Gottesman ME, Nikiforov V (1992) Cooperation of Groel/Groes and Dnak/Dnaj Heat-Shock Proteins in Preventing Protein Misfolding in Escherichia-Coli. P Natl Acad Sci USA 89: 10341-10344
Grundling A, Manson MD, Young R (2001) Holins kill without warning. Proc Natl Acad Sci U S A 98: 9348-9352
Guarner F, Malagelada JR (2003) Gut flora in health and disease. Lancet 361: 512-519
Hamill RJ, Vann JM, Proctor RA (1986) Phagocytosis of Staphylococcus aureus by cultured bovine aortic endothelial cells: model for postadherence events in endovascular infections. Infect Immun 54: 833-836
Harper DR, Enright MC (2011) Bacteriophages for the treatment of Pseudomonas aeruginosa infections. J Appl Microbiol 111: 1-7
Hartl FU (1996) Molecular chaperones in cellular protein folding. Nature 381: 571-580
Hartman BJ, Tomasz A (1984) Low-affinity penicillin-binding protein associated with beta-lactam resistance in Staphylococcus aureus. J Bacteriol 158: 513-516
Hawkey PM (1998) The origins and molecular basis of antibiotic resistance. BMJ 317: 657-660
Hermoso JA, Monterroso B, Albert A, Galan B, Ahrazem O, Garcia P, Martinez-Ripoll M, Garcia JL, Menendez M (2003) Structural basis for selective recognition of pneumococcal cell wall by modular endolysin from phage Cp-1. Structure 11: 1239-1249
Heumann D, Barras C, Severin A, Glauser MP, Tomasz A (1994) Gram-positive cell walls stimulate synthesis of tumor necrosis factor alpha and interleukin-6 by human monocytes. Infect Immun 62: 2715-2721
Higashibata A, Szewczyk NJ, Conley CA, Imamizo-Sato M, Higashitani A, Ishioka N (2006) Decreased expression of myogenic transcription factors and myosin heavy chains in Caenorhabditis elegans muscles developed during spaceflight. J Exp Biol 209: 3209-3218
Hiramatsu K (1998) Vancomycin resistance in staphylococci. Drug Resist Updat 1: 135-150
Hiramatsu K (2001) Vancomycin-resistant Staphylococcus aureus: a new model of antibiotic resistance. Lancet Infect Dis 1: 147-155
Ho K (2001) Bacteriophage therapy for bacterial infections. Rekindling a memory from the pre-antibiotics era. Perspect Biol Med 44: 1-16
Holland PM, Abramson RD, Watson R, Gelfand DH (1991) Detection of specific polymerase chain reaction product by utilizing the 5'----3' exonuclease activity of Thermus aquaticus DNA polymerase. Proc Natl Acad Sci U S A 88: 7276-7280

References
69
Hughes JM (2011) Preserving the lifesaving power of antimicrobial agents. JAMA 305: 1027-1028
Ito T, Okuma K, Ma XX, Yuzawa H, Hiramatsu K (2003) Insights on antibiotic resistance of Staphylococcus aureus from its whole genome: genomic island SCC. Drug Resist Updat 6: 41-52
Jacob F, Fuerst CR (1958) The mechanism of lysis by phage studied with defective lysogenic bacteria. J Gen Microbiol 18: 518-526
Jevons MP, Coe AW, Parker MT (1963) Methicillin resistance in staphylococci. Lancet 1: 904-907
Jhamb K, Jawed A, Sahoo DK (2008) Immobilized chaperones: A productive alternative to refolding of bacterial inclusion body proteins. Process Biochem 43: 587-597
Jhamb K, Sahoo DK (2012) Production of soluble recombinant proteins in Escherichia coli: effects of process conditions and chaperone co-expression on cell growth and production of xylanase. Bioresour Technol 123: 135-143
Jonasson P, Liljeqvist S, Nygren PA, Stahl S (2002) Genetic design for facilitated production and recovery of recombinant proteins in Escherichia coli. Biotechnol Appl Biochem 35: 91-105
Kanamaru S, Ishiwata Y, Suzuki T, Rossmann MG, Arisaka F (2005) Control of bacteriophage T4 tail lysozyme activity during the infection process. J Mol Biol 346: 1013-1020
Katayama Y, Ito T, Hiramatsu K (2000) A new class of genetic element, staphylococcus cassette chromosome mec, encodes methicillin resistance in Staphylococcus aureus. Antimicrob Agents Chemother 44: 1549-1555
Katial RK, Sachanandani D, Pinney C, Lieberman MM (1998) Cytokine production in cell culture by peripheral blood mononuclear cells from immunocompetent hosts. Clin Diagn Lab Immunol 5: 78-81
Keen EC (2012) Phage therapy: concept to cure. Front Microbiol 3: 238
Kim AY, Blaschek HP (1991) Isolation and characterization of a filamentous viruslike particle from Clostridium acetobutylicum NCIB 6444. J Bacteriol 173: 530-535
Kim YW, Zhao RJ, Park SJ, Lee JR, Cho IJ, Yang CH, Kim SG, Kim SC (2008) Anti-inflammatory effects of liquiritigenin as a consequence of the inhibition of NF-kappaB-dependent iNOS and proinflammatory cytokines production. Br J Pharmacol 154: 165-173
King AMQ, Lefkowitz E, Adams MJ, Carstens EB (2011) Virus Taxonomy: Ninth Report of the International Committee on Taxonomy of Viruses.
Kuchment A (2012) The Forgotten Cure: The Past and Future of Phage Therapy, First edn.: Springer.
Kusukawa N, Yura T (1988) Heat-Shock Protein Groe of Escherichia-Coli - Key Protective Roles against Thermal-Stress. Gene Dev 2: 874-882
Kutateladze M, Adamia R (2010) Bacteriophages as potential new therapeutics to replace or supplement antibiotics. Trends Biotechnol 28: 591-595
References
70
Kwan T, Liu J, DuBow M, Gros P, Pelletier J (2005) The complete genomes and proteomes of 27 Staphylococcus aureus bacteriophages. Proc Natl Acad Sci U S A 102: 5174-5179
Larckum N (1932) Bacteriophage in clinical medicine. J Lab Clin Med 17: 675
Levy S (2002a) The Antibiotic Paradox: How the Misuse of Antibiotics Destroys Their Curative Powers: Perseus Cambridge.
Levy SB (1982) Microbial resistance to antibiotics. An evolving and persistent problem. Lancet 2: 83-88
Levy SB (1985) Ecology of plasmids and unique DNA sequences, Washington DC: ASM Press.
Levy SB (1992) Active efflux mechanisms for antimicrobial resistance. Antimicrob Agents Chemother 36: 695-703
Levy SB (1994) Balancing the drug-resistance equation. Trends Microbiol 2: 341-342
Levy SB (1998) The challenge of antibiotic resistance. Sci Am 278: 46-53
Levy SB (2002b) The 2000 Garrod lecture. Factors impacting on the problem of antibiotic resistance. J Antimicrob Chemother 49: 25-30
Levy SB, Marshall B (2004) Antibacterial resistance worldwide: causes, challenges and responses. Nat Med 10: S122-129
Levy SB, Miller RV (eds) (1989) Gene Transfer in the Environment. New York: McGraw Hill
Liljeqvist TG, Andresen D, Zuo Y, Weston C (2012) Bug breakfast in the Bulletin: antimicrobial resistance: moving forward to the past. N S W Public Health Bull 23: 37
Liu W, Saint DA (2002) A new quantitative method of real time reverse transcription polymerase chain reaction assay based on simulation of polymerase chain reaction kinetics. Anal Biochem 302: 52-59
Livak KJ, Schmittgen TD (2001) Analysis of relative gene expression data using real-time quantitative PCR and the 2(-Delta Delta C(T)) Method. Methods 25: 402-408
Livermore DM (2000) Antibiotic resistance in staphylococci. Int J Antimicrob Agents 16 Suppl 1: S3-10
Livermore DM (2005) Minimising antibiotic resistance. Lancet Infect Dis 5: 450-459
Livermore DM (2007) Introduction: the challenge of multiresistance. Int J Antimicrob Agents 29 Suppl 3: S1-7
Llewelyn M, Cohen J (2002) Superantigens: microbial agents that corrupt immunity. Lancet Infect Dis 2: 156-162
Loeffler JM, Djurkovic S, Fischetti VA (2003) Phage lytic enzyme Cpl-1 as a novel antimicrobial for pneumococcal bacteremia. Infect Immun 71: 6199-6204
Loeffler JM, Nelson D, Fischetti VA (2001) Rapid killing of Streptococcus pneumoniae with a bacteriophage cell wall hydrolase. Science 294: 2170-2172
References
71
Loessner MJ (2005) Bacteriophage endolysins--current state of research and applications. Curr Opin Microbiol 8: 480-487
Loessner MJ, Kramer K, Ebel F, Scherer S (2002) C-terminal domains of Listeria monocytogenes bacteriophage murein hydrolases determine specific recognition and high-affinity binding to bacterial cell wall carbohydrates. Mol Microbiol 44: 335-349
Loessner MJ, Maier SK, Daubek-Puza H, Wendlinger G, Scherer S (1997) Three Bacillus cereus bacteriophage endolysins are unrelated but reveal high homology to cell wall hydrolases from different bacilli. J Bacteriol 179: 2845-2851
Lopez R, Garcia E, Garcia P, Garcia JL (1997) The pneumococcal cell wall degrading enzymes: a modular design to create new lysins? Microb Drug Resist 3: 199-211
Low LY, Yang C, Perego M, Osterman A, Liddington RC (2005) Structure and lytic activity of a Bacillus anthracis prophage endolysin. J Biol Chem 280: 35433-35439
Lowy FD (1998a) Staphylococcus aureus infections. N Engl J Med 339: 520-532
Lowy FD (1998b) Staphylococcus aureus infections. New Engl J Med 339: 520–532
Lu TK, Koeris MS (2011) The next generation of bacteriophage therapy. Curr Opin Microbiol 14: 524-531
Lwoff A, Horne R, Tournier P (1962) A system of viruses. Cold Spring Harb Symp Quant Biol 27: 51-55
Lyon BR, Skurray R (1987) Antimicrobial resistance of Staphylococcus aureus: genetic basis. Microbiol Rev 51: 88-134
MacNeal WJ, Frisbee FC (1936) One hundred patients with staphylococcal septicemia receiving bacteriophage service. Am J Med Sci 191: 195
Maniloff J, Ackermann HW (1998) Taxonomy of bacterial viruses: establishment of tailed virus genera and the order Caudovirales. Arch Virol 143: 2051-2063
Marrack P, Kappler J (1990) The staphylococcal enterotoxins and their relatives. Science 248: 1066
Martinez-Alonso M, Garcia-Fruitos E, Ferrer-Miralles N, Rinas U, Villaverde A (2010) Side effects of chaperone gene co-expression in recombinant protein production. Microbial Cell Factories 9
Marwick C (2000) Merits, flaws of live virus flu vaccine debated. JAMA 283: 1814-1815
Matsuda T, Freeman TA, Hilbert DW, Duff M, Fuortes M, Stapleton PP, Daly JM (2005) Lysis-deficient bacteriophage therapy decreases endotoxin and inflammatory mediator release and improves survival in a murine peritonitis model. Surgery 137: 639-646
Matsuzaki S, Rashel M, Uchiyama J, Sakurai S, Ujihara T, Kuroda M, Ikeuchi M, Tani T, Fujieda M, Wakiguchi H, Imai S (2005) Bacteriophage therapy: a revitalized therapy against bacterial infectious diseases. J Infect Chemother 11: 211-219
Mayer BJ (2001) SH3 domains: complexity in moderation. J Cell Sci 114: 1253-1263
References
72
Mcvay CS, Velasquez M, Fralick JA (2007a) Phage therapy of Pseudomonas aeruginosa infection in a mouse burn wound model. Antimicrob Agents Ch 51: 1934-1938
McVay CS, Velasquez M, Fralick JA (2007b) Phage therapy of Pseudomonas aeruginosa infection in a mouse burn wound model. Antimicrob Agents Chemother 51: 1934-1938
Merabishvili M, Pirnay JP, Verbeken G, Chanishvili N, Tediashvili M, Lashkhi N, Glonti T, Krylov V, Mast J, Van Parys L, Lavigne R, Volckaert G, Mattheus W, Verween G, De Corte P, Rose T, Jennes S, Zizi M, De Vos D, Vaneechoutte M (2009) Quality-controlled small-scale production of a well-defined bacteriophage cocktail for use in human clinical trials. PLoS One 4: e4944
Merril CR, Scholl D, Adhya SL (2003) The prospect for bacteriophage therapy in Western medicine. Nat Rev Drug Discov 2: 489-497
Michel M, Gutmann L (1997) Methicillin-resistant Staphylococcus aureus and vancomycin-resistant enterococci: therapeutic realities and possibilities. Lancet 349: 1901-1906
Miethke T, Wahl C, Heeg K, Echtenacher B, Krammer PH, Wagner H (1992) T cell-mediated lethal shock triggered in mice by the superantigen staphylococcal enterotoxin B: critical role of tumor necrosis factor. J Exp Med 175: 91-98
Mindich L, Qiao X, Qiao J, Onodera S, Romantschuk M, Hoogstraten D (1999) Isolation of additional bacteriophages with genomes of segmented double-stranded RNA. J Bacteriol 181: 4505-4508
Misumi Y, Miki K, Takatsuki A, Tamura G, Ikehara Y (1986) Novel blockade by brefeldin A of intracellular transport of secretory proteins in cultured rat hepatocytes. J Biol Chem 261: 11398-11403
Moller JK, Bak AL, Stenderup A, Zachariae H, Afzelius H (1977) Changing patterns of plasmid-mediated drug resistance during tetracycline therapy. Antimicrob Agents Chemother 11: 388-391
Montag D, Riede I, Eschbach ML, Degen M, Henning U (1987) Receptor-recognizing proteins of T-even type bacteriophages. Constant and hypervariable regions and an unusual case of evolution. J Mol Biol 196: 165-174
Moore GE, Gerner RE, Franklin HA (1967) Culture of normal human leukocytes. JAMA 199: 519-524
Morita M, Tanji Y, Orito Y, Mizoguchi K, Soejima A, Unno H (2001) Functional analysis of antibacterial activity of Bacillus amyloliquefaciens phage endolysin against Gram-negative bacteria. FEBS Lett 500: 56-59
National Health and Medical Research Council (2008) The Australian Immunisation Handbook. Canberra: Australian Government Department of Health and Ageing, 9th edn.
Navarre WW, Ton-That H, Faull KF, Schneewind O (1999) Multiple enzymatic activities of the murein hydrolase from staphylococcal phage phi11. Identification of a D-alanyl-glycine endopeptidase activity. J Biol Chem 274: 15847-15856
Nikaido H (1996) Multidrug efflux pumps of gram-negative bacteria. J Bacteriol 178: 5853-5859
Nishihara K, Kanemori M, Kitagawa M, Yanagi H, Yura T (1998) Chaperone coexpression plasmids: differential and synergistic roles of DnaK-DnaJ-GrpE and GroEL-GroES in assisting folding of an allergen of Japanese cedar pollen, Cryj2, in Escherichia coli. Appl Environ Microbiol 64: 1694-1699
References
73
Nishihara K, Kanemori M, Yanagi H, Yura T (2000) Overexpression of trigger factor prevents aggregation of recombinant proteins in Escherichia coli. Appl Environ Microbiol 66: 884-889
O'Flaherty S, Coffey A, Edwards R, Meaney W, Fitzgerald GF, Ross RP (2004) Genome of staphylococcal phage K: a new lineage of Myoviridae infecting gram-positive bacteria with a low G+C content. J Bacteriol 186: 2862-2871
O'Hara AM, Shanahan F (2006) The gut flora as a forgotten organ. EMBO Rep 7: 688-693
Ogawa SK, Yurberg ER, Hatcher VB, Levitt MA, Lowy FD (1985) Bacterial adherence to human endothelial cells in vitro. Infect Immun 50: 218-224
Pal S, Baiocchi RA, Byrd JC, Grever MR, Jacob ST, Sif S (2007) Low levels of miR-92b/96 induce PRMT5 translation and H3R8/H4R3 methylation in mantle cell lymphoma. EMBO J 26: 3558-3569
Pfaffl MW (2001) A new mathematical model for relative quantification in real-time RT-PCR. Nucleic Acids Res 29: e45
Pratt R, Dufrenoy J (1953) Antibiotics. Philadelphia: J B Lippincott
Pritchard DG, Dong S, Baker JR, Engler JA (2004) The bifunctional peptidoglycan lysin of Streptococcus agalactiae bacteriophage B30. Microbiology 150: 2079-2087
Proctor RA, van Langevelde P, Kristjansson M, Maslow JN, Arbeit RD (1995) Persistent and relapsing infections associated with small-colony variants of Staphylococcus aureus. Clin Infect Dis 20: 95-102
Projan SJ (2003) Why is big Pharma getting out of antibacterial drug discovery? Curr Opin Microbiol 6: 427-430
Prudhomme M, Attaiech L, Sanchez G, Martin B, Claverys JP (2006) Antibiotic stress induces genetic transformability in the human pathogen Streptococcus pneumoniae. Science 313: 89-92
Raab R, Neal G, Sohaskey C, Smith J, Young R (1988) Dominance in lambda S mutations and evidence for translational control. J Mol Biol 199: 95-105
Ramesh V, Fralick JA, Rolfe RD (1999) Prevention of Clostridium difficile-induced ileocecitis with Bacteriophage. Anaerobe 5: 69-78
Reacher MH, Shah A, Livermore DM, Wale MC, Graham C, Johnson AP, Heine H, Monnickendam MA, Barker KF, James D, George RC (2000) Bacteraemia and antibiotic resistance of its pathogens reported in England and Wales between 1990 and 1998: trend analysis. BMJ 320: 213-216
Ren Z, Shin A, Cai Q, Shu XO, Gao YT, Zheng W (2007) IGFBP3 mRNA expression in benign and malignant breast tumors. Breast Cancer Res 9: R2
Rupa P, Mine Y (2012) Recent Advances in the Role of Probiotics in Human Inflammation and Gut Health. J Agric Food Chem
Russel M, Linderoth NA, Sali A (1997) Filamentous phage assembly: variation on a protein export theme. Gene 192: 23-32
Rutledge RG (2004) Sigmoidal curve-fitting redefines quantitative real-time PCR with the prospective of developing automated high-throughput applications. Nucleic Acids Res 32: e178
References
74
Samarasinghe R, Tailor P, Tamura T, Kaisho T, Akira S, Ozato K (2006) Induction of an anti-inflammatory cytokine, IL-10, in dendritic cells after toll-like receptor signaling. J Interferon Cytokine Res 26: 893-900
Savva CG, Dewey JS, Deaton J, White RL, Struck DK, Holzenburg A, Young R (2008) The holin of bacteriophage lambda forms rings with large diameter. Mol Microbiol 69: 784-793
Schagger H (2006) Tricine-SDS-PAGE. Nat Protoc 1: 16-22
Schlacher K, Pham P, Cox MM, Goodman MF (2006) Roles of DNA polymerase V and RecA protein in SOS damage-induced mutation. Chem Rev 106: 406-419
Schlieker C, Bukau B, Mogk A (2002) Prevention and reversion of protein aggregation by molecular chaperones in the E-coli cytosol: implications for their applicability in biotechnology. J Biotechnol 96: 13-21
Schmittgen TD, Livak KJ (2008) Analyzing real-time PCR data by the comparative C(T) method. Nat Protoc 3: 1101-1108
Schneiders T, Amyes SG, Levy SB (2003) Role of AcrR and ramA in fluoroquinolone resistance in clinical Klebsiella pneumoniae isolates from Singapore. Antimicrob Agents Chemother 47: 2831-2837
Schoolnik GK, Summers WC, Watson JD (2004) Phage offer a real alternative. Nat Biotechnol 22: 505-506; author reply 506-507
Schuch R, Nelson D, Fischetti VA (2002) A bacteriolytic agent that detects and kills Bacillus anthracis. Nature 418: 884-889
Sheehan MM, Garcia JL, Lopez R, Garcia P (1996) Analysis of the catalytic domain of the lysin of the lactococcal bacteriophage Tuc2009 by chimeric gene assembling. FEMS Microbiol Lett 140: 23-28
Sidhu MS, Heir E, Leegaard T, Wiger K, Holck A (2002) Frequency of disinfectant resistance genes and genetic linkage with beta-lactamase transposon Tn552 among clinical staphylococci. Antimicrob Agents Chemother 46: 2797-2803
Solberg CO (1965) A study of carriers of Staphylococcus aureus with special regard to quantitative bacterial estimations. Acta Med Scand Suppl 436: 1-96
Sonoda H, Kumada Y, Katsuda T, Yamaji H (2010) Functional expression of single-chain Fv antibody in the cytoplasm of Escherichia coli by thioredoxin fusion and co-expression of molecular chaperones. Protein Expres Purif 70: 248-253
Soothill JS (1994) Bacteriophage prevents destruction of skin grafts by Pseudomonas aeruginosa. Burns 20: 209-211
Sorensen HP, Mortensen KK (2005) Soluble expression of recombinant proteins in the cytoplasm of Escherichia coli. Microb Cell Fact 4: 1
Stone R (2002) Bacteriophage therapy. Stalin's forgotten cure. Science 298: 728-731
Stordeur P, Poulin LF, Craciun L, Zhou L, Schandene L, de Lavareille A, Goriely S, Goldman M (2002) Cytokine mRNA quantification by real-time PCR. J Immunol Methods 259: 55-64
Sulakvelidze A, Alavidze Z, Morris JG, Jr. (2001) Bacteriophage therapy. Antimicrob Agents Chemother 45: 649-659

References
75
Summers AO (2002) Generally overlooked fundamentals of bacterial genetics and ecology. Clin Infect Dis 34 Suppl 3: S85-92
Summers WC (2001) Bacteriophage therapy. Annu Rev Microbiol 55: 437-451
Summers WC (2011) In the beginning ... Bacteriophage 1: 50-51
Tamura K, Peterson D, Peterson N, Stecher G, Nei M, Kumar S (2011) MEGA5: Molecular Evolutionary Genetics Analysis Using Maximum Likelihood, Evolutionary Distance, and Maximum Parsimony Methods. Molecular Biology and Evolution 28: 2731-2739
Thacker PD (2003) Set a microbe to kill a microbe: drug resistance renews interest in phage therapy. JAMA 290: 3183-3185
Thiel K (2004) Old dogma, new tricks--21st Century phage therapy. Nat Biotechnol 22: 31-36
Thomas CM, Nielsen KM (2005) Mechanisms of, and barriers to, horizontal gene transfer between bacteria. Nat Rev Microbiol 3: 711-721
Thomas JG, Ayling A, Baneyx F (1997) Molecular chaperones, folding catalysts, and the recovery of active recombinant proteins from E. coli. To fold or to refold. Appl Biochem Biotechnol 66: 197-238
Timmerman CP, Mattsson E, Martinez-Martinez L, De Graaf L, Van Strijp JA, Verbrugh HA, Verhoef J, Fleer A (1993) Induction of release of tumor necrosis factor from human monocytes by staphylococci and staphylococcal peptidoglycans. Infect Immun 61: 4167-4172
Tompkins DC, Hatcher VB, Patel D, Orr GA, Higgins LL, Lowy FD (1990) A human endothelial cell membrane protein that binds Staphylococcus aureus in vitro. J Clin Invest 85: 1248-1254
Torrey RG, Julianelle LA (1941) The sulfonamide therapy of staphylococcal septicemia. Ann Int Med 15: 432
Trucksis M, Hooper DC, Wolfson JS (1991) Emerging resistance to fluoroquinolones in staphylococci: an alert. Ann Intern Med 114: 424-426
Tung WL, Chow KC (1995) A modified medium for efficient electrotransformation of E. coli. Trends Genet 11: 128-129
Twort FW (1915) An investigation of the nature of ultra-microscopic viruses. Lancet 2: 1241-1243
Utsui Y, Yokota T (1985) Role of an altered penicillin-binding protein in methicillin- and cephem-resistant Staphylococcus aureus. Antimicrob Agents Chemother 28: 397-403
van Regenmortel MHV (1990) Virus species, a much overlooked, but essential concept in virus classification. Intervirology 31: 241–254
Vandersteegen K, Mattheus W, Ceyssens PJ, Bilocq F, De Vos D, Pirnay JP, Noben JP, Merabishvili M, Lipinska U, Hermans K, Lavigne R (2011) Microbiological and molecular assessment of bacteriophage ISP for the control of Staphylococcus aureus. PLoS One 6: e24418
References
76
Vasala A, Valkkila M, Caldentey J, Alatossava T (1995) Genetic and biochemical characterization of the Lactobacillus delbrueckii subsp. lactis bacteriophage LL-H lysin. Appl Environ Microbiol 61: 4004-4011
Vercellotti GM, Lussenhop D, Peterson PK, Furcht LT, McCarthy JB, Jacob HS, Moldow CF (1984) Bacterial adherence to fibronectin and endothelial cells: a possible mechanism for bacterial tissue tropism. J Lab Clin Med 103: 34-43
Verdrengh M, Tarkowski A (1997) Role of neutrophils in experimental septicemia and septic arthritis induced by Staphylococcus aureus. Infect Immun 65: 2517-2521
Vesga O, Groeschel MC, Otten MF, Brar DW, Vann JM, Proctor RA (1996) Staphylococcus aureus small colony variants are induced by the endothelial cell intracellular milieu. J Infect Dis 173: 739-742
Vinodkumar CS, Neelagund YF, Kalsurmath S (2005) Bacteriophage in the treatment of experimental septicemic mice from a clinical isolate of multidrug resistant Klebsiella pneumoniae. J Commun Dis 37: 18-29
Volksgezondheid F (2004) MRSA richtlijnen in ziekenhuizen 2004.
Vollmer W, Joris B, Charlier P, Foster S (2008) Bacterial peptidoglycan (murein) hydrolases. FEMS Microbiol Rev 32: 259-286
Waldvogel FA (ed) (1995) Staphylococcus aureus (including toxic shock syndrome). New York: Churchill Livingstone, 1754–1777pp
Wallace TC, Guarner F, Madsen K, Cabana MD, Gibson G, Hentges E, Sanders ME (2011) Human gut microbiota and its relationship to health and disease. Nutr Rev 69: 392-403
Wang H, Dzink-Fox JL, Chen M, Levy SB (2001) Genetic characterization of highly fluoroquinolone-resistant clinical Escherichia coli strains from China: role of acrR mutations. Antimicrob Agents Chemother 45: 1515-1521
Wang IN, Deaton J, Young R (2003) Sizing the holin lesion with an endolysin-beta-galactosidase fusion. J Bacteriol 185: 779-787
Wang IN, Smith DL, Young R (2000) Holins: the protein clocks of bacteriophage infections. Annu Rev Microbiol 54: 799-825
WHO. (2001) Global Strategy for Containment of Antimicrobial Resistance. WHO, Geneva.
Wildy P (1971) Classification and Nomenclature of Viruses: First Report of the International Committee on Nomenclature of Viruses, Vol. Vol. 5.
Wills QF, Kerrigan C, Soothill JS (2005) Experimental bacteriophage protection against Staphylococcus aureus abscesses in a rabbit model. Antimicrob Agents Chemother 49: 1220-1221
Woods DC, Alvarez C, Johnson AL (2008) Cisplatin-mediated sensitivity to TRAIL-induced cell death in human granulosa tumor cells. Gynecol Oncol 108: 632-640
Wu T, Yeaman MR, Bayer AS (1994) In vitro resistance to platelet microbicidal protein correlates with endocarditis source among bacteremic staphylococcal and streptococcal isolates. Antimicrob Agents Chemother 38: 729-732
References
77
Xu M, Arulandu A, Struck DK, Swanson S, Sacchettini JC, Young R (2005) Disulfide isomerization after membrane release of its SAR domain activates P1 lysozyme. Science 307: 113-117
Xu M, Struck DK, Deaton J, Wang IN, Young R (2004) A signal-arrest-release sequence mediates export and control of the phage P1 endolysin. Proc Natl Acad Sci U S A 101: 6415-6420
Yan F, Polk DB (2004) Commensal bacteria in the gut: learning who our friends are. Curr Opin Gastroenterol 20: 565-571
Yao L, Bengualid V, Lowy FD, Gibbons JJ, Hatcher VB, Berman JW (1995) Internalization of Staphylococcus aureus by endothelial cells induces cytokine gene expression. Infect Immun 63: 1835-1839
Yao L, Berman JW, Factor SM, Lowy FD (1997) Correlation of histopathologic and bacteriologic changes with cytokine expression in an experimental murine model of bacteremic Staphylococcus aureus infection. Infect Immun 65: 3889-3895
Yokoi KJ, Kawahigashi N, Uchida M, Sugahara K, Shinohara M, Kawasaki K, Nakamura S, Taketo A, Kodaira K (2005) The two-component cell lysis genes holWMY and lysWMY of the Staphylococcus warneri M phage varphiWMY: cloning, sequencing, expression, and mutational analysis in Escherichia coli. Gene 351: 97-108
Yoong P, Schuch R, Nelson D, Fischetti VA (2004) Identification of a broadly active phage lytic enzyme with lethal activity against antibiotic-resistant Enterococcus faecalis and Enterococcus faecium. J Bacteriol 186: 4808-4812
Young I, Wang I, Roof WD (2000) Phages will out: strategies of host cell lysis. Trends Microbiol 8: 120-128
Young R (2002) Bacteriophage holins: deadly diversity. J Mol Microbiol Biotechnol 4: 21-36
Zelena K, Krings U, Berger RG (2012) Functional expression of a valencene dioxygenase from Pleurotus sapidus in E. coli. Bioresource Technol 108: 231-239
Zhaxybayeva O, Doolittle WF (2011) Lateral gene transfer. Curr Biol 21: R242-246
Ziedaite G, Daugelavicius R, Bamford JK, Bamford DH (2005) The Holin protein of bacteriophage PRD1 forms a pore for small-molecule and endolysin translocation. J Bacteriol 187: 5397-5405

78
79
Addendum: Virus families
I. Virus families not assigned to an order
i. Microviridae
The Microviridae virions are small, have no envelope and contain a single piece of circular
ssDNA (Figure 28). These phages infect very different hosts (e.g. Bdellovibrio, Chlamudia and
Spiroplasma) and are classified into four genera (i.e. Bdellomicrovirus, Chlamydiamicrovirus,
Spiromicrovirus, Microvirus)(King et al, 2011). The infecting phage DNA replicates as a double-
stranded replicative form following the rolling-circle model (Ackermann, 2003).
ii. Corticoviridae
This family only has a single member, the maritime Pseudoalteromonas phage PM2 (King et
al, 2011). Its capsid consist of two protein shells and a lipid bilayer sandwiched in-between.
Corticoviridae are dsDNA viruses (Ackermann, 2003)(Figure 28).
iii. Tectiviridae
Tectiviridae are dsDNA phages that have a rigid protein capsid which surrounds a thick,
flexible lipoprotein vesicle. Upon absorption to bacteria or chloroform treatment, this vesicle
becomes a tail-like tube. Thus a nucleic acid injection device (Bamford et al, 1995). Tectiviridae of
Bacilli have apical spikes. Dispite their apparent rarity, Tectiviridae have an extremely wide host
range (e.g. Acinetobacter, Pseudomonas, Thermus, Vibrio, Bacillus and Aliccyclobacillus) (Ackermann,
2003). Tectiviridae consists of one genus, the Tectivirus (King et al, 2011)(Figure 28).
iv. Leviviridae
The Leviviridae virions are ssRNA viruses that resemble polio viruses and have no
morphological particulars. However, the coat protein of Levivirus Enterobacteria phage MS2 has no
structural similarity to that of other known RNA viruses (van Regenmortel, 1990). Most known
Leviviridae are plasmid-specific coliphages that absorb to F or sex pili. They have been divided, by
serology and other criteria, in to two genera (i.e. Allolevivirus and Levivirus)(King et al, 2011).
Levivirus RNA acts as mRNA and needs no translation (Ackermann, 2003)(Figure 28).
v. Cystoviridae
The Cystoviridae are dsRNA phages that have only a single official member, however two
related viruses have been found (Mindich et al, 1999). These viruses are unique among the
bacteriophages because they contain three molecules of dsRNA and RNA polymerase. The capsids
are surrounded by lipid-containing envelopes and contain a dodecahedral RNA polymerase complex
(Bamford et al, 1993). Infecting Cystoviridae lose their envelopes and their capsids enter the space
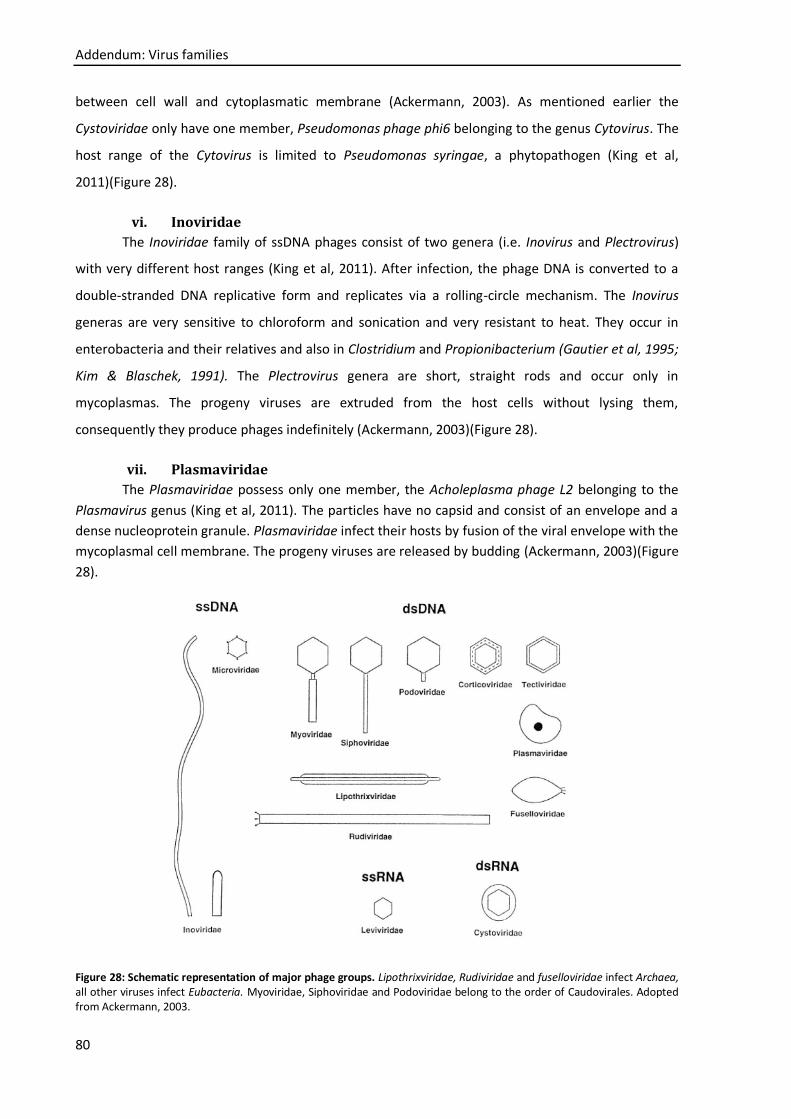
Addendum: Virus families
80
between cell wall and cytoplasmatic membrane (Ackermann, 2003). As mentioned earlier the
Cystoviridae only have one member, Pseudomonas phage phi6 belonging to the genus Cytovirus. The
host range of the Cytovirus is limited to Pseudomonas syringae, a phytopathogen (King et al,
2011)(Figure 28).
vi. Inoviridae
The Inoviridae family of ssDNA phages consist of two genera (i.e. Inovirus and Plectrovirus)
with very different host ranges (King et al, 2011). After infection, the phage DNA is converted to a
double-stranded DNA replicative form and replicates via a rolling-circle mechanism. The Inovirus
generas are very sensitive to chloroform and sonication and very resistant to heat. They occur in
enterobacteria and their relatives and also in Clostridium and Propionibacterium (Gautier et al, 1995;
Kim & Blaschek, 1991). The Plectrovirus genera are short, straight rods and occur only in
mycoplasmas. The progeny viruses are extruded from the host cells without lysing them,
consequently they produce phages indefinitely (Ackermann, 2003)(Figure 28).
vii. Plasmaviridae
The Plasmaviridae possess only one member, the Acholeplasma phage L2 belonging to the
Plasmavirus genus (King et al, 2011). The particles have no capsid and consist of an envelope and a
dense nucleoprotein granule. Plasmaviridae infect their hosts by fusion of the viral envelope with the
mycoplasmal cell membrane. The progeny viruses are released by budding (Ackermann, 2003)(Figure
28).
Figure 28: Schematic representation of major phage groups. Lipothrixviridae, Rudiviridae and fuselloviridae infect Archaea, all other viruses infect Eubacteria. Myoviridae, Siphoviridae and Podoviridae belong to the order of Caudovirales. Adopted from Ackermann, 2003.
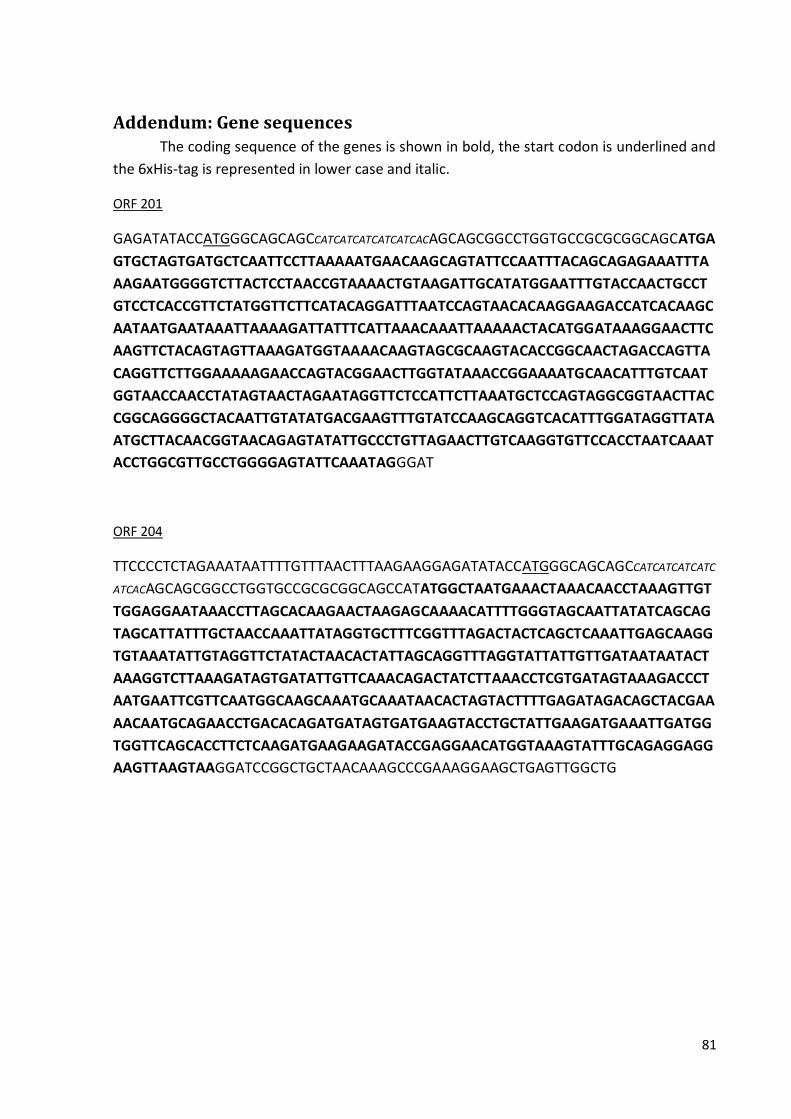
81
Addendum: Gene sequences The coding sequence of the genes is shown in bold, the start codon is underlined and
the 6xHis-tag is represented in lower case and italic.
ORF 201
GAGATATACCATGGGCAGCAGCCATCATCATCATCATCACAGCAGCGGCCTGGTGCCGCGCGGCAGCATGA
GTGCTAGTGATGCTCAATTCCTTAAAAATGAACAAGCAGTATTCCAATTTACAGCAGAGAAATTTA
AAGAATGGGGTCTTACTCCTAACCGTAAAACTGTAAGATTGCATATGGAATTTGTACCAACTGCCT
GTCCTCACCGTTCTATGGTTCTTCATACAGGATTTAATCCAGTAACACAAGGAAGACCATCACAAGC
AATAATGAATAAATTAAAAGATTATTTCATTAAACAAATTAAAAACTACATGGATAAAGGAACTTC
AAGTTCTACAGTAGTTAAAGATGGTAAAACAAGTAGCGCAAGTACACCGGCAACTAGACCAGTTA
CAGGTTCTTGGAAAAAGAACCAGTACGGAACTTGGTATAAACCGGAAAATGCAACATTTGTCAAT
GGTAACCAACCTATAGTAACTAGAATAGGTTCTCCATTCTTAAATGCTCCAGTAGGCGGTAACTTAC
CGGCAGGGGCTACAATTGTATATGACGAAGTTTGTATCCAAGCAGGTCACATTTGGATAGGTTATA
ATGCTTACAACGGTAACAGAGTATATTGCCCTGTTAGAACTTGTCAAGGTGTTCCACCTAATCAAAT
ACCTGGCGTTGCCTGGGGAGTATTCAAATAGGGAT
ORF 204
TTCCCCTCTAGAAATAATTTTGTTTAACTTTAAGAAGGAGATATACCATGGGCAGCAGCCATCATCATCATC
ATCACAGCAGCGGCCTGGTGCCGCGCGGCAGCCATATGGCTAATGAAACTAAACAACCTAAAGTTGT
TGGAGGAATAAACCTTAGCACAAGAACTAAGAGCAAAACATTTTGGGTAGCAATTATATCAGCAG
TAGCATTATTTGCTAACCAAATTATAGGTGCTTTCGGTTTAGACTACTCAGCTCAAATTGAGCAAGG
TGTAAATATTGTAGGTTCTATACTAACACTATTAGCAGGTTTAGGTATTATTGTTGATAATAATACT
AAAGGTCTTAAAGATAGTGATATTGTTCAAACAGACTATCTTAAACCTCGTGATAGTAAAGACCCT
AATGAATTCGTTCAATGGCAAGCAAATGCAAATAACACTAGTACTTTTGAGATAGACAGCTACGAA
AACAATGCAGAACCTGACACAGATGATAGTGATGAAGTACCTGCTATTGAAGATGAAATTGATGG
TGGTTCAGCACCTTCTCAAGATGAAGAAGATACCGAGGAACATGGTAAAGTATTTGCAGAGGAGG
AAGTTAAGTAAGGATCCGGCTGCTAACAAAGCCCGAAAGGAAGCTGAGTTGGCTG

82
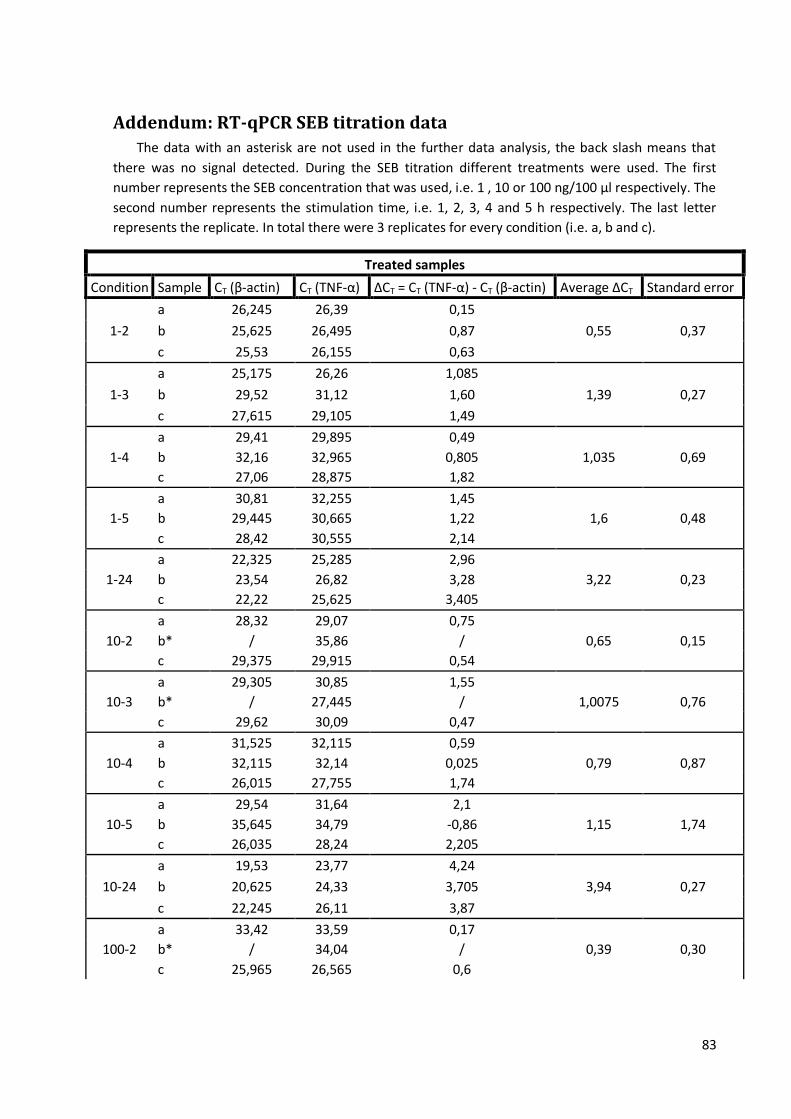
83
Addendum: RT-qPCR SEB titration data
The data with an asterisk are not used in the further data analysis, the back slash means that
there was no signal detected. During the SEB titration different treatments were used. The first
number represents the SEB concentration that was used, i.e. 1 , 10 or 100 ng/100 µl respectively. The
second number represents the stimulation time, i.e. 1, 2, 3, 4 and 5 h respectively. The last letter
represents the replicate. In total there were 3 replicates for every condition (i.e. a, b and c).
Treated samples
Condition Sample CT (β-actin) CT (TNF-α) ΔCT = CT (TNF-α) - CT (β-actin) Average ΔCT Standard error
1-2
a 26,245 26,39 0,15
0,55 0,37 b 25,625 26,495 0,87
c 25,53 26,155 0,63
1-3
a 25,175 26,26 1,085
1,39 0,27 b 29,52 31,12 1,60
c 27,615 29,105 1,49
1-4
a 29,41 29,895 0,49
1,035 0,69 b 32,16 32,965 0,805
c 27,06 28,875 1,82
1-5
a 30,81 32,255 1,45
1,6 0,48 b 29,445 30,665 1,22
c 28,42 30,555 2,14
1-24
a 22,325 25,285 2,96
3,22 0,23 b 23,54 26,82 3,28
c 22,22 25,625 3,405
10-2
a 28,32 29,07 0,75
0,65 0,15 b* / 35,86 /
c 29,375 29,915 0,54
10-3
a 29,305 30,85 1,55
1,0075 0,76 b* / 27,445 /
c 29,62 30,09 0,47
10-4
a 31,525 32,115 0,59
0,79 0,87 b 32,115 32,14 0,025
c 26,015 27,755 1,74
10-5
a 29,54 31,64 2,1
1,15 1,74 b 35,645 34,79 -0,86
c 26,035 28,24 2,205
10-24
a 19,53 23,77 4,24
3,94 0,27 b 20,625 24,33 3,705
c 22,245 26,11 3,87
100-2
a 33,42 33,59 0,17
0,39 0,30 b* / 34,04 /
c 25,965 26,565 0,6

Addendum: RT-qPCR SEB titration data
84
100-3
a 26,05 27,23 1,18
0,39 0,92 b 32,615 31,995 -0,62
c 25,345 25,965 0,62
100-4
a 27,23 28,965 1,74
1,59 0,20 b* / 35,105 /
c 25,505 26,955 1,45
100-5
a 34,62 33,565 -1,055
1,21 1,60 b* / 37,565 /
c 25,29 26,5 1,21
100-24
a 20,245 23,915 3,67
3,93 0,67 b 21,525 26,205 4,68
c 21,71 25,135 3,43
Utreated samples
Sample CT (β-actin) CT (TNF-α) ΔCT = CT (TNF-α) - CT (β-actin) Average ΔCT Standard error
0-5a 23,575 28,5 4,93
4,69 0,44 0-5b 25,02 30,13 5,11
0-5c 23,96 28,065 4,105
0-5d 23,5 28,125 4,63
ΔΔCT
Condition ΔΔCT= ΔCT (treated) - ΔCT (Untreated) 2^-ΔΔCT Standard error
0-5 0 1 0,31
1-2 -4,14 17,69 0,305
1-3 -3,30 9,85 0,27
1-4 -3,66 12,61 0,46
1-5 -3,09 8,52 0,35
1-24 -1,48 2,78 0,26
0-5 0 1 0,34
10-2 -4,05 16,52 0,24
10-3 -3,68 12,85 0,49
10-4 -3,91 14,99 0,55
10-5 -3,54 11,64 1,027
10-24 -0,75 1,69 0,27
0-5 0 1 0,34
100-2 -4,31 19,78 0,28
100-3 -4,30 19,67 0,58
100-4 -3,10 8,57 0,25
100-5 -3,48 11,17 0,95
100-24 -0,77 1,70 0,44

85
Addendum: Protocols
1. TOPO cloning
Purpose
Cloning of a PCR product in preparation of protein expression and restriction-ligation reaction to a
pET15b vector. The complete cloning process from TOPO cloning till the expression construct
(pET15b) takes 5 days.
Material (per construct)
- 1 µl TOPO vector (Cat. no. K450001, Invitrogen, Life Technologies, Carslbad, CA)
- 4 µl PCR purified fragment (Protocol: DNA purification), corresponding to 10 – 100 ng DNA
(Protocol: DNA Concentration Measurement)
Equipment
- Electroporator (MicroPulser Electroporator, Bio Rad, Hercules, CA)
Protocol
1. Add 4 µl (10-100 ng) of purified PCR fragment to 1 µl of TOPO vector in a 1.5 ml Eppendorf
tube.
2. Mix reaction gently by pipetting up and down twice and incubate for 5 min at room
temperature (22-23 °C).
3. Place reaction tube on ice.
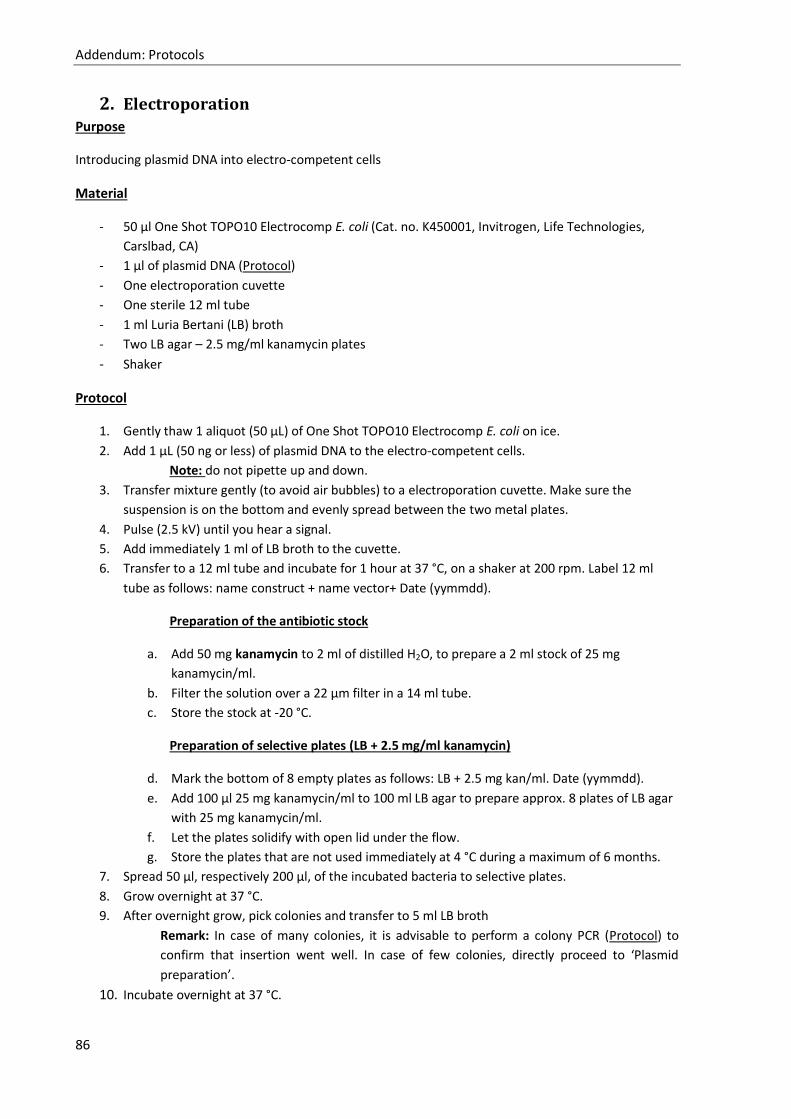
Addendum: Protocols
86
2. Electroporation Purpose
Introducing plasmid DNA into electro-competent cells
Material
- 50 µl One Shot TOPO10 Electrocomp E. coli (Cat. no. K450001, Invitrogen, Life Technologies,
Carslbad, CA)
- 1 µl of plasmid DNA (Protocol)
- One electroporation cuvette
- One sterile 12 ml tube
- 1 ml Luria Bertani (LB) broth
- Two LB agar – 2.5 mg/ml kanamycin plates
- Shaker
Protocol
1. Gently thaw 1 aliquot (50 μL) of One Shot TOPO10 Electrocomp E. coli on ice.
2. Add 1 μL (50 ng or less) of plasmid DNA to the electro-competent cells.
Note: do not pipette up and down.
3. Transfer mixture gently (to avoid air bubbles) to a electroporation cuvette. Make sure the
suspension is on the bottom and evenly spread between the two metal plates.
4. Pulse (2.5 kV) until you hear a signal.
5. Add immediately 1 ml of LB broth to the cuvette.
6. Transfer to a 12 ml tube and incubate for 1 hour at 37 °C, on a shaker at 200 rpm. Label 12 ml
tube as follows: name construct + name vector+ Date (yymmdd).
Preparation of the antibiotic stock
a. Add 50 mg kanamycin to 2 ml of distilled H2O, to prepare a 2 ml stock of 25 mg
kanamycin/ml.
b. Filter the solution over a 22 µm filter in a 14 ml tube.
c. Store the stock at -20 °C.
Preparation of selective plates (LB + 2.5 mg/ml kanamycin)
d. Mark the bottom of 8 empty plates as follows: LB + 2.5 mg kan/ml. Date (yymmdd).
e. Add 100 µl 25 mg kanamycin/ml to 100 ml LB agar to prepare approx. 8 plates of LB agar
with 25 mg kanamycin/ml.
f. Let the plates solidify with open lid under the flow.
g. Store the plates that are not used immediately at 4 °C during a maximum of 6 months.
7. Spread 50 µl, respectively 200 µl, of the incubated bacteria to selective plates.
8. Grow overnight at 37 °C.
9. After overnight grow, pick colonies and transfer to 5 ml LB broth
Remark: In case of many colonies, it is advisable to perform a colony PCR (Protocol) to
confirm that insertion went well. In case of few colonies, directly proceed to ‘Plasmid
preparation’.
10. Incubate overnight at 37 °C.
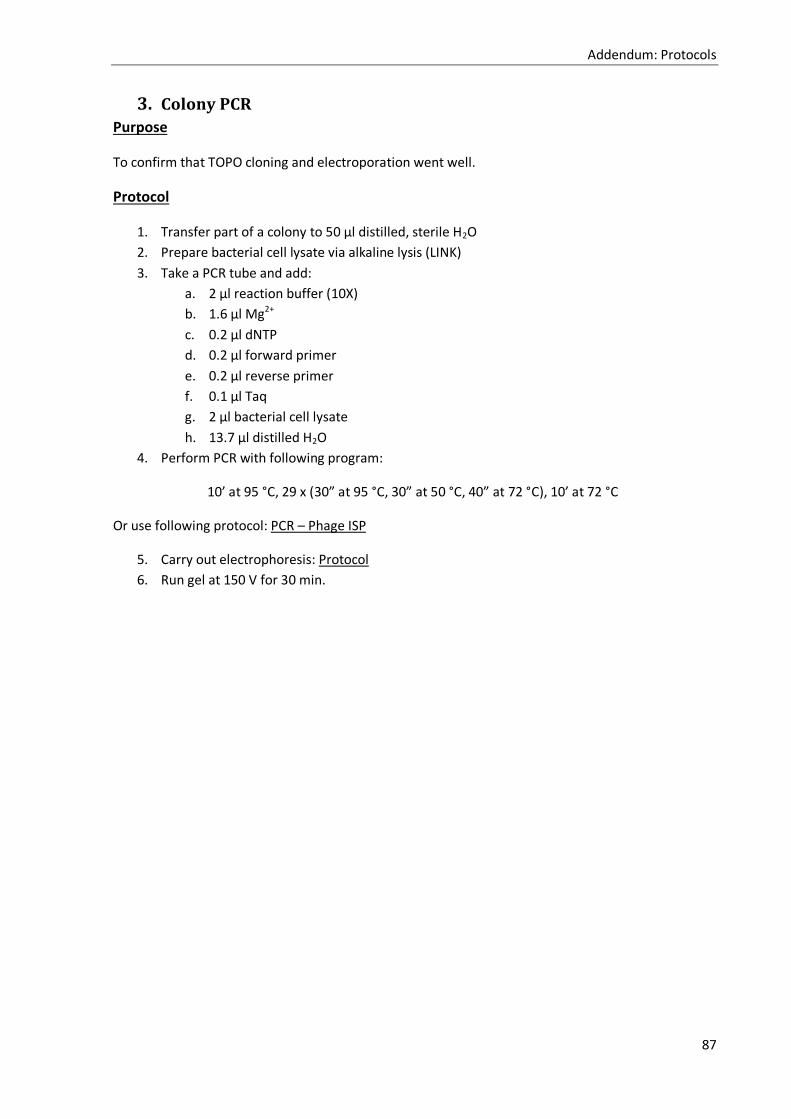
Addendum: Protocols
87
3. Colony PCR
Purpose
To confirm that TOPO cloning and electroporation went well.
Protocol
1. Transfer part of a colony to 50 µl distilled, sterile H2O
2. Prepare bacterial cell lysate via alkaline lysis (LINK)
3. Take a PCR tube and add:
a. 2 µl reaction buffer (10X)
b. 1.6 µl Mg2+
c. 0.2 µl dNTP
d. 0.2 µl forward primer
e. 0.2 µl reverse primer
f. 0.1 µl Taq
g. 2 µl bacterial cell lysate
h. 13.7 µl distilled H2O
4. Perform PCR with following program:
10’ at 95 °C, 29 x (30” at 95 °C, 30” at 50 °C, 40” at 72 °C), 10’ at 72 °C
Or use following protocol: PCR – Phage ISP
5. Carry out electrophoresis: Protocol
6. Run gel at 150 V for 30 min.
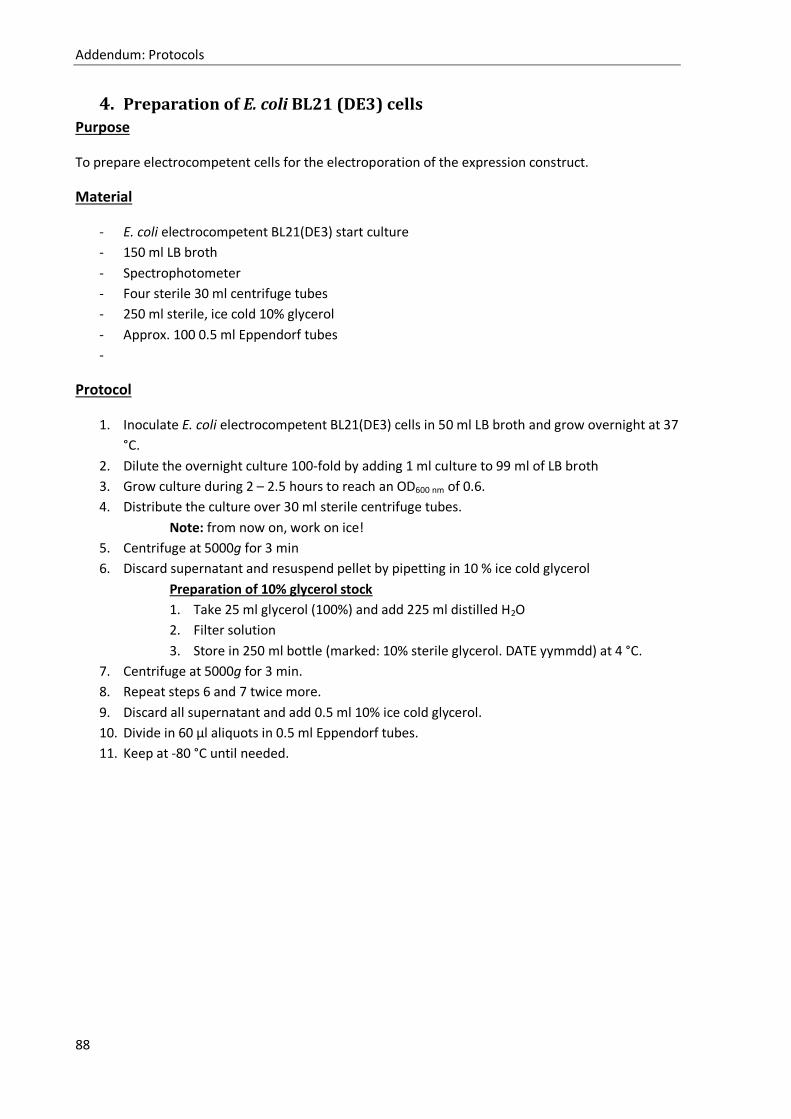
Addendum: Protocols
88
4. Preparation of E. coli BL21 (DE3) cells
Purpose
To prepare electrocompetent cells for the electroporation of the expression construct.
Material
- E. coli electrocompetent BL21(DE3) start culture
- 150 ml LB broth
- Spectrophotometer
- Four sterile 30 ml centrifuge tubes
- 250 ml sterile, ice cold 10% glycerol
- Approx. 100 0.5 ml Eppendorf tubes
-
Protocol
1. Inoculate E. coli electrocompetent BL21(DE3) cells in 50 ml LB broth and grow overnight at 37
°C.
2. Dilute the overnight culture 100-fold by adding 1 ml culture to 99 ml of LB broth
3. Grow culture during 2 – 2.5 hours to reach an OD600 nm of 0.6.
4. Distribute the culture over 30 ml sterile centrifuge tubes.
Note: from now on, work on ice!
5. Centrifuge at 5000g for 3 min
6. Discard supernatant and resuspend pellet by pipetting in 10 % ice cold glycerol
Preparation of 10% glycerol stock
1. Take 25 ml glycerol (100%) and add 225 ml distilled H2O
2. Filter solution
3. Store in 250 ml bottle (marked: 10% sterile glycerol. DATE yymmdd) at 4 °C.
7. Centrifuge at 5000g for 3 min.
8. Repeat steps 6 and 7 twice more.
9. Discard all supernatant and add 0.5 ml 10% ice cold glycerol.
10. Divide in 60 µl aliquots in 0.5 ml Eppendorf tubes.
11. Keep at -80 °C until needed.

Addendum: Protocols
89
5. Preparation of plasmids Purpose
Isolation of plasmid DNA from the E. coli cells that were transformed with the TOPO vector.
Removal of the fragment of interest from the TOPO vector and insertion into a pET15b vector.
Material
- innuPREP Plasmide Minikit (Cat. no. 845-KS-5040250, Life Science, analytikjena bio solutions,
Germany)
Protocol
1. Transfer 5 ml of the overnight E. coli culture into a 1.5 ml Eppendorf tube.
2. Centrifuge for 1 min at maximum speed to pellet the cells.
3. Remove the supernatant as completely as possible.
4. Repeat until all 5 ml is pelleted in the same 1.5 ml Eppendorf tube.
5. Resuspend bacterial pellet in 250 µl Re-suspension buffer (CRA) (vortex or by pipetting up
and down).
6. Add 250 µl Lysis buffer (CLA ), close the tube and mix carefully by inverting the tube 5 times.
Note: do not perform the lysis step for more than 5 min.
7. Add 10 µl alkaline protease and incubate for 5 min.
8. Add 350 µl Neutralization buffer (NS) and mix gently by inverting 4 times.
9. Centrifuge for 10 min at maximum speed
10. Transfer the clarified supernatant sample onto the spin Filter (Cat. no. 845-KS-5040250, Life
Science, analytikjena bio solutions, Germany), placed onto a receiver tube of 2 ml.
11. Centrifuge for 1 min at maximum speed.
12. Discard the filtrate and re-use the receiver tube.
13. Add 750 µl Washing solution (CWS) to the spin filter and centrifuge at maximum speed for 1
min.
14. Discard filtrate and re-use the receiver tube.
15. Add 250 µl CWS to the spin filter and centrifuge at maximum speed for 1 min.
16. Discard the filtrate and re-use the receiver tube.
17. Centrifuge at max speed for 2 min to remove all traces of ethanol.
18. Discard the 2.0 ml receiver tube.
19. Place spin filter into a 1.5 ml elution tube (Eppendorf 1.5 ml).
20. Add 50 µl nuclease free H2O (Cat. no. 129114, Qiagen, Valencia, CA).
21. Centrifuge at maximum speed for 1 min.
22. Flowthrough can be stored at -20 °C or can be directly used for the restriction digest.

Addendum: Protocols
90
6. Restriction digest
Purpose
Removal of the insert DNA from the TOPO vector and preparing it to be used in a pET15b vector.
Material
- 5 µl plasmid DNA
- 2 µl 10X buffer (buffer 4)
- 0.5 µl Enzyme 1 (NdeI or NcoI restriction enzyme)
- 0.5 µl Enzyme 2 (BamHI restriction enzyme)
- Distilled H2O
- One 1.5 ml Eppendorf tube
Protocol
1. Transfer 5 µl of plasmid DNA to a new sterile 1.5 Eppendorf tube.
2. Add 2 µl 10X Buffer (Nep 4 buffer), 1 µl NdeI or NcoI enzyme and 1 µl BamHI.
3. Add 12 µl H2O (total volume of reaction is 20 µl).
4. Incubate at 37 °C for 1 h.
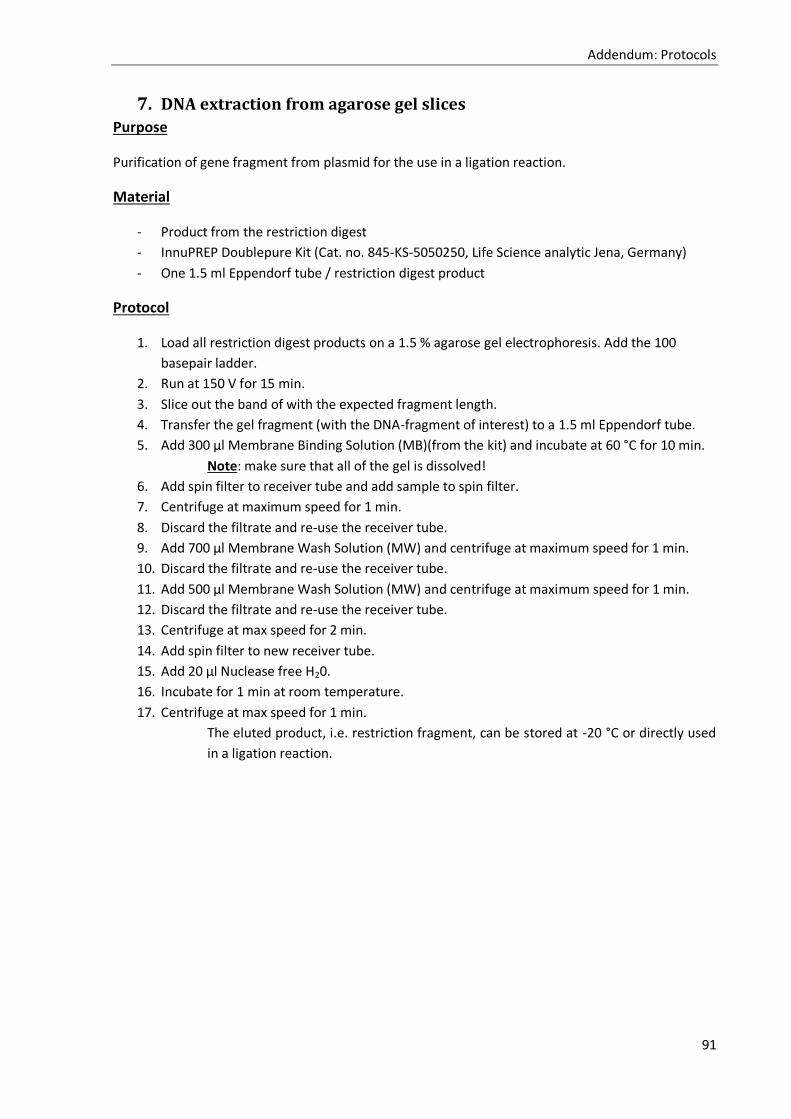
Addendum: Protocols
91
7. DNA extraction from agarose gel slices
Purpose
Purification of gene fragment from plasmid for the use in a ligation reaction.
Material
- Product from the restriction digest
- InnuPREP Doublepure Kit (Cat. no. 845-KS-5050250, Life Science analytic Jena, Germany)
- One 1.5 ml Eppendorf tube / restriction digest product
Protocol
1. Load all restriction digest products on a 1.5 % agarose gel electrophoresis. Add the 100
basepair ladder.
2. Run at 150 V for 15 min.
3. Slice out the band of with the expected fragment length.
4. Transfer the gel fragment (with the DNA-fragment of interest) to a 1.5 ml Eppendorf tube.
5. Add 300 µl Membrane Binding Solution (MB)(from the kit) and incubate at 60 °C for 10 min.
Note: make sure that all of the gel is dissolved!
6. Add spin filter to receiver tube and add sample to spin filter.
7. Centrifuge at maximum speed for 1 min.
8. Discard the filtrate and re-use the receiver tube.
9. Add 700 µl Membrane Wash Solution (MW) and centrifuge at maximum speed for 1 min.
10. Discard the filtrate and re-use the receiver tube.
11. Add 500 µl Membrane Wash Solution (MW) and centrifuge at maximum speed for 1 min.
12. Discard the filtrate and re-use the receiver tube.
13. Centrifuge at max speed for 2 min.
14. Add spin filter to new receiver tube.
15. Add 20 µl Nuclease free H20.
16. Incubate for 1 min at room temperature.
17. Centrifuge at max speed for 1 min.
The eluted product, i.e. restriction fragment, can be stored at -20 °C or directly used
in a ligation reaction.
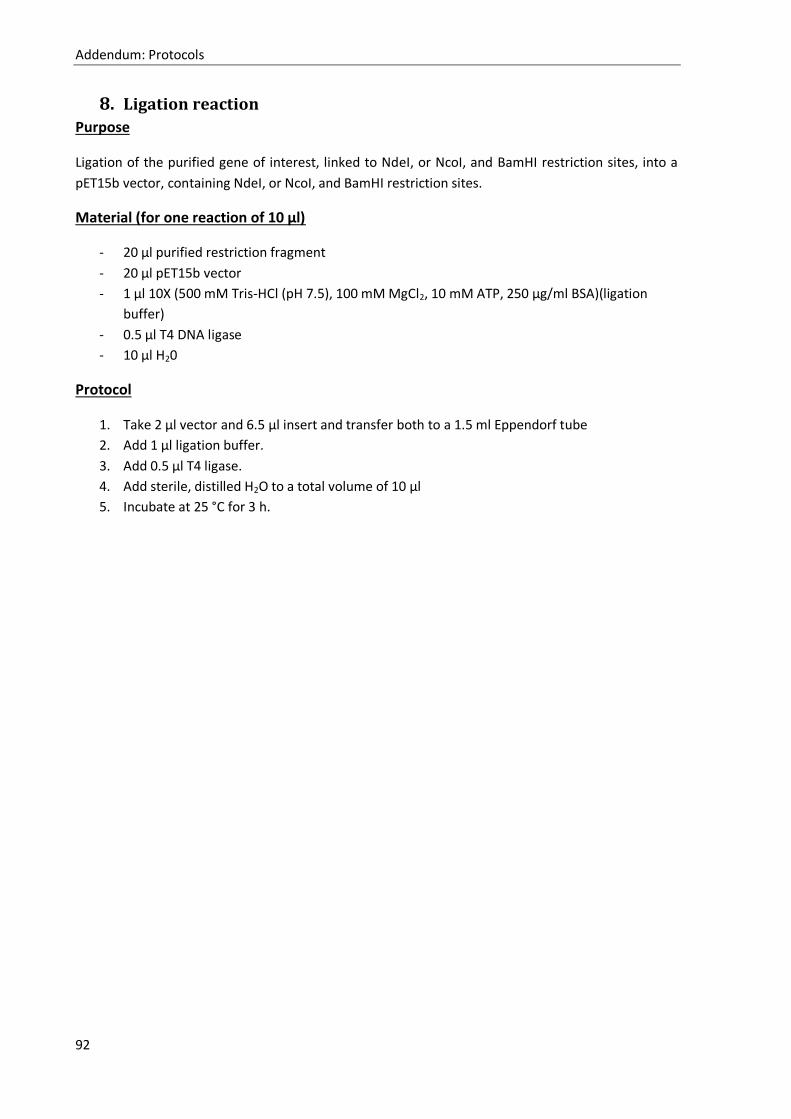
Addendum: Protocols
92
8. Ligation reaction
Purpose
Ligation of the purified gene of interest, linked to NdeI, or NcoI, and BamHI restriction sites, into a
pET15b vector, containing NdeI, or NcoI, and BamHI restriction sites.
Material (for one reaction of 10 µl)
- 20 µl purified restriction fragment
- 20 µl pET15b vector
- 1 µl 10X (500 mM Tris-HCl (pH 7.5), 100 mM MgCl2, 10 mM ATP, 250 μg/ml BSA)(ligation
buffer)
- 0.5 µl T4 DNA ligase
- 10 µl H20
Protocol
1. Take 2 µl vector and 6.5 µl insert and transfer both to a 1.5 ml Eppendorf tube
2. Add 1 µl ligation buffer.
3. Add 0.5 µl T4 ligase.
4. Add sterile, distilled H2O to a total volume of 10 µl
5. Incubate at 25 °C for 3 h.

Addendum: Protocols
93
9. Electroporation
Purpose
Introducing plasmid DNA into electro-competent cells
Material
- 40 µl electro-competent BL21 (DE3) cells. Protocol
- 1 µl of plasmid DNA
- Electroporation cuvette
- 1 ml LB broth
- Two selective plate: LB agar + 100 µg Carbenicillin/ml
- Electroporator
- 14 ml round bottom Falcon
- Shaker
Protocol
11. Gently thaw 1 aliquot (40 μL) of electro-competent BL21 (DE3) on ice.
12. Add 1 μL (50 ng or less) of plasmid DNA to the electro-competent cells.
Note: do not pipette up and down.
13. Transfer mixture gently (to avoid air bubbles) to a electroporation cuvette. Make sure the
suspension is on the bottom and evenly spread between the two metal plates.
14. Pulse (2.5 kV) until you hear a signal.
15. Add immediately 1 ml of LB broth to the cuvette.
16. Transfer to a 12 ml tube and incubate for 1 hour at 37 °C, on a shaker at 200 rpm. Label 12 ml
tube as follows: name construct + name vector+ Date (yymmdd).
Preparation of antibiotic stock
h. Add 500 mg carbenicillin to 2 ml of distilled H2O to prepare 2 ml of 250 mg
carbenicillin/ml.
i. Filter the solution over a 22 µm filter.
j. Store the stock (labelled as 250 mg carbenicillin/ml. Date (yymmdd)) at -20°C for a
maxium of 6 months.
Preparation of carbenicillin selective plates
k. Mark the bottom of 8 empty plates as follows: LB + 100 µg Cb/ml. DATE.
l. Add 40 µl of 250 mg carbenicillin/ml stock to 100 ml LB agar.
m. Let the plates solidify.
n. Store the plates that are not used at 4°C for a maximum of 6 months.
17. Spread 50 µl, respectively 200 µl, of the incubated bacteria to selective plates.
18. Grow overnight at 37 °C.
19. The next day: store plates at 4 °C
20. To control for the success of the ligation, it is advisable to perform a colony PCR: Protocol.
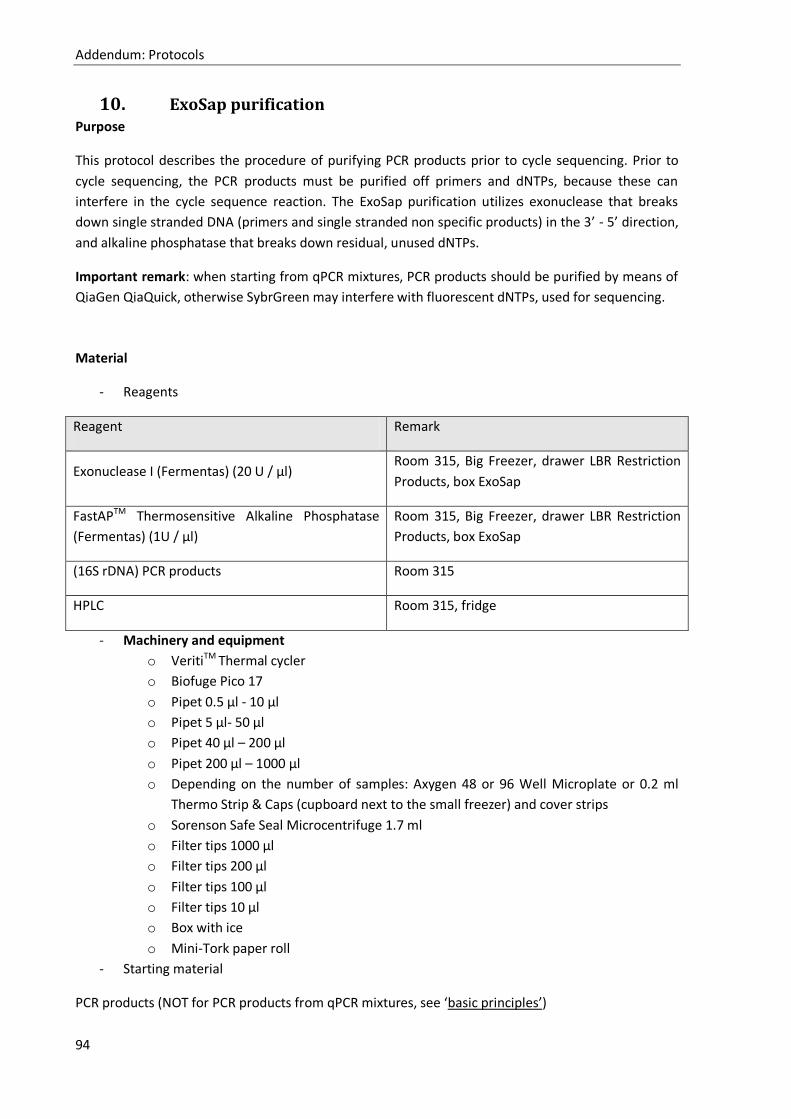
Addendum: Protocols
94
10. ExoSap purification Purpose
This protocol describes the procedure of purifying PCR products prior to cycle sequencing. Prior to
cycle sequencing, the PCR products must be purified off primers and dNTPs, because these can
interfere in the cycle sequence reaction. The ExoSap purification utilizes exonuclease that breaks
down single stranded DNA (primers and single stranded non specific products) in the 3’ - 5’ direction,
and alkaline phosphatase that breaks down residual, unused dNTPs.
Important remark: when starting from qPCR mixtures, PCR products should be purified by means of
QiaGen QiaQuick, otherwise SybrGreen may interfere with fluorescent dNTPs, used for sequencing.
Material
- Reagents
Reagent Remark
Exonuclease I (Fermentas) (20 U / µl) Room 315, Big Freezer, drawer LBR Restriction
Products, box ExoSap
FastAPTM Thermosensitive Alkaline Phosphatase
(Fermentas) (1U / µl)
Room 315, Big Freezer, drawer LBR Restriction
Products, box ExoSap
(16S rDNA) PCR products Room 315
HPLC Room 315, fridge
- Machinery and equipment
o VeritiTM Thermal cycler
o Biofuge Pico 17
o Pipet 0.5 µl - 10 µl
o Pipet 5 µl- 50 µl
o Pipet 40 µl – 200 µl
o Pipet 200 µl – 1000 µl
o Depending on the number of samples: Axygen 48 or 96 Well Microplate or 0.2 ml
Thermo Strip & Caps (cupboard next to the small freezer) and cover strips
o Sorenson Safe Seal Microcentrifuge 1.7 ml
o Filter tips 1000 µl
o Filter tips 200 µl
o Filter tips 100 µl
o Filter tips 10 µl
o Box with ice
o Mini-Tork paper roll
- Starting material
PCR products (NOT for PCR products from qPCR mixtures, see ‘basic principles’)
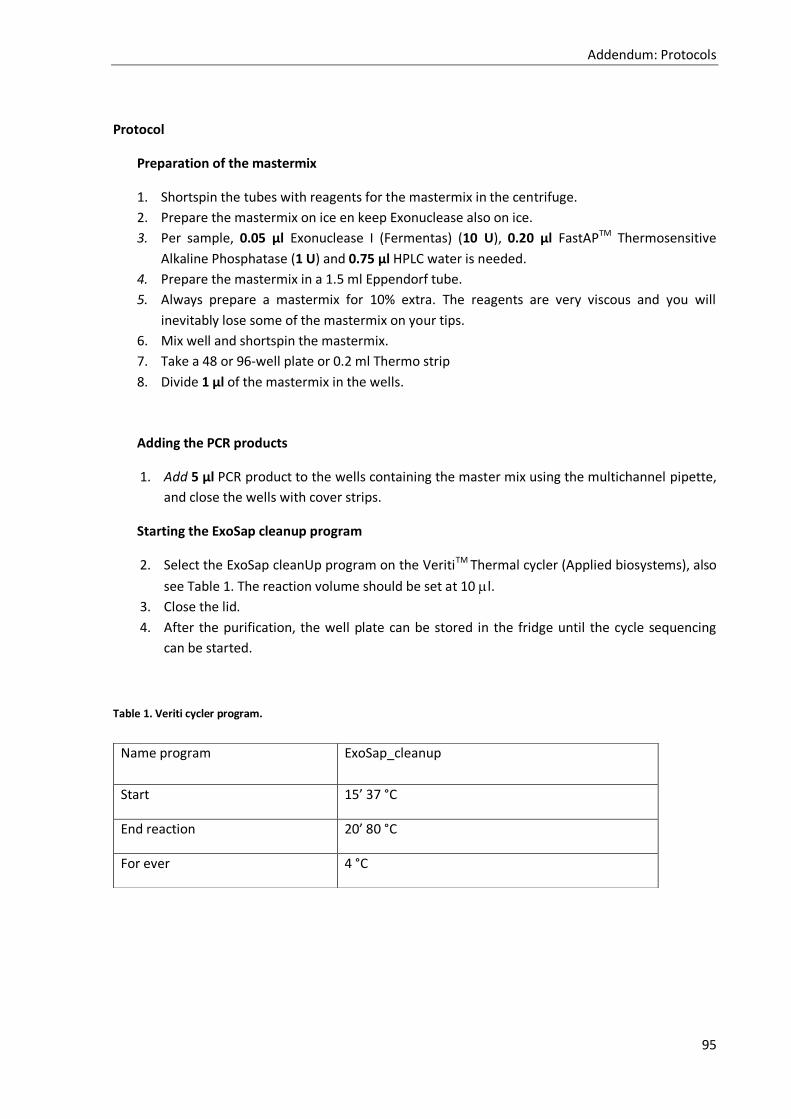
Addendum: Protocols
95
Protocol
Preparation of the mastermix
1. Shortspin the tubes with reagents for the mastermix in the centrifuge.
2. Prepare the mastermix on ice en keep Exonuclease also on ice.
3. Per sample, 0.05 µl Exonuclease I (Fermentas) (10 U), 0.20 µl FastAPTM Thermosensitive
Alkaline Phosphatase (1 U) and 0.75 µl HPLC water is needed.
4. Prepare the mastermix in a 1.5 ml Eppendorf tube.
5. Always prepare a mastermix for 10% extra. The reagents are very viscous and you will
inevitably lose some of the mastermix on your tips.
6. Mix well and shortspin the mastermix.
7. Take a 48 or 96-well plate or 0.2 ml Thermo strip
8. Divide 1 µl of the mastermix in the wells.
Adding the PCR products
1. Add 5 µl PCR product to the wells containing the master mix using the multichannel pipette,
and close the wells with cover strips.
Starting the ExoSap cleanup program
2. Select the ExoSap cleanUp program on the VeritiTM Thermal cycler (Applied biosystems), also
see Table 1. The reaction volume should be set at 10 l.
3. Close the lid.
4. After the purification, the well plate can be stored in the fridge until the cycle sequencing
can be started.
Table 1. Veriti cycler program.
Name program ExoSap_cleanup
Start 15’ 37 °C
End reaction 20’ 80 °C
For ever 4 °C
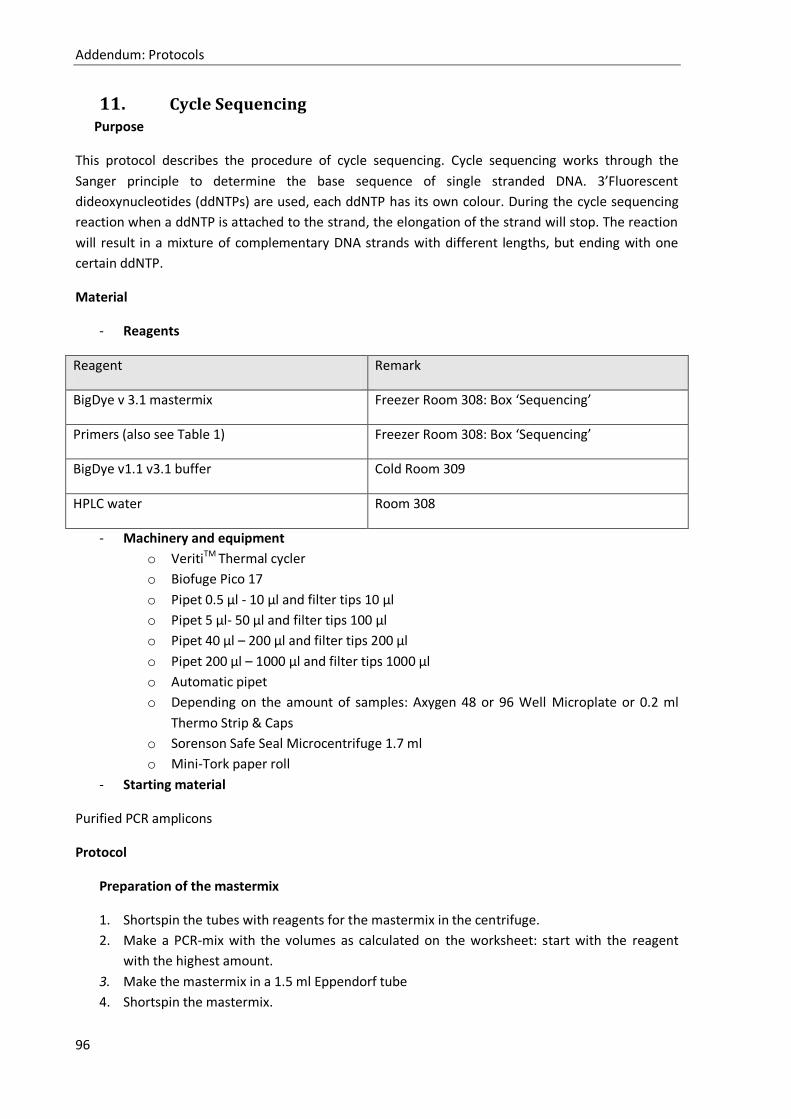
Addendum: Protocols
96
11. Cycle Sequencing Purpose
This protocol describes the procedure of cycle sequencing. Cycle sequencing works through the
Sanger principle to determine the base sequence of single stranded DNA. 3’Fluorescent
dideoxynucleotides (ddNTPs) are used, each ddNTP has its own colour. During the cycle sequencing
reaction when a ddNTP is attached to the strand, the elongation of the strand will stop. The reaction
will result in a mixture of complementary DNA strands with different lengths, but ending with one
certain ddNTP.
Material
- Reagents
Reagent Remark
BigDye v 3.1 mastermix Freezer Room 308: Box ‘Sequencing’
Primers (also see Table 1) Freezer Room 308: Box ‘Sequencing’
BigDye v1.1 v3.1 buffer Cold Room 309
HPLC water Room 308
- Machinery and equipment
o VeritiTM Thermal cycler
o Biofuge Pico 17
o Pipet 0.5 µl - 10 µl and filter tips 10 µl
o Pipet 5 µl- 50 µl and filter tips 100 µl
o Pipet 40 µl – 200 µl and filter tips 200 µl
o Pipet 200 µl – 1000 µl and filter tips 1000 µl
o Automatic pipet
o Depending on the amount of samples: Axygen 48 or 96 Well Microplate or 0.2 ml
Thermo Strip & Caps
o Sorenson Safe Seal Microcentrifuge 1.7 ml
o Mini-Tork paper roll
- Starting material
Purified PCR amplicons
Protocol
Preparation of the mastermix
1. Shortspin the tubes with reagents for the mastermix in the centrifuge.
2. Make a PCR-mix with the volumes as calculated on the worksheet: start with the reagent
with the highest amount.
3. Make the mastermix in a 1.5 ml Eppendorf tube
4. Shortspin the mastermix.
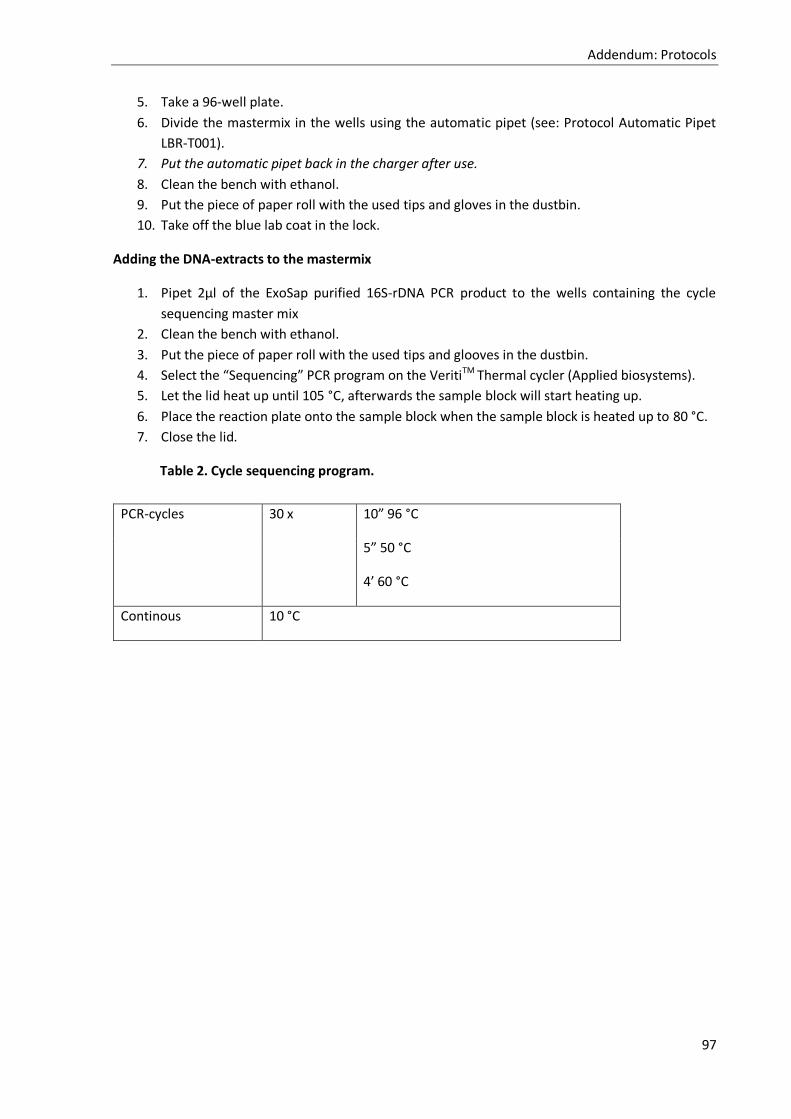
Addendum: Protocols
97
5. Take a 96-well plate.
6. Divide the mastermix in the wells using the automatic pipet (see: Protocol Automatic Pipet
LBR-T001).
7. Put the automatic pipet back in the charger after use.
8. Clean the bench with ethanol.
9. Put the piece of paper roll with the used tips and gloves in the dustbin.
10. Take off the blue lab coat in the lock.
Adding the DNA-extracts to the mastermix
1. Pipet 2µl of the ExoSap purified 16S-rDNA PCR product to the wells containing the cycle
sequencing master mix
2. Clean the bench with ethanol.
3. Put the piece of paper roll with the used tips and glooves in the dustbin.
4. Select the “Sequencing” PCR program on the VeritiTM Thermal cycler (Applied biosystems).
5. Let the lid heat up until 105 °C, afterwards the sample block will start heating up.
6. Place the reaction plate onto the sample block when the sample block is heated up to 80 °C.
7. Close the lid.
Table 2. Cycle sequencing program.
PCR-cycles 30 x 10” 96 °C
5” 50 °C
4’ 60 °C
Continous 10 °C

Addendum: Protocols
98
12. Ethanol Precipitation Purpose
This protocol describes the procedure of ethanol precipitation.
The final step of sequencing is ethanol precipitation and sequence determination on the ABI3130
Genetic Analyzer.
The goal of this reaction is to precipitate DNA molecules so that they don’t contain interfering
components, such as not incorporated fluorescent dideoxynucleotides (ddNTPs) from the cycle
sequencing reaction, as these interfere with the sequence analysis.
Material
- Reagents
Reagent Remark
96% EtOH Fridge Room 315
3 M NaAcetate Fridge Room 315
HPLC water Room 315
HiDi Formamide Fridge Room 315
- Machinery and equipment
o Biofuge Pico 17
o Eppendorf plate centrifuge 5430
o Pipet 0.5 µl - 10 µl and filter tips 10 µl
o Pipet 5 µl- 50 µl and filter tips 100 µl
o Pipet 40 µl – 200 µl and filter tips 200 µl
o Pipet 200 µl – 1000 µl and filter tips 1000 µl
o Automatic pipet
o Depending on the amount of samples: Axygen 48 or 96 Well Microplate or 0.2 ml
Thermo Strip & Caps
o 96 Optical well plate (Applied Biosystems)
o Sorenson Safe Seal Microcentrifuge 1.7 ml
o Mini-Tork paper roll
- Starting material
Purified cycle sequencing product
Protocol
1. Heat the heating block to 95 °C.
2. Prepare 70% EtOH: per sample: 70% EtOH = (105 µl 96% EtOH + 45 µl H2O) / sample (Keep in
fridge till you need it) (See Table 1).
3. Prepare a solution of 95 % ethanol with sodium acetate: mix first per reaction 50 µl of 95%
ethanol with 2 µl of 3 M NaAcetate (vortex before use).
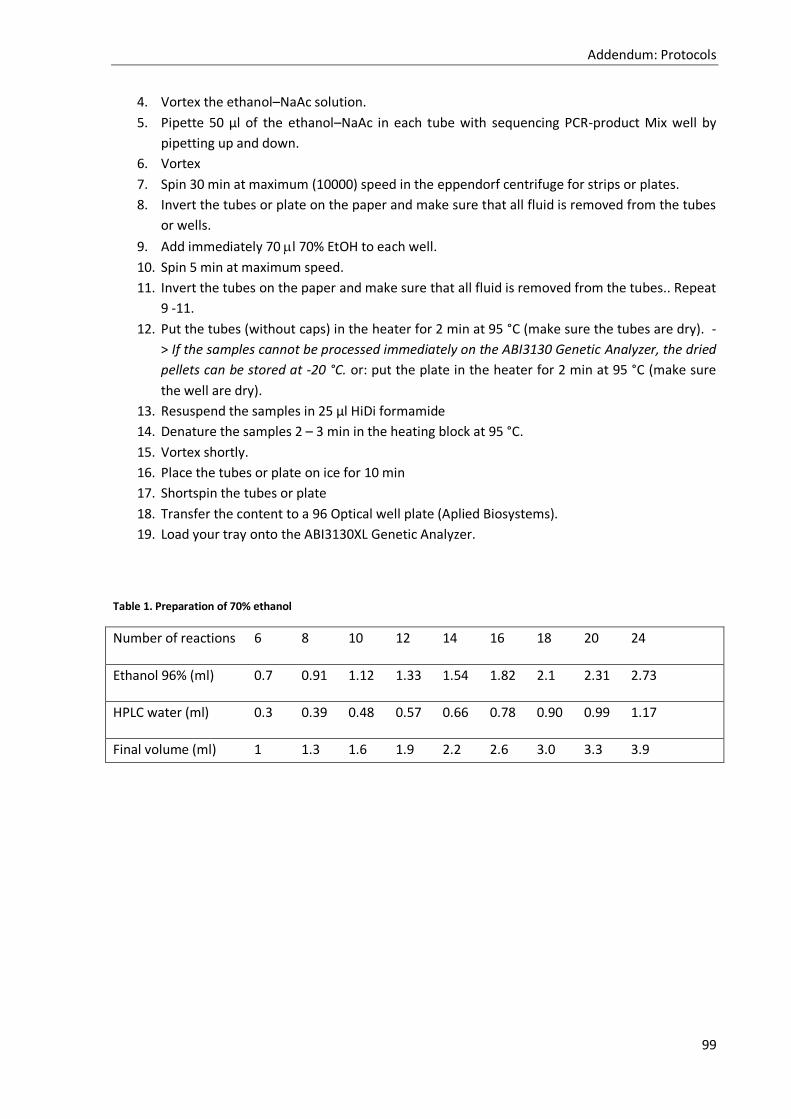
Addendum: Protocols
99
4. Vortex the ethanol–NaAc solution.
5. Pipette 50 µl of the ethanol–NaAc in each tube with sequencing PCR-product Mix well by
pipetting up and down.
6. Vortex
7. Spin 30 min at maximum (10000) speed in the eppendorf centrifuge for strips or plates.
8. Invert the tubes or plate on the paper and make sure that all fluid is removed from the tubes
or wells.
9. Add immediately 70 l 70% EtOH to each well.
10. Spin 5 min at maximum speed.
11. Invert the tubes on the paper and make sure that all fluid is removed from the tubes.. Repeat
9 -11.
12. Put the tubes (without caps) in the heater for 2 min at 95 °C (make sure the tubes are dry). -
> If the samples cannot be processed immediately on the ABI3130 Genetic Analyzer, the dried
pellets can be stored at -20 °C. or: put the plate in the heater for 2 min at 95 °C (make sure
the well are dry).
13. Resuspend the samples in 25 µl HiDi formamide
14. Denature the samples 2 – 3 min in the heating block at 95 °C.
15. Vortex shortly.
16. Place the tubes or plate on ice for 10 min
17. Shortspin the tubes or plate
18. Transfer the content to a 96 Optical well plate (Aplied Biosystems).
19. Load your tray onto the ABI3130XL Genetic Analyzer.
Table 1. Preparation of 70% ethanol
Number of reactions 6 8 10 12 14 16 18 20 24
Ethanol 96% (ml) 0.7 0.91 1.12 1.33 1.54 1.82 2.1 2.31 2.73
HPLC water (ml) 0.3 0.39 0.48 0.57 0.66 0.78 0.90 0.99 1.17
Final volume (ml) 1 1.3 1.6 1.9 2.2 2.6 3.0 3.3 3.9
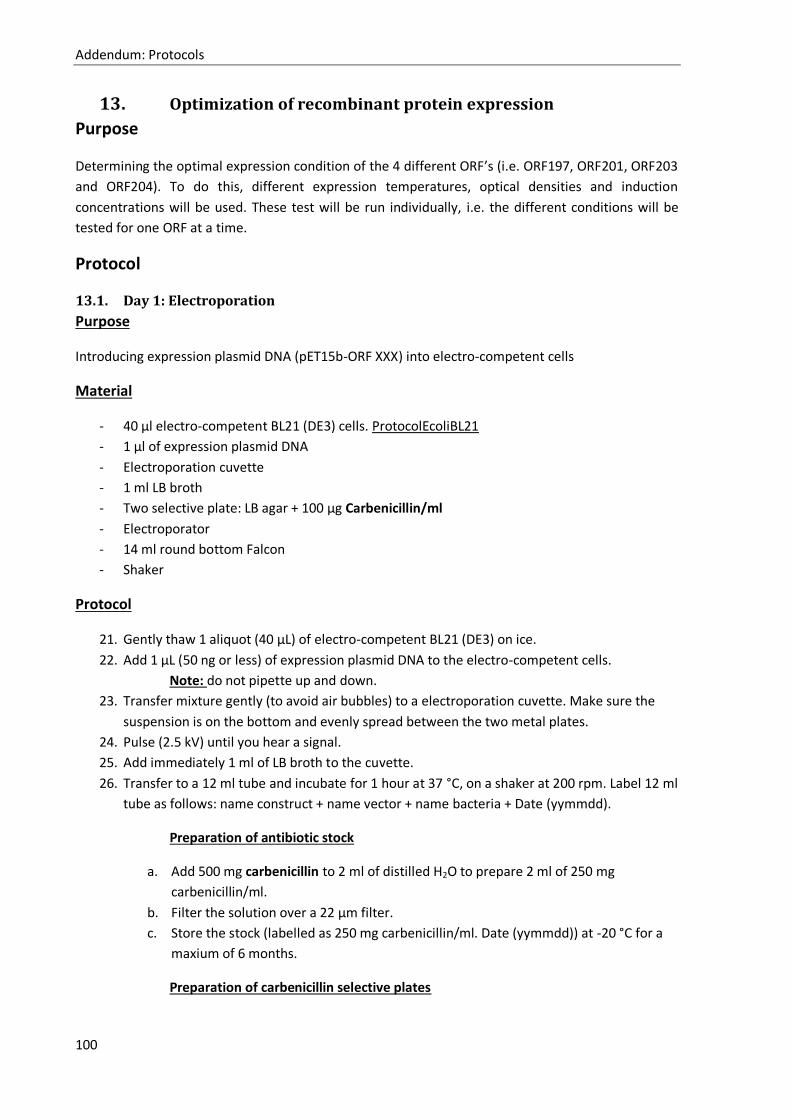
Addendum: Protocols
100
13. Optimization of recombinant protein expression
Purpose
Determining the optimal expression condition of the 4 different ORF’s (i.e. ORF197, ORF201, ORF203
and ORF204). To do this, different expression temperatures, optical densities and induction
concentrations will be used. These test will be run individually, i.e. the different conditions will be
tested for one ORF at a time.
Protocol
13.1. Day 1: Electroporation
Purpose
Introducing expression plasmid DNA (pET15b-ORF XXX) into electro-competent cells
Material
- 40 µl electro-competent BL21 (DE3) cells. ProtocolEcoliBL21
- 1 µl of expression plasmid DNA
- Electroporation cuvette
- 1 ml LB broth
- Two selective plate: LB agar + 100 µg Carbenicillin/ml
- Electroporator
- 14 ml round bottom Falcon
- Shaker
Protocol
21. Gently thaw 1 aliquot (40 μL) of electro-competent BL21 (DE3) on ice.
22. Add 1 μL (50 ng or less) of expression plasmid DNA to the electro-competent cells.
Note: do not pipette up and down.
23. Transfer mixture gently (to avoid air bubbles) to a electroporation cuvette. Make sure the
suspension is on the bottom and evenly spread between the two metal plates.
24. Pulse (2.5 kV) until you hear a signal.
25. Add immediately 1 ml of LB broth to the cuvette.
26. Transfer to a 12 ml tube and incubate for 1 hour at 37 °C, on a shaker at 200 rpm. Label 12 ml
tube as follows: name construct + name vector + name bacteria + Date (yymmdd).
Preparation of antibiotic stock
a. Add 500 mg carbenicillin to 2 ml of distilled H2O to prepare 2 ml of 250 mg
carbenicillin/ml.
b. Filter the solution over a 22 µm filter.
c. Store the stock (labelled as 250 mg carbenicillin/ml. Date (yymmdd)) at -20 °C for a
maxium of 6 months.
Preparation of carbenicillin selective plates
Addendum: Protocols
101
d. Mark the bottom of 8 empty plates as follows: LB + 100 µg Cb/ml. DATE.
e. Add 40 µl of 250 mg carbenicillin/ml stock to 100 ml LB agar.
f. Let the plates solidify.
g. Store the plates that are not used at 4 °C for a maximum of 6 months.
27. Spread 10 µl, respectively 50 µl, of the incubated bacteria to selective plates.
28. Grow overnight (ON) at 37 °C.
29. The next day: store plates at 4 °C
13.2. Day 2: Pre-culture
Purpose
Making of a small scale culture to be used to prepare the actual expression culture. Make 2 pre-
cultures to assure that overenting is a success.
Material (for 2 pre-cultures of 50 ml)
- Carbenicillin antibiotic stock ( 250 mg/ml)
- 100 ml LB broth
- 2X 100 ml Erlenmeyer
- Transformed bacterial culture (see day 1)
Protocol
1. Transfer 50 ml LB to new 100 ml Erlenmeyer
2. Add Carbenicilline, final concentration of 25 µg/ml
3. Inoculate media with one colony
Addendum: Protocols
102
13.3. Day 3: Expression test
Purpose
Testing if protein expression is possible in E. coli and check whether to protein is soluble and which
conditions are best suitable for expression. Three expression temperatures (i.e. 16, 28 and 37 °C),
two different optical densities (i.e. OD600nm = 0.6 and OD600nm = 1.0) and two different induction
concentrations (i.e. 0.1 and 1.0 mM IPTG) will be used, this will lead to 12 different expression
cultures.
Material (for 12 epressions)
- Pre-culture
- 12 X 50 ml LB broth
- 12 X 100 ml Erlenmeyers
- Carbenicillin antibiotic stock ( 250 mg/ml)
- 10 ml IPTG Stock ( 1 M)
Protocol
1. Inoculate 50 ml LB broth + Cb with 1 ml of the pre-culture (for protein expression
2. Incubate at X °C on shaker ( 200 rpm) till OD600nm is 0.6 or 1.0
a. Incubate 4 cultures at 37 °C for later induction at 37 °C
i. 2 cultures will be grown to an OD600nm = 0.6
i. One culture will be induced with 0.1 mM IPTG
ii. One culture will be induced with 1 M IPTG
ii. 2 cultures will be grown to an OD600nm = 1.0
i. One culture will be induced with 0.1 mM IPTG
ii. One culture will be induced with 1 M IPTG
b. Incubate 4 cultures at 28 °C for later induction at 28 °C
i. 2 cultures will be grown to an OD600nm = 0.6
i. One culture will be induced with 0.1 mM IPTG
ii. One culture will be induced with 1 M IPTG
ii. 2 cultures will be grown to an OD600nm = 1.0
i. One culture will be induced with 0.1 mM IPTG
ii. One culture will be induced with 1 M IPTG
c. Incubate 4 cultures at 37 °C for later induction at 16 °C
i. 2 cultures will be grown to an OD600nm = 0.6
i. One culture will be induced with 0.1 mM IPTG
ii. One culture will be induced with 1 M IPTG
ii. 2 cultures will be grown to an OD600nm = 1.0
i. One culture will be induced with 0.1 mM IPTG
ii. One culture will be induced with 1 M IPTG
Note: takes about 3 – 5 h, take OD every 30 min and write down in added document.

Addendum: Protocols
103
Preparing 1M IPTG stock
d. Prepare a 10 ml stock solution (can be short term stored at 4 °C or long term at -20
°C) :
i. Take 2.38 g IPTG (Mw = 238,3 g/mol) and put in 15 ml tube
ii. Add 10 ml distilled H2O
iii. Filter solution on a 0.22 µm filter in a new 15 ml tube
iv. Label tube : IPTG + Filtered + Date + Concentration
3. Before induction remove 1 ml culture and centrifuge for 5 min at max speed, remove
supernatans and store pellet at -20 °C as negative control
4. Add 50 µl/50 ml 1M IPTG (final concentration: 1 mM) or Add 5 µl/50 ml 1M IPTG (final
concentration: 0.1 mM)
5. Incubate at X °C on shaker (200 rpm) for at least 3 h or ON when grown at 20 °C
6. Transfer 1 ml of the culture (after 3h induction or ON induction) to a new 1.5 ml Eppendorf
tube
a. Centrifugate at max speed for 5 min
b. remove supernatans
c. store pellet at -20 °C and resuspended on another day
7. Harvest the cells by centrifugation at 3000 g for 10 min
8. Remove supernatant
9. Store pellets at -80 °C

Addendum: Protocols
104
13.4. Day 4: SDS-PAGE
Purpose
Visualization of the expressed protein by means of SDS-PAGE and commasie-blue colouring.
Material
- 10 ml Laemmli buffer
- 3 X 10-slot 12 % SDS-PAGE
Protocol
1. Resuspend pellet in 100 µl Laemmli buffer
2. Boil resuspend pellet at 95 °C for 10 min
3. Short spin
4. Transfer 15 µl to SDS-PAGE
a. Use fowling loading sequence:
Gel 1 Gel 2 Gel 3
1 Marker Marker Marker
2 OD = 0.6 before ON induction 0.1 mM IPTG at
20 °C
OD = 0.6 before 0.1 mM IPTG at 28 °C OD = 0.6 before 0.1 mM IPTG at 37 °C
3 OD = 0.6 ON induction 0.1 mM IPTG at 20 °C OD = 0.6 3h induction 0.1 mM IPTG at 28 °C OD = 0.6 3h induction 0.1 mM IPTG at 37 °C
4 OD = 0.6 before ON induction 1.0 mM IPTG at
20 °C
OD = 0.6 before 1.0 mM IPTG at 28 °C OD = 0.6 before 1.0 mM IPTG at 37 °C
5 OD = 0.6 ON induction 1.0 mM IPTG at 20 °C OD = 0.6 3h induction 1.0 mM IPTG at 28 °C OD = 0.6 3h induction 1.0 mM IPTG at 37 °C
6 OD = 1.0 before ON induction 0.1 mM IPTG at
20 °C
OD = 1.0 before 0.1 mM IPTG at 28 °C OD = 1.0 before 0.1 mM IPTG at 37 °C
7 OD = 1.0 ON induction 0.1 mM IPTG at 20 °C OD = 1.0 3h induction 0.1 mM IPTG at 28 °C OD = 1.0 3h induction 0.1 mM IPTG at 37 °C
8 OD = 1.0 before ON induction 1.0 mM IPTG at
20 °C
OD = 1.0 before 1.0 mM IPTG at 28 °C OD = 1.0 before 1.0 mM IPTG at 37 °C
9 OD = 1.0 ON induction 1.0 mM IPTG at 20 °C OD = 1.0 3h induction 1.0 mM IPTG at 28 °C OD = 1.0 3h induction 1.0 mM IPTG at 37 °C
10 Marker Marker Marker
5. Run at 1.5 V for 1.5 – 2 h
6. Remove gel from glass plate and put in Commasie Brilliant Blue and put on shaker overnight
7. Remove Commasie Brilliant Blue and add washing solution put on shaker for 1 day
Addendum: Protocols
105
14. 12 % SDS-PAGE gel
Purpose
Making of a polyacryl amide gel for the electrophoresis of a protein sample. Protocol was taken from
the internet (http://mach7.bluehill.com/proteinc/tutorial/sdspage.html)
Material
- SDS
- Beta-mercapto-ethanol
- Glycerol
- Tris-HCl, pH 6.8
- Bromphenolblue
- Acrylamide/Bis-acrylamide
- Ammonium persulfate (APS)
- TEMED
Protocol
SDS Gel Electrophoresis
You will need the following reagents:
5x Sample Buffer
10% w/v SDS
10 mM Dithiothreitol, or beta-mercapto-ethanol
20 % v/v Glycerol
0.2 M Tris-HCl, pH 6.8
0.05% w/v Bromophenolblue
Should add up to 8M urea for really hydrophobic proteins
1x Running Buffer:
25 mM Tris-HCl
200 mM Glycine
0.1% (w/v) SDS

Addendum: Protocols
106
1x Running Gel Solution
For different applications increase your desired percentage acrylamide, prepare up 30 ml of running
gel by selecting one of the following percentages and mixing the ingredients shown below. After
adding TEMED and APS your gel will polymerize fairly quickly, so do not add these until you are sure
you are ready to pour.
7% 10% 12% 15%
H2O 15.3 ml 12.3 ml 10.2 ml 7.2 ml
1.5 M Tris-HCl, pH 8.8 7.5 ml 7.5 ml 7.5 ml 7.5 ml
20% (w/v) SDS 0.15 ml 0.15 ml 0.15 ml 0.15 ml
Acrylamide/Bis-acrylamide
(30%/0.8% w/v) 6.9 ml 9.9 ml 12.0 ml 15.0 ml
10% (w/v) ammonium persulfate (APS) 0.15 ml 0.15 ml 0.15 ml 0.15 ml
TEMED 0.02 ml 0.02 ml 0.02 ml 0.02 ml
Stacking Gel Solution (4% Acrylamide):
H2O 3.075 ml
0.5 M Tris-HCl, pH 6.8 1.25 ml
20% (w/v) SDS 0.025 ml
Acrylamide/Bis-acrylamide
(30%/0.8% w/v) 0.67 ml
10% (w/v) ammonium persulfate (APS) 0.025 ml
TEMED 0.005 ml
Pouring the Gels:
Choose a percentage acrylamide based on the molecular weight range of proteins you wish to
separate:
% Gel M.W. Range
7 50 kDa - 500 kDa
10 20 kDa - 300 kDa
12 10 kDa - 200 kDa
15 3 kDa - 100 kDa
Now mix the ingredients needed for the chosen percentage and pour the solution quickly into your
gel casting form - be sure to leave a some room for the stacking gel - leave about 2 centimeters
below the bottom of the comb for the stacking gel. Look for bubbles and remove them, then layer
the top of the gel with water saturated butanol or, very carefully, with water. This will remove
bubbles at the top of the gel and will ensure this part does not dry out. Wait for about 30 minutes for
the gel to polymerize completely.
While waiting mix the reagents for the stacking gel, but LEAVE OUT the APS and TEMED until you are
ready to pour this gel; stacking gels will polymerize more quickly than desired sometimes while one is
trying to add combs to make wells.
When the running gel is polymerized wash out the butanol completely or your stacker may separate
from the gel and you will get ugly running artifacts. Mix in the polymerizing reagents and pour the
stacking gel on top of the running gel. Insert your combs trying not to get bubbles stuck underneath
and allow another 30 min - 1 hour for complete polymerization. Your gels are ready!

Addendum: Protocols
107
15. Western Blot
Purpose
Western blotting is a technique to transfer proteins from a SDS-PAGE gel to a membrane. By using
specific antibodies, it is possible to detect proteins of interest. In this way it is possible to detect
6xHis-tag recombinant protein by using anti-His-HRP (i.e. Horse radish) antibodies.
The described protocol can only be used for 1 gel.
Material
- Bio-Rad Blotting system
- 2 x sponge
- 6 x Whatmann paper, cut at the same size as the SDS-PAGE gel
- Nitrocellulose membrane Hybond ECL, cut at the same size as the SDS-PAGE gel
- 1 L Protein transfer buffer
- 1 L PBS
- 50 ml Blocking buffer (BB)
- Anti-His antibody (1/5000 dilution)
- 50 ml Blocking buffer with Tween 20 (BB-T)
- PBS with Tween 20 (PBS-T)
- Lumi-light solution 1 and 2
- MQ H20
- ECL reaction mixture
- Photosensitive film
- Plastic foil
- Development unit
Method
A. Electroblotting
1. Protein transferbuffer (1 L):
a. 25 mM Tris (3,03 g)
b. 192 mM glycine (14,4 g)
c. 20 % MeOH (200 ml)
2. Wash the SDS-PAGE gel (without stacking gel) for 5 minutes in the protein transfer buffer.
3. Cut 6 x Whatmann paper at the same size as the gel (without the stacking gel).
4. Make the first sponge wet in the protein transfer buffer and put on the black (negative) site
of the cassette.
5. Make 3 Whatmann papers wet and put on sponge.
6. Add SDS-PAGE.
7. Make ECL Hybond nitrocellulose membrane wet and put on gel.
8. Make 3 Whatmann papers wet and put on sponge.
9. Add a wet sponge and put on the white side (positive) of the cassette.
Note: Make sure that there are no air bubbles present, this can be avoided by gently roiling
over the prepared structure with a Pasteur pipette.

Addendum: Protocols
108
10. Place cassette in blotting tank and fill with protein transfer buffer. An ice trade can be added
to cool down the blotting process.
11. Blotting can be performed overnight at 25 V or for 2 h at 40 V
B. Blocking
1. Blocking buffer (50 ml):
a. 50 ml PBS with 5 g non fat dried milk.
2. Rinse membrane in 20 ml dH2O.
3. Rinse membrane in 20 ml PBS.
4. Incubate membrane for 1 – 2 h in 20 ml blocking buffer at room temperature or at 4 °C
overnight.
C. Probing
1. PBS-T (250 ml):
a. 250 ml PBS with 250 µl Tween 20.
2. Wash membrane:
a. 3 x 20 seconds in PBS-T.
b. 2 x 5 minutes in PBS-T.
3. BB-T (50 ml):
a. 50 ml Blockingbuffer with 50 µl Tween 20.
4. Incubate membrane in 20 ml 1 % BB-T with anti-His antibody (1/5000 dilution).
5. Incubate at room temperature for 1 h.
6. Wash membrane in new bucket:
a. 3 x 20 seconds in PBS-T
b. 2 x 5 minutes in PBS-T
D. Detection
1. Mix 0,5 ml of ECL reagents 1 and 2.
2. Put membrane on Saran foil (protein up) and remove excess of washing solution.
3. Add ECL mixture and disperse evenly.
4. Make envelope with Saran (protein up).
5. Mark orientation with glow-in-the-dark sickers.
6. Place film on blot and incubate 30 sec up to 30 min, depending on the signal.
7. Develop film: developing (until bleaching), fixation (until clear), H20.

Addendum: Protocols
109
16. ORF XXX overexpression and Purification
16.1. Day 1: Electroporation
Purpose
Introducing expression plasmid DNA (pET15b-ORF XXX) into electro-competent cells
Material
- 40 µl electro-competent BL21 (DE3) cells. ProtocolEcoliBL21
- 1 µl of expression plasmid DNA
- Electroporation cuvette
- 1 ml LB broth
- Two selective plate: LB agar + 100 µg Carbenicillin/ml
- Electroporator
- 14 ml round bottom Falcon
- Shaker
Protocol
30. Gently thaw 1 aliquot (40 μL) of electro-competent BL21 (DE3) on ice.
31. Add 1 μL (50 ng or less) of expression plasmid DNA to the electro-competent cells.
Note: do not pipette up and down.
32. Transfer mixture gently (to avoid air bubbles) to a electroporation cuvette. Make sure the
suspension is on the bottom and evenly spread between the two metal plates.
33. Pulse (2.5 kV) until you hear a signal.
34. Add immediately 1 ml of LB broth to the cuvette.
35. Transfer to a 12 ml tube and incubate for 1 hour at 37 °C, on a shaker at 200 rpm. Label 12 ml
tube as follows: name construct + name vector + name bacteria + Date (yymmdd).
Preparation of antibiotic stock
h. Add 500 mg carbenicillin to 2 ml of distilled H2O to prepare 2 ml of 250 mg
carbenicillin/ml.
i. Filter the solution over a 22 µm filter.
j. Store the stock (labelled as 250 mg carbenicillin/ml. Date (yymmdd)) at -20°C for a
maxium of 6 months.
Preparation of carbenicillin selective plates
k. Mark the bottom of 8 empty plates as follows: LB + 100 µg Cb/ml. DATE.
l. Add 40 µl of 250 mg carbenicillin/ml stock to 100 ml LB agar.
m. Let the plates solidify.
n. Store the plates that are not used at 4 °C for a maximum of 6 months.
36. Spread 20 µl, respectively 100 µl, of the incubated bacteria to selective plates.
37. Grow overnight at 37 °C.
Addendum: Protocols
110
38. The next day: store plates at 4 °C
16.2. Day 2: Pre-culture
Purpose
Making of a small scale culture to be used to prepare the actual expression culture.
Material (for x pre-cultures)
- Carbenicillin antibiotic stock ( 250 mg/ml)
- LB broth
- X 100 ml falcon bottles
- X transformed bacterial culture (see day 1)
Protocol
1. Transfer 50 ml LB to new falcon bottle
2. Add Carbenicilline, final concentration of 25 µg/ml
3. Inoculate media with one colony
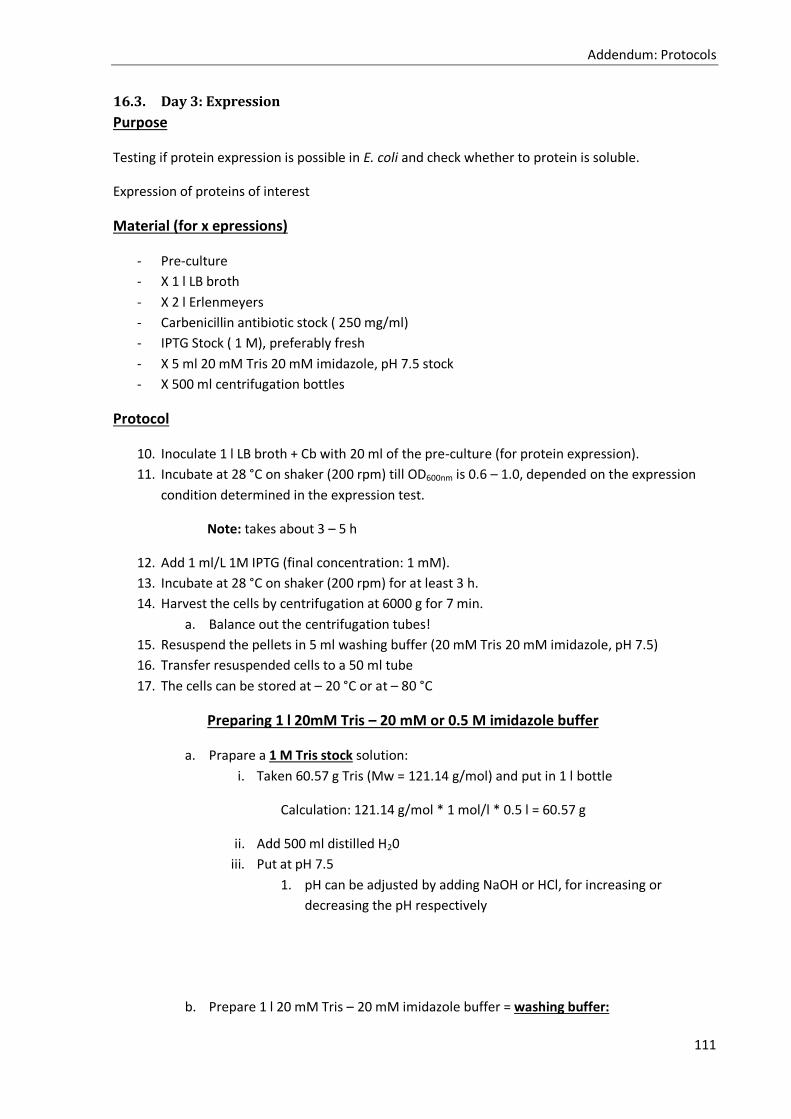
Addendum: Protocols
111
16.3. Day 3: Expression
Purpose
Testing if protein expression is possible in E. coli and check whether to protein is soluble.
Expression of proteins of interest
Material (for x epressions)
- Pre-culture
- X 1 l LB broth
- X 2 l Erlenmeyers
- Carbenicillin antibiotic stock ( 250 mg/ml)
- IPTG Stock ( 1 M), preferably fresh
- X 5 ml 20 mM Tris 20 mM imidazole, pH 7.5 stock
- X 500 ml centrifugation bottles
Protocol
10. Inoculate 1 l LB broth + Cb with 20 ml of the pre-culture (for protein expression).
11. Incubate at 28 °C on shaker (200 rpm) till OD600nm is 0.6 – 1.0, depended on the expression
condition determined in the expression test.
Note: takes about 3 – 5 h
12. Add 1 ml/L 1M IPTG (final concentration: 1 mM).
13. Incubate at 28 °C on shaker (200 rpm) for at least 3 h.
14. Harvest the cells by centrifugation at 6000 g for 7 min.
a. Balance out the centrifugation tubes!
15. Resuspend the pellets in 5 ml washing buffer (20 mM Tris 20 mM imidazole, pH 7.5)
16. Transfer resuspended cells to a 50 ml tube
17. The cells can be stored at – 20 °C or at – 80 °C
Preparing 1 l 20mM Tris – 20 mM or 0.5 M imidazole buffer
a. Prapare a 1 M Tris stock solution:
i. Taken 60.57 g Tris (Mw = 121.14 g/mol) and put in 1 l bottle
Calculation: 121.14 g/mol * 1 mol/l * 0.5 l = 60.57 g
ii. Add 500 ml distilled H20
iii. Put at pH 7.5
1. pH can be adjusted by adding NaOH or HCl, for increasing or
decreasing the pH respectively
b. Prepare 1 l 20 mM Tris – 20 mM imidazole buffer = washing buffer:

Addendum: Protocols
112
i. Take 20 ml 1 M Tris stock solution and transfer to new 1 l bottle.
ii. Add distilled H20 till a total volume of 1 l.
iii. Take 1.362 g imidazole (Mw = 68.077 g/mol) and put in 20 mM Tris solution.
Calculation: 68.077 g/mol * 0.02 mol/l * 1 l = 1.362 g
iv. Stir the solution until all the imidazole is dissolved.
v. Check pH!
c. Prepare 1 l 20 mM Tris – 0.5 M imidazole buffer = elution buffer:
i. Take 20 ml 1 M Tris stock solution and transfer to new 1 l bottle.
ii. Add distilled H20 till a total volume of 1 l.
iii. Take 34 g imidazole (Mw = 68.077 g/mol) and put in 20 mM Tris solution.
Calculation: 68.077 g/mol * 0.5 mol/l * 1 l = 34 g
iv. Stir the solution until all the imidazole is dissolved.
v. Check pH!

Addendum: Protocols
113
16.4. Day 4: Purification
Purpose
Purification of the overexpressed protein and obtaining a pure protein solution
Material (for one protein)
- 300 ml Washing buffer = 20 mM Tris – 20 mM imidazole pH 7.5
- 200 ml Elution buffer = 20 mM Tris – 0.5 M imidazole pH 7.5
- 100 ml 0.1 M NiSO4
- Resuspended cells
- Sonnicator
- Centrifugation tubes
- 400 ml 20 mM Tris, pH 7.5
Protocol
Cell lysation:
1. Sonicate cells four times 2 min at 30 % (with 1 sec pulse, 1 sec no-pulse)
Note: keep the samples on ice!
2. Centrifuge 30 min at 100 000g. Use appropriate tube
3. Transfer supernatans to new tube and keep on ice
Protein purification on NiNTA column:
1. Connect NiNTA column to Äkta.
2. Put pump A on washing buffer, pH 7.5.
3. Pump until conductivity line stabilizes.
a. Make sure that there is no air in the column.
4. Put pump A on 0.1 M NiSO4 until conductivity line stabilizes.
5. Wash column by putting pump A on washing buffer, pH 7.5.
6. Pump until conductivity line stabilizes.
7. Put pump A in protein sample and add 10 ml washing buffer when protein solution is almost
completely pumped up. Be careful to not pump air!
a. Transfer elution tube to new 100 ml bottle and catch effluent (in case something
went wrong you still have your protein sample!).
8. Put pump A on washing solution.
9. Pump until 280 nm line stabilizes (this lines corresponds with the presence of proteins, first it
will rise and decline. This indicates the proteins that are not withheld on the column).
10. Put pump A on elution buffer.
11. Catch effluent when the 280 nm line starts to rise in en new 50 ml falcon tube.
12. Keep pump A on elution buffer until 280 nm line stabilizes.
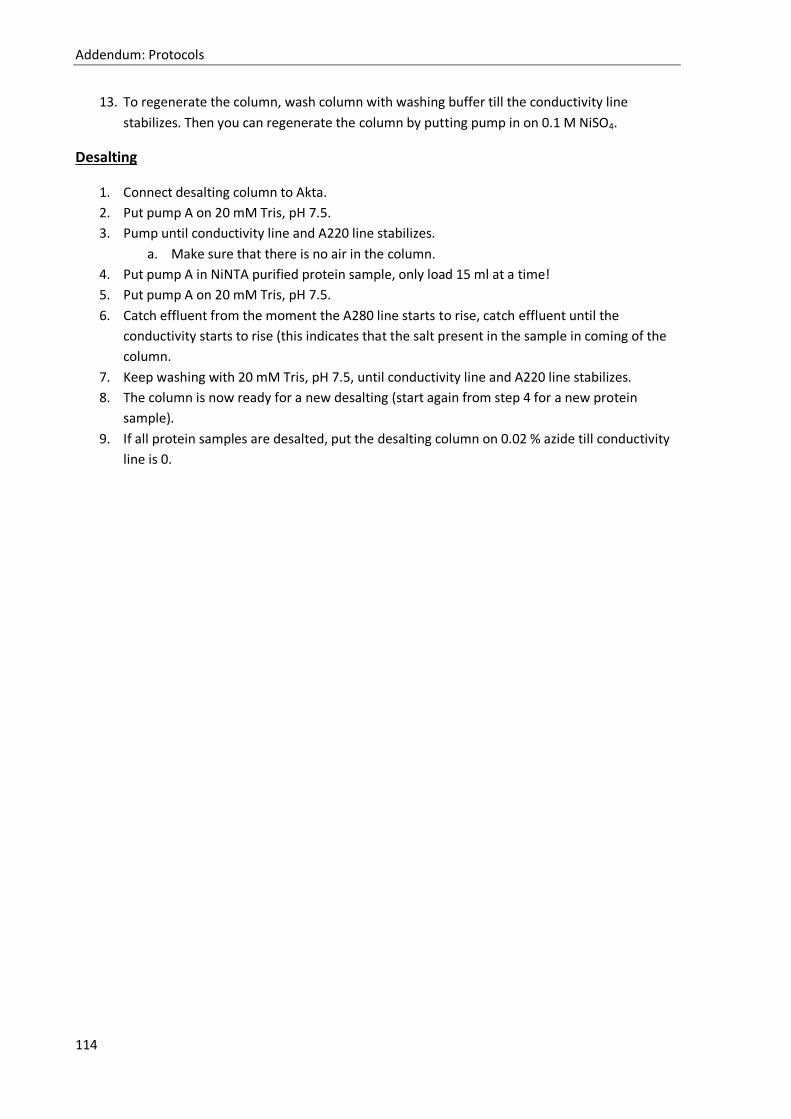
Addendum: Protocols
114
13. To regenerate the column, wash column with washing buffer till the conductivity line
stabilizes. Then you can regenerate the column by putting pump in on 0.1 M NiSO4.
Desalting
1. Connect desalting column to Akta.
2. Put pump A on 20 mM Tris, pH 7.5.
3. Pump until conductivity line and A220 line stabilizes.
a. Make sure that there is no air in the column.
4. Put pump A in NiNTA purified protein sample, only load 15 ml at a time!
5. Put pump A on 20 mM Tris, pH 7.5.
6. Catch effluent from the moment the A280 line starts to rise, catch effluent until the
conductivity starts to rise (this indicates that the salt present in the sample in coming of the
column.
7. Keep washing with 20 mM Tris, pH 7.5, until conductivity line and A220 line stabilizes.
8. The column is now ready for a new desalting (start again from step 4 for a new protein
sample).
9. If all protein samples are desalted, put the desalting column on 0.02 % azide till conductivity
line is 0.
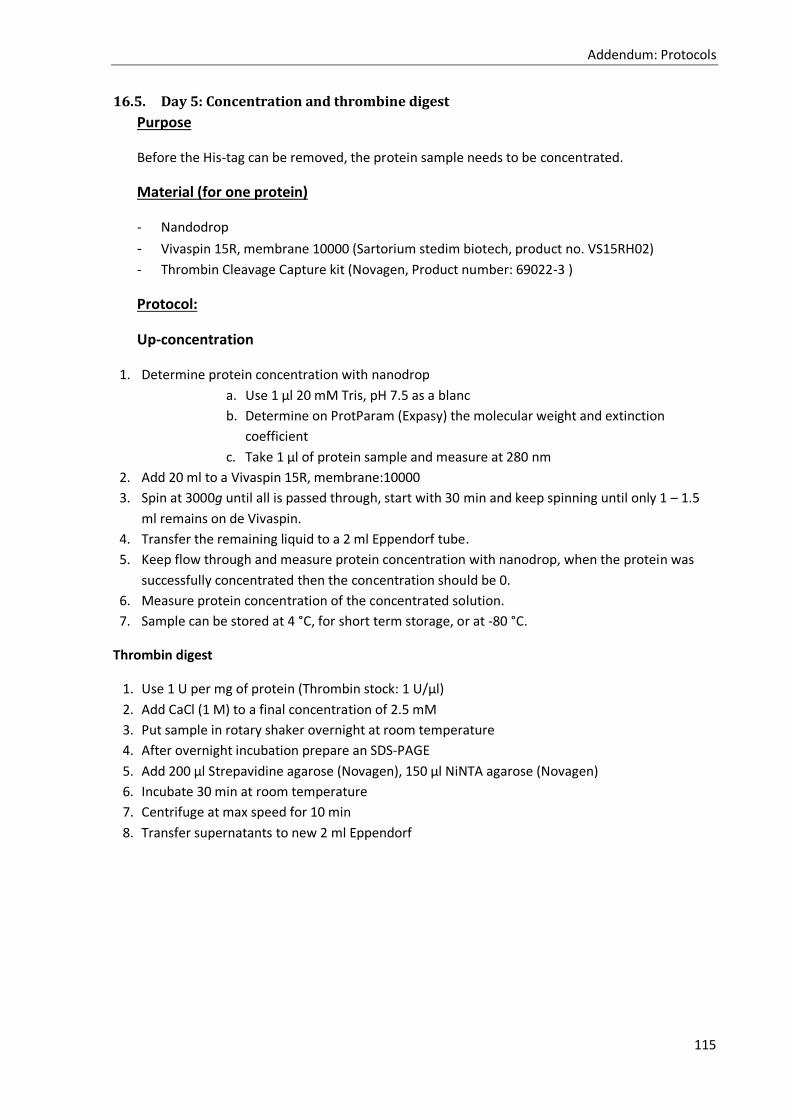
Addendum: Protocols
115
16.5. Day 5: Concentration and thrombine digest
Purpose
Before the His-tag can be removed, the protein sample needs to be concentrated.
Material (for one protein)
- Nandodrop
- Vivaspin 15R, membrane 10000 (Sartorium stedim biotech, product no. VS15RH02)
- Thrombin Cleavage Capture kit (Novagen, Product number: 69022-3 )
Protocol:
Up-concentration
1. Determine protein concentration with nanodrop
a. Use 1 µl 20 mM Tris, pH 7.5 as a blanc
b. Determine on ProtParam (Expasy) the molecular weight and extinction
coefficient
c. Take 1 µl of protein sample and measure at 280 nm
2. Add 20 ml to a Vivaspin 15R, membrane:10000
3. Spin at 3000g until all is passed through, start with 30 min and keep spinning until only 1 – 1.5
ml remains on de Vivaspin.
4. Transfer the remaining liquid to a 2 ml Eppendorf tube.
5. Keep flow through and measure protein concentration with nanodrop, when the protein was
successfully concentrated then the concentration should be 0.
6. Measure protein concentration of the concentrated solution.
7. Sample can be stored at 4 °C, for short term storage, or at -80 °C.
Thrombin digest
1. Use 1 U per mg of protein (Thrombin stock: 1 U/µl)
2. Add CaCl (1 M) to a final concentration of 2.5 mM
3. Put sample in rotary shaker overnight at room temperature
4. After overnight incubation prepare an SDS-PAGE
5. Add 200 µl Strepavidine agarose (Novagen), 150 µl NiNTA agarose (Novagen)
6. Incubate 30 min at room temperature
7. Centrifuge at max speed for 10 min
8. Transfer supernatants to new 2 ml Eppendorf

Addendum: Protocols
116
16.6. Day 6: Gel sizing
Purpose
Removing of the His-tag and a further purification of the sample
Material
- 1 l phosphate buffer
- Hiload 16/600 Superdex 75 pg (GE Healthcare Life Sciences, Product code: 28-9893-33)
- 2.5 ml glass syringe
Protocol
1. Prepare 1 l phosphate buffer (filter the buffer before use!):
a. 137 mM NaCl (Mw: 58.4 g/mol) -> 8 g
b. 2.7 mM KCl (Mw: 74.5 g/mol) -> 0.2 g
c. 10 mM Na2HPO4 (Mw: 141.9 g/mol) -> 1.44 g
d. 2 mM KH2PO4 (Mw: 136.1 g/mol) -> 0.24 g
2. Put pump A and B in phosphate buffer
3. Perform pumpwash on pump A
4. Connect Hiload 16/600 Superdex 75 pg to Äkta
5. Put column on buffer, run at 1.5 ml/min (takes about 1.5 h)
6. Once 35 ml is put on the column, start fractionation (1 ml)

Addendum: Protocols
117
17. Determination of bacteriophage titer Purpose:
Determination of the amount of purified phage (i.e. phage titer), defined as Plaque Forming Units
(PFU)/ml
Material/ per each of x dilutions:
- X Sterile 14 ml tubes
- X x 5 ml LB broth
- X 90 mm Petri dishes with LB agar (1.5%)
- X x 2-3 ml semi-solid LB agar (0.6%)
Protocol:
1. Prepare a serial dilution (in LB broth or saline), ranging from e.g. 1/102 to 1/1010 (100 fold
dilutions): add 50 µl of phage suspension to 5 ml of diluens.
2. Transfer 1 ml from the 1/108, 1/109 and 1/1010 dilution to a new 14 ml tube.
3. Boil semi-solid agar. Add thermometer (but work sterile!). Cool to 45 °C (in water bath, mix
regularly to avoid clumping and to promote equal cooling).
4. Add 100 µl of bacterial host broth culture (108-109 cfu/ml) to 1 ml of each serial dilution
Note: only add bacteria when semi-solid agar has cooled down to 45 °C! If agar is too
hot the bacterial host will die, if the bacteria are added to early to the phages then
they will start to lysate
5. Add semi solid agar(at 45 °C) till a total volume of 3 ml by pippet
Note: work fluently to avoid that the agar starts to solidify. When dealing with many
dilutions, keep semi-solid agar in 45 °C warm water bath.
6. Mix by rolling tube between hand palms after closing the tubes.
7. Pour the mixture on a Petri dish with 1.5% agar and distribute evenly.
8. Let solidify for 15 – 20 min at room temperature with open lid in flow.
9. Incubate overnight, according to bacterial host optimal incubation conditions.
Analysis:
Evaluate all three plates (i.e. 1/108, 1/109 and 1/1010 dilution)
Count the plaques on the plate with the highest dilution whereby individual plaques can be
observed.
Calculate the concentration of the original solution:
i.e. the number of plaques times the dilution
e.g. : on the 1/1010 dilution 21 plaques were counted. 21 x 1010 pfu/ml were present in the original
solution

Addendum: Protocols
118
18. Multiplication of phages
Purpose:
Preparation of phage stocks and long term conservation of purified phages.
Material (per phage multiplication):
- 14 ml tube with solid agar
- 1 l bottle for 40 plates
- 200 ml bottle
- 12 g Alternative Protein Source (APS) - Luria Bertani (LB) Broth powder for one bottle of solid
and one bottle of semi-solid medium
- 7.2 g agar for one bottle of solid and one bottle of semi-solid medium
- Distilled water
- One 14 ml tube for every dilution
- Bacterial host culture (100 µl for every dilution)
- Petri dish with freshly made APS-LB medium
- One drigalski spatula
- Centrifuge tubes (one tube for 6 plates of the same phage dilution)
- 3 ml chloroform
- One 10 ml syringe
- One 30G needle
- One 0.45 µm membrane filter
- One 14 ml tube
Protocol:
Prior to this protocol: Determine at which dilution the phage produces webbing of the host cultivated
on agar: Protocol
1. Determine by titration which dilution gives webbing (i.e. almost all host bacteria are lysed,
the plaques continue into one another). Webbing usually is observed at phage
concentrations of approx. 103-106 PFU/ml.
Day 1
a. Culture of host bacteria
1. Pick up one colony from plate or previously grown host bacteria tube with inoculation
needle.
2. Transfer to new tube with solid medium.
3. Grow overnight at 32 °C.
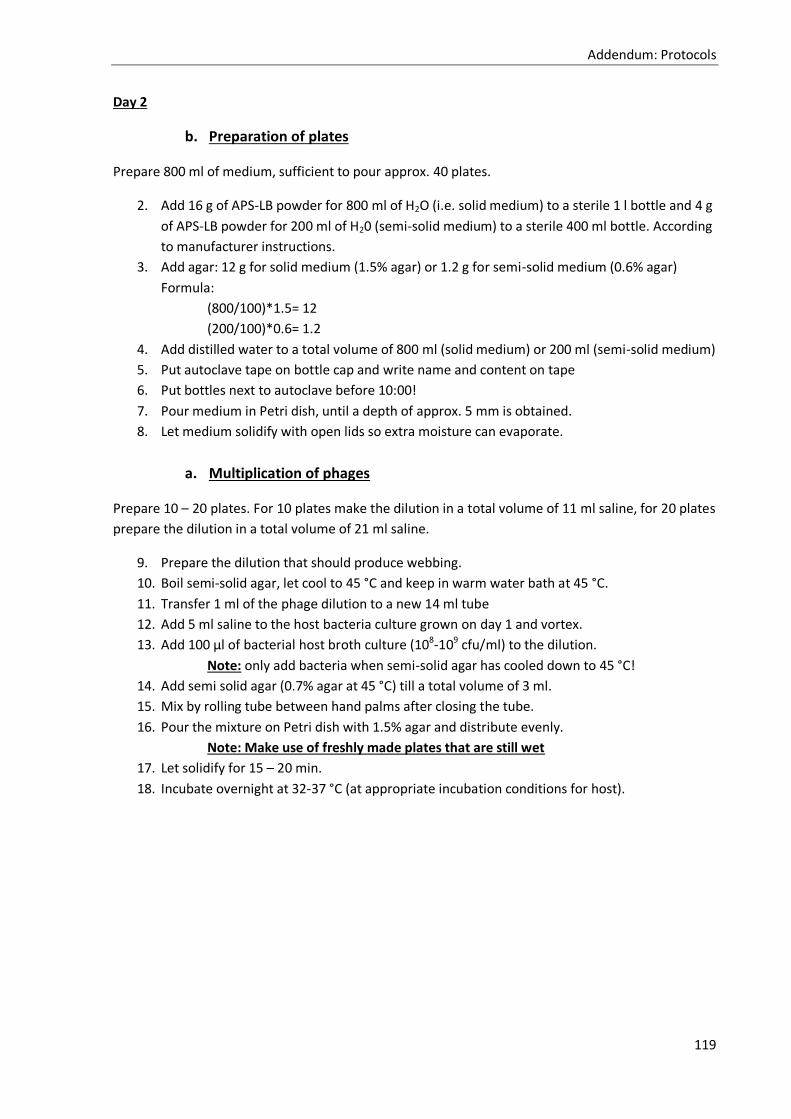
Addendum: Protocols
119
Day 2
b. Preparation of plates
Prepare 800 ml of medium, sufficient to pour approx. 40 plates.
2. Add 16 g of APS-LB powder for 800 ml of H2O (i.e. solid medium) to a sterile 1 l bottle and 4 g
of APS-LB powder for 200 ml of H20 (semi-solid medium) to a sterile 400 ml bottle. According
to manufacturer instructions.
3. Add agar: 12 g for solid medium (1.5% agar) or 1.2 g for semi-solid medium (0.6% agar)
Formula:
(800/100)*1.5= 12
(200/100)*0.6= 1.2
4. Add distilled water to a total volume of 800 ml (solid medium) or 200 ml (semi-solid medium)
5. Put autoclave tape on bottle cap and write name and content on tape
6. Put bottles next to autoclave before 10:00!
7. Pour medium in Petri dish, until a depth of approx. 5 mm is obtained.
8. Let medium solidify with open lids so extra moisture can evaporate.
a. Multiplication of phages
Prepare 10 – 20 plates. For 10 plates make the dilution in a total volume of 11 ml saline, for 20 plates
prepare the dilution in a total volume of 21 ml saline.
9. Prepare the dilution that should produce webbing.
10. Boil semi-solid agar, let cool to 45 °C and keep in warm water bath at 45 °C.
11. Transfer 1 ml of the phage dilution to a new 14 ml tube
12. Add 5 ml saline to the host bacteria culture grown on day 1 and vortex.
13. Add 100 µl of bacterial host broth culture (108-109 cfu/ml) to the dilution.
Note: only add bacteria when semi-solid agar has cooled down to 45 °C!
14. Add semi solid agar (0.7% agar at 45 °C) till a total volume of 3 ml.
15. Mix by rolling tube between hand palms after closing the tube.
16. Pour the mixture on Petri dish with 1.5% agar and distribute evenly.
Note: Make use of freshly made plates that are still wet
17. Let solidify for 15 – 20 min.
18. Incubate overnight at 32-37 °C (at appropriate incubation conditions for host).
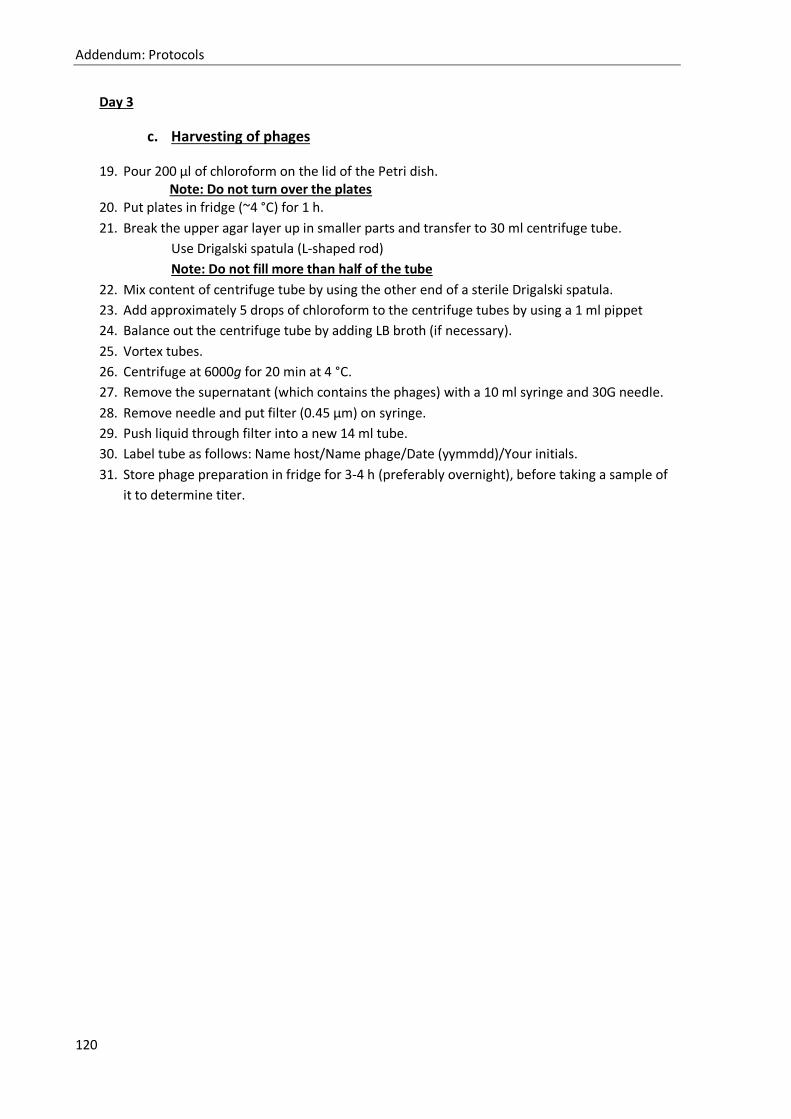
Addendum: Protocols
120
Day 3
c. Harvesting of phages
19. Pour 200 µl of chloroform on the lid of the Petri dish. Note: Do not turn over the plates
20. Put plates in fridge (~4 °C) for 1 h.
21. Break the upper agar layer up in smaller parts and transfer to 30 ml centrifuge tube.
Use Drigalski spatula (L-shaped rod)
Note: Do not fill more than half of the tube
22. Mix content of centrifuge tube by using the other end of a sterile Drigalski spatula.
23. Add approximately 5 drops of chloroform to the centrifuge tubes by using a 1 ml pippet
24. Balance out the centrifuge tube by adding LB broth (if necessary).
25. Vortex tubes.
26. Centrifuge at 6000g for 20 min at 4 °C.
27. Remove the supernatant (which contains the phages) with a 10 ml syringe and 30G needle.
28. Remove needle and put filter (0.45 µm) on syringe.
29. Push liquid through filter into a new 14 ml tube.
30. Label tube as follows: Name host/Name phage/Date (yymmdd)/Your initials.
31. Store phage preparation in fridge for 3-4 h (preferably overnight), before taking a sample of
it to determine titer.
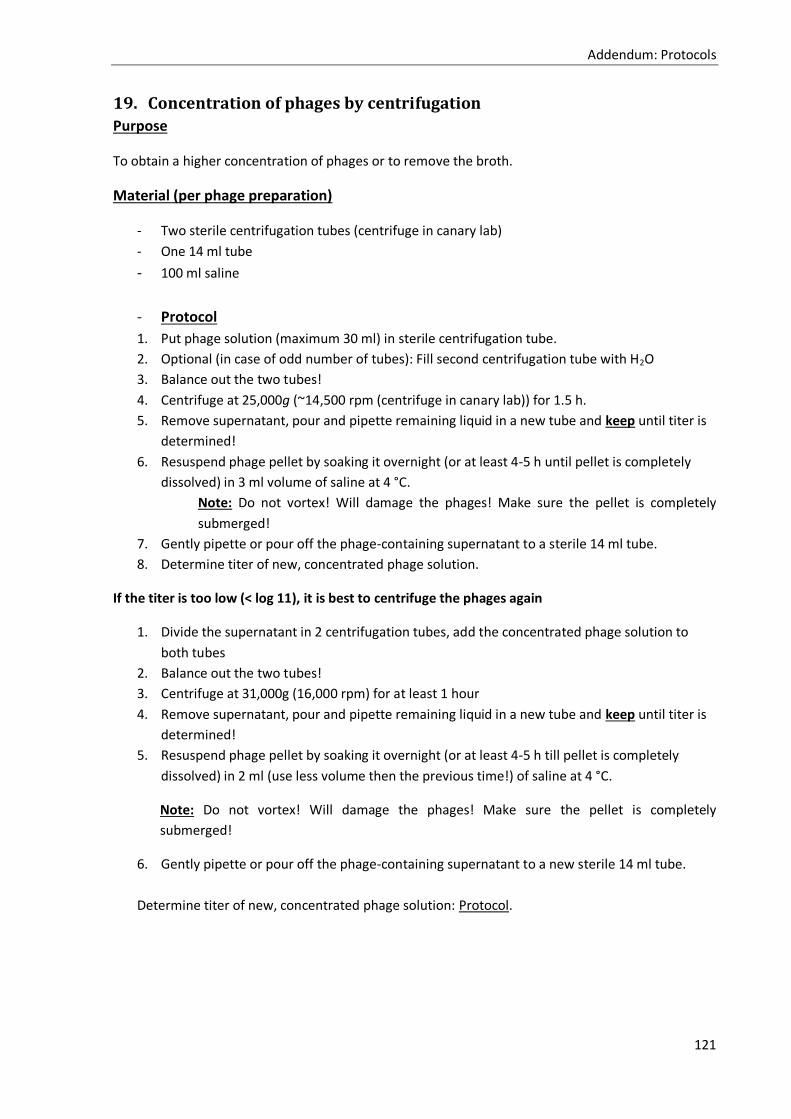
Addendum: Protocols
121
19. Concentration of phages by centrifugation
Purpose
To obtain a higher concentration of phages or to remove the broth.
Material (per phage preparation)
- Two sterile centrifugation tubes (centrifuge in canary lab)
- One 14 ml tube
- 100 ml saline
- Protocol
1. Put phage solution (maximum 30 ml) in sterile centrifugation tube.
2. Optional (in case of odd number of tubes): Fill second centrifugation tube with H2O
3. Balance out the two tubes!
4. Centrifuge at 25,000g (~14,500 rpm (centrifuge in canary lab)) for 1.5 h.
5. Remove supernatant, pour and pipette remaining liquid in a new tube and keep until titer is
determined!
6. Resuspend phage pellet by soaking it overnight (or at least 4-5 h until pellet is completely
dissolved) in 3 ml volume of saline at 4 °C.
Note: Do not vortex! Will damage the phages! Make sure the pellet is completely
submerged!
7. Gently pipette or pour off the phage-containing supernatant to a sterile 14 ml tube.
8. Determine titer of new, concentrated phage solution.
If the titer is too low (< log 11), it is best to centrifuge the phages again
1. Divide the supernatant in 2 centrifugation tubes, add the concentrated phage solution to
both tubes
2. Balance out the two tubes!
3. Centrifuge at 31,000g (16,000 rpm) for at least 1 hour
4. Remove supernatant, pour and pipette remaining liquid in a new tube and keep until titer is
determined!
5. Resuspend phage pellet by soaking it overnight (or at least 4-5 h till pellet is completely
dissolved) in 2 ml (use less volume then the previous time!) of saline at 4 °C.
Note: Do not vortex! Will damage the phages! Make sure the pellet is completely
submerged!
6. Gently pipette or pour off the phage-containing supernatant to a new sterile 14 ml tube.
Determine titer of new, concentrated phage solution: Protocol.

Addendum: Protocols
122
20. Removal of endotoxins from phage solutions, Hyglos EndoTrap blue
(cat. No. 311063)
Purpose Removal of endotoxins present in phage samples for subsequent immunological assays.
Material - Hyglos EndoTrap blue (cat. No. 311063)
- 15 ml Falcon
- Phage preparation of high titre
Protocol Preparation
1. To use a prepacked column, first remove the top cap. This prevents bubbles from being drawn into the gel. Next, remove the end cap and place the column in a suitable holder. Allow storage solution to drain completely from the column. Do not allow the column bed to dry. Continue immediately to “Activation and Endotoxin Removal”. (To avoid bubbles, the column and buffers should be at the same temperature.)
If air bubbles form in the gel bed or if the column is allowed to run dry, the proper performance of the column will be affected. Care should be taken to avoid bubbles and the drying of the gel in the column.
Activation and Endotoxin Removal
1. Wash the column twice with 6 column volumes of Regeneration Buffer. For a 1 ml column, this can be accomplished by washing twice with 3 ml of Regeneration Buffer. This process may take approximately 12 minutes for a 1 ml column.
2. Equilibrate the column by rinsing twice with 6 column volumes of Equilibration Buffer. For a 1 ml column, this can be accomplished by rinsing twice with 3 ml of Equilibration Buffer. This process may take approximately 12 minutes for a 1 ml column.
3. Apply the sample to the column and start collecting immediately. A fraction size of 1 ml is recommended. The void volume for 1 ml of gel is 0.3 to 0.5 ml, therefore, the sample begins to elute immediately after that volume has passed through the column. The column can be filled up to the edge of the column (approximately 4 ml for the small columns). The column can be constantly filled, until the whole sample has been applied. Afterwards, allow the sample to drain completely from the column. (Flow rate: 0.5 to 1 ml per minute)
4. In order to elute the entire protein sample, apply an extra 1 ml (for a 1 ml column) of Equilibration Buffer. Let the column drain and collect all of the effluent. To monitor the elution of the sample, the optical density of each fraction can be measured.
Regeneration and Storage
1. To prepare the column for storage, wash the column with 6 column volumes of Equilibration Buffer and allow to drain completely. For storage, cap the bottom of the column and apply 1 ml (for a 1 ml column) of Regeneration Buffer supplemented with 0.02% sodium azide. Store at 2ºC to 8ºC. Do not freeze.
2. For the next use of the column, start with step 1 of “Activation and Endotoxin Removal”. Regeneration for Immediate Reuse
1. To prepare the column for immediate reuse, for instance when multiple rounds of endotoxin removal are desired, wash the column with 6 column volumes of Equilibration Buffer.
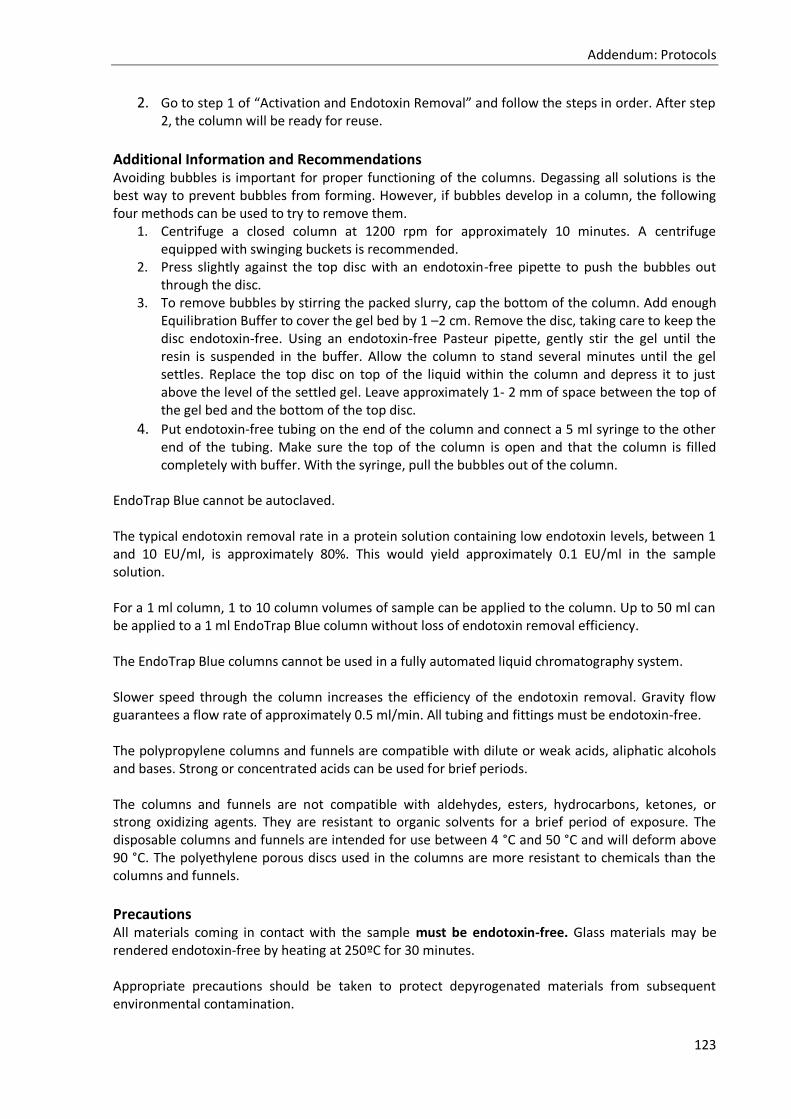
Addendum: Protocols
123
2. Go to step 1 of “Activation and Endotoxin Removal” and follow the steps in order. After step 2, the column will be ready for reuse.
Additional Information and Recommendations Avoiding bubbles is important for proper functioning of the columns. Degassing all solutions is the best way to prevent bubbles from forming. However, if bubbles develop in a column, the following four methods can be used to try to remove them.
1. Centrifuge a closed column at 1200 rpm for approximately 10 minutes. A centrifuge equipped with swinging buckets is recommended.
2. Press slightly against the top disc with an endotoxin-free pipette to push the bubbles out through the disc.
3. To remove bubbles by stirring the packed slurry, cap the bottom of the column. Add enough Equilibration Buffer to cover the gel bed by 1 –2 cm. Remove the disc, taking care to keep the disc endotoxin-free. Using an endotoxin-free Pasteur pipette, gently stir the gel until the resin is suspended in the buffer. Allow the column to stand several minutes until the gel settles. Replace the top disc on top of the liquid within the column and depress it to just above the level of the settled gel. Leave approximately 1- 2 mm of space between the top of the gel bed and the bottom of the top disc.
4. Put endotoxin-free tubing on the end of the column and connect a 5 ml syringe to the other end of the tubing. Make sure the top of the column is open and that the column is filled completely with buffer. With the syringe, pull the bubbles out of the column.
EndoTrap Blue cannot be autoclaved. The typical endotoxin removal rate in a protein solution containing low endotoxin levels, between 1 and 10 EU/ml, is approximately 80%. This would yield approximately 0.1 EU/ml in the sample solution. For a 1 ml column, 1 to 10 column volumes of sample can be applied to the column. Up to 50 ml can be applied to a 1 ml EndoTrap Blue column without loss of endotoxin removal efficiency. The EndoTrap Blue columns cannot be used in a fully automated liquid chromatography system. Slower speed through the column increases the efficiency of the endotoxin removal. Gravity flow guarantees a flow rate of approximately 0.5 ml/min. All tubing and fittings must be endotoxin-free. The polypropylene columns and funnels are compatible with dilute or weak acids, aliphatic alcohols and bases. Strong or concentrated acids can be used for brief periods. The columns and funnels are not compatible with aldehydes, esters, hydrocarbons, ketones, or strong oxidizing agents. They are resistant to organic solvents for a brief period of exposure. The disposable columns and funnels are intended for use between 4 °C and 50 °C and will deform above 90 °C. The polyethylene porous discs used in the columns are more resistant to chemicals than the columns and funnels.
Precautions All materials coming in contact with the sample must be endotoxin-free. Glass materials may be rendered endotoxin-free by heating at 250ºC for 30 minutes. Appropriate precautions should be taken to protect depyrogenated materials from subsequent environmental contamination.

Addendum: Protocols
124
From experience, most sterile, individually wrapped, plastic pipettes and pipette tips are endotoxin-free. However, these materials should be tested before regular use. Prior to application on the column, all aggregates should be removed from the sample by centrifugation at 6000 x g for 30 minutes. Solutions that are too viscous will not pass easily through the column. The recommended concentration for a protein solution is from 1 to 10 mg/ml. By passing the solution through the column and washing with Equilibration Buffer, the protein solution will be diluted. Buffers should be prepared from endotoxin-free materials and water. It is recommended that all buffers, including the Equilibration and Regeneration Buffers, be degassed prior to use. Avoid proteases and organic solvents. To avoid cross contamination of samples (proteins, peptides, antibodies, plasmid DNA), it is recommended that one column be used for one sample solution.
Note: After LPS purification determine the titre and the sterility of the sample. To test the sterility, take 20 µl of the phage solution and spread on blood agar plate (TSA plate).
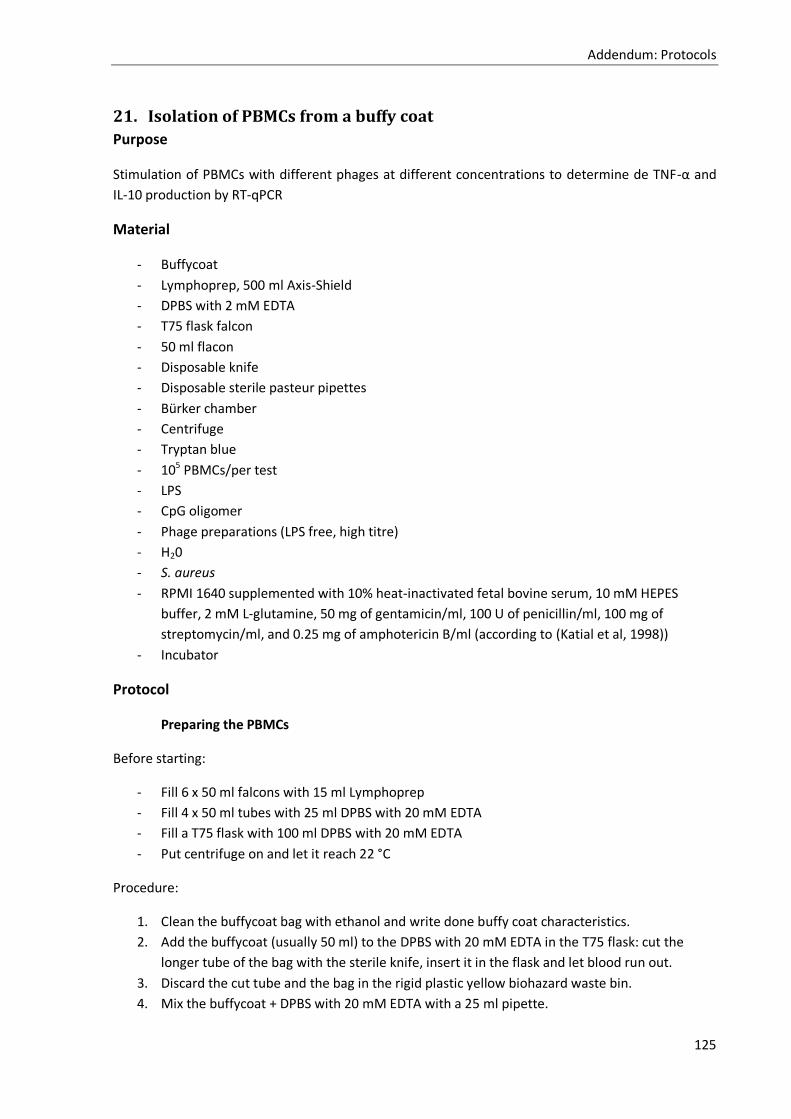
Addendum: Protocols
125
21. Isolation of PBMCs from a buffy coat
Purpose
Stimulation of PBMCs with different phages at different concentrations to determine de TNF-α and
IL-10 production by RT-qPCR
Material
- Buffycoat
- Lymphoprep, 500 ml Axis-Shield
- DPBS with 2 mM EDTA
- T75 flask falcon
- 50 ml flacon
- Disposable knife
- Disposable sterile pasteur pipettes
- Bürker chamber
- Centrifuge
- Tryptan blue
- 105 PBMCs/per test
- LPS
- CpG oligomer
- Phage preparations (LPS free, high titre)
- H20
- S. aureus
- RPMI 1640 supplemented with 10% heat-inactivated fetal bovine serum, 10 mM HEPES
buffer, 2 mM L-glutamine, 50 mg of gentamicin/ml, 100 U of penicillin/ml, 100 mg of
streptomycin/ml, and 0.25 mg of amphotericin B/ml (according to (Katial et al, 1998))
- Incubator
Protocol
Preparing the PBMCs
Before starting:
- Fill 6 x 50 ml falcons with 15 ml Lymphoprep
- Fill 4 x 50 ml tubes with 25 ml DPBS with 20 mM EDTA
- Fill a T75 flask with 100 ml DPBS with 20 mM EDTA
- Put centrifuge on and let it reach 22 °C
Procedure:
1. Clean the buffycoat bag with ethanol and write done buffy coat characteristics.
2. Add the buffycoat (usually 50 ml) to the DPBS with 20 mM EDTA in the T75 flask: cut the
longer tube of the bag with the sterile knife, insert it in the flask and let blood run out.
3. Discard the cut tube and the bag in the rigid plastic yellow biohazard waste bin.
4. Mix the buffycoat + DPBS with 20 mM EDTA with a 25 ml pipette.

Addendum: Protocols
126
5. Put the pipettor on slow and add 25 ml of the buffycoat to each lymphoprep tube: hold the
tube horizontally, put pipette on the tube’s wall and slowly let the first big drop of blood
form the first layer on the lymphoprep surface. Slowly go on adding all the blood. A clear
boundry has to be between the blood and lymphoprep. Separation starts as soon as the
blood is added.
6. Centrifuge 2350 rpm for 15 min at roomtemperature, ac 4 and dec 4.
7. You will see three main phases in the tube: a lower red phase containing erythrocytes and
lumphoprep, an inner whitish ring of PBMCs and an upper plasma semi-transparent phase.
8. Take the ring of PBMCs using a Pasteur pipette being careful not to take the lower red phase
and bring them in 3 of the DPBS with EDTA tubes.
9. Centrifuge 800 rpm for 15 min at room temperature.
10. Take supernatans and bring into a new 50 ml tube.
11. Resuspend pellets with 25 ml DPBS with EDTA, pool all pellets together in one tube.
12. Centrifuge supernatans and pellet tubes at 800 rpm for 15 min at room temperature.
13. Eliminate supernatans and pool all pellets together in 15 ml DPBS with EDTA.
14. Wash tubes with 5 ml DPBS with EDTA twice and add to the tube that already contains 15 ml
of the cell suspension.
15. Centrifuge the cells again at 800 rpm for 20 min.
16. Remove supernatans and resuspend pellet in 25 ml RPMI 1640 cell media.
17. Repeat steps 17 and resuspend cell pellet in 50 ml RPMI 1640 cell media.
18. Count: 10 µl cells + 190 µl tryptan blue.

Addendum: Protocols
127
22. Titration of stimulation of PBMCs with SEB.
Purpose
Stimulation of Peripheral Blood Mononuclear Cells (PBMCs) to determine the optimal Staphylococcal Enterotoxin B (SEB) concentration and stimulation time for the induction of TNF-α production and for later stimulation with different antigens to induce a possible reduction of TNF-α (see Protocol immunology). For each test, each in a volume of 200 (see further) µl, at (see further) 3x10⁵ cells/100 µl cells will be used.
TNF-α and IL-10 levels will be determined by mRNA quantification. In addition, as a control, the Intracellular Cytokine Staining experiment is performed to determine intracellular TNFα, IFNγ, IL2 and CD40L levels.
Material
- 5 vial of 5 x 10⁷ PBMCs/ml (Unitnummer: B032013000680Q) - Water bath - SEB (200 µg/ml) - Hank's Balanced Salt Solution (HBSS), no calcium and no magnesium - 500 ml RPMI 1640 - 50 ml Heat inactivated fetal calf serum - 5 ml MEM, non essential aminoacids, 100X - 5 ml sodium pyruvate - 3 ml PEN 10000 U/ml / Strep 10000 µg/ml - 5 ml L-glutamine 200 mM - 500 µl 2-Mercaptoethanol 50 mM - 50 ml heat inactivated fetal calf serum - 96-well plates, U-bottom (Thermo Scientific) - 96-well plate, V-bottom (Thermo Scientific) - CO2 incubator - Centrifuge - Brefeldin A (stock: 1000X) - Qiazol - 1.5 ml Eppendorf tubes - PBS (Invitrogen) - DPBS (Invitrogen) - Cytofix/Cytoperm (BD Biosciences, Franklin Lakes, New Jersey)
Protocol
1. Thaw cells. Approximately 106 cells are needed per test of 200 µl. a. Take 5 vial of 1 ml at 5 x 10⁷ PBMCs/ml from -80 °C freezer or liquid nitrogen. b. Immediately place the vial in a water bath at 37 °C.
Note: Takes about 1 – 2 min. c. Once the cells are thawed, add the complete vial to 9 ml HBSS (total volume is 10
ml). d. Centrifuge the cells at 350g for 10 min. e. Remove supernatants. f. Resuspend the cells in 5 ml HBSS.
2. Count the cells and determine the viability with propidium iodide (PI). a. Take 80 µl of the resuspended cells and transfer to a new 1.5 ml Eppendorf tube. b. Load sample on the Sysmex KX-12. c. Determine viability: FACS Canto:
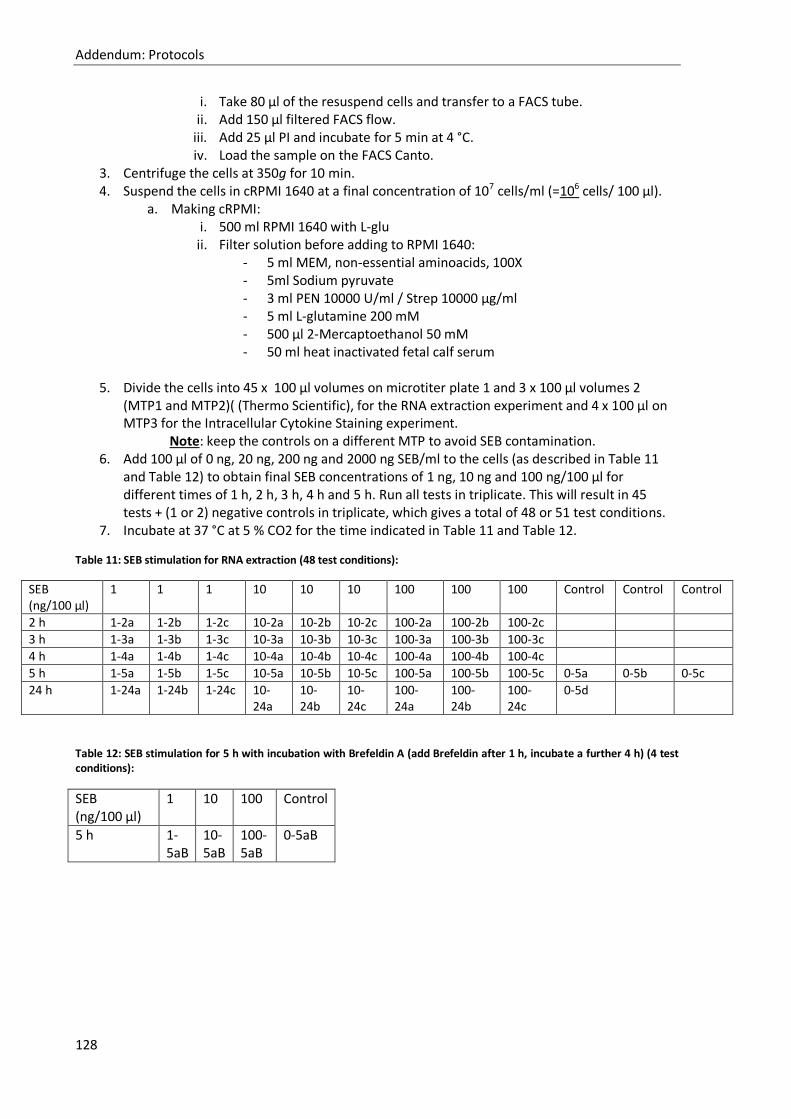
Addendum: Protocols
128
i. Take 80 µl of the resuspend cells and transfer to a FACS tube. ii. Add 150 µl filtered FACS flow.
iii. Add 25 µl PI and incubate for 5 min at 4 °C. iv. Load the sample on the FACS Canto.
3. Centrifuge the cells at 350g for 10 min. 4. Suspend the cells in cRPMI 1640 at a final concentration of 107 cells/ml (=106 cells/ 100 µl).
a. Making cRPMI: i. 500 ml RPMI 1640 with L-glu ii. Filter solution before adding to RPMI 1640:
- 5 ml MEM, non-essential aminoacids, 100X - 5ml Sodium pyruvate - 3 ml PEN 10000 U/ml / Strep 10000 µg/ml - 5 ml L-glutamine 200 mM - 500 µl 2-Mercaptoethanol 50 mM - 50 ml heat inactivated fetal calf serum
5. Divide the cells into 45 x 100 µl volumes on microtiter plate 1 and 3 x 100 µl volumes 2
(MTP1 and MTP2)( (Thermo Scientific), for the RNA extraction experiment and 4 x 100 µl on MTP3 for the Intracellular Cytokine Staining experiment.
Note: keep the controls on a different MTP to avoid SEB contamination. 6. Add 100 µl of 0 ng, 20 ng, 200 ng and 2000 ng SEB/ml to the cells (as described in Table 11
and Table 12) to obtain final SEB concentrations of 1 ng, 10 ng and 100 ng/100 µl for different times of 1 h, 2 h, 3 h, 4 h and 5 h. Run all tests in triplicate. This will result in 45 tests + (1 or 2) negative controls in triplicate, which gives a total of 48 or 51 test conditions.
7. Incubate at 37 °C at 5 % CO2 for the time indicated in Table 11 and Table 12.
Table 11: SEB stimulation for RNA extraction (48 test conditions):
SEB (ng/100 µl)
1 1 1 10 10 10 100 100 100 Control Control Control
2 h 1-2a 1-2b 1-2c 10-2a 10-2b 10-2c 100-2a 100-2b 100-2c
3 h 1-3a 1-3b 1-3c 10-3a 10-3b 10-3c 100-3a 100-3b 100-3c
4 h 1-4a 1-4b 1-4c 10-4a 10-4b 10-4c 100-4a 100-4b 100-4c
5 h 1-5a 1-5b 1-5c 10-5a 10-5b 10-5c 100-5a 100-5b 100-5c 0-5a 0-5b 0-5c
24 h 1-24a 1-24b 1-24c 10-24a
10-24b
10-24c
100-24a
100-24b
100-24c
0-5d
Table 12: SEB stimulation for 5 h with incubation with Brefeldin A (add Brefeldin after 1 h, incubate a further 4 h) (4 test conditions):
SEB (ng/100 µl)
1 10 100 Control
5 h 1-5aB
10-5aB
100-5aB
0-5aB

Addendum: Protocols
129
For the RNA extraction experiment (MTP1):
After the cells are stimulated with SEB:
1. Transfer content of the wells of MTP1 after 1, 2, 3, 4 or 5 h to 1.5 ml Rnase free Eppendorf tubes, labelled according to Table 1.
2. Or: Add 0.2 µl of the 1000X Brefeldin A stock solution (= final concentration?: ) after 1 h SEB stimulation and incubate another 4 h at 37 °C with 5 % CO2.
3. Label the tubes as depicted in Table 11 and Table 12. 4. Centrifuge all tubes for 10 min at 350g. 5. Remove supernatants by pipette. Be careful not to disrupt the cell pellet. 6. Add 1 ml Qiazol and pipette to mix. 7. Once in Qiazol, samples can be stored long-term at -20 °C. 8. RNA extraction (adding 200 µl chloroform) can be performed on another day (See Protocol
RNA extraction).
Intracellular Cytokine Staining experiment
1. After 1 h SEB stimulation Add 0.2 µl of the 1000X Brefeldin A stock solution and incubate another 4 h at 37 °C with 5 % CO2.
2. Transfer cells from the MTP with U bottom to a MTP with V bottom and centrifuge at 350g for 5 min.
3. Remove supernatants and resuspend cells in 200 µL DPBS with 1% Heat inactivated fetal calf serum.
4. Centrifuge at 350g for 5 min. 5. Remove supernatants and resuspend cells in 175 µl Cytofix/Cytoperm and incubate 20 min at
room temperature in the dark. 6. The cells can now be stored at 4 °C and the Intracellular Cytokine Staining can be performed
on a later date. 7. On a later date: centrifuge the fixated cells at 350g for 5 min. 8. Remove supernatants. 9. Resuspend the cells in 50 µl DBPS with 1 % FCS, CD4 and CD8.
Note: make a stock solution with DPBS with 1 % FCS containing 1X CD4 (10X stock) and 1X CD8 (25X stock).
10. Incubate 20 min at room temperature in the dark. 11. Add 125 µl Permwash, the permwash will also make the cells permeable. 12. Centrifuge the cells at 350g for 5 min. 13. Remove supernatants and resuspend the cells in 50 µl Permwash with IL2-APC (1/400), IFNg-
FITC (1/200), CD40L-PE (1/20), TNF-PE-Cy7 (1/20) and CD3-Alexa Fluoro 700 (1/100). 14. Incubate at room temperature in the dark for 20 min. 15. Add 125 µl Perm wash. 16. Centrifuge at 350g for 5 min. 17. Remove supernatants and resuspend the cells in 150 µl DPBS with 1 % FCS and 100 µl Perm
wash. 18. Load the whole sample on the FACS Canto.
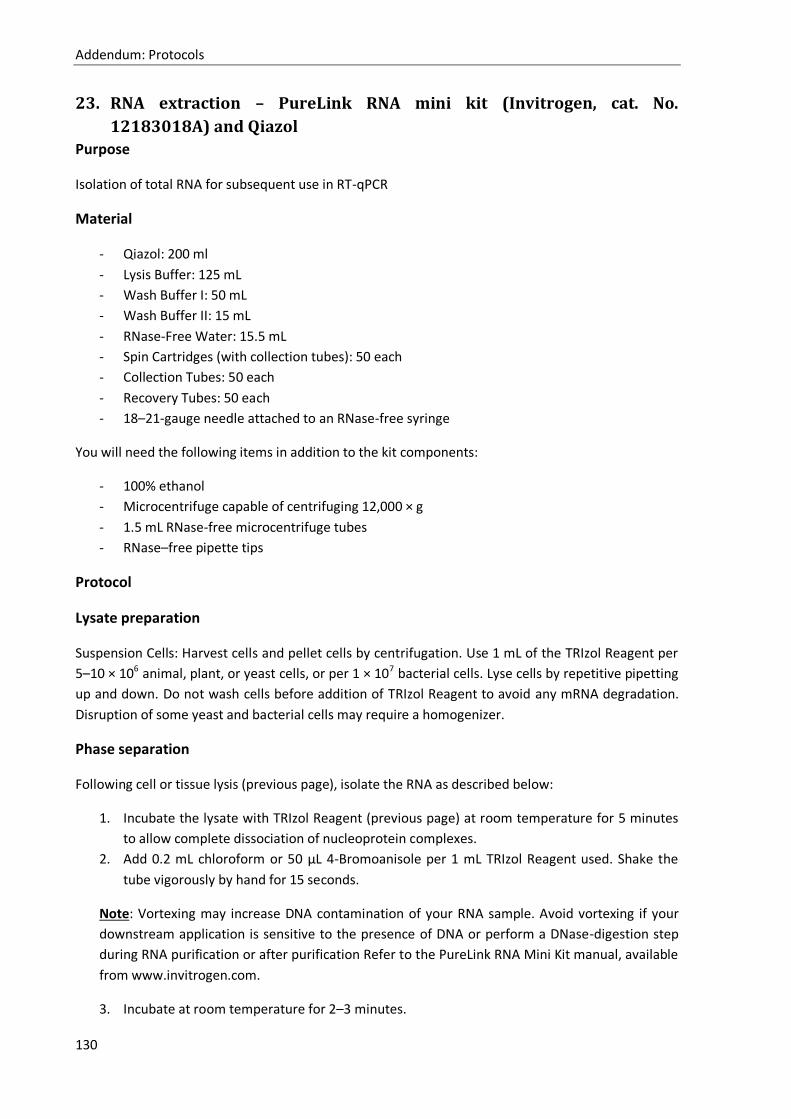
Addendum: Protocols
130
23. RNA extraction – PureLink RNA mini kit (Invitrogen, cat. No.
12183018A) and Qiazol
Purpose
Isolation of total RNA for subsequent use in RT-qPCR
Material
- Qiazol: 200 ml
- Lysis Buffer: 125 mL
- Wash Buffer I: 50 mL
- Wash Buffer II: 15 mL
- RNase-Free Water: 15.5 mL
- Spin Cartridges (with collection tubes): 50 each
- Collection Tubes: 50 each
- Recovery Tubes: 50 each
- 18–21-gauge needle attached to an RNase-free syringe
You will need the following items in addition to the kit components:
- 100% ethanol
- Microcentrifuge capable of centrifuging 12,000 × g
- 1.5 mL RNase-free microcentrifuge tubes
- RNase–free pipette tips
Protocol
Lysate preparation
Suspension Cells: Harvest cells and pellet cells by centrifugation. Use 1 mL of the TRIzol Reagent per
5–10 × 106 animal, plant, or yeast cells, or per 1 × 10⁷ bacterial cells. Lyse cells by repetitive pipetting
up and down. Do not wash cells before addition of TRIzol Reagent to avoid any mRNA degradation.
Disruption of some yeast and bacterial cells may require a homogenizer.
Phase separation
Following cell or tissue lysis (previous page), isolate the RNA as described below:
1. Incubate the lysate with TRIzol Reagent (previous page) at room temperature for 5 minutes
to allow complete dissociation of nucleoprotein complexes.
2. Add 0.2 mL chloroform or 50 μL 4-Bromoanisole per 1 mL TRIzol Reagent used. Shake the
tube vigorously by hand for 15 seconds.
Note: Vortexing may increase DNA contamination of your RNA sample. Avoid vortexing if your
downstream application is sensitive to the presence of DNA or perform a DNase-digestion step
during RNA purification or after purification Refer to the PureLink RNA Mini Kit manual, available
from www.invitrogen.com.
3. Incubate at room temperature for 2–3 minutes.
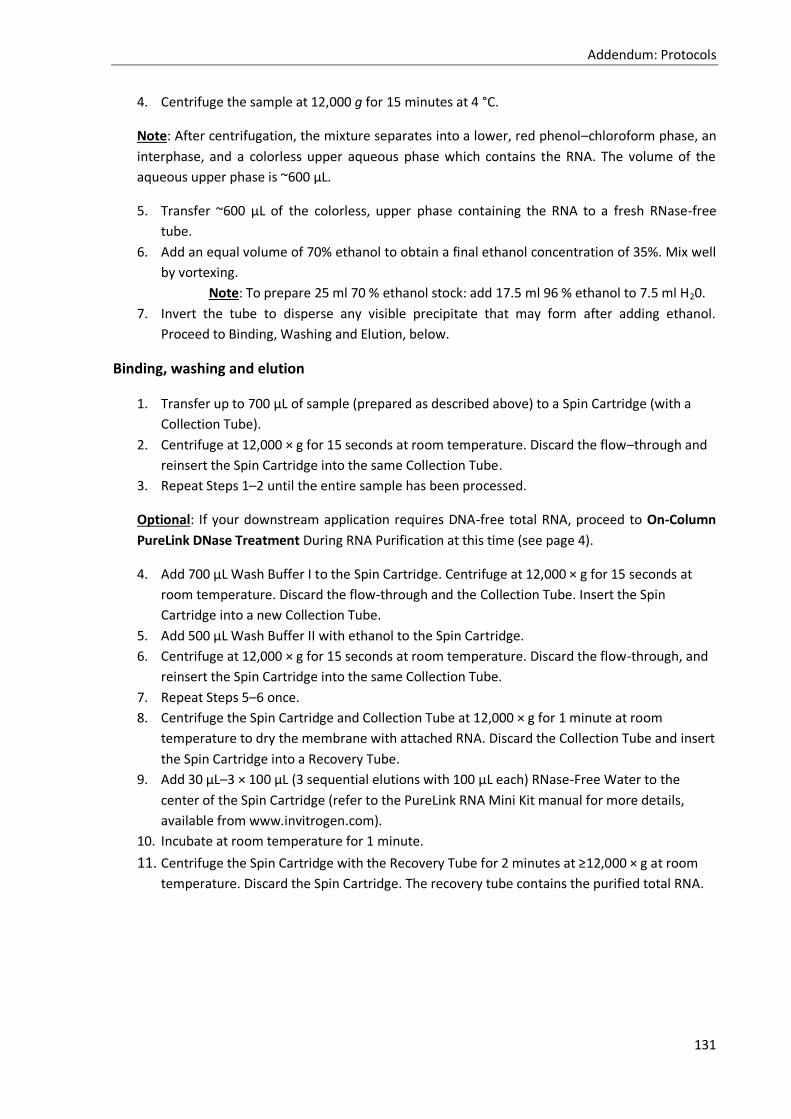
Addendum: Protocols
131
4. Centrifuge the sample at 12,000 g for 15 minutes at 4 °C.
Note: After centrifugation, the mixture separates into a lower, red phenol–chloroform phase, an
interphase, and a colorless upper aqueous phase which contains the RNA. The volume of the
aqueous upper phase is ~600 μL.
5. Transfer ~600 μL of the colorless, upper phase containing the RNA to a fresh RNase-free
tube.
6. Add an equal volume of 70% ethanol to obtain a final ethanol concentration of 35%. Mix well
by vortexing.
Note: To prepare 25 ml 70 % ethanol stock: add 17.5 ml 96 % ethanol to 7.5 ml H20.
7. Invert the tube to disperse any visible precipitate that may form after adding ethanol.
Proceed to Binding, Washing and Elution, below.
Binding, washing and elution
1. Transfer up to 700 μL of sample (prepared as described above) to a Spin Cartridge (with a
Collection Tube).
2. Centrifuge at 12,000 × g for 15 seconds at room temperature. Discard the flow–through and
reinsert the Spin Cartridge into the same Collection Tube.
3. Repeat Steps 1–2 until the entire sample has been processed.
Optional: If your downstream application requires DNA-free total RNA, proceed to On-Column
PureLink DNase Treatment During RNA Purification at this time (see page 4).
4. Add 700 μL Wash Buffer I to the Spin Cartridge. Centrifuge at 12,000 × g for 15 seconds at
room temperature. Discard the flow-through and the Collection Tube. Insert the Spin
Cartridge into a new Collection Tube.
5. Add 500 μL Wash Buffer II with ethanol to the Spin Cartridge.
6. Centrifuge at 12,000 × g for 15 seconds at room temperature. Discard the flow-through, and
reinsert the Spin Cartridge into the same Collection Tube.
7. Repeat Steps 5–6 once.
8. Centrifuge the Spin Cartridge and Collection Tube at 12,000 × g for 1 minute at room
temperature to dry the membrane with attached RNA. Discard the Collection Tube and insert
the Spin Cartridge into a Recovery Tube.
9. Add 30 μL–3 × 100 μL (3 sequential elutions with 100 μL each) RNase-Free Water to the
center of the Spin Cartridge (refer to the PureLink RNA Mini Kit manual for more details,
available from www.invitrogen.com).
10. Incubate at room temperature for 1 minute.
11. Centrifuge the Spin Cartridge with the Recovery Tube for 2 minutes at ≥12,000 × g at room
temperature. Discard the Spin Cartridge. The recovery tube contains the purified total RNA.
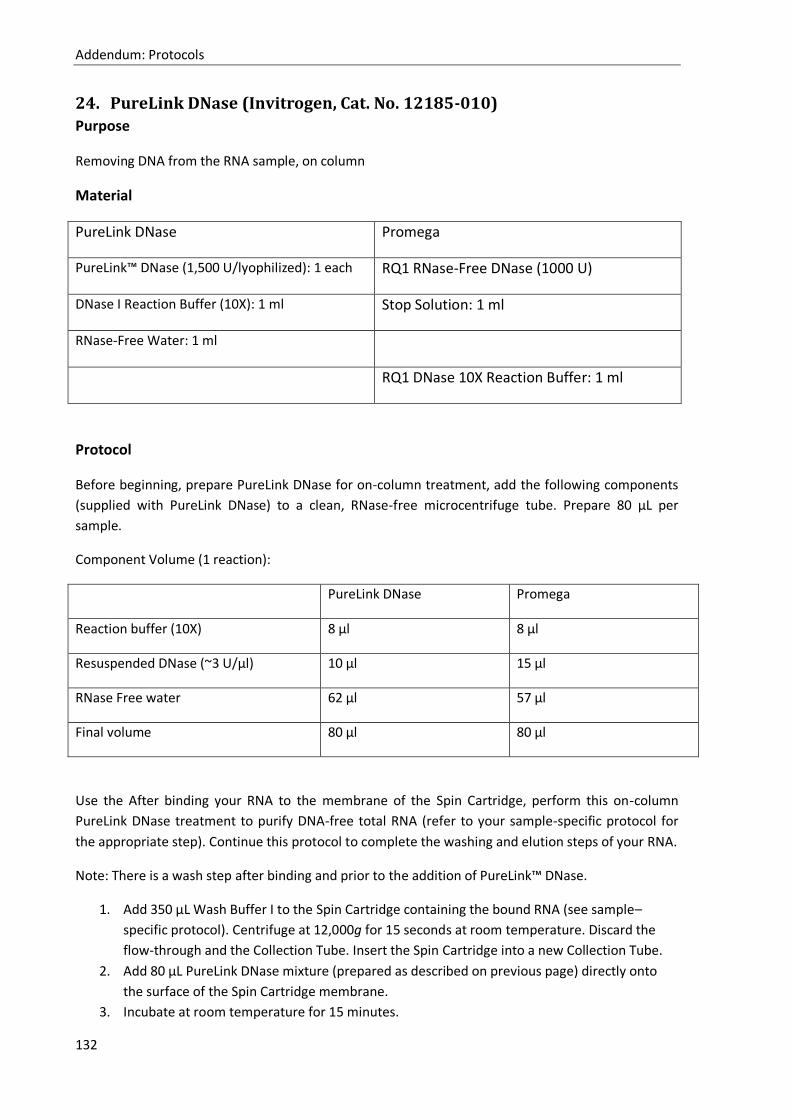
Addendum: Protocols
132
24. PureLink DNase (Invitrogen, Cat. No. 12185-010)
Purpose
Removing DNA from the RNA sample, on column
Material
PureLink DNase Promega
PureLink™ DNase (1,500 U/lyophilized): 1 each RQ1 RNase-Free DNase (1000 U)
DNase I Reaction Buffer (10X): 1 ml Stop Solution: 1 ml
RNase-Free Water: 1 ml
RQ1 DNase 10X Reaction Buffer: 1 ml
Protocol
Before beginning, prepare PureLink DNase for on-column treatment, add the following components
(supplied with PureLink DNase) to a clean, RNase-free microcentrifuge tube. Prepare 80 μL per
sample.
Component Volume (1 reaction):
PureLink DNase Promega
Reaction buffer (10X) 8 µl 8 µl
Resuspended DNase (~3 U/µl) 10 µl 15 µl
RNase Free water 62 µl 57 µl
Final volume 80 µl 80 µl
Use the After binding your RNA to the membrane of the Spin Cartridge, perform this on-column
PureLink DNase treatment to purify DNA-free total RNA (refer to your sample-specific protocol for
the appropriate step). Continue this protocol to complete the washing and elution steps of your RNA.
Note: There is a wash step after binding and prior to the addition of PureLink™ DNase.
1. Add 350 μL Wash Buffer I to the Spin Cartridge containing the bound RNA (see sample–
specific protocol). Centrifuge at 12,000g for 15 seconds at room temperature. Discard the
flow-through and the Collection Tube. Insert the Spin Cartridge into a new Collection Tube.
2. Add 80 μL PureLink DNase mixture (prepared as described on previous page) directly onto
the surface of the Spin Cartridge membrane.
3. Incubate at room temperature for 15 minutes.

Addendum: Protocols
133
Note: For Promega incubate for 30 min at 37 °C.
4. Add 350 μL Wash Buffer I to the Spin Cartridge. Centrifuge at 12,000g for 15 seconds at room
temperature. Discard flow-through and the Collection Tube and insert the Spin Cartridge into
a new Collection Tube.
5. Add 500 μL Wash Buffer II with ethanol to the Spin Cartridge.
6. Centrifuge at 12,000g for 15 seconds at room temperature. Discard flow-through and
reinsert the Spin Cartridge into the same Collection Tube.
7. Repeat Steps 5–6, once
8. Centrifuge the Spin Cartridge at 12,000g for 1 minute to dry the membrane with bound RNA.
Discard Collection Tube and insert the Spin Cartridge into a Recovery Tube.
9. Add 30 μL–100 μL RNase–Free Water to the center of the Spin Cartridge.
10. Incubate at room temperature for 1 minute.
11. Centrifuge Spin Cartridge and Recovery Tube for 1 minute at ≥12,000g at room temperature.
12. Store your purified RNA at -80 °C, or proceed to Analyzing RNA Yield and Quality.
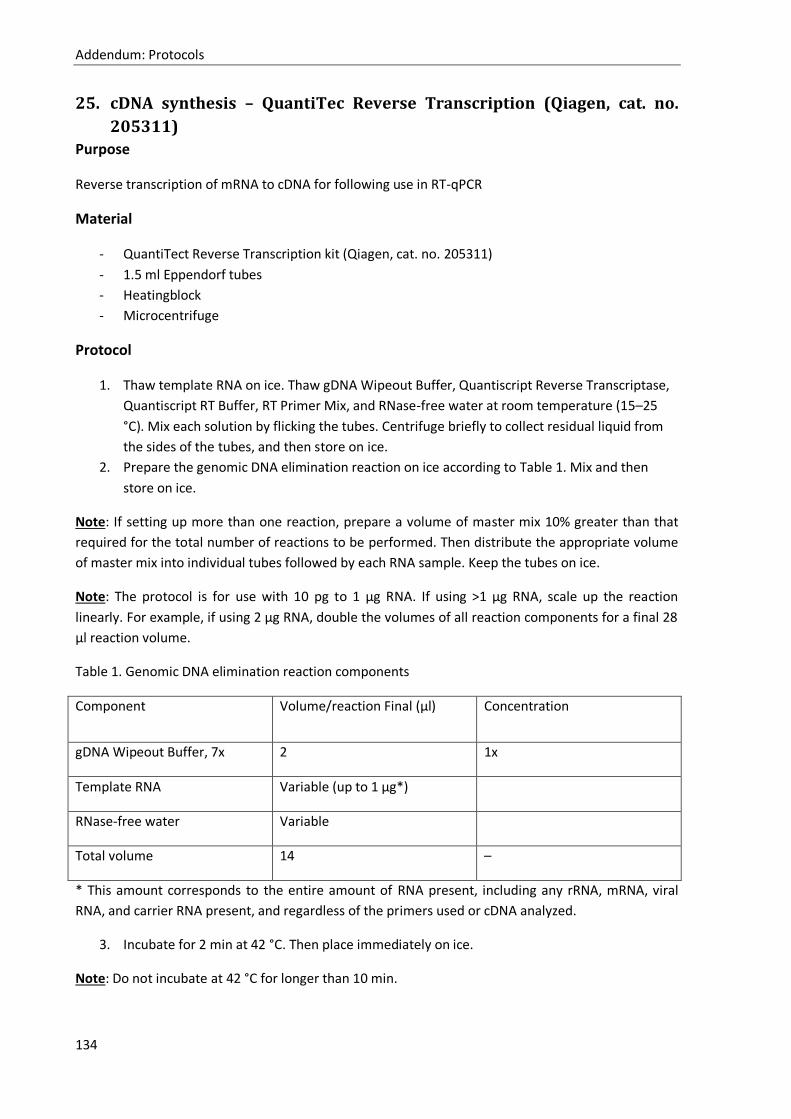
Addendum: Protocols
134
25. cDNA synthesis – QuantiTec Reverse Transcription (Qiagen, cat. no.
205311)
Purpose
Reverse transcription of mRNA to cDNA for following use in RT-qPCR
Material
- QuantiTect Reverse Transcription kit (Qiagen, cat. no. 205311)
- 1.5 ml Eppendorf tubes
- Heatingblock
- Microcentrifuge
Protocol
1. Thaw template RNA on ice. Thaw gDNA Wipeout Buffer, Quantiscript Reverse Transcriptase,
Quantiscript RT Buffer, RT Primer Mix, and RNase-free water at room temperature (15–25
°C). Mix each solution by flicking the tubes. Centrifuge briefly to collect residual liquid from
the sides of the tubes, and then store on ice.
2. Prepare the genomic DNA elimination reaction on ice according to Table 1. Mix and then
store on ice.
Note: If setting up more than one reaction, prepare a volume of master mix 10% greater than that
required for the total number of reactions to be performed. Then distribute the appropriate volume
of master mix into individual tubes followed by each RNA sample. Keep the tubes on ice.
Note: The protocol is for use with 10 pg to 1 μg RNA. If using >1 μg RNA, scale up the reaction
linearly. For example, if using 2 μg RNA, double the volumes of all reaction components for a final 28
μl reaction volume.
Table 1. Genomic DNA elimination reaction components
Component Volume/reaction Final (µl) Concentration
gDNA Wipeout Buffer, 7x 2 1x
Template RNA Variable (up to 1 μg*)
RNase-free water Variable
Total volume 14 –
* This amount corresponds to the entire amount of RNA present, including any rRNA, mRNA, viral
RNA, and carrier RNA present, and regardless of the primers used or cDNA analyzed.
3. Incubate for 2 min at 42 °C. Then place immediately on ice.
Note: Do not incubate at 42 °C for longer than 10 min.
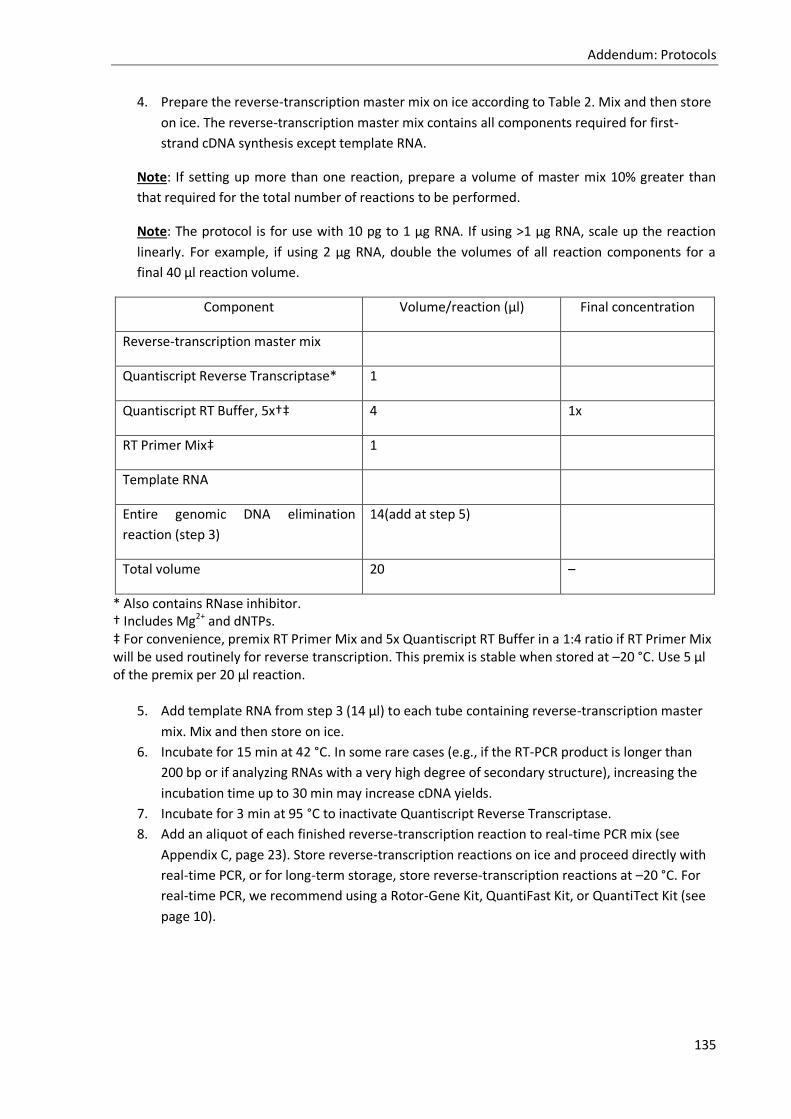
Addendum: Protocols
135
4. Prepare the reverse-transcription master mix on ice according to Table 2. Mix and then store
on ice. The reverse-transcription master mix contains all components required for first-
strand cDNA synthesis except template RNA.
Note: If setting up more than one reaction, prepare a volume of master mix 10% greater than
that required for the total number of reactions to be performed.
Note: The protocol is for use with 10 pg to 1 μg RNA. If using >1 μg RNA, scale up the reaction
linearly. For example, if using 2 μg RNA, double the volumes of all reaction components for a
final 40 μl reaction volume.
Component Volume/reaction (µl) Final concentration
Reverse-transcription master mix
Quantiscript Reverse Transcriptase* 1
Quantiscript RT Buffer, 5x†‡ 4 1x
RT Primer Mix‡ 1
Template RNA
Entire genomic DNA elimination
reaction (step 3)
14(add at step 5)
Total volume 20 –
* Also contains RNase inhibitor. † Includes Mg2+ and dNTPs. ‡ For convenience, premix RT Primer Mix and 5x Quantiscript RT Buffer in a 1:4 ratio if RT Primer Mix will be used routinely for reverse transcription. This premix is stable when stored at –20 °C. Use 5 μl of the premix per 20 μl reaction.
5. Add template RNA from step 3 (14 μl) to each tube containing reverse-transcription master
mix. Mix and then store on ice.
6. Incubate for 15 min at 42 °C. In some rare cases (e.g., if the RT-PCR product is longer than
200 bp or if analyzing RNAs with a very high degree of secondary structure), increasing the
incubation time up to 30 min may increase cDNA yields.
7. Incubate for 3 min at 95 °C to inactivate Quantiscript Reverse Transcriptase.
8. Add an aliquot of each finished reverse-transcription reaction to real-time PCR mix (see
Appendix C, page 23). Store reverse-transcription reactions on ice and proceed directly with
real-time PCR, or for long-term storage, store reverse-transcription reactions at –20 °C. For
real-time PCR, we recommend using a Rotor-Gene Kit, QuantiFast Kit, or QuantiTect Kit (see
page 10).

Addendum: Protocols
136
26. Quantitative PCR (qPCR) Volume/tube in µl: 10 # tubes: Y Total volume in µl: 10 x Y
product Specific stock final dilution volume (µl)
polymerase LC480 Probes Master 2x 1x 2 10 x Y / 2
primer 1 Forward Primer (TNF-α of β–actin) 20 µM 0.5 µM 40 10 x Y / 40
primer 2 Reverse Primers (TNF-α of β–actin) 20 µM 0.5 µM 40 10 x Y / 40
TaqMan probe 1 Probe (TNF-α of β–actin) 20 µM 0.1 µM 200 10 x Y / 200
sample Y x 2,5 2,5
totaal volume
Z = (10 x Y / 2) + (10 x Y / 40) + (10 x Y / 40) + (Y x 2,5)
AD to be added A = Z - (10 x Y)
CONTROLE total volume mix: V = (10 x Y / 2) + (10 x Y / 40) + (10 x Y / 40) - A
# µl mix/tube: 7,5 / Y
# µl staal/tube: 2,50
# µl totaal volume: 10,00
Length PCR product: TNF-α 84
β-actin 90
Real time PCR-program
Initial denaturation 30" 95 °C
Amplification x45
Denaturation 30" 95 °C
Hybridization 10" 59 °C
Elongation 10" 72 °C The fluorescent signal was aquired at the end of the hybridization step (Stordeur et al, 2002).