Study of Potential Aerodynamic Benefits From …mln/ltrs-pdfs/NASA-95-tp3515.pdfStudy of Potential...
38
NASA Technical Paper 3515 Study of Potential Aerodynamic Benefits From Spanwise Blowing at Wingtip Raymond E. Mineck June 1995
Transcript of Study of Potential Aerodynamic Benefits From …mln/ltrs-pdfs/NASA-95-tp3515.pdfStudy of Potential...

NASA Technical Paper 3515
Study of Potential Aerodynamic Benefits FromSpanwise Blowing at WingtipRaymond E. Mineck
June 1995

National Aeronautics and Space AdministrationLangley Research Center • Hampton, Virginia 23681-0001
NASA Technical Paper 3515
Study of Potential Aerodynamic Benefits FromSpanwise Blowing at WingtipRaymond E. MineckLangley Research Center • Hampton, Virginia
June 1995

iii
Contents
Summary. . . . . . . . . . . . . . . . . . . . . . . . . . . . . . . . . . . . . . . . . . . . . . . . . . . . . . . . . . . . . . . . . . . . . . . . . . 1
Introduction . . . . . . . . . . . . . . . . . . . . . . . . . . . . . . . . . . . . . . . . . . . . . . . . . . . . . . . . . . . . . . . . . . . . . . . 1
Symbols . . . . . . . . . . . . . . . . . . . . . . . . . . . . . . . . . . . . . . . . . . . . . . . . . . . . . . . . . . . . . . . . . . . . . . . . . . 2
Wind Tunnel . . . . . . . . . . . . . . . . . . . . . . . . . . . . . . . . . . . . . . . . . . . . . . . . . . . . . . . . . . . . . . . . . . . . . . . 3
Model . . . . . . . . . . . . . . . . . . . . . . . . . . . . . . . . . . . . . . . . . . . . . . . . . . . . . . . . . . . . . . . . . . . . . . . . . . . . 3
Instrumentation. . . . . . . . . . . . . . . . . . . . . . . . . . . . . . . . . . . . . . . . . . . . . . . . . . . . . . . . . . . . . . . . . . . . . 5
Model Calibrations and Corrections. . . . . . . . . . . . . . . . . . . . . . . . . . . . . . . . . . . . . . . . . . . . . . . . . . . . . 5
Corrections for Stiffness and Pressure of Air Lines . . . . . . . . . . . . . . . . . . . . . . . . . . . . . . . . . . . . . . . 5
Jet Momentum Calibration . . . . . . . . . . . . . . . . . . . . . . . . . . . . . . . . . . . . . . . . . . . . . . . . . . . . . . . . . . 5Test Procedures and Data Reduction . . . . . . . . . . . . . . . . . . . . . . . . . . . . . . . . . . . . . . . . . . . . . . . . . . . . 6
Presentation of Results . . . . . . . . . . . . . . . . . . . . . . . . . . . . . . . . . . . . . . . . . . . . . . . . . . . . . . . . . . . . . . . 6
Discussion. . . . . . . . . . . . . . . . . . . . . . . . . . . . . . . . . . . . . . . . . . . . . . . . . . . . . . . . . . . . . . . . . . . . . . . . . 7
Data Accuracy and Repeatability . . . . . . . . . . . . . . . . . . . . . . . . . . . . . . . . . . . . . . . . . . . . . . . . . . . . . 7
Wing Aerodynamic Characteristics Without Blowing . . . . . . . . . . . . . . . . . . . . . . . . . . . . . . . . . . . . . 9
Effect of Spanwise Blowing on Wing Aerodynamic Characteristics . . . . . . . . . . . . . . . . . . . . . . . . . 10
Navier-Stokes Calculations With Simulated Blowing . . . . . . . . . . . . . . . . . . . . . . . . . . . . . . . . . . . . 12Concluding Remarks . . . . . . . . . . . . . . . . . . . . . . . . . . . . . . . . . . . . . . . . . . . . . . . . . . . . . . . . . . . . . . . 14
Appendix—Verification of Navier-Stokes Solver With Simulated Wingtip Blowing . . . . . . . . . . . . . 15
References . . . . . . . . . . . . . . . . . . . . . . . . . . . . . . . . . . . . . . . . . . . . . . . . . . . . . . . . . . . . . . . . . . . . . . . 38
Tables . . . . . . . . . . . . . . . . . . . . . . . . . . . . . . . . . . . . . . . . . . . . . . . . . . . . . . . . . . . . . . . . . . . . . . . . . . . 39
Figures . . . . . . . . . . . . . . . . . . . . . . . . . . . . . . . . . . . . . . . . . . . . . . . . . . . . . . . . . . . . . . . . . . . . . . . . . . 43

Printed copies available from the following:
NASA Center for AeroSpace Information National Technical Information Service (NTIS)800 Elkridge Landing Road 5285 Port Royal RoadLinthicum Heights, MD 21090-2934 Springfield, VA 22161-2171(301) 621-0390 (703) 487-4650
Available electronically at the following URL address: http://techreports.larc.nasa.gov/ltrs/ltrs.html

Summary
Comprehensive experimental and analytical studieshave been conducted to assess the potential aerodynamicbenefits from spanwise blowing at the tip of a moderate-aspect-ratio swept wing. Previous studies on low-aspect-ratio wings indicated that spanwise blowing from thewingtip can diffuse the tip vortex and displace it out-ward. The diffused and displaced vortex will induce asmaller downwash at the wing, and consequently thewing will have increased lift and decreased induced dragat a given angle of attack.
A semispan wing with spanwise blowing from thewingtip has been tested in the Langley 7- by 10-FootHigh-Speed Tunnel. Tests with and without blowingwere conducted at a Mach number of 0.30 over an angle-of-attack range from−2.0° to 11.0°. Additional testingwas conducted at a Mach number of 0.72 without blow-ing and at Mach numbers from 0.20 to 0.50 with blow-ing. Different wingtip blowing configurations weretested to investigate the effects of jet-exit chordwiselength, chordwise and vertical locations, and exhaustdirection. Results indicated that blowing from jets with ashort chord had little effect on lift or drag, but blowingfrom jets with a longer chord increased lift near the tipand reduced drag at low Mach numbers.
A Navier-Stokes solver was modified to simulate thejet blowing at the wingtip. The modified solver pre-dicted the aerodynamic characteristics of the wing with-out blowing reasonably well at Mach numbers of 0.30and 0.72, and, except for the wing drag, it predicted theaerodynamic characteristics of the wing with blowing ata Mach number of 0.30. The solver was then used to pre-dict the results with blowing at a Mach number of 0.72.Calculations indicated that lift and drag increased withincreasing jet momentum coefficient.
Because the momentum of the jet is typically greaterthan the reduction in the wing drag and the increase inthe wing lift due to spanwise blowing is small, spanwiseblowing at the wingtip does not appear to be a practicalmeans of improving the aerodynamic efficiency ofmoderate-aspect-ratio wings at high subsonic Machnumbers.
Introduction
Aerodynamic efficiency is an important factor in themarketing of subsonic, commercial transport aircraft.Efficiency can be improved by increasing the maximumlift-to-drag ratio at the cruise flight condition. Becauseinduced drag is typically 30 percent or more of the totaldrag on a subsonic transport in cruising flight (ref. 1), itis frequently the target of drag reduction efforts. Reduc-ing the strength of the wingtip vortices, diffusing them,
and displacing them outboard will reduce the downwashon the wing at a given angle of attack, thereby resultingin an increase in lift and a decrease in induced drag.Subscale experiments (ref. 2) have shown that spanwiseblowing from the wingtip displaces and diffuses thewingtip vortex. Spanwise wingtip blowing thus has thepotential to increase the wing aerodynamic efficiency.This report investigates spanwise blowing from thewingtip as a potential means to increase lift and reduceinduced drag.
Wingtip blowing entails exhausting one or more jetsof air from the wingtip in a generally spanwise direction,as shown in figure 1. The parameter used to characterizethe jet-blowing magnitude is the jet momentum coeffi-cient, (Cµ). For this study, the reference quantities usedto define the jet momentum coefficient are the free-stream dynamic pressure and the wing reference area.Thus, the magnitude of the jet momentum can be directlycompared with the wing lift and drag when using theappropriate coefficients. Two types of jets have beenstudied: a single, long-chord jet and several discrete,short-chord jets. Air for the jet can be bled from the pro-pulsion system, removed from the flow at the aircraftsurface by a laminar-flow-control system, or ducted fromthe region of the stagnation line along the wing leadingedge. The jet momentum is treated as a gross thrust orforce. To account for all the forces properly, the massflow for the jet is assumed to be decelerated to a stagnantcondition. The force to decelerate the jet mass flow isreferred to as the “ram drag.” If engine bleed air is used,the ram drag of the extra air must be included when eval-uating the results. The use of air ducted from the leadingedge, as shown in figure 2, would provide a passive sys-tem with a portion of the ram drag already included.However, only relatively small mass-flow rates and jetmomentum coefficients would be available from such asystem.
Early work in wingtip blowing (refs. 2–5) addressedlift augmentation of low-aspect-ratio wings. These testsusually involved large jet momentum coefficients and jetchords that were a large fraction of the wingtip chord likethe long-chord jet shown in figure 1. The required jetmass-flow rates and momentum coefficients were quitelarge. In most cases, the jets exhausted in the plane ofthe wing and normal to the free-stream direction. Theresults from these early works showed that spanwiseblowing increased the lift-curve slope and sometimesreduced the drag at a given lift. Blowing increased theloading across the span of a low-aspect-ratio wing withthe largest increases occurring near the tip (closest to thesource). The addition of blowing also increased the max-imum lift coefficient. Flow surveys behind the wingwith and without blowing indicated that blowing dis-placed the primary wingtip vortex outward and upward,

2
diffused the vortex over a larger area, and reduced themaximum vorticity at the center of the vortex. Tests ofspanwise blowing with different jet vertical locations andexhaust directions (ref. 2) showed that displacing the jettoward the upper surface or deflecting the jet downwardincreased the beneficial increment in lift above thatfound for the jet exhausting spanwise on the centerline ofthe wingtip.
As previously mentioned, these exploratory investi-gations (refs. 2–5) primarily studied the effect of span-wise blowing on the lift of low-aspect-ratio wings.Values of jet momentum coefficient ranged from about0.10 to 1.75. For a hypothetical transport aircraft incruising flight with a lift-to-drag ratio of about 15 and acruise lift coefficient of about 0.6, the total engine thrustcoefficient is 0.6/15 or 0.04. Jet momentum coefficientsused in these exploratory investigations are much largerthan the hypothetical installed engine thrust. Such largevalues are not practical for drag reduction studies.
Tests using several short-chord jets, reported in ref-erences 6–8, were made at much lower blowing coeffi-cients, typically between 0.001 and 0.008, by using arectangular wing with an aspect ratio of 3.4. Benefitsfrom blowing were found to be strongly dependent on thelocation and direction of the jet exhaust. The results indi-cated that blowing from several short-chord jets (seefig. 1) can produce trends similar to those obtained with asingle continuous jet, although the magnitude of theeffects is smaller. Additional information concerningother studies on spanwise blowing at the wingtip is pre-sented in reference 9.
Because previous investigations used large jetmomentum coefficients and low-aspect-ratio wings, asystematic study of the effects of jet location and exhaustdirection on the benefits of wingtip blowing is needed ona moderate-aspect-ratio wing with practical values of jetmomentum coefficient. The purpose of this investigationis to evaluate the potential aerodynamic benefits fromspanwise blowing at the tip of a wing planform represen-tative of those found on subsonic transport aircraft. Thisreport presents results from a wind tunnel test of amoderate-aspect-ratio swept wing with spanwise blow-ing from discrete jets at the wingtip.
Baseline data without wingtip blowing wereobtained at Mach numbers of 0.30 and 0.72. The effectsof jet chordwise length, chordwise location, vertical loca-tion, in-plane deflection, and out-of-plane deflectionwere investigated at a Mach number of 0.30. This testwas conducted in the NASA Langley 7- by 10-FootHigh-Speed Tunnel. Wing forces and moments and sur-face pressures were measured along with the mass-flowrate, pressure, and temperature of the jet. The experi-mental results were supplemented with Navier-Stokes
calculations on simulated blowing from the wingtip at aMach number of 0.72.
Symbols
All measurements and calculations were made inU. S. customary units.
b exposed wing semispan, ft
CB wing-root bending-moment coefficient,
slope of wing-root bending-moment curve,
CB,0 wing-root bending-moment coefficient at zerolift
CD wing drag coefficient,
CD,tot total drag coefficient including ram dragpenalty,
CD,0 wing drag coefficient at zero lift
CL wing lift coefficient,
wing lift-curve slope,
Cm wing pitching-moment coefficient,
slope of wing pitching-moment curve,
Cm,0 wing pitching-moment coefficient at zero lift
Cp local static pressure coefficient,
static pressure coefficient at sonic conditions
Cµ total jet momentum coefficient,
Cµ,F front jet momentum coefficient,
Cµ,R rear jet momentum coefficient,
c local wing chord, ft
mean aerodynamic chord, 0.616 ft
cj chordwise length of jet, in.
cl section lift coefficient,
ctip wingtip chord, 4.00 in.
D force in drag direction, lbf
h body height, ft
L force in lift direction, lbf
l section lift per unit span, lbf/ft
MX moment aboutX-axis resolved about wingroot, ft-lbf
MY moment aboutY-axis resolved about0.25 , ft-lbf
free-stream Mach number
jet mass-flow rate, slugs/sec
MX /q∞Sb
CBCL dCB /dCL
D/q∞S
D mjV∞+( ) /q∞S
L/q∞S
CLαdCL /dα, deg1–
MY/q∞Sc
CmCL dCm/dCL
p p∞–( ) /q∞Cp
*
Cµ F, Cµ R,+
mj Vj( )F /q∞S
mj Vj( )R/q∞S
c
l /q∞c
c
M∞mj

3
Nc number of chordwise cells in structured Navier-Stokes grid
Nn number of normal cells in structured Navier-Stokes grid
Ns number of spanwise cells in structured Navier-Stokes grid
Nt number of spanwise cells around each half ofwingtip in structured Navier-Stokes grid
p local static pressure, lbf/ft2
free-stream static pressure, lbf/ft2
free-stream dynamic pressure, , lbf/ft2
R unit Reynolds number per foot,
S wing (exposed) reference area, 0.978 ft2
Vj jet-exit velocity, ft/sec
Vx component of local velocity inx-direction, ft/sec
free-stream velocity, ft/sec
X,Y,Z axis system with origin at wing moment refer-ence center (see fig. 12)
x chordwise distance, positive when measured aftfrom wing leading edge, ft
xj chordwise distance from wingtip leading edgeto center of jet exit, in.
y spanwise distance, positive when measured out-ward on right wing, ft
y+ normal spacing parameter for grid in boundarylayer
z vertical distance, positive measured up fromairfoil reference line, ft
zj vertical distance from airfoil reference line tocenter of jet exit, in.
α wing angle of attack, positive leading edgeup, deg
αi flow angle induced by presence of body, deg
α0 wing angle of attack at zero lift, deg
∆ change in parameter due to blowing, Value(with blowing)− Value (without blowing)
δj jet dihedral (deflection inYZ-plane), deg(see fig. 7)
η fraction of wing semispan,y/b
ρ∞ free-stream density, slugs/ft3
ψj jet sweep (deflection inXY-plane), deg(see fig. 7)
Subscripts:
F front
p∞q∞
12---ρ∞V∞
2
ρ∞V∞ /µ
V∞
R rear
Abbreviations:
AOA angle of attack
ARL airfoil reference line
HSNLF High-Speed Natural Laminar Flow
HST High-Speed Tunnel
mac mean aerodynamic chord
3-D three dimensional
Wind Tunnel
The experimental portion of this study was per-formed in the Langley 7- by 10-Foot High-Speed Tunnel(7 × 10 HST). Descriptions of the tunnel and its supportequipment can be found in reference 10. A sketch of theinternal components of the test section is presented infigure 3. The 7× 10 HST is a single-return, closed-circuit, fan-driven wind tunnel that operates at atmo-spheric temperature and pressure. All four test sectionwalls are solid, and wooden fairings on the sidewalls pro-vide a uniform longitudinal Mach number distributionalong the centerline of the test section. The test section is6.58 ft high and 9.57 ft wide with a usable length of10.83 ft. Four turbulence reduction screens are locatedjust upstream of the 17:1 contraction section to providegood flow quality. A 14 000-hp variable-speed motordrives the fan to provide a continuous Mach numberrange from near 0 to 0.94 with the test section empty.The nominal test conditions of the tunnel are presented infigure 4. The tunnel has a sting-model support systemfor full-span model testing and a sidewall turntable onthe left wall for semispan model testing. For this investi-gation, the model was mounted on the sidewall turntablewith the sting-model support system stowed along thefloor of the test section to minimize interference.
Model
The model used in this investigation was representa-tive of the outer portion of the wing of a subsonic com-mercial passenger transport. Planforms of severalcommercial passenger transports were scaled so that eachhad a wingspan of unity. A comparison of the scaledplanforms showed that the leading-edge sweep, the loca-tion of the discontinuity in the wing trailing-edge sweepangle, and the taper in the outboard portion of the wingwere similar for many types of subsonic passenger trans-ports. The values of the wing parameters selected forthis investigation were as follows: a leading-edge sweepof 33°, a change in the wing trailing-edge sweep angle atthe 40-percent-semispan location, and a taper ratio of 0.4outboard of the location of the discontinuity in the wingsweep angle. Only the portion of a transport wing
4
outboard of the 40-percent-semispan location was mod-eled because the induced effects from jet blowing at thetip of a moderate-aspect-ratio wing were expected to bevery small near the root.
The model was originally designed for testing in awind tunnel with a test section that was 36 in. wide. Tokeep wall interference to a reasonable level and to maxi-mize the model size, a semispan configuration wasselected with a root chord of 10.0 in., a tip chordof 4.0 in., and a semispan of 20.26 in. Photographs ofthe model are shown in figure 5 and sketches areshown in figure 6. The NASA HSNLF(1)-0213 airfoilsection, designed for a lift coefficient of 0.2 at a Machnumber of 0.7, was used for the wing. Measured aerody-namic characteristics of this airfoil are presented inreference 11. The nondimensional coordinates of the air-foil are listed in table 1, and a sketch of the airfoil shapeis presented at the bottom of figure 6(c). The wing hadno twist, with the result that a straightforward installationof the air passages was possible. The wing was mountedon a body such that it would be outside the test sectionsidewall boundary layer.
The body, shown in figure 6(a), was formed in threeparts: a forward section, a center section, and an aft sec-tion. The forward section, which was 8.00 in. long, con-sisted of a half-body of revolution outboard and 6.78-in-wide panels inboard. The aft section of the body, whichwas 10.00 in. long, consisted of a half-body of revolutionoutboard and 6.78-in-wide panels inboard. Coordinatesof the forward and aft sections are listed in table 2. Thecenter section of the body, which was 32.50 in. long,consisted of a semicircle with a diameter of 6.25 in. out-board and 6.78-in. flat panels inboard. The opening forthe wing was rectangular and slightly larger than thewing root. Foam rubber was bonded to the wing withinthe body to form a seal to prevent flow into or out of thebody opening and to minimize seal tare loads on thebalance.
The semispan wing was mounted inverted on a five-component strain gauge balance secured to the model-support turntable by a balance support block within thebody, as shown in figures 5(b) and 6(b). The body wasnot supported by the balance. Two thin-walled hard-walltubes were connected to the balance support and wingroot to serve as the air supply lines. The tubes were bentinto coils looping back and forth within the body, asshown in figure 5(b). The coils provided extra length toease the stiffness between the nonmetric balance supportblock and metric wing. Experiences with such anarrangement have produced repeatable data.
Previous experiments showed that blowing from thetip jet increases the lift over much of the wing. Thesewings had small aspect ratios so that for a rectangular
wing with an aspect ratio of 2, the effect of blowing wasdetected for about 1 chord inboard from the wingtip. Theeffect of tip blowing on the local lift several wingtipchords from the tip should be small. Therefore, chord-wise rows of pressure orifices were concentrated over theouter portion of the wing. Five rows of pressure orificeswere installed in the model atη = 0.25 , 0.50, 0.70, 0.80,and 0.90. Each orifice had a diameter of 0.010 in. andwas drilled normal to the wing surface. A sketch show-ing the nominal orifice locations is presented infigure 6(c), and measured nondimensional orifice loca-tions are listed in table 3. Each chordwise row consistedof 20 orifices on the upper surface extending from theleading edge back to 90 percent chord and 19 orifices onthe lower surface extending from 2 percent chord back to90 percent chord. The wing was too thin aft of the90-percent-chord position to install any orifices there.Results from two-dimensional tests of this airfoil sectionpresented in reference 11 indicate that little loadingoccurs on the rear portion of the airfoil when the flow isattached. By assuming that little or no trailing-edgeseparation occurs, the absence of orifices aft of the90-percent-chord location should have little effect on thecomputation of the section lift coefficient.
The model was designed with removable wingtipsections, shown in figure 6(b), to allow testing of differ-ent wingtip blowing parameters. Each wingtip sectionhad a forward plenum and an aft plenum and each ple-num was supplied with high-pressure air by a separate airpassage in the wing. A 0.020-in. inside-diameter tubewas routed through each air passage and ended in a hookor “J” located in the plenum to measure the total pres-sure. Each plenum supplied high-pressure air to a singlejet exit. By using separate plenum chambers, each jetcould be operated separately.
Six interchangeable wingtip sections were used toinvestigate systematically the effects on the aerodynamiccharacteristics of jet vertical location, chordwise loca-tion, in-plane deflection (sweep), out-of-plane deflection(dihedral), and chordwise length. The nomenclatureused to define the jet geometry is defined in figure 7 anddetails of each tip are presented in figure 8. Each tip wasassigned an identifying number; thus, the missing num-bers denote tips that were designed but not fabricatedbecause of problems in the manufacturing process. Theoriginal numbering system is retained in this report to beconsistent with that in reference 9. Each small-chord jetwas 0.062 in. high and 0.25 in. long (cj/ctip = 0.062). Jetswere centered at nominally the 20-, 30-, 50-, 60-,and 70-percent-chord locations. One tip was fabricatedwith two jets with a longer chord (fig. 8(e)) to approachthe continuous jets used in many of the previous explor-atory experiments. The attachment hardware andfabrication process of the wingtip imposed constraints on
5
the length and location of the two long-chord jet exits.The length of the long-chord front jet was selected tocover the two short-chord jet locations designed for thefront wingtip plenum chamber. The length of the rear jetwas selected to cover the four short-chord jets designedfor the rear wingtip plenum chamber. The jetheight was 0.062 in. and both jets exhausted in a span-wise direction. The length of the forward jet was0.620 in. (cj/ctip = 0.155), and the length of the rear jetwas 1.50 in. (cj/ctip = 0.375). A summary of the jetparameters for each tip is presented in table 4, and sche-matic diagram showing the available jet locations forcomparisons is presented in figure 9.
Instrumentation
Measurements were required of the wing forces andmoments, wing surface static pressures, jet mass-flow rate, pressure, temperature, and wind tunnel testconditions. Wing forces and moments were measured bya five-component strain gauge balance, but wing sideforce was not measured. All balance strain gauges weretemperature compensated, and the balance was calibratedfor the first- and second-order balance componentinteractions.
Wing surface static pressures were measured by anelectronically scanned pressure (ESP) measurement sys-tem with a transducer dedicated to each orifice. Eachtransducer measured a differential pressure. Tunnel free-stream static pressure was used as the reference pressurefor the static pressure measurements. All wing pressureswere measured at virtually the same time that the rest ofthe data were measured.
Pressure and temperature instrumentation were usedwith the air supply system to determine the jet momen-tum and to correct the balance data for the effect of thepressurized air lines. A schematic diagram of the air sup-ply system and associated instrumentation is presented infigure 10. Differential pressure transducers were con-nected to each air line just upstream of the rigid attach-ment to the balance support. These air line pressureswere used to correct the balance data for the effect ofpressure on the air line static load. Differential pressuretransducers were connected to the “J” tubes installed inthe two wingtip plenum chambers. The plenum totalpressure and free-stream static pressure were used todetermine the momentum of each jet. The volume flowrate of each tip jet was measured by separate turbineflowmeters, and static pressure and temperature at theinlet of the flowmeters were measured to determine thegas density. Flowmeter inlet static pressure was mea-sured with an individual differential pressure transducer,whereas flowmeter inlet temperature was measured witha thermocouple. Mass-flow rate was determined from
the density of the high-pressure air and the volume flowrate of each air line.
Tunnel static and total pressures were measured byquartz bourdon-tube pressure transducers. This sametype of transducer was used to measure the referencepressure used for the electronically scanned pressuremodules and the differential pressure transducers. Thesequartz pressure transducers were referenced to a vacuumto provide absolute pressure measurements.
The model angle of attack was measured with anaccelerometer mounted on the wing root, as shown infigure 5(b). The sensor provided the actual wing angle ofattack so that no corrections were required for modelsupport bending.
Model Calibrations and Corrections
Corrections for Stiffness and Pressure of AirLines
The presence of the air lines provides load paths forthe wing forces and moments in addition to the onethrough the balance. The effects of stiffness and pressureof air lines must be determined so that they can beremoved from the balance data. Air line stiffness canchange with pressure, and air line pressure will tend tounwind the coils in the air line, thus changing the air linestatic load on the balance. In order to determine the tare,the wingtip section was removed and a loading bar wasattached to the end of the wing. With the air lines dis-connected from the wing root, known loads were appliedto the wing and balance. The air lines were then con-nected to the wing root and the loadings were repeatedboth with and without pressure in the air lines. The dif-ference in the measured results was the effect of the airline stiffness on the balance calibration.
Air line pressures used in this investigation, whichwere generally less than 110 psi, were too small to have ameasurable effect on the air line stiffness. Each air linewas then pressurized separately to determine the effect ofpressure on the static loads on the balance by unwindingthe air line coils. Details of the calibration proceduresfor air line stiffness and the results from the calibrationmay be found in appendix A of reference 9.
Jet Momentum Calibration
The momentum of the tip jets could not be measuredin all three directions because there was no side-forcecomponent on the balance, and thus an alternate meansof determining the jet momentum was used. A rake withfive total pressure tubes spaced over the width of the jetexhaust was used to survey across the jet exhaust.Ambient pressure, jet total temperature, and five jet total
6
pressures were measured and used to compute the den-sity and velocity of the jet exhaust at multiple positionsin a plane normal to the jet exhaust. Jet momentum perunit width of jet was determined by integrating across thejet height the product of the density and velocity squaredfor each of the five total pressure tubes. Jet momentum(thrust) was computed by integrating the variation of thejet momentum per unit width across the width of the jetexhaust. This process was repeated for several differentplenum pressures. The integrated jet momentum wascalibrated as a function of the difference between thetotal pressure measured in the jet plenum and the ambientstatic pressure. Details of the calibration procedures,derivation of the equations used to compute the jetmomentum, and the calibration measurements are pre-sented in appendix B of reference 9.
Test Procedures and Data Reduction
Accurate and repeatable drag measurements on thewing with tip blowing were crucial to the success of thisinvestigation. Viscous drag on the wing will change ifthe boundary-layer transition point changes. The transi-tion location on the wing upper and lower surfaces wasfixed by using a strip of carborundum grit. The grit loca-tion was determined by using the method of reference 12,and a sketch indicating the size and location of the transi-tion strips is presented in figure 11.
Each tip was tested without blowing at angles ofattack from−2.0° to 11.0° at a Mach number of 0.30.This established a baseline for each tip to eliminate theeffects of any minor manufacturing differences amongthe tips. Then, each tip was tested at the same nominalfree-stream Mach number and angles of attack with max-imum blowing from the front jet alone, the rear jet alone,and from both jets for only tip 8. The maximum jet-exitMach number, which was limited to 0.90 to eliminatepotential noise and fatigue problems associated with asupersonic jet, restricted the maximum jet momentum forthe tips with the short-chord jet exits. The maximumpressure and mass-flow rate of the air supply system lim-ited the maximum jet momentum for tip 8 with the long-chord jets (because of the larger jet-exit area). Tip 8 wastested at a constant angle of attack of about 2° while thetip jet momentum was varied from 0 to the maximumvalue at free-stream Mach numbers of 0.20, 0.30, 0.40,and 0.50. Testing at a Mach number of 0.72 withoutblowing was limited to an angle-of-attack range from−2.0° to 1.0° by the balance rolling-moment limit. Ateach test condition, the balance forces and moments,wing surface static pressures, free-stream test conditions,
plenum pressure, air line pressure, flowmeter turbinerotational speed, flowmeter temperature, and flowmeterpressure for each jet were recorded.
The wing balance data have been corrected forweight tares, first- and second-order balance componentinteractions, and air line stiffness and pressure tares.Data were resolved about a moment reference centerlocated along the wing-body juncture at the quarter-chord location of the mean aerodynamic chord, as shownin figure 6(a). All balance data have been converted tocoefficient form. Wall interference corrections werecomputed by using the technique of reference 13 andwere found to be negligible.
Jet momentum coefficient as well as the jet contribu-tions to the wing lift, drag, root bending moment, andpitching moment were computed from the jet calibration.These direct thrust effects were subtracted from the mea-sured balance quantities to obtain the wing force andmoment results. An equivalent ram drag was computedfrom the jet mass-flow rate and free-stream velocity.The computed ram drag has been added to the wing dragto obtain the wing total drag. Unless specifically notedotherwise, the drag coefficients presented for the wing donot include the ram drag.
Wing pressure data have been referenced to the free-stream static pressure and nondimensionalized by thefree-stream dynamic pressure. Pressures at the two rear-most pressure orifices on the wing upper and lower sur-faces were used to extrapolate linearly to the pressure atthe wing trailing edge. The wing-surface static pressurecoefficients have been integrated in the chordwise andnormal directions to obtain the section normal-force andchord-force coefficients. These coefficients were usedto obtain the section lift coefficient for each chordwiserow of orifices.
Presentation of Results
The wing longitudinal force and moment coeffi-cients are presented in coefficient form in the stability-axis system, and the wing-root bending-moment coeffi-cients are presented in the body-axis system. (Seefig. 12.) The reference area for the coefficients was theexposed planform area, the reference length for the wing-root bending-moment coefficient was the distance fromthe exposed wing root to the tip, and the reference lengthfor the pitching-moment coefficient was the meanaerodynamic chord.

7
Discussion
Data Accuracy and Repeatability
The accuracy of the wing force and moment datadepends on the accuracy of the balance and angle-of-attack measurements. The quoted balance accuracy is0.5 percent of the full-scale balance load, which equatesto 2.0 lbf normal force, 0.15 lbf axial force, 10.0 in-lbfpitching moment, and 5.0 in-lbf rolling moment. A typ-ical accuracy of the angle-of-attack measurement isabout 0.02°. For small angles of attack, the drag accuracydepends primarily on the axial-force measurement andthe lift accuracy depends primarily on the normal-forcemeasurement. At a Mach number of 0.30 and smallangles of attack, the lift-coefficient accuracy is 0.016, thedrag-coefficient accuracy is 0.0012, the pitching-moment-coefficient accuracy is 0.011, and the wing-root
bending-moment coefficient (rolling-moment) accuracyis 0.002.
The repeatability of the wing force and moment datais affected by problems associated with the two air linesthat cross the balance. The design of the air supply sys-tem and the test procedures used in these tests attemptedto minimize the problems with mechanical connections,nonuniform expansion and contraction with temperature,changes in the static loads with air line pressure, and hys-teresis. The repeatability of the wing data was investi-gated by retesting two of the wingtip sections. Theresults are presented in figure 13 for tips 2 and 8 at aMach number of 0.30. These tests were conducted withthe air lines attached so that the repeatability of theresults would be representative of those obtained with tipblowing. Tip 2 was tested two times, and tip 8 was testedthree times. The different sets of measurements for each
The results from this investigation are presented as follows:
Data repeatability without blowing atM∞ = 0.30: FigureWing force and moment coefficients........................................................................................................................... 13Wing chordwise pressure distribution ......................................................................................................................... 14Spanwise variation of section lift coefficient .............................................................................................................. 15
Experimental aerodynamic characteristics without blowing (tip 8) atM∞ = 0.30:Wing force and moment coefficients........................................................................................................................... 16Wing chordwise pressure distribution ......................................................................................................................... 17Spanwise variation of section lift coefficient .............................................................................................................. 18
Experimental aerodynamic characteristics with blowing from short-chord jets atM∞ = 0.30:Effect of jet chordwise location on wing lift and drag coefficients............................................................................. 19Effect of jet vertical location on wing lift and drag coefficients ................................................................................. 20Effect of jet out-of-plane deflection (dihedral) on wing lift and drag coefficients ..................................................... 21Effect of jet in-plane deflection (sweep) on wing lift and drag coefficients ............................................................... 22Effect of jet length on wing lift and drag coefficients ................................................................................................. 23
Experimental aerodynamic characteristics with blowing from longer chord jets (tip 8) atM∞ = 0.30:Effect of blowing on wing force and moment coefficients ......................................................................................... 24Variation of wing lift and drag coefficients with jet momentum coefficient .............................................................. 25Effect of blowing on spanwise distribution of section lift coefficient ........................................................................ 26Variation of section lift coefficient atη = 0.90 with jet momentum coefficient......................................................... 27Change in chordwise pressure distribution atη = 0.90 with jet momentum coefficient............................................. 28
Computed aerodynamic characteristics without and with blowing from longer chord jets atM∞ = 0.72, α = 1°,andδj = 0°:
Chordwise pressure distribution .................................................................................................................................. 29Particle paths near wingtip .......................................................................................................................................... 30Spanwise variation of section lift coefficient .............................................................................................................. 31Change in section wing lift atη = 0.90, wing lift, and wing drag coefficients ........................................................... 32
Computed aerodynamic characteristics with blowing from longer chord jets atM∞ = 0.72, α = 1°, andδj = 30°:Chordwise pressure distribution .................................................................................................................................. 33Particle paths near wingtip .......................................................................................................................................... 34Spanwise variation of section lift coefficient .............................................................................................................. 35

8
tip will be referred to by a run number. Runs 2 and 3 fortip 8 were measured sequentially in the test programwithout stopping the tunnel flow.
The repeatability of the wing lift data without blow-ing for tip 2 and the sequentially measured results fortip 8 are in excellent agreement. The sequentially mea-sured results for tip 8 (runs 2 and 3) differ from theresults for tip 8 obtained earlier in the test (run 1). Thedifference in lift coefficient at the same angle of attack isabout 0.015, which is just within the lift-coefficient accu-racy of 0.016. A linear least-squares curve was fitted tothe linear portion of each data set to obtain the angle ofzero lift (α0) and the lift-curve slope ( ). (The resultsare included in table 5.) Except for tip 8 (run 1), therepeatability of the results for a given tip is very good.
For tip 2, the difference in the drag coefficientbetween the curves at low lift coefficients is about0.0010, and the difference decreases as the angle ofattack increases. The lower drag for run 2 is not consis-tent with the drag obtained on other tips without blowing,but the difference is still within the expected accuracy.Results for tip 8 that were measured sequentially (runs 2and 3) are in good agreement, especially at the lower liftcoefficients. However, results obtained earlier in the test(run 1) show larger differences in the drag as the liftincreases. An examination of the raw millivolt data indi-cates that the model was probably not precisely at anangle of attack of 0° when the reference readings wererecorded for run 1 with tip 8. The difference is probablyattributable to an error of about 0.1° in setting the modelattitude for recording the reference conditions at whichthe model is assumed to be at an angle of attack of 0°.However, the differences between the results are stillwithin the quoted balance accuracy.
For the untwisted wing tested in this investigation,the section lift coefficient at each spanwise station willapproach zero as the angle is attack is reduced to theangle of zero lift. With no lift across the wing, the wing-root bending moment should also be zero. As the angleof attack increases, the lift at each spanwise stationincreases linearly with the angle of attack. The wing-rootbending moment should also vary linearly with angle ofattack and lift because the wing-root bending moment isthe integral of the product of the section lift and spanwiselocation on the wing. The variation should be linear aslong as the flow is attached.
The repeatability of the results from tip 2 for wing-root bending moment and of the sequentially measuredresults from tip 8 is very good. Again, run 1 for tip 8does not agree very well with the other two runs. Thenonzero wing-root bending-moment coefficient at zerolift from run 1 for tip 8 differs slightly from that for theother two runs. This is additional evidence that the refer-
CLα
ence model attitude for run 1 for tip 8 was incorrect. Alinear least-squares curve was fitted to the linear portion
of each data set to obtain the slope and intercept
(CB,0) of the wing-root bending-moment curves, and theresults are included in table 5. For each tip, the repeat-ability of the computed slopes of the bending-momentcurves is very good.
The moment reference center was located at thequarter-chord of the mean aerodynamic chord, whichshould be close to the aerodynamic center. Thus, theslopes of the pitching-moment curves are small until sep-aration begins. Although some scatter exists in the resultsfrom tip 2 for pitching-moment coefficient at the lowerlift coefficients, the curves are in reasonable agreement.The sequentially acquired results from tip 8 are in goodagreement, but the results for run 1 are shifted. Allresults are well within the quoted pitching-moment-coefficient accuracy of 0.011. A linear least-squares fitwas applied to the results over the same linear portionof the curve to determine the pitching moment at zero
lift, ( Cm,0) and the slope , and the results are
included in table 5. The repeatability of the slopes is verygood, although a very small shift in pitching momentoccurs between the runs.
The differences that appear in the results are largerfor runs that were not measured sequentially. Wheneverpractical, the effect of tip blowing will be determined bythe difference between results with and without tip blow-ing measured sequentially in order to minimize thesedifferences. From the limits of data accuracy and datarepeatability, changes in the force and moment coeffi-cients due to blowing that are less than quoted accuracyshould not be considered significant.
The repeatability of the chordwise pressure distribu-tions at each of the five spanwise stations is presented infigure 14 for tip 2 at nominal angles of attack of 4.0°and 8.0°. The accuracy of the transducers in the elec-tronically scanned pressure modules is typically quotedto be 0.15 percent of the transducer full-scale rating. Ata Mach number of 0.30 and a dynamic pressure of125 psf, the accuracy of the pressure coefficient is betterthan 0.01. As can be seen from the plots, such accuracyis not distinguishable on the scales used. For all fivewing stations, the chordwise pressure distributions are inexcellent agreement with each other.
The chordwise pressure distributions from figure 14were integrated to obtain the section lift coefficient ateach spanwise station. These integrated results are pre-sented in figure 15 for tip 2 at the same two nominalangles of attack of 4.0° and 8.0°. As expected, the
CBCL
CmCL

9
repeatability of the spanwise variation of the section liftcoefficient is excellent.
Wing Aerodynamic Characteristics WithoutBlowing
The airfoil section (NASA HSNLF(1)-0213) usedfor the semispan wing was designed to achieve long runsof laminar flow on both surfaces at a section liftcoefficient of 0.2 and a Mach number of 0.70. Two-dimensional test results (ref. 11) of the NASAHSNLF(1)-0213 airfoil section at a Mach number ofabout 0.30 indicate that the airfoil lift curve is linear upto an angle of attack of about 6° where trailing-edgeseparation begins. Separation moves forward withincreasing angle of attack. At stall, leading-edge suctionis still present.
Each tip was tested at a Mach number of 0.30 with-out blowing. Typical results of the wing aerodynamiccharacteristics without wingtip blowing are presented infigure 16 for tip 8. Selected wing aerodynamic charac-teristics without blowing for each wingtip configurationare summarized in table 5. The results from all the tipsare similar, although small differences in the aero-dynamic characteristics exist as was noted in the sectiondescribing the data repeatability. The lift curve is linearwith angle of attack up to an angle of attack of about 4.0°(a lift coefficient of about 0.55) with an average slope of0.101 per degree and an average angle of zero lift ofabout −1.4°. At higher angles of attack, the slope isreduced from that obtained over the linear portionbecause of increasing trailing-edge separation. Maxi-mum lift coefficient was not determined because themaximum angle of attack tested was below the stallangle.
The average wing drag coefficient at zero lift isabout 0.0104. The change in drag is relatively small forlift coefficients up to about 0.40, but it increases rapidlyas the lift increases above that level because of theincrease in profile drag due to trailing-edge separationand because the induced drag increases with the squareof the lift coefficient.
Wing-root bending-moment curves are linear for liftcoefficients up to about 0.55 with a ratio of bendingmoment to lift of 0.42. At higher lift coefficients, theratio is reduced, with the change in the ratio occuring atabout the same lift coefficient at which the change in lift-curve slope occurs. Over the linear portion of the curve,the spanwise center of lift is located at about the42-percent-semispan location, although at higher liftcoefficients, the center of lift moves inboard. The aver-age wing-root bending-moment coefficient at zero lift isvirtually zero.
The variation of pitching-moment coefficient withlift coefficient is nearly linear up to lift coefficients of0.55, with an average slope of about 0.005. The averagepitching-moment coefficient at zero lift is−0.013, whichis very close to the value (−0.012) obtained in the two-dimensional airfoil tests (reported in ref. 11) at slightlydifferent test conditions. Results from the lift, wing-rootbending-moment, and pitching-moment coefficients allindicate that attached flow is maintained up to a lift coef-ficient of about 0.55 and that the separation begins at thetrailing edge.
Chordwise pressure distributions at a Mach numberof 0.30 are presented in figure 17 for tip 8 with no blow-ing at angles of attack from 0° to 10.0° for all five span-wise stations. These results are typical of those for allthe tips. At an angle of attack of−0.1°, the measuredchordwise pressure distributions generally show a favor-able pressure gradient back to at least the 55-percent-chord location on both surfaces of the airfoil. The accel-eration over the upper surface of the leading edge hasbeen reduced so that there is no large suction peak fol-lowed by an adverse pressure gradient. At this angle ofattack, the region aft of the 65-percent-chord location isproviding little, if any, lift. Flow on both surfaces decel-erates over the rear portion of the airfoil and appears tobe attached to at least the aftmost measurement station(the 90-percent-chord location).
At an angle of attack of 2.1°, a more rapid accelera-tion occurs around the leading edge of the upper surface,which is followed by a region with a small adverse pres-sure gradient. Again, the rear portion of the airfoil isproviding little lift. As the angle of attack increases to4.0°, a stronger suction peak develops and the boundarylayer on the upper surface is subjected to a much largeradverse pressure gradient than at the lower angles ofattack. The pressure coefficients on the upper surface atx/c = 0.90 begin to diverge from those on the lower sur-face at an angle of attack of about 4.0°, a result suggest-ing that a separated region is forming near the trailingedge. This is consistent with the break in the lift andpitching-moment curves at 4.0°.
At an angle of attack of 6.0°, signs of separationappear on the upper surface between the 80- and90-percent-chord locations because the pressure distribu-tion ahead of the trailing edge is flattened and less posi-tive (more negative). Separation probably begins at alower angle of attack, but the absence of pressure orificesaft of the 90-percent-chord position prevents its detec-tion. The upper surface pressure distributions indicatethat the suction on the midchord region of the upper sur-face decreases from the inboard to the outboard wingstations. At angles of attack of 8.0° and 10.0°, theleading-edge suction continues to increase and the

10
location of the start of the separated-flow region movesfarther forward. The leading-edge suction peak wasmaintained to the maximum angle tested.
The spanwise variations of the integrated section liftcoefficient associated with these chordwise pressure dis-tributions were computed, and the results are presentedin figure 18. As the angle of attack increased, the sectionlift coefficient increased across the wingspan. At theinboard station, the change in section lift coefficient withangle of attack (section lift-curve slope) was roughlyconstant. At the outer stations, the change in section liftcoefficient with angle of attack became smaller as theangle of attack increased, and during this increase, the lifton the outboard portion of the wing did not increase asmuch as the lift on the inboard portion. Thus, the centerof lift moved inboard as the angle of attack and liftincreased.
Effect of Spanwise Blowing on WingAerodynamic Characteristics
Each interchangeable wingtip section was tested onthe wing at a Mach number of 0.30 both without and withblowing from the forward jet, rear jet, and both jets (tip 8only). The angle of attack for each of these four condi-tions was varied from−2.0° to 11.0°. For the tips withthe short-chord jet exits (0.25 in. long), the maximum jetmomentum coefficient was limited by the assumptionthat the maximum jet-exit Mach number was 0.90. Forthe jet exits with a longer chord on tip 8, the maximumjet momentum coefficient was limited by the air supplysystem. In addition, tip 8 was tested at a constant angleof attack of 2.0° with varying jet momentum coeffi-cient. These additional tests were conducted at Machnumbers of 0.20, 0.30, 0.40, and 0.50 with blowing fromthe forward jet, rear jet, and both jets. By changing thewingtip, the effect of exhaust location and directioncould be investigated. (See fig. 9.) Results from the dif-ferent tips with and without blowing have been groupedto look at the effect of jet chordwise location, verticallocation, in-plane deflection, and out-of-plane deflection.Direct comparisons of results with the jet on and the jetoff will be used to determine the effects of blowing.
The effect of blowing at several chordwise locationson the wing lift and drag coefficients is presented in fig-ure 19. The five available chordwise locations are shownabove each figure with the location of the operating jetnoted by the darkened jet exit. Results show that no sig-nificant changes in the wing lift occur with the additionof blowing. The small changes in the drag coefficientswith the addition of blowing are all less than the mea-surement accuracy, and they do not show any consistenttrend with jet chordwise location.
The effect of blowing at two jet vertical locations onthe wing lift and drag coefficients is presented infigure 20. The available exit locations are shown in thesketches with the operating jet exit darkened. The addi-tion of blowing does not have a measurable effect on thewing lift. The results show a small possible decrease inthe drag coefficient with the jet displaced verticallyupward for jets located at approximately 0.3ctip. Thedecreases, which are smaller than the balance accuracyand data repeatability, should be considered only as apossible trend. This trend is consistent with publishedresults (ref. 2) for wings having a lower aspect ratio,which indicated that displacing the jet upward had alarger induced effect than having the jet on the wingtipcenterline.
The effect of redirecting the jet exhaust downward(out of the wing plane) on the wing lift and drag coeffi-cients is presented in figure 21. The components of thejet thrust in the lift and drag directions have beenremoved from the data. The jet-exit location is shown inthe sketches. The exhaust direction in theXZ-plane isindicated by the arrow with the jet deflection anglenoted. The undeflected jet results (δj = 0°) show nomeasurable effect of blowing. Results with the jetdeflected downward (δj = 20°) show a very small possi-ble increase in the lift coefficient and a decrease in thedrag coefficient. Because both of these changes aremuch smaller than the balance accuracy and datarepeatability, they should be considered only as a possi-ble trend. However, this trend is consistent with pub-lished results (ref. 2) which indicate that deflecting thejet downward has a larger induced effect than anundeflected jet on the wingtip centerline.
The effect of redirecting the jet blowing downstream(in the wing plane) on the wing lift and drag coefficientsis presented in figure 22. The components of the jetthrust in the lift and drag directions have been removedfrom the results. The available jet locations and exhaustdirections in theXZ-plane are presented in the sketcheswith the operating jet exit darkened. The undeflected jetresults (ψj = 0°) show no measurable effect of blowing.With the jet deflected rearward (ψj = 30°), blowing leadsto a very small increase in lift. Results also show a smalldecrease in drag coefficient for the front jet location anda small increase for the rear jet location. The magnitudesof the changes are about the same as the balance repeat-ability and measurement accuracy.
Maximum jet momentum coefficients for the short-chord jets were established by limiting the maximum jet-exit Mach number to 0.90. The effects of blowing on thewing lift and drag could be larger if the jet momentumcoefficient was increased. As noted previously, the jetmomentum coefficient was dependent on the jet-exit area

11
and velocity. Because increases in the jet-exit velocity tosupersonic values were not desirable, the jet-exit areawas increased by increasing the chordwise length of thefront and rear jets to define tip 8. The increased jet-exitarea increased the maximum momentum available fromeach jet. Results for the jets with a longer chord are pre-sented in figure 23. The addition of blowing produceddefinitive results, with reductions in the drag coefficientof about 0.0012 for the front jet and of about 0.0022 forthe rear jet. These drag reductions were larger than theaccuracy and repeatability of the balance drag measure-ment. Blowing from the long-chord jets had little effecton the lift measurements.
None of the results from the short-chord jets (0.25 in.long) yielded reductions in drag coefficient that werelarger than the balance accuracy and data repeatability.However, results from the long-chord jets (both 0.62 in.long and 1.50 in. long on tip 8) yielded significant dragreductions, thereby warranting additional analysis. Theeffect of blowing individually and simultaneously fromthe long-chord jets on the wing aerodynamic characteris-tics is presented in figure 24. Curve fits were applied tothe variation of lift coefficient with angle of attack withand without blowing (fig. 24(a)) to determine the lift-curve slopes. For the linear portion of the curve, the lift-curve slope increased from 0.103 per degree withoutblowing to 0.108 per degree with blowing from both jets.This increase was about the same as the accuracy of thedetermination of the slope over this small angle range.At angles of attack above the break in the lift curve, thelift coefficient with blowing was greater than the liftcoefficient without blowing. The jet exhaust probablyinhibited the local flow from wrapping around thewingtip, thus allowing a higher load to be carried nearthe tip.
The ratio of the wing-root bending-moment coeffi-cient to the lift coefficient with and without blowing(fig. 24(b)) was computed for the linear portion of thecurve to determine the spanwise center of lift. Withattached flow, the spanwise center of lift moved outboardfrom η = 0.42 without blowing toη = 0.43 with blowingfrom both jets. A similar movement in the center of liftwith blowing was noted at the higher angles of attackwhere the curves were nonlinear, a result indicating thatblowing increased the loading over the outer portion ofthe wing.
The increased lift outboard with blowing led to anegative increment in the pitching-moment coefficient(fig. 24(c)) because the tip region was aft of the momentreference center. For the range of lift coefficients associ-ated with attached flow, the slope of the pitching-moment curve changed from 0.005 without blowing to−0.015 with both jets blowing. The drag reduction with
blowing (fig. 24(d)) was about 0.0012 for the front jet,0.0022 for the rear jet, and 0.0025 for both jets operating.
When applied to an aircraft, a source for the high-pressure air for the blowing must be identified. If high-pressure air must be bled from the propulsion system, theram drag must be added to the wing drag. (The ram dragis equal to the product of the mass-flow rate of the jet andthe free-stream velocity.) After adjusting for this ramdrag penalty (as shown in fig. 24(e)), the differenceswith the jets operating are small and mixed. In fact, thedifferences are of about the same magnitude as the accu-racy of the drag measurement. Comparisons of thechordwise pressure distributions and spanwise lift distri-butions for these cases are not practical because of thesmall differences in the angle of attack for the blowing-off and blowing-on data points.
The decrease in drag and the possible small increasein lift due to spanwise blowing from the jets with alonger chord were large enough to warrant additionaltests at several Mach numbers in which the angle ofattack was fixed at 2.1° and the jet plenum pressure wasvaried to investigate the effect of jet momentum coeffi-cient. As noted previously, the maximum jet momentumwas limited by the air supply system for the jets on tip 8.As the Mach number and free-stream dynamic pressureincreased, the maximum available jet momentum coeffi-cient decreased, a result leading to very small jet momen-tum coefficients at Mach numbers of 0.40 and above.Variation of the wing lift and drag coefficients with jetmomentum coefficient is presented in figure 25 for sev-eral Mach numbers with the front jet, rear jet, and bothjets operating. At a Mach number of 0.20, lift increasedwith increasing jet momentum coefficient for all three jetoperating conditions. Drag decreased with increasing jetmomentum coefficient for blowing from the rear jetalone and for blowing from both jets operating simulta-neously, but it increased slightly for blowing from theforward jet alone. At Mach numbers of 0.30 and 0.40(figs. 25(b) and 25(c)), the lift coefficient increased andthe drag coefficient decreased with increasing jetmomentum coefficient for both the front and rear jetoperating conditions. The small change in jet momen-tum coefficient and scatter in the data made it difficult todetermine the effect of blowing on the lift or drag coeffi-cients at a Mach number of 0.50 (fig. 25(d)).
Spanwise variation of the section lift coefficients andchordwise pressure distributions provides additionalinformation about the flow field near the wingtip withblowing. The effect of blowing on the spanwise distribu-tion of the section lift coefficient is presented in figure 26for Mach numbers of 0.20, 0.30, 0.40, and 0.50 at a con-stant angle of attack of 2.1°. Without blowing, the sec-tion lift coefficient increases across the wing to the

12
70-percent-semispan location, and then it decreasestoward the tip. In general, blowing does not have a mea-surable effect on the lift at spanwise stations out toη = 0.70. Increasing the jet momentum coefficientincreases the section lift coefficient atη = 0.90 and, to alesser degree, atη = 0.80. Increases are largest at thelowest Mach number where the jet momentum coeffi-cient was the largest.
The section lift coefficient atη = 0.90 was cross-plotted against the jet momentum coefficient for eachMach number. The results, which are presented infigure 27, show that at all four Mach numbers, the sec-tion lift coefficient near the tip increases with jet momen-tum coefficient for all three blowing configurations. Atthe lower Mach numbers, the increase in section lift coef-ficient with blowing is larger for the front jet than for therear jet.
The effect of spanwise blowing on the chordwisepressure distribution is very small. Differences in thechordwise pressure distribution are difficult to discernwith the scales typically used for the plots. Therefore,the change in pressure coefficient due to blowing that is,(∆Cp = Cp (with blowing) − Cp (without blowing)) willbe used rather than the pressure coefficient itself. Datawere recorded at a constant angle of attack without blow-ing followed immediately by data with blowing. Thechange in the local pressure coefficient with blowing wascomputed atη = 0.90, and the results are presented infigure 28. In general, spanwise blowing increases thesuction on the upper surface (−∆Cp) and increases thepressure on the lower surface (+∆Cp). The magnitude ofthe change in the pressure coefficient is generally largerfor the higher jet momentum coefficient, a result suggest-ing a small increase in the local angle of attack due toblowing. The effect of blowing is usually larger on theupper surface than on the lower surface. Blowing fromthe front jet produces a larger change in the leading-edgesuction peak than blowing from the rear jet; also, theeffect of the front jet on the pressure coefficients is largerthan the effect of the rear jet. The front jet increases thesuction across most of the chord, and the rear jet tends tohave most of its effect on the aft portion of the chord.
As the Mach number and dynamic pressureincreased, the maximum available jet momentum coeffi-cient (Cµ) decreased, but the maximumCµ achievable ata Mach number of 0.72 was too small for practical exper-iments. A Navier-Stokes solver, modified to simulatespanwise blowing at the wingtip, was used to extend theexperimental results to a higher Mach number.
Navier-Stokes Calculations With SimulatedBlowing
Previous experimental investigations (refs. 2–4, 6,and 7) indicated that spanwise blowing from the wingtipmodifies the flow field near the wingtip and in the wake.Because the effects of viscosity are expected to beimportant, a Navier-Stokes simulation of the flow fieldis needed. Thus, an existing Navier-Stokes solver,TLNS3D, which has demonstrated the ability to simulatethe flow field about moderate aspect ratio wings realisti-cally at transonic Mach numbers, was selected for use inthe study. The computer code, described in references 14and 15, solves the unsteady Navier-Stokes equationsnumerically on a grid of control points until steady-stateconditions are obtained. A finite volume representationof the equations is written in discrete form in general,curvilinear coordinates. A thin-layer assumption is usedto simplify the equations because most of the viscous dif-fusion is normal to the wing surface. A body-fitted coor-dinate system was selected with the three coordinatedirections in approximately chordwise, normal, andspanwise directions. The solution is advanced to steadystate by using a modified, five-stage Runge-Kutta time-stepping scheme developed by Jameson, Schmidt, andTurkel in reference 16. Acceleration techniques, such aslocal time stepping and multigrid, are employed toimprove the numerical convergence. The system ofequations is closed with the addition of an eddy viscosityand eddy conductivity for the momentum and energyequations and the algebraic turbulence model of Baldwinand Lomax (ref. 17), a model that works well forattached or mildly separated flows.
A grid-convergence study was performed to deter-mine an acceptable grid for the Navier-Stokes calcula-tions. The Navier-Stokes solver was used to predict thewing aerodynamic characteristics without blowing atMach numbers of 0.30 and 0.72 to demonstrate that thegrid and code are suitable for calculations of the configu-ration used in this study over the desired Mach numberrange. The solver was also used to predict the effects ofblowing at a Mach number of 0.30 to calibrate the modi-fications used to simulate the wingtip jet. The calibratedsolver was then used to predict the effect of spanwiseblowing from the wingtip at a Mach number of 0.72. Asummary of the grid-convergence study, the calibrationof the solver without blowing at Mach numbers of 0.30and 0.72, and the calibration of the modifications to sim-ulate blowing are discussed in the appendix.
Calculations at a Mach number of 0.30 with correc-tions for the effect of the body were in good agreementwith results from the current experiment. (See the

13
appendix.) The computations showed that blowingincreases the suction over part of the upper surface andthe pressure over the lower surface of the wing near thetip. Blowing was also found to increase the section liftcoefficient near the wingtip and the total wing lift.Results from calculations presented in reference 9 indi-cated that the code also predicts particle paths near thewingtip and near the jet that are similar to those obtainedin a water tunnel. Calculations successfully predictedthat blowing displaces and diffuses the wingtip vortex.The only trend not predicted correctly by the Navier-Stokes solver with simulated blowing was the wing drag.Because the code predicts the results without blowing atMach numbers of 0.30 and 0.72 and with blowing at aMach number of 0.30, it can be used with reasonableconfidence to predict the effects (except for drag) ofspanwise blowing from the wingtip at a Mach numberof 0.72.
The Navier-Stokes solver was used to compute theflow field about the wing with tip 8 at a Mach number of0.72 at an angle of attack of 1.0°. The jet-exhaust veloc-ity was limited to a Mach number of 0.90. Thiseffectively determined the maximum jet momentumcoefficient for a fixed jet-exit area. Initial calculationswere performed without and with blowing from the frontjet, rear jet, and both jets at the maximum exit velocity.For these initial cases, the jet exhausted in the spanwisedirection. Additional computations for both jets operat-ing were performed at the maximum jet-exit velocitywith the jets deflected downward 30°.
The effect of blowing from the front jet on the chord-wise pressure distributions is presented in figure 29(a)for two spanwise stations:η = 0.90 and η = 0.98.Because of the larger free-stream dynamic pressure forthe higher Mach number, the jet momentum coefficientis only 0.0012. Atη = 0.90, the effects of blowing arevery small, but close to the tip (η = 0.98), blowingreduces the suction on the upper and lower surfacesat stations ahead of the jet (x/c < 0.23). Suction increaseson both surfaces across the length of the jet (0.23 <x/c< 0.38), and higher suction pressures are maintained aftof the jet on the upper and lower surfaces.
The effect of blowing from the rear jet on the chord-wise pressures is presented in figure 29(b) at the samespanwise stations. Atη = 0.90, the effects are smallexcept for the reduced pressure recovery near the trailingedge, but close to the tip atη = 0.98, blowing induceslarger changes in the pressure distribution. The changesdue to blowing from the rear jet are similar in characterto those found for the front jet. Suction is reduced aheadof the jet (x/c < 0.51), but along the length of the jet, thesuction increases until the pressure recovery begins.
With blowing, the pressure recovery near the trailingedge is less than that found without blowing.
The effect of blowing from both jets on the chord-wise pressure distributions is presented in figure 29(c).At η = 0.90, the change in the pressure distribution withboth jets has the same character found for the front andrear jets alone, but with a slightly larger magnitude. Nearthe tip atη = 0.98, effects from both jets can be seen. Onthe forward portion of the chord, blowing from the frontjet reduces the suction on the upper and lower surfaces,and the suction level increases across the front jet. Onthe rear portion of the chord, blowing leads to a largerincrease in suction and a smaller pressure recovery thanthat found for the rear jet alone.
The particle paths on the upper surface with andwithout blowing are presented in figure 30. The darkershading on the wing surface marks the concave portionof the upper surface where the pressure increases. Todetermine a particle path, a particle is released at a gridpoint just above the surface grid. The position of the par-ticle is determined at 2000 time steps by integrating thelocal velocity at the particle location. Short particlepaths are an indication of regions of low velocity. With-out blowing, particle paths starting from the leading-edgeregion on the upper surface, shown in figure 30(a), moveinboard as they are convected downstream until the rapidcompression is reached where they then move outboard.Particles released along the tip move inboard along theforward portion of the chord, and the flow generallymoves outboard along the compression region on the aftportion of the tip. Particle paths with blowing from thefront jet are presented in figure 30(b) in which the parti-cles starting from the jet exit are noted by the dashedlines. Because the jet momentum is relatively smallcompared with the momentum of the flow around the tip,the flow from the jet swirls around the tip instead of pen-etrating into the free stream. The jet flow blocks the flowaround the tip and over the upper surface and thus createsa region of low-energy flow, as indicated by the short orabsent particle paths. Blowing has only a small effect onthe particle paths starting from the leading edge. Withblowing from the rear jet, shown in figure 30(c), the jetflow from the downstream part of the jet penetrates far-ther into the free stream because of the blockage createdby the lengthened upstream part of the jet. The particlepaths along the forward portion of the tip are initially dis-placed inboard and are carried up and over the jetexhaust. Particle paths with blowing from both jets arepresented in figure 30(d). These results appear to be sim-ilar to a combination of the results found for the individ-ual jet-blowing results. Again, a region of low-energyflow is caused by the jet exhaust blocking the free-streamflow.
14
The spanwise variations of the section lift coefficientwithout and with blowing from the front jet, rear jet, andboth jets are presented in figure 31. The small momen-tum from the front jet leads to little change in the span-wise variation of the section lift coefficients. For the rearjet, blowing increases the load over the outboard portionof the wing. Results for both jets are practically the sameas results for the rear jet alone.
Changes in the section lift coefficient atη = 0.90 andin the wing lift and drag coefficients with blowing, pre-sented in figure 32, are small. For the front jet, blowingincreased the wing drag coefficient but had little effecton the section lift coefficient or the total wing lift coeffi-cient. For the rear jet, blowing increased the section liftcoefficient atη = 0.90 by about 4 percent (from 0.236to 0.245) and the wing lift coefficient by less than 1 per-cent (from 0.256 to 0.258). The drag increased becauseof the increased suction on the rear-facing surface on theaft portion of the chord. Results for both jets wereslightly larger than those for the rear jet alone.
The jet exhausting in the plane of the wing tends toswirl around the wingtip, thereby reducing its effective-ness as a fluid end plate. One possible technique to pre-vent the jet flow from swirling around the tip is to deflectthe jet downward to oppose the local momentum. Forthese calculations, the jet-exit Mach number is main-tained at 0.90 and the jet direction is deflected downward30°. Chordwise pressure distributions near the tip arepresented in figure 33 for the undeflected and deflectedjets. Deflecting both the front and rear jets downward30° increases the suction on the upper surface, increasesthe pressure on the lower surface, and increases thetrailing-edge pressure coefficient relative to the un-deflected configuration. Particle paths for the deflectedjets, shown in figure 34, indicate that the front jet doesnot swirl around the tip as much with the deflected jet asit does for the undeflected jet, although the low-energyflow region is still present. Particle paths from the tip arenot displaced as far inboard as with the undeflected jet.The spanwise variation of the section lift coefficients,shown in figure 35, shows an increase in the loading nearthe tip, which was expected from the pressure distribu-tions. Deflecting the jets downward increases the winglift coefficient from 0.262 to 0.264 and reduces the wingdrag coefficient slightly.
At high subsonic Mach numbers, blowing slightlyincreases the loading near the tip and wing lift and alsoincreases the drag. Blowing leads to a separated regionnear the tip. For the hypothetical transport aircraftdescribed in the “Introduction,” the total engine thrustcoefficient is about 0.0400. The maximumCµ investi-gated with both jets operating represents about 10 per-cent of the total engine thrust, but the small increase in
the wing lift coefficient of about 1 percent does not jus-tify the 10-percent increase in momentum. Thus, for thistype of configuration at a high subsonic Mach number,spanwise blowing from the wingtip is not a practical wayof increasing lift or reducing drag.
Concluding Remarks
The experiments at low Mach numbers showed thatthe addition of blowing had little measurable effect ondrag for the jets with the short-chord exits for a jet-exitMach number of 0.90. The jets with a longer chordshowed drag reductions ranging from 0.0012 for thefront jet to 0.0022 for the rear jet. Blowing from the jetswith a longer chord increased the lift-curve slope andmoved the center of lift outboard.
Tests of the jets with a longer chord indicated thatfor moderate lift coefficients and Mach numbers rangingfrom 0.20 to 0.40, wing lift increased and drag decreasedwith blowing. However, after accounting for the ramdrag penalty, little, if any, total drag reduction occurredwith blowing. Blowing increased the section lift coeffi-cient at the 90-percent-semispan location with a verysmall change at the 80-percent-semispan location. Theincrease in the section lift coefficient was greatest for thelargest blowing coefficient. Spanwise blowing increasedthe suction on the upper surface and the positive pressureon the lower surface.
Calculations using the Navier-Stokes solver withmodified boundary conditions to simulate blowing fromthe wingtip were consistent with almost all experimentalresults at low Mach numbers. Calculations at a Machnumber of 0.72 showed that blowing increased the load-ing near the wingtip and increased the wing lift and drag.Deflecting the jet downward increased the suction on theupper surface and the pressures on the lower surface. Jetdeflection reduced the region of the jet swirling aroundthe upper surface, a result yielding an increase in lift withno additional increase in drag over that of the undeflectedjet.
Because the momentum of the jet was typicallygreater than the reduction in the wing drag and becausethe increase in the wing lift due to spanwise blowing wassmall, spanwise blowing at the wingtip did not appear tobe a practical means of improving the aerodynamic effi-ciency of moderate-aspect-ratio wings at high subsonicMach numbers.
NASA Langley Research CenterHampton, VA 23681-0001March 8, 1995
15
Appendix
Verification of Navier-Stokes Solver WithSimulated Wingtip Blowing
Details of Navier-Stokes Solver
Results from previous experimental investigationsindicated that spanwise blowing from the wingtip modi-fies the flow field near the wingtip and in the wake.Because the effects of viscosity are expected to be impor-tant, a Navier-Stokes simulation of the flow field isneeded. An existing Navier-Stokes solver computercode, TLNS3D, which has demonstrated the ability tosimulate the flow field about moderate-aspect-ratiowings at transonic Mach numbers, was selected for use inthe study. This computer code, described inreferences 14 and 15, solves the unsteady Navier-Stokesequations numerically on a grid of control points untilsteady-state conditions are obtained. A finite-volumerepresentation of the equations is written in discrete formin general, curvilinear coordinates. A thin-layerassumption is used to simplify the equations becausemost of the viscous diffusion is normal to the wing sur-face. A body-fitted coordinate system was selected withthe three coordinate directions in approximately chord-wise, normal, and spanwise directions. The solution isadvanced to steady state by using a modified, five-stageRunge-Kutta time-stepping scheme developed byJameson, Schmidt, and Turkel in reference 16. Acceler-ation techniques, such as local time stepping and multi-grid, are employed to improve the numericalconvergence.
The system of equations is closed with the additionof an eddy viscosity and an eddy conductivity for themomentum and energy equations and the algebraic tur-bulence model of Baldwin and Lomax (ref. 17). This tur-bulence model works well for attached flows but is notrecommended for separated flows.
Five flow variables must be specified on all bound-aries in the computational domain. All computations areperformed at the cell centers. Values for cells at the far-field boundary are based on the Riemann invariants forone-dimensional flow normal to the boundary, as out-lined by Thomas and Salas in reference 18. Symmetry isimposed on all variables at the plane of symmetry exceptfor the spanwise component of momentum which is anti-symmetric. At the downstream boundary, a zero-orderextrapolation is used to determine the values of the vari-ables. On the wing surface, no-slip and no-injection con-ditions are imposed everywhere except at the jet exitwhere the three components of momentum are specified.Zero normal pressure and density gradients are assumedon the wing surface.
Grid Generation
The grid topology must be able to capture the rapidlychanging features in the flow field near the wing surface,wingtip, and across the trailing wake. For the streamwisedirection, a “C”-type grid was selected to resolve the vis-cous effects near the surface and across the downstreamwake. For the spanwise direction, an “O”-type grid wasselected to capture the features near the wingtip becausea previous study on a similar planform wing (ref. 19)indicated that an “H”-type grid with a similar number ofspanwise grid points would not resolve the features of theflow as well as an “O”-type grid. Grid points are clus-tered near the leading and trailing edges of the wing, nearthe wing surface, and near the wingtip to resolve betterthe gradients at those locations. The downstream bound-ary was chosen to be 5 semispans (10 root chords) down-stream of the wing-root leading edge. Outer boundariesfor the computational space were located five semispansupstream of the wing-root leading edge and five semi-spans from the plane of symmetry. The grid modeledonly the exposed part of the wing from the current exper-iment, and the body was not included in the grid.
Grid-Convergence Study
The number of cells in each coordinate directionshould be sufficiently large such that increasing the num-ber of cells in any of the three grid coordinate directionsdoes not have a significant effect on the wing lift, drag,or pressure distributions. A systematic study of theeffect of varying the number of cells in each direction hasbeen conducted to determine the number of cells to beused for the final Navier-Stokes calculations with span-wise blowing. The grid-convergence study was madewithout any simulated blowing from the wingtip, withdetails provided in reference 9. As the number of cells ina given direction was increased, the spacing of the cellswas decreased proportionately. Far-field and down-stream boundaries remained the same for all grids. TheNavier-Stokes solver was run on each grid at a Machnumber of 0.311 and an angle of attack of 3.03° until theresidual error was reduced by at least four orders of mag-nitude. Convergence histories for the residual error inthe continuity equation, the lift coefficient, and the dragcoefficient for one of the grids used in the study are pre-sented in figure A1. The results show that the lift anddrag coefficients have converged to a steady value whenthe residual error has been reduced four orders of magni-tude. For the grid-convergence study, the number ofchordwise cells (Nc) was varied from 96 to 256, the num-ber of spanwise cells (Ns) was varied from 32 to 48, andthe number of normal cells (Nn) was varied from 32to 64, as shown by the results in figure A2. The size ofthe final grid was determined to be the minimum numberof cells that yielded differences in lift coefficient less

16
than 0.001 and differences in drag coefficient less than0.0003 if the number of cells was increased.
The final grid had 192 chordwise cells, 40 spanwisecells, and 64 normal cells. Sketches of the final wing-surface grid and of the final volume grid are presented infigures A3 and A4, respectively. Note that some gridlines have been omitted for clarity. Eight spanwise cellswere used to define the upper and lower halves of therounded-tip cap. The chordwise spacing of the gridpoints was 0.002 of the local chord (c) at the leadingedge and 0.006c at the trailing edge. The spanwise spac-ing of the grid points was 0.059η at the root and 0.003ηat the inboard edge of the rounded tip. The normal spac-ing of the grid points increased from about 0.25× 10⁻⁶cat the leading edge to 0.50× 10⁻⁶c at the trailing edge.This spacing produced values of the normal spacingparametery+ that ranged from about 0.7 to 1.7 at the rootand from about 0.3 to 1.0 at the tip.
Calibration of Navier-Stokes Solver
The Navier-Stokes code solves the equations on asingle-block structured grid. The experimental setup uti-lizes a wing-body combination, and the presence of thebody modifies the local flow field about the wing. Thewing balance measures the forces and moments on thewing that include induced effects from the body. A com-parison of experimental data from the wing-body combi-nation with results from the Navier-Stokes solution forthe wing alone would not be valid. To do so, the effectsof the body on the wing flow field must be included inthe calculations.
In effect, the body blocks the approaching flow andthis leads to a local increase in the velocity in the planeof the wing. The body also acts as a low-aspect-ratiolifting surface that induces an upwash in the plane of thewing. Both effects are largest near the body and decreaserapidly with increasing distance from the body. Theeffects of the body on the local flow field were computedby using the panel method code, VSAERO, described inreference 19. The body alone with a fixed wake was rep-resented by using 880 panels. The program providedthree components of velocity at user-defined points in theflow field. Induced vertical and streamwise componentsof velocity along the quarter-chord line of the wing wereused to predict the change in streamwise velocity (andMach number) and angle of attack induced by the body atfree-stream Mach numbers of 0.30, 0.50, and 0.70 andangles of attack of 0°, 1.0°, 2.0°, and 4.0°. A variation ofthe induced angle of attack (αi) is strongly dependent onthe body angle of attack and is only weakly dependent onthe free-stream Mach number. The results at a Machnumber of 0.30 are presented in figure A5(a). Theresults at the other two Mach numbers are similar. The
correction factor for the normalized streamwise velocity(Vx/V∞) (and Mach number), which was largest near theroot and decreased toward the wingtip, was stronglydependent on the free-stream Mach number and onlyweakly dependent on the body angle of attack. Theresults at an angle of attack of 0° are presented in figureA5(b). The results at the other angles of attack aresimilar.
Induced upwash from the body (αi) is equivalent to atwist across the wing. The upwash angle distributionwas used to define the wing twist at five equally spacedstations across the wing:η = 0, 0.25, 0.50, 0.75,and 1.00. The root twist angle increased from 0° to 2.99°as the body angle of attack increased from 0° to 4.0°.(See ref. 9 for additional details.) This wing twist wasincorporated into the wing-surface grid definition. Aseparate wing-surface grid was defined and used to cre-ate a different volume grid for each of the nominal anglesof attack used in the numerical study (0°, 1.0°, 2.0°,and 4.0°).
Induced streamwise flow from the body was equiva-lent to a spanwise change in the free-stream Mach num-ber. To simplify the calculations, an average change inthe free-stream Mach number was used as an approxima-tion. Because most of the change occurred near the wingroot and the change was fairly constant on the outer por-tion of the wing, the use of an average approximationwas reasonable. The free-stream Mach number for theNavier-Stokes calculations was increased by the changein the local Mach number at the 42-percent-semispanposition because the spanwise center of lift was locatedthere. The increase in the Mach number was 2.3 percentat a Mach number of 0.30 and was 3.1 percent at a Machnumber of 0.72. The Navier-Stokes calculations weretherefore performed on the grid having the appropriatewing twist for the desired angle of attack at the adjustedfree-stream Mach number. Calculated pressure coeffi-cients were corrected for the changes in free-stream staticpressure and dynamic pressure due to the change in free-stream Mach number. Section lift and drag coefficientswere rotated back into the untwisted wing axis systemand corrected for the change in the free-stream dynamicpressure. Corrected section properties were integratedacross the span to obtain the corrected wing lift and dragcoefficients.
Comparisons of the experimental chordwise pressuredistributions with those from the Navier-Stokes solvercode with and without the corrections for the presence ofthe body are shown in figure A6 at a Mach number of0.305 and an angle of attack of 4.03°. Without the cor-rection, the calculated results do not agree with theexperimental results, especially on the upper surface.With the correction, the agreement becomes much better,

17
especially the suction peak at the wing leading edge andthe upper surface pressures. Correcting the calculatedresults at a Mach number of 0.719 brought about similarimprovements in the agreement of the chordwise pres-sure distributions from the experiment. All calculatedresults, unless explicitly noted otherwise, include the cor-rections for the presence of the body.
Computed results having the corrections for the bodyare compared with experimental results at Mach numbersof 0.306 and 0.719 to determine the ability of the code topredict the aerodynamic characteristics without blow-ing. Comparisons of computed and experimental resultsfor several spanwise stations at a Mach number of 0.306and an angle of attack of 2.07° are presented infigure A7. In general, the agreement is very good,although some scatter occurs in the experimental results.The code generally underpredicts the upper surface suc-tion at all spanwise stations and the peak leading-edgesuction at the outboard stations. Even though the codeadequately predicts the magnitude and location of thecompression on the aft portion of the upper surface, ittends to overpredict the compression on the lower sur-face, the difference being largest at the inboard stations.
The effect of angle of attack on the comparison ofexperimental and computed chordwise pressure distribu-tions at the 50-percent-spanwise location is presented infigure A8. Again, the computed results are in very goodagreement with the experimental results. The leading-edge suction peak and the pressures on both surfacesback to the compression agree very well, and the agree-ment improves with increasing angle of attack. Theexperimental scatter is reduced at the higher angles ofattack because the ratio of electrical signal to noise of thepressure transducer increases as the pressure levelincreases with angle of attack. The overshoot in therapid-compression region on the lower surface appearsfor all three angles of attack. The computed results showvirtually no trailing-edge separation at angles of attackup to 4.0°, which is consistent with experimental results.
Spanwise lift distributions for these three angles ofattack (α ≈ 0°, 2.0°, and 4.0°) were computed from thechordwise pressure distributions, and the results are pre-sented in figure A9. Agreement is good at the two lowerangles of attack, but at the larger angle of attack, theagreement is only fair. A comparison of the computedand experimental lift and drag coefficients without blow-ing is presented in figure A10. In general, the lift-curveslopes are in very good agreement, but the computed liftis slightly less than the experimental value at a givenangle of attack. The difference between the values of thecomputed and experimental lift coefficient ranges from0.006 to 0.016. The experimental accuracy of the lift-coefficient measurement is 0.016. The uncertainty in the
calculated lift-coefficient from the grid-convergencestudy is less than 0.001. Even though the computed dragis greater than the experimental drag, it follows the trendof the experiment well, with the difference between thecomputed and experimental drag coefficients rangingfrom 0.0004 to 0.0008. The experimental accuracy ofthe drag coefficient is about 0.0012, and the uncertaintyin the calculated drag coefficient from the grid-convergence study is less than 0.0003. The differencesin the lift and drag are less than the experimental accu-racy. Thus, at a Mach number of 0.306, the Navier-Stokes solver with the corrections for the presence of thebody adequately predicts the pressure distributionseverywhere except on a small portion of the lower sur-face, and the solver reasonably predicts the total wing liftand drag.
Computed results with corrections for the presenceof the body were also compared with experimentalresults at a Mach number of 0.721 at which supercriticalflow occurs over the wing. Chordwise pressure distribu-tions without blowing atα = 0.95° (the highest angle ofattack tested) are compared at several spanwise stationsin figure A11. At the inboard station, (η = 0.25), thecode tends to overpredict the suction on the central por-tion of the airfoil (fig. A11(a)). Because the difference isnot apparent at the other spanwise stations, a likely causeof the overprediction is interference from the body that isnot included in the simple global Mach number correc-tion. Because the tip region is most important in thisstudy, this minor difference at the inboard station isacceptable. At all spanwise stations, the code predictsthe upper surface compression region very well, and thelower surface is in very good agreement with only aslight overshoot at the end of the rapid compression.Because the code will be used to predict the changes dueto blowing, small differences that do exist should haveminimal impact on the incremental values.
The effect of angle of attack on the comparison ofthe chordwise pressure distributions at = 0.721 ispresented in figure A12 for the 50-percent-spanwiselocation. At the lower angle of attack, (−0.09°) only asmall region of supersonic flow occurs on the upper sur-face. However, at an angle of attack of 0.95°, super-sonic flow extends from about 10 to 60 percent chord.Computed results with the correction for the body are invery good agreement with the experimental results,although the computations slightly overpredict the suc-tion on the upper surface. The code with the correctionadequately predicts the location of the compressionregion on both surfaces and the magnitude of the pres-sure rise. The results on the lower surface are in excel-lent agreement. Also, the code with the correctionadequately predicts the results for conditions that resultin regions with supercritical flow.
M∞

18
Computed and experimental spanwise lift distribu-tions for angles of attack of−0.09° and 0.95° are com-pared in figure A13. As noted previously, the codeoverpredicts the suction on the upper surface atη = 0.25,which leads to an overprediction of the section lift coeffi-cient at that location. The agreement fromη = 0.70 toη = 0.90 is very good. Because blowing from the wingtipis not expected to have a measurable effect on theinboard portion of the wing, the differences between thecalculations and the experiment are acceptable for thisstudy.
A comparison of the wing lift and drag coefficientswithout blowing is presented in figure A14, and the cal-culations match the experimental results reasonably well.The quoted balance accuracy at a nominal Mach numberof 0.721 is 0.004 for the lift coefficient and 0.0003 forthe drag coefficient. The computed lift differs from themeasured lift by 0.005, and the computed drag differsfrom the measured drag by about 0.0005.
From these results without wingtip blowing, theNavier-Stokes solver with corrections for the inducedeffect of the body satisfactorily predicts the wing lift anddrag, the spanwise lift distributions, and the chordwisepressure distributions. The solver can be used to predictthe aerodynamic characteristics at Mach numbers up to0.72 at an angle of attack of about 1°.
Verification of Boundary Conditions Used ToSimulate Blowing From Wingtip
Modifications to the Navier-Stokes solver to simu-late spanwise blowing from the wingtip are verified bycomparing calculated results with simulated blowingwith experimental results at the same value ofCµ.Because the Navier-Stokes solver uses a finite-volumeformulation of the equations, calculations are performedat the center of a cell defined by eight of the structuredgrid points. Boundary conditions on the wing surface areimplemented by defining a “ghost cell” inside the wingsurface that mirrors the cell with one face on the wingsurface. The boundary condition at the surface for eachcomputational variable is determined from the values ofthat parameter in the surface cell and in the ghost cell.
The most significant modification to the codeinvolved changes in the boundary conditions used to sim-ulate the jet flow. The jet is characterized by the threecomponents of momentum, density, and pressure. Thejet-exit static pressure is equal to the local static pressurefor a fully expanded jet. To model the jet characteristics,the three components of momentum were specified at thejet exit (wing surface). The density and pressure of thejet were specified at the center of the ghost cell.
The boundary conditions for selected cells weremodified to simulate spanwise blowing from the jets oftip 8. Boundaries of cells with blowing did not match theexperimental jet boundaries exactly because of the tech-nique used to define the surface grid. The roundedwingtip was formed by spacing grid points at equal angu-lar increments. Such spacing led to cells with changingheights so that the cell boundaries were not aligned withlines of constant height. Cells with boundary conditionsmodified for blowing were selected by overlaying theoutlines of the front and rear jet exits on the sketch of therounded tip, as shown in figure A15. The cells withmore than half the face area within the jet exit, which areidentified by the shading, had the boundary conditionsmodified for jet blowing.
The grid in the vicinity of the wingtip must be fineenough to capture the rapidly changing flow field nearthe path of the jet exhaust. By using the final grid fromthe grid-convergence study as a baseline, the number ofcells around each half of the wingtip cap (Nt) wasincreased to determine its effect on the wing aero-dynamic characteristics. The results without and withblowing from the front jet are presented in figure A16.Without blowing, increasing the number of cells aroundthe wingtip above the baseline value (Nt = 8) had a negli-gible effect on the wing lift and drag coefficients. Withblowing from the front jet, increasing the number of cellsfrom 12 to 16 around each half of the wingtip increasedthe wing lift coefficient by 0.001 and had a negligibleeffect on the wing drag coefficient. The tolerance levelused to select the final grid for the wing grid-convergence study was a change in the wing lift coeffi-cient less than 0.001 and a change in the wing dragcoefficient less than 0.0003. The results from the gridwith 16 cells around each half of the wingtip satisfiedthese criteria. The grid used to study the effects of blow-ing had 16 cells around each half of the wingtip, for atotal of 48 spanwise cells.
Four cells were typically used over the height of thejet exit (see fig. A15), which allowed three levels ofmultigrid to be used in the calculations. The jet area forthe computations was larger than the jet area used for theexperiments. The ratio of the front jet-exit area to thewing area was 2.8× 10⁻⁴ for the experiment and3.8× 10−4 for the computations. For the rear jet, theratios were 6.7× 10⁻⁴ for the experiment and 8.9× 10⁻⁴
for the computations. Modifications to the boundaryconditions to simulate blowing were verified by compar-ing experimental results with calculated results at thesame value ofCµ. The comparisons included the changein the chordwise pressure distribution, the section liftcoefficient, and the wing lift and drag coefficients.

19
The Navier-Stokes solver was used to computethe flow field without tip blowing (Cµ = 0) and withblowing from one jet (Cµ = 0.0066) at a Mach numberof 0.307 and an angle of attack of 2.07°. The changein the chordwise pressure distributions (∆Cp = Cp (withblowing) − Cp (without blowing)) atη = 0.90 with blow-ing from the front and from the rear jet is presented infigure A17. Blowing has only a small effect on the pres-sure coefficients. For the front jet, the calculated andexperimental results show similar trends with an increasein suction (−∆Cp) on the upper surface and an increase inpressure (+∆Cp) on the lower surface. However, the cal-culations overpredict the suction on the upper surface,and they also predict an increased leading-edge suctionpeak that was not seen in the experimental results. Theorifice spacing near the leading edge may have been toolarge to resolve this effect. The comparisons are similarfor the rear jet. Both the calculated and experimentalresults show an increase in suction on the upper surface,especially along the rear half of the chord. Both resultsshow an increase in pressure on the lower surface. Thecalculations again overpredict the change in the pressuredistribution and predict a small increase in the leading-edge suction peak. The calculated region with the largestincrease in suction on the upper surface is closer to thetrailing edge for the rear jet. These small differencesover the front and rear portions of the chord lead to errorsin the prediction of the pressure component of the drag.
Changes in the chordwise pressure distributions willbe reflected in the spanwise lift distributions. Blowinghas been shown to increase the loading near the wingtip(e.g., see refs. 2–4), but the effect becomes smaller as thedistance from the tip increases. A comparison of the cal-culated and experimental spanwise variations of the sec-tion lift coefficient with and without blowing is presentedin figure A18. For either jet location, both the calculatedand experimental results show an increase in the lift nearthe wingtip that decreases with increasing distance fromthe wingtip. The calculations indicated that the measur-able influence of the jet blowing extends farther inboardthan was found in the experiment. However, the mea-sured and calculated results are still in reasonable agree-ment. The changes in the chordwise pressuredistributions and in the spanwise variation of the sectionlift coefficient indicate that the calculations are in agree-ment with the experiments at the one value ofCµpresented. Comparisons of calculated and experimentalresults over a range ofCµ are needed to gain the neces-sary confidence in the modified Navier-Stokes solver topredict the effect of blowing at conditions outside theexperimental test envelope.
A comparison of the change in the computed andexperimental section lift coefficients at the 90-percent-
semispan location with jet momentum coefficient is pre-sented in figure A19. The section lift coefficient at thatspanwise station increases with increasing jet momentumcoefficient. For either jet, computations show the propertrend but the predicted increase in the section lift coeffi-cient is too large. In general, the calculated results arebetter for the front jet than for the rear jet. Small differ-ences noted in the change in the chordwise pressure dis-tributions lead to these moderate differences in thesection lift coefficients. Additional experimental dataare needed closer to the wingtip to determine better howwell the code predicts the effects of blowing on the sur-face pressure distribution.
Computed changes in the wing lift and drag coeffi-cients are compared with the experimental results in fig-ure A20. For the front jet, the calculations show theincrease in the wing lift coefficient with increasing jetmomentum coefficient. The experimental results indi-cated a small decrease in the wing drag coefficient withincreasing jet momentum coefficient, but the calculationsshowed a very small increase. For the rear jet, changesin the computed and experimental lift coefficients are ingood agreement. However, the computed drag increaseswith increasing jet momentum coefficient, which isopposite the effect found in the experiment. Althoughthe drag trend for either jet location is the opposite of thatfound in the experiments, the differences are small, onthe order of the accuracy of the drag computations. Theincrease in computed drag is due to the increase in suc-tion on the aft part of the airfoil. Drag calculations aredivided into viscous and pressure components. Althoughnot shown, calculations indicate that the viscous drag isthe same with or without blowing. Pressure dragincreases with blowing, and because the surface has anaft-facing component, increased suction leads toincreased drag.
Surface pressure coefficients, spanwise lift distribu-tions, and the wing lift and drag coefficients predicted bythe Navier-Stokes solver with corrections for the pres-ence of the body are in good agreement with the experi-mental results at Mach numbers of 0.30 and 0.72 with nowingtip blowing. Also, the changes with blowing for thechordwise pressure distribution, section lift coefficientnear the tip, and wing lift coefficient were predicted rea-sonably well by the modified Navier-Stokes solver withthe body corrections. The modified solver can be usedwith reasonable confidence at a Mach number of 0.72 topredict the effects of blowing on the surface pressure dis-tribution and wing lift. However, the calculation of thechange in wing drag coefficient with blowing isquestionable.

20
References
1. Zimmer, H.:Aerodynamic Optimization of Wings at SubsonicSpeeds and the Influence of Wingtip Design. NASATM-88534, 1983.
2. Tavella, D. A.; Wood, N. J.; Lee, C. S.; and Roberts, L.:TwoBlowing Concepts for Roll and Lateral Control of Aircraft.NASA CR-180478, 1986.
3. Ayers, R. F.; and Wilde, M. R.:Aerodynamic Characteristicsof a Swept Wing With Spanwise Blowing. College of Aeronau-tics, Cranfield, Note 57, Sept. 1956.
4. Smith, V. J.; and Simpson, G. J.:A Preliminary Investigationof the Effect of a Thin High Velocity Tip Jet on a Low AspectRatio Wing. Note ARL/A.163, Australia Dep. of Supply,June 1957.
5. Lloyd, Adrian:The Effect of Spanwise Blowing on the Aero-dynamic Characteristics of a Low Aspect Ratio Wing. vonKarman Institute for Fluid Dynamics Project Report 1963–90,1963.
6. Wu, J. M.; Vakili, A.; and Chen, Z. L.: Wing-Tip JetsAerodynamic Performance.ICAS Proceedings, 1982—13thCongress of the International Council of the AeronauticalSciences/AIAA Aircraft Systems and Technology Conference,Volume 2, B. Laschka and R. Staufenbiel, eds., Aug. 1982,pp. 1115–1121. (Available as ICAS-82-5.6.3.)
7. Wu, J. M.; Vakili, A. D.; and Gilliam, F. T.: AerodynamicInteractions of Wingtip Flow With Discrete Wingtip Jets.AIAA-84-2206, Aug. 1984.
8. Wu, J. M.; Vakili, A.; Chen, Z. L.; and Gilliam, F. T.: Investi-gation on the Effects of Discrete Wingtip Jets. AIAA-83-0546,Jan. 1983.
9. Mineck, Raymond Edward:Assessment of Potential Aero-dynamic Benefits From Spanwise Blowing at the Wing Tip.NASA TM-107847, 1992.
10. Fox, Charles H., Jr.; and Huffman, Jarrett K.:Calibration andTest Capabilities of the Langley 7- by 10-Foot High SpeedTunnel. NASA TM X-74027, 1977.
11. Sewall, William G.; McGhee, Robert J.; Viken, Jeffery K.;Waggoner, Edgar G.; Walker, Betty S.; and Millard, Betty F.:Wind Tunnel Results for a High-Speed, Natural Laminar-FlowAirfoil Designed for General Aviation Aircraft. NASATM-87602, 1985.
12. Braslow, Albert L.; and Knox, Eugene C.:Simplified Methodfor Determination of Critical Height of Distributed RoughnessParticles for Boundary-Layer Transition at Mach NumbersFrom 0 to 5. NACA TN 4363, 1958.
13. Gillis, Clarence L.; Polhamus, Edward C.; and Gray, JosephL., Jr.: Charts for Determining Jet-Boundary Corrections forComplete Models in 7- by 10-Foot Closed Rectangular WindTunnels. NACA WR L-123, 1945. (Formerly NACA ARRL5G31.)
14. Vatsa, V. N.: Accurate Numerical Solutions for Transonic Vis-cous Flow Over Finite Wings.J. Aircr., vol. 24, no. 6,June 1987, pp. 377–385.
15. Vatsa, Veer N.; and Wedan, Bruce W.: Development of an Effi-cient Multigrid Code for 3-D Navier-Stokes Equations. AIAA-89-1791, June 1989.
16. Jameson, A.; Schmidt, Wolfgang; and Turkel, Eli: NumericalSolution of the Euler Equations by Finite Volume MethodsUsing Runge Kutta Time Stepping Schemes. AIAA-81-1259,June 1981.
17. Baldwin, Barrett; and Lomax, Harvard: Thin-Layer Approxi-mation and Algebraic Model for Separated Turbulent Flows.AIAA-78-257, Jan. 1978.
18. Thomas, J. L.; and Salas, M. D.: Far-Field Boundary Condi-tions for Transonic Lifting Solutions to the Euler Equations.AIAA-85-0020, Jan. 1985.
19. Maskew, Brian: Prediction of Subsonic Aerodynamic Charac-teristics: A Case for Low-Order Panel Methods.J. Aircr.,vol. 19, no. 2, Feb. 1982, pp. 157–163.

21
Table 1. Coordinates of NASA HSNLF(1)-0213 Airfoil
z/c z/cx/c Upper Lower x/c Upper Lower
0.00000 0.00000 0.00000 0.30000 0.07223−0.05327.00025 .00301 −.00160 .35000 .07375 −.05610.00050 .00428 −.00230 .40000 .07400 −.05817.00075 .00526 −.00286 .45000 .07301 −.05947.00100 .00609 −.00335 .50000 .07069 −.05998.00150 .00747 −.00419 .55000 .06678 −.05980.00200 .00863 −.00492 .60000 .06078 −.05857.00250 .00964 −.00556 .65000 .05219 −.05594.00500 .01351 −.00796 .70000 .04132 −.05093.01000 .01867 −.01120 .75000 .02954 −.04106.02000 .02524 −.01551 .80000 .01829 −.03313.04000 .03400 −.02155 .85000 .00810 −.02695.06000 .04049 −.02602 .90000 −.00058 −.02188.08000 .04573 −.02977 .95000 −.00761 −.01752.10000 .05015 −.03308 .97500 −.01066.15000 .05878 −.03997 .98000 −.01555.20000 .06498 −.04535 .99000 −.01224 −.01503.25000 .06936 −.04971 1.00000 −.01322 −.01456
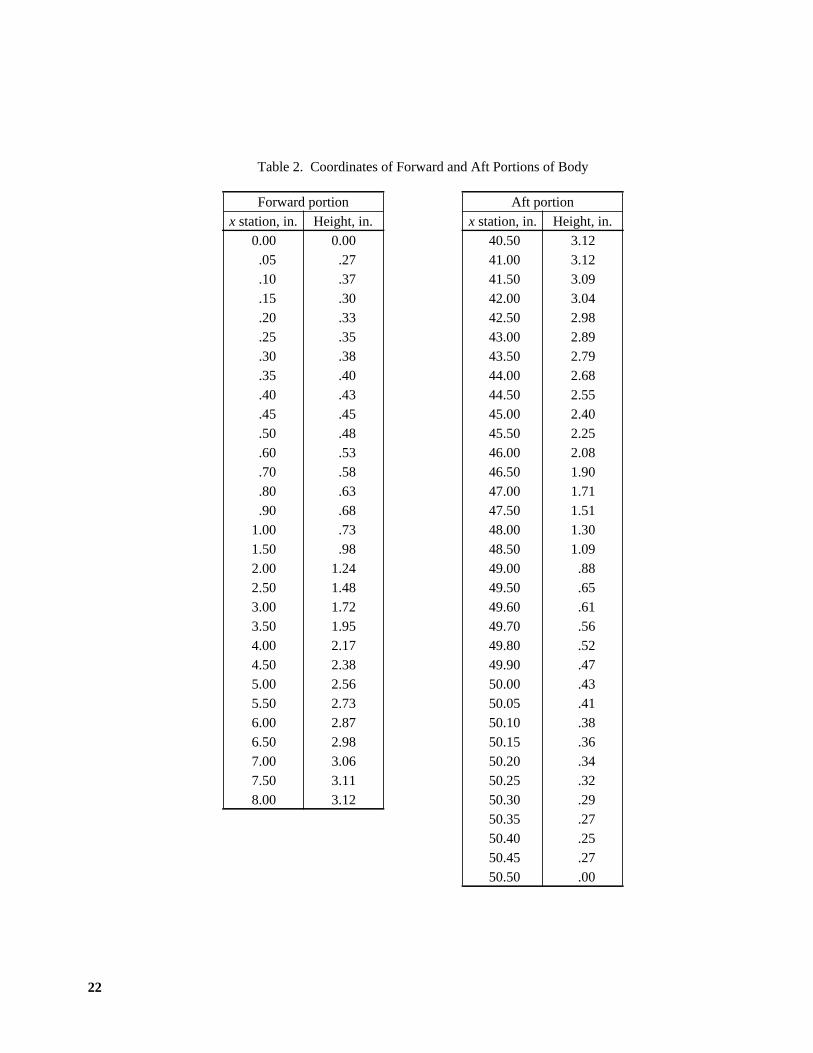
22
Table 2. Coordinates of Forward and Aft Portions of Body
Forward portion Aft portionx station, in. Height, in. x station, in. Height, in.
0.00 0.00 40.50 3.12.05 .27 41.00 3.12.10 .37 41.50 3.09.15 .30 42.00 3.04.20 .33 42.50 2.98.25 .35 43.00 2.89.30 .38 43.50 2.79.35 .40 44.00 2.68.40 .43 44.50 2.55.45 .45 45.00 2.40.50 .48 45.50 2.25.60 .53 46.00 2.08.70 .58 46.50 1.90.80 .63 47.00 1.71.90 .68 47.50 1.51
1.00 .73 48.00 1.301.50 .98 48.50 1.092.00 1.24 49.00 .882.50 1.48 49.50 .653.00 1.72 49.60 .613.50 1.95 49.70 .564.00 2.17 49.80 .524.50 2.38 49.90 .475.00 2.56 50.00 .435.50 2.73 50.05 .416.00 2.87 50.10 .386.50 2.98 50.15 .367.00 3.06 50.20 .347.50 3.11 50.25 .328.00 3.12 50.30 .29
50.35 .2750.40 .2550.45 .2750.50 .00

23
Table 3. Measured Nondimensional Orifice Locations (x/c)
[Values are nondimensionalized by local wing chord]
Values ofx/c at pressure orifices of—
η = 0.25 η = 0.50 η = 0.70 η = 0.80 η = 0.90
Upper Lower Upper Lower Upper Lower Upper Lower Upper Lower
0.000 0.000 0.000 0.000 0.000
.019 0.019 .019 0.020 .018 0.019 .019 0.020 .018 0.019
.049 .050 .049 .050 .049 .049 .050 .050 .049 .049
.099 .100 .099 .100 .099 .099 .100 .101 .099 .099
.149 .153 .149 .150 .149 .150 .150 .151 .149 .149
.199 .200 .199 .200 .199 .199 .200 .201 .200 .200
.249 .250 .249 .250 .249 .250 .250 .250 .249 .250
.299 .300 .299 .299 .299 .299 .299 .300 .299 .300
.349 .350 .349 .349 .349 .349 .350 .350 .349 .350
.399 .399 .399 .400 .399 .400 .400 .400 .399 .400
.449 .449 .449 .450 .449 .450 .450 .451 .449 .450
.499 .499 .499 .500 .499 .499 .500 .501 .499 .499
.549 .550 .549 .550 .549 .549 .550 .551 .550 .549
.599 .600 .599 .600 .599 .599 .600 .601 .600 .600
.649 .650 .649 .650 .649 .650 .651 .651 .649 .652
.699 .700 .699 .700 .699 .700 .701 .701 .698 .700
.749 .750 .749 .750 .749 .750 .750 .751 .749 .750
.799 .800 .800 .800 .799 .800 .800 .801 .799 .800
.850 .849 .849 .850 .849 .850 .851 .851 .849 .850
.899 .899 .899 .900 .899 .900 .899 .895 .899 .886

24
Table 4. Summary of Jet Parameters for Each Wingtip
Tip
Number Position xj /ctip zj /ctip cj /ctip δj, deg ψj, deg Figure
1 Front 0.206 −0.008 0.062 0 0 8(a)
Rear .494 −.008 .062 0 0 8(a)
2 Front 0.299 −0.008 0.062 0 0 8(b)
Rear .604 −.008 .062 0 0 8(b)
3 Front 0.299 −0.008 0.062 20 0 8(c)
Rear .714 −.008 .062 0 0 8(c)
6 Front 0.299 0.023 0.062 0 0 8(d)
Rear .494 .023 .062 0 0 8(d)
8 Front 0.252 −0.008 0.155 0 0 8(e)
Rear .619 −.008 .375 0 0 8(e)
9 Front 0.299 −0.008 0.062 0 30 8(f)
Rear .604 −.008 .062 0 30 8(f)
Table 5. Wing Aerodynamic Characteristics for Each Wingtip Without Blowing
Tip ,deg−1 α0, deg CD,0 CB,0 Cm,0 Run
1 0.1010 −1.457 0.0104 0.4166 −0.0037 0.0050 −0.011
2 .1016 −1.382 .0103 .4162 .0017 .0054 −.013 1
2 .1019 −1.389 .0099 .4168 −.0003 .0061 −.012 2
3 .1003 −1.411 .0102 .4151 −.0001 .0057 −.013
6 .1006 −1.307 .0110 .4160 .0028 .0048 −.014
8 .1008 −1.287 .0103 .4188 .0052 .0039 −.014 1
8 .1010 −1.419 .0112 .4171 −.0009 .0050 −.012 2
8 .1009 −1.423 .0112 .4174 −.0013 .0052 −.011 3
9 .1014 −1.344 .0098 .4134 .0003 .0072 −.013
Average . . . 0.1011 −1.382 0.0104 0.4159 0.0004 0.0054 −0.013
CLαCBCL
CmCL

1
Figure A1. Convergence histories for residual error, lift coefficient, and drag coefficient for a typical grid (Nc = 192,Nn = 64,Ns = 40) atM∞ = 0.311 andα = 3.03°.
(a) Variation with number of chordwisegrid points atNs = 32.
(b) Variation with number of normalgrid points atNs = 32.
(c) Variation with number of spanwisegrid pointsNc = 192;Nn = 256.
Figure A2. Variation of lift and drag coefficients with number of grid points.
Figure A3. Sketch of final wing-surface grid. (Every other grid line was omitted for clarity.)
Figure A4. Sketch of final volume grid. (Some grid lines were omitted for clarity.)
(a) Effect of body on local induced angle of attack atM∞ = 0.30.
(b) Effect of body on local induced streamwise velocity atα = 0°.
Figure A5. Calculated induced effect of body along wing quarter-chord line.
(a) η = 0.25.
(b) η = 0.50.
Figure A6. Comparison of calculated (with and without corrections for presence of body) and experimental chordwisepressure distributions atM∞ = 0.305 andα = 4.03°.
(c) η = 0.70.
(d) η = 0.80.
Figure A6. Continued.
(e) η = 0.90.
Figure A6. Concluded.
(a) η = 0.25.
(b) η = 0.50.
(c) η = 0.70.
(d) η = 0.90.
Figure A7. Comparison of computed and experimental chordwise pressure distributions without blowing at severalspanwise stations atM∞ = 0.306 andα = 2.07°.
(a) α = −0.05°.
(b) α = 2.07°.
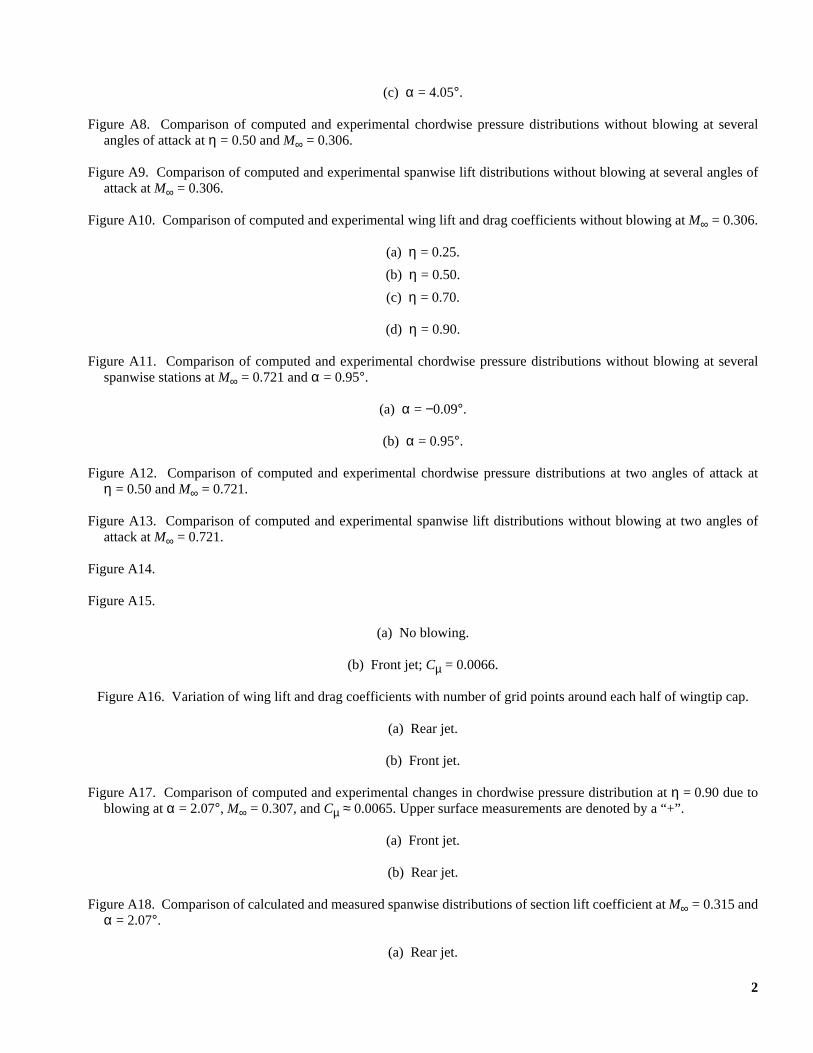
2
(c) α = 4.05°.
Figure A8. Comparison of computed and experimental chordwise pressure distributions without blowing at severalangles of attack atη = 0.50 andM∞ = 0.306.
Figure A9. Comparison of computed and experimental spanwise lift distributions without blowing at several angles ofattack atM∞ = 0.306.
Figure A10. Comparison of computed and experimental wing lift and drag coefficients without blowing atM∞ = 0.306.
(a) η = 0.25.
(b) η = 0.50.
(c) η = 0.70.
(d) η = 0.90.
Figure A11. Comparison of computed and experimental chordwise pressure distributions without blowing at severalspanwise stations atM∞ = 0.721 andα = 0.95°.
(a) α = −0.09°.
(b) α = 0.95°.
Figure A12. Comparison of computed and experimental chordwise pressure distributions at two angles of attack atη = 0.50 andM∞ = 0.721.
Figure A13. Comparison of computed and experimental spanwise lift distributions without blowing at two angles ofattack atM∞ = 0.721.
Figure A14.
Figure A15.
(a) No blowing.
(b) Front jet;Cµ = 0.0066.
Figure A16. Variation of wing lift and drag coefficients with number of grid points around each half of wingtip cap.
(a) Rear jet.
(b) Front jet.
Figure A17. Comparison of computed and experimental changes in chordwise pressure distribution atη = 0.90 due toblowing atα = 2.07°, M∞ = 0.307, andCµ ≈ 0.0065. Upper surface measurements are denoted by a “+”.
(a) Front jet.
(b) Rear jet.
Figure A18. Comparison of calculated and measured spanwise distributions of section lift coefficient atM∞ = 0.315 andα = 2.07°.
(a) Rear jet.
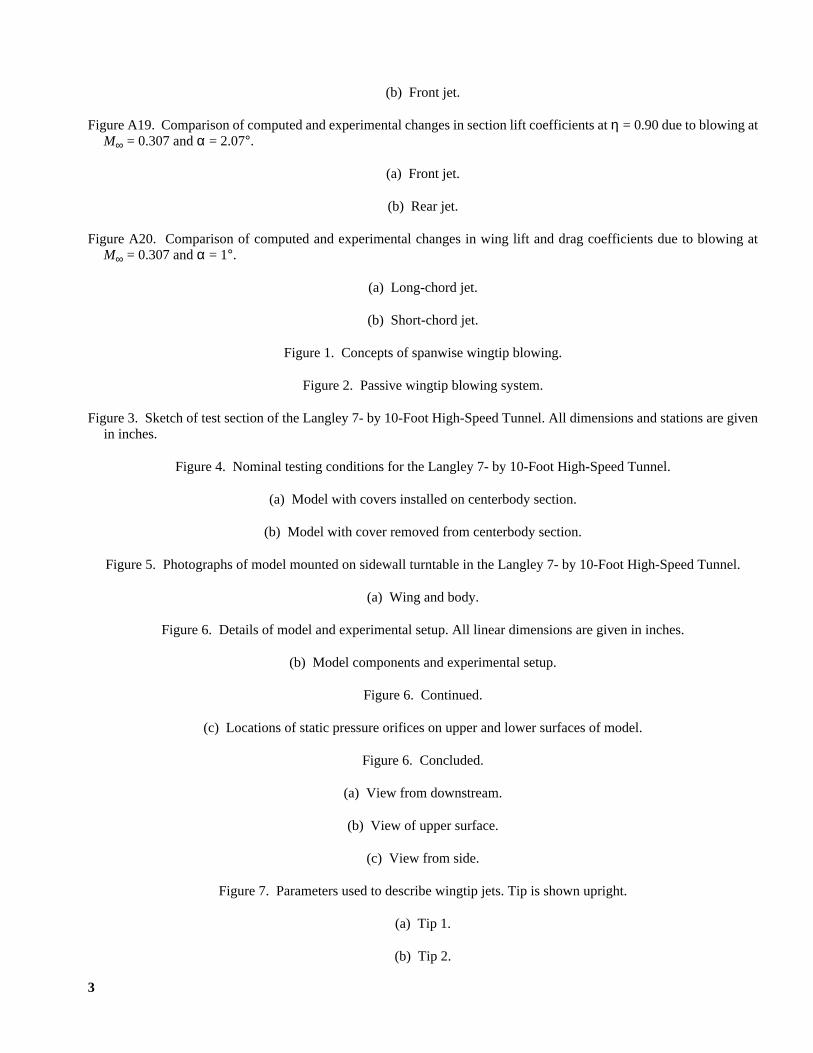
3
(b) Front jet.
Figure A19. Comparison of computed and experimental changes in section lift coefficients atη = 0.90 due to blowing atM∞ = 0.307 andα = 2.07°.
(a) Front jet.
(b) Rear jet.
Figure A20. Comparison of computed and experimental changes in wing lift and drag coefficients due to blowing atM∞ = 0.307 andα = 1°.
(a) Long-chord jet.
(b) Short-chord jet.
Figure 1. Concepts of spanwise wingtip blowing.
Figure 2. Passive wingtip blowing system.
Figure 3. Sketch of test section of the Langley 7- by 10-Foot High-Speed Tunnel. All dimensions and stations are givenin inches.
Figure 4. Nominal testing conditions for the Langley 7- by 10-Foot High-Speed Tunnel.
(a) Model with covers installed on centerbody section.
(b) Model with cover removed from centerbody section.
Figure 5. Photographs of model mounted on sidewall turntable in the Langley 7- by 10-Foot High-Speed Tunnel.
(a) Wing and body.
Figure 6. Details of model and experimental setup. All linear dimensions are given in inches.
(b) Model components and experimental setup.
Figure 6. Continued.
(c) Locations of static pressure orifices on upper and lower surfaces of model.
Figure 6. Concluded.
(a) View from downstream.
(b) View of upper surface.
(c) View from side.
Figure 7. Parameters used to describe wingtip jets. Tip is shown upright.
(a) Tip 1.
(b) Tip 2.
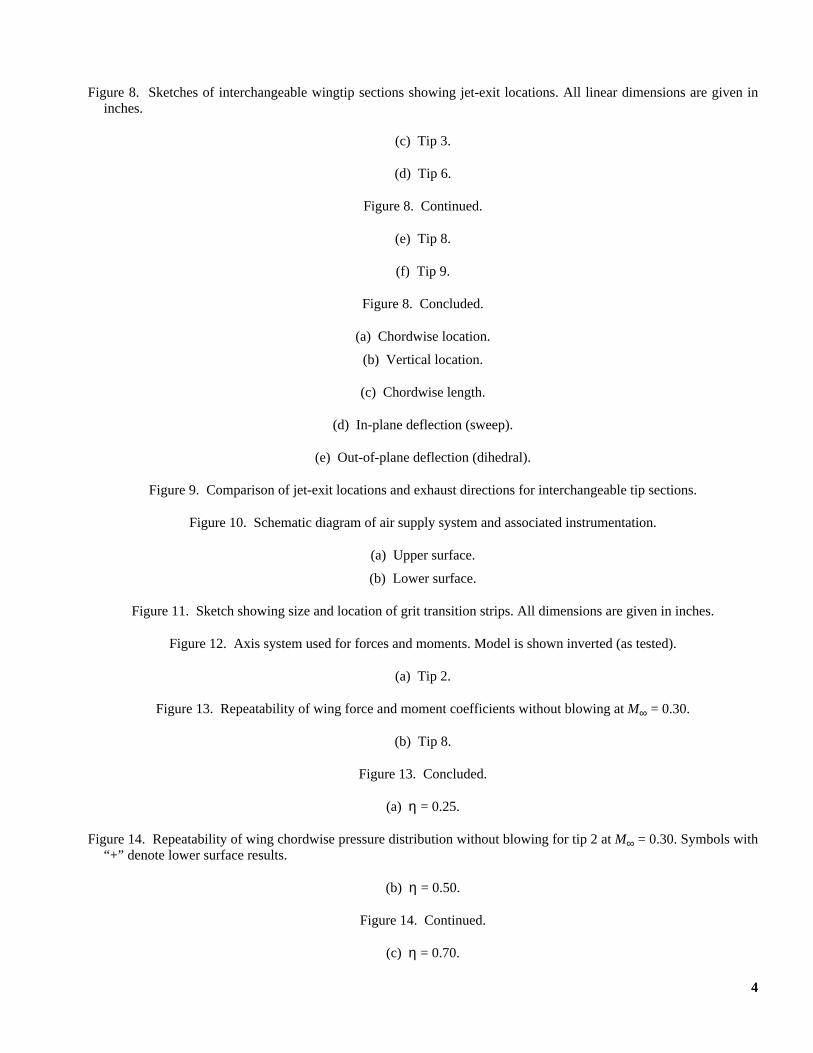
4
Figure 8. Sketches of interchangeable wingtip sections showing jet-exit locations. All linear dimensions are given ininches.
(c) Tip 3.
(d) Tip 6.
Figure 8. Continued.
(e) Tip 8.
(f) Tip 9.
Figure 8. Concluded.
(a) Chordwise location.
(b) Vertical location.
(c) Chordwise length.
(d) In-plane deflection (sweep).
(e) Out-of-plane deflection (dihedral).
Figure 9. Comparison of jet-exit locations and exhaust directions for interchangeable tip sections.
Figure 10. Schematic diagram of air supply system and associated instrumentation.
(a) Upper surface.
(b) Lower surface.
Figure 11. Sketch showing size and location of grit transition strips. All dimensions are given in inches.
Figure 12. Axis system used for forces and moments. Model is shown inverted (as tested).
(a) Tip 2.
Figure 13. Repeatability of wing force and moment coefficients without blowing atM∞ = 0.30.
(b) Tip 8.
Figure 13. Concluded.
(a) η = 0.25.
Figure 14. Repeatability of wing chordwise pressure distribution without blowing for tip 2 atM∞ = 0.30. Symbols with“+” denote lower surface results.
(b) η = 0.50.
Figure 14. Continued.
(c) η = 0.70.

5
Figure 14. Continued.
(d) η = 0.80.
Figure 14. Continued.
(e) η = 0.90.
Figure 14. Concluded.
Figure 15. Repeatability of spanwise variation of section lift coefficient without blowing for tip 2 atM∞ = 0.30.
Figure 16. Wing force and moment coefficients without blowing for tip 8 atM∞ = 0.30.
(a) α = −0.1°.
Figure 17. Effect of spanwise location on chordwise pressure distribution without blowing for tip 8 atM∞ = 0.30.Symbols with “+” denote lower surface results.
(b) α = 2.1°.
Figure 17. Continued.
(c) α = 4°.
Figure 17. Continued.
(d) α = 6°.
Figure 17. Continued.
(e) α = 8°.
Figure 17. Continued.
(f) α = 10°.
Figure 17. Concluded.
Figure 18. Effect of angle of attack on spanwise variation of section lift coefficient without blowing for tip 8 atM∞ = 0.30.
Figure 19. Effect of blowing at various jet chordwise locations on wing lift and drag coefficients atM∞ = 0.30.
Figure 19. Continued.
Figure 19. Concluded.
(a) xj/ctip = 0.30.
Figure 20. Effect of blowing at two jet vertical locations on wing lift and drag coefficients atM∞ = 0.30.
(b) xj/ctip = 0.50.
Figure 20. Concluded.
(a) δj = 20°.

6
(b) δj = 0°.
Figure 21. Effect of redirecting jet exhaust downward on wing lift and drag coefficients atM∞ = 0.30. Jet contributionsto lift and drag coefficients have been removed.
(a) xj/ctip = 0.30.
Figure 22. Effect of redirecting jet blowing downstream on wing lift and drag coefficients with direct thrust effectsremoved atM∞ = 0.30.
(b) xj/ctip = 0.50.
Figure 22. Concluded.
Figure 23. Effect of jet length on wing lift and drag coefficients atM∞ = 0.30.
(a) Variation of lift coefficient with angle of attack.
(b) Variation of wing-root bending-moment coefficient with lift coefficient.
Figure 24. Effect of blowing individually and simultaneously from long-chord jets on wing force and momentcoefficients for tip 8 atM∞ = 0.30.
(c) Variation of wing pitching-moment coefficient with lift coefficient.
(d) Variation of wing drag coefficient with lift coefficient.
Figure 24. Continued.
(e) Variation of wing total drag coefficient (including ram drag penalty) with lift coefficient.
Figure 24. Concluded.
(a) M∞ = 0.20.
(b) M∞ = 0.30.
Figure 25. Variation of wing lift and drag coefficients with jet momentum coefficient for tip 8 atα = 2.1°.
(c) M∞ = 0.40.
(d) M∞ = 0.50.
Figure 25. Concluded.
(a) M∞ = 0.20.
(b) M∞ = 0.30.
Figure 26. Effect of blowing on spanwise distribution of section lift coefficient for tip 8 atα = 2.1°.
(c) M∞ = 0.40.
(d) M∞ = 0.50.

7
Figure 26. Concluded.
(a) M∞ = 0.20.
(b) M∞ = 0.30.
(c) M∞ = 0.40.
(d) M∞ = 0.50.
Figure 27. Variation of section lift coefficient atη = 0.90 with jet momentum coefficient for tip 8 atα = 2.1°.
(a) M∞ = 0.20.
(b) M∞ = 0.30.
Figure 28. Change in local pressure coefficient with blowing atη = 0.90 for tip 8 atα = 2.1°. Symbols with “+” denotelower surface results.
(c) M∞ = 0.40.
(d) M∞ = 0.50.
Figure 28. Concluded.
(a) Front jet.
(b) Rear jet.
Figure 29. Computed chordwise pressure distributions near wingtip without and with spanwise blowing atM∞ = 0.72,δj = 0°, andα = 1°.
(c) Both jets.
Figure 29. Concluded.
(a) No blowing (Cµ = 0).
(b) Front jet operating (Cµ = 0.0012).
Figure 30. Computed particle paths on upper surface near wingtip atM∞ = 0.72,δj = 0°, andα = 1°. Paths starting at jetexit are denoted by dashed lines.
(c) Rear jet operating (Cµ = 0.0027).
(d) Both jets operating (Cµ = 0.0040).
Figure 30. Concluded.

8
Figure 31. Computed spanwise variation of section liftcoefficient for different jet blowing configurations atM∞= 0.72,δj = 0°, andα = 1°.
Figure 32. Computed changes in section wing lift coeffi-cient atη = 0.90, wing lift, and wing drag coefficientsdue to blowing atM∞= 0.72,δj = 0°, andα = 1°.
Figure 33. Computed chordwise pressure distribution near wingtip with blowing from both jets at two jet deflectionangles compared with no-blowing case atM∞ = 0.72 andα = 1°.
Figure 34. Computed particle paths on upper surface near wingtip with exhaust of both jets deflected downward 30° atM∞ = 0.72 andα = 1°. Paths starting at jet exit are denoted by dashed lines.
Figure 35. Computed spanwise variation of section lift coefficient with blowing at two deflection angles compared withno-blowing case atM∞ = 0.72 andα = 1°.
L-89-10608
L-89-11515

Form ApprovedOMB No. 0704-0188
Public reporting burden for this collection of information is estimated to average 1 hour per response, including the time for reviewing instructions, searching existing data sources,gathering and maintaining the data needed, and completing and reviewing the collection of information. Send comments regarding this burden estimate or any other aspect of thiscollection of information, including suggestions for reducing this burden, to Washington Headquarters Services, Directorate for Information Operations and Reports, 1215 JeffersonDavis Highway, Suite 1204, Arlington, VA 22202-4302, and to the Office of Management and Budget, Paperwork Reduction Project (0704-0188), Washington, DC 20503.
1. AGENCY USE ONLY (Leave blank) 2. REPORT DATE 3. REPORT TYPE AND DATES COVERED
4. TITLE AND SUBTITLE 5. FUNDING NUMBERS
6. AUTHOR(S)
7. PERFORMING ORGANIZATION NAME(S) AND ADDRESS(ES)
9. SPONSORING/MONITORING AGENCY NAME(S) AND ADDRESS(ES)
11. SUPPLEMENTARY NOTES
8. PERFORMING ORGANIZATIONREPORT NUMBER
10. SPONSORING/MONITORINGAGENCY REPORT NUMBER
12a. DISTRIBUTION/AVAILABILITY STATEMENT 12b. DISTRIBUTION CODE
13. ABSTRACT (Maximum 200 words)
14. SUBJECT TERMS
17. SECURITY CLASSIFICATIONOF REPORT
18. SECURITY CLASSIFICATIONOF THIS PAGE
19. SECURITY CLASSIFICATIONOF ABSTRACT
20. LIMITATIONOF ABSTRACT
15. NUMBER OF PAGES
16. PRICE CODE
NSN 7540-01-280-5500 Standard Form 298 (Rev. 2-89)Prescribed by ANSI Std. Z39-18298-102
REPORT DOCUMENTATION PAGE
June 1995 Technical Paper
Study of Potential Aerodynamic Benefits From Spanwise Blowing atWingtip WU 505-59-10-30
Raymond E. Mineck
L-17368
NASA TP-3515
This report is an expanded version of a thesis submitted in partial fulfillment of the requirements for the Degree ofDoctor of Science, George Washington University, Washington, D.C., May 1992.
Comprehensive experimental and analytical studies have been conducted to assess the potential aerodynamic bene-fits from spanwise blowing at the tip of a moderate-aspect-ratio swept wing. Previous studies on low-aspect-ratiowings indicated that blowing from the wingtip can diffuse the tip vortex and displace it outward. The diffused anddisplaced vortex will induce a smaller downwash at the wing, and consequently the wing will have increased liftand decreased induced drag at a given angle of attack. Results from the present investigation indicated that blowingfrom jets with a short chord had little effect on lift or drag, but blowing from jets with a longer chord increased liftnear the tip and reduced drag at low Mach numbers. A Navier-Stokes solver with modified boundary conditions atthe tip was used to extrapolate the results to a Mach number of 0.72. Calculations indicated that lift and dragincrease with increasing jet momentum coefficient. Because the momentum of the jet is typically greater than thereduction in the wing drag and the increase in the wing lift due to spanwise blowing is small, spanwise blowing atthe wingtip does not appear to be a practical means of improving the aerodynamic efficiency of moderate-aspect-ratio swept wings at high subsonic Mach numbers.
Spanwise blowing; Wingtip blowing 100
A05
NASA Langley Research CenterHampton, VA 23681-0001
National Aeronautics and Space AdministrationWashington, DC 20546-0001
Unclassified–UnlimitedSubject Category 02Availability: NASA CASI (301) 621-0390
Unclassified Unclassified Unclassified

BULK RATEPOSTAGE & FEES PAID
NASAPermit No. G-27
National Aeronautics andSpace AdministrationLangley Research CenterMail Code 180Hampton, VA 23681-0001
Official BusinessPenalty for Private Use, $300