STUDY OF HYDRATION KINETICS AND … OF HYDRATION KINETICS AND RHEOLOGICAL BEHAVIOUR OF GUAR GUM...
12
K.Nandhini Venugopal et al / International Journal of Pharma Sciences and Research (IJPSR) Vol.1(1), 2010, 28-39 STUDY OF HYDRATION KINETICS AND RHEOLOGICAL BEHAVIOUR OF GUAR GUM K.Nandhini Venugopal, Abhilash M Department of Biotechnology Engineering, The Oxford College of Engineering, Bangalore, INDIA ABSTRACT BACKGROUND Guar galactomannan is a plant polysaccharide with extensive applications in food, paper, textile and petroleum industries. The main advantages for using guar are its low cost, easy availability and capacity to form viscous solutions and gels at low concentration. Additionally, chain architecture of guar galactomannan can be selectively modified to tailor properties of guar formulations and open up new opportunities for guar usage.The parameters such as hydration of guar, intrinsic viscosity measurements for determining the molecular weight of guar, rheological properties of guar were studied. RESULTS Experimental data have been correlated with the different models: flow curves with the Cross, Carreau and Meter- Bird model .The volume mean size of guar gum was 53.7μm and the molecular weight of guar near neutral pH was 967000 g/mol which were determined by intrinsic viscosity measurements. Hydration kinetics followed the logarithmic model. The behaviour of guar was interpreted in terms of Carreau model. CONCLUSION In this investigation the parameters such as hydration of guar, intrinsic viscosity measurements for determining the molecular weight of guar, rheological properties of guar were studied which would be very useful in modifying chain architecture of galactomannan to alter its properties which would open new opportunities for the use of guar. Keywords: Guar gum, Hydration, Rheology, Dissolution Kinetics. INTRODUCTION Gums are polymeric substances which, in an appropriate solvent or swelling agent, form highly viscous dispersions or gels at low, dry substance content. All gums are polysaccharides composed of sugars other than glucose. (1,2) Guar gum is a hydrocolloid obtained from the endosperm of the Cyanmopsis tetragonolobus belonging to the family Leguminosae. The structure of guar gum consists of a linear backbone of β(1,4)-linked D-mannose units with various amounts of α (1,6)-linked D-galactose side chains. The ratio of mannose to galactose is 2:1. Guar gum is an economical thickener and stabilizer. It easily hydrates in cold water to give highly viscous solution. The very high viscosity attained at low concentrations makes guar gum an excellent thickener in the food industry, such as in ISSN : 0975-9492 28
Transcript of STUDY OF HYDRATION KINETICS AND … OF HYDRATION KINETICS AND RHEOLOGICAL BEHAVIOUR OF GUAR GUM...

K.Nandhini Venugopal et al / International Journal of Pharma Sciences and Research (IJPSR) Vol.1(1), 2010, 28-39
STUDY OF HYDRATION KINETICS AND
RHEOLOGICAL BEHAVIOUR OF GUAR
GUM K.Nandhini Venugopal, Abhilash M
Department of Biotechnology Engineering, The Oxford College of Engineering, Bangalore, INDIA
ABSTRACT
BACKGROUND
Guar galactomannan is a plant polysaccharide with extensive applications in food, paper, textile and petroleum
industries. The main advantages for using guar are its low cost, easy availability and capacity to form viscous
solutions and gels at low concentration. Additionally, chain architecture of guar galactomannan can be selectively
modified to tailor properties of guar formulations and open up new opportunities for guar usage.The parameters such
as hydration of guar, intrinsic viscosity measurements for determining the molecular weight of guar, rheological
properties of guar were studied.
RESULTS
Experimental data have been correlated with the different models: flow curves with the Cross, Carreau and Meter-
Bird model .The volume mean size of guar gum was 53.7μm and the molecular weight of guar near neutral pH was
967000 g/mol which were determined by intrinsic viscosity measurements. Hydration kinetics followed the
logarithmic model. The behaviour of guar was interpreted in terms of Carreau model.
CONCLUSION
In this investigation the parameters such as hydration of guar, intrinsic viscosity measurements for determining the
molecular weight of guar, rheological properties of guar were studied which would be very useful in modifying
chain architecture of galactomannan to alter its properties which would open new opportunities for the use of guar.
Keywords: Guar gum, Hydration, Rheology, Dissolution Kinetics.
INTRODUCTION
Gums are polymeric substances which, in an appropriate solvent or swelling agent, form highly viscous dispersions
or gels at low, dry substance content. All gums are polysaccharides composed of sugars other than glucose. (1,2)
Guar gum is a hydrocolloid obtained from the endosperm of the Cyanmopsis tetragonolobus belonging to the family
Leguminosae. The structure of guar gum consists of a linear backbone of β(1,4)-linked D-mannose units with
various amounts of α (1,6)-linked D-galactose side chains. The ratio of mannose to galactose is 2:1. Guar gum is an
economical thickener and stabilizer. It easily hydrates in cold water to give highly viscous solution. The very high
viscosity attained at low concentrations makes guar gum an excellent thickener in the food industry, such as in
ISSN : 0975-9492 28

K.Nandhini Venugopal et al / International Journal of Pharma Sciences and Research (IJPSR) Vol.1(1), 2010, 28-39
soups, desserts, pie fillings. The molecular weight of guar gum is between 220,000 and 300,000. However molecular
weight as high as 0.1-2.8 million have also been reported. (3,4) Guar gum and its derivatives are major ingredients
in drilling muds and fingering fluids in oil industry and in the textile industry guar solutions help to improve the
printing quality. (3,5,6)
A number of factors are known to influence the hydration or dissolution process including the molecular weight and
concentration of the galactomannan in the guar powder and also the environmental conditions such as temperature
and pH and the presence of co solutes such as sucrose and salts. The major determinant of hydration kinetics is
particle size, which reflects the change in surface area exposed to water. The rate and degree of hydration of guar
gum are critical variables in influencing its biological activity. (3,5,6)
Rheology is defined as the science involved in the study of flow and deformation of materials. It is a powerful tool
that can be used to characterize a wide range of materials ranging from solutions, melts, and gels, particulate
systems among others (2,7).
Guar has now assumed a larger role among the domesticated plants due to its unique functional and rheological
properties. Its ability to suspend solids, bind water by hydrogen bonding, control the viscosity of aqueous solutions
and form strong tough films, have accounted for its rapid growth and use in various industries. Industrial grade guar
gum is used in paper, textile processing, explosives, detergents, drilling fluids, ceramics, paints and many other
industries. The purified grade is used in the pharmaceuticals, dielectric, cosmetic and food Industries. (2)
The hydration property of guar gum and other water soluble non-starch polysaccharides (s-NSP) is an important
characteristic in many applications where solutions of these polymers often need to be prepared. Guar gum can
significantly modify metabolism and gut function of experimental animals and humans. These metabolic effects are
considered to be of clinical value in the dietary management of diabetes mellitus.
In view of the extensive applications of guar gum in various processes, biological environments and keeping in view
that it is a low cost polysaccharide, easily available, nontoxic and biodegradable, the purpose of this work was
To prepare and characterize guar sols
To measure the intrinsic viscosity and to determine the effect of molecular weight in acidic, near neutral
and alkaline media, which find applications in food and dietary fields.
To develop a method of measuring the hydration rate of guar gum and the selection of a suitable empirical
model for determining hydration kinetics as well as hydration index which is a main criteria in biological
process especially in drug delivery systems.
To determine the effect of shear rate and pH on the viscosity of guar sols that find application in many
industries like cosmetics, fermentation, explosives, and mining industries and in polymer processing.
Generation of flow curves at different pH media.
MATERIALS
Guar gum, Borax, Sodium chloride, Hydrochloric acid, Sodium hydroxide (of LR grade) was obtained from
National Chemicals Limited, Vadodara.
ISSN : 0975-9492 29

K.Nandhini Venugopal et al / International Journal of Pharma Sciences and Research (IJPSR) Vol.1(1), 2010, 28-39
EXPERIMENTAL METHODOLOGY
The guar gum dispersions were prepared by weighing a definite amount of guar and sprinkling into a rapidly
swirling vortex of 100 ml deionised water in a glass beaker at 30+_1ºC. A magnetic stirrer was used to create the
vortex in the deionised water. Guar gum samples were gently tapped manually on the sides of the beaker thoroughly.
This encouraged a rapid and even dispersion of the sample into the water vortex created by magnetic stirrer, thus
minimizing the aggregation of particles and producing a homogeneous polymer solution.
The time taken to add the guar sample was 60-90 s. Post dispersion was carried out by reducing the speed of agitated
mass. Guar samples dispersed in water for 30 minutes were allowed to rest in refrigerator undisturbed for a period of
24 hours. The viscosity at the end of 24 hours was considered to be the ultimate viscosity. Care was taken that there
was no loss of volume.
Viscosity of the sols was determined using the Brookfield cone and plate Rheometer at shear rates of 0.25-150 s-1.
The solutions of guar with varying pH in the range of 2-13.4 were also prepared. The lower pH value was controlled
by adding sulphuric acid while alkaline pH was maintained by adding sodium hydroxide. The intrinsic viscosity
measurements were performed using an Ostwald glass viscometer by measuring the efflux time of guar sols of
concentration ranging from 0.05-0.3 g (w/v).
RESULTS AND DISCUSSION
4.1 CHARACTERISATION OF GUAR
4.1.1 PARTICLE SIZE DISTRIBUTION
Determination of particle size is very important as it influences the hydration and viscosity of the guar. The major
determinant of hydration kinetics is the particle size, which reflects the changes in surface area exposed to water.
There is an inverse relationship between the dissolution rate and particle size. (6)
In view of this, guar gum was characterized on the basis of particle size. The guar gum flour was screened through a
200 mesh Taylor sieve screen where all the particles passed through it suggesting that the sizes to be less than 74μ.
The guar was further analyzed for particle size distribution using a Sympatec Helos (H1004) Laser Particle Size
Analyzer with pressure at 3 bars and duration of 5 seconds. The volume mean diameter was found to be 53.7μm.The
size distribution and volume mean diameter are reported in Figure 4.1
ISSN : 0975-9492 30

K.Nandhini Venugopal et al / International Journal of Pharma Sciences and Research (IJPSR) Vol.1(1), 2010, 28-39
Figure. 4.1. Particle size distribution of guar gum.
The mean particle size of food grade guar as reported by various investigators including Wang et al (3,5,6,8) also
happens to be in the range of 54-500μm
4.1.2 INTRINSIC VISCOSITY MEASUREMENTS
Intrinsic viscosity measurements were performed using Ostwald viscometer for guar sols in the concentration
ranging from (0.05-0.3% w/v) of guar at various pH conditions ranging from 2-13.4 covering acidic, near neutral
and basic environments.
The intrinsic viscosity a measure of the size of the isolated molecules was determined using equation 4.1 as
Intrinsic viscosity = 00 )ln
()( cr
csp
cc
…………………………………… (4.1)
The intrinsic viscosity was determined by taking specific viscosity at various concentrations and extrapolating the
concentration to c = 0. The concentration dependence is also expressed by Huggins equation (4.2) as
ISSN : 0975-9492 31

K.Nandhini Venugopal et al / International Journal of Pharma Sciences and Research (IJPSR) Vol.1(1), 2010, 28-39
ckcsp 2
……………………………………………. (4.2)
Where k =Huggins constant
From the intrinsic viscosity, viscosity average molecular weight Mv was estimated using Mark-Houwink’s equation
(4.3)
aKM ………………………………………………… (4.3)
Where η= Intrinsic viscosity obtained from the graph.
K = Proportionality constant
M = Molecular weight of the polymer
a = Shape factor
K and a are also called as Mark-Houwink constants and their values are obtained from the literature (8,9,10) as K =
3.8*10-4 and a = 0.732.
The molecular weight at different pH of guar gum were tabulated in Table 4.1.
Table 4.1: Molecular weight at different pH of Guar
pH Intrinsic viscosity
(dl/g)
Huggins constant Molecular weight
(g/mol)
2 5.5259 2.641 485000
3 6.5257 2.182 609000
4 5.9664 2.152 539000
6.4 9.1495 0.655 967000
8 5.9868 3.27 542000
10 6.2132 2.03 570000
13.4 1.4974 9.842 81600
At pH 6.4 (the pH of deionised water) the intrinsic viscosity value was determined to be 9.149 dl/g which is in close
agreement to reported values of guar galactomannan of 10-12.6 dl/g.(11). On moving away from neutral pH there is
a decline in the values of intrinsic viscosity. This could be attributed to partial hydrolysis of polysaccharides by
acid/alkali and also due to the variation in the dielectric constant of solvents resulting in a decrease in the molecular
weight. Wang et al (12) also reported the viscosity of guar gum to be slightly lower in acidic pH than neutral pH.
They suggested the degradation of guar galactomannan under acidic conditions was random with respect to chain
cleavage and pH > 2 does not very much effect the molecular weight of galactomannan.
A decrease in intrinsic viscosity noted can also be attributed to the change in water structure affecting the interaction
between water/galactomannan and galactomannan/galactomannan molecules. The weak protonation of the hydroxyl
groups in galactomannan and water molecules caused by high H+ may reduce the inter and intra molecular hydrogen
bonding. It is possible that galactomannan molecules are less expanded in acidic media and the hydrogen bonding
between water and galactomannan is less prevalent. The value of Huggins constant for pH 6.4 is 0.655 which is in
ISSN : 0975-9492 32

K.Nandhini Venugopal et al / International Journal of Pharma Sciences and Research (IJPSR) Vol.1(1), 2010, 28-39
the specified range of 0.35-0.9 as quoted in the literature (12). However it was observed that the Huggins constant
was much greater in acidic and alkaline media indicating the poor incompatibility of solvent with solute.
4.2 HYDRATION OF GUAR
The hydration kinetics of different concentrations of guar gum powder (0.6-1.2 %) (w/v) was studied using viscosity
development as an index of hydration rate. The hydration studies were carried out and the viscosity of the different
guar sols (0.5-1.2 %) at 0.5 to 100 s-1 shear rates was measured
First order kinetics and Logarithmic model were used to fit the hydration kinetics. In view of the first order model
not fitting the experimental data satisfactorily, the logarithmic model was used to fit the data and showed that the
model fitted the experimental data reasonably well with > 0.95 correlation coefficient.
The model is given by,
tkbt ln)1ln(
……………………………………….. (4.4)
ηt = Zero shear viscosity at time t
η∞ = Ultimate viscosity
k and b = Hydration constants.
Figure. 4.2. Hydration curves at different guar concentrations
From Figure 4.2 it can be seen that the slope k and intercept b increase in the concentration range 0.6 to 1.2%. From
the results obtained it is helpful to generate the relationship between the hydration rate and the concentration. Zero
shear viscosity was taken at 0.5 s-1 as it was not possible to measure viscosity at shear rates lower than 0.5 s-1. This
value also corresponds to the first Newtonian plateau
ln(t)
-4
-3.5
-3
-2.5
-2
-1.5
-1
-0.5
0
0 1 2 3 4 5 6
ln(i
-t/
) 0.60%
0.80%
1%
1.20%
ISSN : 0975-9492 33

K.Nandhini Venugopal et al / International Journal of Pharma Sciences and Research (IJPSR) Vol.1(1), 2010, 28-39
Figure 4.3. Viscosity developments at shear rate of 0.5 s-1
Figure 4.3 shows a plot of η vs. t at different concentration of guar gum sols. It can be seen that the plateau in the
curve was attained at lower times when almost > 90% of viscosities was developed at 60 minutes.
The reason for choosing t0.9 time period rather than t0.5, was that it covered the main period of hydration process
during which most of the viscosity had developed and also that the viscosity was approaching the plateau value or
ultimate viscosity.
Thus the Equation 4.4 can thus be rearranged as
kbt et /1]/)1[(
…………………………………………. (4.5)
Substituting η0.9 =0.9η∞ in the above Equation gives
kbe
t /19.0 )
1.0( ……………………………………………….. (4.6)
Table 4.2 reports the t0.9 values for concentration ranges 0.6 to 1.2%.
Table 4.2: Hydration index at different guar concentration
Concentration (g/dl) t0.9 (min)
0.6 56.48
0.8 65.58
1 82.85
1.2 99.65
It is assumed that the particle hydrates in a uniform manner and does not fragment during the dissolution/hydration
process. Slight higher shear rates employed in this experiment could have resulted in fragmentation and accelerated
the overall hydration process and the solution tend to get hydrated rapidly due to enhanced surface area leading to an
enhancement of viscosity.
0
400
800
1200
1600
2000
2400
2800
3200
3600
4000
0 100 200 300 400
Time (min)
Vis
cosi
ty (
cp)
0.60%
0.80%
1%
1.20%
ISSN : 0975-9492 34
K.Nandhini Venugopal et al / International Journal of Pharma Sciences and Research (IJPSR) Vol.1(1), 2010, 28-39
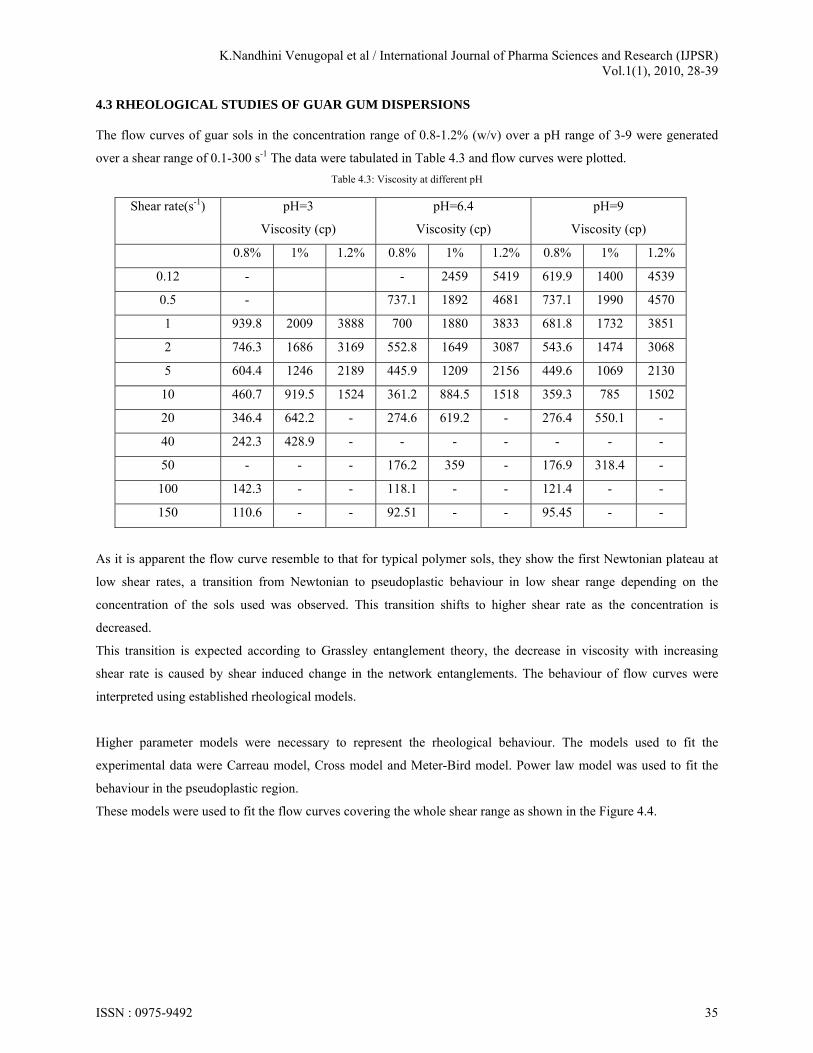
4.3 RHEOLOGICAL STUDIES OF GUAR GUM DISPERSIONS
The flow curves of guar sols in the concentration range of 0.8-1.2% (w/v) over a pH range of 3-9 were generated
over a shear range of 0.1-300 s-1 The data were tabulated in Table 4.3 and flow curves were plotted.
Table 4.3: Viscosity at different pH
Shear rate(s-1) pH=3
Viscosity (cp)
pH=6.4
Viscosity (cp)
pH=9
Viscosity (cp)
0.8% 1% 1.2% 0.8% 1% 1.2% 0.8% 1% 1.2%
0.12 - - 2459 5419 619.9 1400 4539
0.5 - 737.1 1892 4681 737.1 1990 4570
1 939.8 2009 3888 700 1880 3833 681.8 1732 3851
2 746.3 1686 3169 552.8 1649 3087 543.6 1474 3068
5 604.4 1246 2189 445.9 1209 2156 449.6 1069 2130
10 460.7 919.5 1524 361.2 884.5 1518 359.3 785 1502
20 346.4 642.2 - 274.6 619.2 - 276.4 550.1 -
40 242.3 428.9 - - - - - - -
50 - - - 176.2 359 - 176.9 318.4 -
100 142.3 - - 118.1 - - 121.4 - -
150 110.6 - - 92.51 - - 95.45 - -
As it is apparent the flow curve resemble to that for typical polymer sols, they show the first Newtonian plateau at
low shear rates, a transition from Newtonian to pseudoplastic behaviour in low shear range depending on the
concentration of the sols used was observed. This transition shifts to higher shear rate as the concentration is
decreased.
This transition is expected according to Grassley entanglement theory, the decrease in viscosity with increasing
shear rate is caused by shear induced change in the network entanglements. The behaviour of flow curves were
interpreted using established rheological models.
Higher parameter models were necessary to represent the rheological behaviour. The models used to fit the
experimental data were Carreau model, Cross model and Meter-Bird model. Power law model was used to fit the
behaviour in the pseudoplastic region.
These models were used to fit the flow curves covering the whole shear range as shown in the Figure 4.4.
ISSN : 0975-9492 35

K.Nandhini Venugopal et al / International Journal of Pharma Sciences and Research (IJPSR) Vol.1(1), 2010, 28-39
10
100
1000
10000
0.1 1 10 100 1000
(s-1)
cp)
0.80%
1%
1.20%
10
100
1000
10000
0.01 0.1 1 10 100 1000
(s-1)
(cp
)
0.80%
1%
1.20%
Figure 4.4. Flow curves at pH 3, 6.4.
Power law model was used to fit the experimental data in the pseudoplastic regime. Attempts were made to fit the
experimental data generated in this work and are detailed below.
The full Carreau Model (13,14) is expressed by the following equation
2
12
0
])(1[
n
………………………. (4.9)
The Carreau model parameters were given in Table 4.4.
Table 4.4: Carreau model parameters
C(g/dl) pH=3 pH=6.24 pH=9
(s-1)
n 0
(cp)
(s-1)
N 0
(cp)
(s-1)
n 0
(cp)
0.8 0.2739 0.462 939.8 0.1818 0.3655 790 0.2173 0.4278 619
1 0.3921 0.4594 2009 0.666 0.4285 2459 0.3703 0.4059 1990
1.2 0.5128 0.444 3888 1.02 0.5874 5419 0.5555 0.4743 4570
The parameter (n) value calculated from the models closely related to the value of (n) calculated from the power law
model (fitting in pseudoplastic range) .This can be seen from Figure 4.5
ISSN : 0975-9492 36

K.Nandhini Venugopal et al / International Journal of Pharma Sciences and Research (IJPSR) Vol.1(1), 2010, 28-39
0
100
200
300
0 50 100 150 200
(s-1)
(Dyn
es/c
m2)
0.80%
1%
1.20%
0
100
200
300
0 20 40 60 80 100
(s-1)
(D
ynes
cm-2
) 0.8 G
1 G
1.2 G
Figure 4.5. Power law model at pH 3, 6.4
The comparison of values of (n) were tabulated in Table 4.5.
Table 4.5. Comparison of flow index (n)
C(g/dl) pH=3 pH=6.24 pH=9
Carreau
model
Power law Carreau
model
Power law Carreau
model
Power law
0.8 0.462 0.5724 0.5874 0.6326 0.4278 0.7148
1 0.4594 0.5823 0.4285 0.5574 0.4059 0.5601
1.2 0.444 0.649 0.3655 0.6005 0.4743 0.7483
The carreau model fitted the data best and the experimental and calculated viscosities are reported in Table 4.8(a),
(b) and (c). Meter-Bird model also fits the data but the percentage deviation was too large.
At 1 and 1.2 (w/v) %, the zero shear viscosity was found to increase on increasing the pH from 3 to 6.4 and
decreased at pH 9. The characteristic time constant too followed the same trend. At concentration 0.8 (w/v) % zero
shear viscosity decreased on increasing the pH. The characteristic time constant and flow index decreased on
increasing the pH from 3 to 6.4 and then increased at pH 9 as per the Table 4.6.
ISSN : 0975-9492 37

K.Nandhini Venugopal et al / International Journal of Pharma Sciences and Research (IJPSR) Vol.1(1), 2010, 28-39
Table 4.6. Carreau model fitting at pH 6.4
Shear
rate
(s-1)
0.8%
1%
1.2%
ηexp
cp
cal
cp
ABS(1-
ηcal/ηexp)
*100
ηexp
cp
cal
cp
ABS(1-
ηcal/ηexp)
*100
ηexp
cp
cal
cp
ABS(1-
ηcal/ηexp)
*100
0.12 - - - 2459 2454.53 0.18 5419 5402.4 0.31
0.5 737.1 787.9 6.9 1892 2386.2 26.12 4681 5166.6 10.37
1 700 781.8 11.7 1880 2214.1 17.77 3833 4677.6 22.04
2 552.8 759.4 37.39 1649 1837.0 11.41 3087 3862.5 25.12
5 445.9 652.5 46.35 1209 1206.3 0.22 2156 2745.3 27.33
10 361.2 497.1 37.64 884.5 826.7 6.53 1518 2074.5 36.66
20 274.6 340.3 23.93 619.2 558.9 9.72 - - -
30 - - - 492.9 443.7 9.99 - - -
50 176.2 193.9 10.09 359 331.5 7.64 - - -
100 118.1 125.3 6.11 - - - - - -
150 92.51 96.9 4.79 - - - - - -
SUM 1.849 SUM 89.56 SUM 121.83
APD 20.543 APD 9.9515 APD 20.3
CONCLUSIONS
Guar galactomannan is a plant polysaccharide with extensive applications in food, paper, textile and petroleum
industries. The main advantages for using guar are its low cost, easy availability and capacity to form viscous
solutions and gels at low concentration. Additionally, chain architecture of guar galactomannan can be selectively
modified to tailor properties of guar formulations and open up new opportunities for guar usage. For example,
reducing the galactose (side chain) content of guar can be utilized to form synergistic gels with biopolymers such as
xanthan and carrageenan in various food applications. In the oil and gas industry, cross-linked guar gels are used to
transport sand (proppant) into artificially created fractures oil bearing rock in order to enhance petroleum
productivity.
In this investigation the parameters such as hydration of guar, intrinsic viscosity measurements for determining the
molecular weight of guar, rheological properties of guar were studied. The volume mean size of guar gum was
53.7μm and the molecular weight of guar near neutral pH was 967000 g/mol which were determined by intrinsic
viscosity measurements. Hydration kinetics followed the logarithmic model.
ISSN : 0975-9492 38

K.Nandhini Venugopal et al / International Journal of Pharma Sciences and Research (IJPSR) Vol.1(1), 2010, 28-39
This work can be extended to find the effect of salts and solvents on viscosity of guar sols and characterization of
guar gel. Further studies on loss and storage modulus of guar as well as gels needs to be investigated using dynamic
measurements. Influence of particle size on hydration needs to be investigated in detail. Ageing and biodegradation
of guar need to be identified. Detail mechanisms of gelling of guar with borax and focus on thermal degradation of
guar gels and resilience to thermal decomposition need to be determined.
REFERENCES
[1] Bikales Mark, Overberger, Menges, Encyclopedia of Polymer Science and Technology. Volume 7, 2nd Edition. (1987) 587-635, John Wiley and Sons Inc
[2] Kirk-Othmer, Encyclopedia of Chemical Technology. Volume 12. 4th Edition, (1994) 842-862, John Wiley and Sons Inc. [3] Wang, Q., Ellis, P.R., Ross-Murphy, S.B. Dissolution kinetics of guar gum powders—II. Effects of concentration and molecular weight.
Carbohydr. Polym. (2003) 53, 75-83. [4] Anchalee Srichamroen. Influence of Temperature and salt on viscosity property of Guar gum Naresuan University Journal, (2007) 15(2):55-
62. [5] Wang, Q., Ellis, P.R., Ross-Murphy, S.B. Dissolution kinetics of guar gum powders—I. Methods for commercial polydisperse samples.
Carbohydr. Polym. (2002) 49, 131-137. [6] Wang Q., Peter R.Ellis., Simon B.Ross-Murphy. Dissolution kinetics of guar gum powders— III. Effect of particle size. Carbohydr. Polym.
(2006) 20, 1-8. [7] Collins Appaw. Rheology and Microstructure of Cellulose acetate in Mixed Solvent Systems. PhD Thesis, (2004) Graduate Faculty of
North Carolina State University, Raleigh [8] Wang, Q., Ellis, P.R., Ross-Murphy, S.B. The stability of guar gum in an aqueous system under acidic conditions. Food Hydrocolloids,
(2000) 14, 129-134. [9] Thimma Reddy, T., Shekharam Tammishetti. Free radical degradation of guar gum. Polym. Deg. Stab., (2004) 86, 455-459. [10] Geoffrey Robinson., Simon B. Ross-Murphy., Edwin R. Morris. Viscosity-Molecular weight relationships, intrinsic chain flexibility and
dynamic solution properties of guar galactomannan. Carbohydr. Res., (1982) 107, 17-32. [11] Vispy F. Bharucha. Rheological study of Hydroxypropyl guar (HPG) slurries. Master of Thesis, (2003) University of Oklahoma, Norman. [12] Bernard Launay., Gererd Cuvelier., Salomon martinez-Reyes. Viscosity of locust bean, guar and Xanthan gum solutions in the Newtonian
domain: a critical examination of the log (ηsp) 0-log C (η) 0 master curves. Carbohydr. Polym. (1997) 34, 385-395. [13] Robert P. Hesketh. Non-Newtonian flows-Modified from the FEM lab ChE library module, (2005) Rowan University. [14] Helleloid, G.T., Elgindi, M.B.M., Langer, R.W. On the Computation of Viscosity-Shear rate Temperature master Curves for Polymeric
Liquids, University of Wisconsin, Eau Claire.
ISSN : 0975-9492 39