Study of Hot Tearing During Steel Solidification Through ...
29
HAL Id: hal-01354150 https://hal-mines-paristech.archives-ouvertes.fr/hal-01354150 Submitted on 3 Jan 2017 HAL is a multi-disciplinary open access archive for the deposit and dissemination of sci- entific research documents, whether they are pub- lished or not. The documents may come from teaching and research institutions in France or abroad, or from public or private research centers. L’archive ouverte pluridisciplinaire HAL, est destinée au dépôt et à la diffusion de documents scientifiques de niveau recherche, publiés ou non, émanant des établissements d’enseignement et de recherche français ou étrangers, des laboratoires publics ou privés. Study of Hot Tearing During Steel Solidification Through Ingot Punching Test and Its Numerical Simulation Takao Koshikawa, Michel Bellet, Charles-André Gandin, Hideaki Yamamura, Manuel Bobadilla To cite this version: Takao Koshikawa, Michel Bellet, Charles-André Gandin, Hideaki Yamamura, Manuel Bobadilla. Study of Hot Tearing During Steel Solidification Through Ingot Punching Test and Its Numerical Simulation. Metallurgical and Materials Transactions A, Springer Verlag/ASM International, 2016, 47 (8), pp.4053-4067. 10.1007/s11661-016-3564-x. hal-01354150
Transcript of Study of Hot Tearing During Steel Solidification Through ...

HAL Id: hal-01354150https://hal-mines-paristech.archives-ouvertes.fr/hal-01354150
Submitted on 3 Jan 2017
HAL is a multi-disciplinary open accessarchive for the deposit and dissemination of sci-entific research documents, whether they are pub-lished or not. The documents may come fromteaching and research institutions in France orabroad, or from public or private research centers.
L’archive ouverte pluridisciplinaire HAL, estdestinée au dépôt et à la diffusion de documentsscientifiques de niveau recherche, publiés ou non,émanant des établissements d’enseignement et derecherche français ou étrangers, des laboratoirespublics ou privés.
Study of Hot Tearing During Steel SolidificationThrough Ingot Punching Test and Its Numerical
SimulationTakao Koshikawa, Michel Bellet, Charles-André Gandin, Hideaki Yamamura,
Manuel Bobadilla
To cite this version:Takao Koshikawa, Michel Bellet, Charles-André Gandin, Hideaki Yamamura, Manuel Bobadilla.Study of Hot Tearing During Steel Solidification Through Ingot Punching Test and Its NumericalSimulation. Metallurgical and Materials Transactions A, Springer Verlag/ASM International, 2016,47 (8), pp.4053-4067. �10.1007/s11661-016-3564-x�. �hal-01354150�

1
Study of hot tearing during steel solidification through ingot punching test and its
numerical simulation
Takao Koshikawa1, 2
, Michel Bellet1, Charles André Gandin
1,
Hideaki Yamamura3, and Manuel Bobadilla
4
1 MINES ParisTech, CEMEF UMR CNRS 7635, 06904 Sophia Antipolis, France
2 Nippon Steel & Sumitomo Metal Corporation, Oita Works Equipment Division, 1 Oaza-
Nishinosu, Oita City 870-0992, Japan 3 Formerly, Nippon Steel & Sumitomo Metal Corporation, Steelmaking R&D Division, 20-1
Shintomi, Futtsu City, Chiba Prefecture 293-8511, Japan, and now The Japan Institute of
Metals and Materials, 1-14-32, Ichibancho, Aoba-ku, Sendai 980-8544, Japan 4 ArcelorMittal Maizières, Research and Development, BP 30320, 57283 Maizières-lès-
Metz, France
E-mail of the corresponding author: [email protected]
Abstract
Experimental and numerical studies of hot tearing formation in steel are reported. On the one
hand, an ingot punching test is presented. It consists in the application of a deformation at the
surface of a solidifying 450 kg steel ingot. The experimental parameters are the displacement
of the pressing tool, together with its velocity, leading to variations of a global strain rate. On
the other hand, three-dimensional finite element thermomechanical modelling of the test is
used. The time evolution of the strain tensor serves to compute an index to evaluate the
susceptibility to create hot tears. It is based on the integration of a hot tearing criterion (HTC)
that compares the local accumulation of strain with the expression of a critical value proposed
in the literature. The main variable of the criterion is the brittleness temperature range (BTR)
that refers to the solidification interval during which strain accumulates and creates hot cracks
or tears. Detailed comparison of the simulation results with the measurements reveals the
importance of the BTR for the prediction as well as excellent capabilities of the HTC to
predict the formation of hot tears.
Metallurgical and Materials Transactions A 47 (2016) 4053-4067
http://dx.doi.org/10.1007/s11661-016-3564-x
2
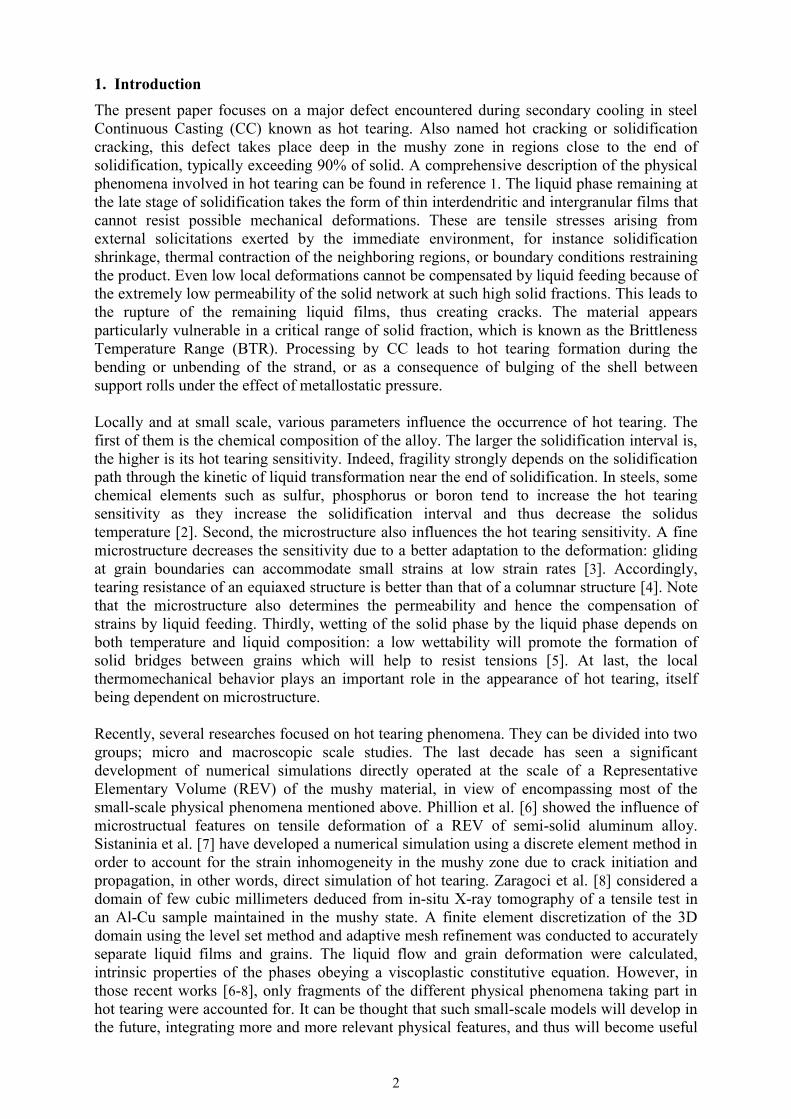
1. Introduction
The present paper focuses on a major defect encountered during secondary cooling in steel
Continuous Casting (CC) known as hot tearing. Also named hot cracking or solidification
cracking, this defect takes place deep in the mushy zone in regions close to the end of
solidification, typically exceeding 90% of solid. A comprehensive description of the physical
phenomena involved in hot tearing can be found in reference 1. The liquid phase remaining at
the late stage of solidification takes the form of thin interdendritic and intergranular films that
cannot resist possible mechanical deformations. These are tensile stresses arising from
external solicitations exerted by the immediate environment, for instance solidification
shrinkage, thermal contraction of the neighboring regions, or boundary conditions restraining
the product. Even low local deformations cannot be compensated by liquid feeding because of
the extremely low permeability of the solid network at such high solid fractions. This leads to
the rupture of the remaining liquid films, thus creating cracks. The material appears
particularly vulnerable in a critical range of solid fraction, which is known as the Brittleness
Temperature Range (BTR). Processing by CC leads to hot tearing formation during the
bending or unbending of the strand, or as a consequence of bulging of the shell between
support rolls under the effect of metallostatic pressure.
Locally and at small scale, various parameters influence the occurrence of hot tearing. The
first of them is the chemical composition of the alloy. The larger the solidification interval is,
the higher is its hot tearing sensitivity. Indeed, fragility strongly depends on the solidification
path through the kinetic of liquid transformation near the end of solidification. In steels, some
chemical elements such as sulfur, phosphorus or boron tend to increase the hot tearing
sensitivity as they increase the solidification interval and thus decrease the solidus
temperature [2]. Second, the microstructure also influences the hot tearing sensitivity. A fine
microstructure decreases the sensitivity due to a better adaptation to the deformation: gliding
at grain boundaries can accommodate small strains at low strain rates [3]. Accordingly,
tearing resistance of an equiaxed structure is better than that of a columnar structure [4]. Note
that the microstructure also determines the permeability and hence the compensation of
strains by liquid feeding. Thirdly, wetting of the solid phase by the liquid phase depends on
both temperature and liquid composition: a low wettability will promote the formation of
solid bridges between grains which will help to resist tensions [5]. At last, the local
thermomechanical behavior plays an important role in the appearance of hot tearing, itself
being dependent on microstructure.
Recently, several researches focused on hot tearing phenomena. They can be divided into two
groups; micro and macroscopic scale studies. The last decade has seen a significant
development of numerical simulations directly operated at the scale of a Representative
Elementary Volume (REV) of the mushy material, in view of encompassing most of the
small-scale physical phenomena mentioned above. Phillion et al. [6] showed the influence of
microstructual features on tensile deformation of a REV of semi-solid aluminum alloy.
Sistaninia et al. [7] have developed a numerical simulation using a discrete element method in
order to account for the strain inhomogeneity in the mushy zone due to crack initiation and
propagation, in other words, direct simulation of hot tearing. Zaragoci et al. [8] considered a
domain of few cubic millimeters deduced from in-situ X-ray tomography of a tensile test in
an Al-Cu sample maintained in the mushy state. A finite element discretization of the 3D
domain using the level set method and adaptive mesh refinement was conducted to accurately
separate liquid films and grains. The liquid flow and grain deformation were calculated,
intrinsic properties of the phases obeying a viscoplastic constitutive equation. However, in
those recent works [6-8], only fragments of the different physical phenomena taking part in
hot tearing were accounted for. It can be thought that such small-scale models will develop in
the future, integrating more and more relevant physical features, and thus will become useful

3
tools for a better fundamental understanding of hot tearing. But upscaling of such models to
deduce rules that can be applied at the processing scale, such as in continuous casting, will
require time due to their computational cost and actual approximations of the physical
phenomena. Therefore, it is necessary to focus on more macroscopic analysis methods to
study hot tearing. Those constitute the second group of researches mentioned previously, if
one is targeting process scale applications.
In the literature, lots of studies have proposed hot tearing criteria based on thermal
considerations [9], solid mechanics [10-15] or solid and fluid mechanics [16]. Bellet et al.
[15] have evaluated four of those hot tearing criteria for steels [9, 10, 14, 16] by means of
constrained shrinkage tests and ingot bending tests. Systematic numerical simulation of the
tests was conducted with the finite element package THERCAST® equipped with the different
macroscopic criteria. The authors concluded that the only criterion able to show a qualitative
agreement with the experimental tests was the strain-based criterion proposed by Won et al.
[14]. They proposed an enriched expression to reach quantitative agreement [15]. In addition,
Pierer et al. [3] evaluated, by use of submerged split chill tensile tests, a stress-based criterion
[11], a strain-based criterion [14], a criterion based on strain rate and including liquid feeding
consideration [16] and a criterion based on the sole BTR value [9]. The authors found that
only the stress-based criterion and the strain-based criterion had good capability for predicting
hot tearing. As a consequence, in the framework of the present study, we will essentially
focus on hot tearing criteria based on critical strain.
Section 2 of this paper will consist of a review of macroscopic strain-based criteria and of
their characterization through ingot bending or punching tests, as it will be shown that such
tests are well suited to reproduce the context of continuous casting. Section 3 will present the
ingot punching test developed in the framework of the present study. In Section 4, the
thermomechanical finite element model will be presented including the effective
implementation of the selected hot tearing criterion in the computation code THERCAST®.
Results of the numerical simulation of the punching tests and their comparison to
experimental measurements will be presented and discussed in Section 5.
2. A review of strain-based criteria and associated characterization through ingot
bending or pressing tests
As initially suggested by Yamanaka et al. [13], the basic expression to quantify the risk for
the occurrence of hot tearing due to accumulation of strain is written as follows:
cBTRHT F (1)
where BTR is the local cumulated strain for a REV in the mushy zone during its cooling
within a range of solid fraction. The second strain, c , is the critical strain at which cracks
form. These quantities will be detailed and discussed hereafter. From Eq. (1), a positive value
of the criterion function HTF interprets as the onset of cracks as the cumulated strain locally
exceeds the critical strain. Note that if one assumes a direct relationship between temperature
and fraction of solid, the range of solid fraction transforms into a temperature interval called
the brittleness temperature range (BTR).
For a given alloy, the critical strain value has to be established by experimental testing. The
latter should be representative of the conditions of the solidification process for which the
criterion is used. With this respect, the ingot bending or punching tests developed since the
late 70's by steelmakers to estimate the CC-process viability are good candidates. Such tests
have been developed by several authors [2, 17-21]. They consist in bending, punching, or

4
pressing the solidifying shell of an ingot during its solidification by means of a punch moved
perpendicularly to the shell plane (or surface of the ingot), i.e. along the dendritic growth
direction when solidification proceeds directionally away from the mold walls. The size of the
ingot and the control of the bending/punching conditions have to represent the solicitations
undergone by the solid shell during CC when it passes through the support rolls. Note that in
CC, the alloy also endures the metallostatic pressure which induces bulging between each roll
stand. Narita et al. [20] performed ingot punching tests on 72 kg steel ingots. This was done
by moving a punch through an opening window designed in the mold. The displacement and
the velocity of the punch were recorded during the tests, but the punching force was not
measured. Another example is provided by Wintz et al. [2] who developed a three-point
bending test performed on 300 kg steel ingots (1200×150×250 mm3) during their
solidification in a thin 6 mm-thick mold made of mild steel. The whole set -ingot plus mold-
was bent by a cylindrical punch (maximum force 450 kN), the velocity of which was
maintained constant in the range 0.1 to 5.5 mm s-1
during a short time. The surface
temperature of the mold was measured by a pyrometer. The knowledge of the solidified
thickness at the bending instant was obtained by a sulfur print made on a cross-section of a
test-ingot in which the remaining liquid pool was on purpose and instantly enriched in sulfur
at the instant of bending.
In this type of experiments, authors evaluated the applied deformation close to the
solidification front by some simple bending formulae. The applied strain rate was directly
deduced by dividing the total displacement imposed to the punch by the duration of its travel.
It is worth noting that those estimations do not take into account neither the three-dimensional
character of the test nor the fact that highly non uniform thermal gradients prevail through the
shell thickness, inducing a gradient in the material strength. Therefore, the quantitative results
deduced from these tests should be considered cautiously. However, from a qualitative point
of view, results clearly demonstrate that the first order variable for crack occurrence is strain.
Strain rate appears as a second order parameter, as the critical strain depends on strain rate
(the higher the strain rate, the smaller the critical strain).
Nagata et al. [12] summarized lots of experimental results conducted on steels and draw the
conclusion that the critical strain is related to the strain rate, , by a power law. The slope of
the log-form of this power law is a constant whatever the steel grade. The corresponding
relationship thus is written as follows:
*
c
mA (2)
where m* is a constant while A depends on steel grades (chemical composition). In addition,
the authors introduced the concept of poor ductility zone in the direction of the ingot
thickness, the extent of which is denoted . Poor ductility is considered by the authors
between the solidus temperature TS and a lower temperature called "Zero Ductility
Temperature" TZD. This should not be seen as being contradictory to the definition of the BTR
given above. Indeed, this may express the effect of intergranular coalescence. As
demonstrated by Rappaz et al. [22] and illustrated by Wang et al. [23], stable liquid films
could still cover grain boundaries to a lower temperature than the solidus temperature. Thus,
in their paper, Nagata et al. proposed an expression of TZD, or equivalently of the coalescence
undercooling, as a function of the carbon, phosphorus and sulfur content [12]. Taking into
account the non-linear temperature profile through the ingot shell (non-constant temperature
gradient), the expression proposed for is
291.1
surfS
surfZD1TT
TTd (3)

5
where d is the thickness of solidified shell and Tsurf is the surface temperature. It is worth
noticing that can equivalently be expressed by the following formula:
T
TT
ZDS (4)
which involves the local temperature gradient
T within the poor ductility zone. Nagata et
al. noticed that the critical strain also obeys the following expression [12]:
*c
nC (5)
where C and n* are constants with positive values. Interpretation is that the smaller the poor
ductility zone is, the larger is the critical strain required to form cracks (that is the smaller is
the risk of hot tearing). Finally, in line with Eqs. (2) and (5), and on the basis of a compilation
of several ingot bending experiments, the expression of the critical strain, as suggested by
Nagata et al., is written as follows [12]:
*
4*c103
m
n
(6)
where 167.0*m and parameters and n* are as follows:
258.0*and0077.0then,mm 3If
13.2*and0602.0then,mm 3mm 1If
n
n
(7)
Won et al. [14] proposed a similar expression. But rather than using the poor ductility extent
, which requires the knowledge of both the surface temperature Tsurf and the solidified shell
thickness d, as in Eq. (3) and (6), they preferred to use directly the BTR value. The proposed
expression for the critical strain is then
*BTR
*c nm T
(8)
where BTRT is the extent of the BTR in Kelvin and , m*, and n* are parameters. Through
the analysis of many experimental data [18, 20, 24, 25], the authors identified constant values
for those three parameters: 02821.0 , 3131.0*m , 8638.0*n . They also mention that
BTRT should be calculated with a non-equilibrium microsegregation analysis, taking into
account the steel composition and the cooling rate. Bellet et al. [15] conducted a similar
discussion, showing the strong dependence of the effective value of the critical strain, c ,
with respect to the microsegregation model used for the determination of BTRT .
Accordingly, and in line with Won et al. [14], they proposed a new expression for the critical
strain, based on a BTR value calculated with a microsegregation model in equilibrium
conditions, but with correction terms expressing the effective extent of the brittleness domain
especially due to sulfur and phosphorus. This model was validated against the experimental
results of Wintz et al. [2].
In the present study, a strain-based criterion – hereafter named WYSO from the initials of its
authors – will be considered with the shape of Eq. (8), the BTR extent being calculated by
means of different microsegregation models presented in the literature [28]. The latter point
will be detailed and discussed in Section 5.

6
3. Ingot punching test
The present punch press test has been designed and operated by Nippon Steel and Sumitomo
Metal Corporation in the R&D Centre of Futtsu, Japan. Steel grade for the present study is
shown in Table 1. A schematic of the test is shown in Figure 1. It has been designed to mimic
the thermomechanical solicitations taking place during CC processing of steel; for instance,
with respect to the evolution of the cooling rate and deformation. The procedure of the
experiments was as follows: the molten metal was prepared in an electric ladle furnace and
the temperature was maintained at 1913 K (1640 °C), i.e. 129 K above the liquidus
temperature. The molten metal was poured into the mold from the top through a tundish. The
filling duration was about 70 s during which the temperature of the molten metal started
decreasing due to heat exchanges with the tundish and with the mold. After filling, powder
was added at the top of the ingot to limit heat exchanges with the air. The size of the ingot
was 0.75 m height, 0.5 m width and 0.16 m thick. Its mass was approximately 450 kg. In
practice, a thermal insulator whose thickness was 5 mm covered the bottom part of the inner
mold walls from the base of the ingot and up to 0.2 m height. This was required to avoid
molten metal sticking and to make demolding easier. At a precise time after filling, the upper
part of one of the two largest ingot surfaces (top right mold in Figure 1) was moved upward.
The lateral surface of the ingot was then in direct contact with the air. Note in Figure 1 that
this side of the mold is made of two parts positioned one on top of the other. The bottom part
could thus be kept at the same place when the top part was removed. A punching tool was
then put into contact with the lateral vertical free surface of the ingot. It consists of a
horizontal 0.12 m-diameter 0.3 m- long cylinder with length centered on the main vertical
face of the ingot, its longitudinal axis aligned with the Z direction at height 0.45 m from the
bottom of the ingot. The tool velocity and displacement are controlled by means of a
hydraulic system and recorded during the test. The reaction force is also measured using the
time evolution of the hydraulic system pressure. The test conditions referred to as N-2 to N-6
are summarized in Table 1, together with measured nominal compositions in the ladle before
filling. Note that a unique alloy composition was targeted for the experimental results
reported hereafter. To know temperature evolution during the test, type-B thermocouples
labelled TC-1 and TC-2 in Figure 1 were positioned in the ingot. For that purpose, two
horizontal holes were created in the fixed large face of the mold (at left in Figure 1).
Thermocouples were inserted into these holes from outside. They were positioned in the mold
cavity at desired location. The holes diameter was 5.5 mm. For sealing purpose, thermal
insulator was put into the holes after setting thermocouples. In addition, type-K
thermocouples were placed in the fixed large face of the mold in trial N-4. The ingot surface
temperature was also measured with a pyrometer, labelled PM in Figure 1, in trial N-4 before
and after deformation when the top right mold was removed.
After completion of casting and cooling to room temperature, the ingot was cut and
appropriate etching was conducted to investigate hot tearing occurrence considering its
intensity and locations in micrographs. The cut was performed in the section Z = 0 m
schematized in Figure 1(b), i.e. a transverse section that reveals the entire ingot thickness and
height and is located at mid-width. Figure 2(a) shows a typical section for trial N-4. The
punching tool comes from the right-hand side in the figure. In front of the punching tool, a
columnar dendritic microstructure grew from the ingot surface toward the ingot center. The
columnar dendrites are slightly oriented upward as is shown in Figure 2(b). This could be due
to a downward liquid flow in the melt in front of the growing dendrites, as expected from
previous analyses [29]. Around the center of the ingot, the morphology is changed to
equiaxed due to the decrease of the temperature gradient in the liquid ahead of the growing
front [30]. At the top, primary shrinkage is observed with a large void located slightly below
the top solid shell. In order to avoid thermal exchange at the top, a thermal insulator powder
was put on the free liquid/air interface just after filling. However, thermal exchange was not

7
completely stopped and a thin solid shell formed. Upon further cooling, shrinkage flow leads
to a typical ingot top-surface depression shape and a large void underneath. Considering the
bottom of the ingot, the morphology is almost equiaxed and voids are also found. These
observations are attributed to shrinkage upon solidification of an isolated hot liquid pocket. In
fact, solidification is delayed in the bottom part of the ingot compared to the area located in
front the punching tool because of the thermal insulator material deposited at the bottom
surface of the mold to avoid metal sticking. The temperature gradient is also lowered at the
bottom part, facilitating the formation of an equiaxed zone and large shrinkage porosity. Yet,
void formation is not studied hereafter, as the main interest for this study is hot tearing in the
section of the ingot located in front of the punching tool. Detailed analysis reveals the
formation of the hot tears, as shown in Figure 2(b). The cracks are aligned with the columnar
dendrites, as expected from previous observations in the literature [31]. In this micrograph, it
seems stopped by the equiaxed zone. Its length reaches 20 mm in the cross section, although
hot tears are obviously three-dimensional objects and this value should be seen as an
underestimation. Also worth noticing is the absence of hot tear on the side of the ingot
opposite to the punching tool (e.g. in region X>0 according to Figure 1). The total number
and length of cracks observed in the transverse metallographic cross sections were measured
to estimate the intensity of hot tearing as a function of the experimental conditions.
4. Thermomechanical finite element modeling
4.1. Finite element modeling with THERCAST®
The numerical simulation of the punching tests consists of a thermomechanical stress/strain
analysis. It is conducted using the 3D finite element code THERCAST®. The essential
characteristics of the code can be found in References 32 and 33. Non-linear average
conservation equations for the total mass, momentum and energy are solved at each time
increment on all interacting domains shown in Figure 1: the ingot, the different components
of the mold, and the pressing punch. Yet, as regards the mechanical problem, only the ingot is
considered as deformable; the mold components and the punch are assumed rigid. In the
ingot, the solution covers the whole domain occupied by the metal, whatever its state: liquid,
solid, or mushy. The semi-solid steel (composed of liquid and solid phases) is simply
considered as a homogenized continuum with averaged properties and a unique average
velocity field v. The thermal problem and the mechanical problem are solved sequentially at
each time increment. First, the average energy conservation is solved in all domains taking
into account heat exchange between them. This equation can be expressed by
Tdt
dh (9)
where is the average density, h is the average specific enthalpy per unit mass, is the
average thermal conductivity and T is the temperature. Second, the mechanical problem is
considered. The following average momentum and mass conservation equations are solved
concurrently in the framework of a velocity-pressure formulation.
0tr
0vpε
γgs
p (10)
where s is the deviatoric stress tensor, p is the pressure, g is the gravity vector, γ is the
acceleration vector and vpε is the viscoplastic part of the strain rate tensor 2/)( T
vvε .
The alloy is modeled with a hybrid constitutive equation. Details can be found elsewhere [34],
only main lines being recalled here. Over the solidus temperature, the alloy is considered as a

8
non-Newtonian fluid obeying a temperature-dependent viscoplastic multiplicative law, as
follows:
mmK 1
3
(11)
where is the equivalent von Mises stress, K is the viscoplastic consistency, is the
generalized strain rate and m is the strain rate sensitivity. The value of m over the liquidus
temperature is equal to 1 (Newtonian fluid). In the frame of the present study, liquid flow in
liquid regions is ignored and the liquid viscosity is defined as 10 Pa s for numerical stability
reasons. Below the solidus temperature, the alloy obeys an elastic-viscoplastic constitutive
equation, expressed by:
nmmHK
13 (12)
in which is the cumulated plastic strain, H is the strain hardening coefficient and n is the
strain sensitivity. Physical properties and constitutive parameters are temperature dependent.
4.2. Implementation of the hot tearing criterion
In this study, the WYSO hot tearing criterion proposed by Won et al. [14] is evaluated. Being
interpreted like in [15], this criterion is based on the cumulated strain in the plane
perpendicular to the dendritic growth direction, this direction being assumed as the
temperature gradient direction. The corresponding strain rate is denoted . Following Eqs. (1)
and (8), the strain-based criterion WYSO
HTF is expressed as follows:
*BTR
*ccWYSO
HTˆ
ˆwithˆdˆnm
BTR TtF
(13)
where c denotes the strain limit which depends itself on the strain rate perpendicular to the
thermal gradient and on the BTR extent. The value of parameters , *m , and *n have
already been reported in Section 2 [14]. The values of the characteristic solid fractions
bounding the BTR will be discussed further. As regards , it is calculated as follows. The
strain rate tensor ε is first calculated in a reference frame attached to the temperature gradient
direction, the two complementary directions defining the perpendicular plane. From the four
components of the tensor ε in this plane, it is possible to calculate two eigen values.
Considering that hot tearing takes place under tension, is defined as the largest positive
eigen value.
In THERCAST®, given the linear interpolation of the velocity field in tetrahedral elements,
the velocity gradient is uniform in each element, and so is the value of . Hence, the criterion WYSO
HTF has been implemented as a constant field in each finite element, e. It is seen from Eq.
(13) that the definition of the strain rate used to define the critical strain c can give rise to
interpretations and discussions. The selected implementation procedure is detailed here. At
each time increment i, the following quantity is calculated:
*BTR
*ie
i
i_startj
jje
iWYSO,eHT,
ˆ
ˆnm
T
tF
(14)
where i_start is the time increment at which element e enters the BTR, and jt is the time
step at time increment j. The time increment at which element e exits the BTR is denoted

9
i_end. During the crossing of the BTR, the maximum value of the quantities iWYSO,
eHT,F is
retained to form the hot tearing criterion. Finally, in each element e the criterion value is
defined as:
iWYSO,eHT,
i_endi_start,i
WYSOeHT, Max FF
(15)
4.3. Simulation of ingot punching tests
As illustrated in Figure 1, half of the setup is simulated, because of the symmetry with respect
to the central transverse vertical section plane. The simulation encompasses 7 domains: the
ingot, 5 mold components, and the punching tool. In the ingot, the initial mesh size is 8 mm
and the number of elements is approximately 600,000. For better accuracy in the deformed
region, remeshing is performed to decrease the mesh size to 4 mm just before punching,
leading to 1,000,000 elements. The filling stage is not taken into account so that the
thermomechanical simulation starts at the end of the filling stage (70 s after filling start). The
corresponding "initial" temperature of the ingot at that time, 1823 K, is estimated thanks to
the measurements. It is set to 293 K for all other domains. The thermal boundary condition in
between ingot and mold is defined through a heat transfer coefficient, the value of which
depends on the air gap which may form at the interface because of shrinkage and thermal
contraction. When the ingot is into contact with the mold, the heat transfer coefficient is
calibrated by comparison with measurements. Its value is set to 850 W m-2
K-1
. When air gap
forms, its width is considered and a heat transfer coefficient is computed taking into account
radiation and heat conduction through the air gap [34]. Regarding the ingot top, an adiabatic
condition is used, thus modeling the use of the powder thermal insulator. After partial mold
removal, a free surface heat exchange condition is applied to this region of the ingot surface
by accounting for radiation and convection with the air at 293 K, with the values for
emissivity and convective heat transfer coefficient taken as 0.8 and 15 W m-2
K-1
, respectively.
Three different solidification paths are given in Figure 3. The first one is based on the lever
rule (LR) approximation, meaning that full thermodynamic equilibrium is assumed in all
existing phases at any temperature. The second one is a combination of the partial-equilibrium
(PE) approximation together with the para-equilibrium approximation (PA). It accounts for
the fact that C is an interstitial element with large diffusivity compared to substitutional
elements that are frozen in the solid phases. In addition, the PE+PA approximation accounts
for the peritectic reaction taking place in the steel grade investigated in this study. The details
of these approximations and the solidification paths for similar alloy compositions are given
elsewhere [28, 35]. The last solidification path (EX) is extracted from measurements
conducted on a sample using interrupted unidirectional solidification. Finally, the BTR
chosen in the present study is limited by solid fractions 0.9 and 0.99. Calculated values are
listed in Table 2 for the three solidification paths given in Figure 3.
Graphs in Figure 4(a) and (b) show a comparison of experimental stress-strain plots with
calculated curves based on Eq. (13). The comparison indicates a good agreement. The
temperature dependence of the corresponding constitutive coefficients in Eqs. (12-13) is given
in Figure 4(c). Thermophysical properties shown in Figure 5(a) are deduced from the TCFE6
database assuming full equilibrium solidification path [38, 39]. Latent heat is estimated to
260000 J kg-1
. Tabulation of the thermal conductivity as taken from [36] is also given in
Figure 5(b).

10
5. Results and discussion
Results for experiment N-4 are first considered, a global view of the structure observed in a
transverse metallographic cross section being provided in Figure 2. Analyses of the
temperature history and punch force evolution permit to introduce measurements and their
comparison with numerical simulations. This is done considering the 3 solidification paths
shown in Figure 3, corresponding to the BTR values reported in Table 2, as parameters for the
simulations. The set of data detailed for N-4 are then compared with those for N-5 and N-6.
As can be deduced from Table 1, the punching time is doubled in N-5 as the total
displacement of the punching tool is the same as for N-4 while the velocity of the punching
tool is twice smaller. For trial N-6, the punching time is the same as for N-4 since the total
displacement has been reduced by a factor 2 with the same velocity as for N-5. Finally, results
for all trials are reported in the same graphs for a global analysis and discussion.
5.1. Thermomechanical validation
Figure 6 shows the cooling curves recorded in the N-4 trial ingot by thermocouples TC-1 and
TC-2. TC-1 (blue curves in Figure 6) is located at the center of the ingot thickness and at
190 mm from the narrow face (or inner wall of the side mold). Comparatively, TC-2 (red
curves in Figure 6) is closer to the narrow face (90 mm from the side mold) but still close to
mid-thickness (only 20 mm off). Both thermocouples are at the same height, i.e. only 20 mm
below the impact position of the punching tool with the ingot surface. Surface temperatures at
the height of the punching tool using the pyrometer are also reported (circle marks in Figure
6). The calculated temperature evolution at the location of the thermocouples is in good
agreement with measured data from about 300 s. Before this time, simulated cooling curves
reveal an overestimation of the temperatures compared to measurements. A series of
additional simulations were performed by progressively decreasing the liquid viscosity during
the first 300 s. With more realistic properties of the melt, the predicted temperature came
closer to the measurements. It should also be pointed out that the filling stage of the mold by
the molten metal was not modeled. It is expected that it would further homogenize the
temperature. Temperature evolution during the punching test is yet well predicted.
After 300 s, the top-right mold located in front of the punching tool is removed (Table 1).
Simulation shows that the surface temperature of the ingot then increases (green curve in
Figure 6). This is expected as the heat flux decreases in the absence of the mold. At 484 s,
identified by a dashed vertical orange line, the punching tool is in contact with the ingot
surface. Pressing starts 15 s later, at 499 s, and lasts for 12 s (Table 1). The start/end of the
pressing sequence is identified by the 2 vertical orange lines in Figure 6. While no thermal
signature of the punching test is made visible with the thermocouples located in the core of
the ingot, it can be seen on the simulated curve extracted at the ingot surface in front of the
punching tool. A large temperature decrease precedes the punching sequence, with a
minimum temperature reached immediately after punching. While the punching tool goes
backward with a velocity of 1.0 mm/s after punching, the temperature increases up to
approximately the same level as before punching. Although it cannot be measured during
pressing, the calculated temperature evolution is in good agreement with the pyrometer
measurement (green symbols in Figure 6).
In order to further validate the thermomechanical simulations, the time evolution of the
reaction force acting against the imposed displacement of the punching tool is plotted in
Figure 7(a) for trial N-4. It is to be compared with the recorded force on the punching tool.
Globally, the agreement of the simulation with measurement is good. When comparing the
predictions obtained with the different solidification paths, it can be seen that an excellent
agreement with the measurement is reached for the simulation using the PE+PA
approximation. No large variation can be found when using EX or LR. However, the fact that

11
the prediction using LR leads to a larger reaction force reveals the presence of a stiffer solid
shell when pressing is applied. Indeed, according to LR, a higher quantity of solid is indeed
present as expected from Figure 3 when considering a given temperature distribution.
Overall, the comparison of temperature and force evolutions demonstrates that
thermomechanical evolutions are well simulated from about 300 s and up to the completion of
solidification, thus demonstrating the use of satisfying thermophysical and rheological
properties, as well as boundary conditions. Similar observations could be done for the other
trials as shown for N-5 and N-6 in Figure 7(b) and (c). These results confirm that quantitative
agreement is found for the thermomechanical load applying on the ingot surface. This
provides a sound basis in the use of the model for further interpretation of the distribution of
stresses and strains, as well as their exploitation to evaluate the selected hot tearing criterion.
5.2. Stress distribution and hot tearing criterion
Figure 8 shows the numerical simulation results just after punching for trial N-4 with the
solidification path labeled PE+PA in Figure 3 and Table 2. The various parts of the mold and
the punching tool appear with a uniform grey color, while the ingot section and surface are
colored according to the distribution of (a) the temperature, (b) the first principal stress
component Iσ , and (c) the hot tearing criterion WYSO
HTF . As this is a magnified view through
the various domains of the simulation shown in Figure 1, only the left, bottom-right and side
parts of the mold are partially made visible. The top-right part of the mold has already been
removed and the bottom part is invisible in this field of view. The cylindrical punching tool is
also visible. From this view, one can better see the analogy made with the interaction with
rolls in the secondary cooling zones of continuous casting machines. At the end of punching,
for trial N-4, it can first be seen that a region of fully molten liquid steel still exists at the
center of the ingot where the temperature is higher than the liquidus temperature of the alloy,
1784 K, while the surface temperature remains over 1273 K. Isotherms also reveal that the
average temperature of the right-hand-side domain of the ingot is hotter than the
left-hand-side. This is compatible with the previous description of the predicted cooling
curves shown in Figure 6 as cooling was found to be delayed in the absence of the top-right
mold.
Figure 8(b) presents the field of the first principal stress component, just before and just after
punching. For a better representation, only the tensile state is colored, regions in compression
(with negative value of this first principal stress component) being represented with the same
grey color as the mold parts and tool. First, it can be seen that a small region below the ingot
surface, in front of the tool, is compressed. Second, and as expected from the bending created
by the punch movement, tensile stresses generate and their values increase when going deeper
into the ingot. However, the maximum value (around 6 MPa) is not found in the mushy zone,
but in the solid, just beside the mushy zone. This is because the stiffness of the material is
continuously decreasing with increasing temperature, with an abrupt decay at the solid/mushy
transition. Tensile stresses also form on the left-hand-side but with a much lower intensity
than on the punch side.
The distribution of the values of the hot tearing criterion WYSO
HTF is displayed in Figure 8(c).
It is reminded here that those values result from an incremental build-up when crossing the
BTR, as expressed by Eqs. (14) and (15). Like for the tensile stress, only representations of
regions with positive value are shown, corresponding to higher risk to form tear defects.
Before punching and outside of the punching zone, there is no trace of hot tearing risk. The
negative values of the criterion express that the "natural" solidification of the ingot is globally
12
sound. Conversely, after bending, positive values appear, the higher ones being found on the
punching side, at the height of the punching tool, close to the end of solidification, within the
BTR. This is clear in Figure 8(c): after punching the maximum values are within the contours
defined for the fractions of solid 0.9 and 1. At the end of a casting simulation, when the ingot
is fully solid, the final WYSO
HTF map is made by retaining those values and reveals a high hot
tearing sensitivity only in the ingot region facing the punching tool.
5.3. Hot tearing prediction versus observations
Figure 9 shows a magnified view of the micrograph for trial N-4. It is extracted from the cut
schematized in Figure 1(b) and shown in Figure 2(a). In fact, the top hot tear circled in Figure
9 is the same as the one shown in Figure 2(b). Cracks were only found on the punching side
of the ingot. Their number and position were measured. This was done by counting the
number of cracks along the height of the ingot as a function of the distance from the punching
side, i.e. the right-hand-side limit of the images. Results are also presented in Figure 9 for trial
N-4. The black stepwise line is thus a direct reading of the intensity of defects found. In fact,
the range over which cracks are present depends on the crack lengths and the crack density is
directly proportional to the number of cracks. A total of maximum 3 tears were counted
50 mm away from the ingot surface where pressing was applied. Cracks are present between
40 to 60 mm. Note that this range is close to the length of the circled crack in Figure 2(b),
thus the longest in this sample.
Profiles are also provided for the criterion WYSO
HTF in Figure 9. Positive values normally
correspond to the occurrence of cracks. Considering the PE+PA solidification path (red curve),
cracks are predicted to occur over a distance ranging from 36 to 50 mm. This is not far from
the prediction using the experimental solidification path (EX, green curve). However, it also
becomes clear from Figure 9 that prediction using the LR approximation (blue curve) is not
satisfying as it almost never leads to positive values for WYSO
HTF . The reason is linked to the
small extent of the BTR (Table 2) in the case of LR. Cumulated strain computed within this
small temperature interval does not permit to reach the critical strain thus positive values of WYSO
HTF over a satisfying distance. This also corroborates the finding described for the
simulated reaction force that LR does not lead to results as good as the PE+PA approximation.
However, while differences between PE+PA and LR when predicting the reaction force were
not large, the effect on WYSO
HTF becomes spectacular. The effect of the solidification path is
thus evidenced, revealing the crucial role of the microsegregation model for the prediction of
hot tearing.
5.4. Comparison of experiments and discussions
Figure 7 and Figure 9 also present results of analyses for trials N-5 and N-6. Similar
observations can be given for the reaction force prediction and its comparison with
measurements through Figure 7. In Figure 9, however, a large number of cracks is visible for
trial N-5 while very few and short ones are found for trial N-6. Again, a more quantitative
illustration is given in the bottom line of Figure 9. This observation is retrieved in the
distribution with a maximum number of cracks count reaching 10 at around 50 mm reported
in Figure 9 for trial N-5, while only a maximum of 2 cracks are reported in Figure 9 for trial
N-6. Similar trends are predicted with the distribution of the WYSO
HTF value along the profile.
The maximum WYSO
HTF value is reached for trial N-5 while it only slightly overpasses the
zero-limit from which defects are expected to form for trial N-6. In Figure 9 trial N-5

13
corresponds to twice the time for the reaction time and a lower reaction force for trial N-6
since the total displacement has been reduced by a factor 2 compared to trial N-4. Such results
confirm the pertinence of the selected hot tearing criterion. Similar analyses as for N-4 again
reveal the critical role played by the solidification path to determine the BTR extent.
In an effort to analyze the cumulated strain criterion and to compare results with literature,
Figure 10 presents limit curves predicted by the WYSO criterion when based on the three
solidification paths. The continuous curves correspond to the strain limit )(ˆc that
constitutes the second term of the WYSO criterion in Eq. (13). Note that in the expression of
)(ˆc , the BTR extent is known a priori from the solidification path (Table 2). Thus, for each
curve, the half space located above the curve corresponds to WYSO
HTF > 0, expressing a higher
risk to form hot tearing defects. According to its smaller BTR extent, the LR limit curve is
shifted toward the top-right region of the graph while the PE+PA limit curve is located in a
lower (left-bottom) region, the EX limit falling in between. Calculated values are
superimposed on the figure for trials N-2 to N-6. To this end, for each test, the profile of WYSO
HTF along the thickness of the ingot at the punching tool height is exploited. The
maximum value for WYSO
HTF is taken from the profile as well as the corresponding value at the
same position for the perpendicular cumulated strain: BTRtd . The corresponding
perpendicular strain rate is then recomputed with Eq. (13), using the obtained values for the
maximum WYSO
HTF and the cumulated strain. The distribution of the results in the graph is
linked to the applied displacement and velocity of the punching tool as shown in Table 1. It is
found that the microsegregation model does not play a major role on the perpendicular
cumulated strain and the perpendicular strain rate in the BTR since the three points for each
trial are very close. Note that, while metallographic investigations of all these trials have
revealed the presence of hot tears, only the PE+PA and EX curves give a good response. The
simulation using LR does not work as N-6 is not located in the crack risk region and was yet
shown to present defects.
Considering the results presented above, it appears that the expression of WYSO
HTF not only
provides us with a criterion to predict the formation of hot tears but also has potential to
predict their magnitude. In order to reveal this behavior, a hot tearing index is built by
considering a simple addition of the crack length measured in each of the experiments. Figure
11 presents the value of cumulated hot tearing length, expressed in millimeters, as a function
of the maximum value for WYSO
HTF obtained from its profile at punching height based on the
PE+PA solidification path for each experiment. A positive slope is found, that shows a
significant correlation between the calculated value of the criterion function and the effective
crack intensity as deduced from cumulated measured crack lengths. This indicates that the
strain based criterion can also be used to predict the hot tearing magnitude.
6. Conclusions
A hot tearing study has been performed during steel solidification. Analyses include
- punching tests using a tool to press the semi-solid ingot while it is solidifying, thus
mimicking deformation under the rolls of a continuous casting machine,
- several trials conducted for various values of the total deformation and velocity of the
pressing tool,
14
- measurements including thermal history through the use of thermocouples and a
pyrometer as well as the reaction force acting against the imposed displacement of the
pressing tool,
- thermomechanical simulations of each trials using finite element simulations,
- metallographic investigation of a transverse cross section of the ingot and systematic
count of all cracks found to evaluate the intensity of defect formation,
- integration of a cumulated strain based hot tearing criterion (HTC),
- comparison of predictions with observations.
Main findings are as follows:
- the HTC is able to predict the risk of crack formation, provided that the brittleness
temperature range (BTR) is adequately reproduced,
- predictions in a cumulated strain versus strain rate perpendicular to the temperature
gradient, as well as the reaction force, does not evidence large variation with the BTR,
nor did the thermal history,
- the role of the BTR is evidenced when drawing the HTC profile along the ingot
thickness, thus revealing the critical effect of the selected solidification path,
- excellent correlation is found between measurements and simulations concerning the
position and intensity of the hot tears.
As a perspective to the present work, considering the strong sensitivity of the hot tearing
prediction to the solidification path, coupling with macrosegregation has to be modeled.
Indeed, deformation induced composition variations are expected to generate variations in
solidification paths [37]. This is particularly true when considering alloying elements such as
C, S or P for which low concentration variations can generate large deviations of the solidus
temperature. The numerical modelling of this coupling with macrosegregation requires in turn
the calculation in the mushy zone of the concurrent deformation of the solid phase and liquid
flow. Some work has been initiated by the authors of the present paper [41-43] by use of a
two-dimensional "two-phase" thermomechanical model [42, 43]. However, a general 3D
framework implementing concurrently macrosegregation and hot tearing is still missing in the
literature. Further developments in this direction are foreseen.
Acknowledgments
This work is supported by Nippon Steel & Sumitomo Metal Corporation (NSSMC) in a
collaborative project with ArcelorMittal (AM). The authors are deeply grateful to
Dr Olivier Jaouen and Dr Frédéric Costes from TRANSVALOR (Mougins, France), for their
kind help and discussion about thermomechanical modeling using software THERCAST®.
15
References
1. J. Campbell: Castings, Butterworth-Heinemann, Oxford, United Kingdom, 1991
2. M. Wintz, M. Bobadilla, and M. Jolivet: La Revue de Métallurgie, 1994, vol. 4, pp. 105-
114
3. R. Pierer, C. Bernhard, and C. Chimani: La Revue de Métallurgie, 2007, vol. 2, pp. 72-83
4. D.G. Eskin, Suyitno and L. Katgerman: Progress in Materials Science, 2004, vol. 49, pp.
629-711
5. M. Braccini: Doctotal Thesis, 2000, Institut National Polytechnique de Grenoble
6. A.B. Phillion, S.L. Cockcroft, and P.D. Lee: Acta Mater., 2008, vol. 56, pp. 4328-4338
7. M. Sistaninia, A.B. Phillion, J.M. Drezet, and M. Rappaz: Metall. Mater. Trans. A, 2011,
vol. 42, pp. 239-248
8. J.F. Zaragoci, L. Silva, M. Bellet, and C.A. Gandin: Proc. MCWASP XIII, 13th Int. Conf.
on Modelling of Casting, Welding and Advanced Solidification Processes, Schladming
(Austria), June 17-22, 2012, A. Ludwig, M. Wu, A. Kharicha (eds.), IOP Conference Series 33
(2012) 012054, 8 pages
9. T.W. Clyne and G.J. Davies: Solidification and Casting of Metals, TMS, Warrendale, PA,
1977, pp. 275-278
10. N.N. Prokhorov: Russian Castings Production, 1962, vol. 2, pp. 172-175
11. B. Rogberg: Scand. J. Metall., 1983, vol. 12, pp. 51-66
12. S. Nagata, T. Matsumiya, K. Ozawa, and T. Ohashi: ISIJ Int, 1990, vol. 76 (2), pp. 214-
221
13. A. Yamanaka, K. Nakajima, K. Yasumoto, H. Kawashima, and K. Nakai: Proc. 5th
Int.
Conf. on Modeling of Casting, Welding and Advanced Solidification Processes, 1991, M.
Rappaz, M.R. Ozgu, and K.W. Mahin (eds.), TMS, pp. 279-284
14. Y.M. Won, T.J. Yeo, D.J. Seol, and K.H. Oh: Metall. Mater. Trans. B, 2000, vol. 31, pp.
779-794
15. M. Bellet, O. Cerri, M. Bobadilla, and Y. Chastel: Metall. Mater. Trans. A, 2009, vol. 40,
pp. 2705-2717
16. M. Rappaz, J.M. Drezet, and M. Gremaud: Metall. Mater. Trans. A, 1999, vol. 30, pp.
449-456
17. H. Sato, T. Kitagawa, K. Murakami, and T. Kawawa: Tetsu to Hagane, 1975, vol. 61,
S471
18. K. Miyamura, A. Ochi, K. Kanamaru, and N. Kaneko: Tetsu to Hagane, 1976, vol. 62,
S482
19. K. Marukawa, M. Kawasaki, T. Kimura, and S. Ishimura: Tetsu to Hagane, 1978, vol. 64
S661
20. K. Narita, T. Mori, K. Ayata, J. Miyazaki, and M. Fujimaki: Tetsu to Hagane, 1978, vol.
64, S152
21. Y. Sugitani, M. Nakamura, H. Kawashima, and M. Kawasaki: Tetsu to Hagane, 1980, vol.
66, S193
22. M. Rappaz, A. Jacot, and W.J. Boettinger: Metall. Mater. Trans. A, 2003, vol. 34, pp. 467-
479
23. N. Wang, S. Mokadem, M. Rappaz, and W. Kurz: Acta Materialia, 2004, vol. 52, pp.
3173-3182
24. H. Fujii, T. Ohashi, and T. Hiromoto: Tetsu to Hagane, 1976, vol.62 , S484
25. T. Matsumiya, M. Ito, H. Kajioka, S. Yamaguchi, and Y. Nakamura: ISIJ Int, 1986, vol.
26, pp. 540-546
26. Q. Chen and B. Sundman: Mater. Trans., 2002, vol. 43, pp. 551-559
27. M. Hillert: Phase Equilibria, Phase Diagrams and Phase Transformations, Cambridge
University, 1998
28. T. Koshikawa, C.A. Gandin, M. Bellet, H. Yamamura, and M. Bobadilla: ISIJ Int, 2014,
vol. 54, pp. 1274-1282

16
29. T. Carozzani, C.A. Gandin, H. Digonnet, M. Bellet, K. Zaidat, and Y. Fautrelle: Metall.
Mater. Trans. A, 2013, vol. 44, pp. 873-887
30. C.A. Gandin: Acta Mater., 2000, vol. 48, pp. 2483-2501
31. H. Fujii, T. Ohashi and T. Hiromoto: Tetsu to Hagane, 1976, vol.62 , pp. 1813-1822
32. M. Bellet and V.D. Fachinotti: Comput. Meth. Appl. Mech. Eng., 2004, vol. 193, pp. 4355-
4381
33. M. Bellet, O. Jaouen, and I. Poitrault: Int. J. Num. Meth. Heat Fluid Flow, 2005, vol. 15,
pp. 120-142
34. B.G. Thomas and M. Bellet: Modeling of stress, distortions and hot tearing, In ASM
Handbook Volume 15: Casting, Division 4: Modeling and Analysis of Casting Processes,
American Society of Metals, 2008, pp. 449-461
35. T. Koshikawa, M. Bellet, H. Yamamura, and M. Bobadilla: SteelSim2013, 5th
Int. Conf.
on Modelling and Simulation of Metallurgical Processes in Steelmaking, Ostrava, Czech
Republic, September 10-12, 2013, DVD published by the Czech metallurgical Society, 9 pages
36. Iron and Steel Institute of Japan: Mechanical behavior in Continuous Casting, ISIJ, 1985,
NCID:BN03702225 (Citation Information by National institute of informatics: CiNii)
37. A. Palmaers, A. Etienne, and J. Mignon: Stahl und Eisen, 1979, vol. 99, pp. 1039-1050
38. P. Shi: TCS steels/Fe-alloys database V6.0 Thermo-Calc Software AB, Stockholm,
Sweden, 2008
39. Thermo-Calc, TCCS manuals Thermo-Calc software AB, Stockholm, Sweden, 2013
40. British Iron and Steel Research Association: Physical constants of some commercial steels
at elevated temperatures (based on measurements made at the National Physical Laboratory,
Teddington), Butterworths Scientific Publications, 1953
41. G. Lesoult, C.A. Gandin, and N.T. Niane: Acta. Mater., 2003, vol. 51, pp. 5263-5283
42. V.D. Fachinotti, S. Le Corre, N. Triolet, M. Bobadilla, and M. Bellet: Int. J. Num. Meth.
Eng., 2006, vol. 67, pp. 1341-1384
43. T. Koshikawa, M. Bellet, C.A. Gandin, H. Yamamura, and M. Bobadilla: Proc. MCWASP
XIV, 14th
Int. Conf. on Modeling of Casting, Welding and Advanced Solidification Processes,
Awaji Island, Japan, 21-26 June 2015, H. Yasuda (ed.), IOP Conference Series: Materials
Science and Engineering 84 012096, 8 pages
17
Tables
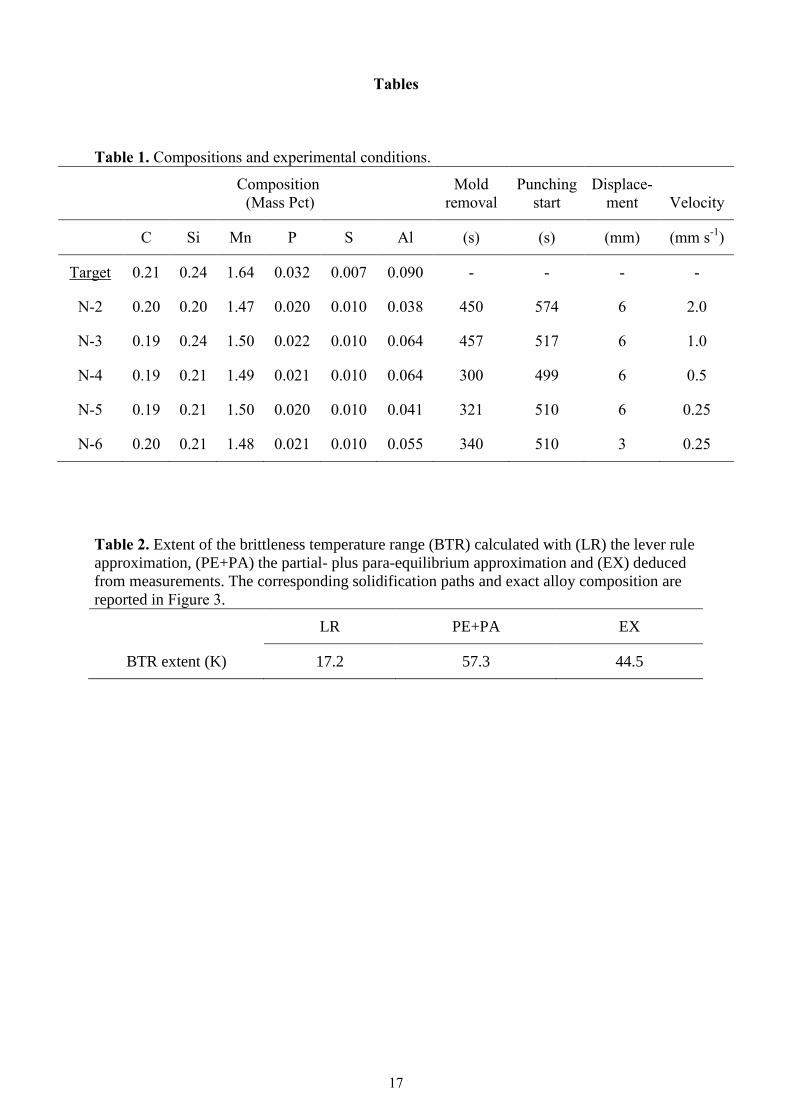
Table 1. Compositions and experimental conditions.
Composition
(Mass Pct)
Mold
removal
Punching
start
Displace-
ment Velocity
C Si Mn P S Al (s) (s) (mm) (mm s-1
)
Target 0.21 0.24 1.64 0.032 0.007 0.090 - - - -
N-2 0.20 0.20 1.47 0.020 0.010 0.038 450 574 6 2.0
N-3 0.19 0.24 1.50 0.022 0.010 0.064 457 517 6 1.0
N-4 0.19 0.21 1.49 0.021 0.010 0.064 300 499 6 0.5
N-5 0.19 0.21 1.50 0.020 0.010 0.041 321 510 6 0.25
N-6 0.20 0.21 1.48 0.021 0.010 0.055 340 510 3 0.25
Table 2. Extent of the brittleness temperature range (BTR) calculated with (LR) the lever rule
approximation, (PE+PA) the partial- plus para-equilibrium approximation and (EX) deduced
from measurements. The corresponding solidification paths and exact alloy composition are
reported in Figure 3.
LR PE+PA EX
BTR extent (K) 17.2 57.3 44.5
18
Figures
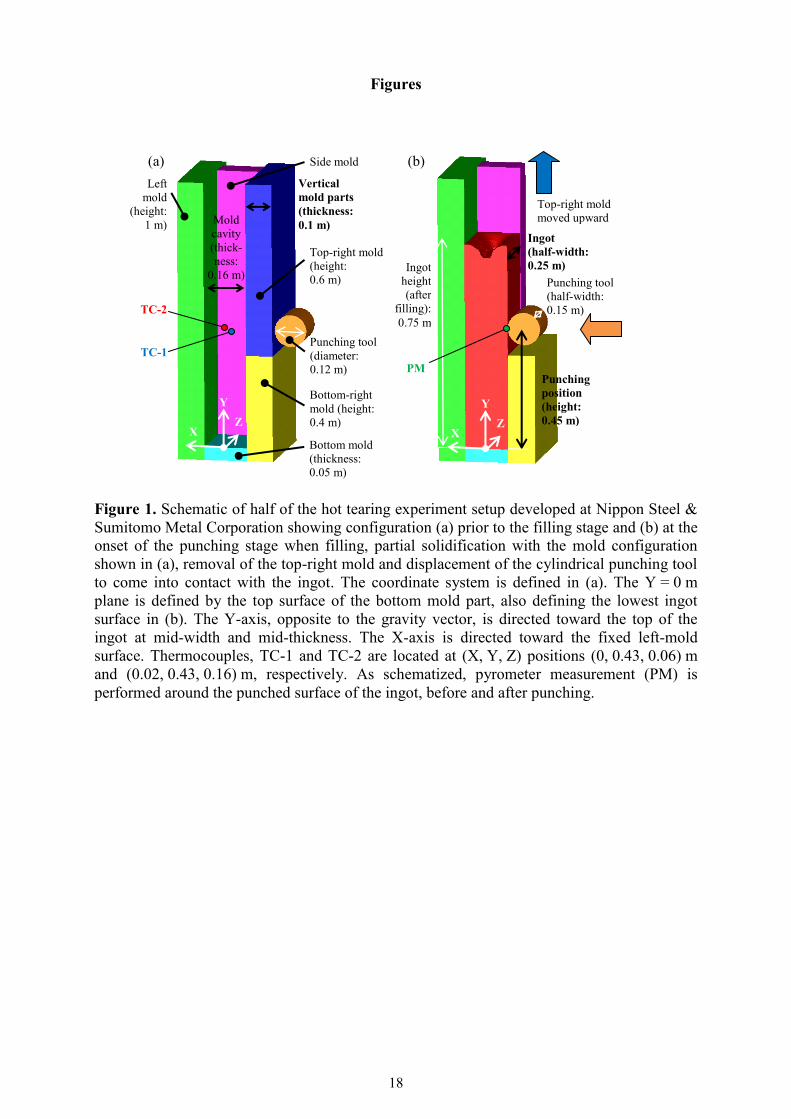
Figure 1. Schematic of half of the hot tearing experiment setup developed at Nippon Steel &
Sumitomo Metal Corporation showing configuration (a) prior to the filling stage and (b) at the
onset of the punching stage when filling, partial solidification with the mold configuration
shown in (a), removal of the top-right mold and displacement of the cylindrical punching tool
to come into contact with the ingot. The coordinate system is defined in (a). The Y = 0 m
plane is defined by the top surface of the bottom mold part, also defining the lowest ingot
surface in (b). The Y-axis, opposite to the gravity vector, is directed toward the top of the
ingot at mid-width and mid-thickness. The X-axis is directed toward the fixed left-mold
surface. Thermocouples, TC-1 and TC-2 are located at (X, Y, Z) positions (0, 0.43, 0.06) m
and (0.02, 0.43, 0.16) m, respectively. As schematized, pyrometer measurement (PM) is
performed around the punched surface of the ingot, before and after punching.
Punching tool
(half-width:
0.15 m)
Punching tool
(diameter:
0.12 m)
Mold
cavity
(thick-
ness:
0.16 m)
Left
mold
(height:
1 m)
Top-right mold
(height:
0.6 m)
Bottom-right
mold (height:
0.4 m)
Ingot
(half-width:
0.25 m)
Punching
position
(height:
0.45 m)
Top-right mold
moved upward
(a) (b)
Bottom mold
(thickness:
0.05 m)
Side mold
Ingot
height
(after
filling):
0.75 m TC-2
TC-1
PM
X
Y
Z X
Y
Z
Vertical
mold parts
(thickness:
0.1 m)
19
(a)
(b)
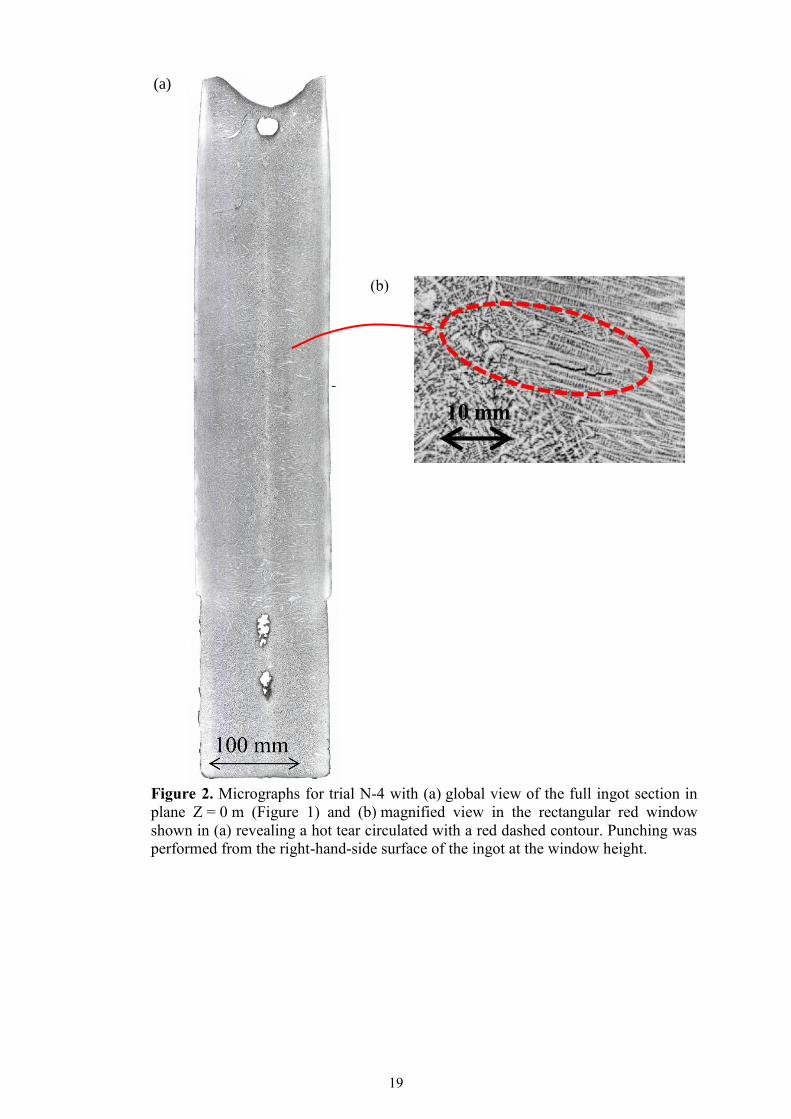
Figure 2. Micrographs for trial N-4 with (a) global view of the full ingot section in
plane Z = 0 m (Figure 1) and (b) magnified view in the rectangular red window
shown in (a) revealing a hot tear circulated with a red dashed contour. Punching was
performed from the right-hand-side surface of the ingot at the window height.

20
0.0 0.2 0.4 0.6 0.8 1.01670
1690
1710
1730
1750
1770
1790
Tem
per
atu
re (
K)
Solid fraction (-)
LR
PE+PA
EX
Figure 3. Three solidification paths for targeted alloy composition (Table 1)
corresponding to (blue curve, LR) the lever rule approximation, (red curve,
PE+PA) a combination of the partial- and para-equilibrium approximations [26, 27]
and (green marks with error bars, EX) experimental investigation [28].

21
(a)
0.00 0.02 0.04 0.06 0.080
5
10
15
20
25
30
T=1573 K
T=1373 K
Str
ess
(MP
a)
Strain (-)
T=1273 K
(b)
0.00 0.02 0.04 0.06 0.080
2
4
6
8
10
T=1673 K
Str
ess
(MP
a)
Strain (-)
(c)
1200 1300 1400 1500 1600 1700 1800 19000
50
100
K
H
Vis
cop
last
ic c
on
sist
ency
(M
Pa
sm)
Str
ain
har
den
ing
co
effi
cien
t (M
Pa)
Temperature (K)
0.0
0.2
0.4
0.6
0.8
1.0
m
n
Str
ain
rat
e se
nsi
tiv
ity
(-)
Str
ain
sen
siti
vit
y (
-)
Figure 4. Strain-stress ( - ) curves established by means of (marks) high temperature
tensile tests [36, 37] and (curves) calculations based on equation (12) for (a) 3 temperatures
from 1273 K to 1573 K at constant strain rate, 6.67×10⁻⁴
s-1
, (b) at a higher temperature,
1673 K, for 3 strain rates in range 5.58×10⁻⁵
s-1
to 2.78×10⁻³
s-1
and (c) obtained constitutive
parameters as a function of temperature.
14s1067.6
13s1078.2
14s1078.2
15s1058.5

22
(a)
200 500 800 1100 1400 1700 20000
400
800
1200
1600
2000
Specific heat
Sp
ecif
ic h
eat
(J k
g-1
K-1
)
Temperature (K)
6800
7000
7200
7400
7600
7800
8000
Density
Den
sity
(k
g m
-3)
(b)
200 500 800 1100 1400 1700 20000
20
40
60
Th
erm
al c
on
du
ctiv
ity
(W
m-1
K-1
)
Temperature (K)
Figure 5. Temperature-dependent average properties for thermomechanical simulations
including (a) specific heat per unit mass Pc and density while assuming full equilibrium
[38, 39] and (b) thermal conductivity [40].
23
0 200 400 600 800 10001100
1200
1300
1400
1500
1600
1700
1800
1900
TC-1 (Predicted)
TC-2 (Predicted)
PM (Predicted)
Pouring end
TC-1 (Measured)
TC-2 (Measured)
PM (Measured)
Tem
per
atu
re (
K)
Elapsed time from pouring (s)
Punching
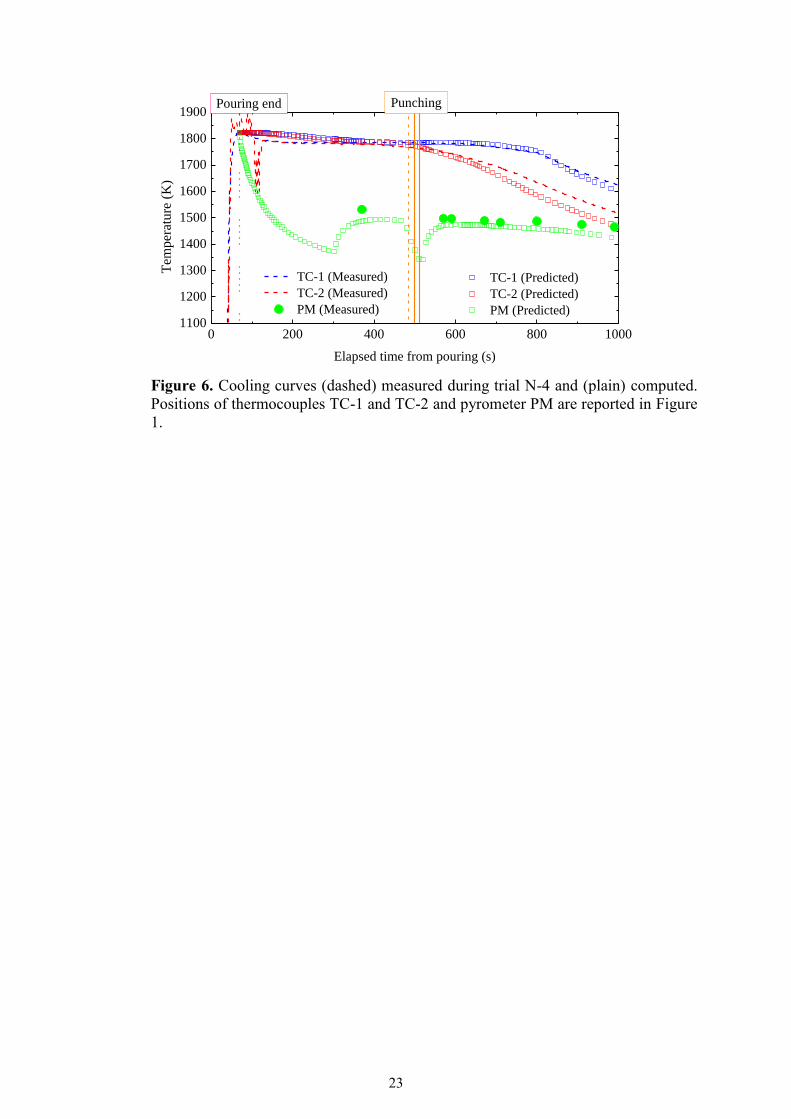
Figure 6. Cooling curves (dashed) measured during trial N-4 and (plain) computed.
Positions of thermocouples TC-1 and TC-2 and pyrometer PM are reported in Figure
1.

24
(N-4)
490 500 510 520 530 5400
10
20
30
40
50
60
70
80
90
Measured
LR
PE+PA
EX
Forc
e (k
N)
Elapsed time from pouring (s)
Punching
(N-5)
490 500 510 520 530 5400
10
20
30
40
50
60
70
80
90 Punching Measured
LR
PE+PA
EX
Forc
e (k
N)
Elapsed time from pouring (s)
(N-6)
490 500 510 520 530 5400
10
20
30
40
50
60
70
80
90 Punching
Measured
LR
PE+PA
EX
Forc
e (k
N)
Elapsed time from pouring (s)
Figure 7. Time evolution of the reaction force due to the displacement of the
punching tool during trial N-4, N-5 and N-6. Curves correspond to (black marks)
measurements thanks to hydraulic system used to impose the movement of the
cylindrical tool and (curves) simulations. Results are presented as a function of the 3
solidification paths presented in Figure 3.
25
Time (s) (a) T (K) (b) I (MPa) (c) WYSO
HTF
499 s
511 s
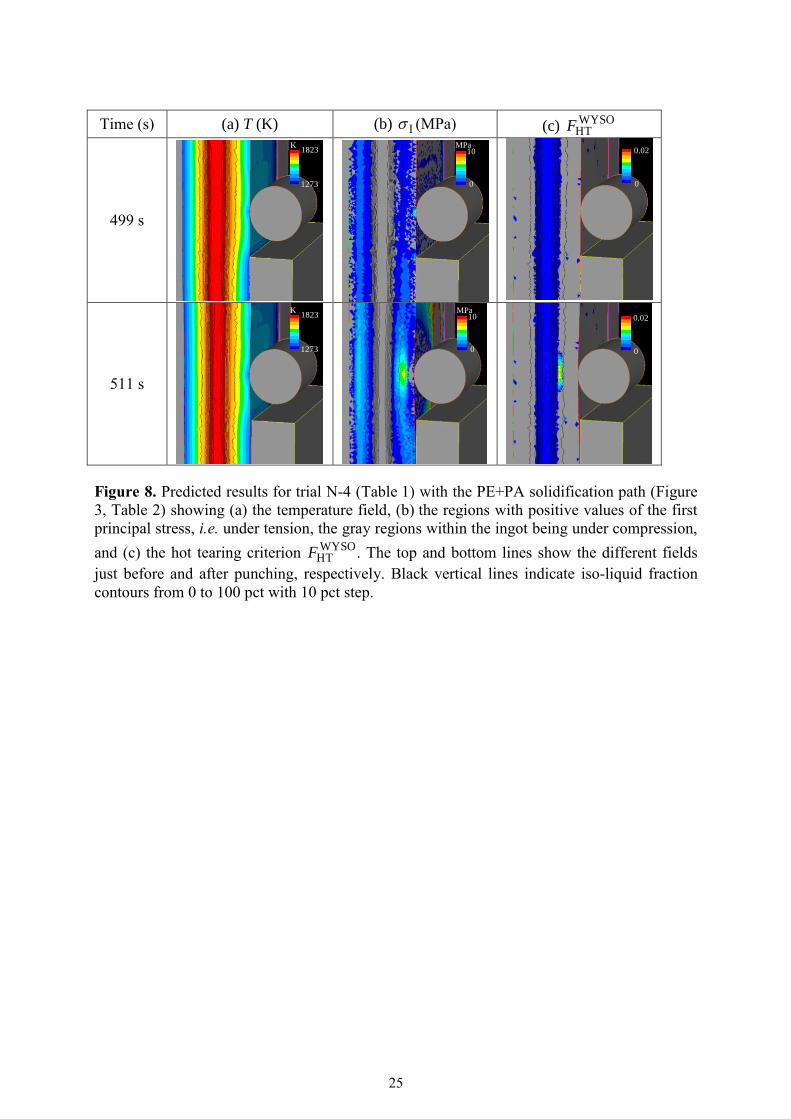
Figure 8. Predicted results for trial N-4 (Table 1) with the PE+PA solidification path (Figure
3, Table 2) showing (a) the temperature field, (b) the regions with positive values of the first
principal stress, i.e. under tension, the gray regions within the ingot being under compression,
and (c) the hot tearing criterion WYSO
HTF . The top and bottom lines show the different fields
just before and after punching, respectively. Black vertical lines indicate iso-liquid fraction
contours from 0 to 100 pct with 10 pct step.
1823
1273
K10
0
MPa
0
0.02
1823
1273
K10
0
MPa
0
0.02

26
N-4 N-5 N-6
0.08 0.06 0.04 0.02 0.00-0.01
0.00
0.01
0.02 LR
PE+PA
EX
FW
YS
O
HT
(-)
Distance from the ingot surface of the punch side (m)
0
2
4
6
8
10
Crack
Num
ber
of
hot
tear
s (-
)
0.08 0.06 0.04 0.02 0.00-0.01
0.00
0.01
0.02 LR
PE+PA
EX
FW
YS
O
HT
(-)
Distance from the ingot surface of the punch side (m)
0
2
4
6
8
10
Crack
Num
ber
of
hot
tear
s (-
)
0.08 0.06 0.04 0.02 0.00-0.01
0.00
0.01
0.02
LR
PE+PA
EX
FW
YS
O
HT
(-)
Distance from the ingot surface of the punch side (m)
0
2
4
6
8
10
Crack
Num
ber
of
hot
tear
s (-
)
Figure 9. Magnified micrographs for trials N-4, N-5 and N-6 on the top. In all cases, hot tears are observed and circled with dashed red contours. Note
that the top circle crack in N-4 is the same as the one shown in Figure 2(b). Also, the view being limited, not all cracks found are shown. Profiles
along the ingot thickness for (black curve, right-hand-side legend) the number of hot tears and (colored curves, left-hand-side legend) the hot tearing
criterion WYSO
HTF on the bottom. Results are presented as a function of the 3 solidification paths presented in Figure 3 for trials N-4, N-5 and N-6.

27
1E-5 1E-4 1E-3 0.010.00
0.01
0.02
0.03
N-6
N-5 N-4
N-3
N-2
PE+PA
EX LR
Less crack risk
LR
PE+PA
EX
Cum
ula
ted s
trai
n (
-)
Perpendicular strain rate (s-1)
Higher crack risk
Figure 10. Computed cumulated strain BTR
td as a function of the strain rate
perpendicular to the temperature gradient calculated when passing through the BTR.
Values are taken from the WYSO
HTF profile at the punching height, an example being
shown in Figure 9. The three continuous curves indicate the strain limit c
(Eq. (13)).

28
0.000 0.005 0.010 0.015 0.020 0.0250
10
20
30
40
50
60
N-6
N-5
N-4
N-3
N-2
Cum
ula
ted h
ot
tear
ing l
ength
(m
m)
FWYSO
HT based on PE+PA (-)
Figure 11. Cumulated hot tearing length measured as a function of the calculated
value of the maximum hot tearing criterion WYSO
HTF using the PE+PA solidification
path.