STUDY OF COMPRESSIVE STRENGTH OF JOINTED ROCKMASS · 2017-02-02 · LIST OF TABLES Pages 2.0...
29
STUDY OF COMPRESSIVE STRENGTH OF JOINTED ROCKMASS A PROJECT REPORT SUBMITTED IN PARTIAL FULFILLMENT OF THE REQUIREMENTS FOR THE DEGREE OF Bachelor of Technology in Civil Engineering By Supriy(10301030) Devi Prasad Mishra(10301035) Department of Civil Engineering National Institute of Technology Rourkela 2007
Transcript of STUDY OF COMPRESSIVE STRENGTH OF JOINTED ROCKMASS · 2017-02-02 · LIST OF TABLES Pages 2.0...

STUDY OF COMPRESSIVE STRENGTH OF JOINTED
ROCKMASS
A PROJECT REPORT SUBMITTED IN PARTIAL FULFILLMENT OF THE
REQUIREMENTS FOR THE DEGREE OF
Bachelor of Technology in
Civil Engineering
By
Supriy(10301030) Devi Prasad Mishra(10301035)
Department of Civil Engineering National Institute of Technology
Rourkela 2007

STUDY OF COMPRESSIVE STRENGTH OF JOINTED
ROCKMASS
A PROJECT REPORT SUBMITTED IN PARTIAL FULFILLMENT OF THE
REQUIREMENTS FOR THE DEGREE OF
Bachelor of Technology in
Civil Engineering
By
Supriy(10301030) Devi Prasad Mishra(10301035)
Under the Guidance of
Prof. (Dr.) N. Roy
Department of Civil Engineering National Institute of Technology
Rourkela 2007

National Institute of Technology
Rourkela
CERTIFICATE
This is to certify that the thesis entitled, “STUDY OF COMPRESSIVE STRENGTH OF
JOINTED ROCKMASS” submitted by Sri Supriy and Sri Devi Prasad Mishra in partial fulfillment the
requirements for the award of Bachelor of Technology Degree in Civil Engineering at National
Institute of Technology, Rourkela (Deemed University) is an authentic work carried out by them under
my supervision and guidance.
To the best of my knowledge, the matter embodied in the thesis has not been submitted to any
other University / Institute for the award of any Degree or Diploma.
Date: Prof. (Dr.) N. Roy Dept. of Civil Engineering
National Institute of Technology
Rourkela - 769008
Acknowledgement
We would like to make our deepest appreciation and gratitude to Prof(Dr.) N. Roy for his
invaluable guidance, constructive criticism and encouragement during the course of this project.
We would also like to thank the head of the department, Civil engineering Prof. (Dr.) K.C.
Patra for his kind support.
We would like to express our gratitude to Prof. (Dr.).C.R. Patra (Civil engg. dept) for giving
the permission to use the Geo Technical Laboratory.
Grateful acknowledgement is made to all the staff and faculty members of Civil Engineering
Department, National Institute of Technology, Rourkela for their encouragement. I would also like to
extend my sincere thanks to all my fellow graduate students for their time, invaluable suggestions and
help. In spite of the numerous citations above, the author accepts full responsibility for the contents
that follow.
Supriy Devi Prasad Misra
10301030 10301035
B.Tech 8th semester B.Tech 8th semester
Civil Engineering Civil Engineering

CONTENTS Page No
Abstract i List of Figures ii List of Tables iii Nomenclature iv Chapter 1 GENERAL INTRODUCTION 1
1.1 Introduction 2
Chapter 2
LITERATURE REVIEW
2.1 Rock and Rock mass 5
2.2 Intact Rock mass 7
2.3 Proposed strength criterion 10
2.4 Effect of confining pressure, Temperature, Rate of loading 11
2.5 Rock discontinuities 12
2.6 Rock intensity 13
2.7 Orientation of joints 15
2.8 Joint roughness 15
2.9 Joint roughness coefficient 18
2.10 Scale effects 20
2.11 Strength criterion for anisotropic rocks 21
2.12 Influence of a single plane of weakness 23
2.13 Study on planar joints 25
2.14 Study on rough joints 28
2.15 Influence of number and location of joints 28
2.16 Parameters characterizing type of anisotropy 31
2.17 U- type anisotropy 32
2.18 Shoulder type anisotropy 32
2.19 Undulatory type anisotropy 35
2.20 Deformation behaviour of rock masses 35

Chapter 3
3.1
LABORATORY INVESTIGATION
3.2 Materials tested 39
3.3 Preparation of specimen 39
3.4 Curing 40
3.5 Introduction of anisotropy 40
Chapter 4
RESULTS & DISCUSSION
4.1 Roughness parameter 43
4.2 Uniaxial compression test results 44
4.2(a) Intact specimen 44
4.2(b) Jointed specimen 45
Chapter 5 CONCLUSIONS 47
REFERENCES 49

ABSTRACT
Rock masses are hardly present in intact state in nature but are most commonly found in
jointed form. In-situ test for determining the behaviour of jointed rock mass is costly and time
consuming, hence attempts are being made by researchers to predict the strength and deformation
behaviour of jointed rock masses under controlled laboratory conditions.
Considering its implications experimental study has been undertaken for determining strength
characteristics of jointed rock mass. Models have been prepared using plaster of paris and different degree
of anisotropy have been induced by inducing joints in them at orientation (β) varying from 0° to 90°.
The parameters studied are-
i) Variation of compressive strength ratio (σcr= σcj /σci) of Plaster of Paris under
unconfined conditions with joint factor.
ii) Variation of jointed cohesion (Cj), friction angle Φj and roughness parameters
r=tanΦj.
where,
σcj =Uniaxial compressive strength for intact mass.
σcj =Uniaxial compressive strength for jointed mass.
n= Inclination parameter
r= Joint strength
The values for cohesion Cj for jointed specimen of Plaster of Paris was found to be 0.16 MPa and the
value of friction angle Φj was found to be 39°. Hence the roughness parameter ( r= tan Φj ) comes
out to be .809 for the specimen of Plaster of Paris tested.
The optimum value of uniaxial compressive strength (σ ci) evaluated from the above test was found to
be 11.00 MPa.
Comparison also has to be made between the observed experimental values and the empirical relations
given by various researchers previously.

LIST OF FIGURES Pages
2.1 Rock mass 5
2.2 Joint inclination factor,n for different β 16
2.3 View of typical anisotropic sample 22
2.4 Variation of σc with β 27
2.5 Types of joints 28
2.6 Types of joints studied 29
2.7 U-type anisotropy 32
2.8 Shoulder type anisotropy 33
3.1 Normal stress vs Shear stress 41
3.2 Water content vs Uniaxial compressive stress 42
3.3 Variation of σcr vs Jf for single jointed specimen 44
3.4 Variation of σcj vs Jf for single jointed specimen 44
3.5 Variation of σcr vs Jf for single jointed specimen(experimental and predicted) 45

LIST OF TABLES Pages
2.0 Factors affecting rock strength 7
2.2 Values of inclination parameter n 14
2.3 Physical and engineering properties of plaster of paris used for testing 25
2.4 Modes of failure of planar joint specimen 26
2.5 Values of constants A,B, and C for estimating σcj 28
3.1 Normal stress vs Shear stress 41
3.2 Water content vs Uniaxial compressive stress 42
3.3 Variation of σcr vs Jf for single jointed specimen 43
3.4 Variation of σcr vs Jf for single jointed specimen(experimental and predicted) 45

Chapter 1
GENERAL INTRODUCTION
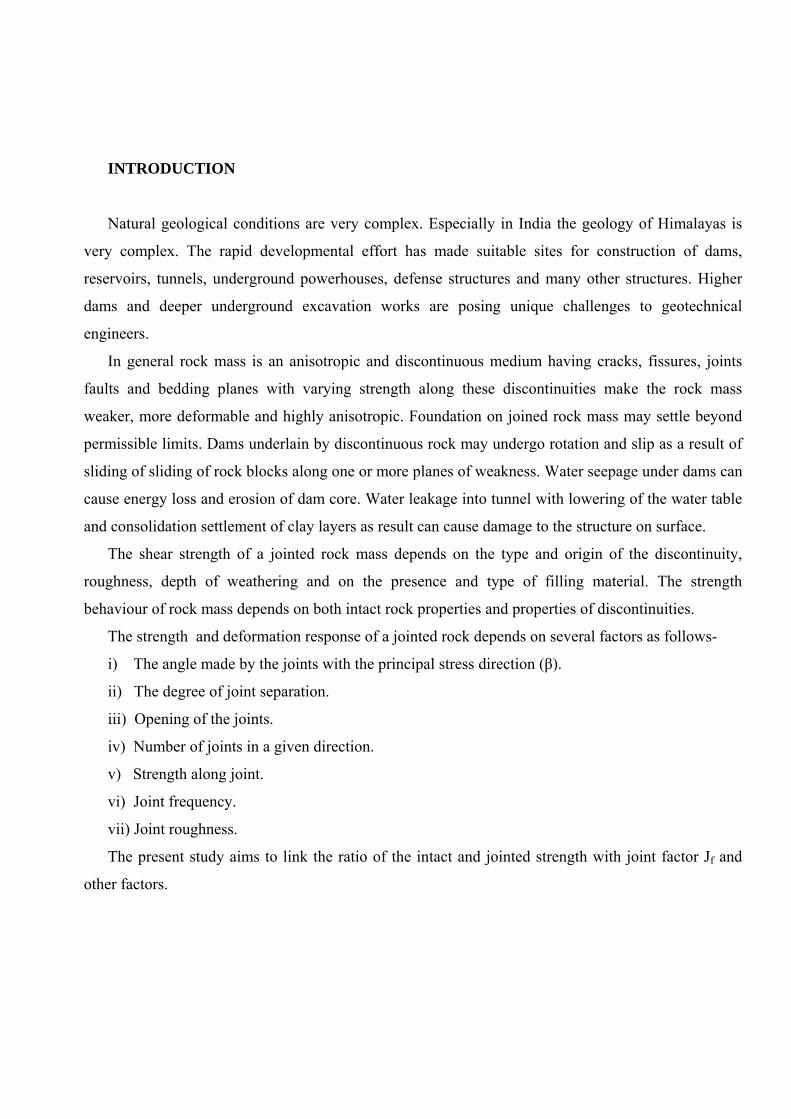
INTRODUCTION
Natural geological conditions are very complex. Especially in India the geology of Himalayas is
very complex. The rapid developmental effort has made suitable sites for construction of dams,
reservoirs, tunnels, underground powerhouses, defense structures and many other structures. Higher
dams and deeper underground excavation works are posing unique challenges to geotechnical
engineers.
In general rock mass is an anisotropic and discontinuous medium having cracks, fissures, joints
faults and bedding planes with varying strength along these discontinuities make the rock mass
weaker, more deformable and highly anisotropic. Foundation on joined rock mass may settle beyond
permissible limits. Dams underlain by discontinuous rock may undergo rotation and slip as a result of
sliding of sliding of rock blocks along one or more planes of weakness. Water seepage under dams can
cause energy loss and erosion of dam core. Water leakage into tunnel with lowering of the water table
and consolidation settlement of clay layers as result can cause damage to the structure on surface.
The shear strength of a jointed rock mass depends on the type and origin of the discontinuity,
roughness, depth of weathering and on the presence and type of filling material. The strength
behaviour of rock mass depends on both intact rock properties and properties of discontinuities.
The strength and deformation response of a jointed rock depends on several factors as follows-
i) The angle made by the joints with the principal stress direction (β).
ii) The degree of joint separation.
iii) Opening of the joints.
iv) Number of joints in a given direction.
v) Strength along joint.
vi) Joint frequency.
vii) Joint roughness.
The present study aims to link the ratio of the intact and jointed strength with joint factor Jf and
other factors.

Chapter 2
LITERATURE REVIEW

Rocks and their properties:
A better definition of rock may be given as granular, allotropic , heterogeneous technical substance
which occur naturally and which are composed of grains, cemented together by mechanical bond, but
ultimately by atomic, ionic and molecular bond within the grains Thus by “rock’ as an engineer
means a firm and coherent substance which normally can’t be excavated by manual methods alone.
Thus like any other material a rock is frequently assumed to lx homogeneous and isotropic but in most
cases it is not so.
A homogeneous substance is one in which a small element has the same property as that of whole
substances and a heterogeneous substance has different properties of the element within the body .An
isotropic material is one that has the same property in every direction at any point. Based on the mode
of origin rocks are classified into three groups such as igneous, sedimentary and metamorphic rocks
.Igneous rocks are those rocks which are formed by the solidification of molten magma originating in
the interior of the earth. When a rock or earth crust is weathered or decomposed and transported or
deposited and subsequently consolidated and cemented partly or fully then the new products is known
as sedimentary rock .Igneous rock which are formed at depth are known as igneous rocks and formed
from lava and found mainly at the surface, are known as volcanic igneous rock. Information regarding
the type of rock such as igneous, sedimentary or metamorphic is not sufficient when an engineering
structure will be made on the rock mass. The rock may be igneous one, but it may consist of a lot of
discontinuous in the mass which may make it unable to withstand high stress as due to structure.
Rock and rock mass:
An intact rock is considered to be an aggregate of mineral, without any structural defects and also such
rocks arc treated as isotropic, homogeneous and continuous. Their failures can be classified as brittle
which implies a sudden reduction in strength when a limiting stress is exceeded.
Intact Rock mass:
Strength of intact rock mass
Strength of intact rock mass is influenced by the following factors
(1) Geological
(2) Lithological
(3) Physical

(4) Mechanical
(5) Environmental factors
When rock is on the earth surface there is no conforming pressure. If the rock mass is present below
the earth surface, conforming pressure on the strength of the rock has investigated extensively.
Various investigations have been conducted to study the influence of conforming pressures show a
non-linear variation of the strength with conforming pressures. In important aspect of rock behaviour
under uniaxial condition is the change in behaviour from brittle to ductile nature at the conforming
pressures.
Uniaxial Compressive Strength:
The uniaxial compressive strength of rock mass is represented in a non-dimensional form as the ratio
of compressive strength of jointed rock to that of intact rock . The uniaxial compressive strength ratio
is expressed as
σcr =σcj/σci where σcj= uniaxial compressive strength of jointed rock and σci= uniaxial strength of intact rock. The
uniaxial compressive strength ratio of the experiment data should be plotted against the joint factor.
The joint factor for the experimental specimens should be estimated based on the joint orientation,
joint strength and joint spacing. Based on the statistical analysis of the data, empirical relationship for
the uniaxial compressive strength ratio as a function of a joint factor (Jf) is derived.
Elastic Modulus
Elastic modulus is expressed as the tangent modulus at 50% of the failure stress considered in this
analysis. The elastic modulus ratio expressed as
Er =Ej/Ei
Where Ej is the tangent modulus of joined rock
Ei is the tangent modulus of intact rock.
Strength criterion of Anisotropic Rocks
Unlike isotropic rocks, the strength criteria of anisotropic rocks are more complicated because of
variation in i the orientation angle β. A number of empirical strength criteria have been proposed in the
recent past based on the classical Navier-Columb and Griffith’s criteria.
An idealized cylindrical specimen of anisotropic rock with an oblique plane weakness making an
angle β with the axis of major principal stress σ1 .The angle β is designated as the orientation angle.
Hock and Brown (1980) showed clearly that strength of all rock is maximum for β=0 to 90o and is
minimum for β=20 to 30o.
Influence of single plane of weakness:
In a laboratory test the orientation of plane weakness with respect to principal stress direction remains
unaltered. Variation of the orientation of this plane can only be achieved by obtaining cores of
direction. In a field situation either in foundations of darn around underground or open excavation the
orientation of joint system remains stationary but the direction of the principal stress rotates resulting
in a change in the strength of the rock mass.

Chapter 3
LABORATORY INVESTIGATION

Laboratory Testing: In this chapter the experimental investigation has been carried out to determine the shear the shear
strength of the rock joints are presented through sections, model testing parameter studies,
experimental setup and experimental study.
Material Tested:
Researches have been conducted on model materials so as to get uniform, identical or homogeneous
specimen in order 10 understand the failure mechanism, strength behavior. It is observed that the use
of plaster of Paris has been used as model material to simulate weak rock mass in the field. Many
researchers have used plaster of Paris as a model because of its ease in casting, flexibility, instant
hardening, low cost and easy availability. Any type of joint can he modeled by plaster of Paris. The
reduced strength in relation to actual rocks has made plaster of Paris one of the ideal materials for
modeling in Geotechnical Engineering.
Preparation of Specimen:
Commercially available plaster of Parts from local market has been procured. This plaster of Paris
powder produced by pulverizing partially burnt Gypsum is dull white in colour with smooth feel of
cement. T he water content, at which maximum density is to be arrived, is found out by conducting
number of trial tests at different percentage of water.
Fur the preparation of specimen 135 gm of plaster of Paris is mixed thoroughly with optimum
moisture content of water to form a uniform paste. The plaster of Paris specimen prepared by pouring
the plaster mix in the mould is vibrated in the vibrating machine for 2 minute for proper compaction
and to avoid presence of air saps. After this
it is allowed to set for five minutes. After hardening the specimen is kept at room temperature of 48
hours.
Curing:
After keeping in the sunlight and oven the specimens were placed inside desiccators containing
concentrated Sulphuric Acid. This is done to maintain the relative humidity in the range of 40 to 60%.
This humidity is maintained constant in desiccators by keeping a solution of concentrated Sulphuric
Acid of 47.7 cc with distilled water of 52.3cc. Specimen were allowed to cure inside the desiccators
till constant weight to be attained (about 15 days)

Introduction of Anisotropy:
In the rock mass joints planes may be oriented in different directions with respect to the stress field
and this may vary from place to place. To, investigate these aspects in this study single plane of
weakness and its inclination with respect to major principal stress direction has been considered.
31 .5Making Joints in Specimens:
The following instruments are used for making joints in the plaster of Paris
1) ‘V’ Block
2) Light weight Hammer
3) Chisel
4) Scale
5) Pencil
6) Protractor

Single Joint Specimen

Double Joint Specimen

Chapter 4
RESULTS AND DISCUSSION

Result and Discussions
The strength characteristics of intact and jointed specimen of plaster of Paris has been presented and
discussed. The experimental finding has been compared with the empirical relationship suggested by
Arora (1987). The findings of laboratory tests conducted under unconfined conditions have been
extended to predict the strength of jointed mass.
Roughness Parameter
Shear test was conducted at different normal stresses. The value of shear stress for different values of
normal stress on jointed specimen of Plaster of Paris in direct shear test is given below:
Table 3.1
Fig. 3.1
Normal stress vs Shear stress
0
0.05
0.1
0.15
0.2
0.25
0.3
0.35
0 0.05 0.1 0.15 0.2 0.25 0.3 0.35
Normal stress(MPa)
Shea
r str
ess(
MPa
)
Normal stress(MPa) 0.1 0.2 0.3
Shear stress(MPa) 0.22 0.28 0.32
Cj=0.16 MPa Φj=39°

The values for cohesion Cj for jointed specimen of Plaster of Paris was found to be 0.16 MPa and the
value of friction angle Φj was found to be 39°. Hence the roughness parameter ( r= tan Φj ) comes
out to be .809 for the specimen of Plaster of Paris tested.
Uniaxial Compression Test Results:
Intact Specimen
The variation of stress as obtained in uniaxial compression test for the intact specimen of Plaster of
Paris for different values of water content is illustrated below:
Table 3.2
Water content (%) 35 37 38 40 42 44 45
Uniaxial Compressive Strength(MPa) 9.60 10.02 10.70 11.00 10.66 9.70 8.05
Fig 3.2
Water content vs Uniaxial compressive stress
0
2
4
6
8
10
12
0 5 10 15 20 25 30 35 40 45 50
Water content(%)
Com
pres
sive
str
engt
h(M
Pa)
The optimum value of uniaxial compressive strength (σ ci) evaluated from the above test was found to
be 11.00 MPa.

Jointed Specimen
The uniaxial compressive strength for jointed specimen (σ cj) is evaluated .After obtaining the values
of σ cj it was observed that the strength of Plaster of Paris was minimum for orientation angle β=30°.
The values of σ cr with different joint orientation angles (β) were obtained by using the relationship:
σcr= σcj /σci
The value of joint factor (Jf) has been evaluated by using the relationship:
Jf =Jn/(n.r)
Arora(1987) has suggested the following empirical relationship between Jf and σcr :
σcr=e-.008Jf
The variation between σcr and Jf is illustrated for single joints. Also a comparative study of the
experimental tests and the empirical relationship given by Arora is provided.
Table 3.3
Joint type in degrees Jn n r= tan Φj Jf=Jn/(n.r) σcj (MPa) σci
(MPa)
σcr= σcj /σci
0 13 0.81 0.809 19.83 9.23 11.00 0.83
10 13 0.46 0.809 34.93 8.85 11.00 0.80
20 13 0.105 0.809 153.04 4.30 11.00 0.39
30 13 0.046 0.809 349.33 3.24 11.00 0.29
40 13 0.071 0.809 226.32 4.65 11.00 0.42
50 13 0.306 0.809 52.51 7.32 11.00 0.66
60 13 0.465 0.809 34.55 8.33 11.00 0.75
70 13 0.634 0.809 25.34 8.98 11.00 0.81
80 13 0.814 0.809 19.74 9.54 11.00 0.86
90 13 1.00 0.809 16.06 10.12 11.00 0.92
It is clear that for β increasing from 0º to 90° the value of σcr goes on decreasing and attains a minimum
at β=30° and then increases again to attain a maximum value at β=90º.

Fig 3.3
Variation of σcr vs Jf
0
0.1
0.2
0.3
0.4
0.5
0.6
0.7
0.8
0.9
1
0 50 100 150 200 250 300 350 400
Joint factor
Com
pres
sive
str
engt
h ra
tio
Experimental valuesExpon. (Experimental values)
Fig 3.4
.
Variation of σcj vs Jf
0
2
4
6
8
10
12
0 50 100 150 200 250 300 350 400
Joint factor
Com
pres
sive
str
engt
h in
join
ted
rock
mas
s
Experimental valuesExpon. (Experimental values)
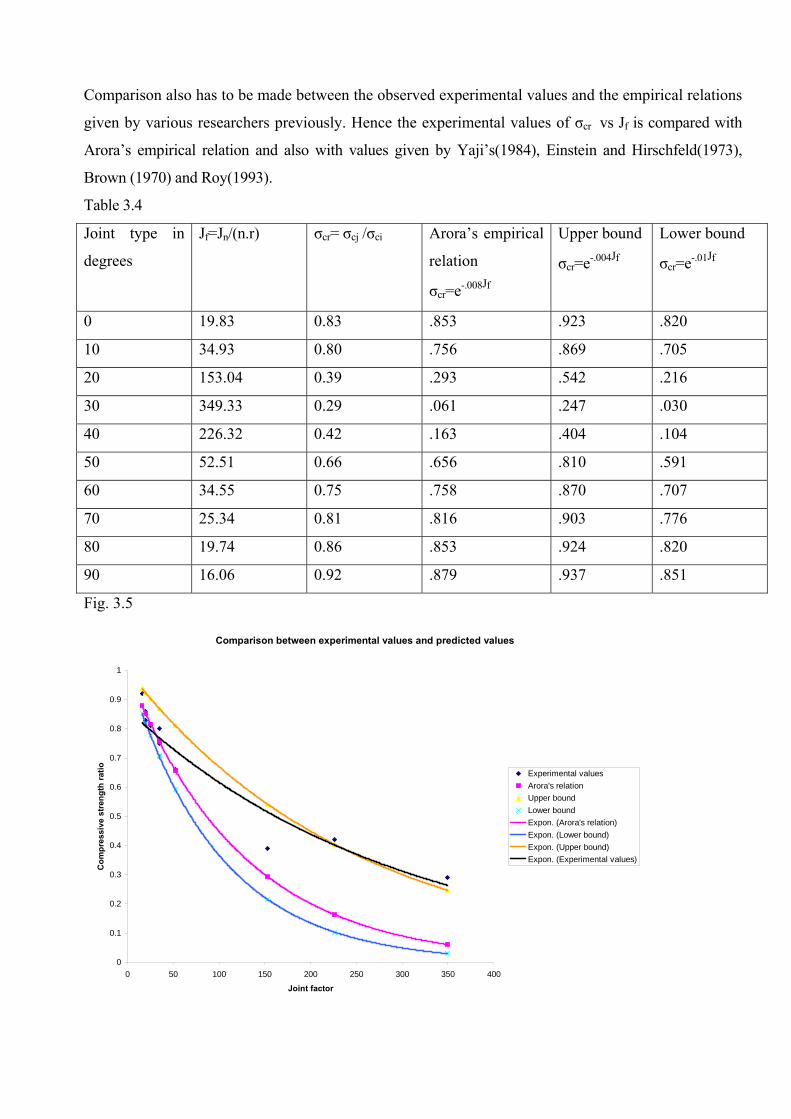
Comparison also has to be made between the observed experimental values and the empirical relations
given by various researchers previously. Hence the experimental values of σcr vs Jf is compared with
Arora’s empirical relation and also with values given by Yaji’s(1984), Einstein and Hirschfeld(1973),
Brown (1970) and Roy(1993).
Table 3.4
Joint type in
degrees
Jf=Jn/(n.r) σcr= σcj /σci
Arora’s empirical
relation
σcr=e-.008Jf
Upper bound
σcr=e-.004Jf
Lower bound
σcr=e-.01Jf
0 19.83 0.83 .853 .923 .820
10 34.93 0.80 .756 .869 .705
20 153.04 0.39 .293 .542 .216
30 349.33 0.29 .061 .247 .030
40 226.32 0.42 .163 .404 .104
50 52.51 0.66 .656 .810 .591
60 34.55 0.75 .758 .870 .707
70 25.34 0.81 .816 .903 .776
80 19.74 0.86 .853 .924 .820
90 16.06 0.92 .879 .937 .851
Fig. 3.5
Comparison between experimental values and predicted values
0
0.1
0.2
0.3
0.4
0.5
0.6
0.7
0.8
0.9
1
0 50 100 150 200 250 300 350 400
Joint factor
Com
pres
sive
str
engt
h ra
tio Experimental valuesArora's relationUpper boundLower boundExpon. (Arora's relation)Expon. (Lower bound)Expon. (Upper bound)Expon. (Experimental values)

Chapter 5
CONCLUSIONS

Conclusions
From the experimental analysis of the intact and jointed specimen of plaster of Paris the
following conclusions are drawn:
1) The uniaxial compressive strength of intact specimen of Plaster of Paris is found to be
11.00 MPa.
2) The strength of jointed specimen depends on the joint orientation β with respect to the
direction of major principal stress. The strength at β=30º is found to be minimum and the
strength at β=90º is found to be maximum.
Scope of future work:
1) The effect of temperature, confining pressure and rate of loading on the strength
characteristics can be studied.
2) The change in strength can be studied by introducing gouge in the joints.
3) Studies can be made by introducing multiple joints in varying orientation.
On the basis of above investigation one can find out the values of uniaxial compressive stress
of jointed rock mass without conducting extensive tests in the field but by a few simple laboratory
experiments.
It can also be possible to find out the values of σcj for different rock mass by conducting simple
laboratory tests. For this we have to take a photograph of the rock mass by remote sensing or aerial
photography and from that we can find out the nature of the joint and hence the values of σcj can be
predicted.

Reference
1. Dr. N. Roy, Dr. T. Ramamurthy, Dr. J.M. Kate, “An experimental study of engineering
behaviour of Jointed Mass in Uniaxial Compression”.
2. Arora V.K(1987),”strength and deformation behaviour of jointed rock“.
3. Ramamurthy , Arora V.K(1994) strength and modulus response of anisotropic rocks.
4. Verma B.P(1985),Rock mechanics for engineers.
5. Lama R.D and Vutukuri V.S(1978): Handbook on mechanical properties of rock vol:4 page
:80-86.
6. Yaji,R.K(1984)” Shear Strength and deformation of jointed rock”.