STUDY DESIGN, PROCEDURES, AND FORMS A …...Robinson Hollister (Swarthmore),Robert Levine (RAND),...
353
A PANEL STUDY OF INCOME DYNAMICS STUDY DESIGN, PROCEDURES, AND FORMS 1968 INTERVIEWING YEAR (WAVE I) A Report on Research in Process Under Contract to the Office of Economic Opportunity James N. Morgan James D. Smith SURVEY RESEARCH CENTER INSTITUTE FOR SOCIAL RESEARCH THE UNIVERSITY OF MICHIGAN ANN ARBOR, MICHIGAN 1969
Transcript of STUDY DESIGN, PROCEDURES, AND FORMS A …...Robinson Hollister (Swarthmore),Robert Levine (RAND),...

A P A N E L S T U D Y O F I N C O M E D Y N A M I C S
STUDY DESIGN, PROCEDURES, AND FORMS
1968 INTERVIEWING YEAR (WAVE I)
A Report on Research in Process Under Contract to the
Office of Economic Opportunity
James N. Morgan
James D. Smith
SURVEY RESEARCH CENTER
INSTITUTE FOR SOCIAL RESEARCHTHE UNIVERSITY OF MICHIGANANN ARBOR, MICHIGAN
1969


A P A N E L S T U D Y O F I N C O M E D Y N A M I C S :
STUDY DESIGN, PROCEDURES, AND FORMS
1968 INTERVIEWING YEAR (WAVE I)
A Report on Research in Process Under Contract to the
Office of Economic Opportunity
James N. Morgan
James D. Smith
SURVEY RESEARCH CENTER
INSTITUTE FOR SOCIAL RESEARCHTHE UNIVERSITY OF MICHIGANANN ARBOR, MICHIGAN
1969


PREFACE
Contents
Data collection and processing procedures followed in this
panel study of income dynamics and a description of the data available
to analysts are described in detail in this manual including the repro-
duction of the important forms used in the study. An overview of the entire
study is presented in Section I. The sample design is discussed in
Section II while Section III details the field procedures that have been
used in locating, interviewing and keeping track of respondents. Also
reproduced in Section III is the 1968 questionnaire, parts of the inter-
viewers' instruction booklet and other forms used to facilitate the field
work. Section IV follows with a discussion of the data processing
procedures, including editing and coding, and subsequent data-cleaning
processes. A theoretical justification for the manipulation of the raw
data into our conceptual framework is also presented in this section.
Section IV concludes with a description of the derivation of the weights.
The last section, Section V, details the code categories for the variables
generated from the first wave of the survey, including variables derived
directly from the questionnaire, as well as more complex variables which
involved manipulation of the raw data into our conceptual scheme. For
most variables, a weighted percentage for the entire sample is given.
Structural Outline
In brief structural outline, the survey is longitudinal with
interviews taking place annually for about five years. The sample at
the survey's inception included a representative cross-section sample of

-ii-
the United States, as well as a supplementary sample of families who had
previously been interviewed once or twice by the Census Bureau and who
were known to have low incomes and were headed by someone under age sixty.
The representative cross-section sample netted 2930 interviews while the
supplementary sample netted 1872 interviews. In subsequent years the
sample will include all families interviewed the preceding year as well
as newly formed families who were part of original nuclear families in the
preceding year. The interview unit is the head of the family while the
analysis unit can either be the family or the individual in the family.
Theoretical Model
Basically the purpose of the study is to explain the short-run
changes in the economic status of individuals and families. The theoretical
model is recursive--a set of broadly defined personality variables is
thought to affect economic behavior which in turn affects economic status.
Then changes in economic status are linked back to the personality variables
and thus the circle is closed. See Section I for a more detailed
description of the theoretical model.
Staff and Financing
The financing for the study has come from the Office of Economic
Opportunity as well as The Urban Institute. Professors Morgan and Smith
have been the main researchers on the study. John B. Lansing has also
been active on the study, especially in the academic year 1969-1970 when
Professor Morgan has been on leave. In addition, the following individuals
have been responsible: Nancy Baerwaldt, Joan Brinser, Jonathan Dickinson,

-iii-
Louis Hawkins, and Katherine Rogin. Extensive contributions in sampling
have been made by Irene Hess and Thomas Tharaken, in interviewing pro-
cedures by Charles Cannel1 and John Scott, and in data processing by
Barbara Dickerson and Duane Thomas. Methodological studies on achievement
motivation and mental abilities are being made by Kent Marquis and Joseph
Veroff. Results of these studies may allow questions on achievement
motivation and mental abilities in later waves of interviews.

-iv-
CONTENTS
Page
Preface ................................................................
Section I: Introduction .............................................
Section II: Sample for the Panel Study of Income Dynamics ............
Section III: Interviewing and Field Procedures ........................
Part 1: Interviewing and Keeping Track of Respondents ............
Part 2: Questionnaire ............................................
Part 3: Interviewers' Instruction Book ...........................
Part 4: Letter and Other Forms ...................................
Part 5: Documentation of Regional Data ...........................
i
1
21
29
30
36
69
137
154
Section IV: Processing Procedures .................................... 157
Part 1: Editing .................................................. 157
Part 2: Coding ................................................... 185
Part 3: Data-Cleaning Operations ................................. 188
Part 4: Index Creation ........................................... 190
Part 5: Response Rates and Weighting ............................. 202
Section V: Tape Code and Distribution of Responses .................. 209

SECTION I
INTRODUCTION
Background of the Study
The direct antecedent of this study is a large-scale research
project, The Survey of Economic Opportunity (SEO), undertaken by the Office
of Economic Opportunity in the spring of 1966. That research began with
interviews of families in a national sample of 30,000 dwellings. Families
were interviewed twice, once in the spring of 1966 and a second time in the
spring of 1967. The family living at the dwelling at the time of each
visit was interviewed. Hence, no attempt was made to interview the same
family in both years. These interviews were taken for OEO by the Census
Bureau. The Bureau was also responsible for designing the sample, but the
substantive content of the study was the joint effort of the research staff
of OEO and the Census Bureau.
It was originally contemplated that the Census Bureau would process
all interviews and provide tabulations and a computer file which was to be
made available to the research community. The work was subsequently trans-
ferred to an "alliance" formed by the Brookings Institution, OEO, and The
Assist Corporation.1
During the spring of 1966 it became clear to the research staff of
the Office of Economic Opportunity that time series data such as the SEO'S,
1 Work on the Survey of Economic Opportunity is now complete. Researchersinterested in obtaining tape files for their own use may purchase them fromThe Assist Corporation, 7202 Poplar Street, Annadale, Virginia 22003.

-2-
though valuable for estimating the numbers of poor of various demographic
characteristics, could shed but dim light on the dynamics of well-being.
For instance, were the poor in 1966 the same people who were poor in 1968,
merely two years older? Or was there a significant amount of churning
about in the distribution of well-being, even within an age cohort? Do many
escape from poverty simply by chance? Is poverty essentially a caste into
which one enters at birth, or, do many people become poor at some time in
their lives? To what extent does the rate of family formation--timing and
spacing of children-- influence the time path of economic well-being? These
and related questions became the topics of a string of formal and informal
meetings of members of the research staff at OEO.
OEO has been fortunate in the quality of the research staff it has
been able to recruit from universities and government agencies. Although
the participants in those early meetings varied, Glen Cain (Wisconsin),
Robinson Hollister (Swarthmore), Robert Levine (RAND), James Lyday (OEO),
Alvin Shorr (Brandies) and Harold Watts (Wisconsin) were among the regulars.2
Out of these meetings came a study paper by James D. Smith titled
"Longitudinal Study of Individual Economic Development," which was circulated
among academic and government researchers for comment. Preliminary work
toward implementing the research outlined in the paper was subsequently
begun under a small contract with the Bureau of the Census. It was anticipated
2 In addition to those persons who were members of the OEO staff, assistanceand helpful commentary were received from Robert J. Lampmen, John Mogey,Guy Orcutt, and Martin David.

-3-
that families interviewed in the 1967 wave of the SE0 would be subsampled to
form a smaller panel which would be followed over time. The obvious ad-
vantages of using the 1967 SE0 as a sampling source were that one observation
of the panel would be complete at the very beginning of the study and it
would be possible easily and cheaply to stratify the sample by level of well-
being from information obtained in the SE0 interview, rather than to screen
respondents in the field.
It soon became apparent that the processing of the panel would
require commitment of a highly trained and specialized staff. It also be-
came apparent that the kind of research OEO wished to undertake could easily
involve politically sensitive matters, for instance, alienation and attitudes
toward the government, which could better be handled by an academic group.
A decision was reached at OEO to solicit a working arrangement with an
academically-based survey research organization. The study paper was sent
to organizations believed to have the field and research staff required to
handle a panel composed of all the persons in 5,000 families. Proposals were
received from three organizations and on the basis of those proposals the
Survey Research Center of the University of Michigan was selected. Work was
begun immediately by members of the Survey Research Center and the OEO
research staff to implement the study outline.
One of the problems created by the transfer of work from the Census
was the possible loss of ability to reinterview persons in the SE0 sample.
A Census rule held that OEO could not have complete access to the information,
specifically the family's name and address, which would be collected in the
1967 SE0 interviews. This rule is based on concern for the confidentiality
of information given by respondents to the Census. Yet, from the point of

-4-
view of this project the ruling raised the prospect that OEO would incur a
substantial increase in costs because of the need to start with a new
dwelling-unit sample involving screening respondents in the field. Members
of the OEO research staff met with the Director of the Census Bureau in
early 1967 before the 1967 SE0 interviews were taken, and worked out an
agreement that reconciled these conflicting considerations. It was agreed
that all families that the Census was about to interview would be given the
opportunity to sign a statement which authorized the Census to give OEO the
needed information. About 70% of the interviewed families signed the
"release of information form." Though more will be said about the sample
design in Section II, in general, it called for about 3,000 families newly
selected from the Survey Research Center's sampling frame and about 1,900
subselected from the 1967 SEO.
Details of the Theoretical Model
A schematic outline of the recursive model being used is shown
on page 5, with its three main groups of variables: economic status,
economic behavior, and personality and attitudes. This outline is the bare
bones of the model that is being used to explain the short run dynamic
changes occurring among the population of families and individuals.

-5-
Each of the three main variables has a number of components or is measurable
in more than one way, as shown below:
Personality and Attitudes
Ambition-aspirationTrust in othersBelief in rewards for strivingHostility-anomie
Economic Behavior
Income increasing actsConnections to sources of informationTime horizon (acts of planning ahead)Avoidance of undue riskReal earning acts (such as home maintenance and auto repairs)Economizing acts (like eating at home and nonprofligate spending)
Economic Status
Family money incomeFamily net real income/needs
In addition to the three main variables of the recursive part of
the model, two sets of exogenous events enter the model as predictors.

-6-
The first of these are background events, which are known, from previous
studies, to be strongly associated with the level of economic status--factors
such as being born black, poor, or in a rural area. These factors do affect
the variables in the recursive model, but are completed events which cannot
themselves be affected by the short-run dynamics of the model. Unpredictable
chance events also enter as variables into the model. Among such variables
are getting hurt in an accident, a serious illness of a family member, or a
loose local labor market.
The main function of the theoretical model is to give a consistent
general structure to the collection and analysis of data. It also provides
a conceptual framework within which the data will be analyzed. Clearly, it
is not the only possible model, nor necessarily the best one. Undoubtedly

-7-
the data will be analyzed in ways that are not now anticipated, and it is
quite reasonable to expect that other models will be employed with the same
data. And since the data from this study will be available to other analysts
on computer tape, it is certain that they will find other models which better
suit their own research interests.
The Focus of the Analysis
Since there are three different attitudinal indexes and six
composite measures of economic behavior, each with some theoretical justifi-
cation and distinct reason for inclusion, the analysis will focus on trying
to answer such questions as: Which attitudes tend to affect behavior and
for what kinds of people? Which behavior patterns seem to lead to change in
economic status? Which changes in economic status can be attributed to
people's own behaviors and which are the result of forces outside their
control? What kinds of economic changes, and for whom, lead to changed
attitudes and/or changed behaviors?
There are some basic general hypotheses about human behavior im-
bedded in the structure. For instance, success (improved condition) leads
to raised aspiration levels (in some circumstances). Motivation is a com-
bination of stable personality characteristics and more changeable attitudes
(subjective probabilities and specific felt need). Success (and its rewards)
may increase motivation more than failure and punishment.
There should be some practical implications of the findings in
several areas. For instance, if some kinds of events produce more change
in people's attitudes and behavior patterns than others, policies producing
that kind of event may be indicated. If certain kinds of attitudes produce

-8-
more changes in behavior, or certain behavior patterns seem to produce more
changes in status, then policies attempting to produce those attitudes or
behaviors may be indicated. Perhaps most important, the study should throw
light on who among the low-income families have potential for self-support
and whether they can be distinguished and selected for investment in new
skills. By following families over an extended period and looking at what
happens to them and what they do, it should be possible to see how some
managed to improve and to assess whether any of the still-poor might still
make it on their own.
The Information Content
The basic study design called for several measures of economic
status, of relevant economic behavior patterns, and of some related
attitudes, plus some background information.
Three basic types of economic status measures and several parallel
variants of each of these have been constructed. The first is annual
income--the best measure of the economic resources available to the family.
The variants on our income measures range from simple total money income
to measures which account for income in kind, such as the imputed rental
value of owner occupied homes, and measures which net out estimated federal
income taxes and expenses associated with the earning of income.
The second type of status measure, the "Orshansky" type, adjusts
the simple dollar income measure by taking into account the differential needs
of families of varying compositions and sizes. The "need standard" used for
this adjustment takes account of the economies of scale associated with large
families, and the food requirements of family members based on their ages
and sex. Orshansky ratios have been derived for each of the income variants.

-9-
The third measure of economic status takes account of the hours of
work the family must do to earn its income or, alternatively, the amount of
leisure the family has left to enjoy it. Difficult conceptual problems are
raised in attempting to establish an equivalency between income and leisure.
However, it is quite clear that, at the margin, more hours of leisure are
preferred to fewer for any given level of income. On that basis we have
developed a "well-offness" measure which encompasses income, needs, and
leisure.
We have asked a number of questions which are designed to elicit
the respondent's subjective satisfaction with his economic status. We plan
to relate changes in this reported satisfaction to changes in our various
status measures and perhaps develop more refined measures in the process.
The behavioral and attitudinal measures required developmental
work. A perusal of the literature revealed very little appropriate material
that had been validated or used on broad representative samples. Extensive
discussions were conducted with a variety of social scientists in economics,
psychology, sociology, and social work. The resulting attitudinal measures
focus largely on a few major items:
1. Sense of personal efficacy or self-confidence, time
horizon and propensity to plan ahead, all of whichended up in a single index.
2. Trust in others, and in the rewards of striving,versus hostility-anomie.
3. Ambition and high aspiration.
The questions used to measure these attitudes are partly self-
descriptive and partly general attitudinal, and mostly open-ended. The
development of them built on previous work, went through pretesting, and
ended with indexes created partly by judgment and partly according to patterns

-1O-
of correlation (avoiding combining things with very low or negative correla-
tions).
The behavioral measures include components of behavior, which are
open to most people, and seem to fit the conceptual framework. These com-
ponents are combined into indexes by simple addition, but adjustment is made
for components where any substantial number of people are foreclosed, by using
scores of 0, 1, 2 instead of 0, 1. The foreclosed group is scored 1 and the
others either 0 or 2 depending on whether they engaged in the behavior. Thus
people got two points on the risk avoidance index if they fastened their seat
belts, but non-car owners who would not be eligible for the two points were
put in the middle with one point.
Six indexes so generated were given names roughly describing what
they represent:
1. Money earning acts (things that increase money earnings).
2. Connectedness to sources of information and help.
3. Planning acts, behavioral evidences of time horizon.
4. Avoidance of undue risks.
5. Real earning acts (do-it-yourself projects like repairingown car).
6. Economizing - money saving activities like eatingtogether, eating at home, and keeping down expenditureon alcohol and cigarettes.
In addition to the behavioral indexes there are scales for employment
problems (unemployment, illness, etc.), background problems (rural background,
poor parents, first child early), current handicaps (disabilities, dependents,
difficulties communicating), and quality of housing and neighborhood.
Finally there are some variables measuring the quality of the local
(county) environment based on Census data and on a questionnaire sent to the

-11-
state employment security commissions.
Three areas where measurement in the first two waves may be in-
adequate or missing are physical limitations (disabilities), mental ability
(intelligence), and psychological forces (achievement motivation). There
were a few questions on disabilities of the head in the first questionnaire,
and more detailed questions about the head's disabilities plus those of other
family members on the second wave, but there is evidence from methodological
studies that such measures are imprecise. One problem is that this study
requires estimating the economic impact of limiting physical conditions, which
may be only loosely tied to functional limitations.
For instance, loss of a hand might result in little or no reduction
in income for a mathematician or a sportscaster. It should also be kept in
mind that the same medical condition incurred later in life may have quite a
different economic impact than if incurred at a very young age; this differential
impact itself might vary with still other circumstances. A "nervous" condition
might have a significant impact on income level, yet such a condition may not
be easily detectable in an interviewing situation unless carefully constructed
question sequences are used to facilitate the respondent's report of the
condition. Some methodological work is under way.
Measurement of limitations in intelligence or education that may
hamper a person economically also raises problems. Most intelligence tests
measure not only basic mental acuity, but also formal education, vocabulary,
and even motivation. Intelligence tests have been commonly designed for ad-
ministration in a classroom or clinical setting and thus present difficult
problems in voluntary field situations. One such problem is that tests
generally push the examinee to the level where he fails. When used on survey

-12-
respondents, such public failure is felt to cause antagonism and result in
future noncooperation, a serious problem for a panel study. For our purposes
the extremes of the intelligence distribution are the most important, on the
hypotheses that extreme limitations may be a cause of low economic status,
while extremely high intelligence may allow an individual to overcome all
sorts of other handicaps. An "intelligence test" designed to distinguish the
lower end of the distribution was given to part of the sample in 1968, but
more development work is required before we can justify administering a test
to the whole sample.
Finally, while attitudes and behavioral indexes are important, it
would be better to have also some measure of basic personality dispositions,
particularly achievement motivation.' Achievement motivation is thought to
be a relatively stable aspect of an individual's personality, characterized
by a tendency to get satisfaction from overcoming obstacles by one's own
effort, and often manifesting itself in what economists call entrepreneurial
activities: taking calculated risks, but not gambling on long shots. Measures
of the motive were developed using content analysis of imaginative stories
elicited by rather vague pictures in conjunction with standard questions like:
What is happening? What are the people thinking? What will happen next?
These thematic apperception test (TAT) protocols have been used in a national
3See David McClelland, The Achieving Society, D Van Nostrand, Princeton, N.J.,1961; John W. Atkinson, Ed., Motives in Fantasy, Action and Society, D VanNostrand, Princeton, N.J., 1958; and John W. Atkinson, An Introduction toMotivation, D Van Nostrand, Princeton, N.J., 1964.

-13-
personal interview study and in a study of injured workers. 4However, the
protocols took substantial interviewing time, required adjustments for wide
variations in the amount of story content different respondents gave, and in
the case of non-verbal people like injured workers, produced very little
content and some resistance.
Another achievement motivation measure is based on a derivative
theory that high achievement motivation leads to strong distinctions between
easy and difficult tasks and the placing of very high reward values on dif-
ficult ones. Field measures of this motive were obtained by asking respondents
to place values on difficult and easy occupations. This measure did help
explain differences in earnings and in education completed by or planned for
children, even in multivariate analyses. 5
A basic problem is that people's verbal tribute to achievement and
enterprise is not a good measure of their basic personality and often gets
confounded with attitudes toward perseverance, industry, or success as a goal.
Methodological work has been going on in the laboratory to transfer promising
measures into forms that can be used in voluntary personal interview situations
and with a much wider range of ages, educational levels, etc. than covered by
the usual college class. During the next year additional developmental work
4Gerald Gurin, Joseph Veroff and Sheila C. Feld, Americans View Their MentalHealth, New York, Basic Books, 1960; James N. Morgan, Marvin Snider and MarionSobol, Lump Sum Redemption Settlements and Rehabilitation: A Study of Workmen'sCompensation in Michigan, Ann Arbor, Institute for Social Research, 1959.
5 See James Morean. Martin David. Wilbur Cohen and Harvev Brazer. Income and. sWelfare in the United States, New York, McGraw-Hill, 1962; James Morgan"Achievement Motive and Economic Behavior," Economic Develppment~ and CulturalChange XII (April, 1964), 243-267.

-14-
will be done on need achievement measures. We have secured the cooperation
of Professor Joseph Veroff, an expert with extensive experience in motiva-
tional studies, who will work with Charles Cannel1 and Kent Marquis of the
Survey Research Center's program in survey methodology to develop better
achievement motivation measures.
Sample
The sample for this study combined a representative cross-section
sample of nearly 3,000 families in the coterminous United States, selected
from the Survey Research Center's master sampling frame, and a subsample of
about 1,900 families interviewed previously by the Bureau of the census for
the Office of Economic Opportunity.
The subsample drawn from the OEO-Census study was limited to
families that had the following characteristics:
1. Their income in 1966 was less than twice the officialpoverty line.
2. The head of the family was not over 60 years of age inthe spring of 1967.
3. The family gave permission to the Census Bureau to releasethe information it supplied to OEO.
The combined sample covers 120 sampling areas (mostly counties or
sets of counties). Thirty-three of the areas included families from both the
OEO-Census study and the SRC master sampling frame. These thirty-three areas
included the twelve largest United States metropolitan areas. Forty-one areas
contained only families from the SRC master sampling frame and forty-six in-
cluded only families from the OEO-Census study. From the combined sample one
can derive representative data for each of four regions of the country, but the

-15-
data must be weighted unless one uses only the SRC representative cross-
section sample. The sample is not designed so as to give representative
estimates for smaller areas.
Sample Weights
The weights take account of failures to obtain an interview with
sample families, including non-response to the first wave of interviewing in
the spring 1968, but not of subsequent panel losses. The latter are relatively
unimportant as potential sources of bias compared with the dramatic differences
in sampling and subsampling rates. The weights also adjust for the fact that
about a quarter of the OEO-Census study sample did not sign a release of their
information to the OEO and, consequently, Census could not release sufficiently
detailed information so that these families could be located and reinterviewed.
While most analysis will be on families, some will be on individuals.
Each individual has the same weight as the family, leaving no weight bias.
Indeed, in subsequent waves, since the initial sample is considered as in-
cluding all individuals living in the families originally interviewed, we
shall follow and interview individuals who move out (except minor children
moving in with other relatives), and they will also keep their original weights.
Field Procedures
Two waves of interviews have been completed. Interviews were taken
between March and June of 1968 and 1969.
Field operations for both waves followed the standard operating
procedure of the Research Center. Press releases were issued announcing the
study, letters were sent to each potential respondent describing in general

-16-
terms the general purpose of the study, and then the interviewers called on
respondents. Neither the press releases, the letters, nor the interviewers
specified the Office of Economic Opportunity as the sponsor of the study,
largely because of potential political problems and because of the controversial
nature of the poverty program in some areas. The interviewers were instructed
to make every effort to interview the head of the household--defined in general
as the husband or the main wage earner. Some interviewers made as many as
seven calls in an attempt to interview the head. In a few cases where the
head simply refused or was unavailable for the whole interviewing period, inter-
views were taken with the wife or a close relative. All the identifying
information--name, address, and phone number of the respondent and name and
address and phone number of someone who would know where the respondent was
(to help locate him the next year)--was entered on a form apart from the
interview called the "Cover Sheet." This allows separation in the office of
all identifying information about the respondent from the content of the inter-
view so that even the coders do not know the identity of the person whose
information they are making machine readable.
On the first wave in 1968 those being interviewed from the Census
Sample were promised payment after the interview since they had already been
interviewed once or twice before. As soon as the interviews came into the
Ann Arbor office, a check for $5 was mailed to these people. The same people
were also promised another $5 just for mailing in a card in early '69 so that
we would know for sure where they were. The procedure resulted in a substantial
reduction in the field costs of finding respondents who moved. In the 1969 wave
this procedure for a $5 payment after the interview and a second $5 for a card
to be sent in in early 1970 was applied to the full sample since they were all

-17-
being asked for a reinterview. Since there is no control group, there is no
easy way of knowing whether these payments increase the response rate and the
willingness to cooperate. The payments also helped the interviewer secure
the cooperation of neighbors in locating respondents who were hard to find.
Residents in low-income neighborhoods are often very suspicious of strangers
asking for someone's whereabouts since such people are often bill collectors
or investigators. This suspicion was sometimes reduced when the interviewer
could point out that the respondent would be paid for the interview.
Respondents who spend an hour or more answering questions about
themselves are often interested in finding out how other people respond to
the same kinds of questions. One effective way of maintaining respondents'
interest and cooperation is to send respondents a report summarizing study
findings each year. The first such report was mailed out to all the re-
spondents in early November 1968. Mailing the report in November also helped
in locating forwarding addresses for some people who had moved without sending
in the card to inform us they had changed residence.
Response Rates
The response rates have to be considered separately for the new
representative cross-section sample and the Census Sample. In the case of the
new cross-section sample, Survey Research Center response rates for economic
studies tend to vary around 85 percent, but this first wave came in the Spring
of 1968--a time of disturbance or uneasiness in urban areas with much discussion
about confidentiality and privacy. A result, we believe, was that the response
rate in the cross-section sample was around 75 percent, with the lowest rates
in the large urban areas. The increase in nonresponse came largely from

-18-
refusals and from people who simply wouldn't answer the door. In the case of
the Census Sample the response rate was about the same but for entirely
different reasons: many of the people had moved or were otherwise not
locatable. The response rate in the second wave, from preliminary counts, is
between 85 and 90 percent of those previously interviewed. We hope that
response rates will continue to be as high or higher on successive waves. It
must be remembered that in a panel study our emphasis is more on change over
time than on representative population estimates. Thus, while high initial
response rates are always to be desired, it is more important to reinterview
a high proportion than to pressure people to cooperate on the first wave who
are likely to be lost later. (Studies are planned to assess the impact of
the losses in the Census Sample since a great deal is known from the previous
Census interviews.)
Processing and Data Cleaning
The interviews go through three stages of processing to put the
data into machine readable form. In the first of these, pre-editing, members
of the analysis staff check such items as current family composition against
the record from the previous year's interview to be sure that the interview
was indeed taken with the correct family and to identify individuals so that
the data can be matched with last year's. The cover sheets, which contain
identifying information, are then separated from the interview schedule and
placed in a confidential file.
The interviews, now anonymous, go through editing and coding stages.
Editors check to be sure that the questionnaire sequences were followed cor-
rectly and then assemble numerical information from various parts of the

-19-
questionnaire onto work sheets from which the data can be keypunched. The
editors also compute such basic variables as total family income, total
family work time and family need standard. This provides a subjective
"reasonableness" check which often catches errors which are difficult to find
by computer.
Coders convert the non-numerical answers into digital codes which
can be handled by computer. Nearly 300 variables are coded for each family
unit and an additional 18 are coded for each individual in the sample.
Once on tape the data are run through a series of data cleaning
programs to correct errors revealed by inconsistencies or illegitimate codes.
Creation of Analysis Files
Once the data are clean some 80 additional variables, complex
economic status measures, bracket codes, and various indexes are generated by
computer. At the end of this process the family unit file for a given year is
complete.
Data from the first two waves of the study can then be merged and
used to generate change variables. Additional cleaning operations will take
place at this stage.
For some purposes, however, the family is not the ideal unit for
analysis. Children from sample families move out to marry, couples separate,
and individuals living alone move in with other single individuals. Families
after such a change are often very different from the ones before the change
so that status change measures designed to apply to a specific family are
somewhat confounded. Thus we create another computer file which contains a
separate record for each individual in the sample. These individual records

-20-
include the basic information which was coded directly for that individual
plus information about the family in which the individual was embedded at the
time of the interview. If the family composition changes radically, the unit
of analysis remains constant and the appended family data reflects the change
that has occurred.
Analysis at the individual level is limited by the fact that
attitudinal data was obtained only from the respondent (usually the head).
However, the attitudes of the family head may be presumed to be an important
indirect influence on the individual's behavior so that substantial analysis
can be carried out in the absence of direct attitudinal information.
To summarize, the data will be available for analysis in the follow-
ing forms: a) a family unit file for each wave of the study, b) an individual
file for each wave, and c) a number of more complex files combining data for
more than one year for those who remain in the sample.
Questionnaire
The questionnaire used in the first wave of this study is included
so that prospective users of the computer files from this study may familiarize
themselves with the specific questions asked of respondents. It should be
kept in mind that the questionnaire was designed to facilitate a natural
interview, and the order in which questions are asked does not represent the
way they would be grouped on the basis of their relatedness for analytical
purposes. We have built indexes by pulling information from widely separated
parts of the questionnaire. It should also be remembered that certain questions
may have a much different surface connotation to the respondent than the
analytical ends for which they were asked.
We welcome the use of any of these questions in other studies, and will
provide copies of the codes used with them, upon request.

-21-
SECTION II
SAMPLE FOR THE PANEL STUDY OF INCOME DYNAMICS
Introduction
This section documents in full the selection of the Census reinter-
view sample and shows in brief schematic form how the cross-section sample
was selected.
The Survey Research Center's Cross-Section Sample
The cross-section sample of dwellings was selected from the Survey
Research Center's master sampling frame of the coterminous United States.
The master sample itself is flexible in design so that it can be used over a
reasonable period of time for more than one selection of dwellings as well
as for surveys with differing requirements. The chart on the next page
summarizes the characteristics of the Center's national sample. 1The
selection made for this study was designed to yield 3,000 interviews.
1For a complete description of this sample, see Kish, L., and Hess, I.;The Survey Research Center's National Sample of Dwellings (Ann Arbor: Institutefor Social Research, 1965), ISR #2315.

SUMMARY OF CHARACTERISTICS AND DESIGN OF SRC NATIONAL SAMPLE OF DWELLINGSa
Multistage "area" Probability
1st
2nd
3rd
4th
5th
. . .
County, county group, Probability propor- or SMSA as primary tionate to size (pps) sampling unit (psu)
Cities, towns, census pps tracts, minor civil divisions, rural i areas
Blocks, census ED's, PPS chunks, city or directory pages equal probability
Segments or clusters Equal probability of dwellings
Families, spending Equal or unequal units, or adults probability
Over-all sampling fraction = prod. of selection probabilities, over the several stages
I 3. Sample size determined: (1) to yield acceptable reliability
sample of dwellings and
1 psu from each of 74 Universe o f dwellings homogeneous strata in 48 states and D.C.,
exclusive of du's on
3-10 selections and - military reservations
average of five (population in non-
selections per psu du's excluded)
1 selection per ex- pected cluster of 4 du's, for 3,000 interview survey
6-20 segments (av.=8) of 4 du's each per psu, for 3,000 interview survey
All families or spend- ing units, or one adult per household
their occupants
Households, families, spending units, or persons
for estimates of means, percentages, comparisons; (2) to be administratively feasible: 8-10 traveling supervisors; permanent, local, part-time
interviewers in 74 locations (12 largest SMSA's, 62 other 1st stage units). 4. Stratification within psu's: (1) Central cities of SMSA's; (2) other cities of 50,000 or more; (3) urban places
2,500-49,999; (4) other urbanized areas; (5) remaining areas. 5. Sample dwellings for specific study selected from: (1) area segments OR (2) clusters of du's (about 4 per cluster) at
6. Probability sampling permits calculation of of about 4 du's; city directory addresses--supplemented by
sampling error from the sample itself. area sample to include du's at addresses
7. The measurement of nonsampling errors, an important contribution to NOT in directory.
total error in survey data, is not readily estimated from the sample alone; often the measurement is dependent upon information obtained from independent sources.
aFrom The Survey Research Center's National Sample of Dwellings, op. cit.

-23-
The Census Supplementary Sample
The Census supplementary sample was a subsample of families inter-
viewed in the spring of 1967 by the Bureau of the Census for the Office of
Economic Opportunity. As a first step in describing this reinterview sub-
sample we present a brief description of the original Census sample.
The Original Census Sample
The Census sample, which utilized the 357-PSU design, had two parts:
(1) a cross-section sample of about 18,000 households, designated E1; (2) a
nonwhite supplement of about 12,000 households, designated E2, and located in
1960 Enumeration Districts (ED'S) with specified proportions of nonwhite
population, the proportions varying with geographical locations and degree
of urbanization. The area represented by the E2 supplement may also be
referred to as the nonwhite stratum. Disproportionate sampling was necessary
in the supplement in order to provide estimates for eight tabulation areas,
geographical region crossed by size of place.
The E1 sample, by itself, was a national cross-section sample of
about 18,000 households selected at the over-all rate of 1/3158. The E2 sample
was neither a national sample nor a self-weighting sample; it was a probability
sample of about 12,000 households selected from the nonwhite stratum of ED's.
The sampling fractions ranged from about 1/258 to 1/755.
In combination the E1 and E2 samples when properly weighted formed a
national cross-section sample of about 30,000 households, selected in clusters
(segments) of an expected six dwellings. Segments in the nonwhite stratum had
a dual chance of selection, first for the E1 sample and second for the E2 sample;
hence the total selection probability was the sum of the E1 and the E2 probabilities.
The remaining segments retained the E1 selection probability. A consequence of

-24-
these disproportionate selection probabilities was the disproportionate
values of the weights. These ranged from a minimum of 238.51 to a maximum
of 3158.
Although the original Census sample is conveniently referred to as
a 30,000 household sample, some selections were made from group quarters
also. Within a household the sample respondent was any responsible adult
who reported for all household members. In group quarters each selected
individual reported for himself.
In a sense the 1967 survey made for the Office of Economic
Opportunity was itself a reinterview study because the sample households
and individuals were first visited and interviewed by the Bureau of the
Census in the spring of 1966. However, no attempt was made to conduct the
1967 interview with the 1966 respondent. In 1967 the sample segments were
revisited, and an interview was attempted with a responsible member of each
current sample household; in a large number of cases the 1966 and the 1967
households were identical.
Because of a Census Bureau administrative rule, it was necessary
that written permission be secured from each 1967 respondent in order to
release his name and address to the Office of Economic Opportunity. There-
fore, the reinterview sample was reduced to those respondents signing
releases and was subject to the biases arising from nonresponse as well as
from nonrelease of respondent identification.
For this study a sample size much smaller than 30,000 households
was desired. However, unless disproportionate sampling by income level was
used, the number of families below the poverty level would be insufficient
for separate estimates by white and nonwhite classifications in a small sample
of 3,000 to 5,000 households. A sample of this size was chosen because it

-25-
was the maximum that the Center is staffed to handle efficiently.
Another problem that faced the SRC was the cost of staffing and
administering a large field operation in areas where the Census Bureau took
interviews but where the Center did not have interviewers.
In an attempt to satisfy research, budgetary and administrative
interests, the two-part sample evolved. While the new 3,000 interview cross-
section sample drawn by SRC was subject to biases of nonresponse and of panel
losses, it began as an unbiased sample that had as one of its research
potentials the opportunity to assess the bias that might have been present in
the reinterview sample because of the nonsigning of releases. The actual re-
interview sample was limited to a subsample of about 2,000 interviews with
families having low economic status and heads under 60 years of age at the
time of the 1967 interview. Thus, the reinterview sample was used to augment
the cross-section sample from the population groups of greatest research
interest -- poor families in general, and poor Negro families in particular.
Selection of the Reinterview Sample for SRC
Three of the goals in designing the reinterview sample were: (1) to
make maximum use of the SRC sample areas; (2) to maintain a probability sample
from a definable universe; (3) to determine a sample size that would yield a
sizable number of interviews with poor families. Achievement of these goals
was complicated by the fact that planning for the 1968 survey had to proceed
before information was available about signers of releases and their income
distribution. Somewhat subjectively it was decided to restrict families
taken from the Census sample to those with incomes equal to or less than $2000
+ N ($1000) , where N is the number of persons in the family. The value $2000
+ N ($1000) was roughly equal to twice the federal poverty line used in 1967.
Also arrived at subjectively was the geographical area represented by the

-26-
reinterview sample.
Comparison of the SRC sample points with the 357-PSU Census sample
revealed that the two samples have complete overlap among the areas comprising
the 12 self-representing primary areas in the SRC sample; there is partial over-
lap of other sample SMSA's but almost no overlap between non-SMSA's in the SRC
sample and those in the 357-PSU sample.
For planning purposes we obtained a tabulation by PSU of the number of
families and individuals interviewed in 1966 with heads under 60 years of age
and whose family income was less than 1.7 times the federal poverty line. With
these data, which showed a range from zero to over a hundred sample cases by PSU,
we calculated the probable sample size for alternative designs, assuming that
about 60 percent of the respondents would sign releases and that about 90 percent
of signers would grant interviews to the SRC interviewer in 1968.
Because of administrative and cost restrictions we limited ourselves
to a maximum of 40 new sample PSU's (those neither in nor adjacent to the SRC
current national sample PSU's). To meet this last requirement while achieving
the desired sample size led to the decision to do no subsampling within PSU's.
As anticipated, this limiting of the number of PSU's while accepting all eligible
cases within the designated sample PSU's led to wide disparity in the over-all
weights.
The selection process was built upon the SRC national sample
stratification. The Census sample PSU's were first divided into three parts:
(1) areas that are self-representing in both the Census and the SRC samples;
(2) the remaining Census SMSA PSU's; and (3) the non-SMSA PSU's. To make
these divisions in accordance with the SRC national sample structure required
a few slight changes in PSU definitions because neither the Census sample nor
the SRC sample maintained an absolute separation of SMSA counties (Or part

-27-
counties) from non-SMSA counties. (Fortunately, both organizations used the
1960 SMSA definitions).
The areas in part 1 were the 12 largest metropolitan areas forming
the self-representing PSU's in the SRC national sample. These 12 areas were
included with certainty in the reinterview sample.
The sampling of SEA's in part 2 proceeded in several steps:
Step 1: All of the SMSA's in the SRC strata with two SMSA's per stratum wereself-representing in the Census 357-PSU sample. All such SMSA's were includedwith certainty in the reinterview sample.
Step 2: Among the 3-SMSA strata in the SRC sample, all of the SRC sampleSMSA's were certainty selections in the Census 357-PSU sample. Therefore, theSRC sample PSU's with their SRC selection probabilities were included in thereinterview sample.
Step 3: The remaining Census sample SMSA's were ordered according to the SRCstratification. Whenever all SMSA's in an SRC stratum were present in theCensus sample, the SRC selection from that stratum was included in the re-interview sample with the SRC selection probability. In other cases, theCensus SMSA's were grouped and one or more SMSA's were selected with equalprobability at rates that varied from 1/3 to 1/6; the reinterview sampleprobability for such PSU's then becomes the product of the Census probabilityand the subsampling rate.
Because more than 80 percent of the 1966 non-SMSA interviews came
from the South, it was decided to restrict the non-SMSA sample to the South.
For subsampling the Census sample, it was convenient to use the Census Bureau's
105-PSU sample which is a 1 in 4 subsample of the 357-PSU sample. The 23 non-
SMSA PSU's in the South and in the 105 PSU sample were included in the re-
interview sample, their selection probabilities being the product of the 357-
PSU probability and the subsampling rate of 1/4.

-28-
The final reinterview sample of about 2550 families was distributed
as follows:
PartNumber Percent Distributionof PSU'S of Families*
SRC self-representing areas 12 54
Other SMSA'sIn SRC national sampleNot in SRC national sample
21 1823 15
Non-SMSA's in SouthNot in SRC national sample 23 13
____________________________
Total 79 100
* Includes family heads under 60 years of age with family incomes of less thantwo times the federal poverty definition.
A Word of Warning
While it was our intention that the (reinterview) sample be selected
as described, there is evidence that the selection of families sent to SRC
deviated in some unknown manner from the sample design. An investigation is
underway to determine if there was bias in the sample selection and to assess
the magnitude of that bias if it is present. In view of preliminary analysis
of the data which we have made, especially comparisons of weighted distributions
with published distributions based on the Current Population Survey, we think
it unlikely that any bias will be found which will seriously distort the con-
clusions of most analyses likely to be undertaken with these data.

-29-
SECTION III
INTERVIEWING AND FIELD PROCEDURES
Introduction
Section III documents the interviewing and field procedures used in
the 1968 wave of the survey. Part I of this section describes the interview-
ing and how we try to keep track of respondents. Part II is the 1968
questionnaire. Then reprinted is the Instruction Book for 1968 excluding
its first section since that material is already covered in Section I of this
manual. Following the interviewers' Instruction Book is reprinted a typical
letter that announces to the potential respondent that the interviewer will
be coming to call on the family. Only one such letter is reprinted here;
there are others but they include only minor variations from this one. The
four cover sheets are reprinted next; there are two for each of the cross-
section and Census supplementary samples. Their use is described in the
section on interviewing. Not only were families interviewed, but demographic
information about the county in which they resided was also secured. This
procedure is documented in the fifth part of this section.

-30-
Part 1.
Interviewing and Keeping Track of Respondents
Interviewing
The interviewing on the first wave of this study was conducted, for
the most part, between March and June, 1968. All of the interviewing was
done by interviewers who had been hired and trained by the Survey Research
Center. 1 Most of them had been on the staff prior to the beginning of this
study, but the interviewing staff also included a substantial fraction of
interviewers who were hired just prior to this study. The need for new
interviewers arose in part from the inclusion of approximately 34 counties in
the sample that were not part of the Survey Research Center's master sampling
frame. In addition, whenever possible black respondents were interviewed by
black interviewers. The preponderance of black respondents in the supple-
mentary Census Sample was an additional reason for hiring. Most of these
black sample members were located in the central cities of large SMSA's and
in the South.
Because of the procedural and conceptual complexities of this study
as well as the addition of a large number of new interviewers to the staff,
regional meetings were held throughout the country with the interviewers who
were working on this study, whether newly hired or not. At these meetings the
study staff discussed with the interviewers the purpose of the study and the
1For the methods used see Survey Research Center, Manual for Interviewers,(Ann Arbor: Institute for Social Research, 1969), especially Sections 3-7.

-31
reasons for and the implications of a longitudinal design, as well as the
conceptual bases for some of the questions. In addition, an Instruction Book
which outlined in detail the procedures to be followed and the objective for
each question was sent to each interviewer for study. Furthermore, before
doing any production interviewing each interviewer was required to take a
practice interview, which was carefully gone over by her supervisor.
Interviewers utilized for the cross-section sample a dwelling-unit
sample of addresses drawn from the Survey Research Center's master sampling
frame. For the supplementary sample of families with low incomes who had
previously been interviewed once or twice by the Census Bureau a list of names
and addresses was used. The geographic spread of the Survey Research Center's
cross-section sample and the supplementary sample were not the same. In the
majority of the SMSA's both samples appeared, but most of the time in different
areas of the city. And, of course, in the 34 areas added to the sample from
the Census supplement there were no cross-section addresses. Some of these
areas (counties) were adjacent to Survey Research Center sampling areas, and
interviewers in the nearby area did the interviewing of the supplementary sample.
The procedures followed by the interviewers were the same for the two
samples. All respondents were sent a standard letter, varied somewhat accord-
ing to the circumstances, notifying them that they would be interviewed. Both
samples were administered the same questionnaire. Interviewers were instructed
to interview the head of the family and to substitute another respondent only
in the event that the head would be unavailable for the duration of the inter-
viewing period. Hence, substitution of another respondent was made only if we
otherwise would lose the interview. About 93 percent of the interviews were
taken with the head of the family.

-32-
Interviews were also taken in both samples with subfamilies--subunits
within the family where some member (1) earned more than $2000 in 1967, and
(2) did not share income and expenses with the rest of the family, and (3) was
reported likely to move away from the family in the next few years.
Verbal Ability Questions
There was one difference in the questions asked of the cross-section
and supplementary samples. One-fourth of the Census Sample was asked an
additional question consisting of a list of words that were to be matched
with four pictures. The list of fourteen words varied from nouns such as
"fence," which was easy to match with an object in a picture, to adjectives
such as "respectful," which required that the respondent generalize from the
scene in the picture. The purpose of this test was to separate the lowest
extreme on this crude measure of verbal ability from the rest of the sample,
testing the hypothesis that differences in verbal ability are a predictor of
economic status. This word test is reprinted on page 4 of the two supplementary
sample's cover sheets.
Cover Sheet Procedures
Prior to a survey the Survey Research Center commonly has each inter-
viewer make a list of the sample dwellings in designated areas, and from this
list a selection of dwellings for a particular survey is made. Each selected
dwelling is then listed on its own "cover sheet," including a segment designa-
tion, line number, address, city, and state. The form used on this study for
this purpose, "Cover Sheet for Primary Families--Cross Section Address," is
reprinted in this section. On this study all the families living within each

-33-
selected dwelling were designated to be interviewed. If two unrelated in-
dividuals were living together both were interviewed and considered as separate
families. No family living outside the dwelling unit was interviewed. One
family was designated as the primary family while the other was designated a
related or unrelated secondary. A cover sheet was made out for the latter
families, called "Cover Sheet for Unrelated Secondaries," which is also re-
printed. The Survey Research Center office staff compiles a list of the
dwellings selected for a particular survey, and information from the cover
sheet about what the interviewer finds at each address and about interviews or
non-interviews at that address is checked against that list. The cover sheet,
thus, serves as a control for both the interviewer and the office staff.
For the supplementary Census sample this same cover sheet control
procedure was used. But instead of the interviewer transcribing the dwelling-
unit address onto the cover sheet, the name and address of the family to be
interviewed was listed by the office on each cover sheet. This form, "Cover
Sheet for Reinterview Sample--Family at Address Last Year," is also reprinted
in this section. Also included on this form was the age, sex, and race of the
head of the family and the number of people in the family at the time of the
1967 interview. Since this sample was one of families, and not dwellings, no
interviews were taken with any other family living at the same dwelling as the
sample family unless, of course, they, too, were already in the sample. If a
family moved between 1967 and 1968, they were interviewed at their 1968 address
unless the address would involve excessive traveling by the interviewers, in
which case it became a non-interview. The Survey Research Center maintains a
national field staff and it was often possible to reinterview people who had
moved a long distance without excessive travel by an interviewer.

-34-
Since changes in family composition could occur between 1967, when
the families were interviewed by the Census Bureau and 1968, another cover
sheet was made for the adult members of the 1967 family who had moved away
from the nuclear family. This was called "Cover Sheet for Reinterview
Sample--For Moved Adult Family Member," and is also reprinted here. Follow-
ing adult family members who had moved from the original nuclear family
between 1967 and 1968 was unique to the supplementary sample. Family
members who had moved between 1967 and 1968 were followed because all in-
dividuals living in the family at the time of the 1967 interview rather than
1968 were considered members of the supplementary sample. Subfamilies were
also interviewed in this sample, and the same cover sheet was used for them.
Follow-up Information Secured
It was our intention to reinterview in 1969 all families interviewed
in 1968. Therefore, the head of each household was asked for his name,
address and telephone number and also for the name and address of a relative
or friend who would know where to find him if he moved. It was especially
important that the interviewer get a correct name and mailing address for the
Census supplement part of the sample since each of these respondents was sent
a check for $5 from the University of Michigan for the interview. No cross-
section respondent was paid on the first wave of the study, but all cross-section
respondents are going to be paid in subsequent waves. At the end of the inter-
view each supplementary sample respondent was given a preaddressed green
postcard which he was to return to us if and when he moved or in January of 1969,
that is, one month before the commencement of the second wave of the survey.
This postcard enabled us to keep the addresses of these respondents up-to-date.

-35-
For keeping in touch with us each supplementary sample respondent was paid
another $5. If the respondent sent a postcard to us before January, 1969
indicating an address change, he was sent another postcard requesting that it
be sent to us when he moved again or in January, 1969. No matter how many
postcards were sent to and received from the respondent, only $5 was paid
each respondent for keeping in touch. In January the memory of those from
whom we had not heard was prodded by sending them a reminder letter and a
duplicate postcard in case they lost the first one. Of the 1,872 Census sample
respondents 1,400 returned either the original postcard left with them-at the
interview or the reminder postcard. Since this procedure proved so successful,
with three out of four respondents returning postcards with their current
address, it was decided to continue the procedure in subsequent waves of the
survey for both the cross-section and supplementary parts of the sample.
The Report to Respondents
After most of the data from the 1968 survey were put into a format
making tabulation possible, a five-page nontechnical summary of some of the
more interesting results was sent to each respondent for whom we had a name
and mailing address (practically all of the respondents). The reports were
sent third class with an address correction request. The U. S. Post Office's
response to this request was slow and haphazard. Because of this experience,
the reports to respondents in future years will be sent first class rather
than third class, but we will still ask for an address correction. Each year
the entire process of trying to keep track of these people and their new ad-
dresses will be repeated.

-36-
Part 2
1968 Questionnaire
The questionnaire reprinted here was used only in the 1968 wave of
the survey. The 1969 questionnaire, however, is very similar to the one
reprinted here. The majority of changes were improvements in the questions
rather than additional questions or objectives.
The questionnaire is organized by topics as follows:
Section A: Housing (pages 1-3)
Section B: Family composition; Education of children (pages 4-5)
Section C: Car ownership; Car behavior (pages 5-7)
Section D: Debt; Health insurance; Assets (pages 7-8)
Section E: Consumption--Food, clothing, cigarettes, alcohol(pages 8-9)
Section F-H: Occupation and employment of head (pages 10-17)
Section I: Marital status, education of wife, occupation andemployment of wife, family planning (pages 18-19)
Section J: Family income, occupation of others in family, otherincome and financial information (pages 20-25)
Section K: Time use (pages 26-27)
Section L: "Feelings" questions (pages 28-29)
Section M: Background questions for head (page 30)
Section N: Interviewer's observation section including who wasrespondent, impressions of respondent and dwelling unit,and location and type of dwelling relative to an SMSA(pages 31-32)
Each interviewer uses the last page of the questionnaire to write a
brief sketch of the family including information that might not have been

-37-
included in the replies to the questions, especially events that may have
been important determinants of the respondent's economic status, the condition
of the dwelling, and her impressions of the respondent's neighborhood.
Variable numbers are indicated in the margin to assist users of the
data in locating answers to individual questions in the code.

-38-
I STUDY OF FAMILY ECONOMICS BB # 116-R0135
(INTERVIEW NUMBER) 1 Project 768 Approv. Exp. 2-69
I I I
I
SURVEY RESEARCH CENTER
INSTITUTE FOR SOCIAL RESEARCH
THE UNIVERSITY OF MICHIGAN (Do not write in above spaces.)
2. P. S.U. v. 92
1. Interviewer’s Label 3. Your Interview No. v. 98
4. Date v. 99
5. Length of Interview v 100
Al. Are you the head of this household?
cl YES N0 - (ASK FOR HEAD)
A2. When did you move into this (house/apartment)? v. 101 (DATE, OR YEARS AGO)
A3. How many rooms do you have here for your family (not counting bathrooms)? V 102)
A4. Do you own this (home/apartment), pay rent, or what? v, 103
OWNS OR PAYS RENT - - NEITHER OWNS NOR RENTS - IS BUYING (TURN TO All) (TURN to A14)
IF OWNS OR IS BUYING)
A5. How much did all your utilities like heat and electricity cost you last year -- was it less than $100, $100-200, $200-300, $300-400, or more than $400?
LESS THAN $100 $100-200 $200-300
$300-400 q MORE THAN $400
A6. Could you tell me what the present value of this house (farm) is -- I mean about what would it bring if you sold it today?
$
A7. Do you have a mortgage on this property? IL IOY- YES N0 - (TURN TO PAGE 3, A19)
1st Mortgage 2nd Mortgage
A8. How much are your monthly payments? $ L A9. About how much is the remaining
principal on this mortgage? $
(IF A9a. About how many more DON'T payments do you have
KNOW) left to make? $ A10. Do you also have a second mortgage?
YES - (ASK A8-A9, FOR N0 - TURN TO PAGE 3, A19) SECOND MORTGAGE) (TURN TO A19)
Copyright c 1968 THE UNIVERSITY OF MICHIGAN All Rights Reserved

-39-
(IF PAYS RENT)
(IF NEITHER OWNS NOR RENTS)
All. About how much rent do you pay a month?
A12. Do you pay for any of the utilities yourself?
YES NO - (TURN TO A19)
A13. (IF YES) How much did they cost you altogether last year -- was it Less than $100, $100-200, $200-300, $300-400, or more than $400?
LESS THAN $100 $lOO-200 $200-300
$300-400 MORE THAN $400
(TURN to Al9)
(IF NEITHER OWNS NOR RENTS) ---
A14. How is that? v. 105-
A15. Do you do some work in return for your housing? (What?)
V. 106
A16. How much would it rent for if it were rented? $ per (MONTH, YEAR)
A17. Do you pay for any of the utilities yourself?
YES N0 - (TURN to A19)
A18. (IF YES) How much did they cost you altogether last year -- was it less than $100, $100-200, $200-300, $300-400, or more than $400?
LESS THAN $100 $lOO-200 $200-300
$300-400 MORE THAN $400
(TURN TO A19)

-40-
(ASK EVERYONE)
A19. Did you have any work done on the (house/apartment) during the last year, or do any work on it yourselves?
YES
I
N0 (GO TO A28)
V 107
A20. What was done? V. 108
V.109 A21. Did you (or your family) do any of it?
YES N0 (GO TO A25)
(IF YES)
A22. What did you do?
A23. Did you save more than $50 by doing it yourself?
YES NO (GO TO A25)
A24. (IF YES) About how much money do you think you saved by doing it yourself?
$
A25. Do you still owe anything on it? V. 110
YES N0 (GO TO A28)
A26. (IF YES) Is what you owe for it included in your mortgage payments you told me about?
YES (GO TO A28)
NO
A27. How much are your monthly payments?
$ per
A28. Do you think you might move in the next couple of years? V. 111
N0 - (TURN TO Bl)
(IF MIGHT MOVE A29. Why might you move? V. II2 OR WILL MOVE;

-40-
SECTION B
B1. How many people live here altogether? V. 113
(LIST ALL PERSONS, INCLUDING (ASK B3 FOR THOSE CHILDREN, LIVING IN THE DU, AGED 5-25 (EXCEPT (ASK B4 IF ANSWER
B2. How old are they and how are they related to you?
B3. Is (he/she) B4. How many years in school? of school did
Age Sex (he/she) finish
2. YES NO-
3. YES NO-
4. YES NO-
5. YES NO-
6. YES NO-
7. YES NO-
8. YES NO-
9. YES NO-
10. YES NO-
B5. Anyone else? (LIST ABOVE) V 114 - V 121
B6. Do you (HEAD) have any children under 25 who don't live here with you?
N0 - (GO TO Bll)
B7. Are they B8. How old B9. Is (he/she) in BlO. (IF NOT IN SCHOOL) sons or is (he/ school, working, How many years of daughters? she)? in the army, school did (he/she)
or what? V, 123 finish? V125-~127
1.
2.
3. !
Bll. Has anyone moved into your household in the last year? V.128
YES NO - (GO TO B13)
c B12. (IF YES) Who moved in? (CIRCLE LISTING NUMBERS 0f MOVERS ABOVE) V. 129
B13. Has anyone moved out in the last year? V. 130
YES B14. who moved out? v. 131 (ENTER AGE AND- RELATION TO HEAD AGE
NO - (TURN to B15) RELATION TO HEAD)

-41-
B15. INTERVIEWER: SEE B3 AND B9, AND CHECK ONE:
CHILDREN IN SCHOOL NO CHILDREN IN SCHOOL - (GO TO B20)
B16. Have you (or your wife) ever attended any meetings of a parent-teacher's organization? V. 136
YES NO - (GO TO B18)
B17. (IF YES) When was the last time?
B18. How much education do you think your children will have when they stop going to school? V. 137
(IF UNCERTAIN B19. What do you really think will happen? OR EXPRESSES HOPES ONLY)
(GO TO B21)
B20. (ASK ONLY IF NOT CLEAR) Have you (HEAD) ever had any children? V138
YES q NO (GO TO Cl)
B21. When was your (HEAD'S) first child born? (YEAR OR AGE)
SECTION C: CARS
(ASK EVERYONE) Cl. Altogether, how many people are there in your family here who can drive? v. 139
NONE (GO TO C3)
c2 . DO you or anyone else in the family here own a car?
I
v 140
YES NO (TURN TO c6) _
c3. Does not having a car cause you (FAMILY) any difficulties?
YES NO (GO TO C5)
c4. What are they? V. 141
c5. Is there public transportation within walking distance of here that is adequate for you? V. 142
YES NO

-42- C6. How many cars do you and your family living here own? V 143
(ASK FOR EACH CAR OWNED)
c7. What year model is it?
C8. What make of car is it?
c9. Is it in good, fair, or poor condition?
C 10. Do you owe any money on it?
CAR #3 V. 144 CAR #l CAR #2
v. l47 V. 146%
V.148 YES (GO TO
C13) NO
YES (GO TO C13)
NO
YES (GO TO C13)
NO
(IF NO MONEY OWED ON CAR)
Cll. Is that car insured? v.149
YES N0 - (GO TO A)
$
per
YES q (GO TO A)
NO- YES
I (GO TO A)
c12. (IF YES) How much do you pay for your car insurance?
$
per per
A GO TO C7 FOR NEXT CAR, OR TO C17.
c13. How much are your payments?
(IF MONEY OWED ON CAR)
$
per
$
per
$
per
c14. How many payments do you have left? V. 150
v. 151
c15. Do they include v. 149 insurance?
YES - YES - q YES - (GO TO B) (GO TO B) (GO TO B)
C16. (IF NO) How much NO
is the insurance cost per year? $ $ $
,- GO TO C7 FOR NEXT CAR, OR TO C17.
Cl 7. Does the car you (HEAD) drive most of the time have seat belts? v. 152
TYES N0 (TURN TO C19) DOES NOT DRIVE (TURN to c19)
C18. (IF YES) Do you have them fastened all the time while you are driving, v.l53 part of the time, or practically none of the time?
ALL THE TIME PART OF THE TIME @PRACTICALLY NONE OF THE TIME

-43-
c19. Do you (or your family) do any of your own repair work on your car(s)? v.154
(IF YES)
D1.
N0 (GO TO D1)
v. 155 c20. What kinds of things have you done on your car(s) in the last year?
c21. In the last year do you think you saved more than $50 that way? V156
YES NO (GO TO Dl)
I c22. (IF YES) About how much do you think you saved? $
C23. About how much time did that take you altogether? v157 (HOURS)
SECTION D
We have talked about homes and cars. Do you (FAMILY) make any regular payments for other things you have bought?
YES N0 (GO TO D3)
D2. ( IF YES) About how much do you have to pay each month? $
D3. Are you (HEAD) covered by some hospital or medical insurance like Blue Cross? V158
YES
D4. (ASK ONLY IF 2 OR MORE PEOPLE IN FAMILY)
Does this insurance cover the entire family?
YES NO
(TURN To D6) V158
N0
D5. Can you get free medical care in any way such as from medicare, medicaid, or as a veteran?
V158

-44-
D6. Do you (FAMILY) have any savings, such as checking or savings accounts, or v 159 government bonds?
YES NO
D7. (IF YES) Would they V.160 amount to as much as two months' income or more?
YES - NO
- D8. Was there a time in the last five years when (GO TO El) you had as much as two months' income saved
V161
SECTION E
(ASK EVERYONE)
El. Now I have a few questions about food and clothing. About how many times a week do you (FAMILY) eat out at restaurants or drive-ins? v l62
E2. About how much do you (FAMILY) spend in a week eating out, including lunches V163 at work (or at school)?
s
E3. Do you have any of your milk delivered to the door? v. 164
YES N0 - (GO TO E5)
E4. About how much do you (FAMILY) spend on that milk in a week or month? V165
$ per
E5. About how much do you spend a week on all the (other) food you use at home? v 166
S
average week? E6. How about alcoholic beverages -- how much do you (FAMILY) spend on that in an v. 167
$ NONE - (TURN to E8)
v. 168
E7. Is that included in the food bill?
Yes No

-45-
E8. Do any of you smoke? v 169
NO (GO TO Ell)
E9. (IF YES) About how many cigarettes do you (FAMILY) smoke in a day or week?
(CIGARETTES, PACKS, OR CARTONS) (DAY, WEEK)
ElO. Is that included in the food bill? V170
Ell. Are there any special ways that you try to keep the food bill down?
YES NO (GO TO E14)
E12. (IF YES) What special ways do you have for keeping the food bill down? v 171
E13. Anything else? V 171
E14. (ASK IF 2 OR MORE PEOPLE IN FAMILY) How much of the time does the family sit down and eat the main meal of the day together?
v 174
E15. Do you have any special ways of saving on clothing costs? v 175 - VI76 VI77
NO (TURN TO Fl)
E16. (IF YES) What are they?
I I E17. Did you (FAMILY) save more than $50 on your clothing bill this way last year?
VI79 YES NO (TURN TO F1)
t E18. (IF YES) About how much did you save this way
in the last year? $
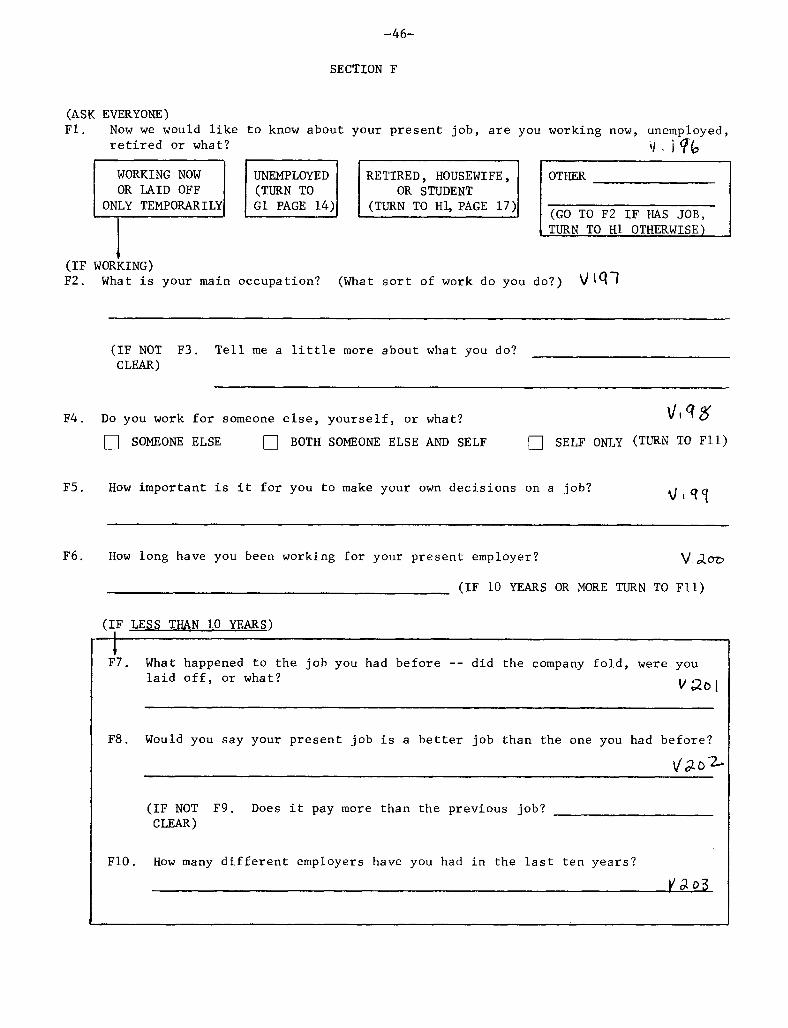
-46-
SECTION F
(ASK EVERYONE) F1. Now we would like to know about your present job, are you working now, unemployed,
retired or what? v 196 WORKING NOW UNEMPLOYED RETIRED, HOUSEWIFE, OTHER OR LAID OFF (TURN TO OR STUDENT
ONLY TEMPORARY G1 PAGE 14) (TURN TO H1, PAGE 17) (GO TO F2 IF HAS JOB, TURN TO H1 OTHERWISE)
1 TURN TO H1 OTHERWISE) I
(IF WORKING) F2. What is your main occupation? (What sort of work do you do?) v 197
F4. Do you work for someone else, yourself, or what? v 198
SOMEONE ELSE BOTH SOMEONE ELSE AND SELF SELF ONLY (TURN TO F11)
F5. How important is it for you to make your own decisions on a job? V199
F6. How long have you been working for your present employer?
(IF NOT F3. Tell me a little more about what you do? CLEAR)
v. 200
(IF 10 YEARS OR MORE TURN TO Fll)
(IF LESS THAN 10 YEARS)
1 F7. What happened to the job you had before -- did the company fold, were you
laid off, or what? V 201
I I
F8. Would you say your present job is a better job than the one you had before?
(IF NOT F9. Does it pay more than the previous job? CLEAR)
F1O. How many different employers have you had in the last ten years?
v 203

-47-
F11. Rave you ever moved out of a community where you were living in order to take v 204 a job somewhere else?
Yes (Go to because you did not want to move?
F13)
NO F12. Have you ever turned down a job
F13. How good would a job have to be before you would be willing to move somewhere v 207 else in order to get it?
F14. Do you plan to try for a new job or line of work or will you keep the job you have now? V 208
TRY FOR NEW JOB, q KEEP JOB HAVE NOW ( GO TO F20) OR LINE OF WORK
F15. What kind of job do you have in mind? v 209
F16. How much might you earn? $ per v 210
F17. Would you have to get additional training to qualify? V 211
v 212 F18. Rave you been doing anything in particular about it?
YES NO (GO TO F20)
F19. (IF YES) What have you done? v 212
F20. How much do you like a job where you are told exactly what to do? v 213

-48-
F21. Would you have any trouble getting another job if you wanted one?
YES NO (GO TO F23)
V 214
F22. (IF YES) Why is that? v 214
F23. Have you ever had an illness or accident that laid you up for a month or more? v 215
YES NO (GO TO F25) -
F24. (IF YES) When was that? (YEAR) v 215
F25. Do you have a physical or nervous condition that limits the type of work or the v 216 amount of work you can do?
YES NO (GO TO F27)
F26. (IF YES) How much does it limit your work?
F27. Are there times when you are late getting to work? V 217
q NO GO TO F29)
(IF YES) About how often does that happen? V 217
F29. Are there times when you don't go to work at all, even though you are not sick? v218
YES NO (GO TO F31)
F30. (IF YES) How often does that happen? V 218
F31. Have you ever been out of a job or on strike for two months or more at one time? v 219
YES NO (GO TO F33)
v 219 F32. (IF YES) When was the last time that happened? (YEAR)
F33. In the last year, how many days were you unemployed, laid off, or without work?
v 220
F34. How many days of work did you miss on your main job in the last year because you were sick or otherwise unable to work?
v 221

-49-
F35. And how many weeks of vacation did you take last year? v 222
F36. Then how many weeks did you actually work on your main job in 1967? V 223
v224 F37. Did you have a standard workweek on your main job?
YES
F38. How many hours a week is that?
V 225
F39. Did you have any overtime or extra work on your main job?
v 226 YES N0 (GO TO F42)
F40. How many hours did that amount to last year?
v 226
(GO TO F42)
No I
F41. On the average, how many hours a week did you work on your main job last year?
v 225
(GO TO F42)
F42. Did you have any other jobs, or any other ways of making money in addition to your main job? v 227
YES NO (TURN TO F47)
F43. What did you do? v 228
F44. Anything else? v 227
F45. About how many hours in all did that amount to in the last year? v 229
F46. About how much did you make per hour for this? $ (PER hour)

-50-
F47. Could you have worked ii you had wanted to in 1967? v 230
YES (GO TO F49) NO
F48. Would you have liked to work more? v 231
YES (TURN TO PAGE 18, 11)
NO (GO TO F49)
t I
F49. Could you have worked if you had wanted to? v 232
YES (TURN TO No PAGE 18, 11)
F50. Would you have preferred less work even if you had earned less money? v 233
(TURN TO PAGE 18, 11)
SECTION G: IF UNEMPLOYED
Gl. What do you do when you work? (What is your occupation?) V 197
G2. Did you work at all last year?
YES NO (TURN TO G5)
(IF YES)
G3. How many weeks did you work last year? v 223
G4. About how many hours a week did you work (when you worked)? v 225

G5.
G6.
G7.
G9.
-51-
Did the company you worked for fold, were you laid off, or what? v 201
How many different employers have you had in the last ten years? v 203
v 204 Have you ever moved out of a community where you were living in order to take a job somewhere else?
YES (GO TO G9)
G8. Have you ever turned down a job because you did not want to move?
YES NO
Do you think you will be able to find steady work around here, or will you have to move? V 206
G1O. How good would a job have to be, for you to be willing to move somewhere else in order to get it?
G11. Is there anything in job?
YES
particular that might make it difficult for you to get another V 214
NO (GO TO G13)
G12. (IF YES) What is that? v 214
G13. How many places do you have your name in for a job? v 235
v 236 G14. Have you applied for a job anywhere in the last 2 weeks?
0 NO (GO TO G16) v 236
YES
G15. (IF YES) How many places did you apply?
G16. How much do you like a job where you are told exactly what to do? v 213

-52-
G17. Have you ever had an illness or accident that laid you up for a month or more? V 215
YES
1
NO (GO TO G19)
G18. (IF YES) When was that? v 215
(YEAR)
G19. Do you have a physical or nervous condition that limits the type of work, or the amount of work you can do?
v 216
YES
I
NO (GO TO G21)
G20. (IF YES) How much does it limit your work? V 216
G21. When you were working, were there times when you were late getting to work? V 217
YES q NO (GO TO G23)
G22. (IF YES) About how often did that happen?
G23. Were there times when you didn't get to work at all, even though you were not sick?
YES NO (GO TO G25) v 218
G24. (IF YES) How often did that happen? v 218
G25. Have you ever been out of a job, or on strike for two months or more at one time?
YES NO (GO TO G27)
G26. (IF YES) When was the last time that happened? v 219 (YEAR)
G27. Are there jobs available around here that just aren't worth taking? v 237
(IF JOBS NOT WORTH TAKING) G28. How much do they pay? $
v 238 Per
(HOUR, WEEK)
G29. How important is it for you to make your own decisions on a job? v 199

-53-
SECTION H: IF RETIRED, HOUSEWIFE, OR STUDENT
H1. During the last year (1967) did you do any work for money?
YES q NO (GO TO H5)
H2. What kind of work did you do when you worked? (What was your occupation?)
V 197
H3. How many weeks did you work last year? v 223
H4. About how many hours a week did you work (when you worked)? v 225
H5. Are you thinking about going to work?
YES q NO (GO TO Hll)
I
v 235
(IF YES)
H6. How many places do you have your name in for a job? v 235
H7. Have you applied for a job anywhere in the last two weeks? v 236
YES q NO (GO TO H9)
H8. (IF YES) How many places did you apply? v 236
H9. Are there jobs around here that just aren't worth taking? v 237
(IF JOBS NOT WORTH TAKING) H1O. How much do they pay? $ per v 238
(HOUR WEEK) ,
H11. Do you have a physical condition, or nervous condition that limits the type of work or the amount of work you can do?
YES q NO (TURN TO I 1)
H12. (IF YES) How much does it limit your work?
(TURN TO I 1)

-54-
SECTION I
(ASK EVERYONE)
I 1. Are you married, single, widowed, divorced, or separated?
MARRIED
SINGLE- I I 2. Have you ever been married? YES q NO (GO TO I 6)
I 3. When were you first married? v 240 (SPECIFY DATE OR AGE)
For how long? v 241 (YEARS)
When were you first married? V240 (SPECIFY DATE OR AGE)
GO TO I 6
I 6. INTERVIEWER: CHECK BOX
CHILDREN UNDER 12 NO CHILDREN UNDER 12 OR HEAD AND HEAD WORKS IS NOT WORKING (TURN TO PAGE 20, J1)
I 7. How were the children taken care of while you were working? v 242
18. About how much did that cost you last year? $
(TURN TO PAGE 20, J1
(
I
IF MARRIED)
9. Did your wife do any work for money last year? v 243 YES NO (TURN TO I 16)
I 10. What kind of work did she do? v 243
I 11. About how many weeks did she work last year? v 244
I 12. And about how many hours a week did she work? v 245
I 13. INTERVIEWER: CHECK BOX
CHILDREN UNDER 12 N0 CHILDREN UNDER 12 (TURN TO I 16)
I 14. How were your children taken care of while your wife was working? v 242
I 15. About how much did that cost you last year? $

-55-
(IF MARRIED -- CONTINUED)
I 16. How many grades of school did your wife finish? v 246
I 17. Did she have any other schooling? v 246
YES q NO (GO TO I 21)
I 18. What other schooling did she have? v 246
(IF COLLEGE) I 19. Does she have a college degree?
YES NO (GO TO I 21)
I 20. What degree(s) did she receive?
I 21. Is this your (HEAD'S) first marriage?
YES
I 24. (INTERVIEWER: SEE PAGE 4, Q. B2, (LISTING Box) AND CHECK ONE)
WIFE UNDER 45 WIFE 45 OR OLDER (TURN TO Jl)
I I 25. Do you expect to have any more children?
YES NO
r
NO
I 23. When were you (HEAD) married for the first time? v 240
I 26. When do you think you might have another child?
I (TURN To J1)
(SPECIFY WHETHER YEAR OR AGE)
I 27. How sure are you that you won't have any (more) children?
(TURN TO J1 )

-56-
SECTION J: INCOME
(ASK EVERYONE)
To get an accurate financial picture of people all over the country, we need to know the income of all the families that we interview.
J1. (INTERVIEWER: CHECK BOX)
FARMER NOT A FARMER (GO TO J5)
J2. What were your total receipts from farming in 1967, v 249 including soil bank payments and commodity credit loans? $ A
J3. What were your total operating expenses, not counting living expenses? $ B
I J4. That left you a net income from farming of? A - B = $ A-B
J5. Did you (R and Family) own a business at any time in 1967, or have a financial interest in any business enterprise? v 250
YES NO (GO TO J8)
J6. Is it a corporation or an unincorporated business, or do you have an interest in both kinds?
v 250 q CORPORATION (GO TO J8)
UNINCORPORATED
BOTH
DON'T KNOW
J7. How much was your (family's) share of the total income from the business in 1967 -- that is, the amount you took out plus any profit left in? $
(ASK EVERYONE) J8. How much did you (HEAD) receive from wages and salaries in 1967,
that is, before anything was deducted for taxes or other things? $ v 251
J9. In addition to this, did you have any income from bonuses, overtime, or commissions?
YES NO (TURN TO J11)
JlO. How much was that?

-57-
J11. Did you (HEAD) receive any other income in 1967 from:
a) professional practice or trade?
(IF "YES" TO ANY ITEM, ASK "How much was it?" ENTER AMOUNT AT RIGHT)
(IF "NO" ENTER"O")
b) farming or market gardening, roomers or boarders?
c) dividends, interest, rent, trust funds, or royalties?
d) ADC, ADCU ?
e) other welfare?
f) Social Security?
g) other retirement pay, pensions, or annuities?
h) unemployment, or workmen's compensation?
i) alimony?
j) help from relatives?
k) anything else? (specify)
J12. (INTERVIEWER: CHECK ONE)
$ v 254
$ v 259
v 263
HEAD AND WIFE SINGLE MAN OR WOMAN (TURN TO J16)
J13. Did your wife have any income during 1967?
NO (TURN TO J16)
J14. (IF YES) Was it income from wages, salary, a business or what? Any other income?
(SOURCE) (SOURCE)
J15. How much was it before deductions? $ +$ = $

-58-
J16. INTERVIEWER: SEE PAGE 4, B2, (LISTING Box) FOR ANYONE (OTHER THAN HEAD AND WIFE) AGED 14 AND OLDER, AND CHECK BOX
NO ONE 14 OR OLDER EXCEPT HEAD AND/OR WIFE - (TURN TO J28)
OTHER FAMILY MEMBERS 14 AND OLDER
LIST ALL OTHER FU MEMBERS 14 AND OLDER BY RELATION TO HEAD AND AGE
(IF HAD INCOME)
Did (MENTION MEMBER) have any income during 1967?
J18. Was that from wages, a pension, a business, interest or what?
J19. How much was that?
520. Did (he/she) have any other income?
(IF ANY FROM WAGES, OR A
BUSINESS)
A
(IF OTHER INCOME)
J21. What was that from?
J22. How much was that?
J23. How many weeks did (he/she) work last year?
J24. About how many
J25. (IF NOT CLEAR) work more than
hours a week was that?
Did (he/she) half time?
J26. Does (he/she) share in the family's expenses, or what?
J27. Is (he/she) likely to stay here with you or might (he/she) move away within the next few years?
REPEAT J17-J27 FOR NEXT PERSON LISTED; IF NO OTHER PERSON, TURN TO J28.
v 265 Yes No (Go to A)
(SOURCE)
YES NO (GO TO J23)
(SOURCE)
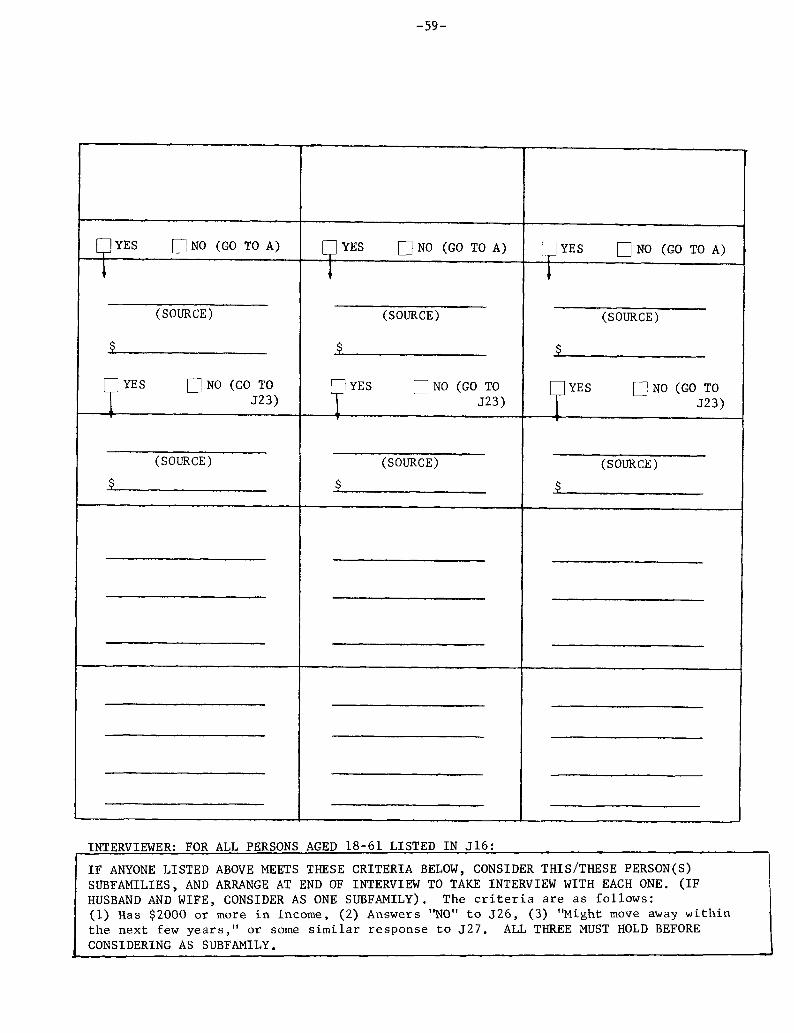
-59-
YES N0 (GO TO A)
(SOURCE)
YES N0 (GO TO 523)
(SOURCE)
YES N0 (GO TO A) YES NO (GO TO A)
I
(SOURCE) (SOURCE)
NO (GO TO YES 523)
NO (GO TO 523)
(SOURCE) (SOURCE)
$ $
INTERVIEWER: FOR ALL PERSONS AGED 18-61 LISTED IN J16:
IF ANYONE LISTED ABOVE MEETS THESE CRITERIA BELOW, CONSIDER THIS/THESE PERSON(S) SUBFAMILIES, AND ARRANGE AT END OF INTERVIEW TO TAKE INTERVIEW WITH EACH ONE. (IF HUSBAND AND WIFE, CONSIDER AS ONE SUBFAMILY). The criteria are as follows: (1) Has $2000 or more in income, (2) Answers "NO" to J26, (3) "Might move away within the next few years," or some similar response to J27. ALL THREE MUST HOLD BEFORE CONSIDERING AS SUBFAMILY.

-6O-
J28. Did you get any other money in the last year -- like an insurance company, an inheritance, or anything?
a big settlement
YES NO (GO TO 530)
J29. (IF YES) HOW much did that amount to?
J30. Did anyone here get more than $50 worth of food or clothing v 268 as a part of their pay?
YES q NO (GO TO 532)
J31. (IF YES) About how much would that be worth? $
v 269 J32. Did you (FAMILY) get any free food, clothing, or food stamps
worth $50 or more in 1967?
YES NO (GO TO 534)
J33. (IF YES) About how much did that save you last year? $
J34. Was your family's income a lot higher or lower than usual this past year (1967)? V 270
NO (GO TO J36) HIGHER THAN USUAL LOWER THAN USUAL
I J35. Why was that?
J36. Does your family's income change from month to month, stay the same over the v 272 year, or what?
STAYS THE SAME - CHANGES FROM MONTH TO MONTH (TURN TO J38)
v 273 J37. Why does it vary?
(TURN TO J38)
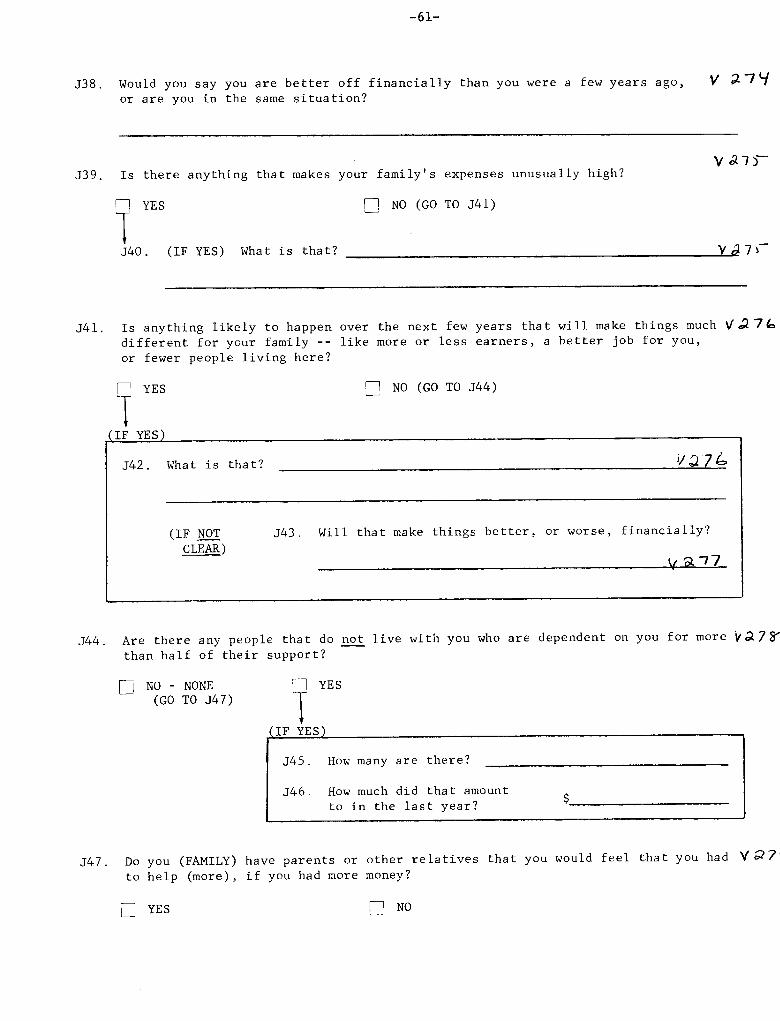
-61-
J38. Would you say you are better off financially than you were a few years ago, V 274 or are you in the same situation?
v 275 J39. Is there anything that makes your family's expenses unusually high?
YES NO (GO TO J41)
J40. (IF YES) What is that? v 275
J41. Is anything Likely to happen over the next few years that will make things much V 276 different for your family -- like more or less earners, a better job for you, or fewer people living here?
NO (GO TO 544)
J42. What is that?
(IF NOT J43. Will that make things better, or worse, financially? CLEAR)
v 277
J44. Are there any people that do not live with you who are dependent on you for more v 278 than half of their support?
NO - NONE YES (GO TO 547)
(IF YES)
J45. How many are there?
J46. How much did that amount to in the last year? $
J47. Do you (FAMILY) have parents or other relatives that you would feel that you had V 279 to help (more), if you had more money?
YES NO

-62-
SECTION K: TIME USE
K1. We're interested in how people spend their spare time. What things do you v 286 (HEAD) usually do in your spare time? Second Mentum v 281
No of things v 283
K2. How often do you (HEAD) go to church? v 284
K3. Are you (HEAD) taking any courses or lessons? V 285
YES NO (GO TO K5)
K4. (IF YES) What are they?
K5. About how many hours do you (HEAD) usually watch television on an average weekday? v 286
K6. How often do you (HEAD) read a newspaper -- every day, once a week, or what? v 287
NEVER
K7. About how many people in this neighborhood do you know by name? v 288
K8. Do you (FAMILY) have any relatives who live within walking distance of here?
v 289
K9. Did you spend more than 40 hours helping friends or relatives last year? v 290
YES NO (TURN TO k11)
K10. (IF YES) About how many hours was that? v 290

-63-
K11. Did you get any free help with housework, baby sitting, or anything like that in the last year (1967)?
NO (GO TO K15)
K12. Did it save you as much as $50 during the year?
YES NO (GO TO K14)
K13. (IF YES) About how much did it save you? $
K14. Was it from someone who doesn't live here? v 291
K15. How often do you (HEAD) go to social clubs or organizations? v 292
K16. How often do you (HEAD) go to a bar or tavern? v 293
v 294 K17. Do you (HEAD) belong to a labor union?
YES
NO (TURN TO L1)
K18. (IF YES) How much did your union dues amount to last year? $ v 294

-64-
SECTION L: FEELINGS
Here is something different -- some questions about how you feel towards things.
(INTERVIEWER: IF RESPONDENT SIMPLY REPEATS ONE OF THE ALTERNATIVES GIVEN IN A QUESTION, CIRCLE THAT WORD OR PHRASE. "YOU" MEANS HEAD IN THIS SECTION.)
L1. Have you usually felt pretty sure your life would work out the way you want it to,
L2 Are you the kind of person that plans his life ahead all the time,
or do you live more from day to day?
L3 When you make plans ahead, do you usually get to carry out things the way you expected,
or do things usually come up to make you change your plans?
v 297
L4 Would you say you nearly always finish things once you start them,
or do you sometimes have to give up before they are finished?
L5 How much do you like to do things that are difficult and challenging?
L6 Would you rather spend your money and enjoy life today,
or save more for the future?
Would you rather have a job that you like even if the chances for a raise were small,
or a job you don't like which offers a good chance for making more money?
v 301
Are you more often satisfied, or dissatisfied with yourself?
V 302
or have there been more times when you haven't been very sure about it?

-65-
L9. Do you have some limitations that keep you from getting ahead as far as youwould like?
v 303
L10. Do you get angry fairly easily,
or does it take a lot to get you angry?
v 304
L11. How much does it matter what other people think about you?
v 305
L12. Do you trust most other people, some, or very few?
v 306
L13. Do you spend much time figuring out ways to get more money?
v 307
L14. Do you think a lot about things that might happen in the future,
or do you usually just take things as they come?
v 308
L15. Do you think the life of the average man is getting better
or is it getting worse?
v 309
L16. Are there a lot of people who have good things they don't deserve?
v 310

-66-
SECTION M: THE PAST
Now, just a few questions about things you've done in the past.
Ml. Where did you (HEAD) grow up? V 311 (SPECIFY STATE, IF U.S., COUNTRY IF FOREIGN)
M2. Was that on a farm, in a large city, small town, or what?
M3. How many grades of school did you (HEAD) finish?
v 312
V313
(IF 6 GRADES OR LESS)
M4. Did you get any other training? v 314
NO - (GO TO M6)
V 314 What was it?
M6. Do you have any trouble reading?
(GO TO M11)
(IF 7 GRADES OR MORE)
M7. Did you have any other schooling?
YES N0 - (GO TO M11)
What other schooling did you have?
v 314
M10. What degree(s) did you receive?
(GO TO M11)
(IF M9. Do you have a COL- college degree? LEGE)
YES N0 - (GO TO M11)
(ASK EVERYONE)
M11. Are you (HEAD) a veteran? YES q NO V 315
M12. How many brothers and sisters did you have? V 316
M13. Were your parents poor when you were growing up, pretty well off, or what?
v 317
M14. How much education did your father have? V 318
(IF NONE OR DON'T KNOW) M15. Could he read and write ? V 318
TURN TO PAGE 4 OF COVER SHEET

N1.
N2.
N3.
-67-
SECTION N: BY OBSERVATION ONLY
Who was present during interview? v 179
Who was respondent (relation to head)?
Race? WHITE NEGRO OTHER V 181 (SPECIFY)
V 182 N4. Number of calls?
N5. How clean was the interior of the DU?
VERY CLEAN CLEAN SO-SO
V 183
NOT VERY CLEAN DIRTY
N6. How much reading material was visible in the DU?
N7.
N8 .
N9.
About how many times did you have to repeat a question?
About how many times did you have to ask R to repeat a reply? v 186
Does R have any obvious disfigurements or habits that could make it difficult for him to get a job?
V 187
N10 . What is the name of the nearest city of 50,000 population or more?
CITY V 188
STATE
N11. How far is this DU from the center of that city? V 189

-68-
N12. TYPE OF STRUCTURE IN WHICH FAMILY LIVES:
N13
[ ] TRAILER[ ] DETACHED SINGLE FAMILY HOUSE
[ ] APARTMENT HOUSE (5 OR MORE UNITS,3 STORIES OR LESS)
[ ] 2-FAMILY HOUSE, 2 UNITS SIDE BY SIDE[ ] 2-FAMILY HOUSE, 2 UNITS ONE ABOVE
THE OTHER[ ] DETACHED 3-4 FAMILY HOUSE[ ] ROW HOUSE (3 OR MORE UNITS IN AN
ATTACHED ROW)
[ ] APARTMENT HOUSE (5 OR MORE UNITS,4 STORIES OR MORE)
[ ] APARTMENT IN A PARTLY COMMERCIALSTRUCTURE
[ ] OTHER (Specify)
NEIGHBORHOOD: Look at 3 structures on each side of DU but not more than 100 yardsor so in both directions and check as many boxes as apply, below. v 191
[ ] VACANT LAND ONLYVlq'L
[ ] APARTMENT HOUSE (5 OR MORE UNITS,[ ] TRAILER 3 STORIES OR LESS)[ ] DETACHED SINGLE FAMILY HOUSE [ ] APARTMENT HOUSE (5 OR MORE UNITS,[ ] 2-FAMILY HOUSE, 2 UNITS SIDE BY SIDE 4 STORIES OR MORE)[ ] 2-FAMILY HOUSE, 2 UNITS ONE ABOVE [ ] APARTMENT IN A PARTLY COMMERCIAL
THE OTHER STRUCTURE[ ] DETACHED 3-4 FAMILY HOUSE [ ] WHOLLY COMMERCIAL OR INDUSTRIAL[ ] ROW HOUSE (3 OR MORE UNITS IN AN STRUCTURE
ATTACHED ROW) [ ] OTHER (Specify)
N14. Is this DU located in a public housing project? YES NO V 193
Thumbnail Sketch

-69-
Part 3.
Interviewers' Instruction Book
The entire Instruction Book is reprinted here except for Section I,
the contents of which are already covered in Section I of this manual.
Section II of the Instruction Book describes in detail the instructions to
the interviewer in carrying out the dwelling-unit sampling. The Field Notes
section gives details of the communication that goes on between the Ann Arbor
office and the interviewers. Section IV describes the objective of each
question, often with an example of what might be an adequate reply to a
question.
Following Section IV of the Instruction Book is the set of supple-
mentary instructions for the Census sample. This details the procedures for
interviewing the families, rather than sample dwellings.

-70-
The University of MichiganSurvey Research Center
Project 45768Spring 1968
INSTRUCTION BOOK
Panel Study of Family Economics
Contents
Section I: Overview of the Study 1A. Background and Study Design 1B, Basic Sample Design 2C. The Questionnaire 4
Section II: Sampling Procedures for the Cross-Section SampleSample of DwellingsSampling Materials for the StudyChanges in Listing ProceduresUnlisted Dwellings at Listing Sheet AddressesUpdating for Take-Part SegmentsSampling Procedures in Large SegmentsNoninterview and Nonsample AddressesReturn of Blue Folders to Ann ArborWhom to InterviewDisposition of Obsolete Yellow Folders
Section III: Field NotesStudy DatesPractice InterviewMaterials You Should Have for P. 45768Respondent LettersCall ProceduresProgress Report Forms - General ProceduresProject Completion FormReturning Interviews and Cover SheetsMailing ScheduleMailing RulesGeneral Editing InstructionsPress ReleaseShow CardsInterviewer's Cards, "Why Do We Ask You?" Folders,Contacting Local Authorities
Section IV: question- by-Question Objectives 18-64
Page
7778888999
10
11111111121214151616161617171717
Samples of P. 45768 MaterialsWhite Cover SheetGreen Cover SheetRespondent LetterProgress Report Forms
* * * * * * * * * * * * * * * * * * * * * * * * * * * * * * * * * * * * * * * * * * * * * * * * *

-71-
SECTION II7.
SAMPLING PROCEDURES FOR THE
CROSS-SECTION SAMPLE
NOTICE
The sampling instructions that follow apply to the segmentsample from the 74 prima--y areas in the Survey ResearchCenter's national sample of dwellings. At a later datesampling instructions for the Census sample will be sentto each interviewer who is to participate in that part ofstudy 45768.
Sample of Dwellings
The entire segment sample is composed of dwellings not previously used in anSRC study. It will be necessary to list or to update listings for all assignedsegments.
Sampling Materials for the Study
1.
2.
3.
4.
5.
New Blue and Yellow Folders for New ChunksFor chunks being used for the first time, and there are many of these, bothBlue and Yellow folders will be sent to the office contact. (Please referto a subsequent section on "Disposition of Obsolete Yellow Folders.")
Blue Folders for Old ChunksWhen a chunk has been used on an earlier study, only the Blue Folder willbe mailed to the Office Contact since the Yellow Folder is already inher/his files.
MapsA map for each sample place has been or is being sent to the OfficeContact. These maps on which chunks are numbered and outlined in colorare to be used to determine the general location of the chunks. If thesemaps become misplaced or badly worn, please notify us so that we may sendreplacements. Furthermore, if chunk boundaries on the maps are not identi-cal with chunk boundaries in the segment folders or if there are diff-erences between maps and folders in chunk numbers, at your earliestconvenience please send the map(s) to us so that we may make correctionsand return the map(s) to you.
New Listing Sheets, S210A new listing form, S210, is to replace the old listing sheet, S203.Whenever a new listing is to be prepared or an old listing supplemented,please use the new form which has ten lines, instead of 20, so that youwill have adequate space for dwelling descriptions and notes. (Seeparagraph on "Changes in Listing Procedure.")
Unaddressed Cover SheetsThe cover sheets, all unaddressed, are of two forms:
a. White Cover SheetsA white cover sheet is to be made out for each sample dwelling,whether occupied or vacant. At an occupied dwelling the white cover

-72-
8.
sheet is used for the Primary Family respondent.
b. Green Cover SheetsA green cover sheet is to be made out for secondary family respon-dents and for subfamily respondents. (The determination of sub-families is explained in a later paragraph.)
Changes in Listing Procedures
No prelistings are being sent to you for new segments, whether Take-Partor Take-All. Each new segment is to be visited and listed on a new list-ing sheet, Form S210, before the sample dwellings are selected for study45768. The lister's name and the date are to be recorded in item A ofForm S210.
On chunk sketches, please use a small square to show locations ofdwelling units. For additional instructions on listing refer to theInterviewer's Manual.
Unlisted Dwellings at Listing Sheet Addresses
On page 3 of the white cover sheet you are asked to determine the numberof dwelling units at the Listing Sheet address referred to in Item 8,page 1, of the cover sheet. If one or more unlisted DUs are discovered,make out a new white cover sheet for each. Be sure to record on boththe cover sheet and the Listing sheet the identification (up, down,front, back, etc.) for each such DU. Use the same listing sheet linenumber for all of those DUs. Interview at each DU unless the total numberat the listing sheet address exceeds 5. When there are more than 5 DUsat a listing sheet address, do not interview there but notify the officeand wait for instructions.
_Updating Listing for Take-Part Segments
For instructions on updating listings for Take-Part segments used onearlier studies, please refer to "Updating Segment Listings", a 3-pagepink supplement to the Interviewers' Manual. This supplement was sent toall Interviewers working on the January-February study p. 772. If you didnot receive a copy, request one from the Field Office immediately.
Sampling Procedures in Large Segments
1. TARE-ALL SegmentsIf, after completing the listing of a Take-ALL segment, you find thatthe segment contains more than 12 DUs, do not interview in the segment.Return the blue folder containing the complete listing and a sketchshowing DU Locations, to us immediately. Attach an Immediate ActionForm (bright pink) to the folder and call our attention to the factthat you have 13 or more DUs assigned in this segment on P45768. Wewill then make another selection of Lines and return the blue folder toyou as quickly as possible.

-73-
9.
2. TARE-PART SegmentsIn Take-Part segments, if the number of listed addresses exceeds the high-est line number appearing in column 5 of the blue folder cover, send thefolder (Immediate Action Form attached), with the Listings and a roughsketch of the segment, to the Field Office. After reviewing the materials,we will send instructions to you.
Noninterview and Nonsample Addresses
Whenever you have a sample address (an address on an assigned Line on theS210), you are to make out a cover sheet for it, even if the structure nolonger exists, is no longer a dwelling, is vacant, or is under construction.
If you are unable to obtain an interview with a respondent, (refer tosection on respondent selection), please report the appropriate informationon the noninterview page of the cover sheet.
Return of Blue Folders to Ann Arbor
After a segment has been visited and the listing sheet in the blue folderupdated or a new listing prepared, only then is the blue folder to be return-ed to the Ann Arbor office. However, do not keep the blue folders any longerthan is necessary. Work from the yellow folder and return the blue folderto us.
Whom to Interview
Preferred respondents are heads of families, although is some cases, explainedbelow, a wife or another responsible family adult may be interviewed. Somedefinitions and explanations follow. For a definition of primary family,please refer to page 68 of Interviewers' Manual.
1. Head of FamilyThe preferred respondent is the head of the family. The head shouldalways be interviewed unless he is going to be unavailable for the entirestudy. Only as a last resort should you interview the wife, or, if thereis no wife, another responsible adult in the family. Use the "DETER-MINING FAMILY HEAD" card to determine just who the head is. (Orange8 1/2 x 11" card). In general this is the (1) husband in case of headand wife, (2) the main financial provider if not a married couple, or(3) the person closest to age 45 if (1) and (2) don't work. (For thoseof you who worked on the Survey of Consumers, this is the procedureused in that study.)
2. Head of SubfamilyIn the course of the interview you will be asking about the income andearnings of persons other than the head of the family. Some of theseindividuals who are related to the head of the family we may want tointerview. A subfamily must meet the following criteria before beinginterviewed: (1) He (or she) must have $2000 or more income, (2) hemust not share the family's expenses, (3) it must be expected that hemight move away within the next few years. These criteria are printedon the questionnaire, on page 23. Green Cover Sheets are to be used

-74-
10.
for these subfamilies. If the subfamily consists of a husband and wife,e.g.,daughter and son-in-law of the head, interview the son-in-law only.The subfamily will usually be a young person who is about ready to leavehis parental home. On the Green Cover Sheet, you are to indicate whetheror not it is being used for a subfamily or an unrelated secondary family.Use the questionnaire as you did for the head of the total family.
3. Unrelated Secondary FamiliesCheck for secondary families at all addresses in the Cross SectionSample. The Green Cover Sheets are to be used for these secondaryfamily heads found at addresses appearing on white cover sheets. Inter-view the head of these secondary families as well.
Disposition of Obsolete Yellow Folders
We request that the Office Contact retain all Yellow Folders until we sendspecific instructions for the disposition of each yellow fodder not in thecurrent chunk sample. Our plans are to mail such instructions to OfficeContacts within the next few weeks.

-75-
SECTION III
FIELD NOTES
11.
Study Dates March 5 - May 30
The above dates represent the interviewing period for the cross-sectionpart of this study. The Census sample interviewing, however, will beginand end later, since SRC has not been able to start the sampling workon this part. Since the Census sample is beginning as the second waveof interviewing a panel of named individuals who have been interviewedbefore, the time interval allowed to complete that part of the samplemay be longer. Details will be sent with the Census sample.
Practice Interview
Moat of you were sent a questionnaire to be used for taking a practiceinterview in mid-February, which was marked in the upper right-handcorner, “PRACTICE AND TRAINING PURPOSES ONLY”; hence, most of you shouldalready have taken your practice interview and received comments on itfrom your supervisor. If, for some reason you did not receive a practiceinterview at that time, use one of the questionnaires sent with yourmaterials for this purpose. Study your materials, and then take yourpractice interview. Don’t take production interviews until you havetaken a practice interview, gone over it very carefully, and sent it toyour supervisor. If you have not received your supervisor’s commentson the practice interview when you are ready to start interviewing, youmay start without hearing from her.
Denote this interview with the word “PRACTICE” prominently on the firstpage of the practice interview so that there will be no possibility ofits later getting confused with a production interview.
Materials You Should Have for P. 45768
Instruction Books . . . . . . . . . . . 1 per interviewer, plus andextra one in larger PSUs
Questionnaires . . . . . . . . . . . . 1 per address, plus extras
Respondent Letters . . . . . . . . . . 1 folded and 1 unfolded for each“Dear Head of Household” address
Envelopes for Respondent Letters. . . . 1 per address, plus 3 extraper PSU
“Why Do We Ask, You?” Folders . . . . . 1 per address, plus extras
Interviewer’s Card . . . . . . . . . . 1 per address, plus extras
(continued on next page)

-76-
12.
Materials You Should Have for P. 45768 (cont.)
Card for Determining Family Head . . . . . 1 per interviewer
Progress Report Forms andProject Completion Form . . . . . . . . . 1 set per PSU (for OC's use)
Copies of Press Release . . . . . , . . . . 2 for smaller PSUs and 4 forlarger ones
Sample Address Summary Forms . . . . . . . Dependent upon number ofinterviewers and sample size
Envelope(s Sampling Materials . . . . . (contains segment folders,White and Green cover sheets)
Respondent Letters*
For this cross section part of the study, there is only one type ofrespondent letter. Its salutation is "Dear Head of Household." Thefolded letters are for sending out in the mail before you visit andthe unfolded ones are to carry with you to show and/or leave with Rswho say they didn't receive a letter. You will have to use some of theextra unfolded letters to send to newly-discovered DUs (unless you havesome left-over folded letters).
Since this sample consists entirely of cross-section addresses, allletters should be sent to "Head of Household."
Call Procedures
1. a. In take part segments that were partially used on an earlierstudy mail letters before making your first visit to the segment.On your first visit you should first update the listing and thenmake contacts at some of the addresses which have received letters.Be sure to allow enough time on your first visit to the segmentto both update the listing and take an interview.
b. In segments that are to be listed for the first time, you probablyshould make a separate trip to list and then return to interviewafter mailing the letters. However, if there are places in thesegment without mailable addresses you should contact one or moreof them on your first visit as soon as you have done the listing.
C . In all cases make the first visit during day light hours for thesake of accuracy.
*Spanish translations of the Respondent letter and the "Why Do We Ask YOU)”folder are available and may be ordered.

-77-
13.
Call Procedures (cont.)
2. Return a cover sheet to the office if it is RA or NAH after fourcalls in an urban or rural non-farm area, or after three calls ata rural farm address if:
a. Calls were made at all parts of the day - morning, afternoon,and evening, and
b. Calls were made on weekend days as well as weekdays, and
C . Your PSU has reached a minimum response rate of 85%.
If all three of these conditions are not true, continue to callon an NAH or RA until all conditions are met, or the maximum limitof eight calls has been reached. The only exception to this ruleis in those cases where you find a house vacant on your first call.In this case do not call back, even if someone is moving in the nextday. As far as we are concerned, these addresses will remain HVsfor the duration of the study, since it is perfectly possible forthe people who move in to have come from another address in thesample. The rule also applies in reverse, that is, if you find aDU occupied on your first contact but the people move out beforeyou can interview them, the address becomes an NI-Other and youdon't have to make additional callbacks.
3. It is often useful to exchange your refusals with another interviewer'srefusals. Often a different person calling at the address will impressthe respondent with the importance of his being interviewed.
If you feel a personal letter from the office might reverse a refusal,please write and request a persuasion letter. In a request for apersuasion letter include the following information:
(1) mailing address, plus segment and line number.
(2) whether head is male or female so we will know whether salutationshould be "Dear Sir" or "Dear Madam."
(3) circumstances of refusal - if some other person kept you fromgetting to the head, be sure to indicate that the refusal wasfrom someone other than the head so that the letter can be soadapted.
(4) any information you might have about R and/or family which mightbe useful in adapting a letter to the individual circumstances.
The letter we send may not always reflect all the information yousend in your request for a persuasion letter, because wheneverpossible we will use the standard persuasion letter composed for thisstudy, but we do need to have the types of information listed above-so that we will at least not send a letter which is inappropriate inany way. And, if you furnish us complete information, you will equipus to write a very relevant and perhaps effective letter if timepressures in the office permit.
We will send a carbon copy of the persuasion letter to you on thesame day we send the original to the respondent.

-78-
14.
Progress Report Forms - General Procedures
We will use the weekly progress report form. We are asking for the numberof hours worked, number of miles travelled, and amount of other expensesincurred only at the end of the study. Remember that the Field Officeshould receive only one progress report from the office contacts midwaythrough the study on April 19. The supervisor should receive all of theprogress report forms, including a copy of the April 19 progress report.The project completion form, of course, is sent to the Field Office andthe supervisor at the end of the study.
Here are the procedures for using the progress report forms:
1. As soon as you receive your sample, write each address on the SampleAddress Summary Form. (The office contact will also have to keep a"master list" for the entire PSU,) Keep these Summary Forms up todate throughout the study. Every time you take an interview, orfind a DU that is NI or NS, or find an extra DU, indicate this besidethe appropriate entry on the Sample Summary Form. Bring your Formup to date after each trip to a segment.
2. The office contact and the interviewers should agree on a time forrelaying the information for the Progress Report Form. This timeshould be mutually convenient but, once it has been set, it is theinterviewer's responsibility to call the office contact at that time,and the office contact's responsibility to be available for the call.
3. When the interviewer calls the office contact, it is the interviewer'sresponsibility to provide information for every item on the ProgressReport Form. The interviewer should be prepared to report a figurefor every item on the Form, including her response rate (Item 7). Ifthe office contact notices a discrepancy in the figures, she should,of course, ask the interviewer about it. However, it should not benecessary for the office contact to figure out each interviewer'sresponse rate, nor to check all figures (use Appendix A to yourInterviewers' Manual to compute response rates quickly).
4. By consulting her Sample Address Summary Form, the interviewer canfill out the blanks in one column of a Progress Report Form. Theblank forms provided at the back of this instruction book can beused for that purpose. The first column, now labelled Office Contact,on the first form, can be used for the first week of the study, thesecond column on the first form for the second week, etc. The columns,of course, are cumulative.
5. The office contact will then mail the copy of the Progress ReportForm for her entire PSU to her supervisor on each Friday of the studyperiod, starting March 15 of the study period. If the office contacthas not heard from each interviewer in her PSU by the specified time,,and is unable to contact the interviewer, then the office contact willhave to leave the column for the interviewer blank and mail the formanyway.

-79-
15.
Notice that there is a column on the Progress Report Form for eachinterviewer in the PSU who is working on the study. If there are morethan four interviewers (including office contact) working on a study,it will be necessary for the office contact to use the extra formprovided for the additional entries.
At the midpoint of the study, on Friday, April 19, the office contactshould send two copies of the form; one to the supervisor and one tothe Field Office. For the last week of the study, please use the ProjectCompletion Form instead of a Progress Report Form. Send one copy of theProject Completion Form to your supervisor and one to the Field Office,and keep one for your files, as usual.
Project Completion Form
Three copies of the Project Completion Form have been sent to each PSU.These forms should be filled out by the office contact upon the comple-tion of the study in the PSU. One copy should be sent to us with thefinal mailing of materials for the study; the second copy should besent to the supervisor; the third copy is for the PSU files.
Use the form below to record your hours, miles, and amount of otherexpenses before you send in your pay forms on the lOth & 25th of each mo. soyou will have the figures called for on the project completion form.
Reporting Period Hours Worked Miles ClaimedAmount Claimedfor Other EXPS.
TOTAL FOR STUDY(To be reportedon ProjectCompletion Form)

-8O-
16.
Returning Interviews and Cover Sheets
Securely assemble all the materials for one interview together; usepaper clips or just insert the cover sheet in the questionnaire. Pleasedo not use staples, scotch tape, or the "fold and tear" method since allmaterials for each interview are assigned a code number in the officeand then separated to insure anonymity.
Mailing Schedule
As you well know, it is very important to maintain a steady flow ofinterviews throughout the study period. This insures that work willnot pile up at your end and that each respondent will have a good chanceto be found and interviewed. This steady flow also enables us here inAnn Arbor to keep up with the processing and coding of interviews asthey arrive each day.
Mailing Rules
A (lst, and last weeks) -- Mail all interviews before noon of the dayfollowing the interview. Use Air Mail in all PSUs except Detroit,Genesee, Hancock, Marshall, St. Joseph, and Toledo.
B (2nd week through week before last week) -- Mail in groups of three,unless you have not completed three interviews within the seven-dayperiod following your last mailing. In this case mail however manyyou have on hand. NEVER HOLD COMPLETED INTERVIEWS LONGER THAN AWEEK, DO NOT COLLECT MORE THAN THREE INTERVIEWS BEFORE MAILING.Use regular First Class envelopes to mail during this period.
General Editing Instructions
Please try to edit your interviews right after you take them, while youstill remember the respondent and the interview situation clearly. Thefollowing points are listed so that you can easily refer to them andmake sure they are well covered while you are editing:
1. LEGIBILITY.
2. Inappropriate questions are clearly marked "Inap." or "slashed."(Make sure the questions you mark "Inap." are really inappropriateaccording to the questionnaire instructions. "Omitted" or "Skipped"should be used to account for questions not asked for some otherreason. See page 36 of the Interviewers' Manual.)
3. Full thumbnail sketch to give reader a good idea of the interviewingsituation. Particularly note any unusual situations and otherinformation about the respondent not stated in the interview.
4. All probes (and any other remarks by you) indicated in parentheses.
5. All unclear responses clarified (by your parenthetical notes).
6. Your name label appears on the questionnaire and on the cover sheet.

-81-
Press Release
17.
We are sending three copies of the press release to each PSU, chargingthe OC with the responsibility of taking the release to the papers inher PSU in which it is most likely to get printed. We suggest that youlocalize the story by noting the areas that will be interviewed, thenames of the interviewers, etc.
Show Cards
The show cards are to be shown as they are called for on the questionnaire.Use them in the customary manner.
Interviewer's Cards, "Why Do We Ask You?" Folders
The Interviewer's Card was designed to leave you as much leeway aspossible in its use, Two possibilities are to write a message on itwhen you find no one at home at an address and/or use it as a callingcard by writing your name and a "Thank you" on it (or having your nameprinted on it or putting your name label on it) and handing it to therespondent at the end of the interview. Many respondents find itreassuring to know the name of the person who has interviewed them.
You may include the "Why Do We Ask You?" folder with the respondentletter. The folder can also be used at the door or after the interviewhas been completed.
Contacting Local Authorities
As usual, we feel it is important that the OC (by letter or by tele-phone) contact the local Police Chief or Sheriff, as well as the BetterBusiness Bureau or Chamber of Commerce, and give these people the follow-ing information before interviewing begins:
1. A brief statement about the study (similar to what you will betelling your respondents);
2. The names of all the local interviewers working on the study;
3. A general indication of the interviewing dates, and the neighborhoodswhere interviews will be taken.
If you are interviewing in several towns, you'll need to do this foreach one. Feel free to show your ID card, the "Why Do We Ask You?"folder, and the Respondent Letter. If the person wants a direct confir-mation from Ann Arbor, let us know immediately and we'll send a letter;or, if necessary, the person may contact us directly. In such a casehe should write John Scott in the Field Office or call him at areacode 313, 764-8356.

18.
A2
A3
A4
A5
-82-
Section IV
QUESTION-BY-QUESTION OBJECTIVES
SECTION A: Housing
When did you move into this (house/apartment)?
If family did not move in together ask when head moved in. If Rtells you the year he bought the house, probe to find out whenhe moved in.
How many rooms do you have here for your family(not counting bathrooms)?
Include only whole rooms, e.g., kitchens, bedrooms, dining rooms,living rooms, permanently enclosed sun porches of substantial size,finished basement or attic rooms, or other rooms suitable or usedfor living purposes and rooms used for office purposes by a personliving in the DU. Count as only one room a combined kitchenetteand dinette separated only by shelves or cabinets.
Exclude bathrooms, strip or pullman kitchens, halls or foyers,alcoves, pantries, laundries, closets or storage space, unusedbasement or attic rooms not suitable for living quarters, roomssubleased for office purposes by a person not living in thedwelling unit, and rooms used for business in a dwelling unit.(These procedures are from the U.S. Census.)
Do you own this (home/apartment), pay rent, or what?
1. Where two unrelated family units are co-owners of a DU orshare the rent, please note this on the questionnaire.
2. If R is buying a home by making mortgage payments check OWNSor IS BUYING box.
3. Some examples of families who neither own nor rent the DU theylive in are:
a) janitors, domestic servants, farm laborers, etc.,who receive living quarters as part of their pay.
b) people who live in houses or rooms providedrent-free as a gift from someone.
c) people who have sold their house but have not yetmoved at the time of the interview.
How much did all your utilities like heat and electricity cost youlast year -- was it less than $100, $100-200, $200-300, $300-400,or more than $400?
We realize that this is a difficult question to answer precisely,but it is an important component of housing costs. We encourageR to make a rough estimate on this. (Same question also for rentersA13, and for those who neither own nor rent, A18.) If the costscover two homes, each for part of a year, that is all right.

-83-
A6 Gould you tell me what the present value of this house (farm) is?I mean about what would it bring if you sold it today?
1. We want R's estimate of what he would get if he were to sell hishouse now, but NOT under conditions of forced sale. Include theland value.
2. For farmers include value of the land and other buildings withthe house.
A7 Do you have a mortgage on this property?
1. If a buyer took out a mortgage when he bought his home but haspaid it off, "NO" should be checked.
2. Mortgages, land contracts, and deeds of trust are all a "YES"to this question because of the terms of each are such that, ifthe debtor does not make his payments, the organization or personthat loaned the money can take possession of the house. But IF Rborrowed money on a personal loan, the answer to A7 is "NO" (butenter the personal loan payments in Section D). Land contractsand deeds of trust differ from mortgages only because legal titleto the house is held by the seller, or a trustee.
A9 How much is the remaining principal on this mortgage?
Get amount still owed on the principal, not original loan nor thetotal remaining payments, which include interest.
A10 Do you also have a second mortgage?
Sometimes two mortgages are taken out at the time a house is pur-chased. For example, part of the down-payment may be borrowed on asecond mortgage. Another way two mortgages can come about is if aperson who already has one mortgage on his house needs cash. Ifhis house is worth more than his first mortgage, he may be able totake out another mortgage to obtain cash.
All About how much rent do you pay a month?
1. For the primary family total rent for the dwelling is required.
2. If R belongs to a secondary FU and pays rent to the primaryor shares the rent, we want to know only how much he pays.
3. If the rental rate has changed during the year give the mostrecent rent per month.
However, if rent is paid irregularly or on a "pay as I can"basis as may be the case for some secondary FUs or a primaryrenting from relatives or friend, obtain the respondents bestestimate of "an average month's rent."
4. If a weekly rate is given, be sure to indicate this so that wecan make the conversion.
19.

-84-
20.
A14-15 FOR THOSE WHO NEITHER OWN NOR RENT
How is that? Do you do some work in return for your housing? (What?)
This set of questions is to determine whether this housing should becounted as part of the respondent's earned income or whether it iseffectively a gift. The housing may be part of the benefits on one'sregular job - room for a live-in servant, parsonage for a minister.Or work done for housing may be an extra way of saving money -custodian in an apartment house. Find out enough aboutto distinguish work substantial enough to pay for housing from essen-tially free living quarters.
Al6 How much would it rent for if it was rented?
If R asks, we want rent for a comparable house or apartment includingwhatever furnishings and utilities the landlord provides. We use thisto make a better estimate of the family's economic status.
A17-18 Utility payments if "Neither Owns Nor Rents" - see A5
A19 Did you have any work done on this (house/apartment) during thelast year, or do any work on it yourselves?
We want to know whether any work has been done around the house, eitherdo-it-yourself projects by someone in the household, or work whichsomeone else was asked to do. Painting, repairs, and redecorations allcount. We include work done on any house/apartment the family livedin during 1967.
A20 What was done?
Here we want enough detail to separate simple things from thoserequiring complex skills. Responses such as "installed/built kitchencabinets, " "painted the house (outside)," "fixed a broken window,"are acceptable.
A21-22 Did you (or your family) do any of it? What did you do?
The object here is to find out how much (if any) of the work wasdone by members of the household. From this question, in conjunctionwith A20, we want to be able also to infer the level of skill exhi-bited by members of the household. Thus "All of it" is an acceptableresponse if the answers to A20 are clear. Other examples are "Allbut the electrical work" (for a family room or the like); "I carriedthe bricks for the mason." If some of the work was done free by afriend or relative not in the household note that clearly. Forinstance: "I did the carpentry, a friend did the plumbing. (Free?)Yes ."

-85-
21.
A23-24 Did you save more than $50 by doing it yourself? How much did you save?
Work done oneself is a form of non-money income which we want toinclude in our measure of economic status. The value of such workis the difference between what the job would have cost if he hadhired someone else to do it, and what he actually spent in doingit himself. In most cases he will not have saved the entire cost ofhaving someone else do the job since he has purchased materials etc.
The $50 cutoff is to avoid spending time trying to get an exact figurewhen the amount isn't large enough to be important. For those who savedmore than $50, an estimate to the nearest $50 is acceptable, althougha more precise figure is better if the respondent offers it.
A25 Do you still owe anything on it?
This may be money owed for materials used in doing the job oneself orfor work done by someone else.
A26-27 Is what you owe for it included in your mortgage payments you told me about?(IF NO) How much are your monthly payments?
Our purpose in asking about payments is to get a measure of the totalcommitted money outflows. We are not interested in the total amountof debt outstanding. If the money owed is included in the mortgage,the payments have already been covered in A8 & A9. For renters whohappen to owe money of this sort, the "included in mortgage?" questionis poorly worded but should be automatically answered no. There arelikely to be very few such cases. For money owed, not included inthe mortgage, be sure to note the frequency (weekly, monthly) as wellas the amount of the payments.
A28-29 Do you think you might move in the next couple of years?Why might you move?
We will code different type of reasons by degree of planning andpurposiveness: "I am going to move to take a better job"; "We aregoing to move so that our children can attend better schools,"versus "I've been transferred to a plant in Georgia"; "There's ahighway coming through and this place will be torn down."

-86-
22.
SECTION B
HOUSEHOLD COMPOSITION AND EDUCATION OF CHILDREN
In this study, so as to start interviewing with something lessthreatening than the formal listing of those in the dwelling, thehousing section precedes the household composition. If you feelthat you need to ask these questions first because of some complexfamily situation or because you want to postpone asking the valueof the house, that is all right. We doubt that having the listingbox here should cause you any serious problems. In any case, ifyou do get this far and find that after you have listed all thepeople living in the DU, you are interviewing the wrong person, youwill not have gone very far into the questionnaire. You might wantto ask page 4 first for people in expensive private homes, but startwith housing for the others.
B1 How many people live here altogether?
No matter which sample you are interviewing from, we want thenumber of people actually living within the DU -- whether or notrelated to the family you are interviewing. One purpose here isto get a measure of the degree of crowding of the DU.
B2 How old are they and how are they related to you?
Enter relation to HEAD, age, and sex, for everyone on the DU. Forunrelated persons specifications such as "friend," "roomer" areacceptable. Be sure to include everyone in the listing box. Thislisting box should be the same for all interviews taken at one DU,i.e., if there are secondary interviews at the address, the listingbox should be the same for that interview as for the primary.
B3-B4 Is (he/she) in school? How many years of school did (he/she) finish?
We apologize for the complex appearance of this sequence, but itshould flow quite smoothly. For those aged 5-25 and not now inschool, we want to know how much schooling they completed. We donot want the information here for the head and wife since we getthat elsewhere in the questionnaire, nor are we interested inpre-schoolers.

-87-
23.
B6-10 Do you have children under 25 who don't live here with you? Are theysons or daughters? How old is (he/she)? Is (he/she) in school, work-ing, in the army, or what? How many years of school did (he/she) finish?
Children here refers to natural children of the head, whether by presentspouse or previous marriage. They need not be presently supported bythis family. Do not include sons-in-law or other "children" relatedonly by marriage. This set of questions gives us some information onchildren in the armed services or in institutions, which we do notsample. It also gives additional information on the educationalorientation of the family. B9 and 10 need not be asked for pre-schoolers.
B11-12 Has anyone moved into your household in the last year? Who moved in?
This question is especially important for that part of the sampledrawn from the Census records (on Yellow or Pink cover sheets). Itenables us to reconcile the differences between the family listingobtained by Census in 1967 and the present listing. The concern iswith new members living with the main family who were not present inearly 1967. For all such persons, related or unrelated, circle theirline number in the listing box. New babies are also considered tohave "moved in" and should be circled.
B13-14 Has anyone moved out in the last year? who moved out?
Again, this question is crucial for the Census sample respondents.People moving out should include unrelated individuals as well asrelated individuals, whether through divorce, death, forming a newhousehold, or whatever. It is especially important that individualsaged 18+ who moved out of households in the Census part of the samplebe accounted for, because we wish to interview them in this wave ofthe study. At the end of the interview there is a set of questionson the yellow cover sheet which refers you back to this question tocheck whether there are such persons who moved out. If there are,you will list name and address in the space provided and latertransfer them to the pink cover sheet. (It is not necessary toobtain addresses of those who have moved out for the Cross Sectionsample, so these questions have been omitted from the white coversheet.) In the case of moving out because of divorce, we know thatwe are asking something that is difficult, but try, with as muchtact as possible, to get the new address of the divorcee.
B16 Have you (or your wife) ever attended any meetings of a parent-teacher organization?
We are referring to organizations, usually known as PTA, and notprivate conferences with the teacher requested because the child hassome sort of problem, Our purpose here is to find out the degreeof concern and interest the R has for his children's education: itis voluntary participation that counts.

-88-
24.
B18-19 How much education do you think your children will have when theystop going to school? What do you really think will happen?
Here we mean the number of years or grades the head expects themto finish. Allow R to give one response for all the children takentogether or let him answer for each child individually. Note theprobe, but do not probe too much, since inability to reply doesgive us some information as to the degree of R's planning.
B20 Have YOU (HEAD) ever had any children?
This question is asked only to determine whether B21 is appropriate.Ask if children have not been mentioned previously, regardless ofmarital status.
B21 When was your (HEAD'S) first child born? (TO BE ASKED OF ALL HEADSWHO HAVE EVER HAD ANY CHILDREN)
This will give us a standard sociological variable "age at birth offirst child." Be sure to make clear whether the figure is age ordate. The figure 30, for instance, might be either 30 years of ageor 1930.
SECTION C: CARS
Some of you who have worked on the Survey of Consumers may notesome similarity between the section on cars in this questionnaireand that of the Survey of Consumers. Our general purpose here is abit different, however. In addition to some financial detail, weare interested in the quality of the family's transportation ordifficulties they have if they don't own a car. Note also that thedefinition of "car" is expanded to include any car or truck availablefor the family's personal use.
C1
c2.
Altogether, how many people are there in your family here who can drive?
We want the number who are able to drive and who have a license.
Do you or anyone else in the family here own a car?
Because of our different objectives, we want to broaden the definitionof car to include trucks of all description. But do exclude cars orother vehicles which are not usable or do not have current licenseplates. Of course, if in doubt, do include the vehicle with anexplanation as to its use.

-89-
25.
C3-4 Does not having a car cause you (FAMILY) any difficulties? What are they?
We want to know whatever is most salient to the respondent in thisregard. It may be anything from inability to get to a job to inabilityto get to a drive-in movie. If the respondent offers reasons why thisis not a problem, record that also! "No, there's good bus service.""No, we have a motorcycle."
c5 Is there public transportation within walking distance of herethat is adequate for you?Public transportation excludes intercity carriers such as Greyhoundbuses, unless the intercity buses or trains, etc., are the ways thatone gets from a rural area to the nearest area for shopping, etc.Generally, public transportation includes things like the city busservice, subway or other local train services.
c7-9 What year model is it? What make of car is it? Is it in good, fair,or poor condition?
Here our objective is to find out the adequacy of the family'sresources in transportation. If the respondent offers a two-wordanswer to the make of car (Olds, F-85) record it, but a singleword is acceptable.
Cl0 Do you owe any money on it?
Because auto insurance can either be included in car payments or paidfor separately, we need two different sequences, selected on thebasis of this question.
Cll-12 Is that car insured? How much do you pay for your insurance?
BY "insured," we mean at least liability insurance, whether or notthere is also collision insurance or other coverage. This isimportant as a measure of risk avoidance. The amount of the paymentsis added to our committed payments measure. Be sure to indicate thefrequency (monthly, quarterly, yearly) as well as the amount of payments.
Cl5-16 Do they include insurance? How much is the insurance cost per year?
Here again we want to know the amount of committed payments. If Roffers the information that the car is uninsured write "no insurance"in C16.

-90-
26.
C17-18 Does the car you (HEAD) drive most of the time have seat belts?Do you have them fastened all the time while you are driving, partof the time, or practically none of the time?
The car the head drives most of the time may or may not be one ofthe cars mentioned above; it may be a vehicle to which he has accessonly during the course of his job. This is all right in the lightof the objective of this question, which is to determine how muchthe respondent avoids risk. A car with seat belts in left frontonly counts as having belts.
Cl9 Do you or your family do any repair work on your car?
The procedure is clear if the response is simply "yes" or "no."For responses such as "some," "occasionally," and even "not much"you should continue on with C20, since we are interested whether ornot this saved him a substantial sum or not.
c20 What kinds of things have you done on your car(s) in the last year?
We will want to code these for skill level, SO record all the detailthe respondent offers. Typical responses are "points and plugs andchange the oil, " "ground the valves," "put in new rings and bearings,""overhauled transmission," "fixed brakes." If it becomes apparentthat someone did a great deal to a car such as building a hot rod orrestoring an antique, we don't need a mass of detail.
C21-23 In the last year do you think you saved more than $50 that way?About how much do you think you saved? About how much time didthat take you?
Same objectives as work around the house (see A20-24). Again theamount saved is the difference between what it cost him to do thejob and what it would have cost if a garage had done it. It willbe equal to the total cost in a garage only if he didn't have tobuy any parts.
The time question applies to the same work that he saved money on.Thus we can get an approximate hourly rate on this do it yourselfwork.

-91-
27.
SECTION D: DEBTS AND RESERVES
D1-2
In previous sections we have been developing various parts of ourmeasure of economic status. On the income side we have asked ques-tions to estimate the value of work done around the home (moneysaved) so as to add it to money income. On the outflow side we haveasked about regular payments for housing and cars. Here we ask acleanup question to get regular payments which the respondent makesfor other things. We also ask about medical insurance and about theamount of saving available in case of emergency.
We have talked about homes and cars. Do you (Family) make anyregular payments for other things you have bought? About how muchdo you pay each month?
As mentioned above this is a cleanup question so we don't want toinclude things we have already measured in the housing and carsections. It is possible, however, that the respondent is makingpayments for a summer cottage or a motor cycle or a non-mortgagehome loan which were not included previously and should be includedhere. Other things for which the family might be making paymentsare household appliances, a T.V., revolving charge accounts at adepartment store, medical expenses, educational expenses, or personalloan which may have gone for any number of purposes. If the respon-dent mentions more than one payment, use the space above D1 to addthem and record the different purposes the money was used for ifoffered.
If the respondent states that he has lump sum debt or debts onwhich he does not make regular payments, note this in the spaceabove D1 with any information about the purpose for which the debtwas incurred when offered. We do not ask about payments on debtsnot connected with purchases, since they are usually small.
D3 Are you (Head) covered by some hospital or medical insurancelike Blue Cross?
If the respondent is covered by standard Blue Cross, Blue Shield,Major Medical, or other contributory medical insurance the answerwill be a straightforward "Yes" and you should continue on with D4.Medical payment provisions in auto insurance do not count: they aretoo restricted in coverage.
R may, however, explain that he has benefits such as workmen'scompensation, Medicare, veteran's medical benefits, or variousprograms available to welfare recipients, all of which are non-contributory. In these cases, write down what R says in the spaceabove the boxes for D4 and D5 and then ask both of these questions.

-92-
28.
D4 (ASK ONLY IF 2 OR MORE PEOPLE IN FAMILY)
Does this insurance cover the entire family?
Answers may in some cases be of the sort: "All but my son who isover 18." Write such an answer below the box. But a "yes" or "no"will do.
D5 (ASK IF NO INSURANCE OR NOT CLEAR. SEE D3)
Can you get free medical care in any way such as from Medicare,Medicaid, or as a veteran?
From this question, in conjunction with D3, we want to be ableto tell whether the family can cope with a serious illness oraccident without financial disaster. We are also interested inthe distinction between insurance programs which involve someinitiative on the part of the respondent and free programsoverwhich he has no control. (Initiative may be in the respondent'schoice of a job with medical fringe benefits.) Hopefully hisanswer to this question will clarify the situation if his answerto D3 is unclear. Medicaid and most veteran's care are availableonly to those with low incomes, but accept the respondent's inter-pretation.
D6 Do you (Family) have any savings, such as checking or savingsaccounts or government bonds?
We are interested in money available for a "rainy day." This canalso include money hidden in the house and stocks that can bereadily sold.
D7-8 Would they amount to as much as two months' income or more?(IF NO) Was there a time in the last five years when you hadas much as 2 months'income saved up?
If he has difficulty with the income comparison but does offera dollar amount we can make the comparison when we code the question.The savings should include those of all members of the family in the DU, &exclude those of anyone not living there.

-93-
29.
SECTION E: FOOD AND CLOTHING
E1
E2
E3-4
Many of the questions in this section are new with this study. Weare concerned primarily with the efficiency of use of resources inthe home. Since this is usually the domain of the wife or otheradult female in the home it will be desirable for her to be presentwhen this section is asked. She can answer the questions herselfor help with the details.
Now I have a few questions about food and clothing. About how manytimes a week do you (Family) eat out at restaurants and drive-ins?
This question is mainly an opener for E2 so you needn't worry aboutprobing to get a precise answer here. Answers such as "twice aweek," "almost never, " "my husband eats his lunches at a cafeteria,""we go out as a family about once a month" are all acceptable.
About how much do you (Family) spend in a week eating out, includinglunches at work (or at school)?
We want here the cost of all meals purchased away from home by thefamily or individuals in the family. You may need to use the marginto figure out and add up the various components - school lunches,restaurants, etc. The "week" here is the "average week" whichexcludes vacations, unusual trips, wedding receptions and the like.We will use the figure, along with the other food bill questions,to get an estimate of the total amount spent on food. The makingsfor lunches prepared at home to be carried to school or work areusually included in the ordinary grocery bill and thus their costshould be excluded from this figure.
Do you have any of your milk delivered to your door? (IF YES) Abouthow much do you (Family) spend on that in a week or month?
This is another correction factor for the food bill. If they havetheir milk delivered to the door this figure will be added to theamount they spend at the supermarket. If they don't have it delivered,the cost of milk will ordinarily be included in the answers to Q. E5.

-94-
30.
E5
E6-7
E8-10
About how much do you spend on al1 the (other) food you use at home?
This figure should include the main weekly bill at the supermarketplus any other amounts spent on groceries during the week.
There will be some cases where the family is receiving food stamps.Sometimes they are free and in other cases the family pays part ofthe cost. We need at least the amount that the family spends on thestamps. "We pay $20 a month for food stamps" is an adequate answer.An answer such as "We get $52 worth of food stamps for $3O,"is helpfulif the respondent offers it. The amount saved by food stamps is alsoto be reported later in question J32-33. If the respondent spendsmoney on food in addition to food stamps, that should be included inthe answer to E5.
How about alcoholic beverages, how much do you (Family) spend onthat in an average week? Is that included in the food bill?
'Alcoholic beverages - beer, wine, whiskey - are not food so we willsubtract them out if they have been included in the food bill. Thisis to be done here in Ann Arbor.
This question doesn't seem to bother non-drinkers who can simply say"I don't drink" or "none." Other people drink a lot and admit itfreely.
Do any of you smoke? About how many cigarettes do you (Family)smoke in a day or week? Is that included in the food bill?
Cigarettes are also often included in the food bill and we want tobe able to subtract them out (again the subtraction will be donein Ann Arbor). Note that the question asks for a family total. Youmay record either a simple total or a compound answer such as "Ismoke a pack a day, my wife smokes about 1/2 a pack." Be sure tospecify whether it is cigarettes, packs or cartons.
In view of the Surgeon General's Report, we may also include smokingas a negative component in our risk avoidance index. We do not askabout cigars or pipes.
E11-13 Are there any special ways that you try to keep the food bill down?What special ways do you have for keeping the food bill down?Anything else?
There will be many types of answers to this question, from "shopping atsales" to various ways of managing the budget, using leftovers,casseroles and using vegetable proteins such as beans. The familymay also raise some of its own food or preserve or freeze food. Somemay get a substantial amount of meat from hunting or fishing. Thewife's answers will be especially helpful for the meal planning typeanswers.

-95-
31.
E14 How much of the time does the family sit down to eat the main mealof the day together?
The main purpose of this question is to get an idea, however limited,of how well the family functions together as a unit. Organizationto the point of having regular meals together should be an indicationof this.
E15-18 Do you have special ways of saving on clothing costs? What are they?Did you (Family) save more than $50 on your clothing bill this waylast year? About how much did you save this way in the last year?
Again, the replies of the wife or adult female are helpful here.Saving money can include reduction in total purchases, sewing, pur-chasing at sales, buying at various nonprofit outlets, use of "hand-me-downs," etc. If R mentions that someone in the family sews butsomething other than clothes are made, e.g., draperies, curtains,slipcovers, etc., they should be included here, as well. Again, the$50 threshhold is to avoid asking for a dollar amount except in caseswhere it's large enough to be important. An answer to the nearest$50 is acceptable.
SECTION F: OCCUPATION
F1 Are you working now, unemployed, retired, or what?
Working now or laid off only temporarily:
This includes all persons who have an employer (or are self-employed)and are working now or reasonably likely to return to work in thenear future. The latter category may include those who are home sickor temporarily disabled, those out on strike, and those who have beenlaid off but know they will be going back to work soon.
Unemployed:
All persons who are not now working and do not have an employer towhom they know they will return. Such a person must be in the marketfor a job though not necessarily actively so. If the respondent istemporarily sick or disabled but will be in the market for a job inthe future he should be asked the unemployed sequence.
Retired, Housewife, or Student:
Persons totally and permanently disabled are considered to be retired.A housewife who is the head of the household is to be included in thecategory only if she is neither employed nor looking for work, other-wise she should be asked the employed or unemployed sections instead.If a Student is working more than half time (20 hours a week, 1000hours a year), he should be asked the employed section.

-96-
32 .
F2 (G1 , H2) What is your main occupation? What do you do when you work?What kind of work did you do when you worked?
Sections F,G,H refer to Head of the family.
1. Probe for a clear, complete answer.
2. The name of the place at which R actually works is an insufficientresponse to the occupation question (e.g., if R works in a bank hemay be the manager, a teller, or the janitor).
3. Job titles at the lower end of the occupational scale are likelyto be less descriptive than they are for professionals. Try toavoid vague job titles which may apply to a wide range of occupations.
a) For example, if R tells you that he is an engineer, he mayi) design bridges or airplanes
ii) operate a railroad locomotiveiii) tend an engine in a power plant
or iv) shovel coal into a furnace.
We obviously need more specific information than "engineer" here,so that a distinction between skilled and semi-skilled and unskilledworkers can be made, which is our objective,
4. If the Head is unemployed or retired, we need to know what he didwhen he worked, with the above detail.
5. Particularly unacceptable answers are:Factory workerConstruction workerDriver (of what?)Engineer (what does he do in his job?)Nurse (registered, practical, or what?)Sailor (officer, enlisted man, deck hand, or what?)
F4 Do you work for someone else, yourself, or what?
Do not assume that R is self-employed or not. Ask the question,it may help us to be sure we get & his jobs.
F5&
G29
How important is it for you to make your own decisions on a job?
We want here not an indication of how much the individual does makedecisions on his current job, but a measure of intensity of theimportance to him of making such decisions. Replies such as "some-what," "I wouldn't take a job unless I could make decisions," aresuitable replies to this question. "I don't make any decisions onmy job," is not an adequate reply, however.

F6
-97-
33.
How long have you been working for your present employer?
F7&G5
F8
F9
F10&G6
Employer in this question means "The New York City Public SchoolSystem" or the "General Electric Corporation." If an individualhas worked all over the country and received numerous promotionsand relocations over the years with the General Electric Corpora-tion, we consider him to have worked for the same employer thewhole time. However, the same job, say school teacher, with adifferent school system is not the same employer. The purposehere is to get a measure of the steadiness of the head's employment.
What happened to the job you had before -- did the company fold,were you laid off, or what?
For some young respondents, this question may be irrelevant, sincethey may have just recently entered the labor force. Replies morepositive than the alternatives given are certainly acceptable: "Iquit to take a better job," "I wanted to move to California." The"job before" refers to a different employer, not a different jobfor the same company.
Would you say your present job is better than the one you had before?
It may be better or worse because of working conditions, type of work,pay, or what have you. These factors may even go in opposite direc-tions. Thus, "Worse, but it pays more" would be an acceptableresponse. If the respondent does not mention comparative pay speci-fically than you should ask F9.
Does it pay more than the previous job?
The term "pay more" can mean that the hourly rate is higher, theannual salary is higher, or that the job enables one to work longerhours and therefore earn more money. If R asks, in a case wherehe switched jobs several years ago, we are interested in a comparisonon the basis of what his previous job would pay now.
How many different employers have you had in the last ten years?
"Different employers" does not mean working for one company in anumber of branches or plants. It can mean having the same job witha different company, however.

-98-
34.
F11-12 Have you ever moved out of a community where you were living in order& G7-8 to take a job somewhere else? (IF NO) Have you ever turned down a
job because you didn't want to move?
There are two key phrases in this question. "Moved out of a communitywhere you were living" means moving far enough to be out of easycontact with friends in the old neighborhood This may be a move tothe other side of a city or across the country. "In order to takeanother job" means just that. We are not interested here in moves hemade if he did not change his job at the same time. Moving to takeanother position with the same company does count in this instance,however. You may accept simple "Yes" and "No" answers at face valueand needn't probe to verify the kind of move.
F13 How good would a job have to be before you would be willing to& move somewhere else in order to get it?
G1OAgain, this is a move that would be associated with changing jobsand which means breaking ties with his current neighborhood. Answersto this question are likely to come in several different frames ofreference and some will require a clarifying probe such as "Why isthat?"
Answers such as "It would have to be a job I liked and pay enoughmore to cover moving expense" or "I'd move anywhere if I could geta job driving a truck" are clear enough as they stand. Others suchas "I wouldn't really consider moving" could well do with a probe.If in doubt probe. Comparisons with the present job are helpful.
F14 Do you have plans to try for a new job or line of work, or willyou keep the job you have now?
A new job or line of work could be with the same employer,a different employer, or plans for self-employment. Our purpose hereis to determine whether or not R hopes to advance on a job or if heis resigned to or content with what he is currently doing.
F15-19 What kind of job do you have in mind? How much might you earn?Would you have to get additional training to qualify? Have you beendoing anything in particular about it? What have you done?
All of these questions are designed to give us some feel for theamount of serious planning and thinking that R has been doing aboutgetting another job. If he responds with vague replies to thesequestions do not probe for specific responses since such forcedreplies would probably be meaningless.

-99-
35.
F20 How much do you like a job where you are told exactly what to do?&
G16 Here we want an intensity of feeling response, such as "very much,""I would never take a job where I wasn't told exactly what to do,"or "I couldn't stand it." Note that this is almost the oppositeof F5 (or G29). If the replies seem inconsistent to you, leave themand by no means try to force R to reconcile these inconsistencies.
F21-22, Would you have any trouble getting another job if you wanted one?G11-12 Why is that?
This question may pick up behavior about which we are reluctant toask direct questions: whether he is a high risk because of frequentindustrial accidents or has had his wages garnish&too frequently;whether he has a police record or evidences of other antisocialbehavior, Or it may get more usual reports of no skill, or toospecialized a type of training. Do not probe here.
F23-24, Have you ever had an illness or accident that laid you up for aG17- 18 month or more? When was that?
BY "laid you up" we mean prevented him or her from working. "Whenwas that?" refers to the most recent time.
F25-26 Do you have a physical or nervous condition that limits the typeG19-20, of work or the amount of work you can do? How much does it limitH11-12 your work?
Our real concern here is whether or not the person's disabilityaffects the family's economic situation, by reducing the amountthe individual can earn or by requiring additional expenses. Hence,we are not interested in the disability per se, but only in thelimitations and restrictions it puts on the individual insofar asworking for money or carrying on everyday activities are concerned.Some individuals may be obviously handicapped but state that theircondition does not limit their work. This is okay, do not press Rto make him tell you that he has a physical handicap. If a dis-ability obviously has a very serious effect on the family's economicstatus you should explain this in the thumbnail.
F27-28 Are there times when you are late getting to work? About howG21-22 often does that happen?
This question gets at a small manifestation of how conscientiousthe respondent is about his work. If he offers an explanation fora "No" answer, write it down.

-lOO-
36.
F29-30, Are there times when you don't go to work at all even though youG23-24 are not sick? How often does that happen'?
This is another aspect of conscientiousness on the job. Acceptthe respondents answer - don't probe. Response may range from"the first day of fishing season" to "whenever I store up a coupleof sick days." But if he gives some special reason that explains,put it down.
F31-32, Have you ever been out of a job or on strike for two months orG25-26 more at one time? When was the last time that happened?
If R asks, by "out of a job" we mean completely without work - wewant to find out whether or not R has been completely without workfor what might well be a disastrously long period of time. Otherwise,accept R's answer and then note anything he mentions about interimemployment while off from his main job.
F33 In the last year, how many days were you unemployed, laid off, orwithout work?
Again, unemployed means completely without work. However, you shouldaccept his answer and then note any additional information he offersabout interim employment. If R replies in terms of weeks, you willhave to ask him how many days he lost from work.
F34 How many days of work did you miss on your main job in the lastyear because you were sick or otherwise unable to work?
Weather, illness of children, death in the family, or even notfeeling like going to work should all be considered as reasons whyone was unable to work. This does not include the days when therespondent was unemployed which have already been counted in F33.
F35 About how many weeks of vacation did you take last year?
Be sure to specify whether the figure R gives is days or weeks.A reply such as "1/2 a week" is adequate, as is "3 days." Vacationtime, unemployment, and sick time will all be subtracted from totaltime in the year to get the total time he worked in 1967.

-lOl-
37.
F36 Then how many weeks did you actually work on your main job in 1967?
"Weeks actually worked" means after deduction for vacations, sicknessand unemployment. For instance if R were neither sick nor unemployedduring 1967 but took a two-week vacation, the number of weeks actuallyworked should be "50." If he were sick for 2 1/2 weeks and took a2-week vacation, the number of weeks actually worked should be "47 1/2."
F37 Do you have a standard workweek on your main job?
Some people have very well defined work weeks, usually about 40 hours,and anything over that is overtime. For such persons, the sequenceF38-40 is the simplest way of getting the hours worked per week andthe amount of overtime hours, if any. Others, often those who workin small companies, will have a workweek that varies with the amountof work to be done. In such cases there is often no clear distinctionbetween regular time and overtime so we ask only about the time worked"on the average," see Q. F41.
F38-40 (IF STANDARD WORKWEEK) How many hours a week is that? Did you haveany overtime or extra work on your main job? How many hours did thatamount to last year?
The answers to the first question may be something like "40 hoursbut I usually get 6 hours overtime;" hence, write down "40 andusually 6 overtime," and then in F40 find out how much overtimein actual hours he had last year. Some multiplication may benecessary here.
F41 (IF NO STANDARD WORKWEEK) On the average, how many hours a weekdid you work on your main job last year?
To get the total hours worked on the main job in 1967, for those withno standard workweek we will multiply weeks worked (F36) by hoursworked per week on the average (F41). If this is awkward for R andhe prefers to give the total number of hours worked in 1967 directly,this is okay; just give an explanation in the margin.
F42-46 Did you have any other jobs, or any other ways of making money inaddition to your main job? What did you do? Anything else? Abouthow much did you make per hour for this?
If R is reluctant to indicate what he did on his second job, do notpressure him into a response. What we are really interested in is theamount of time spent on this second job and his remuneration for it,If R finds it difficult to recall on the spot how many hours he workedon his second job, ask him first how many weeks he worked at hissecond job, and about how many hours per week he worked on this secondjob. Make sure, if you are in doubt, that these hours are not alreadycounted in reply to hours spent on the main job.

-102-
38.
F47-50 Could you have worked more if you had wanted to in 1967? Would youhave liked to work more? Could you have worked less if you hadwanted to? Would you have preferred less work even if you earnedless money?
We want to know how much freedom R has to determine his hours of workand whether or not he liked the number of hours that he worked lastyear. "Could you" means "did you have the freedom to work more hours"or “was there more work available that R could have done." "Wouldyou have liked (preferred)" means "Would you have changed your workhours if you had had the opportunity?" Thus we assume that thosewho answer "Yes " to both of the "could you" questions had a freechoice as to how much they worked and are satisfied with their currenthours of work. For those who did not have a free choice we ask whatthey would have chosen if they had had the opportunity.
SECTION G: UNEMPLOYED
G1 See F2
G2-4 See F36-41
G5 See F7
G6 See F10
G7-8 See F11-12
G9 Do you think you will be able to find steady work around here,or will you have to move?
The objective here, is to get the respondent's impression of thelocal labor market conditions. "Will you have to move," the lastof the question, does not mean to ask if R is actually going to move,but whether or not he perceives that he would have to move to getsteady work.
G11-12 See F21-22, even though the wording differs slightly.
G13 How many places do you have your name in for a job?
We are trying to find out the amount of effort being put intosecuring employment. The number of places mentioned by R should beinterpreted to mean the number of places where he thinks he currentlyhas his name in for a job.

-103-
39.
G14-15 Have you applied for a job anywhere in the last 2 weeks? How manyplaces did you apply?
Again, the objective is the amount of activity R is putting forthto try to find a new job. "Places" refers either to actual placeswhere one can work or to employment agencies, private or public.
G16 See F20
G17-18 See F23-24
G19-20 See F25-26
G21-22 See F27-28, even though the wording differs slightly.
G23-24 See F29-30, even though the wording differs slightly.
G25-26 See F31-32. The "last time" here may be R's current seigeof unemployment.
G27-28 Are there jobs around here that just aren't worth taking?& How much do they pay?
H9-10We want to know what level of pay the respondent considers tobe unacceptable. An affirmative answer may be simply "Yes" orhe may mention a job such as "car wash." You should then ask G28.He may reply, however, "There just aren't any jobs in the area,"which is an adequate reply to G27, and in which case G28 need notbe asked.
G29 See F5. We realize that sometimes it may not be the pay, butthe working conditions that are bad.

-104-
40.
SECTION H: RETIRED, HOUSEWIFE, OR STUDENT
H1-2 During the last year (1967) did you do any work for money? Whatkind of work did you do when you worked? (What was your occupation?)
See F2 for a suitable reply to the occupation question. Note thatwe ask the occupation only of those who worked in 1967. For thosewho are retired from a previous job, this means what they did lastyear, and not what they were doing at the time they retired.
H3-4 See F36-41, remembering that our objective is the number of hoursthat R actually worked in 1967.
H5-8 Are you thinking about going to work? How many places do you haveyour name in for a job? Have you applied for a job anywhere in thelast two weeks?
Even though these questions might be somewhat inappropriate for thosestudents who may not have worked last year and who do not plan to workin the immediate future, do ask them, so that we can get a measure ofthe plans for all those heads of households who are currently notworking. Also see G13-15.
H9-10 See G27-28.
H11-12 See F25-26.
SECTION I: MARITAL STATUS, EMPLOYMENT OF WIFE
I 1 Are you married, single, widowed, divorced, or separated?
This refers to the current status of the head of the family. Thereare likely to be some single women with children and married womenwith no husband in evidence, but accept whatever answer therespondent gives.
I 2-3 Have you ever been married? When were you first married?
Be sure that you ask I 2 for all those who are currently single,and I 3 if appropriate. If the respondent answers "Yes" to I 2,he probably should have answered "widowed, divorced, or separated"to I 1. You needn't change this yourself unless the respondentvolunteers the information after being asked I 2.

-105-
41.
14-5 For how long? When were you first married?
I 6-8
If R has been widowed, divorced, or separated more than one time,the "for how long" query refers to the most recent time. However,the marriage question refers to the most distant marriage, i.e., thefirst husband or wife.
(If single, widowed, etc., and children under 12 and Head working)
How were the children taken care of while you were working? Abouthow much did that cost you last year?
The "CHILDREN UNDER 12" means any children in the household whetheror not they are the Head's natural children. In some cases there maybe an extra adult in the household who is the obvious one to take careof the children while the head is working. You should ask the questionsanyway. The cost of child care will be counted as a cost of earningincome in our analysis.
I 9-10 See F1-2.
I 11-12 See F36-41.
I 13-15 CHECK BOX, How were your children taken care of while your wife wasworking? About how much did that cost you last year?
Note the implicit assumption of the check box - that the head of thefamily as well as the wife was working. In case the head is not work-ing, we would prefer to ask the question and get the obvious answerthat he cares for them ( in which case you can skip the cost question)than miss a few cases where someone else is paid to care for thechildren.
I 21-23 Is this your (HEAD'S) first marriage? When were you married? Whenwere you (READ) married for the first time?
These questions are for background purposes. Be sure to specifywhether you are recording the head's age or the calendar year.
I 24-27 CHECK BOX, Do you expect to have any more children? When do youthink you might have another child? How sure are you that you won'thave any (more) children?
Family planning or lack of it is one of this study's most importantmeasures of foresight and planning, as well as degree of risk taking.You do not need to probe for replies to I 26, "when do you think youmight have another child" since the "don't know" response in itselfgives us evidence of the amount of planning, Answers such as "positive,""you never know," are acceptable replies to the "How sure are you,”question. Some people are not fertile, so being sure they won't haveany more children does not necessarily mean that they are using birthcontrol. We do not ask which is the case.

-106-
42.
SECTION J: INCOME
The income asked about in this section is, of course, the largestsingle component in our measure of economic status. Thus it isimportant that you try to get complete and accurate responses. Ifthe respondent is reluctant to answer some of the income questionsexplain that this is an important part of the study, and that ourinterviews and individual interview data are not available to theInternal Revenue Service or to anyone else. They are held in strict-est confidence. If you should be asked why we do not obtain incomeinformation elsewhere, you should explain that neither we nor anyoneelse have access to individual income tax returns. Such informationis strictly confidential, and is not released by the Internal RevenueService for research purposes.
We regard the Family Unit as having had the same composition allthrough 1967 (and 1968) as it has at the time of the interview. So,if R got married last June, we want the whole year's income for bothhusband and wife & that is, include wife's income before they weremarried. There is one exception to this rule:
If there has been a death in 1967 or 1968 of aformer member of the family, we still want his1967 income, even though he is no longer livingat the time of the interview.
And if there is an unrelated adult who pools his income with thefamily, or is dependant on them, or cannot possibly be interviewedseparately, ask about his work and earnings too.
J1 Farmer Not a farmer
A farmer for our purposes is anyone whose main source of income isfarming. We pick up farming as a secondary source of income in J11b,for non-farmers.
J2 What were your total reciepts from farming in 1967, including soilbank payments and commodity credit loans?
The following are included here as receipts from normal farmingoperations:
1) money from sale of cash crops
2) receipts from the sale of livestock, dairy products, poultry,eggs, fruits, and vegetables
3) soil bank payments
4) receipts from commodity credit loans
Do not include as farming receipts:
1) money from sale of land - this is not income
2) rent from tenant farmers - put this under rent
3) crop loans - not income

-107-
43.
J3 What were your total operating expenses, not counting living expenses?
Farm operating expenses may include:
1) Expenses for feed, seed, lime, fertilizer, insurance, fuel,tires, repairs to trucks and farm machinery, rent for machinery,crop storage, irrigation water, ginning, veterinary expenses
2) Amount spent to purchase livestock
3) Wages
4) Custom work (price paid for work done by a man who brings hisown machinery.)
5) Depreciation
6) Interest on loans
7) Property taxes (but not Federal Income Taxes)
J4 That left you a net income of ---- (A-B = ) ?
Simply defined, farm income equals total receipts less operatingexpenses. Doing the subtraction and then asking J4 will enable youto discover omissions and correct errors.
J5 Did you (R and Family) own a business at any time during 1967, orhave a financial interest in any business enterprise?
The respondent need not be a businessman for this question to beappropriate. The business may be something like a small beauty shopin which his wife has a part interest. The key feature is that therespondent (or family) has money invested in the enterprise.
J6 Is it a corporation or an unincorporated business, or do you havean interest in both kinds?
If the respondent does not seem to understand the question, assumethat the business is unincorporated. (Raving a business incorporatedrequires considerable work and R would know whether he had done this.)If R says he owns stock in a large corporation, check "corporation"but note in the margin that he just owns stock. Be sure to ask J11cclearly for such persons.

-108-
44.
J7 (FOR UNINCORPORATED BUSINESSES) How much was your family's shareof the total income from the business in 1967 - that is, the amountyou took out plus any profits you left in?
The figure should include the total profits from the business in 1967,including that which may be attributable to or accounted for as thehead's salary. If he does give you separate figures for salary andother business profits, write them both down, with identification,and add. If the wife or other member of the family is paid wages ora salary by the business, that should also be labeled and added in here.
J8 How much did you (Head) receive from wages and salaries in 1967, thatis, before anything was deducted for taxes and other things?
This question applies only to the Head of the family and its objectiveis to get the total amount of wages and salaries in calendar 1967.For most wage earners this is the income reported on one's W-2 form(s).It should include income from a second job if the respondent had one.It's a good idea to probe to make sure in cases where he has two jobs.Cases where you should be careful are:
1. Fixed salary rates: If R tells you that he makes $5000 a year,this need not mean that he actually made $5000 in 1967. He may,for example have had a raise in September, or have started workafter graduating from college in June. Again, we want total1967 income - not R's current salary rate.
2. Complicated work history: If R moved around several jobs andwas unemployed during part of the year, you may have to helphim reconstruct his income. It would help us if you wrotedown your figuring and sent it along.
3. Businessmen: The wages and salaries unincorporated businessmenpay themselves should not be listed here - this should be takencare of in the business sequence. However, wages they get fromsome other job should be included here.
J9-10 In additon to this, did you have any income from bonuses, overtimeor commissions? How much was that?
Note the phrase "In addition to this."
If R has already included some or all of his income from these sourcesin J8, just note that there is no need to separate it. This questionis included only as a check in case this sort of thing has been leftout of the J8 figure.

-109-
45.
J11a Did you (Head) receive any other income in 1967 from a professionalpractice or trade?
1. Income BEFORE TAXES but AFTER EXPENSES is called for here.
2. Examples of PROFESSIONAL PRACTICE are:
Self-employed doctors, lawyers, certified public accountants,etc. Income from consulting for a business firm or governmentis also included here.
3. TRADE - examples:
Self-employed plumbers, radio-repairment, etc; A carpentermay receive wages from a construction company and do independentwork in the evenings - and the latter is included here.
J11b . . . . farming or market gardening, roomers or boarders?
(Again income BEFORE TAXES but AFTER EXPENSES is called for)
1. FARMING OR MARKET GARDENING:
If farming is R's primary occupation, his income should come inQ. J2-4 and not be duplicated here, but if he receives most of hisincome from a source other than farming and some from a small farm,you should include the amount from farming here.
Income from renting farm property is "rent" not "farming" income,however.
2. ROOMERS OR BOARDERS
Money paid for rent, room or board between members of therespondent's family is not included as income here.

-ll0-
46.
J11c . . . . dividends, interest, rent, trust funds, or royalties?
1. DIVIDENDS:
Dividends are the amounts paid to owners of common and preferredstock. If R is the owner of a small incorporated business, thesalary he paid himself should be entered under J8. He may alsohave taken profits out of the business by paying a dividend tohimself on his common stock. These dividends and also incomereceived on any other stocks he may own belong here. "Dividends"on insurance policies are not to be counted at all.
2. INTEREST:
Receipts here include primarily income from government andcorporate bonds, all kinds of savings accounts, mortgages ownedas well as interest received on personal loans made.
3 . __RENT:
In addition to his own home, R may own other real estate that herents to others. The income should be net, i.e., after deductingexpenses and janitorial services, heat, light, and water, realestate taxes (but not income taxes), minor repairs (but not majoradditions).
4. TRUST FUNDS:
A trust fund is money invested by a person or group of personsfor another person known as a beneficiary. If R is a beneficiary,these payments belong here.
5. ROYALTIES
These include such things as payments for the use of propertyfor mining or drilling oil wells, use of copyrights and inventionsand payments to authors when copies of their books are sold.
J11d . . . . ADC ADCU
ADC is Aid to Dependent Children while ADCU is Aid to DependentChildren of Unemployed Fathers. Both are noncontributory publicwelfare programs, and administered by States, counties, or largecities, but generally supported by Federal grants-in-aid. Thesetwo programs cover more individuals than any other single publicwelfare program. ADC covers needy mothers with young children, whohave no husband, while ADCU covers where the father is present in thehousehold, but unemployed. Even though ADC and ADCU are supported byFederal Grants-in-aid there is great variation among the 50 states inthe number of dollars received by those covered under this program.
(J11d continued on next page)

-111-
47.
J11d(cont.)
J11e
J11f
. . . . ADC ADCU
We are very interested in getting a fairly good estimate of theimportance of this form of welfare, as distinct from all othertypes of welfare, so make sure that if the family is covered bya number of programs that the dollar amount for this program isseparate from all other forms of public welfare.
. . . . other welfare
Other welfare includes all other Public programs contingent uponthe individual's (family's) showing need. Included here are thefollowing:
1. OAA (Old Age Assistance - do not confuse with OASDI)OAA for persons 65 or older who are not working and who
find that they are not eligible forSocial Security or some other retirement pension, or findthat the benefits to which they are entitled under theseprograms are smaller than what is needed for survival.
2. AB (Aid to the Blind)-
3. APTD (Aid to the Permanently and Totally Disabled)This program covers those who find themselves unable to workbecause of disability, but yet unable to collect a pension,or for some reason, ineligible to collect benefits underthe Social Security's Disability Benefit Program.
4. General Assistance This is the catchall, covering theneedy who are not eligible for any of the above "categorical"welfare programs. Most of the funds here come from the statesor the local units of governments themselves, with no FederalGovernment participation.
. . . . Social Security
Unlike public welfare, benefits received under Social Security arehis by right, so long as you do not earn too much, in the way ofwages and salaries and the scale of benefits is based on the amountone contributes to these programs before collecting benefits.OASDHI is the abbreviation for all benefits coming under the SocialSecurity Program. (Old age, survivors, disability, and HealthInsurance) Generally, there are three types of regular benefits,not counting medicare.
1. Benefits paid to those 65 or older who are "insured" andretired. Such benefits are paid to anyone who has paid theSocial Security tax for 10 years or more.
2. Workers 50 or older who become disabled, as well as certaingroups of disabled children are eligible for disabilitybenefits.
3. Survivors benefits are paid to widows (and widowers) whosespouse was covered. Unmarried children under 18 are alsopaid a certain allowance as well.
(j11f continued on next page)

-112-
48.
J11f Some people may be receiving reduced benefits because of a fairly(cont.) large amount of post-retirement wage and salary income, even though
they are "eligible" for Social Security benefits because of theircontributions to the system.
J11g . . . . other retirement pay pensions or annunities
OTHER RETIREMENT PAY
Some retired people will be receiving deferred compensation fromfunds set up by companies for their employees.
PENSIONS
Private pensions from previous employers will be the main incomesource which fits in here. There are also various types of armedservice benefits and state government pensions. Military pensionsinclude:
a) Disability pension - for a permanent injury received whilein military service.
b) Retired serviceman's pension - an officer or an enlisted manis eligible for such a pension after 20 years service, eventhough he may be under 40 years old.
c) Educational benefits - enter only payments made directlyto R, not those paid to an educational institution.
d) Family Allotments - dependents of servicemen on active dutyreceive these allotments from the government. If R has told youthat her son or husband is in service, be alert for an answer here.
ANNUITIES
Pay received from a retirement insurance (annuity) policy will gointo this category, usually financed personally.
J11h . . . . unemployment or workmen's compensation
1. UNEMPLOYMENT COMPENSATION: All 50 states participate in thisprogram which is administered by the states, with the fundscoming mostly from employer contributions and the FederalGovernment. Even though all states cover workers, there is agreat variation between states in the amount of benefits.Such compensation covers those working only in enterprises of acertain minimum size. Agricultural workers, family workers,domestic servants in private homes, and the self-employed areusually ineligible for these benefits.
2. WORKMEN'S COMPENSATION: This is a program which is entirelystate administered with no participation or standard settingwhatsoever from the Federal Government. Benefits are paid to aworker if he incurs an injury in connection with his job, Amongthe 50 states, there is wide variation in coverage, i.e., somestates cover only those engaged in hazardous occupations, someexclude government employees. A person collecting such benefitsshould usually be considered to be "WORKING NOW."
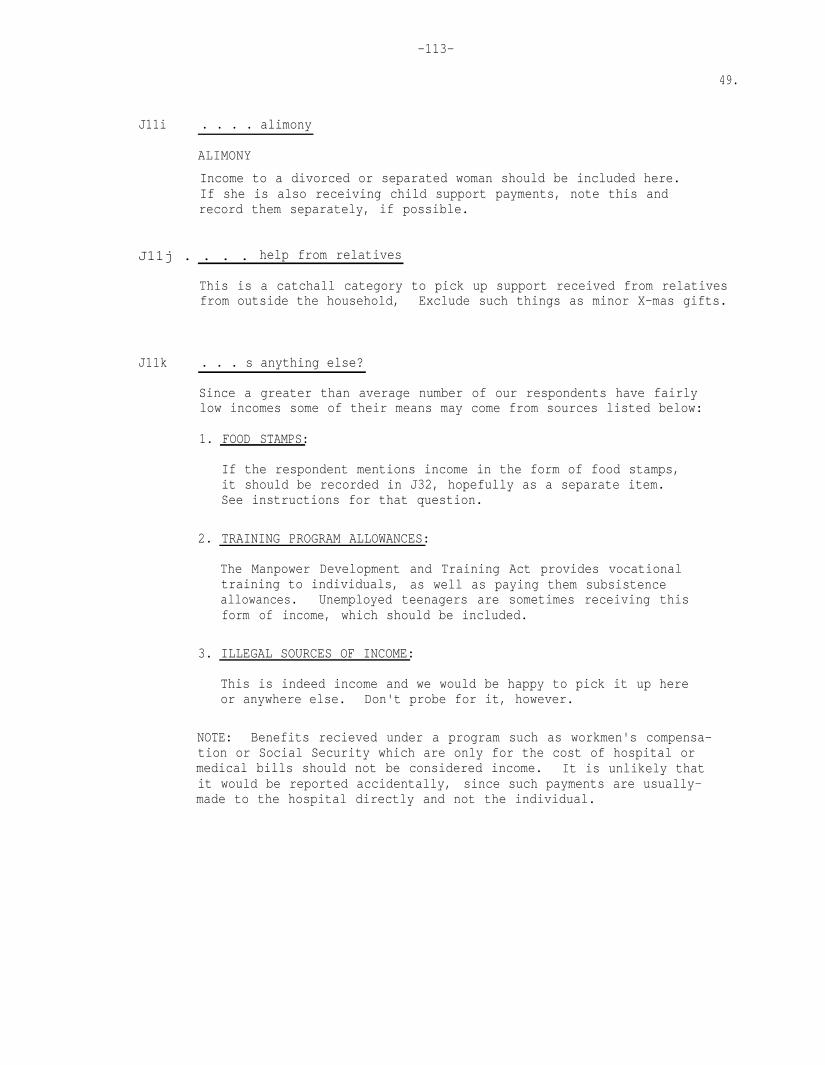
-113-
49.
J11i . . . . alimony
ALIMONY
Income to a divorced or separated woman should be included here.If she is also receiving child support payments, note this andrecord them separately, if possible.
J11j . . . . help from relatives
This is a catchall category to pick up support received from relativesfrom outside the household, Exclude such things as minor X-mas gifts.
J11k . . . s anything else?
Since a greater than average number of our respondents have fairlylow incomes some of their means may come from sources listed below:
1. FOOD STAMPS:
If the respondent mentions income in the form of food stamps,it should be recorded in J32, hopefully as a separate item.See instructions for that question.
2. TRAINING PROGRAM ALLOWANCES:
The Manpower Development and Training Act provides vocationaltraining to individuals, as well as paying them subsistenceallowances. Unemployed teenagers are sometimes receiving thisform of income, which should be included.
3. ILLEGAL SOURCES OF INCOME:
This is indeed income and we would be happy to pick it up hereor anywhere else. Don't probe for it, however.
NOTE: Benefits recieved under a program such as workmen's compensa-tion or Social Security which are only for the cost of hospital ormedical bills should not be considered income. It is unlikely thatit would be reported accidentally, since such payments are usually-made to the hospital directly and not the individual.

-114-
50.
J12-15 Wife's Income
1. Make sure the wife's income from all sources is recorded, howeversmall the amount.
2. It is a regular practice for an owner of common stock to listsome of his shares in his wife's name. So if R has indicatedthat he is an owner of stocks or corporate bonds, be on thelookout for dividend or interest income in the wife's name too.
3. If some or all of the wife's income is from work in the familybusiness it may already be included in J7. If so, note "Includedin business income" in the margin. If the amount specificallyattributable to this source wasn't given, get an estimate here.
If she had a clearly defined wage or salary from the businesswhich was not included in J7 it can be listed here but circleit and note the source and the fact it was not included in J7.
J16-17 CHECK BOX, Did (MENTION MEMBER) have any income during 1967?
Be sure to actually ask Q. J17 for all members in the household 14and older; do not assume anything. And be sure to identify otherFU members by both relationship to head and age, e.g., "SON, 21".If you think some family members are working for nothing on a familyfarm or in a family business, ask J23-25 anyway.
J18-19 Was that from wages, a pension, a business, interest or what?How much was that?
The most common source here will be wages, whether from regularemployment or odd jobs. If the respondent mentions a specific jobor occupation write it down (summer job - garage mechanic). Retiredor disabled adults in the household are likely to have income fromSocial Security or other pension plans. Children under 18 may alsohave income under various provisions of the Social Security law.This should be listed here if it has not already been included inJ11f. Income from interest, dividends, and trust funds should alsobe included. All of the above should be clearly identified.
J23-25 How many weeks did (he/she) work last year? About how many hoursa week was that? Did (he/she) work more than half time?
This series of questions is for our objective of determining thenumber of hours worked by all members of the family. Also if therespondent is not sure about how much income some "other" had, hemay know more about the amount of time spent working. In the criteriafor subfamilies, 1000 hours in 1967 (about half time) may be taken asequivalent to $2000 income if the income is not available. "More thanhalf time" here refers to the average over the year.

-115-
51.
J26 Does (he/she) share in the family's expenses or what?
This question is phrased so that it can be answered by a simple"Yes" or "No," with some space for elaboration if the respondentoffers it. If R indicates the degree of sharing is small, theperson should not be considered as sharing. The person should besharing a substantial portion (roughly half or more) of his incomein order for J26 to be answered "Yes."
J27 Is (he/she) likely to stay here with you or might (he/she) moveaway within the next few years?
This is another one of the criterion questions used in determiningwhether or not the individual in question should be considered a"subfamily." "Move away” means move into another DU, not necessarilyout of town. "Within the next few years" is purposely indefinite toallow for different planning horizons. A "Yes" or "No" is notsufficient here since we won't know to which of the alternatives the"Yes" or "No" applies. Might move and other more positive responses-"probably will move," "yes, he'll move" etc., fulfill the criteria.Equivocal answers "he might move - he might not" and more negativeanswers do not fulfill the criteria. If you get a "Don't Know"answer, probe to find out which is more likely.
SUBFAMILY DETERMINATION
There are three criteria, all of which must be met if an extraadult (or family) is to qualify as a subfamily to be interviewedseparately. Thus there is no point worrying about fine distinctionson one of the criteria if it is clear that one of the others is not met.
The criteria are:
1. More than $2000 income in 1967
If the respondent doesn't know the income for this person he mayknow the hours of work so 1000 hours of work in 1967 may be takenas an alternate criterion. If that is also unknown or unclearthe respondent ought at least to be able to tell whether theperson in question worked a lot or a little - more or less thanhalf-time in 1967 -so we use a positive answer to J25 "Did (he/she)work more than half time" as a second alternative criterion. Thereason for the double back-up is that the respondent is apt toknow less about those members of the household who are moreindependent,
2. Does not share in the family expenses
Especially in cases where this is the deciding factor, we want itinterpreted more stringently. "Does not share a substantialportion of his income in meeting family expenses." See instruc-tion for J26.
3. Is likely to move out in the next few years
If an extra adult fulfulling the other criteria is more likelythan not to move out, then this criterion is fulfilled.

-116-
52.
J28-29 Did you get any other money in the last year - like a big settlementfrom an insurance company, an inheritance, or anything?
This question is designed to pick up sums of money which may beimportant in determining the family's current financial status butwhich may not be included in strict concepts of income. In the caseof insurance settlement we don't want sums which went directly to payfor medical expenses and the like, but we do want the amount leftover after such expenses. Insurance settlements which might be includedare payments for "pain and suffering" and life insurance payments.Other things to be included are inheritance of money, large giftsfrom someone outside the household, or money from repayment of a loanto someone in the family by someone outside the family. Money fromthe sale of property should also be included. The amount given inJ29 should be the total of such amounts for all members of thehousehold. If the respondent mentions an inheritance or large giftof property it should be noted in the margin with an approximate value.
J30-31 Did anyone here get more than $50 worth of food or clothing as partof their pay? About how much would that be worth?
Note that this question is restricted to food and clothing -- itshould not include such things as transportation or medical carereceived while on the job. Also, it is restricted to those in thefamily who worked last year because we are interested in food andclothing received as a job benefit. It should include such thingsas lunches or other meals received, the amount saved from subsidizedmeals, special shoes, uniforms, etc., that R did not have to buyhimself. The dollar amount given in reply to J31 should include thetotal for all members of the family. This should be especiallyrelevant for domestics and other service workers who quite oftenreceive food as part of their pay.
J32-33 Did you (Family) get any free food, clothing, or food stamps worthmore than $50 in 1967?
This is free food and clothing as opposed to that which was receivedfrom an employer as part of one's income. The latter was coveredin J30-31.
The $50 threshhold here is to avoid worrying about relativelyunimportant amounts. Above $50, accuracy to the nearest $50 isadequate.
Food stamps present a special problem because the family often payspart of the cost of food. For instance they might pay $20 for $45worth of food stamps. In such cases you need to determine how muchthey saved because what they paid for the stamps should have beenincluded in E5. If the above family received stamps twice a monthfor six months then their saving last year would be $25 x 12 = $300.00.If the family received both food stamps and other free items, we wantto know the separate amounts.

-117-
53.
J34-35 Was your family's income a lot higher or lower than usual thispast year (1967)? Why was that?
All of the income questions we have asked refer to this past year.Our interpretation of the family's economic status will be differentif it was an unusually high or low income year, than if it wasnormal. The question is phrased "a lot higher or lower than usual"to exclude small variations like a cost of living increase or alittle less overtime, but if the respondent answers with such inmind accept and go on. Typical reasons for larger variations are- wife working or not working if she had been, illness or unemploy-ment, head having a second job or a promotion. Don't includeextraordinary expenses in the answer, they belong in J39-40.
J36-37 Does your family's income change from month to month, stay thesame over the year or what? Why does it vary?
The question asks about income variation within the year as opposedto the year to year variation asked about in J34. This sort ofvariation is important because of the necessity for careful planning- saving in months with higher income so as to meet expenses whenincome is low. Reasosn for variation might include seasonalunemployment or overtime, unsure health of the main earner, wife'sfreedom to work when children are in school, etc.
J38 Would you say you are better off financially than you were a fewyears ago or are you in the same situation?
This is a broader question than the previous sets of questions,since it refers to both income and expenditures, and to anythingelse that affects one's economic situation. The family might bebetter off because of fewer mouths to feed, or because the head'sjob is steadier even if it does not pay more. The head might bemaking more now but be "about the same" because of the higher costof living. Any number of expenses or income factors or evendissatisfaction with rate of progress might lead the respondent tosay his situation is worse than a few years ago. The answer mustspecify at least "better," "same," or "worse." "Yes" or "no"answers are inadequate.
339-40 Is there anything that makes your family's expenses unusually high?
This question refers to the current situation, and can include suchthings as educational expenses, unusual medical expenses, legalexpenses, high debt payments, or anything the respondent sees asmaking his expenses higher than those of an average family. We wantto know this even if the family economizes on other things to bringtotal expenses down.

54. -118-
J41-43 IS anything likely to happen over the next few years that will makethings much different for your family -- like more or less earners,a better job for you, or fewer people living here? What is that?Will that make things better or worse financially?
This question again refers to the overall economic situation thatwe asked about in J38 but here we are asking the respondent to lookahead to his future situation. If he finds this difficult and givesonly a noncommital answer or "don't know" do not push him or probe,since replies to succeeding questions would probably be forced andmeaningless. The respondent may give a change, the economic conse-quences of which are unclear; "My son is leaving" might mean fewermouths to feed or it might mean less income, - hence the final probe.Our use of "less earners" instead of "fewer" is more colloquial thancorrect but is intentional.
J44 Are there any people who do not live with you who are dependent onyou for more than half of their support? How many are there? Howmuch did that amount to last year?
This refers to dependents who can be claimed for tax purposes, suchas a child in college, an aged parent in an institution, or otherdependents outside the household. We want the total dollar amountthat this entire family, not just the head, contributed to all thesedependents' support during 1967. If R volunteers that part of thissum is going for an expense such as college tuition which is not aliving expense, note this in the margin with the dollar amount thatgoes for this if possible.
J46 Do you (Family) have parents or other relatives that you would feelyou had to help (more), if you had more money?
Our objective here is to find out if there might be a negativeincentive to R's earning more money, since it would have to go forcare of others rather than to him. A "Yes" or "No" reply is adequatehere.
SECTION K
We are interested in all the ways the respondent spends his non-working hours, from rest and relaxation to spare-time work helpingrelatives, but particularly those that may help him find bargains,jobs, etc. We also ask about activities such as taking courseswhich may have economic significance.
Kl We're interested in the ways people spend their spare time. Whatthings do you (Head) usually do in your spare time?
"Spare time" means time not spent working for pay, doing regularhousework, eating, sleeping, etc. It should include, however, timespent working on do-it-yourself projects or for community serviceorganizations. "I don't have any spare time" is a relatively frequentresponse to the question. In such cases probe "Why is that?" or "Howdo you mean that?" in order to find out whether (he/she) spends all ofthe time working, or whether spends some of it doing things we wouldconsider to be spare time activities. In the latter case we want toknow what the activities are. Activities may be those done by the headalone or together with the family.

K2
K3-4
K5
K6
K7
-119-
How often do you (Head) go to church?
55.
Church refers to any type of religious services. A specific quanti-tative reply like "once a month" is desirable but partially quantita-tive responses such as "occasionally" or "frequently" are acceptableas well.
Are you (Head) taking any courses or lessons? What are you(Head) doing?
"Courses or lessons" can refer to practically anything - all theway from taking college courses to bowling lessons. This shouldinclude any Manpower Retraining Course or on-the-job trainingthat the Head may be involved in.
About how many hours a day do you (Head) usually watch televisionon an average weekday?
By "watch" we mean give attention such that it excludes doing otherwork. We do not mean by "watch" having the TV going all the timeand working around it. If, for instance, the respondent says "Iwatch it while I'm doing housework," write this down and then askhow much time she actually sits down to watch programs. Here,"about two hours," "all evening," are acceptable replies.
How often do you (Head) read a newspaper - every day, once a week,or what?
Our objective here is twofold -- first to get a measure of whetheror not the Head ever uses such an information source, second as apreliminary indication of whether he might have difficulty reading.Again, replies such as "every day," "once a week," or "never" areacceptable.
About how many people in this neighborhood do you know by name?
This means number of adults. It serves as a measure of connectednessto the local community. The geographic size of the "neighborhood"will vary. It might be a few blocks in the city or an entire smalltown. Accept whatever R thinks of as 1 is neighborhood. In generalneighbors are within easy walking distance.

56.
K8
K9-10
-120-
Do you (FAMILY) have any relatives who live within walking distance of
"Relatives" of anyone in the family is what we mean by relatives inthis question. A "Yes" or "No" is an adequate reply here. Be alertfor R's parents or children living somewhere else. Many people thinkof such close kin as being family, not relatives, but they should berecorded here if within walking distance.
Did you spend more than 40 hours helping friends or relatives lastyear? About how many hours was that?
We mean friends and relatives outside the DU where the family lives.Our purpose here is to get a measure of family help patterns. Do notinclude here time that R may have given to churches, charity, or otherinstitutions. Again there is a threshhold, so as not to bother thoseworking only a few hours with a "how many" question.
K11-14 Did you get any free help with housework, babysitting, or anythinglike that in the last year (1967)? Did it save you as much as $50?About how much did it save you? Was it from someone who doesn'tlive here?
Include here any help received by the family, whoever it is from.Nursing services, housekeeping services, and free care of children(even if they are left at someone else's house) are examples of suchhelp. If they received any other kinds of help which saved themmoney and which have not been evaluated before, include them herewith explanation. The $50 threshhold is to save time if the amountis small. We edit out help from people in the same household.
K15 How often do you (Head) go to social organizations or clubs?
These can be fraternal, charitable, religious, community action,neighborhood clubs, etc. Include here meetings or activitiessponsored by the organization, and casual attendance.
K16 How often do you (Head) go to a bar or tavern?
When asked matter-of-factly this question rarely bothers anyone. IfR volunteers night clubs, race tracks, gambling casinos, etc., youshould include them here. This is important as a possible source ofdisproportionate expenditure. Answers such as "rarely" or "everytwo weeks" are acceptable here.
K17-18 Do you (Head) belong to a labor union? How much did your union duesamount to last year?
Two objectives are wanted from this question. First, belonging toa union can make it easier to get a job and make the job he now hasmore secure. Second, union dues, coupled with initiation fees arequite expensive, and hence the annual dollar outlay for such expensesare important to know.

-121-
57.
SECTION L: ATTITUDES AND FEELINGS
The purpose of this section is to tap the respondent's image ofhimself, and some of his attitudes and feelings about life ingeneral. We are particularly interested in his feelings about hiseconomic situation and attitudes which may affect his economicbehavior. Most of the questions give two alternatives from which
the respondent selects one. We have left space to write down whatthe respondent says but if he simply repeats one of the two phrases,you can save time and energy by simply circling the phrase herepeats and writing any additional comments he makes in the spaceprovided.
We will code free form answers and qualified responses on a scalebetween the two alternatives so you needn't force a response intoone category or the other. Be sure to write down such brief addi-tional comments as "usually" or "definitely."
L1
L2
L3
L4
Have you usually felt pretty sure your life would work out theway you want it to, or have there been more times when you haven'tbeen very sure about it?Are you the kind of person that plans his life ahead all the time,or do you live more from day to day?When you make plans ahead, do you usually get to carry out thingsthe way you expected, or do things usually come up to make youchange your plans?Would you say you nearly always finish things once you start them,or do you sometimes have to give up before they are finished?
The first four questions have been used on a number of our studiesto form a scale, sometimes called sense of personal efficacy. Theyshould create no problems except for an occasional respondent whostarts talking about the way he or the world should be, instead ofthe way it is, in which case you should repeat the question.
How much do you like to do things that are difficult and challenging?
This question should lead to answers varying from very much to notat all. For normative answers such as "not as much as I should" youshould repeat the question "How much do you actually like to dothings . . . ?
L6 Would you rather spend your money and enjoy life today or save morefor the future?
Again, this will be coded on a scale so answers from “save” or“spend” to “I save enough for security and spend enough to livecomfortably” are acceptable. “I ought to save more” is inadequate,but “I ought to save but I never do” is acceptable.
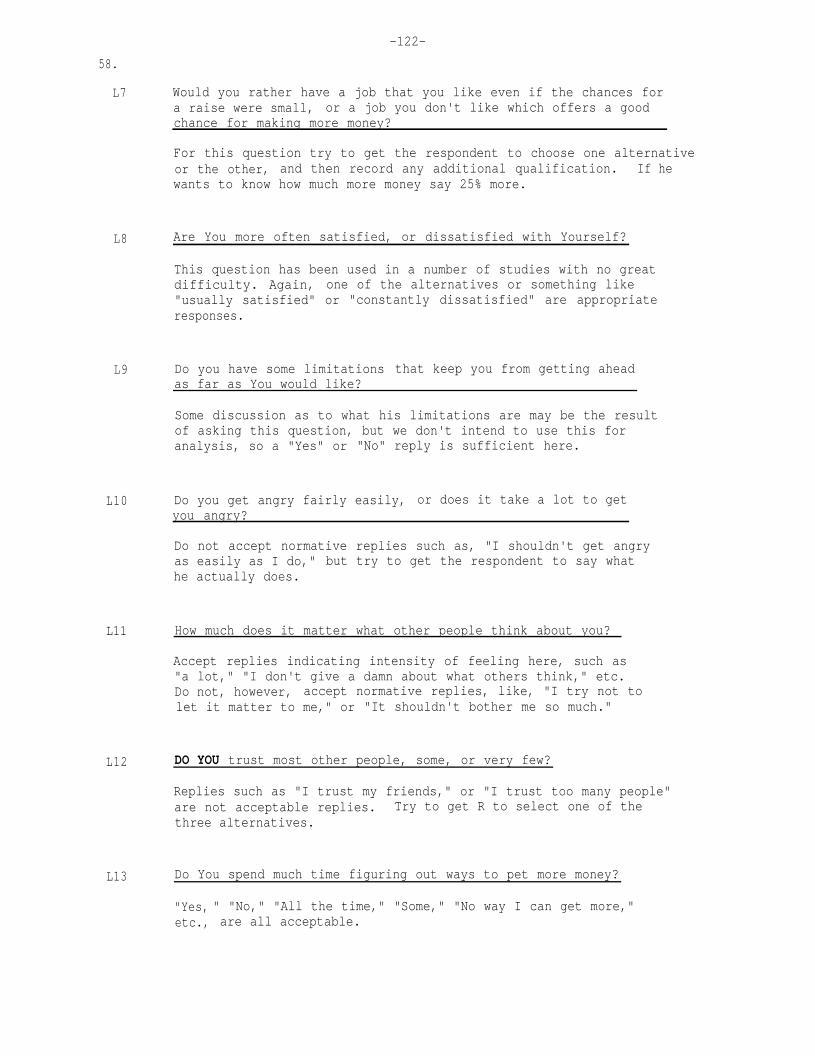
-122-
58.
L7 Would you rather have a job that you like even if the chances fora raise were small, or a job you don't like which offers a goodchance for making more money?
For this question try to get the respondent to choose one alternativeor the other, and then record any additional qualification. If hewants to know how much more money say 25% more.
L8 Are You more often satisfied, or dissatisfied with Yourself?
This question has been used in a number of studies with no greatdifficulty. Again, one of the alternatives or something like"usually satisfied" or "constantly dissatisfied" are appropriateresponses.
L9 Do you have some limitations that keep you from getting aheadas far as You would like?
Some discussion as to what his limitations are may be the resultof asking this question, but we don't intend to use this foranalysis, so a "Yes" or "No" reply is sufficient here.
L10 Do you get angry fairly easily, or does it take a lot to getyou angry?
Do not accept normative replies such as, "I shouldn't get angryas easily as I do," but try to get the respondent to say whathe actually does.
L11 How much does it matter what other people think about you?
Accept replies indicating intensity of feeling here, such as"a lot," "I don't give a damn about what others think," etc.Do not, however, accept normative replies, like, "I try not tolet it matter to me," or "It shouldn't bother me so much."
L12 DO YOU trust most other people, some, or very few?
Replies such as "I trust my friends," or "I trust too many people"are not acceptable replies. Try to get R to select one of thethree alternatives.
L13 Do You spend much time figuring out ways to pet more money?
"Yes, " "No," "All the time," "Some," "No way I can get more,"etc., are all acceptable.

-123-
L14
59.
Do you think a lot about things that might happen in the future,or do you usually just take things as they come?
Again, do not accept replies such as, "I try not to," but try toget R to give his impression of what he actually does. Selectionof one or the other of the alternatives is sufficient.
L15 Do you think the life of the average man is getting better or isit getting worse?
The word "Better" or "Worse" is an adequate reply. If the respondentanswers in two or more frames of reference, "There's more jobs butthere's air pollution and the war too" write it down and then askwhether he thinks it's better, worse, or about the same overall.
L16 Are there a lot of people who have good things they don't deserve?
If R asks what is meant by "good things," you can say money, wealth,a good job, and economic good fortune in general. "Yes" or "No"are adequate replies here. "Some, not a lot" and "Not for me tojudge what other people deserve" are also acceptable.
SECTION M: THE PAST
This is the demographic section and questions here are similar tomany that have been asked before; many of our objectives here arequite obvious.
Ml Where did you (HEAD) grow up?
"Grow up" refers to the period between about ages 6 and 16. If Rmentions several places, tell him we want the place where he spentthe largest number of years between ages 6 and 16.
M2 Was that on a farm, in a large city, small town, or what?
If R replies "small city," "village," this is okay.

-124-
60.
M3-5,7,8 How many grades of school did you (HEAD) finish? Any othertraining? What?
A simple number here is adequate as are answers such as "Ifinished high school in night school." Some respondents maymention G. E. D. T._ ---- which is a high school equivalencycertificate given by the armed services.
On the basis of the answer to M3 you should ask either thesequence for 6 or less grades or 7 or more. Both sequencesfirst ask about any additional training. This encompassesapprentice training, training under some Federal retrainingprogram, adult education course, beauty college, universityeducation, etc.
M6 (FOR THOSE WITH 6 GRADES OR LESS)
Do you have any trouble reading?
Inability to read is a serious handicap in filling out jobapplications, etc. It is likely to be relatively frequentamong those with little education and will help explain arespondent's economic status.
The question is phrased in such a way as to let someone whofeels embarrassed get himself off the hook with a reply like"Yes, I have trouble with my eyes." Don't probe if it seemssensitive.
M9,10 Do you have a college degree? What degrees did you receive?
These questions are asked only if respondent attended an academiccollege (Barber, or Beauty, or Secretary "Colleges" are simplyvarieties of "other training, schooling.")
We want to know whether they graduated and what degrees theygot. Appropriate answers for M10 are BS, MSW, MD, BA.
M11 Are you a Veteran?
A veteran is anyone who has been a member of the U.S. ArmedServices and is hence entitled to veteran's benefits. He neednot be a war veteran.

-125-
M12 How many brothers and sisters did you have?
We want the number of siblings in the Head’s family when he wasgrowing up. They need not all be alive now.
M13 Were your parents poor when you were growing up, pretty welloff, or what?
We want the respondent’s subjective estimate here. If hementions that he was not living with his parents then thequestion applies to the family he grew up with. “Poor,”“Average, ” “Comfortable, “It was the depression but we wereno poorer than anyone else,” are all acceptable. If therespondent had no family, note this and continue.
M14- 15 How much education did your father have? Could he read and write?
If the R indicates no recollection of a male head of family whenhe was growing up, omit these questions.
If the Head’s father died while he was very young, you may askthese questions about the male who was his step-father orguardian about the time when he was growing up.
NOTE : When you have asked all the questions in this section youshould next go to the Cover Sheet, Page 4, IN ALL CASES. Thequestions asked on page 4 of the cover sheet differ according towhich sample you are interviewing, and according to which partof those samples. Instructions for using the word list follow,after the instructions for Section N (By Observation Section),as do instructions for asking the questions necessary tosecuring a reinterview.
SECTION N
Do not ask any of these question of your R, but complete thissection as soon as possible after the interview, while you stillremember the interview situation.
Who was present during interview?
61.
This should include people present long enough so that they couldeither be distracting or perhaps influence the replies of therespondent. Children and other adults, by relation to head if youcan tell, should be given here. “Three children in and out” is anadequate reply. You needn’t record yourself here.

-126-
62.
N2 Who was respondent?
N3
We have asked you to interview the head of the FU, but in caseswhere he will be away for the entire interviewing period, someoneother than the head may have been your R.
Race?
This question refers to the HEAD of the family, but note in marginif family is racially mixed.
N4 Number of calls
Count as separate calls, those that are one hour or more apart;information can be transferred from the Call Record on Page 1of the Cover Sheet.
N5 How clean was the interior of the DU?
All that is needed here is your impression of the room you werein when taking the interview and nearby rooms that may have beenvisible to you. A look of chaos or temporary disarray does notnecessarily imply dirtiness, so the fact that toys, newspapers,and hobbies are all over the place should not influence yourreply, nor should the cost, quality, or newness of the DU or itsfurnishings influence your answer,
N6 How much reading material was visible in the DU?
Reading material does not refer to things that obviously belongto the children, e.g., children's comic books,
children's school books, etc. It does refer tothings that might be read by the head of the family and/or hiswife. Obviously the reply here might be slightly biased sincethe room where the interview was taken may be the only roomwhere there is no reading materials. But do not ask to inspectthe DU for reading material.
N7 About how many times did you have to repeat a question?
Repeating questions for any purpose should be counted. A quali-tative reply such as "many times" is acceptable, but if you write"R.Q." (repeat question) by those questions you had to repeat,you should be able to provide us with a quantitative reply.

N8
N9
N10
N11
There will be some ambiguous cases. The DU may be closer to alarge sprawling city if you measure to the city limits but notas close as to another if you measure to the central businessdistricts. In such cases, list both and explain.
How far is this DU from the center of that city?
Center of the city refers to the central business district. Ifthe situation is ambiguous, explain, and perhaps sketch a map.
N12 Type of structure in which family lives
-127-63.
About how many times did you have to ask R to repeat a reply?
Whether or not you had to ask R to repeat a reply because of aforeign accent, regional accent, speech defect, low voice, orwhatever, it should. be counted as having to ask R to repeat a reply.
Does R have any obvious disfigurements or habits which might makeit difficult for him to get a job?
Examples of such handicaps might be severe nervousness, speechdefects, extreme obesity, severe scars or birthmarks, cerebralpalsy, other paralysis, obvious alcoholism, etc. Exclude minorannoyance such as an unpleasant voice. We expect these charac-teristics to apply only to a small fraction of the population.
What is the name of the nearest city of 50,000 or more?
It would be a good idea to have a state road map when answeringthis question. Remember that in large metropolitan areas there areoften suburban cities over 50,000. If this address is closer tosuch a suburban city than to the central city then we want thename of the suburban city here.
1.
2.
3.
4.
5.
6.
Trailer - include those which have been set up permanently ona lot, even if additional rooms have been added.Detached single family house - structure housing one familyand not attached to another dwelling.2-Family house, 2 units side by side, often called a duplex.It usually has separate entrances for each unit.2-Family house, 2 units one above the other. This may havebeen originally designed as two units, or have been convertedfrom a 1 family house. May or may not have separate entrance.Detached 3-4 family house this can include a large houseconverted to apartments or a small apartment house. If thebuilding is attached to others in the block, cross off theword "detached."Row house: This is a single family unit with a separateentrance in a row of such units, attached so that they sharecommon side walls.
7. Apartment in a partially commercial structure. This may be anapartment located above or in back of a store or business orliving quarters that are part of one place of business. Includealso large apartment buildings with shops on the first floor. Adoctor's or lawyer's or other professional's office - a singlehome should not be counted.
8. If you have any doubts describe the structure.

-128-
64.
N13 Neighborhood
1. Check the types of 3 structures that are in the respondent'simmediate neighborhood on each side but not more than 100 yards awaythe length of a football field. Do not include the structurein which R himself lives, houses on the other side of the streetor houses in back of R's house which form another street.
2. The "vacant land ONLY" category applies in cases where thereis no structure within 100 yards of R's DU on either side.If the land is vacant only on one side of R's DU, then justcheck the appropriate box(es) for structures on the other side.
N14 Is this DU located in a public housing project?
By "public housing project" we mean government sponsored low renthousing. Projects are usually distinguished by a large number ofunits with similar, usually uninspired, architecture. The respon-dent is also likely to refer to it as a project during theinterview.
THUMBNAIL SKETCH
Please describe things which may indicate the amount of familysolidarity or friction and the respondents interest in theinterview. Also are there any factors which would be importantin explaining the families economic status but which were notcovered fully or at all in the interview? We would also likeyou in this Thumbnail sketch to rank the condition of the dwell-ing unit and the neighborhood in which this family lives. Sofar as the housing is concerned no&especially whether or notthere is evidence of only an outside toilet, no running water,or whether there are any really basic repairs that need to bedone. When ranking the neighborhood, you might take the follow-ing into consideration: junk and litter in the streets or alleys,the presence of many old abandoned houses, the presence of drunksand other human derelicts around the area.
--

-129-
The University of MichiganSurvey Research CenterMarch 1968
SUPPLEMENT TO P. 45768 INSTRUCTION BOOK - INSTRUCTIONS FOR CENSUS SAMPLE
INTRODUCTION
These instructions are to be used in conjunction with the main instruction bookfor the Panel Study of Family Economics. Those of you who have both cross-section and Census samples have already received the main instruction book andthose of you who have only the Census sample will receive it with these supple-mentary instructions. Section I and IV of the main instruction book areapplicable in their entirety to both samples; Section II is applicable only tothe cross-section; some parts of Section III are applicable to both samples andothers are applicable to only the cross-section. Interviewers who have Censussample only, then, may skip over Section II of the main instruction book butmust read the other three sections.
SAMPLING PROCEDURES FOR THE REINTERVIEW SAMPLE
Sample of Families
The names sent to you on addressed cover sheets identify a sample of familiesinterviewed in 1967 by the Census Bureau. YOU may in some cases receive thename of two families at the same address. Whatever the situation may be, YOUare to interview only in those families identified by the names and addressesappearing on the yellow cover sheets. YOU are not to inquire about additionalfamilies within the dwelling or about additional dwellings at an address.Furthermore, if a sample family has moved from the address shown on the coversheet, you are to try to determine the present address of the family and inter-view the family head at the new address if it is within your sample area. (Donot interview the new family at the 1967 address from which the sample familyhas moved.) If the new address is outside of your ares, send the cover sheet withthe new address noted, to the Field Office.
If an adult family member has left the family during the past year, you are todetermine the new address of the adult and interview the head of the new familyunit at the new address (or send the cover sheet to the Field Office when thenew address is located outside your area).
If there are any adults who qualify as subfamilies within the sample family,each subfamily herd is to be interviewed.
Sampling Materials for the Study
1. Addressed yellow Cover Sheets
In item 6 on page one the name of the family head and the 1967 addressappear. In addition the age, sex and race of the head, and the number ofpersons in the family unit (FU) have been recorded.
2. Unaddressed pink Cover Sheets
A pink cover sheet is to be made out for: (a) each subfamily within a mainfamily whose name and address is on a yellow cover sheet; and (b) eachadult who has left the main family since the 1967 interview was taken.

-130-
3. Sample Address Summaries (green)
The sample address summaries have been prepared to help the office contactwith record keeping. These forms are not to be returned to the Field Office.
Locating the 1967 Addresses
Generally, the address on the yellow cover sheet will be clear and complete andcan be located without difficulty. Because the original sample was a segmentsample, you may find that there are several addresses within a neighborhood.The codes appearing in the upper right-hand box on the yellow cover sheet includea segment number and a household serial number, as well as PSU and family codes,arranged as follows:
Therefore, within a PSU, we may expect that cover sheets having the same segmentnumber will have nearby addresses; if you can locate one address within asegment, the others should not be difficult to find.
Notice that in addition to the address, item 6 on the yellow cover sheet some-times contains a telephone number which may help you to locate the sample family.
If you are unable to locate a sample address, write the Field Office.
Whom to Interview
The preferred respondents are heads of families as explained on pages 9 and 10of the Instruction Book for the Panel Study of Family Economics.
Page 3 of the yellow cover sheet and the interview with the family head willgive you direction on when to interview a subfamily or an adult who left themain family during the past year.
Use of Pink Cover Sheets
When it has been determined (from the interview with the main family) that anadult who left the family, or a subfamily is to be interviewed, a pink coversheet is to be prepared by entering information on page 1, as follows:
1. To the upper right-hand BOX, transcribe the identification codes from thecorresponding box on page 1 of the yellow cover sheet.
2. In item 2 record the PSU name as it appears in item 2 of the yellow coversheet. Items 3, 4 and 5 are to be completed later, as appropriate.
3. The identifying information to be recorded in item 6 is determined in thefollowing way:
a. If the pink cover sheet is to be used for an adult who left the mainfamily: Transcribe the name and address from section 2, page 3,of the yellow cover sheet.
b. If the pink cover sheet is to be used for a subfamily: On the pinkcover sheet record the name of the adult (or of the subfamily headwhen there is more than one person in the subfamily). The address isto be the current address of the subfamily (person).

-131-
3
4 . To determine the box to be checked in item 6a, refer to item 6a, page 1,of the yellow cover sheet:
a. If the first box is checked on the yellow cover sheet, check thefirst box on the pink cover sheet;
b. If the second box is checked on the yellow cover sheet, check thesecond box on the pink cover sheet.
5. Item 7:
a. Check the first box if the pink cover sheet is to be used with asubfamily interview;
b. Check the second box if the pink cover sheet is to be used for anadult who has left the main family.
NOTICE
Now that the pink cover sheet has been printed, we find ourterminology confusing. We suggest that the term "primary"in item 6 and 7, page 1, be interpreted as "main" familyidentified by the name and address on page 1 of the yellowcover sheet.
When To Use Word List
Please refer to item 6a on page 1 of the cover sheet, yellow and pink:
a. If the first box is checked, USE WORD LIST.
b. If the second box is checked, DO NOT USE WORD LIST.- -- -
Respondents in Nondwelling Unit Quarters or on Military Reservations
We are including in the current study some 1967 respondents who at that timewere living in nondwelling unit quarters or in dwellings on military reservations.If you have problems in locating or contacting such respondents, get in touchwith the Field Office.

-132-
FIELD NOTES
Study Dates
4
The starting date of interviewing for the Census sample will vary because themailing of materials will be done over a period of time. We will start mailingmaterials on March 18 and from then on will send them as they are prepared. Theending date will be specified individually for each PSU in order to take intoaccount the work load and other individual contingencies. Your PSU shouldfinish its assignment by MAY 31
Practice Interview
If You are working on the cross section sample too, then you have already takena Practice interview, but if you are working on only the Census sample and havenot Yet taken a practice interview, you must do SO before you start productioninterviewing. In order to practice with a typical respondent, you should go intothe nearest low-income area and ring doorbells until you find the head of afamily available and willing to be interviewed, preferably someone under age 60.Edit your practice interview immediately and send it to your supervisor. Shewill review it and send it back to you with notes and comments. If you have notreceived Your supervisor’s comments on the practice interview when you are readyto start interviewing, you may start without hearing from her.
Denote this interview with the word "PRACTICE" prominently on the first page andbe sure to attach your name or other identification.
Materials You Should Have For P. 45768 Census Sample
Instruction Book with Beige Cover and Supplementary Instructionsfor Census Sample . . . . . . . . . . . . . . . . . . 1 per interviewer
Questionnaires . . . . . . . . . , . . . . . . . . . . . . 1
Respondent Letters to send to head of family who isnamed on yellow cover sheet . . . . . . . . . . . . . 1
Respondent Letters to send to adult members of familywho have moved away since last year . . . . . . . . . 5
Franked Envelopes for Respondent Letters . . . . . . . . . 1
Word List Show Card. . . , . . . . . . . . . . . . . . . . 1
Green Postcard for Respondents to send in January 1969to update addresses . . . . . . . . . . . . . . . . . 1
“Why Do We Ask You?” Folders . . . . . . . . . . . . . . . 1
Interviewer’s Card . . . . . . . . . . . . . . . . . . . . 1
Card for Determining Family Head . . . . . . . . . . . . . 1
Progress Report Forms and Project Completion Form. . . . . 1
Copies of Press Release. . . . . . . . . . . . . . . . . . 2
Envelope(s) of Sampling Materials (Contains addressed yellow_
per yellow coversheet, plus 10%extras
per yellow coversheet, plus 10%extras
per yellow cover sheetplus 10% extras
per interviewer
set per PSU (forOffice Contact’s use)per PSU
cover sheets,pink cover sheets, maps in some cases)
per yellow coversheet , plus 20%extras, plus 2 perinterviewer
folded and 1 unfoldedper yellow coversheet
per interviewer
per yellow coversheet plus 3 extrasper interviewerper interviewer. inspecified PSUs

-133-
Respondent Letter5
You should send a respondent letter to each family for whom you have a yellowcover sheet, timed to arrive just a few days before you plan to call. Addressthe letters by name and mailing address. In some cases you will not havemailable addresses and will not be able to send a respondent letter in advance -in this case you should just hand a letter to the person who comes to the door.The folded letters are for sending out in the mail before you visit, and theunfolded ones are to carry with you to show and/or leave with respondents whosay they didn't receive a letter.
you will note that we have stamped "Address Correction Requested" on the frankedenvelopes we have furnished for respondent letters. This is to take advantageof a new postal service whereby, when mail is forwarded, the sender is furnishedthe forwarding address for a 15 cents charge. Please paste one of yourinterviewer's labels over the Field Office return address printed on theenvelope before you send each letter so that the forwarding address will befurnished to you rather than to US. Then, when a respondent has left aforwarding address, the letter will be forwarded and a Post Office form showingthe new address will be delivered to YOU and the 15 cents charge collected.
We are also sending letters for those who have moved away from the Original1967 family. Use these as the occasion arises.
Refusals and Persuasion Letters
It is often useful to exchange your refusals with another interviewer's refusals.Often a different person calling at the address will impress the respondentwith the importance of his being interviewed.
If you feel a personal letter from the office, signed by the Center Director,Angus Campbell, might reverse a refusal, please write and request that apersuasion letter be sent. In a request for a persuasion letter include thefollowing information:
1) Name and mailing address, plus segment and serial number for furtheridentification.
2) Whether you talked personally to the head, or whether some other personkept you from getting to the head.
3) Circumstances of refusal, plus any information you might have aboutrespondent and/or family which might be useful in adapting a letter to theindividua1 circumstances.
4) Whether you or another interviewer is going to call again after thepersuasion letter is sent, so that we can mention in the letter the nameof the person who is going to call.
We will send a carbon copy of the persuasion letter to you on the same day wesend the original to the respondent.
Progress Report Forms
The person who is the office contact in each PSU must fill out one of theseforms each Friday and mail it to her/his supervisor. She/he need send one tothe Field office only on Friday, April 19. We will be using the same progressreport form for the Census sample as for the cross section sample, so the form

-134-6
is not quite appropriate in some regards, such as, for example, item 1 mentionsincluding newly discovered DUs at sample address, whereas for the Census sampleyou will not be concerned with any DUs other than the one where the sample familylives. Include split-off members and subfamilies in the total sample sizefigure. Classify movers for whom you are unable to get a new address as NS, notNI. Make a separate notation of the number of cover sheets that you have returnedto the office because the family moved to a place more than 50 miles from aninterviewer in your PSU, because this type of case does not fit under any of theitems on the form.
Mailing Rules
Rule A in the beige instruction book is not applicable. Use Rule B throughoutyour interviewing on the Census sample.
General Information About the Census Sample
See pages 1 through 4 of the main instruction book for general information,especially “Census Sample Details” on page 3.
Each yellow cover sheet will have typed in at item 6, the name of the head of asample family, the address where the family lived when interviewed in March orApril 1967, the age, sex, and race of the head, the number of people in thefamily at the time of the spring, 1967, interview, and the phone number as oflast year’s interview. Basically, your job will be to locate all personscurrently between the ages of 18 and 61 who were members of the sample familylast year and to interview the person determined to be the head of the family ateach location where at least one of such family members now lives. In mostcases, the adult members of the family will still be together in the samehousehold, either at the same address or at a new address that they have movedto together. But when persons between the ages of 18 and 61 have separated fromthe main nucleus family in the past year (as picked up at Q.13 in thequestionnaire), then you must try to get their new address (and enter it atitem 2 on page 3 of the yellow cover sheet) and fill out a pink sheet andinterview them too.
Since the Census sample is a sample of named families, you should interview atan address only those families named on a yellow cover sheet. Ignore and donot interview unrelated secondary families unless, of course, you have a separatecover sheet.
Format of Cover Sheets
The use of pages 1 and 2 of the yellow and pink cover sheets will be quite clear.Page 3 of the yellow cover sheet is for entering information about families whohave moved together to another address, members of the family 18-61 who haveleft the family since last year (split-offs), and family members who meet thecriteria for consideration as a subfamily (pages 22 and 23 of the questionnaire).Page 3 of the pink cover sheet is blank because that cover sheet is itself usedfor a split-off or a subfamily and thus those items are not applicable. Page 4of the cover sheets is a continuation of the questionnaire. You will note thatat the end of Section M in the questionnaire (page 30) you are instructed toturn to page 4 of the cover sheet. Item 5 is the word list question which youshould ask or skip depending on which box is checked at item 6a on page 1 of thecover sheet. We will check one of the boxes at 6a on the yellow cover sheetsand you will need to check the same box on a pink cover sheet filled out for anymember of that family. This word list is being used for only about one-fourthof the Census families (it is not being used at all for the cross section

-135-
7
sample). The remaining follow-up and payment items should be covered foreveryone in this sample as indicated.
Note that the title of the pink cover sheet at the top of the page says "ForMoved Adult Family Members," but the pink cover sheet is also to be used for asubfamily determined to exist in a Census sample family. Subfamilies will be rare iin the Census sample because one of the criteria is an income of $2,000 or moreand it isn't likely that a member of a poor family, other than the head, wouldhave that much income.
Call Procedures
YOU should attempt to make the first contact and set up an appointment for aninterview by phone, whenever the family has a phone. This will be economicaland yet we feel will not result in a higher refusal rate because these familieswill not be likely to refuse since they have already been interviewed at leastonce and, in the majority of cases, twice,their responses to be given to the OEO.
and have signed a release to allow
Whenever you find out that a family has moved and you cannot locate them throughtelephone information or the telephone directory, and you do not get a newaddress from the Post Office (via "Address Correction Requested" procedure) aftera reasonable length of time, please return the cover sheet with a detaileddescription of your efforts to locate the family. We have available the nameand address of a relative or friend of the family who should know theirwhereabouts, given by the respondent when he was interviewed last year, and wewill send you this information if you draw a blank from telephone informationand the Post Office. When you are able to get a new address for a moved family,YOU should enter that new address at item 1 on the top of page 3 of the yellowcover sheet, and then proceed to try to get an interview with them at the newaddress if it is within about 50 miles of an interviewer in your PSU, or sendthe cover sheet in to the Field Office for possible reassignment to a closerPSU if it is more than 50 miles from any interviewer in your PSU.
Paving Respondents
We are making provision for paying pnly the Census sample families. The cross-section sample respondents will not be paid, or at least not this year. Thereare a number of justifications for paying these Census families. First, we areasking for their cooperation for a number of years, perhaps four or five. It ishoped that this payment will motivate these families to cooperate with US overthis long-term study. Furthermore, these families we are paying are believed tohave lower than average incomes and, therefore, there is a financial need. Inaddition, it is known that low-income families move frequently and leave fewtraces so that it would likely be prohibitively expensive to try to locate themin any other way than paying them to keep us informed as to their whereabouts.It is true that some of the cross-section respondents will be as poor as therespondents from the Census sample; however, we are interviewing them for thefirst time, and probably will decide to pay them if we do follow-up and interviewthem the second year. You should never make mention of remuneration at all toany of the cross-section respondents.
There are two different types of respondent letters, one for the Cenus samplefamilies being paid, and one for the cross-section addresses where no paymentwill be made. The letter received by the one group of potential respondentswill mention remuneration while that for the other group will make no mentionof it. If you are interviewing both Census and cross-section samples, youmust be very careful to send (or show) only the right letter.

-136-8
The Census sample was selected originally using a procedure not unlike that usedby SRC, i.e., segments are used, so it is likely that these families will belocated in clumps of blocks, while your cross-section addresses will be locatedin other (different) clumps of blocks. Hence, the chance of communicationbetween the two groups of respondents is slight, and furthermore, theprobability of overlapping is remote. We, therefore, are quite confident thatPaying one group and not the other will not cause you any problem.
Read carefully pages 66-68 of the main instruction book for specific proceduresfor paying respondents.

-137-
Part 4.
Letter and Other Forms
The letter on the following page is a sample of a letter sent to
respondents announcing that the interviewer is going to call on them for
an interview. Following the letter are the cover sheets used for the cross-
section sample and the Census supplementary sample. Their use is described
in Part 1 of this section.

-138-
RESEARCH CENTER
INSTITUTE FOR SOCIAL RESEARCH
THE UNIVERSITY OF MICHIGAN
ANN ARBOR, MICHIGAN 48106
March 1968
Dear Head of Household:
One of our local interviewers will be calling at your home soon in connection with one of our regular surveys. We would like to interview the head of your family.
The Survey Research Center of The University of Michigan has been conducting nationwide surveys for over 20 years on topics of public interest. These studies are based on personal interviews taken at addresses which have been scientifically selected to represent a national cross section.
We wanted to let you know in advance about the visit of our interviewer so that you would not mistake him, or her, for a salesperson. Each of our interviewers carries an identification card as an employee of The University of Michigan, and is happy to show it.
We think you will find this interview interesting and worthwhile. The information you give us will be kept in complete confidence. We will be happy to send you a report of our findings on this study free of charge as our way of saying thank you for your cooperation in this important research.
If you have any further questions, please ask our interviewer.
Angus Campbell Director
AC:mb P. 768

-139- COVER SHEET
FOR PRIMARY FAMILIES --
CROSS SECTION ADDRESS
Project 768 Spring 1968
Family Economics
II SURVEY RESEARCH CENTER
INSTITUTE FOR SOCIAL RESEARCH
THE UNIVERSITY OF MICHIGAN (Do nof write in above spaces.)
I
1. Interviewer’s Label
2. P.S.U. 3. Your Interview No.
Study
4. Date
5. Length of Interview
6. Segment No. 7. Line No.
8. Address (or description):
9. City 10. State
11. Call record
Call Number 1 2 3 4 5 6 More (specify)
Hour of the Day (plus AM or PM)
Date
Day of Week
Results
12. IN INTERVIEW TAKEN, COMPLETE PAGES 3 AND 4 OF THIS FORM AND ATTACH COVER SHEET TO INTERVIEW, AND MAIL TO FIELD OFFICE
13. IF NO INTERVIEW IS TAKEN, COMPLETE PAGES 2 AND 3 OF THIS FORM AND MAIL TO FIELD OFFICE.

-140-
2 NONINTERVIEW NONSAMPLE FORM: (FILL OUT FOR ADDRESSES AT WHICH NO INTERVIEW WAS OBTAINED)
1. INTERVIEWER: Check one
HV ---- House Vacant; not being lived in. Record below if seasonal DU. AND ---- Address Not a Dwelling. Describe below (commercial, house burned, etc.)
NAH ---- No one at Home; DU being lived in but no one at home after required calls. RA ---- Respondent Absent; someone at DU, but respondent absent. Describe below. q Ref ---- Refusal. Give detailed description below. Other -- No interview obtained for reason other than above; explain fully below.
2. INTERVIEWER: Please supply as much of the following information as you can, without making inquiries of neighbors. Supply a-e for all cases. (Complete the Listing Box on page 4 of cover sheet if possible.)
a. What is the name of the nearest city of 50,000 population or more?
CITY STATE
How far is this DU from the center of that city?
c. Type of structure in which family lives: TRAILER DETACHED SINGLE FAMILY HOUSE 2-FAMILY HOUSE, 2 UNITS SIDE BY S 2-FAMILY HOUSE, 2 UNITS ONE ABOVE THE OTHER
DETACHED 3-4 FAMILY HOUSE ROW HOUSE (3 or more units in an
attached row)
cl IDE
El
APARTMENT HOUSE (5 or 3 stories or less)
APARTMENT HOUSE (5 or 4 stories or more)
APARTMENT IN A PARTLY STRUCTURE
OTHER (Specify)
more units,
more units,
COMMERCIAL
d. Neighborhood: Look at 3 structures on each side of DU but not more than 100 yards or so in both directions and check as many boxes as apply, below:
@VACANT LAND ONLY APARTMENT HOUSE (5 or more units, @TRAILER 3 stories or less) @DETACHED SINGLE FAMILY HOUSE APARTMENT HOUSE (5 or more units, q 2-FAMILY HOUSE, 2 UNITS SIDE BY SIDE 4 stories or more)
2-FAMILY HOUSE, 2 UNITS ONE ABOVE APARTMENT IN A PARTLY COMMERCIAL THE OTHER STRUCTURE
q DETACHED 3-4 FAMILY HOUSE WHOLLY COMMERCIAL OR INDUSTRIAL q ROW HOUSE (3 or more units in an STRUCTURE
attached row) OTHER (Specify)
e. Is this DU in a Public Housing Project? YES NO f. Estimated monthly rent of dwelling unit:
q UNDER $50 $50-99 $100-199 $200 OR MORE CAN'T TELL
g. How many adults in primary family? TWO THREE OR MORE DON'T KNOW
h: Is there a married couple in this primary family? YES q NO q DON'T KNOW
i. Race: q WHITE NEGRO OTHER DON'T KNOW
j. Sex of Head: q MALE @FEMALE DON'T mow
k. Estimated age of Head: 18-24 q 25-34 35-44 45-54
55-64 65 OR OVER ] DON'T mow
3. INTERVIEWER: Space for COMMENTS on this noninterview situation a

-141-
(FOR EACH ADDRESS)
3
1. Determine the number of Dwelling Units at the Listing Sheet address referred to in Item 8, page 1, and check one:
NO DU's. Complete Nonresponse Form on page 2.
Exactly 1 DU.
There are (SUPPLY NUMBER) dwellings that have NOT been
I
listed separately on the Segment Listing sheet - S210.
Make out the required number of white cover sheets and interview at Add to item 8, page 1 a description of the DU for which this cover sheet is used. On each white cover sheet be sure to describe the dwelling specifically.
2. Determine whether or not any unrelated secondary families in DU, and check one:
NO UNRELATED SECONDARY FAMILIES
THERE ARE (SUPPLY NUMBER) UNRELATED SECONDARY FAMILIES
Enter all persons in the Listing Box on Page 4 of the questionnaire, transferring information from the Primary Family interview to that of the secondary. Make out a GREEN cover sheet for each Secondary Family, and take an interview with each one of them.
(FOR EACH ADDRESS WHERE A PRIMARY INTERVIEW OBTAINED)
3. Note below if any subfamilies in Primary FU of DU -- (See pages 22-23 for criteria of subfamilies) -- and check one:
@NO SUBFAMILIES
Q SUBFAMILIES
Make sure all such persons are in the Listing Box on page 4 of the transferring information from the Primary Family interview to that of the secondary -- by their relation or connection with head of the primary family; make out GREEN cover sheet for each subfamily and take interview with each one.

4 -142-
i
_ 2. PSU
1. Interviewer's Label 3. Segment No. 4. Line
5. Your Int. No.
6. Date FOLLOW-UP FORM
(ASK EVERYONE) 7. We may wish to talk with you again next year to see how things have changed for you.
May I have your name?
8. . . . . . . . . . . and mailing address?
(STREET & NUMBER) (CITY & STATE)
9. If we want to contact you by phone, could I have that number?
N0 PHONE REFUSED (AREA CODE) (LOCAL NUMBER)
10. Just in case you move, would you give me the mane and address of someone who would know where you will be then, like a close relative?
(STREET & NUMBER) (CITY & STATE)
BE SURE TO COMPLETE PAGE 3 OF THIS FORM. IF SUBFAMILIES, MAKE APPOINTMENT FOR INTERVIEW.
1. INTERVIEWER: COMPLETE REMAINDER OF FORM WHEN EDITING
FILL OUT USING LISTING BOX ON PAGE 4 OF INTERVIEW (IF SECONDARIES AND/OR SUBFAMILIES, FILL OUT USING LISTING BOX ON PAGE 4 OF INTERVIEW ( IF SECONDARIES AND/OR SUBFAMILIES,
BE SURE TO INCLUDE) Indicate Remarks: Note anything Adults by Relationship Respondent likely to help you iden
Race or Connection to Head Sex Age FU# by ( ) Text
HEAD of Dwelling Unit

-143- COVER SHEET
FOR UNRELATED SECONDARIES OR SUBFAMILIES
CROSS SECTION ADDRESSES (INTERVIEW NUMBER)
6.
8.
Project 768 1 Spring 1968
Family Economics Study
I SURVEY RESEARCH CENTER
INSTITUTE FOR SOCIAL RESEARCH
THE UNIVERSITY OF MICHIGAN
2. P.S.U.
(Do not write in above spaces.)
1. Interviewer’s Label 3. Your Interview No.
4. Date
5. Length of Interview
Segment No.
Address (or description):
7. Line No.
City 10. State
CHECK ONE:
Unrelated Secondary Family
Subfamily -- Related to Primary, but meets criteria of subfamily (See pp. 22-23 of Questionnaire)
Call record
Call Number 1 I 2 3 4 5 6 More (specify)
Hour of the Day
(plus AM or PM)
Date
Day of the Week
Results
13. IF INTERVIEW TAKEN, COMPLETE PAGE 4 OF THIS FORM AND ATTACH COVER SHEET TO INTERVIEW, AND MAIL TO FIELD OFFICE.
14._ IF NO INTERVIEW IS TAKEN, COMPLETE PAGE 2 OF THIS FORM AND MAIL TO FIELD OFFICE.

-144-
2 l., NONINTERVIEW FORM
INTERVIEWER: Check one RA ----- Respondent Absent; someone at DU, but respondent absent. Describe below.
REF ---- Refusal. Give detailed description below. OTHER -- No interview obtained for reason other than the above; explain fully below.
2. INTERVIEWER: Please supply as much of the following information as you can, without making inquiries of neighbors. Supply a-e for all cases. (Complete the Listing Box on page 4 of cover sheet if possible.)
a. What is the name of the nearest city of 50,000 population or more?
CITY STATE
b. How far is this DU from the center of that city? LESS THAN 5-14.9 5 MILES
15-29.9 30-49.9 50 OR MORE MILES MILES MILES MILES
c. Type of structure in which family lives:
TRAILER DETACHED SINGLE FAMILY HOUSE
APARTMENT HOUSE (5 or more units, 3 stories or less)
2-FAMILY HOUSE, 2 UNITS SIDE BY SIDE 2-FAMILY HOUSE, 2 UNITS ONE ABOVE
APARTMENT HOUSE (5 or more units, 4 stories or more)
THE OTHER DETACHED 3-4 FAMILY HOUSE
APARTMENT IN A PARTLY COMMERCIAL STRUCTURE
ROW HOUSE (3 or more units in an OTHER (Specify) attached row)
d. Neighborhood: Look at 3 structures on each side of DU but not more than 100 yards or so in both directions and check as many boxes as apply, below:
VACANT LAND ONLY TRAILER
APARTMENT HOUSE (5 or more units, 3 stories or less)
DETACHED SINGLE FAMILY HOUSE APARTMENT HOUSE (5 or more units, 2-FAMILY HOUSE, 2 UNITS SIDE BY SIDE 4 stories or more)
2-FAMILY HOUSE, 2 UNITS ONE ABOVE APARTMENT IN A PARTLY COMMERCIAL THE OTHER STRUCTURE
q DETACHED 3-4 FAMILY HOUSE WHOLLY COMMERCIAL OR INDUSTRIAL ROW HOUSE (3 or more units in an STRUCTURE
attached row) OTHER (Specify)
e. Is this DU in a Public Housing Project? YES NO
Estimated monthly rent f. of dwelling unit: UNDER $50 $50-99 $100-199 $200 OR MORE CAN'T TELL
8. How many adults in family? ONE (GO TO Q. i) TWO THREE OR MORE DON'T KNOW
9. Is there a married couple in this (sub) family? q YES NO DON'T KNOW
10. Race: WHITE NEGRO OTHER DON'T KNOW
11. Sex of Head: MALE FEMALE DON'T mow
12. Estimated age of Head: 18-24 25-34 35-44 45-54 55-60
61-64 65 and over q DON'T mow
INTERVIEWER: Space for COMMENTS on this noninterview situation

2. PSU
-145-
1. Interviewer's Label 3. Segment No. 4. Line
5. Your Int. No.
6. Date
FOLLOW-UP FORM (ASK EVERYONE)
7. We may wish to talk with May I have your name?
8. . . . . . . . . .and
you again next year to see how things have changed for you.
mailing address?
(STREET & NUMBER) (CITY & STATE)
9. If we want to contact you by phone, could I have that number?
NO PHONE REFUSED (AREA CODE) (LOCAL NUMBER)
10. Just in case you move, would you give me the name and address of someone who would know where you will be then, like a close relative?
(STREET & NUMBER) (CITY & STATE)
INTERVIEWER: COMPLETE REMAINDER OF FORM WHEN EDITING
11. Fill out using listing box on page 4 of interview (Be sure to include primary family)
Adults by Relationship or Connection to Head
Indicate Remarks: Note anything Respondent likely to help you iden-
by tify this FU next year
HEAD of Dwelling Unit
Sex Age

(INTERVIEW NUMBER)
-146- COVER SHEET FOR Project 768
REINTERVIEW SAMPLE 1
FAMILY AT ADDRESS LAST YEAR Spring 1968
Family Economics Study
1. Interviewer’s Label
SURVEY RESEARCH CENTER
INSTITUTE FOR SOCIAL RESEARCH
THE UNIVERSITY OF MICHIGAN I
2. PSU
3. Your Interview No.
4. Date
5. Length of Interview
6. Name of Head Street & No.
City & State Zip Age Sex Race # in FU
Local Tel. # 6a. CHECK ONE: Use Item 5 on Page 4 for this family (Word List)
Do not use Item 5 on Page 4 for this family (Word List)
7. Is this where (LAST NAME) live(s)?
Yes (INTERVIEW THE FAMILY HEAD)
No, someone else here DO NOT INTERVIEW AT THIS ADDRESS.
House Vacant Try to get the new address(es) of the adult members of the (NAME)
Address not a dwelling family who lived here last year. ENTER ON PAGE 3 OF THIS FORM.
8. Call Record
Call Number 1 2 3 4 5 6 7 or more
Hour of the Day (plus AM or PM)
Date
Day of Week
Results
9. IF INTERVIEW TAKEN COMPLETE PAGES 3-4 OF THIS FORM AND ATTACH COVER SHEET TO INTERVIEW AND MAIL TO FIELD OFFICE.
10. IF FAMILY HAS MOVED OUTSIDE YOUR AREA, RETURN THIS SHEET TO THE FIELD OFFICE IMMEDIATELY.
11. IF NO INTERVIEW TAKEN, OR FAMILY LOST, COMPLETE PAGE 2 OF THIS FORM.

-147- NONINTERVIEW FORM
INTERVIEWER: Check One
Ref ---- Refusal. Give detailed description below. NER ---- No eligible respondent.
LOST --- FU moved, cannot locate new address. Describe efforts to locate R. Other -- Explain.
2 1.
2. INTERVIEWER: Please supply as much of the following information you can, without making inquiries of neighbors. Supply a-e for all cases. (Complete Listing box on page 4 of questionnaire if possible -- attach it to this cover sheet before returning to Field Office.)
b.
a. What is the name of the nearest city of 50,000 population or more?
CITY STATE
How far is this DU from the center of that city?
LESS THAN 5-14.9 15-29.9 30-49.9 50 OR MORE 5 MILES MILES MILES MILES MILES
C. Type of structure in which family lives:
TRAILER DETACHED SINGLE FAMILY HOUSE
APARTMENT HOUSE (5 or more units, 3 stories or less)
2-FAMILY HOUSE, 2 UNITS SIDE BY SIDE 2-FAMILY HOUSE, 2 UNITS ONE ABOVE THE OTHER
q DETACHED 3-4 FAMILY HOUSE
APARTMENT HOUSE (5 or more units, 4 stories or more)
@APARTMENT IN A PARTLY COMMERCIAL STRUCTURE
ROW HOUSE (3 or more units in an attached row)
OTHER (Specify)
d. Neighborhood: Look at 3 structures on each side of DU but not more than 100 yards or so in both directions and check as many boxes as apply, below:
VACANT LAND ONLY APARTMENT HOUSE (5 or more units, TRAILER 3 stories or less)
q DETACHED SINGLE FAMILY HOUSE APARTMENT HOUSE (5 or more units, 2-FAMILY HOUSE, 2 UNITS SIDE BY SIDE 4 stories or more)
2-FAMILY HOUSE, 2 UNITS ONE ABOVE APARTMENT IN A PARTLY COMMERCIAL THE OTHER STRUCTURE
DETACHED 3-4 FAMILY HOUSE WHOLLY COMMERCIAL OR INDUSTRIAL ROW HOUSE (3 or more units in an STRUCTURE
attached row) OTHER (Specify)
e. Is this DU located in a Public Housing Project? q YES NO
f. Estimated monthly rent of dwelling unit: q UNDER $50 $50-99 100-199 $200 OR MORE CAN'T TELL
g. How many adults in this family? ONE (GO TO Q.i) q TWO THREE OR MORE DON'T KNOW
h. Is there a married couple in this family? YES NO DON'T KNOW
i. Race: WHITE NEGRO OTHER DON'T KNOW
j. Sex of Head: MALE FEMALE DON'T KNOW
k. Estimated age of Head: 18-24 25-34 35-44 45-54 55-61 CAN'T TELL
3. INTERVIEWER: Space for COMMENTS on this noninterview situation

1.
2.
3.
-148-
IF NO MEMBERS OF THE SAMPLE FAMILY ARE LIVING AT THE ORIGINAL ADDRESS ENTER NEW ADDRESS HERE. IF ENTIRE FAMILY HAS MOVED AND SPLIT ENTER THE NEW ADDRESS FOR THE LARGEST PART OF THE FAMILY HERE, AND ADDRESSES FOR OTHER ADULTS (AGED 18-61) IN SECTION 2 (BELOW).
NAME
ADDRESS (New street and number) (New City and State)
If new address is in your area, go there and take an interview with the head of this family. If it is outside your area return this cover sheet to the field office.
If the sample family is not at the new address, continue to trace them. DO NOT INTERVIEW ANY OTHER FAMILY.
Use this cover sheet for the family listed in 1 (above). Do not make out a pink cover sheet unless some adult members of the family have left the family since last year, or you discover subfamilies.
IF ANY ADULT MEMBER(S) (AGED 18-61) HAVE LEFT THE FAMILY SINCE LAST YEAR LIST THEIR NEW ADDRESS BELOW (See Q. B14, Page 4)
NAME
ADDRESS (New street and number) (New City and State)
ADDRESS (New street and number) (New City and State)
Fill out pink cover sheet for each person listed in section 2.
If the pink cover sheet address is in your area, take an interview with the head of the new family unit (e.g., If a daughter married and moved to live with her husband, interview him)
If the sample family member is not at the new address, continue to trace him or her. DO NOT INTERVIEW IN ANY HOUSEHOLD NOT CONTAINING AT LEAST ONE ADULT WHO LIVED WITH THE ORIGINAL SAMPLE FAMILY LAST YEAR.
Item 6a on all pink cover sheets for this family should be checked to agree with item 6a on this yellow sheet.
ARE THERE ANY ADULTS AGED 18-61 WHO QUALIFY FOR A SUBFAMILY INTERVIEW? See Pages 22-23 of Questionnaire YES NO
(IF SUBFAMILIES)
Make out a PINK cover sheet for each subfamily and take interview with each one. Make sure all such persons are in the Listing Box on page 4 of Primary's question- naire. Item 6a on all pink cover sheets for this subfamily should be checked to agree with item 6a on this yellow cover sheet.
3

-149-
1. PLACE INTERVIEWER'S LABEL HERE 2. PSU
3. Your Int. #
4. Date
5. INTERVIEWER: SEE ITEM 6a ON PAGE 1 OF THIS FORM. USE THIS Q. ONLY WHEN INDICATED
Now here is one last thing that is a little different. We want to know whether you are familiar with some words. (HAND PICTURE CARD TO RESPONDENT)
Here is a card with four pictures on it. I'll read some words, and you tell me the number of the best picture for each word I say. If the word is not familiar to you, just say so.
RECORD PICTURE RECORD PICTURE READ THESE WORDS NUMBER READ THESE WORDS NUMBER
dancing 1 respectful 4 fence 3 daring 3
music I pedestrian 4
pepper 2 fluid 2
woman I discipline 4 school 4 saccharin 2
couples 1 cordiality I
(ASK EVERYONE) 6. Thank you for helping in this research. When I send this interview into the Survey
Research Center, the University will send you five dollars, but for them to do this, I must have your name and the proper mailing address:
RESPONDENT'S NAME (FULL FIRST NAME OR 2 INITIALS, AND SURNAME)
MAILING ADDRESS (Street and Number) (City and State)
7. We will be calling back on you again about this time next year. Here's a postcard that is worth another five dollars if you save it and return it to the University after the first of the year, in January of 1969. I'll O.K. it now with my name, but to receive the extra five dollars you have to remember to save it and fill it out with the address of wherever you are next January.
(ENTER R'S NAME AND YOURS, PLUS YOUR INTERVIEW NUMBER ON CARD: GIVE TO R)
8. If we want to contact you by phone, could I have that number?
(AREA CODE) (LOCAL NUMBER) N0 PHONE REFUSED
9. Just in case you move and forget to return the card, would you give me the name and address of someone who would know where you would be, like a close relative?
NAME
ADDRESS (Street and Number) (City and State)

-150-
PROJECT 45768 1969 Family Economics Study
COVER SHEET FOR ADULT FAMILY MEMBER LIVING OUTSIDE 1969 REINTERVIEW HOME
SURVEY RESEARCH CENTER INSTITUTE FOR SOCIAL RESEARCH THE UNIVERSITY OF MICHIGAN ANN ARBOR, MICHIGAN 48106
(Do not write in above space)
PSU
Your Interview No.
Date
Length of Interview (Minutes)
INTERVIEWER: MAKE OUT PINK COVER SHEET FOR ANY ADULT FAMILY MEMBERS LIVING AWAY FROM 1969 REINTERVIEW FAMILY WHO ARE ENTERED IN ITEMS 3 & 4, PAGE 3 OF WHITE COVER SHEET. CHECK BOX WHICH APPLIES.
q SOMEONE 18 OR OLDER MOVED OUT q SOMEONE IN ARMED FORCES, COLLEGE OR OTHER INSTITUTION IN 1968 - NOW ESTABLISHED IN OWN HOUSEHOLD
6. Name (from White Cover Sheet)
7. 8. 9. Street & No. City State
IF MALE OR UNMARRIED FEMALE, INTERVIEW PERSON RECORDED. IF PERSON RECORDED IS MARRIED FEMALE, INTERVIEW HUSBAND. COMPLETE LISTING BOX, PAGE 2 OF THIS COVER SHEET.
10. Call Record
Call Number 1 2 3 4 5 6 More (specify)
Hour of the Day (plus AM or PM)
Date
Day of Week
Results
11. IF INTERVIEW TAKEN, ATTACH COVER SHEET TO INTERVIEW AND MAIL TO FIELD OFFICE.
12. IF ADDRESS (items 7, 8, & 9) IS OUTSIDE YOUR AREA, RETURN THIS COVER SHEET TO FIELD OFFICE IMMEDIATELY FOR POSSIBLE REASSIGNMENT TO OTHER PSU.
13. IF NO INTERVIEW POSSIBLE FILL OUT NONINTERVIEW FORM ON PAGE 4.

2 -151-
1.
2.
How many members of your family are living here?
LIST ALL PERSONS, INCLUDING CHILDREN, LIVING IN THE FU
Listing Box I
2a. 2b. 2c. 2d. 2e. Relation to Head Age Sex May I have (his/her) first and last name? Check ()
R
1. HEAD
2.
3.
4.
5.
6.
7. I
8.
9.
10.
GO TO QUESTION Al
IN QUESTIONNAIRE

-152- 3
TO BE ASKED AT END OF INTERVIEW
1. Thank you for helping with this research. When I send this University of Michigan will send you a check for $5.00, but I must have your name and proper mailing address.
interview in, the for them to do this,
Respondent's Name
Mailing Address
City, State & Zip
2. In case we need to contact you by phone, could I have your telephone number?
NO PHONE REFUSED
2a. Is this phone listed in your name?
YES (GO TO 3) q NO 2b. In whose name is it listed?
3. We will be calling on you again about this time next year. Here's a postcard that is worth another $5.00 if you save it and return it to the University in January 1970. I'll O.K. it now with my name, but to receive the extra $5.00 you must remember to save the card and fill it out with the address of wherever you are living next January.
INTERVIEWER: PRINT R'S NAME AND CURRENT ADDRESS ON POSTCARD, SIGN YOUR NAME AND GIVE POSTCARD TO R.
4. Just in case you move and forget to return the card, would you give me the name of someone, such as a close relative, who would know where we could get in touch with you.
Name
Address
City State Zip
Phone (if known)
INTERVIEWER: NOTE BELOW RELATIONSHIP (if any) OF CONTACT PERSON TO R

-153-
NONINTERVIEW FORM (For Panel Families from whom no interview was obtained)
Check one
Ref ---- Refusal. Give detailed description below.
NAH ---- No one at home; DU occupied by Panel Family (to best of knowledge), but no one at home after required calls.
RA ----- Respondent absent; Panel Family at DU, but respondent absent. Describe below.
LOST --- Family moved and unable to obtain new address. Describe below efforts to get new address.
q OTHER -- No interview obtained for reason other than above. Explain fully below.
Space for COMMENTS on this noninterview situation

-154-
Part 5.
Documentation of Regional Data
Locational and environmental factors are important determinants of a
person's economic status as well as his personality and behavior. Conse-
quently, information derived from the personal interviews has been supplemented
with data on the employment and income characteristics of the county in which
the family lives. The county or SMSA of residence was chosen as the relevant
data unit since the characteristics of such an area are relevant to everyone
living there. Further, county demographic and employment data are comparative-
ly easy to secure. Operationally, the situation in each area was measured
by employment conditions in the county, the per pupil expenditures on public
education, and the amount of per capita public assistance in the county.
Since published statistics on county employment characteristics
are generally out-of-date, in the spring of 1968 a questionnaire was sent to
state unemployment offices asking them about the current employment market
situation in the counties that were in our sample. The questionnaire is re-
produced on the next page. Replies to the three questions are the source of
variables 412-414, and their distributions are given below in Section V of the
Code.
In addition to the information secured from this short questionnaire,
data on county education expenditures as measured by 1962 per pupil dollar
expenditures were secured from the Census of Governments 1962. A measure of
the adequacy of public welfare payments was also secured from the same source.
To get a potential measure of the county's growth rate, the five-year percentage

-155-
SURVEY RESEARCH CENTER
INSTITUTE FOR SOCIAL RESEARCH
THE UNIVERSITY OF MICHIGAN
P. 45768
STATE CITY OR TOWN COUNTY
1. We are interested in the market for unskilled temporary labor in the area listed above. Would you say that there are:
M any more jobs than there are applicants
More jobs than applicants
Most people are able to find jobs
A number of unskilled workers unable to find jobs
Many unskilled workers unable to find jobs
2. What is the typical wage that such a worker might receive?
per hour, day, week
3. What is the unemployment rate in the above area?
Under 2%
2-3.9%
4-5.9%
6-10%
over 10%
Additional comments if any:

-156-
change in employment was used. County Business Patterns was the source of
this information. These three items make up variables 415-417. Their dis-
tributions for the families in the sample are given in Section V.

-157-
SECTION IV
PROCESSING PROCEDURES
This section describes in detail the procedures that were used in
processing interviews once interviewing had been completed and all interviews
had been received by the Survey Research Center. Part 1 deals with editing,
the procedure used in transforming replies to numerical values when they could
not be entered directly onto the codesheet from the interview. Part 2 describes
coding, the process of direct conversion of replies to numerical values so
that they could be keypunched. Following the editing and coding, the data
were checked for errors and logical consistency within the interview. These
data-cleaning operations are detailed in Part 3. Part 4 presents the logical
framework for the construction of some of the more important index measures.
Part 5 gives the response rates for this wave of the survey and briefly
describes the weighting.
Part 1
Editing
Introduction
The questionnaire covered a great deal of potentially quantitative
information pertaining to the status of the sample family. Insofar as possible
the questions were designed to elicit the necessary information while minimizing
the burden of arithmetic on both the interviewer and the respondent. This design
necessitated an editing process to transform the questionnaire responses into

-158-
the desired numerical form.
Respondents were usually able to give what seemed to be quite
accurate numerical responses to questions on common economic variables.
Money income, hours worked on the job, and expenditure on foods and housing
were remembered and reported by almost all respondents. The editing process
for these variables consisted chiefly of performing simple arithmetic to
convert responses that were given in weekly or monthly units to annual
amounts and recording the figures on work sheets from which they could be
key-punched. The forms of the responses were sufficiently varied so that
these initial manipulations could not practically be done by computer. The
editors also maintained an overview of the particular family situation and
were able to use information from other parts of the questionnaire when
interpreting a given response. A student, for instance, might report zero
food expenditure after reporting a single payment for room and board in the
housing sequence. The editor would split that payment into the two components.
Assignment of Missing Data
Virtually all of the important economic status variables used in
this study, from total money income to the complex "well-offness measures,"
involved combining numerous components. In order to avoid relegating these
measures to a "not ascertained" category when a single component was missing,
a value was assigned to replace the missing data. In some cases a value
could be estimated by gathering information from other parts of the question-
naire. When such information was inadequate, expected values were taken from
assignment tables based on multivariate analyses of data from other national
surveys.

-159-
Accuracy Codes
Many of the components of the status measures are interesting economic
variables themselves. In order to allow analysis of these variables uncontami-
nated by assigned values, an accuracy code was associated with each one. These
variables, which may be used to filter out assigned cases, were coded as
follows:
0. Adequate response: no estimates or assignments were necessary.This code cannot, of course, take account of the respondent'sreporting errors. Complete responses were accepted at facevalue in the absence of contrary evidence.
1. Response was inadequate but estimates could be made with aprobable error of less than $300 or 10 percent of the valueof the variable, whichever was larger.
2. Response was inadequate and no extra information was availableon which to base a good estimate. A value was assigned from anassignment table.
The accuracy codes were also used to identify unusual treatment of
specific variables.These cases are listed below and explained more fully
in the variable by variable discussion.
A code of 3 in the house value-property taxes accuracy code (Variable 7)
identifies cases of complex property. In these cases the reported house value
included the value of business property in addition to that of the family's
living quarters.
A code of 4 in the accuracy codes for "Value of additions and repairs
done self" (V17) and "saved on car repairs" (V25) identifies transfer of
services. The value given represents work done free of charge by someone
not in the sample family.
A code of 5 in the accuracy codes for annual mortgage payments,
annual rent,annual car debt payments, and annual food expenditures, identi-
fies cases in which the extrapolation of current (Spring '68) weekly or

-160-
monthly flows, to get an annual flow applicable to 1967, was clearly inappropriate.
Only extreme cases such as a family unit of newlyweds who had previously lived
in parental households were so identified.
Values Assigned for the Full Sample
The assignments discussed in the preceeding section were made on
only a small percentage of cases for any given variable. For a small class
of variables pertaining to non-market time use, values were estimated or
assigned for all cases. Direct questions on these items were omitted because
of the necessity of keeping interviewing time on the first wave within
reasonable limits and because a recent study of time use provided a good
basis for assignments. The estimating conventions and assignment procedures
are treated in the discussion of specific variables, which follows. We begin
with Worksheet 1.
Worksheet 1
House Value V5
Most assignments were made on the basis of a distribution table
giving mean house value by family income bracket and belt code. The lowest
house value assignment given in this table is $9300. For a number of dwellings,
particularly those in the rural South, this was clearly much too high. In
such cases the editing supervisor made an estimate of the house value based
on the interviewer description of the condition of the dwelling and on any
available information about the value of similar dwellings in the PSU.
All of the above assignments were given an assignment code 2. There
were 91 such cases out of some 2350 home-owners. Another 25 cases were
assigned on the basis of partial information (interviewer's estimate, for

-161-
SURVEY RESEARCH CENTER 1968 SURVEY OF FAMILY ECONOMICS WORKSHEET 1.
I 2 3 4 5 6 7 8 9 SAMPLE BOOK # EDITOR CHK. EDITOR
HOUSING
OWNERS
1. HOUSE VALUE
2. - MORTGAGE
(rate, table A) 16 17 18 17
Imputed rent
3. = NET EQUITY
4. MORTGAGE PAYMENTS ( A8 ) x 12 =
RENTERS
Property taxes I
5. RENT (A 11) x 12 =
OTHERS
6. RENT VALUE IF RENTED ( A 16 ) x 12 = 37 38 31 40
7. WORK IN RETURN FOR HOUSING? IF YES, F / 2 =
ALL
G. 8. APPROXIMATE UTILITIES ( A5/ A13 / A18 ) 42 43 44
9. VALUE OF A & R DONE SELF ( A23, 24 )
10. A & R PAYMENTS ( A 27 ) x 12 =
ALL CARS
11. CAR INSURANCE ( Cl2 or Cl6 ) X =
12. CAR DEBT PAYMENTS ( C 13 ) X = 61 6a 63 64
13. SAVED ON CAR REPAIRS ( C 21, 22 ) L (r-1
66 67 68
M. 14. HOW MUCH TIME DID THAT TAKE? ( C 23 ) 70 -It l&
OTHER DEBT
15. MONTHLY PAYMENTS ON OTHER THINGS ( D 1, 2 ) x 12 = 19 15 -6 11
31
cl 111
36
cl vi3
YI Hrs 1
66
cl Vjll
60
0 a3
65
cl JY
63
II val
Hrs 3 73
I8

-162-
example) and were given an assignment code 1. Note that the assignment code
for house value is labelled "Accuracy of Property Taxes" in the master code.
Property tax is a multiple of house value so this is more misleading than
inaccurate.
Complex Property
In 124 cases home owners gave a figure for house value which included
value of business property as well. Such properties include farms, apartment
buildings and other cases where it is difficult to estimate the value of the
family's own living quarters separately from the value of the property as a
whole.
The treatment of the cases was as follows: the total value of the
property was entered in the house value field but the property taxes, imputed
rent and annual mortgage payments were prorated to correspond to that portion
of the property value which served as living quarters. For multiple unit
buildings the prorating fraction was taken to be the reciprocal for the
number of D.U.'s. For cases with no such obvious fraction, an assignment
value was taken from Table B5 and the ratio of that value to the total
property value was used as the prorating fraction.
All complex property cases are identified by an assignment code 3.
Property Taxes V6
On the basis of data from other studies, primarily a 1960 cross-
section sample the following property tax rates were assigned.' The assigned
1This study was reported in Income and Welfare in the United States,
by James N. Morgan, et al, New York, McGraw-Hill, 1962.

-163-
tax rate was then multiplied times house value to get an approximate figure
for property taxes paid. As noted above, the assignment code which is
labelled "accuracy of property taxes" applies primarily to assignment of
house value. Property tax rates are assigned in all cases so a non-zero
assignment code is used only when this rate is applied to an assigned house
value.
TABLE A
PROPERTY TAX RATE
Distance from Nearest City Regionof 50,000 or More(Question N11, page 31) New England Other Regions
0 - 5 .025 .020
5 - 49 .020 .015
50 miles or more .015 .010
Property tax rates were assumed to be zero for mobile homes. This
assumption is probably correct for those located on rented lots, but mobile
homes located on owned lots may well be subject to property taxes. There are
only 122 trailers in the sample so the extra questions necessary to clarify
the lot ownership status were not included in the questionnaire. The under-
statement of housing costs in these few cases should be less than $100.
Another difficulty is that we do not ask whether property tax payments
are included in mortgage payments but assume uniformly that they are not. Thus,
for all cases where taxes are included we overstate total housing expenditures
by the amount of the property taxes due to double counting.
Note, however, that this double counting difficulty affects only

-164-
our "Total Committed Expenditure" variable. When computing housing costs for
the "Income net of housing" variable, mortgage payments were not used because
they contain a component of saving. Instead we took 6 percent of the house
value to account for interest expense on the mortgage and opportunity cost
of equity capital. Tax and utilities expenditures could then be added to
that figure with no danger of double counting.
Remaining Mortgage Principal, Net Equity, Imputed Rent V320
Remaining mortgage principal was subtracted from total house value
to obtain net equity in the dwelling. As noted above, a 6 percent return on
this investment in housing was assumed in calculating imputed rental incomes.
There were several possible assignment procedures when the remaining
mortgage principal was unknown or refused. If time remaining to pay and
monthly payments were known the remaining principal was determined from a
mortgage payment table assuming a 6 percent rate of interest. Such assign-
ments were considered to be minor - assignment code 1. If the principal
resulting from this procedure turned out higher than the house value, an
equity of 5 percent of house value was assigned. When either monthly payments
or time left to pay was unknown an assignment was made using a table based on
house value and duration of residence.
Mortgage Payment V8
If the payment was unknown, payments were assigned based on the
assigned mortgage and a 6 percent interest rate. If time remaining to pay
was also not ascertained an initial term of 20 years was assumed. If informa-
tion was volunteered that property taxes were included in the monthly payments
given, estimated property taxes were subtracted from annual mortgage payments.

-165-
a single payment was given for room and board, food expenditure was assigned
Annual Rent V10
Missing data was assigned on the basis of total family income. If
on the basis of income and food needs, and the residual was taken as rent.
Annual Value if Rented V12
If the sample family unit was staying with family or friends, the
respondent sometimes gave the total rent paid for the apartment. That figure
was pro-rated to the respective members in the two families according to the
allocation of rooms if that information was volunteered. If the host family
owned the home and house value was given, 10 percent of house value was pro-
rated in the same fashion.
There were several cases of tenant farmers, where those who were
able to estimate gave a figure of $15/month. This value was assigned for
those who did not give an estimate.
Approximate Utilities V14
Values were assigned by comparison with a sample listing of adequate
responses, matching on region and type of dwelling. The assigned values
ranged from $75/year for small apartments in Los Angeles to $4OO/year for
8-room houses in the north.
For trailer owners who gave a lot rental figure, that amount was
classified as a utility payment.
Value of Additions and Repairs Done by the Family V16
Assignments for missing data were based on the complexity and extent
of the work done. A saving of $30 per room was assigned for interior painting

-166-
and savings of up to $500 were assigned for exterior painting of a large
house, or extensive re-modeling. Such assignments were, of course, only
as good as the staff member's interpretation of the respondent's quantitative
description of what was done.
Car Insurance Premiums V20
Cases with missing data were assigned $100 if respondent lived in
a metropolitan area, $75 otherwise. Assignments for single males under 25
were increased by $50.
Car Debt Payments V22
In cases where there was known to be car debt but payments were not
ascertained, annual car debt payments were assigned in an amount equal to
1/2 the wholesale value of the car. If the respondent was making payments
on a car purchased shortly before the interview, the annual total was calculated
as if payments had been made for the full year. Such cases were identified by
an accuracy code 5 in Variable 23.
Saved on Car Repairs V24
Assignments were based on the complexity of the work done and ranged
from $15 for oil changes and tune-ups to $200 for extensive overhauls.
Time Spent on Car Repairs V26
If time spent was not ascertained, an effective wage rate of $2/hour
was assumed and divided into the amount saved.

-167-
Monthly Payments on Other Things V28
A figure of $20/month was assigned in most cases where payments were
reported but the amount was not ascertained. If it was not determined whether
there were such payments a zero value was assigned.
Worksheet 2
Family Food and Need Standard V31, V32
We constructed a measure of minimum annual food needs and minimum
annual total income needs for each family. The measures are similar to the
Orshansky poverty cut-offs used by the Social Security Administration but
embody some modifications.
The table on Worksheet 2 gives individual weekly food expenditure
requirements by age and sex for persons in a family of four. The data were
taken from the "Low-Cost Plan" given in the Family Economics Review, March 1967.1
These figures were summed for all individuals in the family, converted to annual
amounts, and then adjusted for economies of scale as follows: 1 person families
add 20 percent; 2 persons add 10 percent; 3 persons add 5 percent; 5 persons
subtract 5 percent; 6 or more persons subtract 10 percent.
The total need standard is then obtained by multiplying the food
standard by a factor of 4.89 for single persons: 3.70 for two person families;
and 3.0 for families of 3 or more. The factor of 4.89 yields equivalent
results to the Orshansky convention of taking 72 percent of the two person
need standard for single persons.
All of the above adjustments for economies of scale and the conversions
from weekly to annual amount were incorporated in a set of tables. The editors
simply summed the individual figures and then looked up the annual food and
1U.S. Government Printing Office, 1967.

-168- SURVEY RESEARCH CENTER 1968 SURVEY OF FAMILY ECONOMICS WORKSHEET 2.
INDIVIDUAL FOOD COSTS: USE LISTING BOX AND TABLE B
1 a 3 q s 6 'I 89 10
TABLE B. INDIVIDUAL FOOD STANDARD (LOW COST)
AGE MALE FEMALE
Under 3 3.90 3.90
4-6 4.60 4.60
7-9 5.50 5.50
10 - 12 6.40 6.30
13 - 15 7.40 6.90
16 - 20 8.70 7.20
21 - 35 7.50 6.50
35 - 55 6.90 6.30
55 + 6.30 5.40
A. FAMILY SIZE El
v30 TOTAL UNADJUSTED II
SEE TABLE FOR FOOD AND NEED STANDARDS FOR THE ABOVE FAMILY
ANNUAL FOOD STANDARD /a 13 t4 ts
1.
2. SAMPLE BOOK # 3.
4. EDITOR
5.
6. CHK. EDITOR
7.
8.
9.
10.
11.
12.
13.
SIZE AND UNADJUSTED FOOD TOTAL
ANNUAL NEED STANDARD I6 t7 18 1') a.0
ANNUAL AMOUNT FOOD EXPENDITURE
1. SPENT EATING OUT ( E 2 ) X =
2. COST OF MILK (E4) X =
3. OTHER FOOD (E5) X =
4. FOOD BILL SUBTOTAL ( 1 + 2 + 3 )
5. ALCOHOL (E6) X at aa x3 a9
E. IF INCLUDED (E10) 6. CIGARETTES (E9) X = v35: ENTER AT RIGHT
CORRECTED FOOD BILL a5 16 x7
7. SUBTRACT 5, 6, FROM FOOD BILL IF INCLUDED
NON MONEY FOOD
8. HOME GROWN FOOD ( E12 ) SEE SUPERVISOR
9. CLOTHES MADE AND MENDED ( E17, 18)
10. FOOD RECEIVED ON THE JOB (530, page 24)
11. SAVED ON FOOD STAMPS (532, page 24 )
Hrs 4

-169-
need standards in the table for the appropriate family size.
The above procedure differs from the standard Orshansky procedure in
three respects.
The "low cost" food expenditure standard is slightly higher than
the "economy level" used in the S.S.A. cut-off. It was the opinion of
Faith Clark of the Department of Agriculture that the latter standard is
unrealistically spartan.
The S.S.A. procedure approximates the above procedure by tabulating
need standards for different categories of families based on family size, sex,
age and marital status of head, and age of youngest child. The largest
family size category used is for six persons or more thus effectively assign-
ing zero marginal cost to members beyond the sixth. The linear increase in
standards with family size when calculated by our procedure may err in the
opposite direction but still seems more realistic.
We have incorporated no farm - nonfarm differential in the need
standards. There seems to be no general agreement as to the magnitude of
this differential with values from .70 to .85 argued for. It is a simple
matter to incorporate the desired definition by a computer manipulation
controlling on occupation code. For such variables as total real income,
it is not clear that the differential is appropriate since we impute many
of the types of income in kind which are the source of the differential.
Food Expenditure V37
Expenditures on eating out, milk delivered to the door, and other
food purchased were converted to annual amounts and summed. Expenditures
on alcohol and cigarettes were subtracted out if they were reported to have
been included in the food bill. This corrected total, "Yearly Food Bill,"

-170-
is Variable 37.
If there was evidence that the amount spent eating out was solely
for school lunches, the weekly amount was multiplied by 40 instead of 52.
The most common cases of missing data for this question occurred
when the family ate out only infrequently and the question about the average
weekly amount did not seem to make sense. In such cases an amount of the
order to $2.50 per person per meal was assigned.
The delivered milk expense was not ascertained in only very few
cases. In those few, assignments were based roughly on a quart a day per
child.
If the expenditure for the main component of the food bill "all
other food used at home" was not ascertained, an assignment was made for the
total corrected food bill. The assignment was a multiple of the food needs
standard depending on the ratio of family income to the total needs standard.
A maximum of 1.3 times the food standard was assigned which proved quite
conservative in view of later analysis.
If it was not determined whether expenditures on cigarettes or
alcohol were included in the reported food bill, 50 percent of the outlay on
these items was subtracted as correction.
Home Grown Food V39
The amount edited for this variable was based on the response to
the qualitative question, "Do you have any special ways of keeping the food
bill down? (If so), What special ways ...?" If the respondent reported
producing food, a value was assigned according to a set of conventions.
The amounts assigned ranged from $50 for "we have a small garden" through
$250 for "raise a beef animal" to 60 percent of the food standard for "Raise

-171-
our own milk and meat, have a garden and can freeze a lot." Since these
values were assigned in all cases, the assignment codes distinguish only the
size of the assigned value. Amounts of $1000 or greater were coded 999.
For farmers, the excess over $999 was placed in the "Food received on the
job" category.
Clothes Made and Mended V41
A question similar to the qualitative food question was asked here.
However, it was followed by the quantitative questions: "Did you save more
than $50 this way? (If so), About how much did you save?" Pecuniary savings
from shopping at sales and the like were excluded. If savings from both sales
and sewing were mentioned, 213 of the value was taken for the productive
activity unless other evidence was given. If less than $50 was reported
saved, a figure of $25 was taken.
Food Received on the Job V43
This variable was edited from questions J30 and J31, "Did anyone
here get more than $50 worth of food or clothing as part of their pay? (If
so) How much?" The amount in Variable 43 thus may include both food and
clothing. When the information was given as to whether the amount referred
to food or clothing, it was coded in Variable 268. Overfield amounts are
coded 999.
Yearly Food Stamps V45
This variable was edited from the responses to Questions J32 and J33.
Like Variable 43 it may contain food, clothing or a mixture. The distinguish-
ing information is coded in Variable 269. If transfers of food or clothing
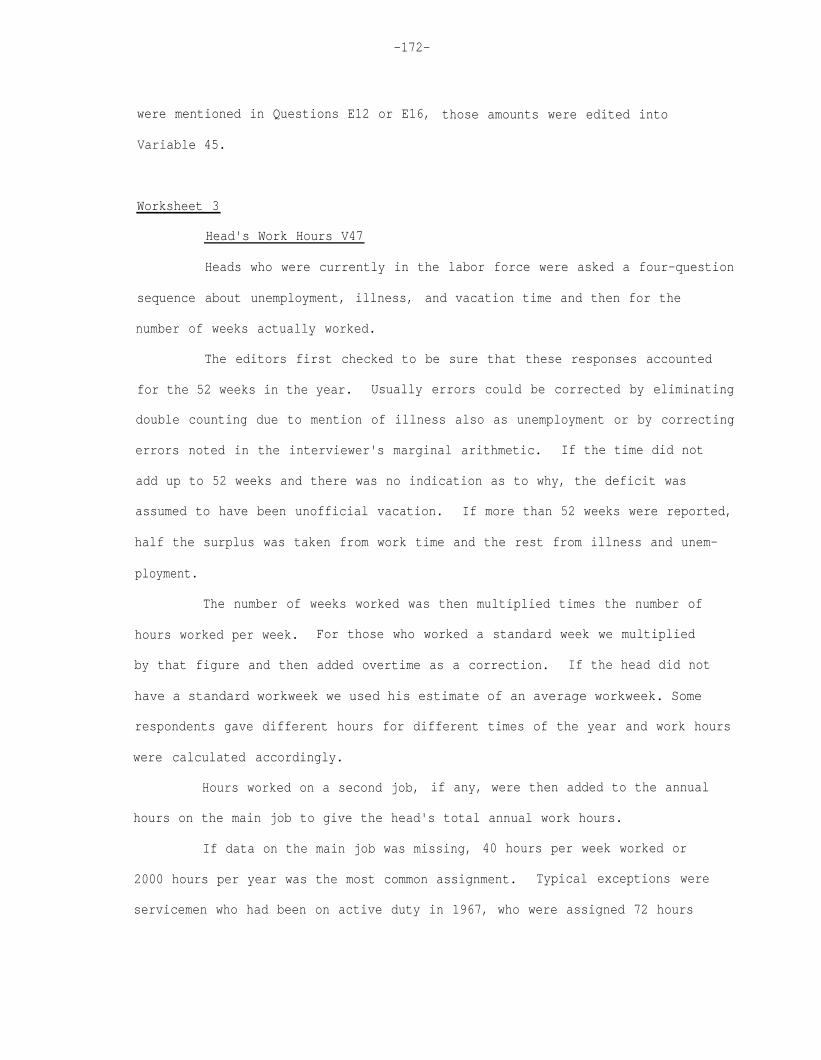
-172-
were mentioned in Questions E12 or E16, those amounts were edited into
Variable 45.
Worksheet 3
Head's Work Hours V47
Heads who were currently in the labor force were asked a four-question
sequence about unemployment, illness, and vacation time and then for the
number of weeks actually worked.
The editors first checked to be sure that these responses accounted
for the 52 weeks in the year. Usually errors could be corrected by eliminating
double counting due to mention of illness also as unemployment or by correcting
errors noted in the interviewer's marginal arithmetic. If the time did not
add up to 52 weeks and there was no indication as to why, the deficit was
assumed to have been unofficial vacation. If more than 52 weeks were reported,
half the surplus was taken from work time and the rest from illness and unem-
ployment.
The number of weeks worked was then multiplied times the number of
hours worked per week. For those who worked a standard week we multiplied
by that figure and then added overtime as a correction. If the head did not
have a standard workweek we used his estimate of an average workweek. Some
respondents gave different hours for different times of the year and work hours
were calculated accordingly.
Hours worked on a second job, if any, were then added to the annual
hours on the main job to give the head's total annual work hours.
If data on the main job was missing, 40 hours per week worked or
2000 hours per year was the most common assignment. Typical exceptions were
servicemen who had been on active duty in 1967, who were assigned 72 hours

-173- SURVEY RESEARCH CENTER 1968 SURVEY OF FAMILY ECONOMICS
17(618j [WJ rn7-T-j
WORKSHEET
11.3 4 s 6 7 9 910 SAMPLE BOOK # EDITOR WORK HOURS
HEAD 1. weeks ( F36, G3, H3 )
X =
hrs ( F38/ 41, G4, H4 )
2. + OVERTIME (F40)
3. + SECOND JOB ( F45 )
4. HEAD'S TOTAL ( 1 + 2 + 3 )
5. UNEMPLOYMENT DAYS (F32) X.8 =
6. ILLNESS DAYS ( F34 ) x 16 =
WIFE 7. X = weeks ( I 11 ) hours ( I 12 )
8. HOUSEWORK TABLE C.
9. CHILD CARE ( I 8, 15) $l=lhr
10. FREE HELP FROM OTHERS $l=lhr ( K12, 13, IF K14 = YES)
E.
F.
36 31 38 39
11. SUBTRACT E, F, FROM HOUSEWORK
HOME PRODUCTION
12. (Hrs 1) WORK FOR HOUSING (A 16) 4 2
13. (Hrs 2) ADDITIONS AND REPAIRS (A 24) ; 2
14. (Hrs 3) CAR REPAIRS ( C 23 >
15. (Hrs 4) HOME GROWN FOOD ( E 12 ) $1 = lhr
16. (Hrs 5) MAKING AND MENDING CLOTHES (E18) $
17. TOTAL
INCLUDE 18. ONLY IF SINGLE HEAD OF HOUSEHOLD OTHER? ( SEE INSTRUCTIONS )
TOTAL 19. (A+B+C+D+G+H+I)
OTHERS' WORK HOURS
20. Rl
21. t 2
X
X
M
N =
22. OTHERS
l= lhr
H.
I.
J.
3.
CHK. EDITOR
# MAJOR ADULTS
cl V71 = 71
I subtract
23. TOTAL

-174-
per week, and farmers, who were assigned 60 hours per week.
If the respondent had overtime but didn't know how much, 10 percent
of regular work time was assigned. If the amount was qualified as "a little,"
5 percent was used.
For persons who were unemployed at the time of the interview, and
for retired persons, housewives and students, the annual hours of work
variable was based on a simpler sequence of two questions: "How many weeks
did you work last year?" and "About how many hours a week did you work (when
you worked)?" Questions were not asked to account for the rest of the year.
Unemployment Hours V49
Unemployment hours were calculated at the rate of 40 hours per week
unemployed. For heads who were unemployed at the time of the interview, the
reported number of weeks worked was subtracted from 52 and the residual was
assumed to be the weeks of unemployment during the year. If there was evi-
dence that the unemployment was due to illness, illness hours were assigned
instead.
An exception was made for female heads with children. The inclusion
of unemployment hours together with the housework assignment would result in
double counting in the calculation of total nonleisure so no unemployment
hours were assigned.
Retired persons, housewives and students were not assigned unemploy-
ment hours.
Illness Hours V51
Nonleisure time due to illness was calculated at the rate of 80 hours
per week. For long illnesses, this was reduced to 60 hours per week after

-175-
eight weeks.
As noted above, some unemployed persons were assigned illness hours
according to the above schedule if there was evidence that this unemployment
during 1967 was due to illness. No illness time was assigned for retired
persons, housewives or students.
Wife's Work Hours
This variable was based on the two questions:
I11. About how many weeks did she work last year?
I12. And about how many hours a week did
Some assignments were made when these questions were
income was reported for the wife. For these cases a
and divided into income.
she work?
missed and then labor
wage rate was estimated
It was sometimes difficult for the respondent to estimate work time
for laundry or child care done at home. One hour per dollar earned was
assigned in such cases.
Housework Hours
Annual hours of housework by head and wife were assigned for all
families. The assigned values were based on an analysis of this variable
in the recent study, Productive Americans.1
The important determinants of
the amount of housework done and the predicted values are summarized in the
following table.
1Productive Americans, J. Morgan, I. Sirageldin, N. Baerwaldt,(Ann Arbor: Institute for Social Research, 1966), Monograph 43.

-176-
Married Couples
Alone
TABLE C
FAMILY HOUSEWORK
Single Man is Head Housework Hours
No one under 18 400
Youngest 6-18 600
Single Woman is Head
Alone
With another adult
One or two childrenyoungest 4 or olderyoungest under 4
1000
1300
16002200
Larger families -- use couples table.
Children or others age 4+3 or 4 people5 or 6 people7 or more
Youngest child under 43 people4 or 5 people6 or more
Wife Doesn't Wife Works Wife Works MoreWork O-750 Hours than 750 Hours
2000 1700 1500
2300 2200 18002600 2500 20003000 2800 2400
2600 2600 18003000 3100 23003500 3500 2700
Source: Productive Americans, MTR 146.

-177-
An adjustment was made if there was help with child care from persons
outside the family unit. The predicted housework value was reduced by one
hour for each dollar's worth of paid or free child care received. When this
adjustment was made, the predicted value for non-working wives was always
used as the base point. This is because the predicted value for working
wives already includes an implicit adjustment for outside care. No adjust-
ment was made for working wives if it would have been smaller than the working-
nonworking differential.
The primary difficulties with the general procedure of assigning
housework arose for large families with single female heads, particularly
those who worked. The Productive Americans cross-section sample of 2200
was not large enough to predict the working-nonworking differential or the
kinds of adjustments that are made if older children can care for younger
ones. Such cases constituted a significant subgroup in our large sample
heavily weighted with low income families. Several procedures were used in
an attempt to estimate reasonable housework and total leisure figures.
Admittedly, however, the assignments in these cases are based on inadequate
data and the resulting variables are at best marginally satisfactory.
Nonworking female heads with large families were simply assigned
housework from the couples portion of the above table. This assignment was
frequently the sole determinant of the leisure variable.
The two main sorts of adjustments that were made for working female
heads are as follows. If there was a daughter in the household old enough
to care for younger siblings, free help hours were edited into Variable 55
and used to adjust the mother's housework downward. Such cases of free help
from within the family are identified by a code of 5 in Variable 291. If
there was another adult in the household who might be considered to be a
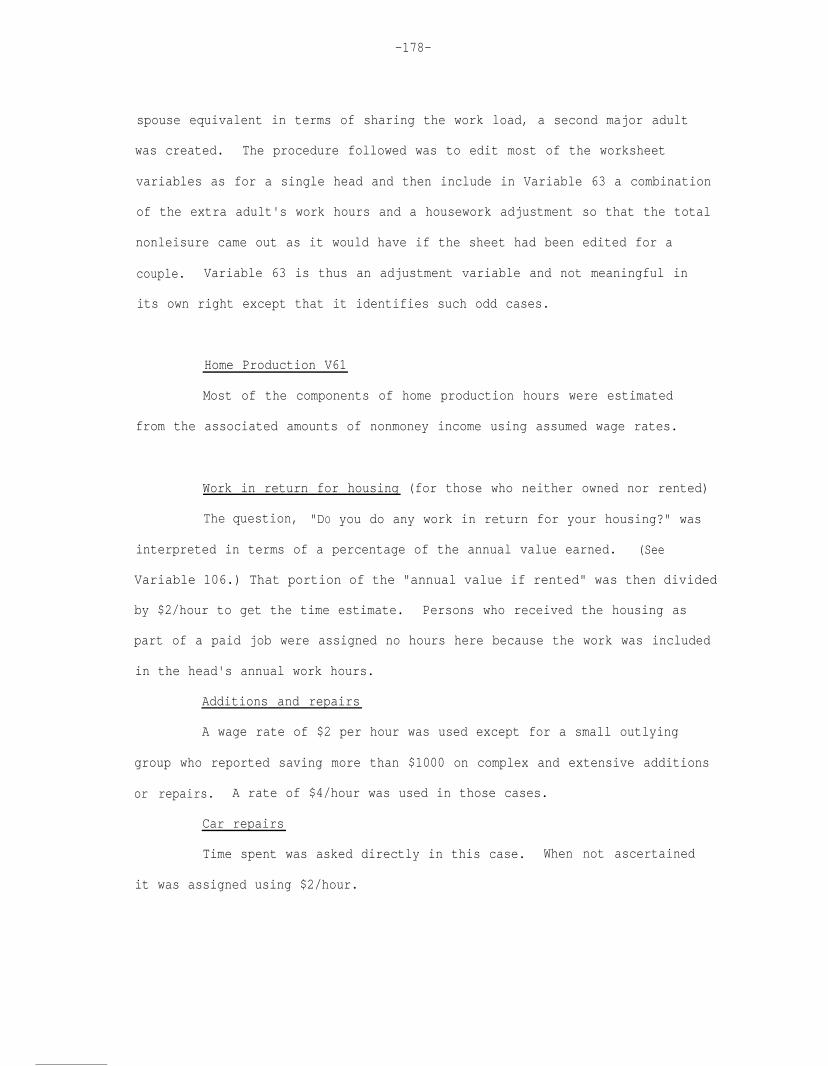
-178-
spouse equivalent in terms of sharing the work load, a second major adult
was created. The procedure followed was to edit most of the worksheet
variables as for a single head and then include in Variable 63 a combination
of the extra adult's work hours and a housework adjustment so that the total
nonleisure came out as it would have if the sheet had been edited for a
couple. Variable 63 is thus an adjustment variable and not meaningful in
its own right except that it identifies such odd cases.
Home Production V61
Most of the components of home production hours were estimated
from the associated amounts of nonmoney income using assumed wage rates.
Work in return for housing (for those who neither owned nor rented)
The question, "DO you do any work in return for your housing?" was
interpreted in terms of a percentage of the annual value earned. (See
Variable 106.) That portion of the "annual value if rented" was then divided
by $2/hour to get the time estimate. Persons who received the housing as
part of a paid job were assigned no hours here because the work was included
in the head's annual work hours.
Additions and repairs
A wage rate of $2 per hour was used except for a small outlying
group who reported saving more than $1000 on complex and extensive additions
or repairs. A rate of $4/hour was used in those cases.
Car repairs
Time spent was asked directly in this case. When not ascertained
it was assigned using $2/hour.

-179-
Home grown food
An effective wage rate of $1/hour was assumed. No hours were
assigned here for farmers because they were assumed to have been included
in reported work hours.
Making and mending clothes
A wage rate of $1/hour was used.
Others' Housework V63
This is an adjustment variable used if there was a spouse equivalent
for a single head of household. See the last part of the discussion of
Housework. This adjustment was also made in a few cases where there were
3 or 4 adults in the household, one of whom did most of the housework and
child care while the others held full time jobs. These cases are identified
by a figure greater than 2 in Variable 71, Number of Major Adults.
Total Nonleisure V65
Number of Major Adults V71
Leisure Per Major Adult V73
The components of nonleisure were summed, divided by the number of
adults to whom the calculation applied, and subtracted from the total time
available, to give Leisure Per Major Adult. The total time available was
assumed to be 16 hours per day for 365 days.
Others' Work Hours V67, V69, V72
Extra earners were ranked in order of descending earned income.
Variable 67 corresponds to the income in Variable 77 and Variable 69 to
Variable 78. The total hours figure for extra earners may include the

-180-
hours of third, fourth, and fifth earners for whom separate time variables
were not edited.
Worksheet 4
Head's Labor Income V74
This variable is the sum of the head's wages (from J8), overtime
and commission (from J10), and professional practice or trade (from J11a)
plus that part of income accruing to labor from mixed-labor-capital income.
In dividing mixed income from a farm or unincorporated business, it was
assumed that the labor was worth at least a dollar an hour. (In cases
where the total dollars earned was less than the number of hours worked,
all the income was assumed to be labor income.) All earnings above a dollar
an hour were then assumed to be half labor income and half capital income.
Mixed income from roomers was simply allocated half to labor and half to
capital. Income from boarders was split 75-25 between labor and capital.
In cases where both the head and wife worked in a family business
or farm and their income was not given separately, their work hours were
combined, their income was divided between labor and capital using the rule
above, and then the head was given two-thirds of the labor income and the
wife was given one-third.
Assignments for the components of this variable were made from the
data of the 1967 Survey of Consumer Finances (SCF). Wage income was assigned
at the mean of groups with the same race, occupation, and education as the
head. Farm and unincorporated business income was assigned as a function
of house value.

-181- SURVEY RESEARCH CENTER 1968 SURVEY OF FAMILY ECONOMICS
12 3 4 5 6 7 8 9 10
HEAD'S LABOR INCOME
1. LABOR PART OF FARM INC. (J4)
2. LABOR PART OF BUS. INC. (J7*)
3. WAGES (J8)
4. BONUS, OVERTIME, COMM. (J10)
5. PROF., PRACTICE, TRADE (J11a)
6. LABOR PART OF ROOMERS ETC. (J11b*)
7. TOTAL ( SUM OF 1 to 6 ) A
WIFE'S LABOR INCOME
8. WIFE'S INCOME FROM WORK (J15*)
CAPITAL INCOME, HEAD AND WIFE 16 17 18 19 20
9. ASSET PART OF FARM INC. (J4*)
10. ASSET PART OF BUS. INC. (J7*)
11. ASSET PART OF ROOMERS ETC. (J11b*)
12. RENT, INT., DIV., ETC. (J11c)
13. WIFE'S INCOME FROM ASSETS (J15*)
TAXABLE INCOME OF HEAD AND WIFE 14. ( A + B + CAPITAL INC. )
TAXABLE INCOME OF OTHERS ( J19 + 522)
15. OTHER WITH HIGHEST INCOME
14. ( A + B + CAPITAL INC. )
16. NEXT HIGHEST INCOME
17. STILL OTHERS WITH INC. ?
OTHERS' TOTAL INCOME V 18. ( 15 + 16 + 17 ) F
36 37 38 39 40 TRANSFERS ( TOTAL FAMILY )
19. A.D.C. A.D.C.U. (J11d) G
20. OTHER WELFARE ( J11e)
21. SOCIAL SECURITY ( J11f)
22. OTHER RETIREMENT (J11g)
23. UNEMP., WORKMENS' COMP. (J11b)
24. ALIMONY ( J11i )
25. HELP FROM RELATIVES (J11j)
26. ANYTHING ELSE? (J11k*)
27. WIFE'S TRANSFER INCOME (J15*)
28. OTHERS' TRANSFER INCOME (J19,22*)
TOTAL FAMILY MONEY INCOME 29. ( C + F + G + OTHER TRANSFERS)
H
46 47 48 49 50
TAX EXEMPTIONS SAMPLE BOOK # OF HEAD AND WIFE
ADULTS EDITOR
+ CHILDREN CHK. EDITOR
+ BLIND, 65 & OVER
+ OUTSIDE FU ____ ENTER DOLLAR AMOUNT (546)
ENTER TOTAL EXEMPTIONS 51 52 53 54
HEAD & WIFE
CIRCLE TABLE USED
TAX FROM TABLE
MS HH
M ' HH
TOTAL FAMILY (J+K+
TAX M L)
MSHH L
55 56 57 58 59 CHILD CARE (18,15)
(SEE BOX E, SHEET 3)
UNION DUES (K18)
COST OF INCOME (M+N+O)
60 61 62 63 64
ASSIGNMENTS
0 none / 1 minor / 2 major

-182-
Wife's Labor Income V75
The Wife's Labor Income is, similarly, the sum of income from wages,
professional practice or trade, and the labor part of income from business,
farm, roomers, and boarders.
Assignments for this variable were made from the 1967 SCF as a
function of the wife's age, education, and race.
Taxable Income of Head and Wife V76
This variable is the sum of Head's Labor Income (Variable 74), Wife's
Labor Income (Variable 75), and the total asset income of both the head and
wife. This asset income consists of the asset part of mixed-labor-capital
income, and income from rent, dividends, interest, and trusts. If income
from dividends, interest, and trusts was not ascertained, it was assigned from
1967 SCF data on the basis of labor income.
Taxable Income of Others V76, V77, V78
The highest and second highest taxable income of persons other than
the head or wife are coded in Variable 77 and 78 respectively. The total
taxable income of others in the family is coded in Variable 79.
If these amounts were not ascertained (as they often were not since
the information was asked of the head), the assignments were made from the
same assignment table as the head if the earner was an adult. If the earner
was a child, a dollar an hour was assigned.
Transfers V80
The total amount that the family received from A.D.C., A.D.C.U.,
and A.F.D.C. was coded separately in Variable 80. If assignments were

-183-
necessary, they were made on the basis of published statistics on the average
payment per recipient by state.
Other transfer income of the family was not coded separately but
simply added into total income. Assignments were made from 1967 SCF data
on the basis of age, labor income, and whether or not the head was self-
employed.
Total Family Money Income V81
This variable is the sum of Taxable Income of Head and Wife (Variable 76),
Others' Total Taxable Income (Variable 79), Total Family A.D.C. (Variable 80),
and the total of the other transfer income of the family.
Financial Support of Persons Outside the Family V82
This amount was taken directly from J45. If the amount of support
was not ascertained, no assignments were made. Thus, this is the only work-
sheet variable with a missing data code.
Total Family Tax V83
The federal income tax for each earner was calculated in the following
way: from total family income we subtracted either the minimum standard
deduction ($200 plus $100 for each exemption) or the 10 percent standard
deduction plus an additional 5 percent to account for the average extra
deductions. We used the method that yielded the lowest adjusted income.
After subtracting an additional $600 for each exemption, the tax was assigned
from the schedules published by the IRS for married persons, single persons,
or heads of households. The total tax was then obtained by adding the taxes
of all the earners together.

-184-
The number of exemptions each earner got was determined by the
number of people inside the family unit he supported plus the number of
people outside the family for whom he provided half of their support. In
addition, the head got an extra exemption if he or his wife were over 65
or blind.
Cost of Income V84
This variable is equal to the sum of the total family income, the
annual union dues of the head (K18), and the cost of caring for the children
if the wife or a single head worked (I8 or 115).
-185-
Part 2
Coding
Introduction
After the editing process was completed the interviews were coded.
Coding involves putting numerical values on replies to questions so that the
data from the interviews can be manipulated by the computer. 1
Coding Procedures
Coders were trained by the Head of the Center's Coding Section before
they were allowed to production-code interviews. In addition, they were
given constant supervision throughout the duration of coding by one of the
analysts working on the study. All coders were required to code two practice
interviews, which were purposely made different to illustrate in advance some
of the problems that might be encountered during production coding. Those who
successfully completed the coding of these two practice interviews were allowed
to production code. For the first two weeks of production coding each coded
interview was "check-coded" by a supervisor of the Coding Section or by one
of the analysts in charge of the study. "Check-coding" consisted of an item-
by-item check of the coded scores with the scores independently coded by the
supervisor for that interview. This process made it possible to determine
early in the study period whether any coder was having trouble and whether any
1For a description of the Coding procedures used by the Survey Research Center,see Manual for Coders, Doris Muehl (Ginsburg), ed. (Ann Arbor: Institute forSocial Research, 1961).

-186-
codes in particular were causing difficulty. After the study staff was
satisfied that the coding errors that were being made were both infrequent and
nonsystematic, only one interview in ten was "check-coded." This gave us a
group of N = 480 "check-coded" interviews.
Coding Reliability
It is this last group of "check-coded" interviews, those check coded
at a rate of one in ten, which was used in the analysis of coding reliability.
Two measures of disagreement were calculated, a gross percent disagreement
between coder and check coder and an estimate of actual coder error, i.e.,
total percent disagreement minus check coder error. The denominator used
in obtaining both these figures was 480 (number of "check-coded" interviews).
Any percent disagreement figure of less than 5 percent was considered non-
significant and required no further investigation. Out of the 243 different
items coded in each interview only 43, or 17.7 percent, needed further analysis.
Coder error was calculated for each of these 43 items and found to
average 12 percent for all of them. The error ranged, however, from 2 to 27
percent. Next, each of these 43 items was analyzed for special coding
problems. Twenty of the 43 cases had actual coder errors of less than 10
percent. This was considered acceptable and no further investigation was made
of them. An analysis of each of the remaining 23 cases revealed that the
questions were either extremely "open-ended," such as attitude questions that
happened to elicit responses that were difficult to code, or questions that
required some knowledge of the degree of skill required to perform certain
automobile and house repairs. Ninety-eight percent of our interviews were
coded by women who seemed to know very little about what constituted a complex
or easy car repair. We did not consider these judgments important since

-187-
complexity estimates were predominately errors of coding a "1" when the item
should have been coded "2" on a five-point scale, rather than errors of
coding a "1" when the item should have been coded "3" or "4."
Hence, the reliability of coding based upon the above-described
analysis was considered acceptable, with the low error rate and no evidence
of any persistent systematic errors. It should be noted that many coding
errors, especially important errors, have been corrected in later stages of
processing.

-188-
Part 3
Data Cleaning Operations
Following the editing and coding processes, the interviews were
keypunched and written on tape. But, before the data could be considered
ready for use in doing analysis, various precautionary checking procedures
were undertaken. The procedures were carried out sequentially, in the
order presented below.
The first of the four data cleaning operations undertaken was a
"sequence check," which merely checked the data for gaps in the number
series. This was done to make sure that all interviews were in fact coded,
that no interview was coded twice, and that each interview had its correct
identifying number.
The next cleaning procedure was a hand operation where each completed
interview and nonresponse form, with its corresponding identification and
location variables, was listed on a computer printout to make sure that a
report on each address (or name and address, depending on the sample) that
was sent to the field interviewer was indeed received back by the Ann Arbor
office - either an interview or a noninterview report. Various errors in
coding were discovered and corrected at this stage. When all the interviews and
nonresponse cases had been accounted for, the interviews were subjected to a
procedure of looking for invalid numerical values on the tape, as well as for
blanks where there should have been some numerical value, and double punches.
A computer program called "Wild Code Check" was used in this operation. This
program, according to specifications, checked each tape location for incorrect
values. For example, a question such as "DO you belong to a labor union?" was

-189-
properly coded 1 for a "yes" response, 5 for a "no" response, and 9 for “not
ascertained." Any value other than the 1, 5, or 9 was an error. The program
printed out the offending record with its interview number and the error was
corrected, by looking at the interview.
The next data cleaning operation, called a "consistency check," was a
check on the internal logical consistency of the entries on the tape for each
interview. This procedure was also completed using a computer program. As an
example of this process, two items coded on each interview were whether or not
the family owned, rented, or neither owned nor rented their dwelling unit
and the family's estimated value of their house if they owned it. For those
who rented or neither owned nor rented, and only for them, a code of zero was
the correct entry on this house-value variable. These logical requirements
were specified in a computer program, and any inconsistent records were corrected
by going back to the original statement by the respondent.
The last check made on the data was for reasonableness. The phrase
"oddball check" was used for this procedure. It involved looking up cases
which seemed to be extreme on a particular value. For instance, to carry the
housing example further, all houses with coded values in excess of $50,000
were looked up to see if indeed the high value was correct or if the amount
was in error. Seemingly large values on money income, and hours of work were
also checked. The majority of the cases were correct as coded, but the procedure
eliminated the risk of one type of serious error. When these checks had been
completed, the next process was construction of additional complex variables.
This process is described in the next section.

-190-
Part 4
Index Creation
General Procedures
Creation of indexes allowed us to group various related dichotomous
measures into more general and more universally applicable analysis
variables. Using the basic conceptual framework of the study, some indexes
were constructed in a deductive manner starting from a priori theoretical
considerations, while some were created inductively by examining the data
and seeing how the various variables were correlated. Most of the economic
status measures were constructed inductively by first assembling meaningful
economic constructs, while the various indexes measuring quality of housing,
background of the head of the family, attitudes, and behavior patterns
were constructed using both methods. An index constructed by either method
was considered tentative until each of the components of that index was
correlated with the entire index and examined for positive or negative
correlation. If the component was sufficiently positively correlated with
the entire index, that component was retained in the index. If the correla-
tion of the component with the entire index or one of the other components
was sufficiently negative, that component was removed. In a very few cases,
it was necessary to revise some indexes and eliminate components from other
indexes.
There are several reasons why indexes were required on this study.
First, even with nearly 5,000 cases (degrees of freedom), there needed to
be some restriction on the number of predictors used in any one analysis.
The technique of constructing an index allowed a number of related variables

-191-
to be collapsed into a more general variable, thus reducing the number of
independent variables in an analysis.
Second, an index is metricized and is easier to use as a dependent
variable or predictor than each of the components taken separately. Changes
in the score value on an index between one year and another or net differences
from the average of others in the same year can be computed easily. For
instance, "economizing behavior" is associated with low incomes where the
pressure to economize is the greatest, but the theory is that such behavior
also helps to increase one's income in the future. Hence, the initial
comparison should be whether the family does more or less economizing than
others with about the same income. Having scores on the same index for two
years for a family allows between-year comparisons.
The third reason for index construction is closely related to the
second. Basing an index on five or six items rather than one or two
increases the probability that the index score for any one family in the
sample will be meaningful. For instance, a family cannot score a point
on an index of money earning behaviors for saving money by doing car
repairs unless they own a car. However, it is probable that the other
component variables comprising this index are relevant for this family.
To neutralize the effect of a component of an index that is irrelevant
for a family, a middle score was arbitrarily assigned for that component
of the index. Operationally, neutralization takes the form of giving one
point for an irrelevant component, while those for whom the item is relevant
are given two points for "scoring" and zero points for "not scoring."
Nevertheless, it is advisable to use the indexes cautiously if some of
their components are irrelevant for a large fraction of the respondents.

-192-
The fourth reason for index construction is that it allows bypassing
lengthy factor analyses, which are difficult in any case with categorical
variables. We were able to avoid doing factor analyses by looking at the
correlation of a component variable with the index in which it was included.
A component that has a very low or negative correlation with the composite
index means a negative correlation with one or more of the other components,
and problems of one component value in the index cancelling out another.
Fifth, it is easy to test whether or not the components are indeed
additive in their effects on a dependent variable by treating the index not
as a single value but as a set of categories of values. If they show linear
relationships with the dependent variable, then the assumption of additivity
of the components is given credence. If not, then there is evidence either
of substitutability--any one or two components are enough--or complementarity--
it takes most or all components together to produce an effect.
Finally, an index provides a rapid method of eliminating variables
which have no effect on a dependent variable, for if the sum of a set of items
which are not negatively correlated with one another has no effect on a
dependent variable, it can be assumed that none of the components have any
effect either. This is not a perfectly safe assumption since one component
may have an effect in the reverse direction, but it does allow a method for
rapid first examination. If the index does have an effect on a dependent
variable, then it is always possible to dissect it and determine which
components are producing the effect.

-193-
Index Measures of Economic Status
Income (1967)
Various subcomponents of money income were added on Worksheet 4
by the editors. (Worksheet 4 is reprinted in Part 1 of this Section.) Income
has been categorized partly according to recipient--head of the family, wife,
or others --and partly according to its source: work for money, transfers, or
capital income or transfer income. But in order to develop the various con-
cepts needed it was necessary to combine these components in various ways.
In addition to all the forms of money income, estimates were also made for
each family of its non-money income, including both imputed returns on assets,
such as one's own home, and the imputed value of work which produced rewards
in non-money forms, such as do-it-yourself projects. Also taken account of
in these measures were the various deductions from income: estimated federal
income taxes, union dues, and child care costs when there was nobody home to
take care of the children. To the family's total money income imputations
were added to derive real income. Then the costs of earning income were
subtracted from this real income to get a measure of net real income.
Variables 74-91 are the major measures of money income, while Variables 322-
324 are the measures of real income.
Family Needs
Measurement of a family's economic status requires comparing the
family's income with some measure of how much the family needs. These
measures of needs are of course not absolutely correct but merely a relative
adjustment for different family sizes and types. Two of these measures were
calculated on Worksheet 2. The food needs standard of the Department of
Agriculture that was computed for each family was based on specific estimated
costs of fulfilling the food requirements of individuals of varying age and

-194-
sex. This annual total was then adjusted according to the Department of
Agriculture's notions for economies of scale for larger families and diseconomies
for smaller families. The total needs measure is based on the food needs
standard which is then expanded to estimate the total family needs according
to the Orshansky principle of multiplying by three, except for smaller
families, where diseconomies of scale are taken into account and a larger
multiplier is used.
Leisure Time of Family
A component of economic status that is often neglected is leisure,
which we measured in this study by first assuming that everyone had 16 hours
a day, or 5,840 hours a year, after deductions were made for sleeping and
eating. Included in our measure of leisure were the head of the family and
his wife, if any. These two individuals were considered "major adults," and
the sum of their number of hours of leisure was divided by two to arrive at
the "leisure per person" figure for the entire family. In unusual circum-
stances, especially where the functional role of the wife was fulfilled by
another person, that person was considered a major adult as well. Worksheet 3
illustrates the editing procedure used in deriving this concept. Basically,
time spent working--whether or not for remuneration--and doing housework
were deducted from the initial 5,840 hours. Other minor adjustments were
made. Eight hours per working day for each day the person was unemployed
was deducted on the grounds that this was not enjoyable leisure time. Sixteen
hours a day during the days that people were ill were deducted on the grounds
that this, too, was unwanted leisure. Estimates of the amount of time house-
work took were based on earlier Survey Research Center data; no questions
about housework time were included in the 1968 survey. These three types of
measures of economic status--income, needs, and leisure--were combined into

-195-
more refined measures as described below.
Income/Needs Ratios
The most obvious first step of refinement was to relate various
measures of income to needs for each family to get what is sometimes called
a welfare-ratio ox poverty index. It is not advisable to attach very much
significance to the value of the ratio when it is equal to one, i.e., calling
it a definition of poverty. But the ratio taken as a number can be used as
a rough indicator of how well-off a family is. A series of such ratios were
generated varying from the simple ratio of money income to the annual needs
standard measure to ones which used more complex and refined measures of income
and needs. (See Variables 325-327.) Eight additional such measures were
developed using two definitions of the level of adequacy of the needs standard,
with two refinements on these definitions, and two different adjustment
factors for farmers. The two definitions of the level of adequacy were the
low cost and the more spartan economy level. The refinement was a modified
standard that was based on the 1965 food consumption survey data which allowed
for economies of scale up to the eleventh family member. One adjustment for
farmers multiplied the calculated ratio by .8, the figure suggested in the
U. S. Department of Agriculture, while the other multiplied the calculated
ratio by .7. The correlation between each one of these welfare ratios was
very high. And although each measure may give a slightly different estimate
of the total number of poor, a family's relative position on one index is
likely to be that same position on each of the other indexes. This is
especially true of all the ratios that use money income, but it is not quite
so true of the ratios where the numerator included components of nonmoney
income.

-196-
Quality of Housing
An important measure of economic status, and one which is difficult
to measure adequately, is quality of housing. Since this measure was used
in deriving the measures of real income, it is worth describing the problems
that exist in measuring this variable, Strictly monetary measures of housing
quality are deficient since there is not necessarily a very good connection be-
tween the amount someone pays for housing and what he gets for it. For example,
some people are the beneficiaries of rent control or landlords who haven't
raised their rent for some years, while others have houses that they have had
for many years that are far better than they need. There are also those who
have faced discrimination in housing and there are those who are recent
migrants and who probably pay higher than average rents for their quarters.
Still others live in subsidized housing. A nonmonetary measure of housing
is also unsatisfactory. Obvious deficiencies that make for substandard housing
are in fact so rare that it seemed inefficient to ask questions about them
in the interview. We did ask the interviewers to note at the end of the inter-
view any obvious deficiencies such as no indoor plumbing, no evidence of
running water in the house, and structural defects. These qualitative assess-
ments were combined with the monetary measures of actual rent or house value.
Other monetary and qualitative measures were included as well. Variable 387
gives all the details of this index.
Measures of "Well-0ffness"
The term "well-offness " describes a class of measures that are more
comprehensive than simple ratios of income to needs, but still focus on the
economic resources of time and goods and services. The term "well-offness"
was chosen over the term "welfare index" since the later implied too broad
a concept and one that might be too tied to the institution of public welfare.

-197-
At issue in the creation of these measures was the problem of how to combine
a measure of the family's control over goods and services (relative to its
needs) with a measure of the leisure time left to enjoy those goods and
services. In essence a measure was desired that would allow ascertaining
whether or not a family was better off in one year than another, taking into
account the fact that any or all of the components, income, family size, or
leisure, might change between one year and another.
Two simplifying assumptions were made: first that the indifference
curve between leisure and real income, or willingness to substitute one for
the other, is roughly a rectangular hyperbola, so that if the product of
income and leisure was constant over two years the family's satisfaction was
unchanged between the two years. Second, it was assumed that total satisfaction
or well-offness is a homogeneous linear function of the two components as in
the theory of production with equal exponents, so our measure of well-offness
becomes
This means that if a family has 10 percent more income relative to
its needs, and 10 percent more leisure too, it is 10 percent better off. It
also means that trading a 10 percent increase in income for a 10 percent
decrease in leisure leaves the family at the same position. The trick is,
of course, that components measured in different units cannot be added but
they can be multiplied. But there is the basic theoretical reasoning, too,
that people have a diminishing rate of substitution between leisure and income.
Three "well-offness" measures were built, one using money income,
and two others using real income; see Variables 328-330. But neither of
these could adjust for the persistent housing quality measure problems:
that what people get for their housing dollar varies a great deal from one

-198-
family to another. There may be other goods and services where price differences,
or differential subsidies, make money an inadequate measure of how well-off one
can be, but housing appears to be the more serious problem.
As stated earlier some people pay low rents because of rent control,
the inertia of their landlords, the willingness of relatives to provide free
housing, or because of various subsidized housing programs. Others pay dearly
for the housing they get, perhaps because of discrimination or perhaps they
find themselves in a tight housing market. And if one of our panel families
were to move from one of these situations to the contrasting one, nothing
would happen to their income, needs standard, or leisure time; yet they would
be better or worse off because their income would buy more, or less. Therefore
another measure was developed which subtracted from net real income all housing
costs (and also imputed housing components of real income).
Index Measures of Background of the Family Head
Three background indexes were built; all referring to the head of
the family. The first was an index called "Background Problems," which
combined early childhood handicaps such as poor parents, growing up on a
farm, inadequate education (less than 6 grades and reports difficulty reading),
and having a child before the age of 20. The second of these was "Employment
Problems," which combined recent experiences of unemployment, illness, loss
of job, and other problems suggesting difficulty in securing employment.
The third, "Current Handicaps," combined various current situational variables
that might be a predictor of the head's current economic status. (See Variables
384-386 for these measures.)

-199-
Index Measures of Behavior
Six indexes of behavior were created, with four of them redone in
revised form. The descriptive titles of these indexes should be considered
only as shorthand indicators of what variables are covered in them.
The index, "Horizon Expressed," combines various evidences of actual
explicit plans or expectations about the future, including plans about moving,
children's education, job change, as well as ownership of substantial savings.
It is worth noting that the correlation between this index of Horizon Expressed
(Variable 391) and the attitudinal counterpart "Self-reported Horizon"
(Variable 392) where the respondent said he planned ahead and that his plans
worked out and that he would rather save than spend, was very low (r = .18).
This low correlation reflects in part the unanchored nature of self-ratings,
but also reflects the fact that explicit behavior reports contain a lot of
random noise because for each behavior there are some for whom it is irrelevant,
impossible, or perhaps, means something different from what we infer.
The second variable, "Connectedness to Sources of Information and
Help," combines reports of ten activities which seemed potentially likely to
provide the respondent with information or help. The activities included
range from going to church to visiting a bar or tavern, and from reading
newspapers to knowing people in the neighborhood. The theory was that when
a man needs a job, or facts about where to get something fixed or buy it cheap,
it helps to have people he can contact without difficulty. (See Variable 393.)
"Income-Increasing Acts" (money-earning acts), combines a number of
job-related actions, and hence is meaningless for those not in the labor
force. Such things as working more than full time, having a working wife,
doing something about a better job, not being late to work or not coming to
work, or moving to get a better job, were all included. (See Variable 394.)

-200-
"Real Earning Acts" combines reports on various kinds of activities
that produced nonmoney income directly with investments in human capital
such as taking courses or lessons. A number of items such as doing one's
own additions and repairs to the home, repairing a car, sewing and growing
one's own food are included. This index is negatively correlated with income.
A revised version of this index exists, as well. (See Variables 395 and 427.)
"Economizing" as originally built combined such components as getting
more than 100 hours of free help, not owning a very new car that could de-
preciate, eating together as a family, restricting expenditure on alcohol
and cigarettes, not eating out much, and reporting special ways of saving on
food and clothing purchases. A variant on this index was built that omitted
the special ways of saving on food and clothing. Both variants are strongly
negatively correlated with income. (See Variables 396 and 432.)
"Risk Avoidance" combines such things as keeping the car in good
condition, having it insured, using seat belts, having some savings, not
over-smoking, and having medical insurance or, if not, a way to get free
medical care. (See Variables 397 and 434.)
Index Measures of Attitudes
Four attitudinal indexes were created, with additional variants on
two of them. Most of the component variables for these indexes came from
Section L of the questionnaire. The questions in this section were all bal-
anced and of the fixed alternative type, with the first stated alternative
the opposite of the second. An example from the questionnaire was the
following: "Would you rather spend your money and enjoy life today, or save
more for the future?" Even though just two alternatives were read to the
respondent, there was space left in the questionnaire for the interviewer

-201-
to record any qualifications to their replies. All these attitudinal questions
were categorized using a five-point Likert scale. The overwhelming majority
of respondents, however, repeated one or the other of the alternatives
without any additional comments of their own, and these replies were coded
at the extremes of the scale. The attitudinal questions used in this wave
of the questionnaire were carefully pretested; many of them have been used
on other studies done at the Survey Research Center. All of these questions
were self-rating in nature.
"Trust in Others," or the variant on this index, "Trust or Hostility,"
was developed to get at the respondent's belief that it is possible for him to
get somewhere. The variant of this index "Trust or Hostility" was a more
dichotomized index, with only the extreme scores getting a point. (See
Variables 389 and 420.) "Ambition (verbal)" or expressions of aspiration
was intended to get at the respondent's sense of pressure to get ahead.
(See Variable 390 and 423.) "Sense of Personal Efficacy" and its variant
"Reported Efficacy and Planning," concern the respondent's sense of whether
his life and plans would work out, and whether or not one felt limited and
generally satisfied or dissatisfied with himself. (See Variables 388 and 419.)
"Self-Reported Horizon" has to do with the sense of the respondent's looking
ahead. (See Variable 392.)

-202-
Part 5
Response Rates and Weighting
Introduction
Since the entire sample of respondents was actually two samples, the
general cross-section sample of newly selected addresses and the reinterview
sample secured from the Census Bureau, the response rates of these two samples
are discussed separately. However, the weighting was done taking both samples
into consideration, so that all interviews can be analyzed as one representa-
tive national cross-section sample when weighted.
Response Rates for the Cross-Section
The overall response rate' for the entire cross-section sample was
77 percent, netting us 2930 completed interviews. Response rates were
significantly lower in the SMSA's than in the Non-SMSA areas. Furthermore,
response rates were consistently lower in the SMSA areas of the Northeast
than SMSA areas outside the Northeast, especially for the central cities of
the largest SMSA's. The response rate for the Non-SMSA areas did not vary
according to region and was 7 percentage points higher than the overall rate
for the entire sample. These differences in response rates were taken into
consideration when weights were calculated for the data.
1 "Response rate" means total response divided by the sum of total cross-sectionresponses plus the noninterview cases of the cross-section. Nonsample cases--house vacant, address found not to be a residential dwelling, respondentabsent--are omitted from the base. The response rate would be 100 percent ifthe interviewer had been perfectly successful in obtaining usable interviewsfrom every unit properly in the sample.

-203-
Table 1
RESPONSE RATESa BY SIZE OF SAMPLE AREA AND
WHETHER IN NORTHEAST
(Cross-Section Sample)
Size of Sample Area
Central cities of12 largest SMSA's
Suburbs of 12largest SMSA's, andother SMSA's
Non-SMSA areas
Total
Region
Northeast Non-Northeast
54% 66%
67% 69%
84% 84%
66% 80%
Total
60%
76%
84%
77%
a[Total Response / (Total Response + Non-Interview Cases)]

-204-
Other variables, mostly demographic, were also examined for response
rate variations. Response rates varied according to age of the head of the
family with those under age 35 and those 75 or older having the highest
response rates, about ten percent higher than the overall average. Families
whose heads were between ages 35 and 74, accordingly, had response rates
slightly lower than the overall average. Differences in response rate accord-
ing to the sex of the head of the family were only minimal. Those living in
single-family dwellings had a response rate of 80 percent, while the rate for
those living in large apartments was substantially lower, 59 percent.
Response Rates for the Reinterview Census Sample
The overall response rate for the reinterview sample was 74 percent.
It must be kept in mind that this response rate reflects the fact that inter-
viewers had to deal with names and addresses of respondents interviewed once
before by another organization and who probably lived in neighborhoods with
which the Survey Research Center interviewer was not familiar. Hence, some
potential respondents were never found, some were deceased, and some had
moved out of the range of any of our interviewers. It should also be noted
that the reinterview sample excluded entirely or underrepresented some groups
who have high average response rates, e.g. people over 60. Nevertheless, in
spite of these problems the response rate was only 3 percentage points lower
than that for the cross-section sample. This sample netted 1872 completed
interviews.
This sample showed the same general relationship between size of area
and response rate that the cross-section sample showed, with the rates lower
for the SMSA areas than elsewhere. (See Table 2.) It must be noted, however,
that the only Non-SMSA part of the sample was located in the South. There was

-205-
Table 2
RESPONSE RATES BY SIZE OF SAMPLE AREA AND REGION
(REINTERVIEW CENSUS SAMPLE)
Size of Sample Area
12 largest SMSA's
Central Cities
Suburbs
Other SMSA's
Non-SMSA areas
Total
Region
NorthNortheast Central South West- -
58% 71% 68%b 64%
68% 64%b 77%b 64%
87%a 67% 68% 64%
C C85%
C
61% 70% 78% 64%
aOnly seven casesbBetween thirty and 50 cases
No cases in these cells
Total
65%
67%
76%
85%
74%

-206-
not quite as pronounced a difference in response rate between central cities
of the 12 largest SMSA's and other SMSA areas in this sample as there was in
the cross-section sample. The Northeast and the West had a lower response
rate than did the other two regions of the country. There were some admin-
istrative difficulties in securing interviews in the Northeast and West that
were unique. The South had a higher overall response rate than did any of
the other regions, but it must be remembered that this was the only region
that contained sample points in Non-SMSA areas.
Weighting
The cross-section sample is a self-weighting sample except for
adjustments for differential non-response. The reinterview Census sample,
however, is far from self-weighting. It started with widely different
sampling fractions between its two halves and within the low-income supple-
ment (see Section II), and had these compounded by non-signing of releases
of data and the selection of PSU's by SRC, as well as by differential non-
response from the Census in 1967 and from the Survey Research Center in 1968.
The weighting can be thought of as combining two parts. First, a
set of weights were calculated, taking account of the variations in selection
rates and the fact that only some parts of the cross-section sample were
eligible for duplication in the Census sample. These calculations were made
originally segment-by-segment, and later pooled. Secondly, differences in
response rates by region and city size were allowed for. When there are
several families because of "split-offs" (e.g. a young adult leaving home),
the weight of the original family is given to the split-off family. And the
family weight is given to each individual in that family, when using the
individual as the analysis unit.

-207-
The resulting weights reduce the possible biases from differential
sampling fractions, nonsigning of releases, and SRC selection rates, as well
as from differential non-response rates on this wave. At best, however, the
weighted results should not be thought of as efficient or totally unbiased
national estimates. The weights are more usefully thought of as reducing
biases in the estimates, especially in the relationships between changes
which we intend to estimate. For some purposes, where emphasis in on low-
income people, it may even make more sense to analyze the data unweighted,
focusing attention on the group out of proportion to their frequency in the
population. When analyzing the data unweighted, however, one must keep in
mind that non-representative samples can produce biased estimates of re-
lationships, and of relationships among various kinds of change over time.

-208-

-209-
SECTION V
TAPE CODE AND DISTRIBUTION OF RESPONSES
The Two Tapes and Their Variables
This section includes the tape code, a description of the tape, and
weighted distributions on most of the variables. There are two tapes, one
having a record for each family, and one having a record for each individual
in the sample. Both tapes are for both samples combined. However, if desired,
the cross-section part of the sample can, through filtering, be used for
analysis purposes by itself.
The family and the individual tapes have their first 439 variables
in common. The only difference between the two in the variables included is
that the individual tape has thirteen additional variables that pertain to
the individuals alone such as age, sex, relationship to the head
etc.
of the family,
The first four variables on both tapes are identifiers. Next come
the group of variables that were created at the editing stage of the process
(Variables 5-91), followed by the variables that were coded directly from the
completed interview (Variables 92-318). The remaining variables are those
generated in the computer after the data-cleaning operations. Variable 439 on
both the individual and the family tape is the weight variable. When analysis
is being done on the entire sample, whether using the family or individual as
the analysis unit, the data should be weighted with this variable. Weights
can be omitted only when the proportion of the population represented by an
individual or family, or group, is of no concern. See Part 5 of Section IV for

-210-
the discussion of weighting.
The tape code is set up, reading from left to right, with the variable
number first, followed by the tape location, and a description of the variable's
content. Immediately to the left of the vertical list of numerical values is
a percentage distribution. This percentage distribution is a weighted dis-
tribution on that variable for the entire sample--both the cross-section and
the Census reinterview halves. These percentages do not always add to 100.0
percent because of rounding. In cases where there was no space for the dis-
tribution immediately to the left of the variable, the distribution was put
after the tape code. No percentage distributions are given for variables
that are in excess of one digit in width. The tape location implicitly gives
the field width of the variable. It should be noted that the value 9 is
often used to signify "not ascertained" and the value 0 is frequently used
when a variable is inappropriate for the unit. In numerical variables of
more than one digit in width, however, the value 0 practically always means
zero. One should be cautious of 9's in a field of more than one digit in
width. This designation was often used when the value for the field was not
ascertained. The code will always indicate whether or not this is true.
Technical Specifications of the Tapes
The two tapes have been built for use on the Institute for Social
Research's OSIRIS/40 system, our version of the IBM (O)perating (S)ystem for
a 360/40. The standard tape as used by this system contains a dictionary in
front of the actual data file. This dictionary contains information about
each variable including the variable number, its type, its alphanumeric name,
tape location, field width, number of decimal places, and specifications of
what the missing data codes are (optional). A tape file in this format is

-211-
called a "Standard File," and it can be used in its original form with the
dictionary only on the OSIRIS/40 system. However, both tapes can usually be
reformated to the user's specifications if these specifications are known in
complete detail.
Both tapes are labeled g-track tapes, with 800 BPI, and written in
EBCDIC (Extended Binary Coded Decimal). Both the family and the individual
tapes are in blocked format, with a fixed record size. The logical record
length of the family tape is 748, while the block size is (748 x 4 families
per block) 2992. The logical record length of the individual tape is 770
while the block size is (770 x 4) 3080.
Procedures for Buying a Tape or Other Data
Any potential user can purchase one or both tapes according to his
own specifications. The cost of one tape and its code should not exceed $500.
Both tapes for 1968 are currently available. If one is not sure precisely in
what format he wants the tape, consultation with the computing center where
the tape will be used is advised. All inquiries regarding the above or any
other information about the study should be made in writing to: Librarian,
Economic Behavior Program, Survey Research Center, Institute for Social
Research, University of Michigan, Ann Arbor, Michigan 48106, and should refer
to Project 45768.
After each of the five years of interviewing, it is planned to make
available tapes and associated tape codes and a set of documents from each
year describing the procedures of the study, including sampling, interviewers'
instructions, editing procedures, creation of complex variables, etc. In sub-
sequent years the data will include variables that show measures of change.

-212-
Worksheet 1 (Housing, Cars, and Payments)
Variable TapeNumber Location Description and Details
1 l-3 Study number (768)
2 4-8 Sequence number (the last digit of this number is zerofor all but 35 cases which were coded 1. These casesare related secondaries about to leave home, who wereinterviewed separately. Most data tapes omit the 35,so the last digit of this number will be =O)
4
6
9-12
13
14-18
19-22
Family number (the first four digits of the sequencenumber, and kept as the link with later reinterviews,i.e., coded each year for any member of this familywho is reinterviewed.
Sub-family number (the last digit of the sequencenumber. This will be 0 except for 35 relatedsecondaries who will be eliminated from most datatapes).
House value- -00000 Inap, not a home owner99999 $99,999 or more(There are no missing data; they were assigned values)
Property taxes (estimated from house value using datafrom previous surveys) and region, and central cityor suburbs. Rate of taxation on house value wasassigned on the basis of data from previous surveys.The assigned tax rates are shown in the table below.
PROPERTY TAXES/HOUSE VALUE
Distance from Nearest Maine, Vermont, Mass.,City of 50,000 or More Rhode Island, N.H.,(Question N11, page 31) Connecticut, New
England (See InterviewerLabel) Other
0 - 5 .025 .020
5 - 49 .020 .015
50 miles or more .015 ,010
Source: E.S. Maynes & J. N. Morgan, "The Effective Roleof Real Estate Taxation," R.E. Stat. XXXIX (Feb.1957), 14-22.

7
8
9
10
11
12
13
14
15
16
23 Accuracy of house value and property taxes
24-27
28 Accuracy of mortgage payments (See code for Variable 7)
29-32 Annual rent paid
0000 Inap, does not pay rent
9999 $9,999 or more
33
34-37
38
39-41
42
43-46
-213-
0 No assignments
1 Minor assignments
2 Major assignments (probable errors more than $300 or 10%
3 Complex property, requiring allocation of propertytaxes, etc. between dwelling and other purposes ofbuilding.
Annual mortgage payments
0000 Inap, does not have mortgage payments
9999 $9,999 or more
Accuracy of rent payments
0. No assignments1. Minor assignments2. Major assignments (probable errors more than
$300 or 10% of the total)
Annual rent value of free housing (for those whoneither own nor rent)
0000 Inap.
Accuracy of annual rent value of free housing(See VII code)
Annual Utilities Paid
0000 None9999 $10,000 or more
Accuracy of annual utilities(See VII code)
Value of Additions and repairs done by R and family
0000 Did none self9999 $9,999 or more

-214-
17
18 48-51
19
20
21
22
23 62 Accuracy of V22 (See V11 code)
24 63-65 Amount saved doing own car repairs
0000 Nothing (or did no repairs)9999 $9,999 or more
25 66 Accuracy of V24 (See V17 code)
26 67-69 Hours spent repairing car
000 None999 999 or more
27
28
29 75 Accuracy of V28 (See V11 code)
47
52
53-56
57 Accuracy of V20 (See V11 code)
58-61 Annual payments on car debts
0000 No car payments9999 $9,999 or more
70
71-74
Accuracy of Vl6
0. No assignments1. Minor assignments2. Major assignments
4. Work done free of charge by someoneoutside the family unit
Annual payments on previous additions and repairs(Debt)
0000 No payments9999 $9,999 or more
Accuracy of V18 (See V11 code)
Annual cost of car insurance
0000 No insurance (or no car)9999 $9,999 or more
Accuracy of V26 (See V11 code)
Annual payments on other debts
0000 No such payments9999 $9,999 or more

-215-
Worksheet 2 (Food Expenditures and Food Needs)
VariableNumber
TapeLocation Description and Details
30 76 Family size
9 Nine or more
31 77-80 Annual food standard (Needs)
This is based on the USDA Low Cost plan estimates of theweekly food costs, according to the table below (repro-duced from Family Economics Review March, 1967),summed for the family converted to annual (times 52),and adjusted for economies of scale by USDA rules asfollows:
Single person - add 20%Two persons - add 10%Three persons - add 5%Four persons - no changeFive persons - deduct 5%Six or morepersons - deduct 10%
TABLE B. INDIVIDUAL FOOD STANDARD (LOW COST)
Age
Under 3
4 - 6
7 - 9
10 - 12
13 - 15
16 - 20
21- 35
35 - 55
55 +
Male
3.90
4.60
5.50
6.40
7.40
8.70
7.50
6.90
6.30
Female
3.90
4.60
5.50
6.30
6.90
7.20
6.50
6.30
5.40
(This same standard will be used in subsequent years,leaving adjustments for inflation, etc. to users.)

-216-
32
33
34
35
36
37
38
39
40
41
81-85 Annual Need Standard
86-88
89 Accuracy of V33 (See V11 code)
90-92 Annual expenditure on cigarettes
000 None999 $999 or more
93
94-97
98 Accuracy of V37 (See V11 code)
99-101 Saved growing own food (in 1967)
000 None
102
103-105
This is the Orshansky-type poverty threshold, basedon the annual food needs standard above, with anadditional adjustment for diseconomies of smallhouseholds (in rent, etc.) and an adjustment forfarmers:
Basically it is: 4.89 times the food needs forsingle persons3.7 times the food needs fortwo person units
3.0 times the food needs for allother units
Annual expenditures on alcoholic beverages
000 None999 $999 or more
Accuracy of V35 (See V11 code)
Annual food expenditures, (corrected to excludealcohol and cigarettes)
0000 None9999 $9,999 or more
999 $999 or more
Accuracy of V39 (See V11 code)
Saved sewing own clothes
000 None999 $999 or more

42
43
44
45
46 114 Accuracy of V45 (see V11 code)
106
107-109
110
111-113
-217-
Accuracy of V41, (See V11 code)
Value of free food received on job (annual)
000 None999 $999 or more
Accuracy of V43 (See V11 code)
Saved by using food stamps (non-money income subsidy)
000 None999 $999 or more

-218-
Worksheet 3 (Time Budgets)
VariableNumber
TapeLocation Description and Details
47 115-118 Head's annual hours working for money
0000 None9999 9999 or more
48 119 Accuracy of V47 (See V11 code)
49 120-123 Head's non-leisure from unemployment (Annual hours)(Days unemployed times 8)
0000 None9999 9999 or more
50
51
52
53
54
55
124 Accuracy of V49 (See V11 code)
125-128 Head's non-leisure from illness (Annual hours)(Days ill times 16 for the first 8 weeks andtimes 8 for time thereafter)
0000 None9999 9999 or more
129 Accuracy of V51 (See V11 code)
130-133 Wife's annual hours working for money- -0000 None or Inap.9999 9999 or more
134 Accuracy of V53 (See V11 code)
135-138 Hours of purchased child care (if children under 12and adults all work) (Based on reported cost ofchild care, assuming $1 per hour)
0000 None or Inap.
56 139 Accuracy of V55 (See V11 code)

57
58 144 Accuracy of V57 (See V11 code)
59 145-148 Hours spent on housework by head and wife. (Basedon estimates from Productive Americans (see below)after deducting purchased child care hours (V55) andfree help (V57))
60
140-143
-219-
Free help with housework, baby sitting, etc. fromoutside dwelling. (Based on amount saved by suchfree help, assuming $1 per hour.)
Single Man Housework Hours
No one under 18
Youngest 6-18
If child under 6, ormore than 4 in FU
Single Woman
Alone
With another adult
One or two childrenyoungest 4 or older
youngest under 4
Larger familiescouples table.
- use
Married Couples
Alone
Children or others age 4+3 or 4 people5 or 6 people7 or more
Youngest child under 43 people4 or 5 people6 or more
400
600
1000
1300
1600
2200
Wife Wife works Wife worksDoesn't but less than more thanWork 750 hrs/yr 750 hrs/yr
2000 1700 1500
2300 2200 18002600 2500 20003000 2800 2400
2600 2600 18003030 3000 23003500 3500 2700
Source: Productive Americans, MTR 146
149 Accuracy of V59 (See V11 code)

-220-
61 150-153
62 154 Accuracy of V61 (See V11 code)
63 155-158 Housework by second adult (not wife) who is to beincluded in calculating leisure per adult. (Extrahousework from Table if second adult were treatedas spouse.)
64 159 Accuracy of V63 (See V11 code)
65 160-163 Total non-leisure hours (working, ill, or unemployed)for head and wife (or second adult, Sum of Variables47, 49, 51, 53, 61, 63)
66 164 Accuracy of V65 (See V11 code)
67 165-168 Work hours of first extra adult (for money)
68 Accuracy of V67 (See V11 code)
69 170-173 Work hours of second extra adult
70
71
174 _Accuracy of V69 (See V11 code)
175 Number of major adults(The number of adults for which the total nonleisurehours was calculated)
72 176-179
73 180-183
Annual hours spent on home production(Work for housing, own additions and repairs, carrepairs, growing food, making and mending clothes)
Total hours worked for money by anyone other thanhead and wife
Leisure hours per major adult(5840 available hours minus non-leisure, V65) dividedby number of major adults, V71). The source of5840 is 365 days of 16 hours each, allowing for8 hours sleep.

-221-
Worksheet 4 (Money Income)
VariableNumber
TapeLocation Description and Details
74 184-188 Head's money income from labor(Labor part of farm income and business income,wages, bonuses, overtime, commissions, professionalpractice, labor part of income from roomers andboarders or business income(See editing instructions)
75 189-193 Wife's money income from work
76 194-198 Income from capital of head and wife_ - . -(Asset part of income from farm, business, roomers,etc., plus income from rent, interest dividends,etc., and wife's income from assets)
77
78 204-208 Taxable income of other person with next highest income
79 209-213 Taxable income of all earners, other than headand wife.
80 214-218
81 219-223 TOTAL FAMILY MONEY INCOME
82 224-227
199-203 Taxable income (from labor or capital) of the personother than head or wife with the highest income
Aid to Dependent Children, Aid to Dependent Childrenwith Unemployed Fathers (ADC, ADCU) for the entirefamily. This is part of transfer income.
This is the sum of V76, 79, 80 plus transfer incomeother than ADC, ADCU. (Total transfer income isavailable by subtracting Variables 76 and 79 fromVariable 81.)
Contributions made to outside dependents (outside thedwelling)(This is an out-transfer which could be deductedfrom income, and is in one variant developed inthe 1969 wave.)
0000 None9998 $10,000 or more9999 N.A.
NOTE: This is the only variable on the worksheets wheremissing data was not assigned.
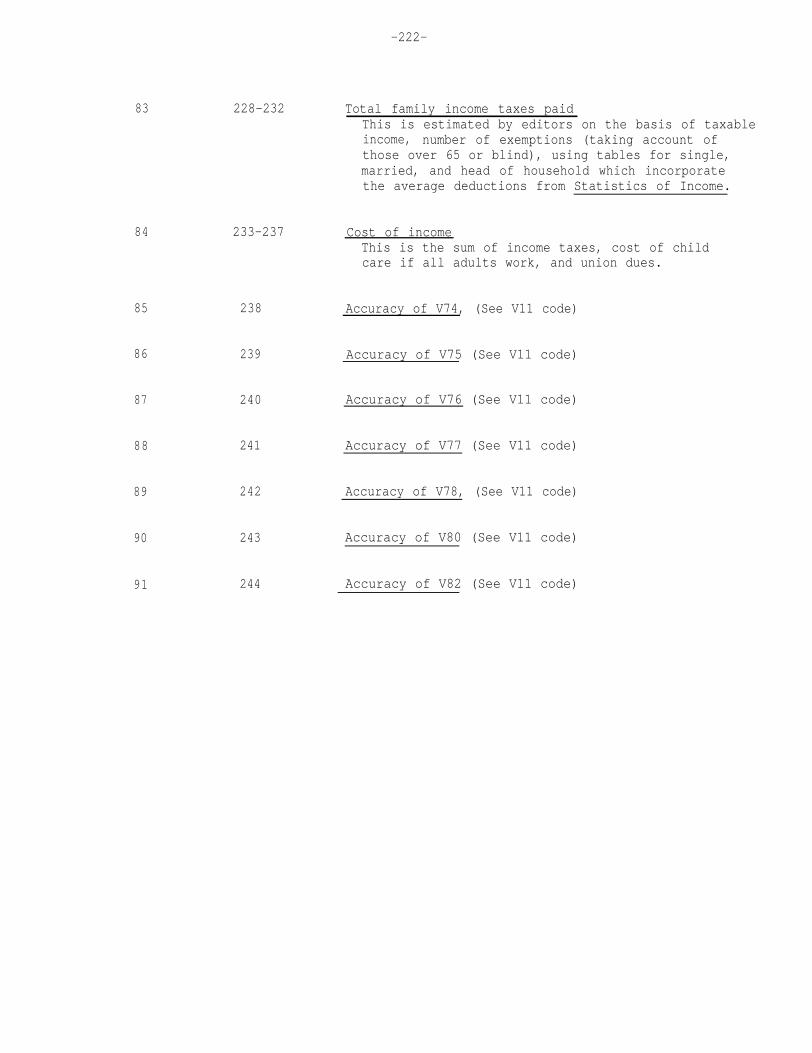
83 228-232
84 233-237
85 238 Accuracy of V74, (See V11 code)
86 239 Accuracy of V75 (See V11 code)
87 240 Accuracy of V76 (See V11 code)
88 241 Accuracy of V77 (See V11 code)
89 242 Accuracy of V78, (See V11 code)
90
91
243 Accuracy of V80 (See V11 code)
244 Accuracy of V82 (See V11 code)
-222-
Total family income taxes paidThis is estimated by editors on the basis of taxableincome, number of exemptions (taking account ofthose over 65 or blind), using tables for single,married, and head of household which incorporatethe average deductions from Statistics of Income.
Cost of incomeThis is the sum of income taxes, cost of childcare if all adults work, and union dues.

-223-
92 245-247 Survey Research Center identifying number of primary sampling unit (county or cluster of counties)
Hundreds Digit Units Digit Area Designated
1
Twelve Twelve Largest Largest 1 1
Metropolitan Metropolitan Areas Areas 3 3
3 3
0 0 I
0
1 or 2
3 or 4
1 or 2
3 or 4
1 or 2
3 or 4
1 or 2
3 or 4 Suburbs of large metro areas, West
Central cities in the Northeast of large metropolitan areas
Suburban areas of large metropolitan areas in the Northeast
Central cities of large metro areas, North Central
Suburbs of large metro areas, North Central
Central cities of large metro areas, South
Suburbs of large metro areas, South
Central cities of large metro areas, West
9
r 6, 7
5, 6, 9 Northeast, area is a Standard Metropolitan Statistical Area (contains a city of 50,000 or more)
9 7, 8 Northeast, not SMSA Rest of the Country 5, 6, 9 North are contains a central, SMSA
North West, West, South, South, not central, SMSA not SMSA a a SMSA SMSA no SMSA in area
This is coded even for the Census sample, but there is a separate Census Primary Sampling Unit designation (See Variable 132)

93
94
95
96
97
98
99 266
248-249 State where lives now
-224-
Alphabetically 01 = Alabama to 49 = Wyoming, (but50 = Alaska and 51 = Hawaii, though they do notappear)
This and the county code are from U.S. GeneralServices Administration Geographical Location Codes,(Office of Finance) October 1966, Washington, D.C.
250-252 County where lives now (See above)This is usable only with V93, counties beingnumbered starting with 001 within each state.
253 Local place (size of largest city)
34.4 1 Largest city in primary sampling units is500,000 or more
19.9 2 100,000 - 499,999
11.3 3 50,000 - 99,999
7.1 4 25,000 - 49,999 Codes 4, 5, 6 are thus PSU's10.5 5 10,000 - 24,999 not encompassing a standard
metropolitan statistical area.16.9 6 Less than 10,000
100.0
254 Detailed SRC place codefor SRC sample and in Census sample = familyidentification number (in case there were twofamilies in a dwelling)
255-263 Interviewers social security number
264-265 Interviewers interview number (she numbersinterviews she takes sequentially, starting with 01).
Date of interview
4.4 1 March 4-1710.1 2 March 18-3112.4 3 April 1-1416.9 4 April 15-2818.5 5 April 29- May 1219.9 6 May 13- May 2611.6 7 May 27- June 96.1 8 June 10 or later
99.9

-225-
Variable TapeNumber Location
100
101
102 271
103
104
Description and Details
267-269 5. Length of Interview
Code actual number of MINUTES (e.g. 1 hour and 10minutes = 70 minutes)
999 Not Ascertained
270 A2. When did you move into this (house/apartment)?
8.7 0 1943 or earlier13.7 1 1944 - 195311.7 2 1954 - 195818.8 3 1959 - 19635.2 4 19648.3 5 1965
10.3 6 196615.9 7 19677.2 8 19680.1 9 NA, D.K.
99.9
A3. How many rooms do you have here for your family(not counting bathrooms)?
1.42.59.8
20.624.3
1 One 21.5 6 Six2 Two 10.0 7 Seven3 Three 8.5 8 Eight or more4 Four 1.3 9 N.A., D.K.5 Five 0.0 0 shares roomNone,
99.9
272 A4. Do you (FU) own this home or pay rent or what?
61.5 1 Owns home (or trailer, fully or jointly)
34.7
3.8100.0
5 Rents (or shares rent)
8 Neither (owns nor rents)
273 A7, A10 .Do you have a mortgage on this property? DO youalso have a second mortgage?
33.6 1 First mortgage only
1.3 2 Two mortgages
26.4 5 No mortgage
38.699.9
0 Inap.

105
106
107
-226-
274 A14. (IF NEITHER) How is that?
0.2 10.6 21.2 3
1.3
0.1 50.1 6
0.0
0.296.3
100.0
4
7
80
Servant; housekeeperFarm laborerOther person for whom housing is part ofcompensation (janitors, gardeners, nurses, etc.)
Persons for whom housing is a gift, paid forby someone outside of FU, owned by relative,pays no rent or only taxes
Sold own home, but still living thereLiving in house which will inherit; estate inprocess
Living in temporary quarters (garage, shed,etc.) while home is under construction
OtherInap.
275 A15. Do you do some work in return for housing? (What?)
97.5 0 No, do no work or Inap.0.1 1 Do work worth about 20% of rental value
(l-2 hours a week)0.0 2 40%, "some" general maintenance of DU (3-4 hours
a week)0.1 3 60%, maintenance of l-3 other DU's, as well,
or substantial maintenance and repairs onown DU (5-6 hours a week)
0.0 4 80%, substantial maintenance and repairs ofother DU's as well or substantial renovationof own DU (7-8 hours a week)
0.5 5 Do work worth 100% of rental value (maintenanceof apartment building)
1.8 6 Housing is part of job - tenant farmer, domestic100.0
276 A19. Did you have any work done on the (house/apartment)during the last year, or do any work on it yourselves?
43.9 1 Yes
56.0 5 No
0.1 9 N.A.100.0

108 277 A20. What was done?
109
110
-227-
13.1
5.6
1 Simple repairs, painting (little skill)
2 Moderately complex things (carpeting, newfaucets, heater repair, installation ofready-made things) N.A. how complex
13.7 3 Fairly complex, one trade-skill (roofing,eaves trough, siding, carpentry)
5.3 4 Extensive repairs requiring several skills(electrical work, finish off the attic,alter room-divisions, masonry work.
5.6
0.5
5 Very complex additions or alterations requiringseveral difficult skills, or rare skills suchas plumbing, add a room.
9 N.A., D.K.
56.199.9
0 Inap.
278 A21-22. Did you or your family do any of it? (If yes) Whatdid you do?
12.6
3.7
1 Simple repairs, painting (little skill)
2 Moderately complex things (carpeting, newfaucets, heater repair, installation ofready-made things) N.A. how complex
8.4 3 Fairly complex, one trade-skill (roofing,eaves trough, siding, carpentry)
3.4 4 Extensive repairs requiring several skills(electrical work, finish off the attic,alter room-divisions, masonry work
3.1
0.4
68.5100.1
5 Very complex additions or alterations requiringseveral difficult skills, or rare skills suchas plumbing, add a room
9 N.A., D.K.
0 Inap., did not do any of it themselves, or didnot have anything done
279 A25-26. Do you still owe anything on it? (If yes) - Is itincluded in your mortgage?
0.8 1 Yes, owe, and yes included in mortgage
2.1 3 Yes, owe, but no included in mortgage (or N.A.whether included)
40.1 5 No, do not owe on additions and repairs
0.7 9 N.A., D.K.
56.4 0 Inap., did no additions or repairs100.1

-228-
111
112
113 282-283 B1. How many people live here altogether?
280 A28. Do you think you might move in the nextcouple of years?
23.2 1 Yes, will move
6.1 2 Probably will; "Yes, I might"
8.2 3 Pro-Con, Do not know, It all depends,maybe
2.4 4 Probably not, not likely
59.7 5 No, never
0.4 9 N.A.100.0
281 A29. Why might you move?
5.5 1 Purposive productive reasons, to takeanother job, to get nearer work
19.8 2 Purposive consumption reasons - more orless space, less rent, better neighborhood,want to own a home, better house
6.4 3 Ambiguous, cannot tell whether purposive orresponse to outside events; other
4.2 4 Response to outside events, involuntaryreasons (DU coming down, being evicted),armed services, etc.
1.4
62.7100.0
9 N.A.
0 Inap.
CODE ACTUAL NUMBER
02 2
10 10
99 N.A.

114 284 Household Composition (from Q's B1 and B2)
-229-
86.8
8.4
1 Head, wife and children
2 FU includes other related people - grandparents,grandchildren and in-laws
0.6 3 FU includes unrelated people
If anunrelated person is included in the extraearner's sequence, pp 22-23, then he has beenincluded in the family.
2.7 4 PRIMARY IN A DU INCLUDING SECONDARIESThe listing box includes someone labeled asRoomer, Boarder, Friend, Roommate, etc. Insuch cases the number of people in the FU issmaller than the number in the DU
1.1 5 SECONDARIESThe Roomer, Boarder, Friend, etc. from thehousehold whose head is coded 4
In the Census Sample, some secondaries will beincluded in the sample while the primariesare not. Also, there will be some personsfrom the Census Sample who have moved in withrelatives who are not in the sample. If theyare not pooling finances, they will be coded4 as 3 they were unrelated secondaries.
0.0 6 Sub families - final digit of ID% is 1, 2, 3, etc.These are related persons who are included inthe primary family FU but who had substantial(>$2000) income last year, didn't pool itwith the family, and are likely to move out.The sub-family interview applies to a sub-unit(a head's son and daughter-in-law, for instance)are included in the sub-family FU.
0.4100.0
7 Special case for Census movers
This person or family was in the Census Samplein spring 1967 but has since moved in withanother family which is not in the sample.They pool income and expenses, so all areincluded in this year's FU.
Usually in these cases the interview willhave been taken with the head of the samplefamily, and the non-sample member of the newenlarged FU will be included on pages 22 and 23.

-230-
115
116
117 288-289 B2. Age of head of Family Unit
118
119
285-286
287
22.562.710.93.10.60.10.00.00.0
99.9
Number of people (children plus adults) in thisFAMILY UNIT (living here) (from listing box)
CODE ACTUAL NUMBER
02 2
10 10
99 N.A.
Number of Adults in this Family Unit (fromlisting box) (Adults are persons 18 years andolder or who are married)
OneTWOThreeFourFiveSixSevenEight or moreN.A.
Up to 96 Actual age in years97 97 years or older
290-291 B2. Age of Wife of Head
Up to 96 Actual age in years97 97 years or older
99 N.A.00 Head of FU is not married
292 B2. Sex of Head of Family Unit
79.0 1 Male21.0 2 Female
0.0 9 N.A.100.0

-231-
120
121
122
123 296
293 How old are they?
Age of YOUNGEST CHILD UNDER 18 IN FU (children at homeonly)
10.0 14.8 24.4 33.8 43.3 57.6 69.7 77.3 80.0 949.1 0
100.0
Less than two years2 years up to 2.99 years3 years up to 3.99 years4 years up to 4.99 years5 years up to 5.99 years6 years up to 8.99 years9 years up to 13.99 years14 years up to 18 yearsN.A.No children under 18 in FU
294 B3. Is he/she in school? (Code number of children inFU in school and living at home) (exclude in-laws)
59.0 0 None, no 2.0 5 Five13.1 1 One 0.6 6 Six12.3 2 Two 0.4 7 Seven8.0 3 Three 0.3 8 Eight4.0 4 Four 0.2 9 Nine
99.9
295 B6-7. Number of children of Head under 25 not livingwith parents
81.3 0 None12.1 1 One4.8 2 Two1.3 3 Three0.3 4 Four0.1 5 Five0.0 6 Six0.0 7 Seven0.0 8 Eight or more0.1 9 Not Ascertained
100.0
B9.Number of children of Head under 25 not living athome, but in institutions (army, jail, boarding school)
92.56.21.10.10.00.00.00.00.00.1
100.0
0 None1 One2 Two3 Three4 Four5 Five6 Six7 Seven8 Eight or more9 Not Ascertained

124
125
126
127
128
129
130
297
298
299
300
301
302
303
-232-
Required number of rooms for a family like this
Education of childrenNumber of children who completed less than 12 grades
Number of children who completed exactly twelve grades
Number of children who completed more than 12 grades
B11, 12. Has anyone moved into your household in the last
6.9 1 Yes, one person0.8 2 Yes, two persons0.2 3 Yes, three people0.2 4 Yes, four or more people
91.4 5 No
0.4 9 N.A.99.9
Bl2. If Yes, who moved in?
0.6 1 Head of family0.3 2 Wife3.8 3 Son or daughter under 18 (include babies
born or adopted)
0.3 4 Brother or sister0.1 5 Father or mother0.9 6 Grandchild, any child relative1.5 7 Other adult relatives, in-laws0.9 8 Unrelated person (roomer, boarder, etc.)0.2 9 N.A.
91.3 0 Inap., coded 5 or 9 in Column 6799.9
Bl3. Has anyone moved out in the last year?
8.6 1 Yes, one person1.2 2 Yes, two persons0.3 3 Yes, three people0.3 4 Yes, four or more people
88.9 5 No
0.1 7 Yes, N.A. how many0.6
100.0 9 N.A.

-233-
131 304 B14. (If yes) Who moved out? (Relation to head and age)
132 305-307
133 308-311
134 312135 313-314
136
1.80.31.90.10.30.44.5
1.10.1
89.5
Head (previous head)WifeSon or daughter (under 18)Head's brother or sisterHead's father or motherGrandchild, any child relativeOther adult relatives (including children 18or older), in-laws
Unrelated person (roomer, boarder)N.A.Inap.
Census designation of primary sampling area (whereoriginally sampled)
(Zero for SRC sample)
Census serial number (household number)
(Zero for SRC sample)
Census segment number (designation of an areawithin the primary sampling area)
(Zero for SRC sample)
315 Bl5-17. (If children in school) Have you (or your wife)ever attended any meetings of a parent-teacher'sorganization? When was the last time?
12.5 1 Yes, less than three months ago10.3 2 Yes, 3-12 months ago5.5 3 Yes, but more than a year ago; several years ago0.8 4 Yes, but cannot remember when10.9 5 No (to B16): Cases where children live outside
FU
1.158.9
100.0
9 N.A., no P.T.A.0 Inap. (no children in school)

137 316 B18-19. How much education do you think your children
138
139
-234-
12.4
10.3
12.2
will have when they stop going to school?What do you really think will happen?
1 All will go to college (definite), theywill get a college education
2 Some will go to college, or will get somecollege, hope will complete college
3 All will finish high school, high schoolat least, 12 grades, hope they will goto college
2.5
0.4
4 Some high school, some will finish highschool, may finish high school
5 One or more will not finish high school,or probably not, not much, even so they canread and write
1.3 6 "Hope they finish high school"
1.0 7 Don't know, gives only desires but not
1.5
58.4100.0
codable in 6
9 N.A.
0 Inap., no children in school
317-318 B20. Have you (HEAD) ever had any children?B21. When was your (HEAD'S) first child born?
12 First child born when head was 12
17 First child born when head was 1718 etc.
99 Don't know, N.A.00 Inap., Head never had any children
319 C1. Altogether how many people are there in yourfamily here who can drive? (Include drivers in
11.9 0 None sub-family)
32.3 1 One44.0 2 Two8.5 3 Three2.5 4 Four0.5 5 Five0.1 6 Six0.0 7 Seven0.0 8 Eight or more0.1
100.09 No; Ascertained

-235-
140 320
141
142
C2. Do you or anyone else in the family here own a car?C3. (If no) Does not having a car cause you (Family)
any difficulties?
80.4 1 Yes, own a car (Yes to C2)
8.4
10.1
0.9
0.2100.0
2 No, and it causes difficulties (Yes to Q. C3)
5 No, and it causes no difficulties (No to Q. C3)
7 No car, N.A. whether causes any difficulties
9 N.A.
321 C4. What are they?
3.8 1 Can't get around; have to depend on others;no way to have fun, etc.
2.5 2 Makes expenses higher (taxis, have to buy inmore expensive stores), have to pay morerent, inconvience in regards to necessities,i.e., getting groceries
0.9 3 Can't get to doctor
1.0 4 Can't get to job; difficult to get to work;cannot get to better job
1.3 9 N.A.
90.4 0 Inap., family owns a car (Coded 1 in Column 16)99.9
322 C5. Is there public transportation within walkingdistance that is adequate for you?
11.5 1 Yes
6.1 5 No
0.0 8 D.K.1.7 9 N.A.
80.7 0 Inap., family owns a car100.0

143
-236-
323 C6. How many cars do you and your family living here own?
144
145
146
49.426.83.60.50.10.00.00.00.019.6
100.0
(Include trucks, leased cars, in the count if theyare used as family transportation, i.e., left in byEditor.)
1 One2 TWO3 Three4 Four5 Five6 Six7 Seven8 Eight or more9 Not Ascertained0 Inap., family does not own a car
324-325 C7. Year model of newest car
CODE LAST 2 DIGITS OF YEAR FOR NEWEST CAR
55 1955
68 1968
99 N.A.
00 Inap., family does not own a car
326-329 Value of all cars owned (Wholesale, Midwest, NADA,Middle Range V-8)
0837 $8373500 $35009998 $9998 or more9999 Not Ascertained0000 Inap., family does not own a car; or car
leased or owned by business
330 C9. Is it in good, fair, or poor condition?- -(Code condition of car in BEST condition)
65.0 1 Good, excellent, very good
12.2 3 Fair
2.7 5 Poor
0.5 9 Not Ascertained
19.6 0 Inap., family does not own a car100.0

-237-
147
148 332
149
150
331 C9. Is it in good, fair or poor condition?
CODE CONDITION OF CAR IN WORST CONDITION
53.3
20.3
6.1
0.7
19.6100.0
1 GoodIf only one, can code sameas V146.
3 Fair
5 Poor
9 N.A.
0 Inap., family does not own a car
C10. Do you owe any money on it?
(Code whether owes on any car)
28.9
51.0
0.4
19.699.9
1 Yes (Owes on one or more cars)
5 No
9 N.A.
0 Inap., family does not own a car
333 C11. Is that car insured?C15. Do they include insurance?
CHECK FOR ALL CARS
69.5 1 All cars insured
2.8 3 Some insured, but one or more uninsured;some insured but N.A. whether all insured
0.1 4 N.A. whether first car insured; second caruninsured, but if newer car is uninsured,then assume that all cars are uninsured
5.9 5 No insured car (all cars uninsured)
2.0 9 Not Ascertained
19.699.9
0 Inap., family does not own a car
334 C14. How many payments do you have left?(LARGEST NUMBER OF PAYMENTS)
4.56.65.24.92.72.20.20.52.5
70.7100.0
BRACKET CODE:
1 l-62 7-123 13-184 19-245 25-306 31-367 37 or more8 Has debt, but no regular payments; lump sum deal9 Not Ascertained0 Inap., no car debt

-238-
151
152 336
153
154
From C14.335 How many payments do you have left?
25.1 1 One set of payments only (May be on 1 or morecars)
3.0 2 Is making more than one set of payments (Maybe on 2 or more cars)
1.2 9 N.A.
70.7100.0
0 Inap., no car debt
C17. Does the car you (HEAD) drive most of the timehave seat belts?
53.2 1 Yes
26.2 5 No
1.0 9 N.A.19.6 0 Inap., no car
100.0
337 C18. Do you have them fastened all the time while youare driving? part of the time, or practicallynone of the time?
10.9 1 Fastened all the time
20.7 3 Fastened part of the time
21.5 5 Fastened practically none of the time
0.2 9 N.A. how often fastened
46.8 0 Inap., does not drive, does not own car,100.1 car has no seat belts
338 C19. Do you (or your family) do any of your own repairwork on your car(s)?
32.2 1 Yes
48.1 5 No
0.2 9 N.A.
19.6 0 Inap., family does not have car100.1

-239-
155
156
157
339 C2O. (If yes) What kinds of things have you done onyour car(s) in the last year?
PRIORITY CODE - highest number
1.7
5.9
5 Yes, complex repairs that usually take askilled mechanic (rebuilt engine or trans-mission), complete overhaul
4 Yes, extensive repairs, taking much skill(rings, valves, bearings, install factoryrebuilt engine, king pins, ball joints,transmission work, motor work, or "I do anythingthat needs doing"
6.9
11.3
3 Yes, some skill required, (brakes, wheel bear-ings, exhaust system, starter)
2 Yes, some skill (tune-up, points, plugs, adjustcarburetor, fuel pump)
3.9 1 Yes, little or no skill, mostly maintenance(oil change, greasing, tire switching) (touch-up painting)
1.4 9 N.A. whether or kind of repairs
1.2 7 Yes, does work, but did none in 1967
67.7 0 Inap., family does not have car, does no100.0 repair work
340 C21. In the last year do you think you saved more than$50 that way?
C22. (If yes) About how much do you think you saved?
10.5 1 Saved, but did not save $50, "No" to Q. C21
14.4 2 Saved $50 - 199
4.0 3 Saved $200 - 499
0.6 4 Saved $500 or more
0.9 7 N.A. how much
0.9 9 N.A.
68.8 0 Inap., family does not have car; did not do100.1 any of own repair work
341 C23. About how much time did that take you altogether?
14.6 1 Less than 50 hours (1 - 6 days3.2 2 50- 199 hours -
(5 -4 weeks, 7 - 25 days)
0.2 3 200 - 499 hours 12 weeks, 26 - 62 days)0.1 4 500 hours or more (13+ weeks, 63+ days)
3.3 9 N.A.
78.6 0 Inap., did not save $50; family has no car100.0

-240-
158
159
160
342 D3.
D4.D5.
71.2
6.4
10.6
9.1
1.2
1.1
0.4100.0
343 D6.
Are you (HEAD) covered by some hospital ormedical insurance like Blue Cross?Does this insurance cover the entire family?Can you get free medical care in any way such asfrom medicare, medicaid, or as a veteran?
PRIORITY CODE
1 Whole family is covered by insurance (Yes toA. D3 and D4)
2 Head is covered, but not entire family (Yesto D3 and No or N.A. to Q. D4)
3 Head not insured, but can get free medicalcare (No to Q. D3 and Yes to Q. D5)
4 Neither; Head is not insured, nor eligiblefor free medical care (No to Q. D3 and Noto Q. D5)
5 Head not insured but family can get freemedical care
7 Yes, N.A. what kind or who covered
9 Not Ascertained to Q. D3
Do your FAMILY have any savings, such as checkingor savings accounts, or government bonds?
75.6
24.0
0.399.9
1 Yes
5 No
9 N.A.
344 D7. Would they amount to as much as two months incomeor more?
161
53.2
21.8
0.624.4
100.0
1 Yes
5 No
9 N.A.0 Inap., does not have any savings
345 D8.was there a time in the last five years when you hadas much as two months' income saved up?
18.5 1 Yes
25.9 5 No
2.4 9 N.A.
53.2 0 Inap., has two months' income or more in100.0 savings now

-241-
162 346
163
164
165
E1. Now I have a few questions about food and clothing.About how many times a week do you (FAMILY) eat outat restaurants or drive-ins?
24.623.05.03.41.7
1.640.7
100.0
1 Less than once; sometimes2 1 or 2 times3 3 or 4 times4 5- 9 times5 10 times or more
9 N.A.0 Practically never eat out, never, very seldom
347 E2. About how much do (FAMILY) spend in a week eatingout, including lunches at work (or at school)?
27.9 0 Nothing, do not eat out21.3 1 Less than $521.1 2 $ 5 - 919.0 3 $10 - 198.6 4 $20 or more
2.2 9 N.A.100.1
348 E3. Do you have any of your milk delivered to the door?
21.3 1 Yes
78.6 5 No, or do not drink milk
0.1 9 N.A.100.0
349 E4. About how much do you (FAMILY) spend on that milkin a week or month?
8.7 1 (Less than $3 a week) (Less than $12 a month)5.8 2 $3 - 4 a week $12 - 17 a month2.6 3 $5 a week $18 - 24 a month2.0 4 $6- 7 a week $25 - 32 a month0.8 5 $8- 9 a week $33 - 41 a month0.9 6 $10 - 13 a week $42 - 59 a month0.2 7 $14 - 19 a week $60 - 85 a month0.1 8 $20 a week or more $86 or more0.4 9 N.A.
78.6100.1
0 Inap., no milk delivered

166
167 351
168
169 353
41.01.1
10.914.411.9
Do not smoke anythingLess than 3 a day3 - 17 a day18 - 22 a day (a pack a day)23 - 35 a day (1 1/2 packs
a day)13.4 5 2 - 3 packs a day
2.0 6 4 or more packs a day
4.80.6
100.1
8 Smokes cigars, pipe, etc.9 N.A. how many cigarettes
350
352
-242-
E5. About how much do you spend a week on all the(other) food you use at home?
0.9 0 Nothing1.3 1 Less than $5 a week5.6 2 $5- 9 a week
23.0 3 $10 - 19 a week28.9 4 $20 - 29 a week20.1 5 $30- 39 a week10.0 6 $40 - 49 a week8.1 7 $50 or more a week
2.2 9 N.A.100.1
E6. How about alcoholic beverages - how much do you(FAMILY) spend on that in an average week?
59.1 0 Nothing27.3 1 Less than $58.7 2 $ 5 - 93.4 3 $10 - 190.9 4 $20 or more
0.6 9 N.A.99.9
E7. Is that included in the food bill?
4.8 1 Yes
35.3 5 No
0.7 9 N.A.
59.1 0 Inap., spends nothing on alcoholic beverages99.9
E8. Do any of you smoke? (E9 if yes) About how manycigarettes do you (FAMILY) smoke in a day or week?
(1 pack = 20 cigarettes)(1 carton = 10 packs)
Per Day Per Week
Less than a pack a week1 - 6 packs a week7 packs a week8 - 14 packs a week (a carton a week)
15 - 24 packs a week (two cartons aweek)
25 or more packs a week (three ormore cartons a week)Roll own cigarettes

170
171
172 356 E13. Anything else?
173 357 (The two mentions combined into one variable)
174
-243-
354 E10. Is that included in the food bill?
17.4
37.3
4.4
41.0100.1
1 Yes
5 No
9 N.A.
0 Inap., family does not smoke
E11. Are there any special ways that you try to keep thefood bill down? Code 2 mentions with largest code
numbers.
355 E12. What special ways do you have for keeping the foodbill down?
4
5
67
8
90
Don't eat much; try to eat lessTry to economize, buy in large quantities,buy bulk; watch for ads in paper, watch forspecials, bargains, sales, shop around thestores, buy from farmer
Have an "in" - army PX, eat cheap at restaurantwhere work; get discount on groceries, buyco-op
Coupons cut from papers; use coupons; foodstamps, welfare food
Eat cheaper foods; e.g., potatoes, hamburgers,chicken, buy no luxuries, eat left-overs,don't waste what we buy
Do own baking, canning, or freezingRaise or grow food; garden, have own milk,raise a calf, pigs, or chickens, have fruittrees. Also do hunting and fishing ifindication of substantial saving
Yes, gifts of food, food from home, etc.PRIORITY BELOW 1
N.A.No to E11 or no second mention to E12
359 E14. How much of the time does the family sit down andeat the main meal of the day together?
17.4 0 Inap., one-person family
5.1 1 Once a week or less (Only on Sunday), never,hardly ever
6.1 2 Part of the time, 2-3 days a week
5.0 3 Most of the time, 4-6 days a week
62.1 4 Every day, nearly every day, all the time;100% of time; once a day
4.4 9 N.A.100.1

-244-
175176177
178
360 E15. Do you have any special ways of saving on clothing361 costs?
362-363If yes) What are they?E16.)
1 Just do not buy much, keep it clean2 Yes, buy economically, shop in larger cities,
shop for sales or bargains, seasonal shoppingat end of season
3 Yes,buy
4 Yes,5 Yes,6 Yes,
HIGHEST PRIORITY- 7 Yes,all
PRIORITY BELOW l- 8 Yes,
shop at discount stores, hand-me-downs;used clothingdiscount on clothing because of employmentmendingsewing, alterations, makes some clothesmake a lot of own clothes, "Wife sews forour daughters," etc.gifts of clothing, clothes sewn by someone
else (outside FU) NOTE: This is not thehighest priority code. Place lower than 1.
9 N.A.0 No, or no second mention
364 E17. Did you (FAMILY) save more than $50 on your clothingbill this way last year?
E18. (If yes) About how much did you save this way inthe last year?
15.1 1 Some ways, but did not save more than $50
21.7 2 Saved $51 - 199
5.2 3 Saved $200 - 499
0.7 4 Saved $500 or more
4.8 7 N.A. how much
2.7 9 N.A., D.K. whether
49.9100.1
0 Inap., no special ways of saving (E15 = 0)
SECTION N (By Observation)
179 365 N1. Who was present during interview?
35.1 1 R only29.8 2 R and spouse16.9 3 R and someone else (not spouse)18.2 4 R and spouse and someone else (include children,
count others even if part-time)
0.1 9 N.A., D.K.100.1

-245-
180 366
181
182
183
N2. Who was respondent (relation to Head)
93.2 10.7 20.3 3
5.4 80.4 9
100.0
367 N3. Race
86.6 110.6 21.8 3
0.7 7
0.3 9100.0
368 N4.
29.928.517.710.34.73.11.91.92.0
100.0
HeadWife, responding for selfOther
Wife responding for husbandN.A.
WhiteNegroPuerto Rican & Mexican
Other (including Oriental, Philippino)
N.A.
Number of Calls
1 One2 Two3 Three4 Four5 Five6 Six7 Seven8 Eight or more9 N.A.
369 N5. How clean was the interior of the DU?
40.7 1 Very clean
33.6 2 Clean
13.7 3 so-so
4.8 4 Not very clean
2.7 5 Dirty
9 N.A.
184 370 N6. How much reading material was visible in the DU?
12.7
52.6
28.0
6.7100.0
1 A lot
3 Some
5 None
9 N.A., D.K.

185 371 N7. About how many times did you have to repeat
186
187 373 N9.
188 374-376 N1O.
189
-246-
43.826.317.86.31.23.5
1.1100.0
372 N8.
67.118.58.52.80.41.4
1.299.9
6.2
3.7
88.4
1.8100.1
377 N11.
24.1
25.3
16.1
9.0
24.9
0.6100.0
a question?
0 Never1 Once or twice, hardly ever, seldom2 3-5 times3 6-9 times, several times, a fair amount4 10-19 times5 20 times or more, many times, a lot
9 N.A.
About how many times did you have to askR to repeat a reply?
0 Never1 Once or twice, hardly ever, seldom2 3-5 times3 6-8 times, frequently, several times4 10-19 times5 20 times or more, many times
9 N.A.
Does R have any obvious disfigurements orhabits that could make it difficult for him topet a job?
1 Yes
3 Yes, qualified, minor ones
5 No, old age
9 N.A.
What is the name of the nearest city of 50,000population or more?
(Not available, to insure confidentialityof records)
How far is this DU from the center of that city?
1 Less than 5 miles
2 5- 14.9 miles
3 15- 29.9 miles
4 30- 49.9 miles
5 50 miles or more
9 N.A.

190
191
192
193
-247-
378 N12. Type of Structure in which Family Lives
3.267.53.56.23.34.06.0
3.5
1.01.8
100.0
7
8 Apartment in a partly commercial structure9 Other, or N.A.
TrailerDetached single family house2-family house, 2 units side by side2-family house, 2 units one above the otherDetached 3-4 family houseRow house (3 or more units in an attached row)Apartment house (5 or more units, 3 storiesor less)
Apartment house (5 or more units, 4 storiesor more)
379 N13. Neighborhood
CODE THE LOWEST NUMBER OF ANY BOX CHECKED
380 N13. Neighborhood
CODE THE HIGHEST NUMBER OF ANY BOX CHECKED
8.1 0 Vacant land2.2 1 Trailer
56.8 2 Detached single-family house10.3 3 2-family house, 2 units side by side
2-family house, 2 units one above the other
6.3 4 Detached 3-4 family houseRow house - 3 or more units in an attached row
5.4 5 Apartment house (5 or more units, 3 stories or less)3.1 6 Apartment house (5 or more units, 4 stories or more)
1.7 7 Apartment in a partly commercial structure3.0 8 Wholly commercial or industrial structure
3.1100.0
9 Other, or N.A.
N14. Is this DU located in a public housing project?
2.1 1 Yes
93.5 5 No
4.4 9 N.A.100.0

194 382 Thumbnail sketch evidence on housing
195 383-384
1.0
1.0
0.3
3.9
88.6
5.1
-248-
PRIORITY CODE the lowest number applicable
1 No running water, or no water inside DU
2 Outside toilet (privy)
3 Other structural defects (no hot water,no heat)
4 Poor maintenance (unpainted, broken windows, etc.)
5 No evidence of any of the above
9 Evidence, but N.A. what degree
Word-to-picture Score (Two Digits)
00 Zero
01 One
. . . etc.
98 Test not given (no number at top of page)
99 (Test not taken), N.A.
For half the Census sample, in half the PSU's, respondents weregiven a set of four pictures and fourteen words were read,asking the respondent to indicate which was the best picturefor that word. The words and pictures came from the AmmonsQuick Test,* but the procedure was so altered that the resultshould not be considered an application of that test. Actually,as graded in tests on school children, we took every third wordup through age 12, so that many people would be expected to getthem all right, and only the bottom fringe would be distinguished.(This reduces the amount of failure experience and field difficulties,we feel.) The simplest words were names of objects actually inone picture, and as the words get more difficult, their connectionto a picture also becomes more indirect.
*Martha J. Mednick, "The Relationship of the Ammons Quick Test of Intelligenceto Other Ability Measures," Psychological Reports, 72, 1965, 48-59.

-249-
196 385
197
74.2
2.2
14.1
7.1
2.3
0.1
100.0
386
12.7
7.4
4.5
11.6
16.0
13.9
12.0
3.0
2.5
16.4100.0
F1* Are you working now, unemployed, retired,or what?
1 Working now, or laid off only temporarily
2 Unemployed
3 Retired, permanently disabled
4 Housewife
5 Student
6 Other
F2 What is your main occupation?
G1 What do you do when you work? (What is youroccupation?)
H2 What kind of work did you do when you worked?(What was your occupation?)
1 Professional, technical and kindred workers
2 Managers, officials and proprietors
3 Self-employed businessmen
4 Clerical and sales workers
5 Craftsmen, foremen, and kindred workers
6 Operatives and kindred workers
7 Laborers and service workers, farm laborers
8 Farmers and farm managers
9 Miscellaneous (armed services, protectiveworkers, unemployed last year but lookingfor work, N.A.)
0 Not in labor force at all in 1967, retired(includes students and housewives who did nowork last year and are not working). Per-manently disabled or not in labor force anddid no work last year.
*F questions were asked only of the Employed, G questions only of the unemployed,and H questions only of the Retired. If no question is listed for that group,its members will be coded "0" for that code. Thus, if no F question is given,all employed will be coded "0" (Inap.)

-250-
Variable TapeNumber Location
198 387
61.7
2.3
10.1
0.2
25.8100.1
199 388
26.6
18.3
3.7
9.6
4.6
3.3
33.899.9
200 389
6.4
8.0
11.1
14.2
14.6
8.6
0.8
36.299.9
Content
F4. Do you work for someone else, yourself or what?
1. Someone else
2. Both someone else and self
3. Self only
9. N.A.
0. Inap.
F5. How important is it for you to make your owndecisions on a job?
629. How important is it for you to make your owndecisions on a job?
1. Very important; of great importance; I don't wantanyone to tell me what to do; I make all thedecisions I can
2. Important; quite important; pretty important; I'mon my own
3. Somewhat important; 50% important; fairly important
4. Not very important; not too important; not thatimportant; don't mind working under someone else
5. Not important at all; just do what I'm told; Idon't like to make decisions
9. N.A., D.K.
0. Inap.
F6. How long have you been working for your presentemployer?
1. Less than half a year; 0-6 months
2. 1 year; 7-18 months
3. 2-3 years; 19 months-42 months
4. 4 through 9 years
5. 10 through 19 years
6. 20 years or more
9. N.A.
0. Inap., (retired, housewife, student,self-employed)

-251-
Variable TapeNumber Location
201 390
202
4.1 1.
0.6
4.8
20.4
4.1
2.
3.
4.
5.
1.5 6.
4.2 7.
1.31.8
57.199.9
8.9.
0.
391 F8. Would you say your present job is a better jobthan the one you had before?
27.7
F9. (If not clear) Does it pay more than the previous job?
1. "Yes" to F8, or reply to F8 unclear, but says yes("pays more") to F9
2.6
5.5
1.6
3. "Pro-con," better in some ways, worse in others
5. "No, same," or "No, worse"
9. N.A.
0. Inap., first job62.7100.1
Content
F7. What happened to the job you had before - did thecompany fold, were you laid off, or what?
G5. Did the company you worked for fold, were you laid off,or what?
Company folded, changed hands, moved out of town;employer died, went out of business
Strike or lockout
Laid off; fired
Quit or resigned, retired, pregnant
First full time or permanent job I ever had; wasn'tworking before this
Was self-employed before
Other; drafted (in service) and did not come backto same job after service; just wanted a change in
job; needed more money; was in service, any mentionof service, seasonal work, job endedJob stopped; work was seasonalN.A.
Inap.

-252-
Variable TapeNumber Location
203 392
4.1
12.8
8.6
5.3
3.4
2.9
1.6
0.8
2.1
58.5100.1
204 393
205 384
21.9
53.5
0.9
23.699.9
6.9
42.7
4.8
45.6 0. Inap., (retired, housewife, student, have moved100.0 from community)
Content
F10. How many different employers have you had in thelast ten years?
G6. How many different employers have you had in thelast ten years?
1. 1
2. 2
3. 3
4. 4
5. 5
6. 6-9
7. 10-19
8. 20 or more
9. N.A.
0. Inap.
F11. Have you ever moved out of a community where youwere living in order to take a job somewhere else?
G7. Have you ever moved out of a community where youwere living in order to take a job somewhere else?
1. Yes
5. No
9. N.A.
0. Inap.
F12. Have you ever turned down a job because you didnot want to move?
G8. Have you ever turned down a job because you didnot want to move?
1. Yes
5. No
9. N.A.

-253-
Variable TapeNumber Location
206 395
207 396
1.1
0.5
0.5
0.3
97.7100.1
2.7
8.4
4.4
35.3
15.3
5.8
0.9
3.5
23.7100.0
Content
G9. Do you think you will be able to find steady workaround here, or will you have to move?
1.
3.
5.
9.
0.
Will find steady work
Depends, might or might not
Will not, will have to move
N.A.
Inap. (employed)
F13. How good would a job have to be before you wouldbe willing to move somewhere else in order to get it?
G10. How good would a job have to be before you wouldbe willing to move somewhere else in order to get it?
1.
2.
3.
4.
5.
6.
7.
9.
0.
IF R REPLIES IN TERMS OF SPECIFIC DOLLAR AMOUNTDIFFERENCES, TRANSLATE INTO PERCENTAGE DIFFERENCEOF CURRENT WAGE RATE.
Would move to get a job; if same or better salary,would move; would like to move to take another job;wouldn't mind moving
Fairly good; would have to have good pay; would haveto be somewhat better paying; would have to havemoderate pay increase; pay increase of l-10% of whatnow getting
Like the situation I have; pro-con responses; payincrease of 11-24% of current salary
Very good; whole lot better; much better paying;don't want to move; considerably better financially;pay increase of 25% or more; I plan to stay here
Would never consider moving; too old to considermoving; could never find a better situation anywhereelse; couldn't move-my business is here; couldn'tbe good enough to make me move
R answers only in terms of qualities of job, i.e.,warm climate, depends on union considerations, andcannot be coded in l-5 above
Other
N.A.
Inap.

-254-
Variable TapeNumber Location
208 397 F14. Do you plan to try for a new job or line of work
11.6
61.6
0.9
26.0100.1
209 398
7.6
or will you keep the job you have now?
1. Try for a new job, or line of work
5. Keep job have now
9. N.A.
0. Inap.
F15. What kind of job do you have in mind?
0.6
1.7
Mentions some explicit job, e.g., machinist, computerprogrammer, secretarial work
Self-employment with mention of explicit type ofwork or broad type of work mentioned
Mentions broad type of work; "factory work"
0.1 Self-employment with no mention of any explicittype of work
0.7
0.7
88.499.8
1.
2.
3.
4.
5.
9.
0.
Does not mention any particular kind of work;mentions only company
N.A.
Inap.
210 399-401 F16. How much might you earn?
Content
CODE DOLLARS AND CENTS PER HOUR CODE MIDPOINT IFGIVES RANGE
300. $3.00 per hour
998. $9.98 or more per hour
999. N.A.
000. Inap., coded 5 in Col. 23 (keep job now have)

-255-
Variable TapeNumber Location
211 402
2.2
2.1
0.95.7
0.7
88.4100.0
212 403
1.4
2.5
3.0
4.1
0.5
0.2
88.4100.1
Content
F17. Would you have to get additional training toqualify?
1. Yes, but does not mention what
2. Yes, and mentions the explicit training needed;or that he is getting training
3. Maybe, might help5. No
9. N.A.
0. Inap., (keep job now have)
F18, F19. Have you been doing anything in particularabout it? What have you done?
1.
2.
3.
5.
7.
9.
0.
Yes, to F18, but no response or only vagueresponse; have a few feelers out; been lookinginto it
Yes to F18; mentions looking for a job; going toemployment office , going to union office
Yes to F18; mentions going to school, specialtraining program; members studying for exam
No to F18
Yes, other
N.A.
Inap., (keep job now have)

Variable TapeNumber Location
213 404
7.1
11.5
7.6
29.7
16.1
4.4
23.7100.1
214 405
0.1
2.2
9.0
1.2
61.8
0.20.01.7
23.9100.1
-256-
Content
F20. How much do you like a job where you are toldexactly what to do?
G16. How much do you like a job where you are toldexactly what to do?
1.
2.
3.
4.
5.
9.
0.
I like it
I don't mind it too much; don't mind followinginstructions; like it if done the right way; O.K.
I don't mind it sometimes; not too fond of it;like it sometimes; fair; depends on the job (situation);not too fond of it; I can take it; "Tell me what todo and then leave me alone."
Don't like it; don't think I'd like it; not (very)much; prefer a job where I'm on my own; wouldn'tlike it; like to be on my own really.
I don't like it at all; hate it; don't like it abit; that's why I'm in this kind of business; orthat’s why I own a business
N.A.
Inap.
F21, F22. Would you have any trouble getting anotherjob if you wanted one? Why is that?
G11, G12. Is there anything in particular that mightmake it difficult for you to get another job?
1. Yes, mentions arrest or prison record; wagesgarnished too frequently
2. Yes, lack training in something else; only limitededucation
3. Yes, mentions age; physical or mental disability
4. Yes, gives only vague reasons, other reasons
5. No
6. Foreign-language difficulty7. Yes, but N.A. what9. N.A.
0. Inap.

-257-
Variable TapeNumber Location Content
215 406
216 407
5.1
4.6
6.2
7.6
51.70.10.8
23.799.8
4.9
4.7
8.1
1.4
77.7
2.4
0.9100.1
F23, F24. Have you ever had an illness or accidentthat laid you up for a month or more?When was that?
G17, G18. Have you ever had an illness or accidentthat laid you up for a month or more?(If yes) When was that?
1. Yes, a year ago; within the last year or morerecently; 1967 or 1968
2. Yes, 2-3 years ago; 1965 or 1966
3. Yes, 4-9 years ago; 1959-1964
4. Yes, 10 or more years ago; before 1959; 1958 orearlier
5. No7. Yes, N.A. when9. N.A., D.K.
0. Inap.
F25. Do you have a physical or nervous condition thatlimits the type of work or the amount of work youcan do? (If Yes - F26. How much does it limityour work?)
G19, G20. Do you have a physical or nervous conditionthat limits the type of work or the amount ofwork you can do? (If Yes - How much does itlimit your work?
1. Yes, complete limitation; can't work at all
2. Yes, severe limitation on work
3. Yes, some limitation on work (must rest, mentionspart-time work, occasional limit on work, can'tlift heavy objects, reports periods of pain,sickness, etc.)
4. Yes, but no limitation on work
5. No.
7. Yes, N.A. limitation on work
9. N.A.

-258-
Variable TapeNumber Location
217 408
3.4
3.6
5.0
1.8
60.2
0.8
1.2
24.0100.0
218 409
0.5
1.6
4.2
1.4
66.4
1.0
1.0
23.9100.0
Content
F27. Are there times when you are late getting to work?(If yes, F28) About how often does that happen?
621, G22. When you were working, were there times whenyou were late getting to work? (If yes) Abouthow often did that happen?
1.
2.
3.
4.
5.
8.
9.
0.
Yes, frequently; once a week or more often
Yes, fairly often; l-3 times a month
Yes, once in a while; a few times a year, not veryoften
Yes, rarely; once a year or less
No; never
Yes, N.A. how often
N.A.
Inap.
F29. Are there times when you don't go to work at all,even though you are not sick?(If yes - F30) How often does that happen?
623, G24. Were there times when you didn't get to workat all, even though you were not sick? (ifyes) How often did that happen?
1. Yes, frequently; once a week or more often
2. Yes, fairly often; l-3 times a month
3. Yes, once in a while; a few times a year, not veryoften
4. Yes, rarely; once a year or less
5. No
8. Yes, but N.A. how often
9. N.A.
0. Inap.

-259-
Variable TapeNumber Location
219 410
220 411
3.6
1.7
1.9
3.1
62.4
1.6
0.7
0.2
0.8
24.0100.0
87.2
2.3
1.7
2.6
4.7
1.5100.0
Content
F31. Have you ever been out of a job or on strikefor two months or more at a time?(If yes - F32) When was the last time thathappened?
G25, G26. Have you ever been out of a job or onstrike for two months or more at a time?(If yes) When was the last time that happened?
1. 1967 or 1968
2. 1965-1966
3. 1962-1964
4. 1955-1961
5. No
6. 1945-1954
7. Before 1945
8. Yes, N.A. when
9. N.A., D.K.
0. Inap.
IF GIVES 2 DATES, CODE MOST RECENT
F33. In the last year, how many days were you unemployed,laid off, or without work?
0. None , or Inap.
1. l-5 days; 1 week
2. 6-10 days; 2 weeks
3. 11-25 days; 3-5 weeks
4. 26 or more days (or unemployed now), 6 or more weeks
9. N.A.

-260-
Variable TapeNumber Location
221 412
23.2
5.7
3.4
3 .-7
1.0
62.999.9
222 413
45.9
12.4
19.8
10.1
11.1
0.7
223 414130.0
17.4
3.4
3.4
5.6
13.3
19.3
25.6
10.1
1.9100.0
Content
F34. How many days of work did you miss on your mainjob in the last year because you were sick orotherwise unable to work?
1. l-5 days 1 week
2. 6-10 days 2 weeks
3. 11-25 days 3-5 weeks
4. 26 or more days (or unemployment now), 6 or more weeks
9. N.A. (includes retired, unemployed)
0. Inap.
F35. And how many weeks of vacation did you take last year?
0. None
1. One; 1-5 days
2. Two; 6-10 days
3. Three; 11-15 days
4. Four or more; 16 or more days
9. N.A.
F36. Then how many weeks did you actually work onyour main job in 1967?
G3. How many weeks did you work last year?
H3. How many weeks did you work last year?
0. None (did not work at all last year) Or Inap.
1. 1-13
2. 14-26
3. 27-39
4. 40-47
5. 48-49
6. 50-51
7. 52
9. N.A.

-261-
Variable TapeNumber Location Content
224 415 F37. Did you have a standard work week on your main job?
225 416
226 417
51.7
21.8
0.4
26.099.9
2.7
4.5
5.1
40.1
6.4
3.5
9.1
8.1
2.9
17.599.9
7.5
8.8
4.9
5.4
22.1
2.3
1.1
47.8
99.9
1. Yes
5. No
9. N.A.
0. Inap.
F38, F41. How many hours a week is that? On the average,how many hours a week did you work on yourmain job last year?
G4. About how many hours a week did you work (when youworked)?
H4. About how many hours a week did you work (whenyou worked)?
1. 1-19 hours a week
2. 20-34
3. 35-39
4. 40
5. 41-47
6. 48
7. 49-59
8. 60 or more
9. N.A.
0. Inap., did not work last year
F39, F40. Did you have any overtime or extra work onyour main job? How many hours did thatamount to last year?
1. Yes, 1-49 hours
2. Yes, 50-199 hours
3. Yes, 200-399 hours
4. Yes, 400 or more hours
5. No
7. Yes, N.A. how much
9. N.A.
0. Inap., no standard work week

Variable Tape-Number Location
227 418
-262-
Content
F42, F44. Did you have any other jobs or any other waysof making money in addition to your main job?Anything else?
13.3 1. Yes, One other job or way of making money. "No"or "N.A." to F44
2.2 3. Yes, two or more other jobs, or ways of making money
0.3 4. Not as a job, coded '0' by F45
57.7 5. No
0.6 9. N.A.
26.0 0. Inap.100.1
228 419 F43. What did you do? (C do e same as other occupationcode (Col. 12). If two or more jobs, code the onewith the lowest code number (highest status)
2.4
0.7
0.9
1.7
2.6
1.4
2.4
1.4
1.9
84.599.9
229 420-422
1.
2.
3.
4.
5.
6.
7.
8.
9.
0.
Professional and technical workers
Managers and officials
Self-employed businessmen
Clerical and sales workers
Craftsmen and foremen
Operatives
Unskilled laborers and service workers
Farmers and farm managers
Miscellaneous
Inap., (not in labor forceor does not have second job)
F45. About how much did you make per hour for this?
(CODE DOLLARS AND CENTS PER HOUR)- -
300. $3.00 per hour
998. $9.98 or more per hour
999. N.A.
000. Inap. (No second job)

-263-
Variable TapeNumber Location
230 423
231
232
233
424
425 F49. Could you have worked less if you had wanted to?
34.2
38.6
1.1
26.1100.0
10.5
25.5
3.7
60.3100.0
33.0
27.9
2.6
36.5 0. Inap. (Could not have worked more, and would100.0 like to have worked more)
426
2.3
23.7
4.3
69.7100.0
234 427 Bracket on Taxable Income of head and wife
13.93.46.04.75.06.218.015.518.58.7
99.9
Content
F47. Could you have worked more if you had wantedto in 1967?
1. Yes
5. No
9. N.A., D.K.
0. Inap.
F48. Would you have liked to work more?
1. Yes
5. No
9. N.A., D.K.
0. Inap. (Could have worked more)
1. Yes
5. No
9. N.A., D.K.
F50. Would you have preferred less work even ifyou had earned less money?
1. Yes
5. No
9. N.A., D.K.
0. Inap. (Could have worked less)
0. Less than $5001. $500-9992. $1000-19993. $2000-29994. $3000-39995. $4000-49996. $5000-74997. $7500-99998. $10,000-14,9999. $15,000 or more
(Replaces an empty code, since Question G9 wasactually coded in Variable 206 [TL 3951)

-264-
Variable TapeNumber Location
235 428
236
237
1.0
0.4
0.3
0.8
3.6
0.6
93.4100.1
429
0.7
0.2
0.1
0.4
2.7
0.6
95.299.9
430
Content
613. How many places do you have your name in for a job?
H5, H6. Are you thinking about going to work? (Ifyes) How many places do you have your name infor a job?
1. Yes, 1 place
2. Yes, 2 places
3. Yes, 3 places
4. Yes, 4 or more places
5. No (Yes to H5, No to H6)
9. N.A., D.K.
0. Inap., not thinking about going to work (No to H5)
G14, G15. Have you applied for a job anywhere in thelast 2 weeks? (If yes) How many places didyou apply?
H7, H8. Have you applied for a job anywhere in the lasttwo weeks? (If yes) How many places did you
1. Yes, 1 place COUNT AN AGENCY AS 1 PLACE
2. Yes, 2 places
3. Yes, 3 places
4. Yes, 4 or more places
5. No
9. N.A., D.K.
0. Inap., (employed, or retired and not thinking ofgoing to work)
627. Are there jobs available around here that justaren't worth taking?
H9. Are there jobs around here that just aren't worth
2.1
1.0
1.7
95.2100.0
1. Yes
5. No
9. N.A., D.K.
0. Inap., not thinking of going to work

Variable TapeNumber Location
238 431-433
239 434
71.5
7.6
12.0
4.7
3.2
0.7
0.299.9
240 435-436 13, 15, 122, or 123. When were you first married?
-265-
Content
G28. (If yes) How much do they pay?
H10. (If yes) How much do they pay?
CODE 3 DIGITS - DOLLARS AND CENTS PER HOUR
050. 50c per hour
300. $3.00 per hour
.... etc.
998. $9.98 or more per hour999. N.A., D.K. how much000. Inap., no jobs that are worth taking or not
thinking of going to work
Il. Are you married, single, widowed, divorced, orseparated?
1. Married
2. Single
3. Widowed
4. Divorced
5. Separated
8. Married, spouse absent
9. N.A.
(CODE AGE OF HEAD WHEN FIRST MARRIED)
23. 23 years old. . . etc.
99. N.A.00. Inap., never married

Variable Tape ColumnNumber Location Number Content
241 14. (If widowed, divorced, or separated) "For how long?"
3.3 1. About 1 year or less, 1967-1968
4.9 2. 2-4 1964-1966years;
4.2 3. 5-9 1959-1963years;
4.2 4. 10-19 1949-1958years;
2.4 5. 20 years or more 1948 or earlier
2.0 9. N.A.
79.0 0. Inap., not widowed, divorced, or separated100.0
242 438 17, 114. How were the children taken care of while youwere working? How were the children takencare of while your wife was working?
0.6 1. They take care of themselves
3.2 2. Children in school, wife home when they are not
5.7 3. Relatives (inside or outside household), spouse
0.6 4. Friend or neighbor
0.5 5. Nursery school, day care center
4.2 6. Unrelated baby sitter or housekeeper
0.8 7. Other
0.8 9. N.A.
83.6 0. Inap., no children under 12 or head not working100.0 or a wife not working
243 439 19, 110. Did your wife do any work for money lastyear? (If yes) What kind of work did she do?
4:4 1. Professional or technical
0.6 2. Manager, official
0.7 3. Self-employed businesswoman
11.9 4. Clerical or sales
0.5 5. Craftswoman or foreman
5.1 6. Operative
6.9 7. Unskilled laborer or service
0.0 8. Farming
1.7 9. Miscellaneous
68.1 0. Wife did not do any work for money last year. ("NO"99.9 to 19 or No Wife)

Variable Tape-Number Location
244 440
4.9
4.1
3.9
2.9
3.2
8.0
3.1
1.8
68.1100.0
245 441
246 442
3.5
5.0
3.4
14.0
1.6
0.7
1.2
0.5
1.8
68.299.9
2.910.213.321.58.57:74.0
1.2
1.029.699.9
-267-
Content
Ill. About how many weeks did she work last year?
1. 1-13 weeks
2. 14-26 weeks
3. 27-39
4. 40-47
5. 48-49
6. 50-51
7. 52
9. N.A.
0. Inap., no working wife
112. And about how many hours a week did she work?
1. 1-19 hours a week
2. 20-34 hours a week
3. 35-39
4. 40
5. 41-47
6. 48
7. 49-59
8. 60 or more
9. N.A.
0. Inap., no working wife
116, 117, 118. How many grades of school did your wifefinish? Did she have any other schooling?(If yes) What other schooling did she have?(If college) Does she have a college degree?
1. O-5 grades2. 6-8 grades, grade school3. 9-11 grades (some high school)4. 12 grades (completed high school)5. 12 grades plus non-academic training6. College, no degree7. College, bachelors degree8. College, advanced or professional degree, some
graduate work, close to receiving degree9. N.A., D.K.0. Inap., no wife

Variable TapeNumber Location
247 443
248 444
59.7
10.6
0.6
29.1100.0
121. Is this your (Head's) first marriage?
1. Yes
5. No
9. N.A.
0. Inap., head not married
125, 126, 127. Do you expect to have any more children?If yes, when do you think you might haveanother child? (If no) How sure are youthat you won't have any (more) children?
6.1 1.
3.1 2.
4.1
0.5
12.2
5.8
7.5
1.8
1.9
57.2100.2
3.
4.
5.
6.
7.
8.
9.
0.
-268-
Content
Yes, and expects to have another 9 months or morefrom now (includes adopted children)
Yes, and expects to have another less than 9 monthsfrom now
Yes, but does not know when
Yes, N.A. when
No and are sure
No, and fairly sure
No, and not sure
No, N.A. whether sure
N.A., yes or no
Inap., widowed, divorced, separated, wifeover 45, no wife

249
250
251
252
445
446
0.2
0.00.30.20.40.40.31.40.4
96.5100.1
2.05.80.10.5
91.40.1
99.9447
25.22.92.34.13.8
11.919.513.713.63.0
100.0
448
12.5
85.1
2.5100.1
-269-
52. What were your total receipts from farming?
1. Less than $500 (including negatives andzero, if a farmer)
2. $500-9993. $1000-19994. $2000-29995. $3000-49996. $5000-74997. $7500-99998. $10,000 or more9. N.A.0. Inap., not a farmer
55. Did you (R and Family) own a business at anytime in 1967 or have a financial interest inany business enterprise?
Is it a corporation or an unincorporated business,or both?
1. Yes, incorporated2. Yes, unincorporated3. Yes, both kinds4. Yes, N.A. whether incorporated5. No9. NA whether owns business
58. How much did you (HEAD) receive from wages andsalaries in 1967?
0. None, Inap.1. $1-4992. $500-9993. $1000-19994. $2000-29995. $3000-49996. $5000-74997. $7500-99998. $10,000 or more9. N.A., D.K.
J9. In addition to this did you receive any incomefrom bonuses, overtime, or commissions? Howmuch was it?
1. Yes
5. No
9. N.A.

-270-
253
253
254 450
255 451
256 452
257 453
258 454
259 455
260 456
261 457
262 458
263
449
449
459
94.11.50.80.70.50.50.40.20.70.7
100.1
30.7
3.9
0.8
33.0
0.1
31.5100.0
J11. Did you (HEAD) receive any other income in1967 from:
J11a. Professional practice or trade
(BRACKET CODES)
0. None1. $1-4992. $500-9993. $1000-19994. $2000-29995; $3000-49996. $5000-74997. $7500-10,0008. $10,000 or more9. N.A.
NOTE: For V254 - V262 use Bracket Code asin J11a (above)
J11b. Farming or market gardening, roomers orboarders
J11c. Dividends, interest, rent, trust funds, orroyalties
J11d. ADC, ADCU
J11e. Other welfare
J11f. Social Security
J11g. Other retirement pay, pensions, or annuities
J11h. Unemployment or workmen's compensation
J11i. Alimony, child support
J11j. Help from Relatives
J12. Did your wife have any income during 1967?(If yes) Was it income from wages, salary, abusiness or what?
Any other income?
1. Yes, solely from work (wages, business,farming, transfers, assets)
2. Yes, from non-labor sources
3. Yes, from both work and non-work
5. No
9. N.A.
0. Inap., no wife

-271-
264 460
265 461 517.
266 462
267
64.36.04.25.74.47.64.60.90.22.1
100.0
78.115.64.91.10.30.0
0.1100.1
93.11.81.11.10.50.50.30.30.70.6
100.0
463 Source Code - J28
1.91.11.20.20.10.42.0
93.1100.0
J15. How much was it, before deductions?Wife's TOTAL income
0. None1. $1-4992. $500-9993. $1000-19994. $2,000-2,9995. $3,000-4,9996. $5,000-7,4997. $7,500-9,9998. $10,000 or more9. N.A.
Did (MENTION MEMBER) have any income during 1967?
(Number of others with income)
0. No other income receivers1. One other income receiver2. Two3. Three4. Four5. Five or more
9. N.A.
528. Did you get any other money in the last year--like a big settlement from an insurance company,an inheritance, or anything?
529. (If yes) How much did that amount to?
0. No, nothing1. Yes, less than $5002. $500-9993. $l,OOO-1,9994. $2,000-2,9995. $3,000-4,9996. $5,000-7,4997. $7,500-9,9998. $10,000 or more9. N.A. (whether, or amount)
1. Insurance settlement2. Inheritance - gifts3. Sale of property - stocks - bonds4. Loan taken out5. Loan repayment received7. Other9. N.A.0. Inap., no such income

-272-
268 464
269 465
270 466
271 467 535. Why was that?
2.00.51.3
95.90.4
100.1
J30-31. Did anyone here get more than $50 worth offood or clothing as part of their pay?
1. Yes, food2. Yes, clothes3. Yes, mixed or N.A which5. No to J309. N.A.
J32-J33. Did you get more than $50 worth of freefood, clothing, or food stamps in 1967?
2.52.82.7
91.40.5
99.9
1. Yes, food,food stamps2. Yes, clothing3. Yes, mixed or N.A. which5. No to J329. N.A.
534. Was your family's income a lot higher orlower than usual this past year (1967)?
56.528.114.31.1
100.0
13.6 1.
18.7 2.
4.7
2.8 4.
1.8
0.0
1.9
56.5100.0
0. No, about the same as usual1. Higher than usual2. Lower than usual9. N.A.
3.
5.
6.
9.
0.
Head had more or less work than usual (includeunemployment, illness of head, overtime,strike, second job)
Head's income from work was higher or lowerthan usual (wages or profits or farm incomedifferent, not work hours)
More or less income from other earners in thefamily
More of less income than usual from other(none-labor) sources
Other reasons, more or fewer people in family
Retirement
N.A. why
Inap., family's income normal

-273-
272
273
274
275
468
469 537. Why does it vary?
470
80.219.10.7
100.0
11.5
5.6
0.71.01.1
80.2100.1
43.15.5
34.7
2.211.43.0
99.9
471
68.413.8
2.3
3.7
5.5
1.13.71.00.6
100.1
J36. Does your family's income change from monthmonth, stay the same over the year, or what?
1. Stays the same2. Changes from month to month9. N.A.
1. Amount of work varies, more or lessovertime, seasonal, etc.
2. Profits or commissions, farm sale,etc. vary
3. Other family members work intermittently4. Other9. N.A.0. Inap.
538. Would you say you are better off financiallythan you were a few years ago, or are you inthe same situation?
1. Better off2. Better off, qualified3. Same, pro-con, better in some ways,
worse in others4. Worse off, qualified5. Worse off9. N.A.
539. Is there anything that makes your family'sexpenses unusually high?
540. (If yes) What is that?
0. No, nothing1. Yes, medical bills, special diets,
illness, psychiatrists2. Yes, rents or other housing costs,
property taxes3. Children in college, boarding school,
child support, alimony4. Food, expenses too high, high prices in
general5. Change in family size7. Other, including luxuries8. Head or wife in college9. N.A. whether

-274-
276 472
277
278 474
279
62.8 0.0.8 1.5.4 2.4.7 3.
3.3 4.6.1 5.
13.0 6.
1.82.1
100.0
541. Is anything likely to happen over the nextfew years that will make things muchdifferent for your family - like more orless earners, a better job for you, or fewerpeople living here?
542. (If yes) What is that?
7. Other reasons9. N.A.
No, nothingAsset or debt transactionsFamily situation changes (marriage, death)Expenses changes (medical expenses, livingexpenses)Pay raises, more or less unemploymentNumber of earners changes; job changes ofothersJob changes of Head, get a better job,promotion
473 543. Will that make things better, or worse,financially?
23.7
2.6
6.0
4.9
62.8100.0
1. Better
3. Pro-con, better in some ways, worse inothers
5. Worse
9. N.A.
0. Inap., nothing likely to happen. (No to J41)
94.32.91.30.40.30.40.4
100.0
544. Are there any people that do not live with youwho are dependent on you for more than half oftheir support?
545. (If yes) How many are there?
0. No, none1. Yes, one2. Yes, two3. Yes, three4. Yes, four or more5. Yes, N.A. how many9. N.A. (whether)
475 547. Do you (FAMILY) have parents or other relativesthat you would feel that you had to help (more),if you had more money?
21.178.30.6
100.0
1. YesNo
9. N.A.

-275-
280 476
281 477 (Second mention to K1. see code for V280)
282 478-479 (The two mentions combined into one variable)
283 480 K1. (Number of things mentioned)
1. One2. Two3. Three4. Four5. Five6. Six7. Seven8. Eight or more9. N.A.0. None
284 481 K2. HOW often do you (HEAD) go to church?
4.25.5
30.0
25.0
31.1
2.7
0.60.9
100.0
19.530.625.712.24.91.70.90.50.73.2
99.9
23.921.0
6.68.2
30.5 4. Every week, once a week, every Sunday7.6 5. More than once a week, once a week plus2.2 9. N.A.
K1. We're interested in how people spend their sparetime. What things do you (HEAD) usually do inyour spare time?
0. Nothing. .Have no spare time, just sit1. Watch TV, other passive things2. Drive the car, talk with neighbors, play
cards, walk, read, fish, do flower gardening3. Energetic activities requiring initiative:
sports, active hobbies, bowling, tennis,hunting, square dancing
4. Productive activities (that save money orproduce direct service: having vegetablegarden, working around house)
5. Investment in self: learning new things,things that may benefit one economically
7. Other9. N.A.
0. Never1. Once in a while, a few times a year, not
often, seldom2. About once a month, sometimes3. Every few weeks, several times a month,
once or twice a month, often
100.0

-276-
285
286 483
287 484
482 K3.K4.
87.90.6
0.6
0.4
4.3
5.40.7
99.9
12.028.421.519.26.05.81.40.81.53.0
99.6
8.81.3
1.19.93.6
74.21.2
100.1
Are you (HEAD) taking any courses or lessons?(If yes) what are they?HIGHEST NUMBER HAS PRIORITY0. No1. Yes, for increasing consumption pleasure
(hobbies, bridge, etc.)2. Yes, for increasing knowledge about
world, etc., public affairs3. Yes, for learning how to do-it-yourself,
fix-it courses, carpentry, N.A. what4. Yes, with potential earning applications.
Job training5. Formal academic work - college, high school9. N.A. whether
K5. About how many hours do you (HEAD) usually watchtelevision on an average week-day?
0. None1. One up to 1.42. Two - 1.5 to 2.4, sometimes, seldom3. Three4. Four5. Five6. Six7. Seven8. Eight or more9. N.A.
K6. How often do you (HEAD) read a newspaper - everyday, once a week, or what?
0. Never1. Hardly ever. Only when something unusual,
only during some season2. Occasionally (less than once a week)3. Once or twice a week, Sunday only4. Week days, several times a week5. Every day9. N.A.

-277-
288 485
289 486
290 487
291
4.3 0.2.7 1.4.3 2.4.1 3.3.2 4.5.0 5.9.3 6.19.6 7.44.8 8.
2.7100.0
K7. About how many people in this neighborhooddo you know by name?
(If counting families, multiply by two)
9.
No oneOneTWOThree, a fewFourFive, 50%6-9, not many10-19, 95%, most20 or more, lots of people, everyone,all of themN.A.
K8. Do you (FAMILY) have any relatives who livewithin walking distance of here?
1. Yes
3. Yes, qualified (they are never home, theyare here only part of year, we never seethem)
5. No
9. N.A.
K9. Did you spend more than 40 hours helping friendsor relatives last year?
K10. (If yes) About how many hours was that?
52.429.75.04.56.6
0. No1. Yes, 41-120 hours2. 121-240 hours3. 241 or more hours7. N.A. how much, but more than 409. N.A.
488 K14. Was that from someone who does not live here?
80.115.60.12.6
0. Inap., No to K111. Yes3. Part of it was5. No9. N.A.

-278-
292
293
294
489
57.59.5
18.8
7.14.40.72.0
100.0
490
63.311.1
9.6
6.84.72.61.9
100.0
491
76.61.02.2
14.74.30.10.60.5
100.0
K15. How often do you (HEAD) go to social clubsor organizations?
0. Never1. Hardly ever. A few times a year2. Occasionally, once or twice a month
(less than once a week)3. Once a week, every Friday, etc.4. A few times a week, more than once a week5. Every day, 4 days a week or more9. N.A.
K16. How often do you (HEAD) go to a bar or tavern?
0. Never1. Hardly ever, a few times a year, almost
never, seldom2. Occasionally, once or twice a month (less
than once a week)3. Once a week4. A few times a week, more than once a week5. Every day, four days a week or more9. N.A.
K17. Do you (HEAD) belong to a labor union?K18. (If yes) How much did your union dues amount
to last year?
0. No1. Yes but no dues2. Yes, dues less than $253. Yes, dues $26-994. Yes, dues $100-4995. Yes, dues $500 or more8. Yes, dues N.A.9. N.A. whether

-279-
295
296
297
298
492
493
494
50.13.73.71.8
32.18.5
99.9
43.24.95.11.7
42.72.4
100.0
53.6
3.57.5
1.8
28.3
5.3100.0
495
72.0 1. Nearly always finish things5.2 2. Nearly always finish, qualified2.5 3. Pro-con, sometimes finish, sometimes give up
0.816.4
2.799.6
L1. Have you usually felt pretty sure your lifewould work out the way you want it to, or havethere been times when you haven't been verysure about it?
1. Usually been pretty sure2. Pretty sure, qualified3. Pro-con, sure sometimes, not sure other4. More times when haven't been sure, qualified5. More times when not very sure about it9. N.A., D.K.
L2. Are you the kind of person that plans his lifeahead all the time, or do you live more fromday to day?
1. Plan ahead2. Plan ahead, qualified3. Sometimes plan ahead, sometimes not, pro-con4. Live more from day to day, qualified5. Live more from day to day9. N.A. D.K.
L3. When you make plans ahead, do you usually getto carry out things the way you expected, ordo things usually come up to make you changeyour plans?
1. Usually get to carry out things the wayexpected
2. Usually get to carry out things, qualified3. Pro-con, depends, sometimes carry out,
sometimes things come up4. Things come up to make me change plans,
qualified5. Things usually come up to make me change
plans9. N.A., D.K.
L4. Would you say you nearly always finish thingsonce you start them, or do you sometimes haveto give up before they are finished?
4. Sometimes have to give up, qualified5. Sometimes have to give up before they are
finished9. N.A., D.K.

-280-
299
300
301 498
302 499
496 L5. How much do you like to do things that aredifficult and challenging?
52.711.78.0
10.111.3
6.2100.0
1. A lot, like it very much2. A lot, qualified, some things a lot3. Pro-con, depends, sometimes yes, sometimes
no4. Not much, qualified5. Don't like things that are difficult and
challenging9. N,A., D.K.
497 L6. Would you rather spend your money and enjoylife today or save more for the future?
36.8
2.4
20.34.5
32.04.2
100.2
1. Would rather spend money and enjoy lifetoday
2. Rather spend and enjoy, qualified, wouldif had it
3. Pro-con, want to do both4. Save more for the future, qualified5. Save more for the future9. N.A., D.K.
73.71.12.00.9
16.0
6.3100.0
73.03.64.0
1.315.22.9
100.0
L7. Would you rather have a job that you likeeven if the chances for a raise were small,or a job you don't like which offers a goodchance for making more money?
1. Rather have a job I like2. Rather have a job I like, qualified3. Pro-con, depends, want both4. Rather have a job I don't like with good
chance for making more money, qualified5. Rather have a job I don't like which offers
a good chance for making more money9. N.A., D.K.
L8. Are you more often satisfied or dissatisfiedwith yourself?
1. More often satisfied2. More often satisfied, qualified3. Pro-con, depends, satisfied some ways,
dissatisfied others4. More often dissatisfied, qualified5. More often dissatisfied9. N.A., D.K.

-281-
303
304
305 502
306 503 L12. Do you trust most other people, some, or very few?
500
501
42.0
5.1
47.9
5.0100.0
20.91.94.84.9
64.6
2.899.9
L9. Do you have some limitations that keep you fromgetting ahead as far as YOU would like?
L10.
1. Yes, health included
3. Yes, but not important, depends
5. No
9. N.A., D.K.
Do you get angry fairly easily, or does ittake a lot to get you angry?
1. Get angry fairly easily2. Get angry fairly easily, qualified3. Pro-con, depends4. Takes a lot to get me angry, qualified
(But I really blow when I do)5. Takes a lot to get me angry (I never get
angry)9. N.A., D.K.
L11. How much does it matter what other peoplethink about you?
46.515.3
8.412.114.23.5
100.0
1. Not at all. Doesn't matter2. Very little, matters what one or two
people think3. Pro-con, depends. Matters in some areas4. A good deal. It matters5. It matters a lot. I'm very sensitive9. N.A., D.K.
56.93.7
18.53.5
14.52.8
99.9
1. Most2. Most , qualified3. Pro-con, depends, should trust some4. Few, not many, qualified5. Very few. I trust no one9. N.A., D.K.

-282-
307
308
309
310
504
505
506
65.53.83.8
1.922.2
2.8100.0
36.72.13.6
1.7
53.22.6
99.9
49.73.39.0
1.828.28.0
100.0
507
30.4 1. Yes, a lot2.5 2. A lot, qualified, quite a few5.4 3. Pro-con, depends, some do4.3 4. Not many, but a few
41.0 5. No16.4
100.0
L13. Do you spend much time figuring out waysto get more money?
1. None at all2. Very little, not much3. Pro-con, sometimes I do, should spend
more (less), used to in the past4. Quite a bit5. A lot. I'm always figuring out how to
get more money9. N.A., D.K.
L14. Do you think a lot about things that mighthappen in the future, or do you usually justtake things as they come?
1. Think a lot about things that might happen2. Think a good deal, qualified3. Pro-con, sometimes do, sometimes, not.
Should think more (less)4. Usually just take things as they come,
qualified, but.....5. Usually just take things as they come9. N.A., D.K.
L15. Do you think the life of the average man isgetting better or is it getting worse?
1. Getting better2. Getting better, qualified; better for most3. Pro-con, better some ways, worse others,
should be different4. Getting worse, qualified5. Getting worse9. N.A., D.K.
L16. Are there a lot of people who have good thingsthey don't deserve?
9. N.A., D.K., not concerned, can't judge

-283-
311 508-509 Ml. Where did YOU (HEAD) grow UP?
312 510
Alphabetical state code running from 01 = Alabamato 49 = Wyomingexcept, Alaska = 50 and Hawaii 49.From Geographical Location Codes, U.S. GeneralServices Administration Office of Finance,October, 1966. (Note that Census city-countydata book inserts Alaska and Hawaii, as 02 and12, and has all 50 states in order.
For this code we added:61 English speaking foreign countries: England,
Canada, Australia, New Zealand62 Other northern European countries: France,
Low Countries, Scandinavia, Poland,Czechoslovakia, Austria, Switzerland, Russia, _Germany
63 Southern European countries and EasternEurope: Spain, Italy, Greece, Yugoslavia,Albania, Romania, Bulgaria
64 Spanish America: Mexico, Central American,West Indies, South America
65 Asia, Mideast (including Egypt)66 Africa, excluding Egypt
99 N.A.
M2. Was that on a farm, in a large city, small town,or what?
34.0
31.5
32.1
1.5
1. Farm
2. Large city, any size city
3. Small town, any size town
4. Other, many different places
9. N.A.
313 511
3.1
4.7
20.3
17.7
17.0
9.8
14.0
8.2
4.7
0.5100.0
M3-10. How many grades of school did you (HEAD) finish?
0. O-5 grades and has difficulty reading
1. O-5 grades, no difficulty reading
2. 6-8 grades
3. 9-11 grades
4. 12 grades (completed high school)
5. 12 grades plus non-academic training
6. College, no degree
7. College, bachelors degree (A.B., B.S., etc.)
8. College, advanced or professional degrees(M.A., Ph.D., LLB, BD, M.S., etc.
9. N.A., D.K.

-284-
314 512
315
21.1
0.9
78.0100.0
M4-5. Did you get any other training; if Yes,what was it?
M7-8. Did you have any other schooling? If yes,What other schooling did you have?
1. Some training outside the regular school system(apprenticeships, manpower training programs,etc.
9. N.A.
0. No training except regular school and college
513 M11. Are you (HEAD) a veteran?
316 514
317 515
35.8
63.5
0.7100.0
1. Yes
5. No
9. N.A.
6.513.814.014.412.19.28.36.0
14.2
1.6100.1
47.9
36.5
14.6
1.3100.3
M12. How many brothers and sisters aid you have?(Includes half-sisters, adopted children, butnot foster children)
0. None1. One2. Two3. Three4. Four5. Five6. Six7. Seven8. Eight or more
9. N.A.
M13. Were your parents poor when you were growing up,pretty well off, or what?
1. Poor
3. Average, it varied
5. Pretty well off
9. Don't know, Didn't live with parent's

-285-
318
319 517 Accuracy of Mortgage owed (See V11 code)
320 518-521 Imputed rental income (6% of net equity in owned home)
321 522 Accuracy of imputed rent (see V11 code)
322
516
10.7
59.4
5.7
10.8
0.9
3.7
3.2
1.5
3.999.8
523-528 Total 1967 Family Real Income in Dollars
M14. How much education did your father have?M15. (If don't know) Could he read and write?
1. O-5 grades, or D.K. and could not reador write
2. 6-8 grades, grade school, or D.K. and couldread and write
3. 9-11 grades, some high school
4. 12 grades, high school
5. 12 grades plus non-academic training
6. College, no degree
7. College degree, no advanced degree mentioned
8. College, advanced or professional degree
9. N.A., D.K., both M14 and M15
(The remaining variables were created by the computer)
This variable is composed of the sum of the followingvariables:
V81 Total 1967 Family Money Income
+V16 Imputed income from doing additions andrepairs in 1967
+V24 Imputed income from doing own car repairsin 1967
+V39 Imputed income from growing own food in 1967
+V41 Imputed income from sewing & mending in 1967
+V43 Earned income in form of food or clothing(only if worth more than $50) in 1967
+V320 Imputed 1967 rental value of owner-occupiedhouse (.06 x net equity in house)
+V12 Estimated annual 1967 rental value of DU (forthose who neither own nor rent)
+V45 Value of free food, clothing, or food stampsreceived in 1967 (only if $50 or more during year)
+57 Value of services received free from othersNOTE: Total value added in if all the timereceived was from someone living outside DU;1/2 total value added if only part of help wasfrom someone outside DU (Valued at $1 = 1 hour)

-286-
Variable TapeNumber Location Description
323 529-534 Total 1967 FAMILY Real IncomeNet of Cost of Earning Income - In Dollars
V322 Total 1967 Family Real Income
-V84 Child care costs, Federal Income Tax, and1967 Union dues for Head of family
-v57 if added originally (free child care)
324 535-540
325 541-544 "Orshansky Ratio" (Full Detail Variant) (V81 3 V32 x 100)
326 545-548xx.xx
Total 1967 FAMILY Real Income Net of Costs of EarningIncome and Net of Housing Costs - In Dollars
V322
-V84
-V10
-v14
-V18
-v12
-V16
-.06 x V5
-V6
V320
-v57
Total 1967 Family Real Income
Cost of Earning Income
1967 Rent Payments
1967 Utilities Payments
1967 Payments for additions and repairs (forall those still owing anything at time ofinterview)
Estimated annual 1967 rental value of DU (forthose who neither own nor rent)
Imputed income from doing additions and repairsin 1967
Imputed 1967 annual rental value of DU (forhomeowners excluding farmers and others withcomplex property, i.e., if coded 3 in V7)
Estimated 1967 Property taxes for homeowners
Imputed rent of homeowners (if coded 3 in V7,i.e., have complex property)
if added originally (Free Child Care)
V81 1967 Total Family Money Income
/ V32 Annual Family Need Standard - Orshansky
Result multiplied by 1.25 if V197 or V228 = 8, i.e., firstor second job a farmer.
Ratio of Total 1967 FAMILY Real Income Net of Cost ofEarning Income to Annual Family Need Standard - Orshansky(V323 / V32 x 100)
V323 Total 1967 Family Real IncomeNet of Cost of Earning Income
/ V32. Annual Family Need Standard - Orshansky

-287-
Variable TapeNumber Location
327 549-552xx.xx
328 553-558
329 559-564
330 565-570
331 571-575
Description
Ratio of Total 1967 Family Real Income Net of Cost ofEarning Income and Net of Housing Costs to 1967 FamilyFood Standard - Orshansky Low Cost (V324 I V31 x 100)
V324 Total 1967 Family Real Income Net of Cost ofEarning Income and Net of Housing Costs
/ v31 Annual Family Food Standard - OrshanskyLow cost
FAMILY Well-offness Index -- uses "Orshansky Ratio"
V325 "Orshansky Ratio"
x v73 Average hours of leisure per major adult infamily, in 1967
FAMILY Well-offness Index - uses Ratio of Total 1967 FamilyReal Income Net of Cost of Earning Income to Annual FamilyNeed Standard - Orshansky
V326 Ratio of Total 1967 Family Real Income Net ofCost of Earning Income to Annual Family NeedStandard - Orshansky
x v73 Average hours of leisure time per major adultin family, in 1967
FAMILY Well-offness Index - uses Ratio of Total 1967Family Real Income Net of Cost of Earning Income and Netof Cost of Housing to Annual Family Need Standard -Orshansky
327 Ratio of Total 1967 Family Real Income Net ofCost of Earning Income and Net of HousingCosts to Annual Family Need Standard - Orshansky
x v73 Average Hours of leisure time per major adultin family, in 1967
Total 1967 Family Contractual Payments - In Dollars
V8 Annual Mortgage payments made in 1967(for Home owners)
+ V10 1967 Rent payments
+ v14 1967 Utilities Payments
+ V18 1967 payments for additions and repairs
-I- v20 1967 Car insurance payments
-f- v22 1967 Car debt payments
+ V28 Other 1967 debt payments
+V6 Estimated annual property taxes paid in 1967(for home owners)

-288-
Variable TapeNumber Location Description
332 576-580 Total 1967 Family Fixed Expenditures - In Dollars
v33 1 Total 1967 Family Contractual Payments
+ v37 Total 1967 Family food expenditures
+ V84 Child care costs (for families where thereare children under 12 and wife of head works,or single head of family works for money)and
+- V82
1967 Union dues for HEAD of family
Total 1967 payments to dependents outside DU(only for cases where amount was ascertained)
333
334
335
581-586 Total 1967 Family Uncommitted Money Income - In Dollars
V81 Total 1967 Family money income
-V332 Total 1967 Family fixed expenditures
587-591 Total 1967 Family Food Consumption
v37 Total 1967 Family food expenditures
+ v39 Imputed income from growing own food in 1967
+ v43 Earned income in form of food in 1967(1 x V43 added if source code indicates thatall was food - if V268 = 1; .7 x V43 added ifsource code says food and clothing or N.A.which, i.e,, if V268 = 3)
+ v45 Value of free food or food stamps receivedin 1967(1 x V45 added if source code indicates thatall was food or food stamps - if V269 = 1;.7 x V45 if source code says food and clothingor N.A. which - if V269 = 3)
592-596 Total 1967 Family Hours of Work (Work for Money PlusUnpaid Work)
v47 1967 Hours of Work for Money - HEAD
+ v53 1967 Hours of Work for Money - WIFE-
+ v59 1967 Hours of Housework - FAMILY
+ V61 1967 Hours of Home Production - HEAD AND WIFE
+ V72 1967 Hours of Work for Money - OTHERS(other than head or wife)
CONTINUED ON NEXT PAGE

-289-
VariableNumber
TapeLocation Description
335 592-596 + v57 1967 Hours of Help from others -(Cont.) (estimated part from outside family unit)
(1 x V57 if all from someone outside familyunit - if V291 = 1; .5 x V57 if only part fromsomeone outside family unit)
+ V63 1967 Hours of house work and work for moneyby others in FU - adjustment factor if someoneother than Head or Wife included as a majoradult.)(Added in when hours of work by others,V72 = 0000, to avoid double counting)
336 597-599x.xx
Ratio of Total 1967 Family Food Consumption to 1967 FamilyFood Standard
v334 Totall Family Food Consumption
/ v31 1967 Family food standard - Orshansky (Low-costplan for family of given size and age-sexcomposition)
337 *600-603 1967 Hourly Earnings - HEADxx.xx
v74 1967 Income from Labor - HEAD
/ v47 1967 Hours of Work for Money - HEAD
*Coded 99.99 when V47 = 0000 (did not work for money in 1967)
338 *604-607 1967 Hourly Earnings - WIFExx.xx
v75 1967 Income from labor - WIFE
/ v53 1967 Hours of work for money - WIFE
*Coded 99.99 when V53 = 0000 (did not work for money in 1967)
The following Bracket Codes are used for Variables 339-350 (Income, Well-Offness,and Payments Variables)
v339-342, V346-350 v343-4 v345
0. Less than 500 Less than 1000 Less than 3000
1. 500-999 1000-1999 3000-5999
2. lOOO- 1999 2000- 2999 6000-8999
3. 2000-2999 3000-3999 9000-11,999
4. 3000-3999 4000-4999 12,000-14,999
5. 4000-4999 5000-5999 15,000-17,999
6. 5000-7499 6000-7499 18,000-22,499
7. 7500-9999 7500-9999 22,500-29,999
8. 10,000-14,999 10,000-14,999 30,000-44,999
9. 15,000 or more 15,000 or more 45,000 or more

-290-
VariableNumber
339
340
341
342 611
343 612 Bkt. V328 Family Well-offness Index - Uses Orshansky
344 613
345 614
346 615 Bkt. V331 Total 1967 Family Contractual Payments
347 616 Bkt. V332 Total 1967 Family Fixed Expenditures
348 617 Bkt. V333 Total 1967 Family Uncommitted Money Income
349
350
618 Bkt. V334 Total 1967 Family Food Consumption
619 Bkt. V335 Total 1967 Family Hours of Work(Work for Money Plus Unpaid Work)
TapeLocation Description
608 Bkt. V81 Total 1967 Family Money Income
609 Bkt. V322 Total 1967 Family Real Income
610 Bkt. V323 Total 1967 Family Real Income Net of Cost ofEarning Income
Bkt. V324 Total 1967 Family Real Income Net of Costsof Earning Income and Net of Housing Costs
Bkt. V329 Family Well-offness Index- Uses Ratio ofTotal 1967 Family Real Income Net of Cost of EarningIncome to Annual Family Need Standard
Bkt. V330 Family Well-offness Index - Uses Ratio ofTotal 1967 Family Real Income Net of Cost of EarningIncome and Net of Housing Costs to Annual Family NeedStandard

-291-
Variable TapeNumber Location
349 618
350 619
351 620
5.018.243.624.16.52.00.70.00.00.0
100.1
1.71.28.3
15.211.418.539.04.30.40.0
100.0
9.914.314.614.128.115.12.80.80.30.0
100.0
Description
Bkt. V334 Total 1967 Family food consumption
0. None1. $1-4992. $500-9993. $1000-19994. $2000-29995. $3000-49996. $5000-74997. $7500-99998. $10,000 or more9. N.A.
Bkt. V335 Total 1967 Family hours of work(Work for money plus unpaid work)
0. None1. $1-4992. $500-9993. $1000-19994. $2000-29995. $3000-49996. $5000-74997. $7500-99998. $10,000 or more9. N.A.
Bkt. V325 "Orshansky Ratio" (Full DetailVariant) Use V407
0 = -99.95-00.741 = 00.75-01.242 = 01.25-01.743 = 01.75-02.244 = 02.25-03.745 = 03.75-06.246 = 06.25-09.747 = 09.75-14.248 = 14.25-99.989 = 99.99 = N.A.

-292-
Variable TapeNumber Location
352 621
353 622
354 623
7.114.816.015.930.313.12.30.50.10.0
100.1
1.82.43.74.3
16.227.124.112.18.30.0
100.0
3.923.730.721.417.22.90.30.00.00.0
100.1
Description
Bkt. V326 Ratio of Total 1967 Family RealIncome net of cost of earning incometo Annual family need standard.Use V408
0 = -99.95-00.74l = 00.75-01.242 = 01.25-01.743 = 01.75-02.244 = 02.25-03.745 = 03.75-06.246 = 06.25-09.747 = 09.75-14.248 = 14.25-99.989 = 99.99 = N.A.
Bkt. V327 Ratio of total 1967 Family realincome net of cost of earning incomeand net of housing costs to 1967 familyfood standard. Use V410
0 = -99.95-00.741 = 00.75-01.242 = 01.25-01.743 = 0.75-02.24
4 = 02.25-03.745 = 03.75-06.246 = 06.25-09.747 = 09.75-14.248 = 14.25-99.989 = 99.99 = N.A.
Bkt. V336 Ratio of total 1967 family foodconsumption to 1967 family foodstandard
0 = -99.95-00.741 = 00.75-01.242 = 01.25-01.743 = 01.75-02.244 = 02.25-03.745 = 03.75-06.246 = 06.25-09.747 = 09.75-14.248 = 14.25-99.989 = 99.99 = N.A.

-293-
VariableNumber
TapeLocation
355 624 Bkt. V337 1967 Hourly earnings - HEAD
356 625 Bkt. V338 1967 Hourly earnings - WIFE
1.44.18.29.49.99.9
17.715.86.6
17.1100.1
Description
0. Less than .501. .50-.992. 1.00-1.493. 1.50-1.994. 2.00-2.495. 2.50-2.996. 3.00-3.997. 4.00-5.998. 6.00-99.989. 99.99, did not work
1.4 0. Less than .503.2 1. .50-.996.4 2. 1.00-1.496.4 3. 1.50-1.995.1 4. 2.00-2.493.8 5. 2.50-2.992.6 6. 3.00-3.991.9 7. 4.00-5.990.9 8. 6.00-99.9868.2 9. 99.99, did not work99.9

-294-
Variable TapeNumber Location
355 624
356 625 Bkt. V338 1967 Hourly Earnings - WIFE
357 626-628
358 629
15.5
39.8
14.7
7.1
4.5
3.3
2.0
1.5
6.8
4.9100.1
359 630
53.2
Description
Bkt. V337 1967 Hourly Earnings - HEAD
Difference between Age at Birth of First Child and Ageat Marriage - HEAD
xxx Difference in years-xx First child before marriage098 Inap, Never married; never had any children
099 N.A. whether currently married; N.A. when firstmarriage; N.A. whether had children ; N.A. whenfirst child was born
Bkt. V357 Difference between Age at Birth of First Childand Age at First Marriage - HEAD
0. (-99 to -2) First child born 2 or more years beforefirst marriage.
1. (-1 to 4-l) First child 1 year before marriage to1 year after marriage.
2. (2) First child 2 years after first marriage
3. (3) First child 3 years after first marriage
4. (4) First child 4 years after first marriage
5. (5) First child 5 years after first marriage
6. (6) First child 6 years after first marriage
7. (7) First child 7 years after first marriage
8. (8-97) First child 8 or more years after firstmarriage
9. (98-99) Never married or never had any children;N.A. whether currently married; N.A. when firstmarried; N.A. whether had children; N.A. when firstchild was born
WHETHER RESERVE FUNDS (Q. D6) Do you (FAMILY) have anysavings, such as checking or savings accounts, or govern-ment bonds? (IF YES) (Q. D7) Would they amount to asmuch as two months' income or more? (Q. D8) (IF NO) Wasthere a time in the last five years when you had as muchas two months' income saved up?
1. Had savings in early 1968 that amounted to as much astwo months' income OK more ("Yes" to both D6 and D7)
CONTINUED ON NEXT PAGE

-295-
Variable TapeNumber Location Description
359 630 11.5(cont.)
6.9
9.6
16.3
2.499.9
360 631 Sex and Marital Status
8.7
20.1
71.5
0.3100.6
361 632
24.1
29.1
30.0
16.8100.0
2.
3.
Had savings in early 1968 that did not amount toas much as two months' income or more but did inpast. ("Yes to D6, "No" OK "N A " to D7. . , and "Yes"to DS)
Had savings in the past five years that amounted toas much as two months' income OK more but did nothave any savings in early 1968. ("No" or "N.A."to D6 and "Yes" to D8),
4. Had savings in early 1968, but did not amount toas much as two months' income or more, and neverin the past five years had that much. ("Yes" toD6 and "No" OK "N.A." to D7, and "No" OK "N.A,"to D8)
5. Did not have any savings in early 1968, and neverin the past five years had savings that amountedto as much as two months' income. ("No" OK "N.A."to D6, and "No" to D8)
9. N.A. whether have any savings in early 1968 andN.A. whether had any savings in the past five years,or combinations other than l-5 above.
1. Single man
2. Single woman
3. Married couple with wife present
9. N.A.
Bkt. on V93 Region Where Family Lived at time of1968 Interview
1. Northeast
2. North Central
3. South
4. West
CONTINUED ON NEXT PAGE

-296-
VariableNumber Location Description
361 632 Region Where Family Lived at Time of 1968 Interview(cont.) (Detailed state-by-state code)
STATE CODE
Region StateCode Code (V93)
3
4
2
2
2
2
3
3
1
3
1
2
2
3
2
4
2
4
1
14
CONTINUED ON NEXT PAGE
01 Alabama
50 Alaska (not in SRC Sample)
02 Arizona
03 Arkansas
04 California
05 Colorado
06 Connecticut
07 Delaware
08 District of Columbia
09 Florida
10 Georgia
51 Hawaii (not in SRC Sample)
11 Idaho
12 Illinois
13 Indiana
14 Iowa
15 Kansas
16 Kentucky
17 Louisiana
18 Maine
19 Maryland
20 Massachusetts
21 Michigan
22 Minnesota
23 Mississippi
24 Missouri
25 Montana
26 Nebraska
27 Nevada
28 New Hampshire
29 New Jersey
30 New Mexico

-297-
VariableNumber
361(cont.)
Location
632
362 633
22.729.232.68.90.00.00.06.5
99.9
Description
STATE CODE - (cont.)
Region StateCode Code (V93)
1 31 New York
3 32 North Carolina
2 33 North Dakota
2 34 Ohio
3 35 Oklahoma
4 36 Oregon
1 37 Pennsylvania
1 38 Rhode Island
3 39 South Carolina
2 40 South Dakota
3 41 Tennessee
3 42 Texas
4 43 Utah
1 44 Vermont
3 45 Virginia
4 46 Washington
3 47 West Virginia
2 48 Wisconsin
4 49 Wyoming
Bkt. V311 State or Country Where Head Grew Up
Region Where Head of Family Grew Up
1. Northeast2. North Central3. South4. West5. Alaska, Hawaii6. English speaking foreign countries7. Non-English speaking foreign countries9. N.A.
This is the summary code. See V311 for region codedetails, and V361 for state code details.
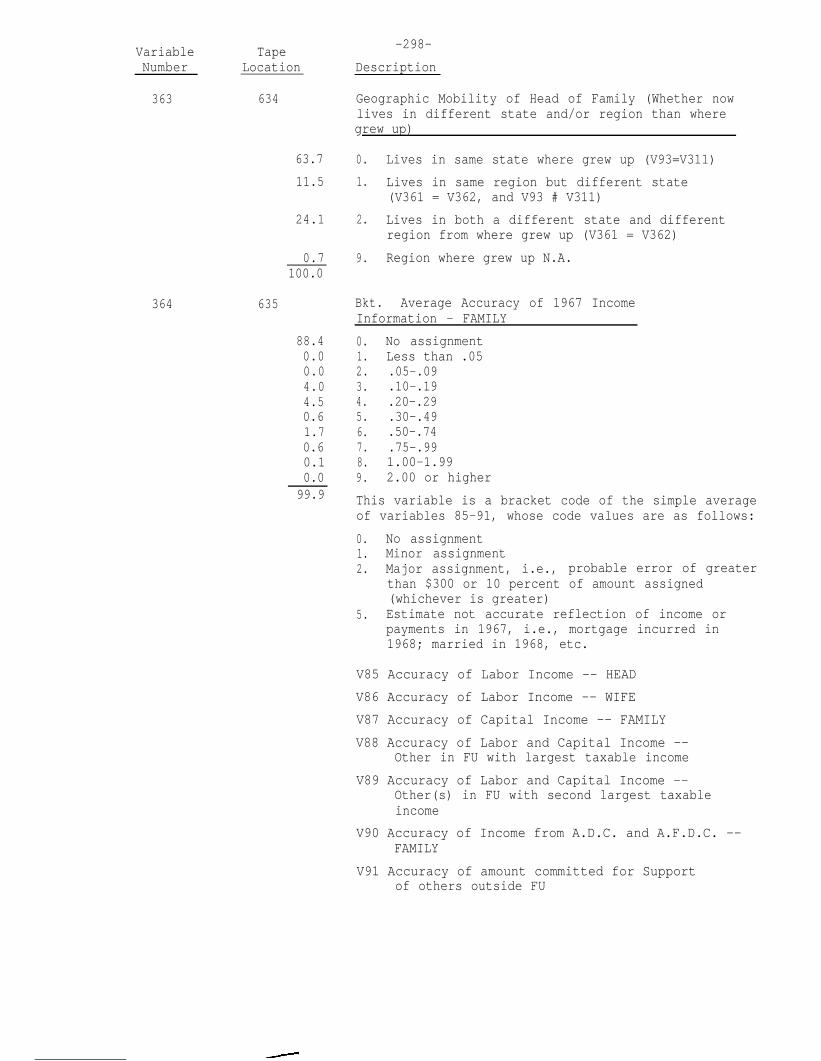
VariableNumber
TapeLocation
363 634
63.7
11.5
24.1
0.7100.0
364 635
88.40.00.04.04.50.61.70.60.10.099.9
-298-
Description
Geographic Mobility of Head of Family (Whether nowlives in different state and/or region than wheregrew up)
0. Lives in same state where grew up (V93=V311)
1. Lives in same region but different state(V361 = V362, and V93 # V311)
2. Lives in both a different state and differentregion from where grew up (V361 = V362)
9. Region where grew up N.A.
Bkt. Average Accuracy of 1967 IncomeInformation - FAMILY
0. No assignment1. Less than .052. .05-.093. .10-.194. .20-.295. .30-.496. .50-.747. .75-.998. 1.00-1.999. 2.00 or higher
This variable is a bracket code of the simple averageof variables 85-91, whose code values are as follows:
0. No assignment1. Minor assignment2. Major assignment, i.e., probable error of greater
than $300 or 10 percent of amount assigned(whichever is greater)
5. Estimate not accurate reflection of income orpayments in 1967, i.e., mortgage incurred in1968; married in 1968, etc.
V85 Accuracy of Labor Income -- HEAD
V86 Accuracy of Labor Income -- WIFE
V87 Accuracy of Capital Income -- FAMILY
V88 Accuracy of Labor and Capital Income --Other in FU with largest taxable income
V89 Accuracy of Labor and Capital Income --Other(s) in FU with second largest taxableincome
V90 Accuracy of Income from A.D.C. and A.F.D.C. --FAMILY
V91 Accuracy of amount committed for Supportof others outside FU

VariableNumber
TapeLocation
365 636
75.20.0
11.64.44.33.30.60.50.2
-299-
Description
Bkt. Average Accuracy of 1967 FinancialInformation Other than Income -- FAMILY
0. No assignment1. Less than .052. .05-.093. .10-.194. .20-.295. .30-.496. .50-.747. .75-.998. 1.00-1.999. 2.00 or higher
This variable is a bracket code of the simpleaverage of the variables listed below whose codevalues are as follows:
0. No assignment1. Minor assignment2. Major assignment ; probable error of greater
than $300 or 10 percent of amount assigned(whichever is greater)
3. Complex property - the reported house valueincluded farm or business property, but imputedrent and housing payments were computed on thebasis of the estimated portion of property usedfor housing
5. Estimate not an accurate reflection of incomeor payments in 1967
v7
v319
V321
v9
V11
v13
Accuracy of House Value and Property Taxes
Accuracy of Mortgage
Accuracy of Net Equity and Inputed Rent
Accuracy of 1967 Mortgage Payments
Accuracy of 1967 Rent Payments
Accuracy of 1967 Rent Value for those whoneither own nor rent
v15 Accuracy of 1967 Cost of Utilities
v19 Accuracy of 1967 Additions and Repairs Payments
v21 Accuracy of 1967 Car Insurance Payments
V23 Accuracy of 1967 Car Debt Payments
v29 Accuracy of 1967 Payments on "Other Things"
v34 Accuracy of 1967 Alcoholic Beverages Bill
V36 Accuracy of 1967 Cigarette Bill
V38 Accuracy of 1967 Total Food Bill

-300-
Variable TapeNumber Location Description
366 637 Accuracy of Hours Variables -- FAMILY
See V364 for bracket code.
This variable is a bracket code of the simpleaverage of the variables listed below whosecode values are as follows:
68.7 0. No assignment0.0 1. Minor assignment14.7 2. Major assignment; probable error of greater9.8 than $300 or 10 percent of assignment value3.4 (whichever is greater)
4. Work done by someone other than Head or Wife5. Estimate not an accurate reflection of income
or payments in 1967
V27
V48
v50
V52
v54
V56
V58
V60
V62
V64
V66
V68
v70
Accuracy of 1967 hours spent on car repairs
Accuracy of 1967 hours of work for money-- HEAD
Accuracy of 1967 hours of unemployment -- HEAD
Accuracy of 1967 hours of illness -- HEAD
Accuracy of 1967 hours of work for money-- WIFE
Accuracy of 1967 hours of child care-- FAMILY
Accuracy of 1967 free help from others --FAMILY
Accuracy of 1967 family housework hours-- FAMILY
Accuracy of 1967 hours of home
Accuracy of adjustment factor forSingle Head of Household
Accuracy of 1967 Sum of HOUrS on whichLeisure Ratio Based -- FAMILY
Accuracy of 1967 HOUrS of Other #lWork for Money
Accuracy of 1967 Hours of Other #2Work for Money

-3Ol-
Variable TapeNumber Location
366 637
68.7 0.0.0 1.
14.7 2.
9.8 3.3.4 4.
2.8 5.
0.50.00.00.0
99.9
Description
Accuracy of Hours Variables -- FAMILY
6.7.8.9.
No assignmentLess than .05 - minor assignment.05-.09 - major assignment; probable error ofgreater than $300 OK 10 percent of assignementvalue (whichever is greater).10-.19.20-.29 - work done by someone other than Heador Wife.30-.49 - estimate not an accurate reflectionof income OK payments in 1967.50-.74.75-.991.00-1.992.00 OK higher
V27
V48
v50
V52
v54
V56
V58
V60
V62
V64
V66
V68
v70
Accuracy of 1967 hours spent on car repairs
Accuracy of 1967 hours of work for money - HEAD
Accuracy of 1967 hours of unemployment - HEAD
Accuracy of 1967 hours of illness - HEAD
Accuracy of 1967 hours of work for money - WIFE
Accuracy of 1967 hours of child care - FAMILY
Accuracy of 1967 free help from others - FAMILY
Accuracy of 1967 family housework hours - FAMILY
Accuracy of 1967 hours of home
Accuracy of adjustment factor for Single Headof household
Accuracy of 1967 Sum of Hours on which LeisureRatio Based - FAMILY
Accuracy of 1967 Hours of Other #1Work for Money
Accuracy of 1967 Hours of Other #2Work for Money

-302-
Variable TapeNumber Location Description
367 638 Bkt. Average Accuracy of 1967 Income Creation Items
75.3 0.0.0 1.0.0 2.19.2 3.0.0 4.4.0 5.1.2 6.0.2 7.0.1 8.0.0 9.
100.0
No assignmentLess than .05.05-.09.10-.19.20-.29.30-.49.50-.74.75-.991.00-1.992.00 or higher
This variable is a bracket code of the simpleaverage of the variables listed below whosecode values are as follows:
0. No assignment1. Minor assignment2. Major assignment; probable error of greater
than $300 or 10 percent of assigned value(whichever is greater)
4. Work done by someone other than head or wife5. Estimate not an accurate reflection of
income or payments in 1967
V17 Accuracy of value of Additions and Repairsdone by Family
V25 Accuracy of value of Car Repairs done byFamily
V40 Accuracy of value of Home Grown Food ofFamily
V42 Accuracy of value of clothes made and/ormended by Family
V44 Accuracy of value of food received as partof pay by Family
V46 Accuracy of value of free food, clothingOK food stamps received by Family

-303-
Variable TapeNumber Location
368 639
Description
Bkt. V117 Age of Head of Family
9.317.821.4l8.916.010.95.50.1
99.9
369 640 Bkt. V118 Age of Wife of Head of Family
9.615.417.713.09.34.71.10.2
29.0100.0
1. Under 252. 25-343. 35-444. 45-545. 55-646. 65-747. 75 or older9. N.A.
1. Under 252. 25-343. 35-444. 45-545. 55-646. 65-747. 75 or older9. N.A.0. Inap., no wife

-304-
VariableNumber
370
TapeLocation
641-642
371 643
372 644 Bkt. on Difference in Age between Head and Wife
19.925.123.213.910.65.51.7
0.099.9
0.3
1.6 1.
3.4
3.9 3.7.6 4.8.6 5.
24.6 6.15.0 7.5.4 a.
29.6100.0
Description
Average Age of Head and Wife (In Years)
This Variable is the simple average of V117(age of Head), v118 (age of Wife). If v118=00(no wife), age of Head is recorded again.
36. Average age of Head and Wife = 36; or nowife present, and Head is 36 years old.
Bkt. v370 Average Age of Head and Wife
1. Under 25 (Do not use this code2. 25-34 where there is no wife.)-3. 35-444. 45-545. 55-646. 65-747. 75 or older
9. N.A.
V117 (Age of Head) minus V118 (Age of Wife)
0.
2.
9.
(-98 to -10) Husband is 10 or more yearsyounger than wife(-9 to -5) Husband is between 5 and 9 yearsyounger than wife(-4 to -2) Husband is between 2 and 4 yearsyounger than wife(-1) Husband is 1 year younger than wife(0) Husband and wife the same age(+l) Husband 1 year older than wife(+2 to +4) Husband 2 to 4 years older than wife(+5 to +9) Husband 5 to 9 years older than wife(+10 to +19) Husband 10 to 19 years olderthan wife(20-99) Husband 20 or more years older thanwife; or no wife.

VariableNumber
373
374
375
376
TapeLocation
645-649
650
2.37.3
26.524.519.09.47.42.31.3
100.0
651 Brackets on Value of All Cars Owned (V145)
20.026.815.223.99.12.61.20.60.00.4
99.8
652 Number correct Word-to-picture test (V195)
0.10.30.30.50.81.0
97.0100.0
-305-
Description
Average Value Per Room in Dwelling Unit
For Homeowners: V5 House Value/102 Number of rooms in DU
*For Renters: 10 x V11 Annual Rent/102 Number of rooms in DU
*For Those whoneither ownnor rent: 10 x v12 Rental Value
v102 Number of rooms in DU
xxxx . Coded in Dollars
*(Calculated value assumes that value of DU isapproximately 10 times its annual rental value)
Bkt. v373 Average Value per Room in Dwelling Unit
1. Less than $5002. $500-9993. $1000-19994. $2000-29995. $3000-39996. $4000-49997. $5000-7499a. $7500 to 99,9989. N.A.
0. Family owns no cars1. Less than $5002. $500-9993. $1000-19994. $2000-29995. $3000-39996. $4000-49997. $5000-7999a. $8000-99989. N.A.
0. 0-51. 6-92. 10-113. 124. 135 . . 14 (all correct>
9. Refused to take test or did not takereason (99); or test not assigned to
for some otherfamily (98)

-306-
Variable Tape Number Location
377 653
378
379 655 Bkt. Age when Head of family married (V240)
380 656 Bkt. Age of head at Birth of First Child (V138)
381 657
88.4 0.1 0.1 0.3 0.5 1.0 2.4 2.6 2.5 2.1
100.0
654
1.3 4.9
13.7 19.2 26.9 14.5
6.4 1.9 3.3 7.9
100.0
0.6
1.0 4.3 9.8
22.6 23.8 19.1 11.0 6.5 1.3
100.0
Description
Bkt. Annual Head Might Earn per hour on Another Job (V210)
0. Inap., question not asked 1. $.01-.99 2. $1.00-1.49 3. $1.50-1.99 4. $2.00-2.49 5. $2.50-2.99 6. $3.00-3.99 7. $4.00-5.99 a. $6.00 or more 9. N.A.
Bkt. Hourly wage of Jobs not Worth Taking -- Head (V238)
See Code for Variable 377 above.
1. Under 16 2. 16-17 3. la-19 4. 20-21 5. 22-25 6. 26-30 7. 31-39 a. 40 or older 9. N.A. 0. Inap., not married
See code for Variable 379 above.
Actual minus Required Rooms for family of this size, age and sex composition (V102, V124)
0. -3 or less (DU has 3 fewer rooms than required)
1. -2 2. -1 3. 0 (actual number of
rooms equals required number
4. +1 5. +2 6. +3 7. +4 a. +5 or more 9. N.A.
NOTE: Actual number
of rooms only coded
through 8, required
number of rooms through 9; therefore, range is
actually -8 to +7

.
-307-
VariableNumber
382
383
384
385
TapeLocation Description
658-660 Persons Per Room
661
09.8 = Family has no room of its own
09.9 N.A.
Otherwise WITH ONE DIGIT AFTER DECIMAL
Race and Sex of Head
70.0 0. White male
9.2 1. Non-white male
16.9 2. White female
3.9 3. Non-white female100.0
662 Employment Problems of Head
One point for each of these:
663 Background Problems of Head
Lost his previous job (V201 = l-3)
Had more than five employers in last ten years(V203 = 6-8)
Turned down a job rather than move (V205 = 1)
Serious illness or accident in last three years(V215 = l-2)
Serious unemployment in last three years(V219 = l-2)
Would have trouble getting another job,for explicit reasons (V214 = 1)
Grew up on a farm (V312 = 1)
Completed less than 6 grades, and has difficultyreading (V313 = 0)
Parents were poor (V317 = 1)
Age <20 at birth of first child TL656 = l-3(v380 = 1-3)

-308-
Variable TapeNumber Location
386
387
Description
664 Current Handicaps of Head
665
No reading matter visible in DU to interviewer(V184 = 5)
Many (6 or more) questions had to be repeated(V185 = 3-5)
Many (6 or more) answers had to be repeated(V186 = 3-5)
Head has disfigurements or dysfunctional habits(V187 = 1)
Family lives 30 miles or more from the nearest cityof 50,000 or more (V189 = 4-5)
Head has disabilities that limit work (V216 = 1-3)
Head has dependents outside his DU (V278 = 1-5)
Family has relatives they might have to help more(v279 = 1)
NOTE: This code has values from 0 through 8. Noadditional points have been given for moredependents, or more serious disabilities,or extreme incoherence, since they are sorare.
Housing Quality (Dwelling Unit and Neighborhood)
See V418 for a revised version of this variable.
Family owns its own home (V103 = 1)
Family does not share dwelling with anotherfamily (V114 = 1, 2, 5-7)
Family owns car or causes no difficulties not tohave a car. (V140 = 1 or 5)
DU is less than 15 miles from center of city of50,000 or more (but not within 5 miles of center)(v189 = 2)
Live in a single family house (V190 = 1)
Neighborhood contains only single family houses(V192 = 2)
Interviewer noted no housing defects (V194 = 5)
House value (or 10 times annual rent) equals $2000or more per room (V374 = 4-8)
Number of rooms equal to or greater than numberrequired (V381 = 4-9)

-309-
Variable Tape Number Location
388 666
Description
Sense of Efficacy
See V419 for a revised version of this variable.
[ Not unsure life would work out (V295 = 1, 2, 3, 9) Sure life would work out (V295 = 1-2)
Some planning [
(V296 = 1, 2, 3, 9) Plans ahead (V296 = 1-2)
Doesn't fail to carry out things (V297 = 1, 2, 3, 9) Get to carry out things as expected (V297 = 1-2)
Not dissatisfied with self (V302 = 1, 2, 3, 9) Satisfied with self (V302 = 1-2)
No limitations seen for self (V303 = 3, 5, 9)
389
390
667 Trust in Others
See V420 for a revised version of this variable.
Neither likes nor dislikes a job where told what to do (V213 = 2-4, 9)
Would not have trouble getting another job (V214 = 5)
Is not concerned with what others think (V305 = 0-2)
Trusts other people (V306 = O-2)
Thinks life of average man is getting better (V309 = 0-2)
Thinks there are not many who have things they don't deserve (V310 = 4, 5)
668 Ambition (Verbal aspiration expressed)
See V423 for a revised version of this variable
Plans to move (purposive move) (v112 = 1-3)
Has high educational aspirations for children (V137 = 1-3)
Says it is important to make own decisions on a job (v199 = 1-2)
Is willing to move for even a moderately better job (V207 = 1-3)
Has plans to try for a new job (V208 = 1)
Doesn't like a job where told what to do (V213 = 4-5)
Wanted to work more hours than did (V231 = 1) Did not want to work fewer hours than did
(neutralizes the Inaps.) (V233 # 1)
Expects things to happen for better (V277 = 1)
Likes to do things difficult or challenging (V299 = 1, 2)
V390 CONTINUED ON NEXT PAGE
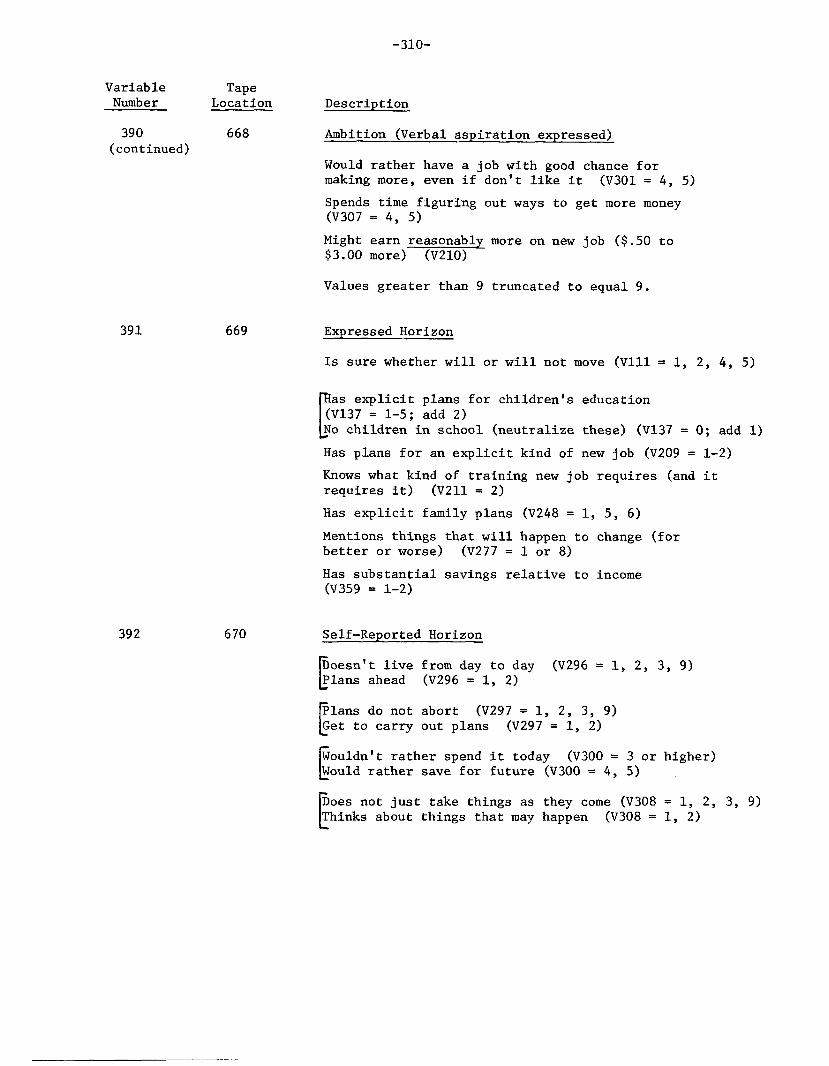
-310-
Variable Tape Number Location Description
390 668 Ambition (Verbal aspiration expressed) (continued)
Would rather have a job with good chance for making more, even if don't like it (V301 = 4, 5)
Spends time figuring out ways to get more money (V307 = 4, 5)
Might earn reasonably more on new job ($.50 to $3.00 more) (V210)
Values greater than 9 truncated to equal 9.
391
392
669 Expressed Horizon
Is sure whether will or will not move (V111 = 1, 2, 4, 5)
as explicit plans for children's education (V137 = l-5; add 2) No children in school (neutralize these) (V137 = 0; add 1)
Has plans for an explicit kind of new job (V209 = l-2)
Knows what kind of training new job requires (and it requires it) (V211 = 2)
Has explicit family plans (V248 = 1, 5, 6)
Mentions things that will happen to change (for better or worse) (V277 = 1 or 8)
Has substantial savings relative to income (V359 = 1-2)
670 Self-Reported Horizon
Doesn't live from day to day (V296 = 1, 2, 3, 9) Plans ahead (V296 = 1, 2)
Plans do not abort (V297 = 1, 2, 3, 9) Get to carry out plans (V297 = 1, 2)
Wouldn't rather spend it today (V300 = 3 or higher) Would rather save for future (V300 = 4, 5)
Does not just take things as they come (V308 = 1, 2, 3, 9) Thinks about things that may happen (v308 = 1, 2)

-311-
Variable Tape Number Location
393 671
Description
Connectedness to potential sources of help
Went to a PTA meeting, within last year (V136 = 1-2) Neutralize those with no children in school (V136 = 0, 1, 2)
Attends church once a month or more (V284 = 2-5)
Watches television a lot (more than 1 hour per day) (v286 = 2-8)
Reads a newspaper once a week or more (V287 = 3-5)
Knows two or more neighbors by name (V288 = 2-8)
Knows six or more neighbors by name (V288 = 6-8)
Has relatives within walking distance of DU (v289 = 1)
Goes to organizations once a month or more (V292 = 2-5)
Goes to bar or tavern once a month or more (V293 = 2-5)
Belongs to a labor union and pays dues (V294 = 2-8)
Values greater than 9 truncated to 9.
394 672 Money Earning Acts (Current money earning behaviors)
Head works more than 2,000 hours (V47 2000)
Wife works more than 1,000 hours (v53 1000) Neutralize: No wife, or children under 4 (V239 1 -- no wife) OR(V120 = 1-3 -- child under 4) - Head self-employed and/or owns a business V198 = 2-3 or V250<5)
Moved to get a better job (V204 = 1)
Has done something about a better job (V212 = 1-3)
If Employed Head seldom or never late for work (V217 = 3-5)
Head rarely or never fails to go to work when not sick (V218 = 4-5)
Head has extra jobs (or ways of making money) (V227 = 1, 3, 4)
Unemployed Has name in several places for a job (V235 = 2-4) or Retired Has applied to 2 or more places in last 2 weeks
V236=2-4 Low reservation price: no jobs not worth taking, or they pay less than $1.50 per hour V238 4 150)

-312-
Variable Tape Number Location
395
396
Description
673 Real Earning Acts (non-money, or investment for future)
674
Saved more than $100 doing own additions and repairs (V16 > 0100, add 2; V16 40100, add 1)
Saved more than $100 by growing own food (V39 >100)
Saved more than $100 by sewing (v41> 100)
Spends time on other productive activities (V280 = 4-5) Spends time on other productive activities (V281 = 4-5)
Taking courses or lessons with earning possibilities (v285 = 3-5)
Saved more than $100 on car repairs (V24 > 100; add 2)
Neutralize non-owners (V143 =0; add 1)
COMMENT : The above items were made into a separate index from the income increasing behaviors more directly related to regular jobs, because they may actually be substitutes for increasing money earnings by working more on the main job.
Economizing
Received free help from others inside or outside the house for more than 100 hours (V57 > 100)
Does not own a recent year model car (1966-68) (V144 = 66, 67, 68)
Spends less than $150/year on alcohol (v33 < $150)
Spends less than $150/year on cigarettes (v35 < $150)
Eat out less than once a week (V1624 2)
Reports special ways of keeping food bill down (V171=O) (V172=O)
Family eats together most or all the time (V174 = 3-4)
Report special ways of saving on clothing (v175 = 0) (V176 = 0)

-313-
Variable Tape Number Location
397 675
398 676 Number of Children Under 18 Living with Family
14.8 1. One 15.0 2. Two
9.8 3. Three 5.2 4. Four 2.6 5. Five 1.5 6. Six 0.7 7. Seven 0.3 a. Eight 0.4 9. Nine or more
49.6 99.9
Description
Risk Avoidance
At least one car in good condition (V146 = 1)
Worst car not in poor condition (also neutralizes non-owners) (v147 = 5)
All cars insured (V149 = 1)
Has no uninsured car (neutralizes non-owners who get a point) (v149 = 3-5)
Head has seat belts fastened all the time (V153 = 1; add 2)
Head has seat belts fastened part of the time (V153 = 3; add 1)
Neutralize the non-owners (V152 = 0; add 1)
Head insured, or family can get free medical care (v158 = 1-3, 5, 7)
Family does not smoke more than 17 cigarettes a day (v169 = O-2)
Family has some savings (V359 = 1, 2, or 4)
Values greater than 9 truncated to 9.
0. None; N.A. how many

-314-
Variable TapeNumber Location Description
399 677-680 Ratio of Family Money Income to Family Money Needs:SSA Economy Level (70% Farm Family Cutoffs)
XX.XX This Social Security Administration definition isbased on the economy level food budget, which was thesame definition that was applied to the 1967 CPS data.The cutoffs are unaltered even to take account of pricechanges. Economies of scale are related to family size,although the definition assumes that the marginal costfor additional family members beyond 7 is zero. Incorpor-ated in the definition are adjustments for the sex of thehead and the ages of family members. For farm families,those whose heads indicate that farming is their firstor second job, the cutoff is .7 x nonfarm values.
400 681-684 Ratio of Family Money Income to Family Money Needs:SSA Economy Level (80% Farm Family Cutoffs)
XX.XX This variable is identical to V399 except that thecutoff for farm families is .8 x nonfarm values.
401 685-688 Ratio of Family Money Income to Family Money Needs:SSA Low-Cost Level (70% Farm Family Cutoffs)
XX.XX This definition is identical in structure to V399,but allows a higher money need per person. Incontrast to the economy-level definitions (V399-400),the cutoffs here have been adjusted upward from the 1967level to reflect price changes. The cutoff for farmfamilies is .7 x nonfarm values.

-315-
Variable TapeNumber Location Definition
402 689-692 Ratio of Family Money Income to Family Money NeedsSSA Low-Cost Level (80% Farm Family Cutoffs)
403 693-696 Ratio of Family Money Income to Family Money NeedsModified SSA Economy Level (70% Farm Family Cutoffs)
XX.XX This definition differs in two ways from V399. First,it rests on a 1965 food expenditures survey and, second,it assumes that the marginal cost of additional familymembers becomes zero after the 11th member, rather thanthe 7th. There are a larger number of poor when thisdefinition is used because the extension of the rangein which family members have a positive marginal cost,and because of the higher cutoffs resulting from the1965 food expenditure survey, which showed the ratioof food expenditure to total needs to be less than 1/3,the ratio developed from the 1955 survey.
404 697-700
XX.XX
Ratio of Family Money Income to Family Money NeedsModified SSA Economy Level (80% Farm Family Cutoffs)
405 701-704 Ratio of Family Money Income to Family Money NeedsModified SSA Low-Cost Level (70% Farm Family Cutoffs)
This definition differs from V401 in the same waythat the modified SSA economy-level definitiondiffers from V399.
406 705-708
xX.xX
Ratio of Family Money Income to Family Money NeedsModified SSA Low-Cost Level (80% Farm Family Cutoffs)

-316-
Variable TapeNumber Location Definition
The following bracket code is used for variables 407-409.
0. Less than .401. .40 - .792. .80 - 1.193. 1.20 - 1.594. 1.60 - 1.995. 2.00 - 2.396. 2.40 - 2.997. 3.00 - 3.99a. 4.00 - 5.999. 6.00 or higher
407
408
409
410 712
411
709
710
711
713
Bkt. on V325: "Orshansky Ratio"
Bkt. on V326: Ratio of Total 1967 Family Real Income Netof Cost of Earning Income to Annual Family Need Standard
Bkt. on V399: Ratio of Family Money Income to FamilyMoney Needs: SSA Economy Level (70% Farm Family Cutoffs)
Bkt. on 88327: Ratio of Total 1967 Family Real IncomeNet of Cost of Earning Income and Net of Housing Coststo 1967 Family Food Standard
0. -9.99 - 0.991. 1.00 - 1.992. 2.00 - 2.993. 3.00 - 3.994. 4.00 - 4.995. 5.00 - 5.996. 6.00 - 7.497. 7.50 - 9.99a. 10.00 - 14.999. 15.00 or higher
Bkt. on 8V382: Persons per Room
0. Under 00.31. 0.3 - 0.42. 0.5 - 0.63. 0.7 - 0.84. 0.9 - 1.25. 1.3 - 1.66. 1.7 - 2.07. 2.1 - 3.0a. 3.1 - 9.89. 09.9 or higher; N.A.

-317-
Variable TapeNumber Location Definition
Variables 412-417 are employment and income characteristicsof the county in which the family was interviewed in 1968.The value of each variable is a constant for everyone inthat county. Data from variables 412-414 are derivedfrom questionnaires sent to one state unemploymentcompensation commissioners asking them about the samplecounties in their state.
412
413
414
415
714
715
716
717
Whether Surplus or Shortage of Unskilled TemporaryLabor in County
1. Many more jobs than there are applicants2. More jobs than applicants3. Most people are able to find jobs4. A number of unskilled workers unable to find jobs5. Many unskilled workers unable to find jobs9. N.A.
Average hourly wage in county for unskilled temporarylabor
1. Under $1.502. $1.50 - 1.993. $2.00 - 2.494. $2.50 - 2.995. $3.00 - 4.009. N.A.
County Unemployment Rate, Spring 1968
1. Under 2%2. 2-3.9%3. 4-5.9%4. 6-10%5. Over 10%9. N.A.
Public Welfare, 1962 Per Capita Expenditure in County- (In Dollars). Census of Governments 1962,Summary - Table 28
1. 00.00 - 00.412. 00.42 - 01.093. 01.10 - 02.794. 02.80 - 04.995. 05.00 - 08.996. 09.00 - 15.997. 16.00 - 29.99a. 30.00 - 79.999. N.A.

-318-
VariableNumber
TapeLocation Definition
416 718 Per Student Public 1962 Public School Expendituresin County (dollars per year). Census of Governments,Summary - Table 28
1. 100 - 1792. 180 - 2193. 220-2544. 255 - 2855. 286 - 3096. 310 - 3197. 320 - 3448. 345 - 3899. 390 - 599
417 719Percent Employment Change in County, 1962-1967,County Business Paterns, Summary Tables
1. -20 - 112. 12-163. 17 - 224. 23-265. 27-316. 32-367. 37-618. 62-2009. N.A.

Variable TapeNumber Location
418 720
419
420 722
721
-319-
Description
Housing and Neighborhood Quality Redone (Revised V387)
Owns home
Live 5-30 miles from center of city
v103=1
of 50,000 or more
Single Family home
Neighborhood of Single Family Houses
Value per room Value = (10 x rent for
V189=2,3
v190=1
v192=2
non-owners) 2000 V374=4-8
Actual - Required rooms V381=5-9
No visible defects v194=5
Omits:
Car Lack FeltShare Dwelling (Hard to Determine)
Changes: Distance to Center, Surplus of Rooms
Reported Efficacy and Planning (Revised V388 and V392)
Sure Life Would Work Out
Plans Life Ahead
Gets to Carry Out Things
Finishes Things
Rather Save for Future
Has No Limitations /
Thinks About Things That Might Happenin Future
v295=1
V296=1
V297=1
V298=1
V300=5
V303=1
V308=1
Trust or Hostility (Revised V389)
Does not get angry easily V304=5
Matters What Others Think V305=4,5
Trusts Most Other People V306=1
Believes Life of Average Man Getting Better V309=1
Believes Not a Lot of People Who Have GoodThings They Don't Deserve v310=5
Omits:Indifference to job where told what to doNo trouble getting another job
(Self-perceived limitations moved to "Efficacy")

-320-
Variable Tape Number Location
423 725
421* 723*
422* 724*
427
424"
425"
729
726*
Real Earning Acts
Saved more than $75 on additions and repairs (Neutralize non-owners who did not save $75)
727* Saved more than $75 growing own food
Description
Aspiration-Ambition (Revised V390)
Might make purposive move v112=1,2
Wanted more work and/or worked > 2500 hours V231=1 V47 > 2500 2 points
Neutralize Inaps. and/or
Likes to do difficult or challenging things Prefers a job with chances for making more money even if dislikes job
Dissatisfied with self Spends time figuring out how to get more money
Plans to get a new job, and knows what type of job, and knows what it might pay
Neutralize Inaps. and one point for plans for job regardless of details
*Subvariable
Omits:
Educational aspirations for children
Important to make own decisions on job Doesn't like job where told what to do Willing to move for moderately good job
Expects things to change for better
v299=1
v301=5 V302=5
v307=5
V208=1 and V209=1-4 and V210=999 or 000
V208<5
V16 > 075 V167 075 V103=5,8
v397 075 v397 075 (2 points)

-321-
Variable TapeNumber Location
426* 728*
Description
Saved more than $75 on car repairs(Neutralize non-owners)
V24 > 075V24 > 075V143=0
Taking courses or lessons with economicpotential V285=3-5
Spends spare time productively (added) V280=4,5
Omits:Saved on sewing
*Subvariable
1968
V33 < 150
V35 < 150
V57 > 100
V144=66, 67, or 68
Vl62=0,1
V174=3,4
432 734
428 730
429 731
430 732
431 733
Economizing
Spend less than $150 a year on alcohol
Spend less than $150 a year on cigarettes
Received more than 100 hours of free help
Do not own very new car (in 1969) /
Eat out seldom
Eat together most of time
Omits:
Reported ways of keeping food bill downReported ways of saving on clothing
434 736 Risk Avoidance
Has at least one car in good condition Vl46=1
No car V1+6=0
All cars are insured V149=1
Uses seat belts some of the time V153=3(Neutralize non-owners) V152=0
Uses seat belts all the time (2 points) V153=1
433 735 Has medical insurance or a way to getfree care
Head is not a heavy smoker (less thanone pack a day)
Have some liquid savings
Have two months income saved up
V158=1,2,3,5,7
V169=0-2
V359=1,2,4
V359=1

-322-
Variable TapeNumber Location Description
435 737-739 Square root of V328 using money income (3 digits)
436 740-742 Square root of V329, well-offness using realincome (3 digits)
437 743-745 Square root of V330, well-offness using realincome net of housing outlays relative tofood needs (3 digits)
438 746 Bkt. Wage rate on 2nd job
0. 0 or inap.1. Under $1.002. $1.00-1.493. $1.50-1.994. $2.00-2.995. $2.50-2.996. $3.00-3.997. $4.00-5.998. $6.00 or more9. N.A.
439 747-748 Weight
All analysis on the entire sample should be basedon weighted data, to reduce the biases fromdifferential sampling and response rates.
However, it is possible to use the SRC cross-section sample only, without weights, since theresponse rates did not vary so much as toproduce substantial biases.

-323-
DISTRIBUTION OF VARIABLES NOT PREVIOUSLY LISTED
VariableNumber
TapeLocation
124 297 Required number of rooms for a family like this
0.138.028.620.18.83.01.00.30.1
100.0
125 298 Education of children
126 299
93.63.81.40.40.10.00.00.00.00.6
99.9
89.67.42.00.20.10.00.00.00.00.7
100.0
Definition
1. One2. Two3. Three4. Four5. Five6. Six7. Seven8. Eight or more9. N.A.
Number of children who completed less than12 grades
0. None1. One2. Two3. Three4. Four5. Five6. Six7. Seven8. Eight or more9. N.A.
Number of children who completed exactly12 grades
0. None1. One2. Two3. Three4. Four5. Five6. Six7. Seven8. Eight or more9. N.A.

-324-
Variable TapeNumber Location
127 300 Education of Children (continued)
88.98.21.90.30.00.00.00.00.00.6
99.9
171 355 E12.
Definition
Number of children who completed more than12 grades
0. None1. One2. Two3. Three4. Four5. Five6. Six7. Seven8. Eight or more9. N.A.
43.1 0.1.4 1.
19.5 2.
1.0 3.
0.9 4.
14.0 5.
7.5 6.11.5 7.
0.4 8.0.7 9.
100.0
What special ways do you have for keepingthe food bill down?
No second mentionDon't eat much; try to eat lessTry to economize, buy in large quantities,buy bulk; watch for ads in paper, watch forspecials, bargains, sales, shop around thestores, buy from farmerHave an "in" - army PX, eat cheap atrestaurant where work; get discount ongroceries, buy co-opCoupons cut from papers; use coupons; foodstamps, welfare foodEat cheaper foods; e.g., potatoes, hamburgers,chicken; buy no luxuries, eat left-overs,don't waste what we buyDo own baking, canning, or freezingRaise or grow food; garden, have own milkraise a calf, pigs, or chickens, have fruittrees. Also do hunting and fishing ifindication of substantial savingYes, gifts of food, food from home, etc.N.A.

-325-
Variable TapeNumber Location
172 356 Special ways for keeping the food bill down (continued)
175 360
66.3 0.1.2 1.
18.1 2.
0.1
0.4
4.2
6.6 6.2.3 7.
0.60.2
99.9
48.6 0.4.9 1.
10.5 2.
5.1
1.41.8
11.413.6
2.4
0.299.9
Description
Anything else?
3.
4.
5.
8.9.
No or no second mentionDon't eat much; try to eat lessTry to economize, buy in large quantities,buy bulk; watch for ads in paper, watchfor specials, bargains, sales, shop aroundthe stores, buy from farmer
Have an "in" - army PX, eat cheap atrestaurant where work; get discount ongroceries, buy co-op
Coupons cut from papers; use coupons; foodstamps, welfare food
Eat cheaper foods; e.g., potatoes, hamburgers,chicken, buy no luxuries, eat left-overs,don't waste what we buy
Do own baking, canning, or freezingRaise or grow food; garden, have own milk,raise a calf, pigs, or chickens, havefruit trees. Also do hunting and fishing ifindication of substantial saving
Yes, gifts of food, food from home, etc.N.A.
Do you have any special ways of saving on clothingcosts?
3.
4.5.6.7.
8.
9.
No, or no second mentionJust do not buy much, keep it cleanYes, buy economically, shop in larger cities,shop for sales or bargains, seasonal shoppingat end of season
Yes, shop at discount stores, hand-me-downs;buy used clothing
Yes, discount on clothing because of employmentYes, mendingYes, sewing, alterations, makes some clothesYes, make a lot of own clothes, "Wife sewsfor all our daughters," etc.
Yes, gifts of clothing, clothes sewn bysomeone else (outside FU) NOTE: THIS IS NOTTHE HIGHEST PRIORITY CODE. PLACE LOWER THAN 1.
N.A.
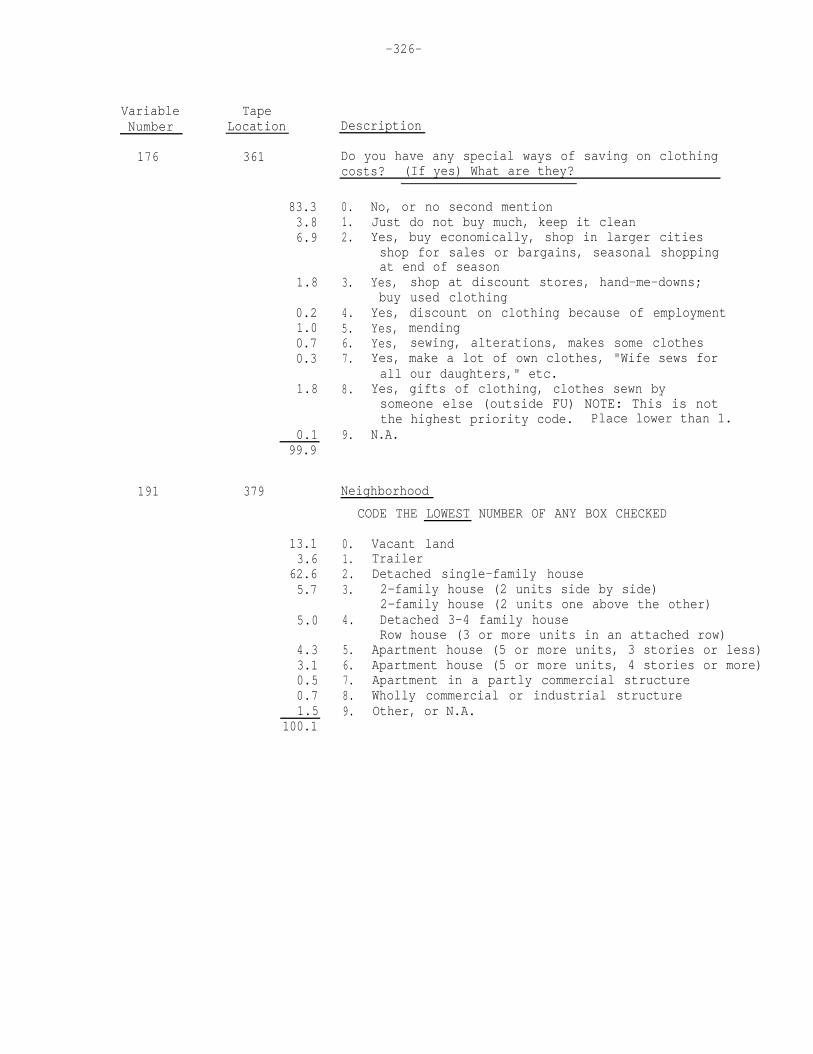
-326-
Variable TapeNumber Location
176 361
191 379 Neighborhood
83.33.86.9
1.8
0.1.2.
3.
0.2 4.1.0 5.0.7 6.0.3 7.
1.8 8.
0.199.9
9.
13.1 0.3.6 1.
62.6 2.5.7 3.
5.0
4.33.10.50.71.5
100.1
4.
5.6.7.8.9.
Description
Do you have any special ways of saving on clothingcosts? (If yes) What are they?
No, or no second mentionJust do not buy much, keep it cleanYes, buy economically, shop in larger citiesshop for sales or bargains, seasonal shoppingat end of season
Yes, shop at discount stores, hand-me-downs;buy used clothing
Yes, discount on clothing because of employmentYes, mendingYes, sewing, alterations, makes some clothesYes, make a lot of own clothes, "Wife sews forall our daughters," etc.
Yes, gifts of clothing, clothes sewn bysomeone else (outside FU) NOTE: This is notthe highest priority code. Place lower than 1.
N.A.
CODE THE LOWEST NUMBER OF ANY BOX CHECKED
Vacant landTrailerDetached single-family house2-family house (2 units side by side)2-family house (2 units one above the other)Detached 3-4 family houseRow house (3 or more units in an attached row)
Apartment house (5 or more units, 3 stories or less)Apartment house (5 or more units, 4 stories or more)Apartment in a partly commercial structureWholly commercial or industrial structureOther, or N.A.

-327-
Variable TapeNumber Location Description
254 450 Did you (HEAD) receive any other income in1967 from:
Farming or market gardening, roomers or boarders?
255
256
451 Dividends, interest, rent, trust funds, or royalties?
452
95.71.30.90.80.30.20.10.00.00.7
100.0
0. None1. $1-4992. $500-9993. $1000-19994. $2000-29995. $3000-49996. $5000-74997. $7500-9,9998. $10,000 or more9. N.A.
64.1 0.19.0 1.5.2 2.4.5 3.1.5 4.1.3 5.0.5 6.0.3 7.0.5 8.2.9 9.
99.8
None$1-499$500-999$1000-1999$2000-2999$3000-4999$5000-7499$7500-9,999$10,000 or moreN.A.
97.80.30.40.60.40.30.10.00.00.2
100.1
ADC, ADCU?
0. None1. $1-4992. $500-9993. $1000-19994. $2000-29995. $3000-49996. $5000-74997. $7500-9,9998. $10,000 or more9. N.A.
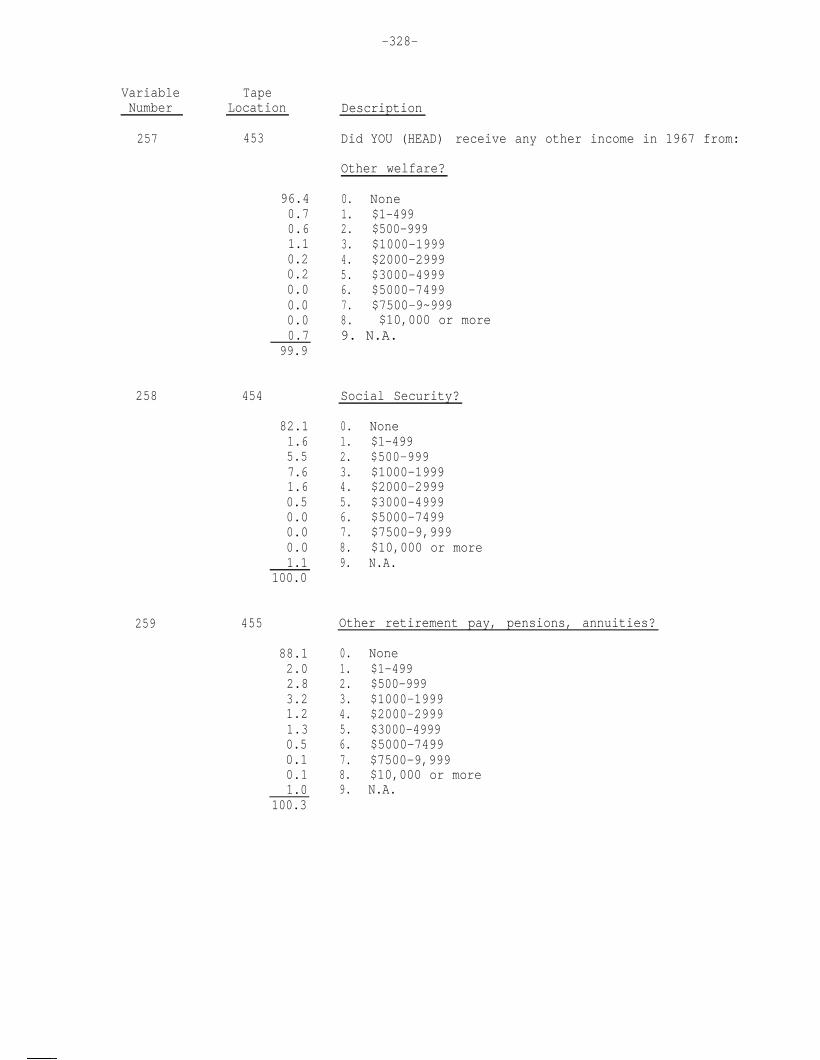
-328-
VariableNumber
257
TapeLocation
453
96.40.70.61.10.20.20.00.00.0
258 454 Social Security?
259
0.799.9
82.11.65.57.61.60.50.00.00.01.1
100.0
455
88.12.02.83.21.21.30.50.10.11.0
100.3
Description
Did YOU (HEAD) receive any other income in 1967 from:
Other welfare?
0. None1. $1-4992. $500-9993. $1000-19994. $2000-29995. $3000-49996. $5000-74997. $7500-9~9998. $10,000 or more9. N.A.
0. None1. $1-4992. $500-9993. $1000-19994. $2000-29995. $3000-49996. $5000-74997. $7500-9,9998. $10,000 or more9. N.A.
Other retirement pay, pensions, annuities?
0. None1. $1-4992. $500-9993. $1000-19994. $2000-29995. $3000-49996. $5000-74997. $7500-9,9998. $10,000 or more9. N.A.

-329-
Variable TapeNumber Location
260 456
Description
Did you (HEAD) receive any other income in 1967 from:
Unemployment or workmen's compensation?
95.3 0.2.5 1.1.0 2.0.5 3.0.1 4.0.0 5.0.0 6.0.0 7.0.0 8.0.6 9.
100.0
None$1-499$500-999$1000-1999$2000-29.99$3000-4999$5000-7499$7500-9,999$10,000 or moreN.A.
261 457 Alimony, child support?
97.3 0.0.4 1.0.6 2.0.5 3.0.4 4.0.1 5.0.0 6.0.0 7.0.0 8.0.6 9.
99.9
None$1-499$500-999$1000-1999$2000-2999$3000-4999$5000-7499$7500-9,999$10,000 or moreN.A.
262 458 Help from relatives?
94.6 0.2.2 1.1.0 2.0.9 3.0.3 4.0.2 5.0.1 6.0.0 7.0.0 8.0.7 9.
100.0
None$1-499$500-999$1000-1999$2000-2999$3000-4999$5000-7499$7500-9,999$10,000 or moreN.A.

-330-
Variable TapeNumber Location
281 477
339
24.614.037.2
17.3
5.9
0.1
0.20.7
100.0
608
0.52.07.58.07.46.6
19.516.720.811.1
100.1
Description
We're interested in how people spend their sparetime. What things do you (HEAD) usually do inyour spare time?
Second mention to above question
0.1.2.
3.
4.
5.
7.9.
Nothing. Have no spare time, just sitWatch TV, other passive thingsDrive the car, talk with neighbors, play cards,walk, read, fish, do flower gardeningEnergetic activities requiring initiative:sports, active hobbies, bowling, tennis,hunting, square dancingProductive activities (that save money orproduce direct service: having vegetablegarden, working around house)
Investment in self: learning new things,things that may benefit one economically
OtherN.A.
Bkt. V81 Total 1967 Family Money Income
0. None1. $1-4992. $500-9993. $1000-19994. $2000-29995. $3000-49996. $5000-74997. $7500-9,9998. $10,000 or more9. N.A.
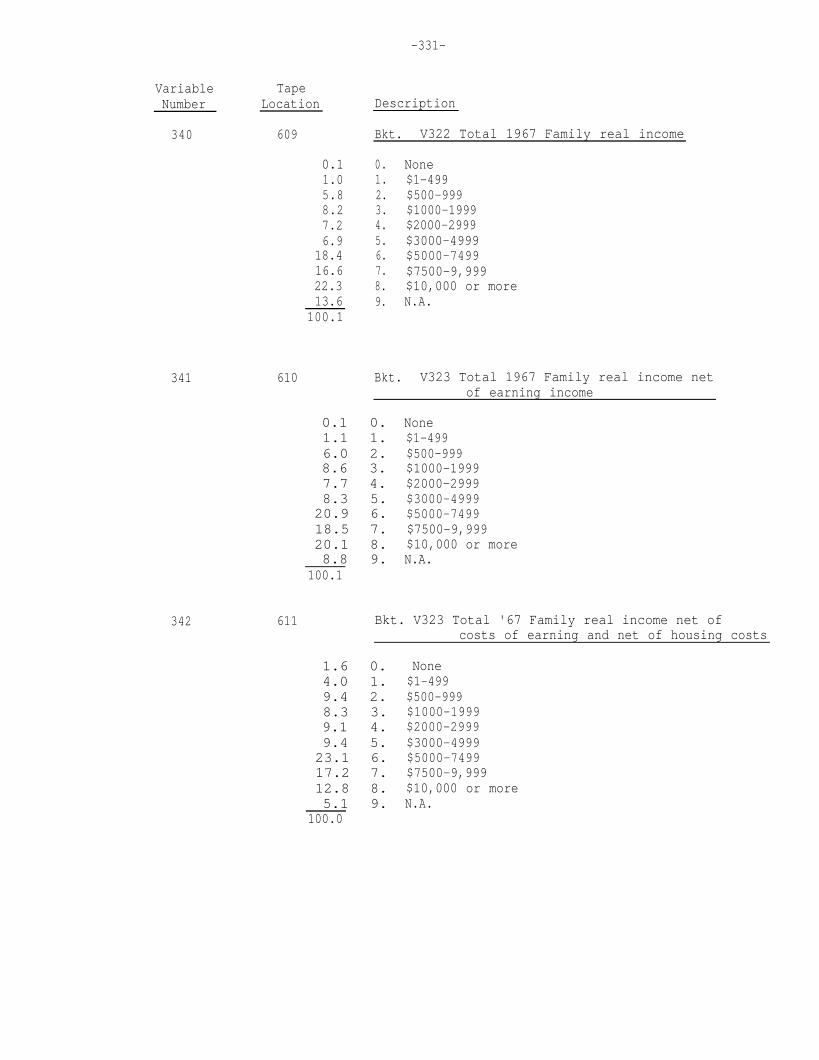
-331-
Variable TapeNumber Location
340 609 Bkt. V322 Total 1967 Family real income
341
342
0.11.05.88.27.26.9
18.416.622.313.6
100.1
Description
0. None1. $1-4992. $500-9993. $1000-19994. $2000-29995. $3000-49996. $5000-74997. $7500-9,9998. $10,000 or more9. N.A.
610 Bkt. V323 Total 1967 Family real income netof earning income
0.1 0.1.1 1.6.0 2.8.6 3.7.7 4.8.3 5.20.9 6.18.5 7.20.1 8.8.8 9.
100.1
None$1-499$500-999$1000-1999$2000-2999$3000-4999$5000-7499$7500-9,999$10,000 or moreN.A.
611 Bkt. V323 Total '67 Family real income net ofcosts of earning and net of housing costs
1.6 0.4.0 1.9.4 2.8.3 3.9.1 4.9.4 5.23.1 6.17.2 7.12.8 8.5.1 9.
100.0
None$1-499$500-999$1000-1999$2000-2999$3000-4999$5000-7499$7500-9,999$10,000 or moreN.A.

-332-
Variable TapeNumber Location
343 612
Description
Bkt. V328 Family Well-offness index - usesOrshansky ratio
1.14.27.49.99.69.4
13.816.718.010.0
100.1
0. None1. $1-4992. $500-9993. $1000-19994. $2000-29995. $3000-49996. $5000-74997. $7500-99998. $10,000 or more9. N.A.
344
345
613 Bkt. V329 Family well-offness index - Usesratio of total 1967 Family real incomenet of cost of earning income and netof housing costs to annual family needstandard
0.73.16.49.5
10.610.314.718.917.38.5
100.0
0. None1. $1-4992. $500-9993. $1000-19994. $2000-29995. $3000-49996. $5000-74997. $7500-99998. $10,000 or more9. N.A.
614 Bkt. V330 Family well-offness index - Usesratio of total 1967 family real incomenet of cost of earning net of housingcosts to annual family need standard
2.15.78.3
10.911.110.813.014.913.99.1
99.8
0. None1. $1-4992. $500-9993. $1000-19994. $2000-29995. $3000-49996. $5000-74997. $7500-99998. $10,000 or more9. N.A.

-333-
Variable TapeNumber Location
346 615
Description
Bkt. V331 Total 1967 Family contractual payments
13.1 0.19.8 1.30.9 2.20.6 3.10.0 4.4.1 5.1.4 6.0.2 7.0.0 8.0.0 9.
100.1
None$1-499$500-999$1000-1999$2000-2999$3000-4999$5000-7499$7500-9999$10,000 or moreN.A.
347
348
616 Bkt. V332 Total 1967 Family fixed expenditures
1.1 0.4.7 1.14.0 2.14.4 3.16.8 4.13.4 5.24.0 6.7.9 7.2.9 8.0.7 9.
99.9
None$1-499$500-999$1000-1999$2000-2999$3000-4999$5000-7499$7500-9999$10,000 or moreN.A.
617 Bkt. V333 Total 1967 Family uncommitted moneyincome
14.7 0.7.2 1.13.5 2.12.9 3.13.1 4.9.5 5.16.0 6.6.7 7.4.3 8.2.0 9.
99.9
None$1-499$500-999$1000-1999$2000-2999$3000-4999$5000-7499$7500-9999$10,000 or moreN.A.

-334-
Variable TapeNumber Location
378 654
380 656 Bkt. Age of head at Birth of First Child (V138)
384 662 Employment Problems of Head
96.20.40.70.30.10.10.10.10.02.0
100.0
0.72.36.1
11.725.819.09.62.41.8
20.599.9
48.423.120.06.31.70.50.10.00.00.0
100.1
Description
Bkt. Hourly wage of Jobs not Worth Taking -Head (V238)
0. Inap., question not asked1. $.01-.992. $1.00-1.493. $1.50-1.994. $2.00-2.495. $2.50-2.996. $3.00-3.997. $4.00-5.998. $6.00 or more9. N.A.
1. Under 162. 16-173. 18-194. 20-215. 22-256. 26-307. 31-398. 40 or older9. N.A.0. Inap., not married
Score Values
0123456789
,

-335-
Variable TapeNumber Location
385 663 Background Problems of Head
386 664 Current Handicaps of Head
387 665 Housing Quality (Dwelling Unit and Neighborhood)
25.741.226.36.30.40.00.00.00.00.0
99.9
28.335.619.810.34.01.60.30.10.00.0
100.0
0.00.00.83.79.4
17.018.217.922.510.499.9
Description
Score Values
0123456789
Score Values
0123456789
Score Values
0123456789

-336-
Variable TapeNumber Location
388 666
2.92.07.17.4
10.414.912.917.011.214.2
100.0
389 667 Trust in Others
1.59.4
16.424.826.016.35.60.00.00.0
100.0
0.08.9
13.715.617.917.612.77.83.72.3
100.2
Description
Sense of Efficacy
Score Values
0123456789
Score Values
0123456789
Ambition (Verbal aspiration expressed)
Score Values
0123456789

-337-
Variable TapeNumber Location
391 669 Expressed Horizon
392 670 Self-Reported Horizon
393 671 Connectedness to potential sources of help
0.00.84.7
19.038.119.913.13.70.60.1
100.0
Description
Score Values
0123456789
7.14.5
16.88.3
21.99.616.96.78.20.0
100.0
Score Values
0123456789
0.20.72.36.0
11.520.123.919.810.55.0
100.0
Score Values
0123456789

-338-
Variable TapeNumber Location
394 672
Description
Money Earning Acts (Current money earningbehaviors)
395
396 674 Economizing
0.39.5
14.89.0
21.023.114.95.61.60.3
100.1
673
19.728.327.614.56.62.40.70.10.00.0
99.9
0.31.95.0
11.819.018.416.714.59.7
Score Values
0123456789
Real Earning Acts (non-money, or investment forfuture
Score Values
0123456789
Score Values
01234567892.7
100.0

-339-
VariableNumber
TapeLocation
397 675 Risk Avoidance
0.0 00.6 11.5 22.7 3
10.4 417.7 527.7 621.4 712.9 85.0 9
99.9
Description
Score Values

-340-
1968 Individual Tape code
Each record on this file contains information about each
individual in the sample, i.e., each family member, regardless of age,
who was living with the sample family at the time of the interview.
Records are also included for family members living at the sample dwelling,
but who, at the time of the interview, were residing in institutional
quarters.
The first 439 variables on this tape are identical to the first
439 variables on the family tape, which contains only one record per family;
but this tape contains an additional thirteen variables that are unique to
the particular individual in the family. Listed below are variables that
are only on the individual tape - refer to the family tape for a description
of variables 1-439.

-341-
Variable TapeNumber Location
440 749-750
441 751-752 Age of individual
442 753
443 754
Description
Individual identification number
01 = Head
02-49 Other family members in dwelling
51 Child under 25 living away from home inarmy, school, or institutional housing
52 Second child under 25 living away
etc.59 Ninth such child
61 Husband in army, jail, or other institution
71 Husband separated, residing with anotherfamily or located in another dwelling
81 Husband or other family member deceasedbetween 1967 and 1968
01 One or under02 Two
etc.
98 Ninety-eight or older
99 N.A.
(B2 or B7) Sex of individual
1. Male
2. Female
9. N.A.
(B2 or B7) Individual's relation to Headof family
1.2.3.4.5.6.
HeadWifeSon or daughterBrother or sisterFather or motherGrandchild, niece, nephew, other relativesunder 18Other, including in-laws, other adult relativesHusband of head not in DU; deceased FD memberN.A.
7.8.9.

-342-
Variable Number
Tape Location Description
444 755 B3 or B9 In school now? (Whether individual in school at time of interview)
1. Yes (Includes college, trade school)
5. No
9. N.A.
445 756-757 B4 or B10 Year of academic school completed by individual (if not still in school at time of interview)
00 Pre-school; still in school . . . . . 01 One year
. . . . . 16 College graduate
. . . . . 99 N.A.
446 758
447 759
Whether individual moved into DU during year preceding 1968 interview
B11-12 Has anyone moved into your household in the last year? (If yes) Who moved in?
1. Individual moved in during year preceding interview
0. Individual lived in dwelling for a year or more preceding interview
Type of Income received by Individual
518, 521 Was that from wages, a pension, a business, interest or what? What was that from?
If wife: I10 (p18) If head: J8-11 (p20-21)
0. Individual received no income in 1967
1. Earnings from work, business, farm
2. Transfer income only (social security, pension, welfare, unemployment compensation, alimony)
3. Asset income only (rent, interest, dividends, royalties)
4. More than one of the above types
9. N.A.

-343-
VariableNumber
TapeLocation
448 760-763
449
450 768
451
764-767 J23-24 Hours worked for Money by Individual
769 Whether Individual likely to move from DU
Description
J19 1967 Total money income of Individual(In Dollars)
0000 Individual received no income in 1967
9998 $9998 or more
9999 N.A.
in 1967
0000 Individual did not work for money in 1967
0940 940 hours
9999 N.A.
Whether Individual shares in Family's Expenses
J26 Does (he/she) share in the family'sexpenses, or what?
1. Yes, shares
3. Yes, shares but qualified (a little) (lessthan $10 a week)
5. No
9. N.A.
0. Inap., individual received no income in 1967
J27 Is (he/she) likely to stay here with you ormight (he/she) move away within the nextfew years?
1. Yes, will stay here
3. Pro-con, depends (Will go to college)
5. Will move away
8. D.K.
9. N.A.
0. Inap., no income

-344-
Variable TapeNumber Location Description
452 770 Extra earner number
Other earners (other than Head or wife) havebeen numbered in order by amount of earned incomein ascending order with the earner having thelargest income receiving the lowest number
1. Other with highest earned income
2. Other with 2nd highest income
3. etc.
0. Individual received no income in 1967;or individual is Head or wife


![GoMOSES2018-Goss (002).pptx [Read-Only]Marti Goss, Ben Shorr, Amy Merten NOAA | Damage Assessment, Remediation, and Restoration Program February 7, 2018 • Natural Resource Damage](https://static.fdocuments.in/doc/165x107/5e320dbaea293b008849b7bc/gomoses2018-goss-002pptx-read-only-marti-goss-ben-shorr-amy-merten-noaa-.jpg)