Study Design and Dose Regimen Evaluation of...
86
ACTA UNIVERSITATIS UPSALIENSIS UPPSALA 2015 Digital Comprehensive Summaries of Uppsala Dissertations from the Faculty of Pharmacy 206 Study Design and Dose Regimen Evaluation of Antibiotics based on Pharmacokinetic and Pharmacodynamic Modelling ANDERS KRISTOFFERSSON ISSN 1651-6192 ISBN 978-91-554-9381-3 urn:nbn:se:uu:diva-264798
Transcript of Study Design and Dose Regimen Evaluation of...

ACTAUNIVERSITATIS
UPSALIENSISUPPSALA
2015
Digital Comprehensive Summaries of Uppsala Dissertationsfrom the Faculty of Pharmacy 206
Study Design and Dose RegimenEvaluation of Antibioticsbased on Pharmacokinetic andPharmacodynamic Modelling
ANDERS KRISTOFFERSSON
ISSN 1651-6192ISBN 978-91-554-9381-3urn:nbn:se:uu:diva-264798

Dissertation presented at Uppsala University to be publicly examined in B22, Biomedicinsktcentrum (BMC), Husargatan 3, Uppsala, Friday, 4 December 2015 at 13:15 for the degree ofDoctor of Philosophy (Faculty of Pharmacy). The examination will be conducted in English.Faculty examiner: Professor Stephan Schmidt (University of Florida).
AbstractKristoffersson, A. 2015. Study Design and Dose Regimen Evaluation of Antibiotics basedon Pharmacokinetic and Pharmacodynamic Modelling. Digital Comprehensive Summaries ofUppsala Dissertations from the Faculty of Pharmacy 206. 85 pp. Uppsala: Acta UniversitatisUpsaliensis. ISBN 978-91-554-9381-3.
Current excessive use and abuse of antibiotics has resulted in increasing bacterial resistance tocommon treatment options which is threatening to deprive us of a pillar of modern medicine. Inthis work methods to optimize the use of existing antibiotics and to help development of newantibiotics were developed and applied.
Semi-mechanistic pharmacokinetic-pharmacodynamic (PKPD) models were developed todescribe the time course of the dynamic effect and interaction of combinations of antibiotics.The models were applied to illustrate that colistin combined with a high dose of meropenemmay overcome meropenem-resistant P. aeruginosa infections.
The results from an in vivo dose finding study of meropenem was successfully predicted by themeropenem PKPD model in combination with a murine PK model, which supports model baseddosage selection. However, the traditional PK/PD index based dose selection was predictedto have poor extrapolation properties from pre-clinical to clinical settings, and across patientpopulations.
The precision of the model parameters, and hence the model predictions, is dependent onthe experimental design. A limited study design is dictated by cost and, for in vivo studies,ethical reasons. In this work optimal design (OD) was demonstrated to be able to reduce theexperimental effort in time-kill curve experiments and was utilized to suggest the experimentaldesign for identification and estimation of an interaction between antibiotics.
OD methods to handle inter occasion variability (IOV) in optimization of individual PKparameter estimates were proposed. The strategy was applied in the design of a sparse samplingschedule that aim to estimate individual exposures of colistin in a multi-centre clinical study.Plasma concentration samples from the first 100 patients have been analysed and indicate thatthe performance of the design is close to the predicted.
The methods described in this thesis holds promise to facilitate the development of newantibiotics and to improve the use of existing antibiotics.
Keywords: pharmacometric, optimal design, pharmacokinetics, pharmacodynamics, PKPD,resistance, antibiotics, modeling, time-kill curve, colistin, meropenem, ciprofloxacin, non-linear mixed effects models, bayesian
Anders Kristoffersson, Department of Pharmaceutical Biosciences, Box 591, UppsalaUniversity, SE-75124 Uppsala, Sweden.
© Anders Kristoffersson 2015
ISSN 1651-6192ISBN 978-91-554-9381-3urn:nbn:se:uu:diva-264798 (http://urn.kb.se/resolve?urn=urn:nbn:se:uu:diva-264798)

Till Sandra


List of Papers
This thesis is based on the following papers, which are referred to in the text by their Roman numerals.
I Mohamed A.F., Kristoffersson A.N., Karvanen M., Nielsen
E.I., Cars O., Friberg L.E., Dynamic Interaction of Colistin and Meropenem on a Wild-type and a Resistant strain of Pseudo-monas aeruginosa as Quantified in a PKPD-Model. [Submitted]
II Kristoffersson A.N., David-Pierson P., Parrott N.J., Kuhlmann O., Lave T., Friberg L.E., Nielsen E.I., Simulation-based evalu-ation of PK/PD indices for meropenem across patient groups and experimental designs. [Submitted]
III Kristoffersson A.N., Hooker A.C., Lustig U., Cao, S. Karlsson M.O., Friberg L.E., Optimal design of in vitro time-kill experi-ments. [In manuscript]
IV Khan D.D., Kristoffersson A.N., Lagerbäck P., Lustig U., An-nerstedt C., Cars O., Andersson D.I., Hughes D., Nielsen E.I., Friberg L.E., A PKPD model characterizing the combined ef-fects of colistin and ciprofloxacin on MG1655 wild type and a clinical isolate of E. coli. [In manuscript]
V Kristoffersson A.N., Friberg L.E., Nyberg J., (2015) Inter oc-casion variability in individual optimal design, Journal of Pharmacokinetics and Pharmacodynamics, 2015, doi: 10.1007/s10928-015-9449-6
VI Kristoffersson A.N., Dishon Y., Paul M., Friberg L.E., A sparse sampling design, with interim evaluation, for estimation of individual colistin pharmacokinetics. [In manuscript]
Reprints were made with permission from the respective publishers.


Contents
Introduction ................................................................................................... 15 Causes and effects of antibiotic resistance ............................................... 15 Dose finding for antibiotics ...................................................................... 16
MIC ...................................................................................................... 16 PK/PD indices ...................................................................................... 16 How modelling and simulation can help ............................................. 17
Semi mechanistic PKPD models .............................................................. 18 Experimental design ................................................................................. 19 Antibiotics and bacteria ............................................................................ 20
Ciprofloxacin ....................................................................................... 20 Colistin................................................................................................. 21 Meropenem .......................................................................................... 22 Pseudomonas aeruginosa .................................................................... 22 Escherichia coli ................................................................................... 23
AIDA project ............................................................................................ 23 Nonlinear mixed effects modelling .......................................................... 24
Model structure .................................................................................... 24 Maximum Likelihood estimation ........................................................ 25 Correlated residual error ...................................................................... 26 Shrinkage ............................................................................................. 27
FIM ........................................................................................................... 27 FIMMAP ................................................................................................. 28 Design criteria ...................................................................................... 29
Aims .............................................................................................................. 30 General aim .............................................................................................. 30 Specific aims ............................................................................................ 30
Methods ........................................................................................................ 31 Literature PK and PKPD models.............................................................. 31
PK models (Papers I, II, V, VI) ........................................................... 31 PKPD models for colistin and ciprofloxacin (Papers I, III, IV) .......... 32
In vitro data (Papers I, III, IV).................................................................. 34 Bacteria and strains .............................................................................. 34 Time-kill experiments (Paper I, III, IV) .............................................. 35 Measured drug concentrations (Paper I, IV) ........................................ 36

Patient data (Paper VI) ............................................................................. 36 AIDA colistin study ............................................................................. 36
PK and PKPD modelling .......................................................................... 37 In vitro time-kill data (Papers I, III, IV) .............................................. 37 Antibiotic PD Interaction (Papers I, IV) .............................................. 37 Re-estimation of Colistin PK model (Paper VI) .................................. 38
Dose regimen simulation (Paper I) ........................................................... 38 PKPD index simulation (Paper II)............................................................ 39 Optimal design (Papers III, IV, V) ........................................................... 40
Optimization of ciprofloxacin time kill studies ................................... 40 Optimisation of ciprofloxacin and colistin combination experiments .......................................................................................... 41 Inclusion of IOV in the FIMMAP (Paper V) .......................................... 43 Optimization of a sparse colistin individual PK sampling schedule (Paper VI) ............................................................................. 45
Software ................................................................................................... 46
Results ........................................................................................................... 47 PKPD models ........................................................................................... 47
Colistin and Meropenem on P. aeruginosa (Paper I) .......................... 47 Dosage regimen simulation for meropenem and colistin in combination (Paper I) .......................................................................... 51 PK/PD index simulation for meropenem (Paper II) ............................ 52 Reduced experimental design for ciprofloxacin PKPD model (Paper III) ............................................................................................ 53 Colistin and ciprofloxacin interaction study on E. coli (Paper IV)...... 55
Inclusion of IOV in the FIMMAP (Paper V) ............................................... 58 Sparse sampling schedule for colistin (Paper VI) .................................... 61
Discussion ..................................................................................................... 64 PKPD models (Paper I and IV) ................................................................ 64 Dose regimen simulation of Meropenem and Colistin in combination (Paper I) ............................................................................... 66 Meropenem PK/PD index simulation (Paper II) ...................................... 66 OD of in vitro time-kill experiments ........................................................ 67
Minimal ciprofloxacin time-kill study design (Paper IV) ................... 67 OD of colistin and ciprofloxacin in vitro time-kill experiments (Paper III) ............................................................................................ 68
IOV in individual OD ............................................................................... 69 Inclusion of IOV in the FIMMAP (Paper V) .......................................... 69 Optimisation of a sparse sampling schedule for determination of individual exposure determinants for colistin (Paper VI) .................... 70
OD compared to simulation-based design optimisation ........................... 71
Conclusion .................................................................................................... 72

Populärvetenskaplig sammanfattning ........................................................... 74
Acknowledgments......................................................................................... 76
References ..................................................................................................... 78


Abbreviations
AC Autocorrelation ACt1/2 Autocorrelation half-life AR1 Autoregressive model of order one AUC Area under the curve BLOQ Below the limit of quantification Bmax. Maximum bacterial density C Concentration c.i. Continuous infusion CBA Colistin base activity CFU Colony forming units CI Confidence interval CIP Ciprofloxacin CL Clearance CLCR Creatinine Clearance Cmax Maximum concentration CMS Colistimethate Sodium (prodrug to colistin) comp. Compartment CST Colistin dOFV delta OFV dSD Decrease in individual standard deviation EBE Empirical Bayes Estimate EC50 Concentration that gives 50% of Emax Emax Maximum-effect ER Residual error magnitude (parameter) EUCAST The European Committee on Antimicrobial
Susceptibility Testing fAUC/MIC Free (unbound) AUC divided by the MIC fCmax/MIC Free (unbound) Cmax divided by the MIC FIM Fisher Information Matrix FIMMAP Maximum a Posteriori Fisher Information Matrix FO First Order FOCE First Order Conditional Estimation fT>MIC Free (unbound) time above the MIC fu Fraction unbound g(.) Individual parameter function h(.) Error function

I Interaction parameter i.v. Intra venous iCL Individual clearance IIV Inter Individual Variability IOV Inter Occasion Variability IQR Inter Quartile Range iSE Individual Standard Error k A rate constant ka Absorption rate LC-MS/MS Liquid chromatography tandem
mass spectrometry L Likelihood LL Log Likelihood LOD Limit Of Detection LOQ Limit Of Quantification M Meropenem MAP Maximum a Posteriori MFEA Modified Federov Exchange Algorithm MER Meropenem MIC Minimum Inhibitory Concentration min Minutes MU Million Units (dose of CMS) Nc Non-colony-forming (bacteria) NLME Nonlinear Mixed-Effects OD Optimal Design ODE Ordinary Differential Equation OFV Objective Function Value PCB Penicillin-Binding Protein pcVPC Prediction corrected Visual Predictive Check PD Pharmacodynamic PK Pharmacokinetic pp Percentage point q Dose interval Q Inter compartmental clearance R Resting state (bacteria) R2 Coefficient of determination RES Residual error RNA Ribonucleic acid RRES Replicate residual error RSE Relative standard error RUV Random Unexplained Variability S Susceptible (bacteria) s.c. Sub cutaneous SCr Serum Creatinine

SE Standard Error SH Shrinkage SIR Sampling Importance Resampling SSE Stochastic Simulation and Estimation T Time t1/2 Half-life t Half- -phase V Volume (of distribution) w Week VPC Visual Predictive Checks WT Weight gamma, Hill coefficient of the drug effect
theta, population fixed effect
eta, individual random effect
kappa, occasion random effect
Chi - individual/design parameters
epsilon, residual
Omega, inter individual covariance matrix
Pi, inter occasion covariance matrix
Epsilon, residual error covariance matrix For PKPD-model parameters, please refer to Table 7 (page 50) & Table 10 (page 57)


Introduction
Modern medicine is strongly dependent on antibiotic drugs, a class of com-pounds that is typically highly effective against microbe growth with moder-ate toxicity to the host. However, most microbes eventually develop re-sistance to the antibiotic drugs to which they are exposed. Current excessive use and abuse of these drugs globally has resulted in increasing resistance which is threatening to deprive us of many antibiotics (1-3). The situation is exacerbated by the ongoing crisis in the development of new antibiotics; only two new classes have been approved for systemic use since the year 2000 (3, 4). Without effective treatment and prophylaxis for bacterial infec-tions, other major achievements such as advanced surgery, organ transplants and certain types of cancer treatment will not be possible. Because of the paucity of new antibiotics there is an increased requirement for effective dosage strategies for the available antibiotics, so as to reduce the develop-ment of resistance and increase their efficacy. The development of antibiotic treatments would be facilitated by an improved understanding of the mecha-nisms and dynamics behind the development of resistance, and by the devel-opment of improved methods for the rapid evaluation of new drug candi-dates, including efficient and informative clinical studies.
Causes and effects of antibiotic resistance It has been suggested that 20-50% of antibiotic used in humans and over 80% in animals are unnecessary (5). The misuse of antibiotics drives re-sistance which takes a heavy toll, both economically and in lives. The direct and indirect cost of antibiotic resistance has been estimated as up to 55 bil-lion $ per year in the US (3), and an estimated 58000 neonatal sepsis deaths per year in India alone are attributable to resistant infections (6). As a result the use of “last resort” antibiotic classes of carbapenems and polymyxins has increased (7), with an associated increase in rates of resistance (8). As there are no new antibiotic classes in pipeline capable of replacing these last resort antibiotics in treatment of systemic Gram-negative bacterial infections (3), the latter is especially concerning. Methods to conserve or increase the po-tency of existing drugs are thus of great importance.
15

Dose finding for antibiotics Inappropriate dosage of antibiotics challenges successful antibacterial thera-py, both in the individual patient (slow or no clearance of infection), and in society at large due to the appearance of, and selection for, resistance. It is thus important that an appropriate dosage is selected and used in therapy. In order to achieve this, the pharmacokinetic (PK) and pharmacodynamic (PD) properties of the drug must be taken into consideration.
The pharmacokinetics of a drug describe the changes in concentration of the drug over time in different sites in the body; this can be influenced by a range of patient covariates, such as weight and age. The pharmacodynamics of a drug describe the concentration-dependence of the drug effect which, for antibiotics, is dependent on the type and strain of bacterium. Over recent decades, specific PK/PD indices have emerged as a cornerstone of dose se-lection for antibiotics. These antibiotic PK/PD indices comprise specific summary measures of the drug pharmacokinetics correlated with the mini-mum inhibitory concentration (MIC) of the antibiotic – the lowest concentra-tion required to inhibit the visible growth of a micro-organism at some de-fined time point after incubation under static conditions (no changes in or dilution of media).
MIC The MIC is commonly used as a measure of the in vitro PD activity of anti-biotics. However, it reflects only a point estimate (often after 18-24 h of exposure) and does not take into account the whole time course of bacterial growth and extermination (9). In addition, the precision of the MIC is lim-ited by the dilution step (e.g a doubling per concentration step) if it is de-rived using liquid culture media or by the resolution of the antibiotic gradi-ent if it is derived using solid media (e.g. Etest®).
PK/PD indices In order to guide the dosage of antibiotics in vivo, the MIC is often linked to the drug PK data by a PK/PD index (10). The most commonly used PK/PD indices are the fraction of the dosage interval in which the unbound drug concentration is greater than the MIC (fT>MIC); the ratio of the total expo-sure of the unbound drug to the MIC (fAUC/MIC); and the ratio of the max-imum concentration of the unbound drug to the MIC (fCmax/MIC) (11). The relevant type and magnitude of PK/PD index is decided by the correlation to the bacterial burden at 24 h across a wide range of exposures and dosage intervals in an in vivo dose fractionation study (9), most commonly in a mu-rine model. A treatment target, such as a decrease by a factor 100 (i.e 2-log kill), is selected and the corresponding PK/PD index target is decided. A
16

human dose can then be selected to achieve the PK/PD index target and hence presumably the treatment target, given knowledge of the human PK.
The appropriateness of the selected dose is, however, dependent on the type and magnitude of the index remaining constant when extrapolating the data from the mouse model to humans. This is an assumption that could in many cases be false, as the index type is dependent on the PK of the system (12). In addition the PK/PD indices share the limitations of the MIC value and can only strictly be considered relevant for the evaluated time point, i.e. no con-sideration is taken of initial rate of kill, or regrowth after the specified time point.
How modelling and simulation can help The creation of mathematical descriptions, or models, of the PK and PD properties of the drug allows an unlimited number of dosage regimens to be evaluated by simulation. A population PK model describes the typical value as well as the variability in the population. Given a population PK model of sufficient detail typical patients, patients with specific covariates, and varia-bility in the population can all be investigated. Population PK models are used when a dose is selected to achieve a certain PK/PD index value across the intended target population. Given well characterised pharmacokinetic-pharmacodynamic (PKPD) models of bacterial response to the drug, the time course of bacterial kill and growth in patients can be simulated for dose se-lection purposes.
Figure 1 Example of a PK/PD index study. A range of doses over different dosing intervals have been administered to infected animals. At some time point (e.g. 24 h) the animals are sacrificed and the number of bacteria (in log10 CFU/ml) are counted and correlated to the magnitudes of the three indices fT>MIC, fCmax/MIC, fAUC/MIC. The index with best correlation to efficacy and the magnitude required for e.g. 2-log kill (here fT>MIC and 29%) are selected and extrapolated to human.
17

Semi mechanistic PKPD models The PD properties of an antibiotic can be characterised in a variety of in vitro bacterial systems (13). Commonly, the bacterial response to a range of static drug concentrations is followed over time, in a so-called static time-kill study. Alternatively the human PK can be mimicked in dynamic sys-tems, and these systems may be used on their own to guide dosage. Howev-er, experiments with dynamic concentrations are relatively time-consuming and expensive and it would therefore be of value to make maximum use of static experiments in order to conserve experimental resources. As the time course and concentration dependence of the drug effect is observed, it is possible to form a mathematical model of the bacteria-drug system (14).
A semi-mechanistic PKPD model, where the prior mechanistic under-standing about the system is coupled to experimental data, may offer added confidence in the model extrapolations compared to an empirical model while requiring less prior knowledge (14). An established semi-mechanistic model by Nielsen et al (15), consisting of a system of ordinary differential equations (ODEs), has been shown to describe changes in bacterial counts as a function of the drug for several tested antibiotics (15). In the model, the bacteria were assumed to exist in either of two states: one growing drug-susceptible state and one resting nonsusceptible state. The drug effect was described as the killing rate for the bacteria in the susceptible state, accord-ing to a sigmoid maximum-effect (Emax) model. The inclusion of a nonsus-ceptible resting state allowed the model framework to describe the biphasic kill often seen in time-kill studies (15) and, due to an increased transfer to the nonsusceptible state at high densities, to predict the inoculum effect (a reduction in bacterial kill at higher starting inoculates) (14). Similar models have been used to e.g. describe oxazolidinones (16), but without a density dependent transfer to the resting state.
The Nielsen model has successfully been applied to predict the commonly used types and magnitudes of the PK/PD indices for several antibiotics (17), i.e. the bacterial count at 24 h was predicted from the model for a range of dosage regimens and correlated to each of the three PK/PD indices. The model has also been expanded to explain mechanisms of resistance and to simulate various dosage regimens (18). A recent application is the descrip-tion of the action of ciprofloxacin on E. coli (19), where the model was ex-panded by a second less susceptible subpopulation in order to explain re-growth and a non-colony forming state was included to explain an initial decrease in bacterial numbers after initial drug exposure followed by a fast rebound (see Figure 2).
18

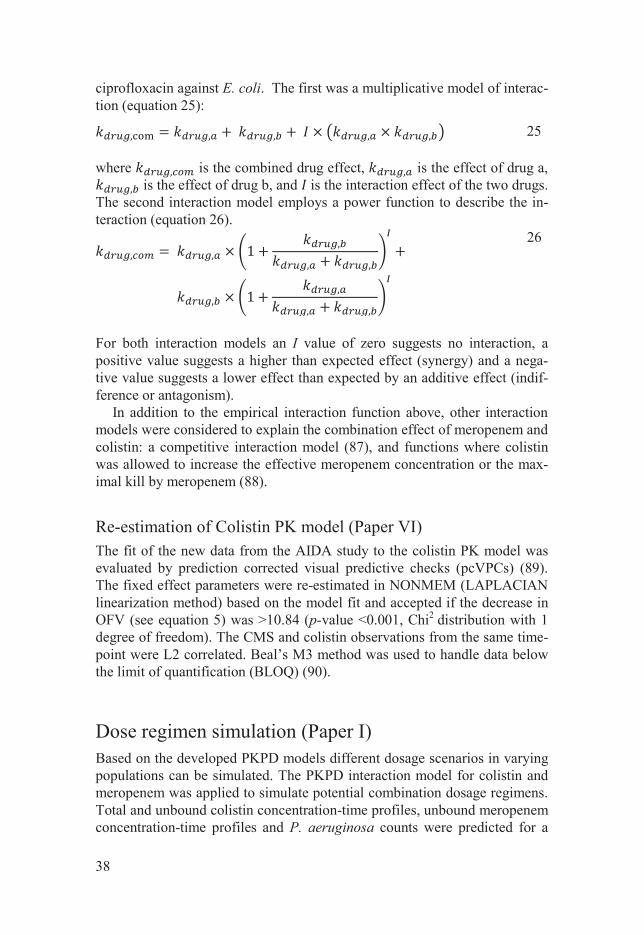
Figure 2 Ciprofloxacin PKPD model developed for E. coli by Khan et al (19). The model includes two bacterial subpopulations, one susceptible (subpopulation 1) and one pre-existing resistant (subpopulation 2). In each subpopulation the bacteria exist in one of three discrete states: 1. Antibiotic susceptible (S) bacteria 2. Resting (R) non-proliferating bacteria being unsusceptible to the antibiotic, and 3. Transiently non-colony-forming (Nc) bacteria. The bacteria enter the R state as a response to high population densities (R+S+Nc) and the Nc state as a response to antibiotic exposure. The drug action is modelled as an increase in the death rate of the S and Nc states through a sigmoidal Emax model.
Experimental design The experimental design, e.g. the selection of drug concentrations and sam-pling times, is critical for the precision of the model parameters, and hence for the predictability of the model. The amount of information available from a study can be increased by enrichening the design. However, cost and ethical reasons dictate a limited study design with as few samples as possible for in vivo PK studies and the experimental effort associated with small ex-pansions to the design of even simple in vitro PD studies increases rapidly. Nonetheless, the information obtained from an experiment can be increased while the experimental cost remains constant or is reduced if optimal design (OD) strategies are used. In OD, prior knowledge of the experimental out-come in the form of a model is assumed. The experimental design can be optimised by forming a design criterion that is linked to an aspect of interest in the model. The determinant of the Fisher Information Matrix (FIM) is a commonly used design criterion, so called D-optimality (20). The inverse of the FIM forms an asymptotic lower bound for the covariance matrix of the model parameters. The expected uncertainty in the model parameters can be minimised by maximising the FIM over the design variables. OD has been
19

applied in the design of PK studies of antibiotics (21-23), and has been used derive specific PD characteristics. Examples include the selection of pyra-zinamide exposures for the estimation of PK/PD indices for Mycobacterium tuberculosis (24) and the selection of meropenem and tobramycin concentra-tions for the estimation of the maximal killing effect at 24 h for Pseudomo-nas aeruginosa (25). However, examples of OD applied examples of OD applied to PKPD models describing the time-course of bacterial growth and kill are scarce.
In vitro time-kill experiments are suitable for OD because of the ease of manipulating the design variables in order to achieve the required infor-mation. The large available design space makes it hard to find the best de-sign without the help of an optimisation algorithm, especially if combina-tions of several antibiotics are considered. OD could also be of value in the determination of sparse sampling schedules for the estimation of individual PK parameters. Individual parameters are of interest in for example, model diagnostics (26), covariate analysis (27, 28) or feedback dosage individuali-sation (29). These individual estimates, referred to as Empirical Bayes Esti-mates (EBEs), are derived by Maximum a Posteriori (MAP) estimation giv-en a prior population PK model and individual observations. However, criti-cally ill patients treated with antibiotics often exhibit erratic PK data, with changes in drug disposition and elimination between study occasions, or so-called inter-occasion variability (IOV). While OD has been previously used create designs for MAP estimation (30, 31), it has hitherto not been expand-ed to include IOV.
Antibiotics and bacteria In this thesis work models for the Gram negative bacteria Escherichia coli and Pseudomonas aeruginosa and three antibiotics active against these path-ogens (ciprofloxacin, meropenem and colistin) will be discussed.
Ciprofloxacin Ciprofloxacin, a fluoroquinolone, has been used since 1987 as treatment against a broad spectrum of microorganisms. Ciprofloxacin inhibits DNA gyrase and topoisomerase IV, important enzymes facilitating chromosome replication and RNA transcription, which leads to inhibition of cell division with a bactericidal effect (32, 33). The effect of ciprofloxacin is dependent on exposure (fAUC/MIC) and the drug has a half-life of around 5 h in plas-ma (34). Ciprofloxacin is used to treat many infections, including urinary tract infections and pneumonia. As a consequence of its frequent use, ciprof-loxacin-resistant bacteria are emerging worldwide (6, 35) and hence combi-nation treatment with other antibiotics is an attractive option. A PKPD mod-
20

el for the action of ciprofloxacin on E. coli has recently been published (19), see Figure 2.
Colistin Colistin is a cyclic peptide polymyxin antibiotic which was first used in the fifties but was later abandoned due to toxicity concerns. During recent years colistin has seen resurgent use in the treatment of multidrug-resistant Gram-negative infections (36). Because it was introduced before the rigours asso-ciated with modern drug discovery were in place, there is insufficient expo-sure-response information, but colistin appears to exhibit an exposure-dependent effect (37). Colistin is administered intravenously as the prodrug colistimethate sodium (CMS). Once formed, colistin has a long half-life of around 14 h (38) and has very variable PK with high inter-individual varia-bility (IIV) and IOV (39), see Figure 3. Colistin is considered as a last resort therapy for multidrug-resistant P. aeruginosa infections, and much effort has recently been put into optimising its dosage regimen (40-44). Due to toxicity concerns with high doses of colistin and an increased risk for resistance development when colistin is used in monotherapy (45), colistin is common-ly used in combination with another drug (42, 46, 47). Because of its disrup-tive effects on cell membranes colistin could be hypothesized to be able to reverse resistance to other antibiotics that require access to the cell, such as ciprofloxacin and meropenem. Recently there has been much interest in col-istin and several PKPD models exist, including one using the same base models structure as previously discussed (48).
Figure 3 Concentration-time profiles showing only inter-individual variability (IIV), only inter-occasion variability (IOV), or both, for 300 individuals simulated using a CMS/colistin PK model (39) (thin solid lines) and 2.5th, 50th and 97.5th percentiles for the population (fat dashed lines). The simulated dosage regimen was a loading dose of 9 MU (270 mg CBA) followed by maintenance doses of 4.5 MU (135 mg CBA) every 12 h. For comparison the effective concentration is around 2 mg/L.
21

Meropenem -lactam antibiotic of the carbapenem class
which was first introduced for human use in 1996. Because it is degraded in the digestive tract, meropenem has to be injected (49). Meropenem has a short half-life of around 1 h in humans and its effect is dependent on fT>MIC (10). The magnitude for maximum bactericidal effect is cited as 40% (50), but magnitudes exceeding this are often required in clinical prac-tice (51) and requirements also appear to vary between patient groups (52). The mechanism of action involves the drug binding to penicillin-binding proteins (PCBs), leading to disruption of cell wall synthesis (49). As mero-penem is a poor substrate for many beta-lactamase enzymes, it is considered a drug of last resort in the treatment of multidrug-resistant Gram-negative pathogen infections (3). However, the incidence of carbapenem-resistant bacterial infection has been steadily increasing since the early 2000s (53).
Pseudomonas aeruginosa P. aeruginosa is a Gram-negative bacterium with a highly evolved capacity to develop resistance against multiple classes of antibiotics (45, 54); high rates of resistance to carbapenem antibiotics have been observed in some parts of the world, see Figure 4. Some mechanisms of resistance are transient or adaptive, for example modifications of the lipopolysaccharide structure on the outer membrane wall (54-56), while other mechanisms, such as target mutations, ribosomal mutations or modifications, and antibiotic-modifying enzymes, are more permanent (54, 55). Resistance to meropenem has empir-ically been modelled as adaptive (57, 58). As resistant P. aeruginosa is high-ly associated with nosocomial infections such as ventilator-associated pneu-monia, infections in intensive care and burns units, and infections in immun-ocompromised patients or those with cystic fibrosis, there is a high morbidi-ty and mortality rate associated with these bacteria.
Figure 4 The current (2015) percentages of invasive P. aeruginosa isolates resistant to car-bapenems (http://resistancemap.cddep.org/). Reprinted under creative commons 3.0, with magnified text.
22

Escherichia coli E. coli bacteria belong to the broader Enterobacteriaceae group and are a normal part of the human gut flora as well as the microbiology and biotech-nology workhorse of choice because of their ease of cultivation and general harmlessness. These Gram-negative bacteria can, however, acquire virulence genes and are subsequently a common causative agent in gastrointestinal infections and urinary tract infections as well as more serious conditions such as neonatal meningitis (59). The incidence of resistance to common treatment options such as fluoroquinolones is high and increasing, with up to 30% of strains reported as resistant in the USA and 85% in India (8), see Figure 5.
AIDA project The EU-funded AIDA project aims to answer the question of clinical effec-tiveness and optimal dosing for old off label antibiotics seeing resurgent use due to increasing emergence of drug resistance and lack of new antibiotics (www.aida-project.org). One of the studied antibiotics is colistin for which a loading dose has recently been suggested in order to more rapidly reach ef-fective concentrations (60). In addition, colistin exhibits increased killing in combination with meropenem in vitro, especially for carbapenem-resistant strains, (61, 62) and the interaction is described by a PKPD model in Paper I. The clinical value of meropenem on top of colistin administered using the currently recommended doses, including a loading dose, is however unclear.
In order to answer this question, and to add additional information on col-istin patient PK, a multicentre, open-label, randomized 360 patient clinical trial (180 patients in each arm) to compare colistin alone vs. colistin plus meropenem for severe infections caused by carbapenem-resistant bacteria has been initiated within the AIDA project. The study aims to demonstrate whether the addition of meropenem on top of colistin is of value in the
Figure 5 The current (2015) percentages of invasive E. coli isolates resistant to fluoroquin-olones (http://resistancemap.cddep.org/). Reprinted under creative commons 3.0, with magnified text.
23

treatment of infections caused by carbapenem-resistant bacteria when col-istin is dosed according to the new recommendations, and is of direct rele-vance for patients suffering from these life threatening conditions.
Therefore it is of interest to focus the design to characterize the individual apparent clearance of colistin. However, since the colistin PK is highly vari-able with both pronounced IIV and IOV, see Figure 3 (39), as well as being administered as a prodrug, it is non-trivial to design a limited sampling schedule for individual exposure determination.
Nonlinear mixed effects modelling Pharmacometrics can be defined as the science that quantifies drug, disease and trial information to aid efficient drug development and/or regulatory decisions. Nonlinear mixed-effects (NLME) models are a central component of this science. The term mixed-effects model was derived because both the typical population parameters (fixed effects) and variability (random effects) are modelled simultaneously, and the random effect enter the model nonline-arly (63). The variability terms commonly included are IIV and random un-explained variability (RUV), i.e. variability between measurements within the same individual. If IOV (e.g. between doses or observation periods) is apparent, it can be introduced as a third level of random effects (64).
Model structure For continuous data the vector of observations for the ith individual can be described by: = f , g , , , , , … , , + h , g , , , , , … , , ,
1
where g() is the vector function describing the parameters for the ith individ-ual defined by the typical population parameter vector = { , , … }, the individual deviations vector = { , , … }~N(0, ), and the m occasion deviation vectors , = { , , … } ~N(0, ). f(.) describe the structural model dependent on the individual variable vector (observation times, design variables, and covariates), and h(.) is the error model depend-ent on the residual error deviation vector ~N(0, ). The ces , , and describe the covariances of the individual, occasion and re-sidual error deviations respectively. For convenience the population parame-ters , , , and may be grouped as .
24

If the observation is discrete instead of continuous, e.g. if the sample is be-low the limit of quantification (BLOQ), the NLME describes a probability: , g , , , , , … , ,
2
which (for the BLOQ example) translates to the probability of the sample being BLOQ given the model parameters. This form of discrete data is termed categorical.
Maximum Likelihood estimation The probability of the model parameters given the individual observations or the likelihood of the data given the model parameters can be defined, for an NLME model, as: ( , ) = P( , | , , , ) P( , , | , )d d 3
where P( , | , , , ) is the probability density of the individual observa-tions and P( , , | , ) is the probability density of the individual parame-ters. The product is referred to as the joint density and the integral over the joint density gives the marginal likelihood (63). The population likelihood is then given as the product of over the N sub-jects in the data: ( , ) = ( , ) 4
The log likelihood (LL), where the right-hand side of equation 4 becomes the sum of the logarithms of the individual likelihoods, is commonly used in the interests of computational stability. The best parameter description of the data, i.e. the maximum likelihood estimate, can be obtained by maximising the LL over the parameter space. In modelling software (e.g. NONMEM), the – 2×LL is commonly used instead of the objective function value (OFV), which is then minimised: argmin 2 × log ( , ) 5
25

As the random effects enter the marginal likelihood non-linearly, there is no closed form solution and the integral in equation 3 has to be approximated. This can be achieved by Monte-Carlo integration (random sampling) or by linearisation. In this work, three linearisation methods were used, as briefly described here.
The Laplace method assumes that the random effects , are normally distributed with a mean of zero and then approximates the marginal likeli-hood by the Laplace approximation. This mandates a second order Taylor expansion of the -2 log individual probability density (the conditional indi-vidual likelihood) around the mode of the random effects (equation 6) where the computation of the hessian (third term in the Taylor series – the second derivative of the conditional individual likelihood with respect to , ) is computationally heavy. , = argmax, [P( , | , , , ) P( , , | , )] 6
The modes of the individual random effects, as presented in equation 6, are EBEs and the estimation is a MAP estimation.
In order to reduce the computational effort, the hessian can be further ap-proximated by the first order (FO) method whereby the model f(.) is linear-ised around the expectation (mean=0) of the random effects ( , ) using an FO Taylor expansion. As the individual random effect can be very different from the population expectation of zero, the FO method is rather coarse but it can be improved by the FO conditional estimation (FOCE) method. The FOCE method is similar to the FO method but, instead of linearising the model around the mean of the random effects, the mode is used – as in the Laplace method.
Of the three methods (Laplace, FOCE, FO) only the Laplace method is considered sufficiently exact to be used with categorical data. All the meth-ods can be used with or without interaction, that is the dependence between the residual error and the random effects , in the residual error model h(.) is either conserved or not. This can be important if, for example, the residual error magnitude differs between individuals.
Correlated residual error The residual error of different observations may be inter-dependent (corre-lated) due to various circumstances, and failure to account for such correla-tions can lead to model-misspecification (65). One situation where such a correlation can appear is when several replicates of one measurement are analysed, or when several measurements are taken at different sites or of different response variables. It is then natural to assume that the residual
26

error can be split into two parts: one that is unique to each replicate or time point, and one that is shared across observations in a so-called L2 block (65, 66).
Another situation where the residual error may be correlated across ob-servations arises when repeated measurements are taken. Generally, some serial correlation between samples is expected as all models are simplified descriptions of reality and hence are unable to describe the true level of de-tail in the data. The serial correlation (or autocorrelation) can be described in various ways, one of which is the autoregressive model of order one (AR1) (65). In this description, the correlation between the current observation j and any subsequent observation k in individual i is assumed to decrease mono-exponentially with a half-life ACt1/2: corr , , , = e ( ) × , ,
7
where , is the residual of the xth time point , .
Shrinkage As is seen in equation 6 the estimate of the EBEs will depend on the balance between the information content in the observations ( ) and the strength of the population variance parameters ( , ). If the individual information is rich the estimated EBEs will be close to the “true” individual parameter val-ues; conversely, if the information in the individual is sparse the estimated EBEs will be close to the mean of the population distribution (i.e. 0). This phenomena is termed shrinkage (SH) (26) and can be assessed from the dis-tribution of the EBEs compared with the population variance:
= 1 SD
8
where SHr is the shrinkage of the rth EBE r
is the rth standard deviation of the population distribution (square root of rth diagonal element of ).
FIM Generally in optimal design the aim is to maximize the precision in some model parameters by optimizing the experimental design variables . This is achieved by maximizing the FIM as, according to the Cramer-Rao ine-quality (67, 68), the inverse of the FIM is a lower bound for the covariance
27

matrix of the maximum likelihood estimates of given the experimental design for any measured data : ( , , ) ( , ) 9
The FIM can, under certain regularity conditions (69) be expressed as the negative expectation over the hessian of the LL given the parameters: ( , ) = E log( ) 10
Due to the sum rule of differentiation, the expression in equation 10 can be expressed as ( , ) = E log( ) 11
where the expression in the summation is the individual FIM (FIMi). That is, the information is additive. If all individuals can be assumed to be identical (i.e. = ) the population FIM is simply the equal to the individual FIM scaled by the number of individuals.
FIMMAP The maximum a posteriori Fisher Information Matrix (FIMMAP), first sug-gested for NLMEs by Merlé and Mentré in 1995 under the name Bayesian Information Matrix (70), can be used for optimization of individual deviation
EBE) (30, 31). The FIMMAP is the expectation of the individual FIM over the IIV distribution with the population distribution as prior information. In order to calculate the FIMMAP the population model is transformed to an individual model transferring the population random effect parameters, , to individual parameters, , sampled from . The process is described in equation 12: = ( , ) , , ~ (0, ) 12
where pi is the parameter vector for individual i dependent on the population parameters , and the individual parameters .
The FIMMAP is formed as the expectation of the individual FIM for the transformed model over its prior, . The expectation can be approximated by Monte Carlo integration over all possible individual parameter values. The procedure is given by:
28

= E [ ] + 1 × +: = , , ,= 13
Design criteria The size of the FIM is most commonly measured by its determinant |FIM|, so called D-optimality (20).
If only selected parameters are of interest in the optimisation, they can be fixed and thus removed from the FIM. This is, however, done under the as-sumption that the fixed parameters are well known and do not have any co-variances with the parameters of interest. In order to relax this assumption, the determinant of the interesting part of the FIM can be calculated, the so-called Ds optimality (20), equation 14. argmax | ( , )| ,
14
29

Aims
General aim The overall aim of this thesis was to develop methods and pharmacometric models for efficiently exploring the pharmacokinetic (PK) and pharmacoki-netic-pharmacodynamic (PKPD) relationships of antibiotics, of value for improving dosage strategies for antibiotics currently in use and accelerating the development of new antibiotics.
Specific aims To develop mechanism-based PKPD models that describes the time-
course of drug effect and interactions between antibiotics, including development of resistance.
To investigate the validity of the current PK/PD index-based dose-selection paradigm and to evaluate dosage regimens.
To develop and apply methods to improve the experimental design of clinical PK and experimental PKPD studies, by optimal design methodology.
30

Methods
Literature PK and PKPD models The basis of this work was a number published PK and PKPD models de-scribed below:
PK models (Papers I, II, V, VI) The PK models that were used in simulations of PK profiles and in method evaluation studies are summarised in Table 1.
Table 1. PK models used in this thesis work Substance / reference
System Description Paper
CMS/Colistin Mohamed et al 2012 (39)
Human, critically ill
i.v. infusion, 2 comp. for CMS and 1 comp. for formed colistin, IIV and IOV, proportional error
I,V, VI
1-COMP
Constructed i.v. infusion, 1 comp. , IIV and IOV, additive or additive and proportional error
V
Meropenem Crandon et al 2011 (71)
Human, adult, criti-cally ill
i.v. infusion, 2 comp., WT = 90 kg CLCR = 70 ml/min
I
Meropenem Li et al 2006 (72)
Human, adult i.v. infusion, 2 comp. IIV, proportion-al and additive error
Typical WT=70 kg, Age=35 y, Sex=Male, SCr=1 mg/dl
II
Augmentet CL
as Typical with SCr=0.4 mg/dl II
Renal dys-function
as Typical with SCr=6.9 mg/dl II
Meropenem van den Anker et al 2009 (73)
Human, neonatal
i.v. infusion, 2 comp. CLCR = 24.3 mL/min, WT=1.87 kg
II
Meropenem Katsube et al 2008 (74)
Mouse, 5 weeks old
s.c bolus, 1 comp. allometrically scaled (75) from 24.4 g female mouse to a 29.6 g male (76) using allometric exponents of 0.75 for CL and 1 for V
II
comp.: compartment, WT: weight, CLCR: Creatinine clearance, SCr: Serum creatinine
31
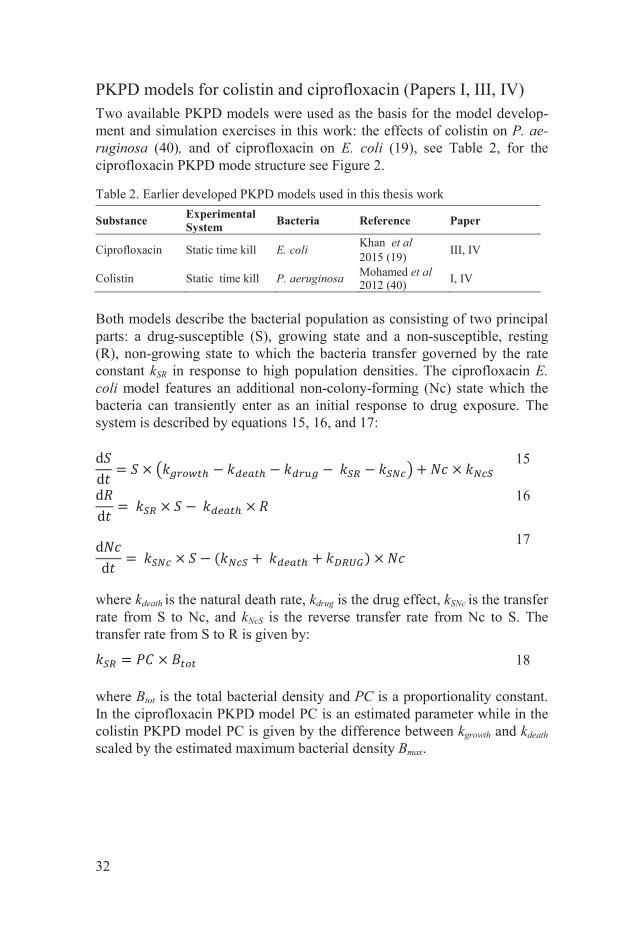
PKPD models for colistin and ciprofloxacin (Papers I, III, IV) Two available PKPD models were used as the basis for the model develop-ment and simulation exercises in this work: the effects of colistin on P. ae-ruginosa (40), and of ciprofloxacin on E. coli (19), see Table 2, for the ciprofloxacin PKPD mode structure see Figure 2.
Table 2. Earlier developed PKPD models used in this thesis work
Substance Experimental System Bacteria Reference Paper
Ciprofloxacin Static time kill E. coli Khan et al 2015 (19) III, IV
Colistin Static time kill P. aeruginosa Mohamed et al 2012 (40) I, IV
Both models describe the bacterial population as consisting of two principal parts: a drug-susceptible (S), growing state and a non-susceptible, resting (R), non-growing state to which the bacteria transfer governed by the rate constant kSR in response to high population densities. The ciprofloxacin E. coli model features an additional non-colony-forming (Nc) state which the bacteria can transiently enter as an initial response to drug exposure. The system is described by equations 15, 16, and 17: dd = × + ×
15 dd = × × 16
dd = × ( + + ) × 17
where kdeath is the natural death rate, kdrug is the drug effect, kSNc is the transfer rate from S to Nc, and kNcS is the reverse transfer rate from Nc to S. The transfer rate from S to R is given by: = × 18
where Btot is the total bacterial density and PC is a proportionality constant. In the ciprofloxacin PKPD model PC is an estimated parameter while in the colistin PKPD model PC is given by the difference between kgrowth and kdeath scaled by the estimated maximum bacterial density Bmax.
32

The rate constant for transformation from susceptible to Nc bacteria (appli-cable in the ciprofloxacin model) is described by a function that approaches a maximum rate (kSNc,max) at high ciprofloxacin concentrations (CCIP):
where tr50 is the sensitivity parameter (resulting in 50% of the maximum rate) and is the estimated Hill factor for this function, EC50 is the con-centration where half the maximum drug effect (Emax) is reached.
The transfer back to S from Nc (applicable in the ciprofloxacin model) is dependent on the scaled ciprofloxacin concentration times a scaling rate
: = × 20
Given sufficient information the rate constants determining the drug-induced bacterial killing are described by sigmoidal Emax models for both drugs: = ×+
21
where Emax is the maximum effect, EC50 is the concentration where 50% of If there
is insufficient information to estimate the Emax, i.e. the concentrations are low in relation to the EC50, equation 21 collapses to a power model: = × 22
Adaptive and pre-existing resistance Both models characterize a rapid initial kill upon drug exposure followed by subsequent regrowth. In the ciprofloxacin on E. coli model the regrowth is explained by a second pre-existing resistant subpopulation present at fraction FS2 prior to antibiotic exposure. The resistant subpopulation is identical to the main population but with an increased EC50 and a decreased kgrowth.
In the colistin P. aeruginosa model, the development of exposure-driven adaptive resistance reduces the apparent kill-rate constant (kdrug,CST). Com-partments for the degree of resistance development affected the maximal achievable rate constant for bacterial killing (Emax,CST) for a specific concen-tration.
= , ×+ 19
33

, = ( ), × 1 , 23
ONR,CST is the hypothetical amount (from 0 to 1) in the adaptive resistance compartment. The resistance onset rate kon was determined by the colistin concentration (CCST) through a sigmoidal Emax model where kon, max is the maximal achievable resistance rate, while Con50 is the colistin concentration that results in 50% of kon,max and is a Hill coefficient (equation 24). = , × +
24
The rate of reversal of resistance is given by the first order constant koff.
In vitro data (Papers I, III, IV) Bacteria and strains The bacteria and strains used in this thesis are listed along with the MICs of the studied antibiotics in Table 3. The MICs of colistin and meropenem for P. aeruginosa were determined by the Etest method, according to the manu-facturers' instructions (bioMérieux, Lyon, France), on Mueller Hinton II agar (BBL, BD, Franklin Lakes, NJ, USA). The MICs of colistin and ciprofloxa-cin for E. coli were determined by macrodilution in Mueller-Hinton II broth incubated for 24 h at 37°C.
Table 3. The bacteria and strains used in this work
Bacteria / Strain Description MIC (mg/L) Paper
CST CIP MER
P. aeruginosa ATCC27853 Wild type 1S - 1S I
ARU552 Clinical 1.5S - 16r I E. coli LM347 Wild type 0.5S 0.023S - III, IV
C47 Clinical 0.75S 0.047S - IV S Susceptible, r Resistant according to EUCAST 2015 (77)
34

Time-kill experiments (Paper I, III, IV) The antibiotic time-kill experiments performed as part of this thesis work are presented in Table 4. For E. coli combinations of colistin and ciprofloxacin were studied, while for P. aeruginosa combinations of colistin and mero-penem were studied.
Table 4. The intended initial concentrations and sampling times for the time-kill experiments performed in this thesis.
Drug Strain Initial concentration (mg/L) Sampling times (h) Paper
MER
ATCC27853 0.05, 0.1, 0.2, 0.4, 0.8, 1.6, 3.2
0, 0.5, 1, 2, 3, 4, 6, 8,
24 I
ARU552 0, 4, 8, 16, 32, 64, 128, 256
CST
:MER
ATCC27853 0.43:0, 1.5:0, 0:0.2, 0:32, 0.25:0.1, 0.25:0.2, 0.5:0.05, 0.5:0.1, 0.25:0.1(1h)
ARU552 0.43:0, 1.5:0, 0:0.2, 0:32, 1:32, 2:16, 8:16, 4:32, 4:32(1h)
CIP
LM347 0, 0.023, 0.046, 0.092, 0.18 0, 1, 3, 4, 8, 25, 26, 32 III
CST
LM347 0-8*, in 7 steps 0, 1, 2, 4, 6, 9, 12, 24,
32 IV
C47 0-12*, in 7 steps
CST
:CIP
LM347 0:0, 0.046: 0, 0: 1.0, 0.0057: 0.063, 0.017: 0.13, 0.012: 0.063, 0.0029: 0.19, 0.0029: 0.13, 0.046: 0.063 0, 1, 2, 4,
6, 10, 24, 32
IV
C47 0:0, 0.094: 0, 0: 1.5, 0.012:0.093, 0.035:0.19, 0.024: 0.094, 0.0059:0.28, 0.0059: 0.19, 0.094:0.093
(1h) experiment where meropenem was added one hour after colistin, *The initial MIC classi-fication was not harmonized between the laboratories performing the experiments, as a result multiple concentrations were used.
For meropenem experiments in Paper I the concentrations and time points were chosen based on previous experience, for the combination experiments the concentrations chosen were predicted to have no observations below the limit of detection (LOD) but still a pronounced initial bacterial killing phase followed by regrowth by the end of the experiment. In the evaluation exper-iments in Paper III the ciprofloxacin concentrations and time points were those determined by the generated OD aimed to maximize the parameter precision. In Paper IV the colistin concentrations chosen were inspired by the OD in Paper III, and the ciprofloxacin and colistin concentrations and time points in the combination experiments were chosen by OD to maximise the precision in the interaction parameter.
The time kill experiments were performed similarly to as has previously been reported for colistin on P. aeruginosa (78) and ciprofloxacin on E. coli (19). The LOD of viable counts was 10 CFU/ml and was also taken as the
35

LOQ in the analysis. On average three different dilutions were prepared and plated for each sampling time point.
In addition to the listed time-kill studies, previously published data was included in order to support parameter estimation. In paper I colistin static time kill data (78) and dynamic meropenem and colistin combination data (79) were used. The dynamic data were generated over 8 h in a kinetic sys-tem , and the concentrations and drug elimination rates were selected to match a clinical scenario (79). Data from static ciprofloxacin time kill curve experiments on E. coli LM347 (19) was used in In Papers III and IV, and on E. coli C47 (80) in Paper IV.
Measured drug concentrations (Paper I, IV) Colistin has been reported to bind to lab materials, and it is important to consider the subsequent reduction in concentrations in PKPD analyses (79). Actual colistin concentrations were measured for the P. aeruginosa time-kill experiments (Paper I) at 0, 8 and 24 h. In the E. coli experiments with col-istin alone (Paper IV), samples were drawn at 0, 2, 4 and 24 h. The colistin concentrations were determined using a previously established analytical method utilising liquid chromatography-tandem mass spectrometry (LC-MS-MS) (81). In Paper I the colistin concentrations were linearly interpolated between the observed time points while in Paper IV a model for colistin binding to the surrounding was used.
Meropenem concentrations (Paper I) were measured at 0, 8 and 24 hours and degradation was studied by a biological concentration method (82). The meropenem concentration was not quantified for the combination experi-ments as the presence of colistin is known to interfere with the biological assay. The meropenem concentrations were linearly interpolated between the observed time points.
Patient data (Paper VI) AIDA colistin study To date, 187 blood samples from 100 critically ill patients from six hospitals in Tel Aviv and Haifa, Israel, in Athens, Greece, and in Naples, Italy, have been assayed. After the samples were drawn from the patients they were immediately chilled and centrifuged. The plasma was stored at -70 degrees centigrade and shipped to Uppsala for analysis. The samples were prepared according to a previously described protocol and analysed for structural var-iants CMS A+B and colistin A+B by LC-MS-MS (39, 81).
The study was conducted according to the principles expressed in the Declaration of Helsinki. All participating hospitals in the colistin AIDA
36

study obtained ethics approval from their respective ethics committees. In-formed consent was obtained from each eligible patient or the patient’s next of kin.
PK and PKPD modelling In vitro time-kill data (Papers I, III, IV) All bacterial count data were transformed into logarithms for data analysis, but the transform-both sides approach was used so that parameters were estimated on the normal scale (if not otherwise indicated). The analysis in-cluded more than one observation per sampling time point from each tube (i.e. replicates) because all plates with a detectable number of bacteria were included in the data set as raw data and no averaging or similar data manipu-lation was performed. As in previous analyses, the residual error was split into two different components: one consistent difference (L2 correlated) common for all replicates at the same time-point (RES) and one replicate-specific difference (RRES) to avoid bias due to correlations between the replicates (65). For time-points where all dilutions had bacterial counts be-low the LOD, the probability for the observation to be below LOD was esti-mated using the M3 method (83, 84) in order to reduce bias in the parameter estimation (90), and hence the LAPLACIAN option was set in NONMEM.
The average tendencies in the population (the typical parameter values) were estimated along with random effects described by the residual errors. No inter-experimental variability (corresponding to IIV if one time-kill or experiment is viewed as one individual) was estimated. Model performance was assessed by evaluation of diagnostic plots, model fit, and the plausibility of estimated parameter values. In order to discriminate between nested mod-els, the difference in OFV (see equation 5) was used, which is expected to be Chi2 distributed. The more complex model was selected when the reduction in OFV was at least 10.84 compared to a simpler model with one parameter less (p-value <0.001, Chi2 distribution with 1 degree of freedom). The model was also evaluated by performing visual predictive checks (VPC) (85) with stratification on the type of experiments and on the drug concentration.
In Paper I Sampling Importance Resampling (SIR) (86) was used to as-sess the parameter uncertainty distribution and to obtain standard errors, while in Papers III and IV, the NONMEM covariance matrix S was used.
Antibiotic PD Interaction (Papers I, IV) Two empirical interaction models were investigated to describe the combina-tion data for colistin plus meropenem against P. aeruginosa and colistin plus
37
ciprofloxacin against E. coli. The first was a multiplicative model of interac-tion (equation 25): , = , + , + × , × , 25
where , is the combined drug effect, , is the effect of drug a, , is the effect of drug b, and is the interaction effect of the two drugs. The second interaction model employs a power function to describe the in-teraction (equation 26).
, = , × 1 + ,, + , +, × 1 + ,, + ,
26
For both interaction models an I value of zero suggests no interaction, a positive value suggests a higher than expected effect (synergy) and a nega-tive value suggests a lower effect than expected by an additive effect (indif-ference or antagonism).
In addition to the empirical interaction function above, other interaction models were considered to explain the combination effect of meropenem and colistin: a competitive interaction model (87), and functions where colistin was allowed to increase the effective meropenem concentration or the max-imal kill by meropenem (88).
Re-estimation of Colistin PK model (Paper VI) The fit of the new data from the AIDA study to the colistin PK model was evaluated by prediction corrected visual predictive checks (pcVPCs) (89). The fixed effect parameters were re-estimated in NONMEM (LAPLACIAN linearization method) based on the model fit and accepted if the decrease in OFV (see equation 5) was >10.84 (p-value <0.001, Chi2 distribution with 1 degree of freedom). The CMS and colistin observations from the same time-point were L2 correlated. Beal’s M3 method was used to handle data below the limit of quantification (BLOQ) (90).
Dose regimen simulation (Paper I) Based on the developed PKPD models different dosage scenarios in varying populations can be simulated. The PKPD interaction model for colistin and meropenem was applied to simulate potential combination dosage regimens. Total and unbound colistin concentration-time profiles, unbound meropenem concentration-time profiles and P. aeruginosa counts were predicted for a
38

39
typical patient based on colistin (39) and meropenem (71) PK models, de-veloped for critically ill patients Table 1.
PKPD index simulation (Paper II) Dose fractionation studies were simulated in order to investigate the ability to replicate in vivo data and to evaluate the robustness of the PK/PD index type and magnitude in different settings. PK models for meropenem were implemented [mouse (74), adult human (typical, renal dysfuntion and aug-mented CL) (72), and preterm neonatal human (72)], see Table 1. The un-bound simulated drug concentration-time profiles in the central compartment were used to drive the bacterial killing in the meropenem PKPD model de-veloped in Paper 1. A meropenem PK/PD index study performed in mice by Sugihara et al (91) was used as reference and was replicated in simulation (Original scenario). The simulation scenarios are summarised in Table 5 and Table 6.
Table 5 The simulated dose fractionation studies in mice, all doses mimicked s.c. bolus administration except the continuous infusion (c.i.) of the Frequent scenario.
Scenario Bacterial strain Meropenem (mg/kg/day) Dose intervals (h) Original ATCC27853 800*, 400, 200, 0 3, 6, 12, 240.5 x MIC ATCC27853 400*, 200, 100, 0 3, 6, 12, 242 x MIC ATCC27853 1600*, 800, 400, 0 3, 6, 12, 24Resistant ARU552 12800*, 6400, 3200, 0 3, 6, 12, 24Frequent ATCC27853 533, 267, 133, 50, 0 1, 2, 4, + c.i.*In line with Sugihara et al (91) the highest daily dose was not included for the once daily dosage interval.
Table 6 Simulated dose fractionation studies in humans. The doses were 0.5 h i.v. infusions except the continuous infusion (c.i.). The PKPD model for strain ATCC27853 in the predictions.
Scenario Start bacterial burden (log10 CFU/mL)
Meropenem (Css, avgx MIC)
Dose intervals (h)
t1/2β*
Typical patient 6.5 0.0156, 0.0313, 0.0625, 0.125, 0.25, 0.5, 1, 2 4, 8, 16, 32, 64
0, 4, 8, 12, 24, + c.i.
1.4 Renal dysfunc-tion
6.5 3.5
Augmented CL 6.5 0.87 Preterm neonate 6.5 2 High inocula 9 1.4 *The meropenem t1/2 in mouse was 0.31 h
For each dosage regimen, the investigated PK/PD indices (fT>MIC, fAUC/MIC, fCmax/MIC) and the bacterial burden at 24 h were predicted. The mouse simulations were performed with residual error in order to more closely match the in vivo study while the human simulations were performed

without IIV or residual error in order to more clearly distinguish the different scenarios. A sigmoid maximum effect (Emax) model was used to examine the relationship between each index and the efficacy of the drug, measured as log10 bacterial density at 24 h. The Emax model was defined according to: = ×+ 27
where E is the PD endpoint (log10 bacterial burden at 24 h), is the zero effect value (maximum bacterial burden at 24 h), is the value of the PK/PD-index, is the maximum effect (reduction in bacterial burden at 24 h), is the value of the PK/PD index required to achieve 50% of
, and is the sigmoidicity factor. The analysis was performed by the fit function in MATLAB, using the NonLinearLeastSquares method and the robust fit option. The coefficient of determination (R2) was used to choose the PK/PD index with best correlation to bacterial density. The magnitude of the PK/PD indices required for bactericidal effect (here chosen as 99% kill-ing from the bacterial burden at time 0, i.e. 2-log kill) was calculated from the fitted parameter values for each PK/PD index.
Optimal design (Papers III, IV, V) Optimization of ciprofloxacin time kill studies Model re-estimation The ciprofloxacin PKPD model was re-estimated for wild-type E. coli LM347 (MIC = 0.023 mg/L) only and autocorrelation (AC) on the RRES was included in order to avoid the potential problems with overestimation of the residual error variance (65) and suboptimal designs (92). In addition, in this version of the model the kSNc and kNcS rate constants were directly esti-mated.
Optimization The re-estimated model was implemented in the OD software PopED (92) utilizing the full FIM calculation and the FO approximation. Data predicted to be BLOQ were handled by setting the information contribution from these samples to zero. All unfixed parameters from the model were included in the FIM except parameters tNc and ACt1/2. tNc was not included as it was thought that optimising for the two rate constants kNcS and kSNc would add sufficient information on the Nc-state. The ACt1/2 was excluded as it was not part of the original model. In addition, the CFU count at start of the experiment (Btot0) was incorporated in the FIM in order to acknowledge the uncertainty around this value.
40

The optimisation variables were the sampling times and the antibiotic concentrations. Because a practical design was required, several conditions had to be met by the final design:
One sampling schedule for all experimental concentrations A minimal sampling time separation of 1 h with sampling times
at whole or half hours (no duplicates) A night-time rest between 10 and 24 h after start of experiment Only ciprofloxacin concentrations from the original design to be
used.
The sampling times available for optimizations were every 0.5 h from 0 to 32 h except the night sampling pause.
The optimization was performed as an iterative design reduction whereby in each step one sampling time for all concentrations or one time series of an antibiotic concentration was removed. The D-optimal design for the two cases was computed (simultaneous optimization over all possible combina-tions of concentrations and sampling times) by the modified Federov ex-change algorithm (MFEA) implemented in PopED.
The reduced design with the highest OFV value (corresponding to the highest predicted parameter precision) was selected and the process was repeated for this design. A minimal design was selected as the smallest de-sign achieving an efficiency (efficiency = OFVreduced/OFVoriginal)^(1/Nunfix) > 0.9, where Nunfix is the number of unfixed parameters.
Evaluation In order to test the performance of the reduced design two pairs of experi-ments were performed in vitro as described above (Time-kill experiments), and the parameter precision was assessed by the NONMEM covariance ma-trix S.
Optimisation of ciprofloxacin and colistin combination experiments The design optimization was performed with the goal of maximizing the precision of the estimated interaction of colistin and ciprofloxacin without having prior knowledge on the interaction. Two E. coli strains were chosen for the optimization; LM347 (wild type) and C47 (clinical strain) (Table 3).
The interaction between the drugs was assumed to be described by a mul-tiplicative interaction model (equation 25) and three interaction levels (-0.5, 0, +0.5) corresponding to antagonism, additivity, and synergy, respectively. Since the C47 strain had not been previously modelled for ciprofloxacin its EC50 was determined through an established MIC correlation for ciprofloxa-
41

cin and E. coli (80) and the remaining model parameters were assumed to be the same as for LM347 (with the exception of an assumed increased fraction of cells in the R state (1/1000), based on prior experience with clinical strains). Colistin was described by a published model (78) which drug effect parameters were re-estimated on new single drug data (Table 4), and the remaining parameters fixed to the same values as for ciprofloxacin.
The design parameters considered for optimization were the concentra-tions of ciprofloxacin and colistin (optimized over 0.125, 0.25, 0.375, 0.5, 0.75, 1, 1.5, 2, and 4 x MIC respectively), and the sampling times (from 0.5 to 32 h, in steps of 0.5 h). A growth control (no antibiotic) as well as a sam-ple at time zero were set to always be present. Additionally, samples were not allowed to be placed between 10 and 24 h after start of experiment, and the minimal sampling time separation was 1 h except for the first hour where a separation of 0.5 h was allowed. The same design was required for both strains and in total the design allowed 8 time-kill curves and 7 sampling times per strain.
The combined model was implemented in PopED utilizing the full FIM calculation and the FO approximation. Data predicted to be BLOQ was han-dled by setting the information contribution from these samples to zero. The experimental design, , was optimized by the modified Federov exchange algorithm (MFEA) as implemented in PopED in order to simultaneously achieve the maximum precision in the interaction effect estimates (I) for the two strains over the three interaction levels. The OFV value to be maxim-ized (equation 28) was calculated using a minimax criteria (93) maximizing the minimum determinant of the interesting part of the FIM (Ds optimality (20), i.e. the design accounts for the influence of the uncertainty of the unin-teresting parameters in those set as interesting) for the alternative interaction magnitudes and strains.
OFV = min… | ( , ) |, 28
where i is one of the m combinations of interaction levels and bacterial strains. The optimization criteria was implemented as a PopED penalty func-tion written in MATLAB.
In the design the natural growth parameters and the ciprofloxacin drug ef-fect parameters (except EC50 for C47 which was considered less well known due to being derived by MIC correlation, and hence set as uninteresting) were assumed to be well determined and therefore fixed. As the colistin PKPD model was based on fewer experiments and had not been as rigorous-ly validated as the ciprofloxacin model (80) the colistin drug effect parame-ters were considered less well known and were included as uninteresting parameters in the optimization.
42

Inclusion of IOV in the FIMMAP (Paper V) Additions to the FIM In order to perform design optimization for maximum precision in individual parameters in the presence of IOV two methods were considered:
MAPocc The IOV was added to the individual FIM as an occasion deviation sampled per individual occasion from the prior IOV distribution . The prior IOV covariance matrix was utilized as occasion prior (equation 29). , = , , , , , , , … ,= ( , , , … ) 29
where is the vector of occasion deviations for the jth occasion of the ith individual, m is the number of occasions and j == .
The inclusion of the occasion deviations in the MAPocc approach is analo-gous to how the individual deviations are handled in the FIMMAP (equation 12).
POPocc The IOV was included in the individual FIM as an occasion variance term: , = , , ,= diag , , 30
where 0v,v is the v-by-v zero matrix acting as prior for , and v is the number of occasion effects in the prior population model. Using the first order (FO) approximation proposed by Retout and Mentré (94) the occasion variance contribution to the individual FIM can then be written as (92): f (. )| ,, × × f (. )| ,,f (. ) = f , g , , , , , … , ,
31
As a reference, the designs were optimised without inclusion of IOV (using the FIMMAP as is), either ignoring the known IOV (case Omit) or using a prior IIV distribution inflated with IOV (case Inflate). The latter mimics the model result from a study design that neglects the possibility of separating IIV and IOV.
43

Design Optimization The methods were tested on two models: the Colistin population PK model by Mohamed et al (39) and a constructed one compartment PK model (1-COMP). The models were implemented in the optimal design software PopED using the FO approximation of the FIM. The prior FIM functionality was used to supply the prior IIV covariance matrix . PopED supports IOV as a population random effect making the implementation of method POPocc straightforward.
The individual deviations vector for the FIM calculation was drawn from (300 samples) and reused for each model and optimization iteration to decrease the Monte Carlo error. The occasion parameter vectors for the MAPocc method , were sampled in the same manner. The expectation of the logarithm of the determinant of the interesting part of the FIM over the prior was employed as the criterion to be maximised (Ds optimality (20)): OFV = E log | + |, + 32
Where FIMi,uninteresting is the FIM for uninteresting parameters (defined be-low). For the MAPocc criterion the occasion deviation parameters , were taken as uninteresting while the POPocc method was computed with the occa-sion variance parameters fixed. In all cases (Omit, Inflate, MAPocc, PO-Pocc) the residual error variances, , and the population parameters, , were fixed.
The sampling schedules for the two test models were optimised using the PopED Random Search, Stochastic Gradient and Line search methods as described by Nyberg et al. (92). Schedules of three or six sampling times over 36 h (three occasions) were investigated for the colistin PK model. Both CMS and colistin concentrations were assumed to be analysed at each time point. For the 1-COMP model a sampling schedule of five samples was op-timised over 24 h, with no time restrictions.
Standard error prediction The predicted individual standard errors (iSE) of the individual parameters ( ) were computed as the square root of the diagonal of the inverse indi-vidual FIM plus the prior: = diag( + )
33
where is the 1-by-u vector of predicted mean standard deviations of the u EBEs of individual i.
The predicted iSEs were compared with the individual covariance from the NONMEM .phi file.
44

Shrinkage Prediction Combes et al (95) calculated the expected SH EBEs based on the FIMMAP. Here the expected covariance matrix was used and the SH was computed on standard deviation scale:
= 1 diag 1n ( + ) × 34
where SHpred is the vector of predicted shrinkages of the u EBEs on a stand-ard deviation scale.
Design performance The expected performance of the design was evaluated by 300 stochastic simulation and estimations (SSE) of the EBEs, keeping the population pa-rameters of the full PK model fixed (NONMEM estimation setting MAXEVAL=0). The parameter precisions of the EBEs were assessed by the iSE as calculated from the square root of the individual covariances in the NONMEM .phi file. The SH was calculated as in equation 8.
Optimization of a sparse colistin individual PK sampling schedule (Paper VI) A sparse individual PK sampling schedule was developed based on the population PK model for colistin and its prodrug CMS (39) using the MAPocc method of individual parameter optimization in order to account for the expected IOV (equation 29) as described above. The same optimization settings as previously (Paper V) for MAPocc were used.
A maximum of 2 samples per patient were to be taken. Sampling was al-lowed in the interval of 0-72 h after start of CMS infusion and at +- 3 h in-tervals around the (daytime, every 24th h) administration times. No samples were to be taken during the CMS infusion or 15 minutes post infusion. One occasion was set as one day (24 h interval, 2 doses per occasion). A LOQ of 0.025 μM colistin/CMS was used below which a sample was assumed to contribute no information.
The expected iSE and SH were assessed by SSE as previously described above (Design performance). The improvement in information in the indi-vidual parameters after individual concentration measurements was deter-mined by the decrease in individual standard deviation (dSD), given as: dSD = 1 iSE /
35
45

where is the kth diagonal element of the population IIV matrix . If no information is gained for the individual the dSD is 0, and if the individual information is very rich the dSD will be close to 1.
Software The population analysis software NONMEM 7 (66) was used for model estimation, and dose regimen simulation. PsN (96) was used to manage NONMEM runs and for performing SSEs, VPC and SIR scripts. R (version 3, www.r-project.org) and the R-based program Xpose (version 4 (97)) was used for graphical analysis and evaluation, and statistical analysis. The de-sign optimization was performed in PopED (92) running on MATLAB R2011a (The MathWorks, Inc., Natick, Massachusetts, United States) which was also used to simulate the PK/PD indices.
46

Results
PKPD models PKPD models describing the interaction of colistin with meropenem on one meropenem-susceptible and one meropenem-resistant strain of P. aerugino-sa (Paper I) and with ciprofloxacin on one wild type and one clinical E. coli strain (Paper IV), were developed from established PKPD models. In both cases the development of resistance to colistin was described as adaptive while resistance to meropenem and ciprofloxacin was described as emerging from a pre-existing resistant subpopulation.
Colistin and Meropenem on P. aeruginosa (Paper I) A previously developed model structure for ciprofloxacin on E. coli, but excluding the transient Nc compartment featured in that model (19), de-scribed the meropenem static time-kill data well. The meropenem model was combined with an established model for colistin against P. aeruginosa and this was applied to jointly describe the single-drug, static, time-kill data (col-istin or meropenem) and the combination time-kill data (static or dynamic), see Figure 6. The interaction of the two drugs in combination was best de-scribed by the empirical power model of interaction (equation 26) which decreased the OFV by 657 units for ATCC27853 and 78 units for ARU552. The estimates of the interaction parameter I indicated a lower than expected effect compared to an additive interaction for ATCC27853 (I=-2.58, 95% CI: -2.74 to -2.42) and a higher effect than expected (synergy) for ARU552 (Int= 1.29, 95% CI: 1.16 to 1.44). The estimated separate interaction pa-rameters for the pre-existing meropenem-resistant subpopulation were not significantly different. VPCs showed that the interaction model was ade-quate for both bacterial strains for meropenem alone (Figure 7a), and for both static (Figure 7b) and dynamic combinations (Figure 7c). The parame-ter estimates and precision are presented in Table 7.
47
Figure 6 PKPD model developed to describe combination ciprofloxacin (CIP) and colistin (CST) in vitro time-kill experiments on E. coli. In the model the bacteria (in green) are assumed exist in three states: 1. Growing and drug sus-ceptible (S), 2. Non-growing and non-susceptible resting (R), and 3. Transiently non colony forming (Nc). The bacteria enter the R state as response to high population densities and the Nc state as response to exposure to CIP (yellow). Resistance to CIP is explained by the presence of a second subpopulation with decreased CIP sensitivity. Resistance to CST (red) is explained as an adaptation (grey), inhibiting the CST drug effect. Decrease in CST over the course of the experiment was described by binding to lab material (CSTB), and only unbound colistin (CSTU) was assumed to affect the bacteria.
48

Figure 7 Visual predictive checks for the colistin (C) and meropenem (M) combina-tion model for P. aeruginosa (ATCC27853) (top row per panel) and for meropenem-resistant P. aeruginosa (ARU552) (bottom row per panel). The observed bacterial counts ( --) of the simulated data. a) Static meropenem drug data, b) static combination drug data, and c) dynamic combination drug data. Colistin concentrations indicated are the initial values as measured by LC-MS/MS.
49

50
Table 7 Estimated PKPD-model parameters describing the growth and killing of P. aeruginosa for the combined colistin and meropenem model. RSE in parenthesis.
Parameter Explanation Colistin Meropenem kgrowth (h
-1) growth rate ATCC27853 1.08 (2.2%) ARU552 0.814 (1.6%) kgdecrease(%) decrease in kgrowth for S2 0.384 FIX ATCC27853 0 FIX ARU552 53.6 (3.7%) kincrease(%) increase in kgrowth for dynamic 33.1 (10%) kdeath (h
-1) natural death rate constant 0.179 FIX Bmax (log10 CFU/ml)
maximum bacterial density 9.11 (0.4%)
FS2 start fraction S2, log10 -2.83 (3.2%) EC50 (mg/L) conc. for 50% of Emax ATCC27853 1.84(11%) - ARU552 - 17.7(4.8%) Slope(L/mg*h) linear function for drug effect ATCC27853 - 2.16 (2.4%) ARU552 17.2 (8.3%) - ShiftS2 (%) increase Ceff S2 - 2250 (6.5) Emax (h
-1) maximum kill rate constant ATCC27853 282†(FIX) ARU552 1.74(3.4%) γ hill factor drug effect ATCC27853 1 FIX 0.376(2.3%) ARU552 1 FIX 2.79 (14%) δ Hill factor adaptive resistance 0.0245(8.0%)
Hill factor drug inhibition 1.08(3.1%) kon,max(L/mg*h) max rate of resistance develop-
ment
ATCC27853 0.779 (11%) ARU552 2.68 (10%) Con,50 (mg/L) conc. for 50% of kon,max
ATCC27853 2.42 (15%) ARU552 18.6 (15%) koff(L/mg*h) rate constant resistance reversal 0.103(4.4%) I interaction parameter ATCC27853 -2.58 (3.1%) ARU552 1.30 (5.3%) RES residual error variance (on
log10 scale) 0.422(3.1%)
RRES replicate residual error variance (on log10 scale)
0.0364(2.8%)
†value was fixed to previously reported (78)

Dosage regimen simulation for meropenem and colistin in combination (Paper I) The possibility of overcoming P. aeruginosa strain ARU552 resistance to meropenem by using sufficiently high, clinically achievable colistin (71) and meropenem (39) plasma concentrations was predicted for a typical individu-al based on the final model, with interaction between the two drugs. Colistin alone did not result in any net kill at 24 h, even with the highest loading dose of 12 MU (results not shown). Similarly, no net kill was observed at 24 h for the highest dose of meropenem alone (2000 mg q8 h; Figure 8, first row).
When the two drugs were combined, the high meropenem dose (2000 mg q8 h) was required to achieve 3-log kill at 24 h, but did so regardless of the colistin loading dose (Figure 8, second row, right). The time to achieve a 3-log kill was predicted to be dependent on the meropenem dose and was more than twice as long for the 1000 mg dose as for the 2000 mg dose (Figure 8, second row, centre).
Figure 8 Model predictions of bacterial kill by meropenem only (first row) and bac-terial killing by colistin and meropenem in combination (second row) for a typical critically ill patient. Estimated PKPD-model parameters for the meropenem-resistant strain P. aeruginosa ARU552 were used in all predictions. CMS and meropenem doses were simulated as 15-min and 3-hour infusions, respectively. The grey lines represent the bacterial count at initiation of therapy, the bacterial count for a 3-log-unit kill, and the bacterial count below the LOD at 10 CFU/ml.
51

PK/PD index simulation for meropenem (Paper II) The results of the simulated meropenem dose fractionation studies are com-piled in Table 8. The results of the in vivo mouse study by Sugihara et al (91) were replicated by the original scenario with fT>MIC selected as the best predictor, at similar explanatory power (R2 of 0.74 and 77, respectively) and with similar magnitudes needed for a 2-log kill (45 and 37%, respective-ly), see Figure 9.
In the simulations, the required fT>MIC was associated with the susceptibil-ity of the bacteria to meropenem (Table 8). For the meropenem-resistant ARU552 (MIC = 16 mg/L), the fT>MIC required for a 2-log kill was in-creased to 52%. Similarly, if the MIC of the meropenem-susceptible ATCC27853 (MIC = 1 mg/L) was miss-specified to 2 mg/L, the required fT>MIC was increased to 52%, and if the MIC was miss-specified to 0.5 mg/L, the fT>MIC decreased to 23%.
The most predictive index was associated with the simulated PK data and the dosage regimen (Table 8). In the scenarios where fT>MIC was selected as the best predictor for achieving a 2-log kill from the initial inoculate, based on the coefficient of determination, the ratio of the longest dosage
1/2 was high (mouse simulations, except the fre-quent dosage scenario, and human typical patient or augmented CL). Con-versely, for the scenarios where fAUC/MIC was the best predictor, the ratio
Figure 9 Literature in vivo PK/PD index study by Sugihara et al (top), the study replicated in simulation (bottom). Circles – observations/predictions, thin horizontal dashed line - the viable cell count at start of therapy (as CFU/thigh or CFU/mL), thick dashed line – fitted Emax curve, thin dashed lines – 95% prediction interval around the fitted curve (shown for simulated data with R2 values > 0.3). The magni-tudes of the PK/PD index required for a 2-log decrease at 24 h from the viable cell count at start of therapy are indicated as well as the R2 values of the curve fits.
52
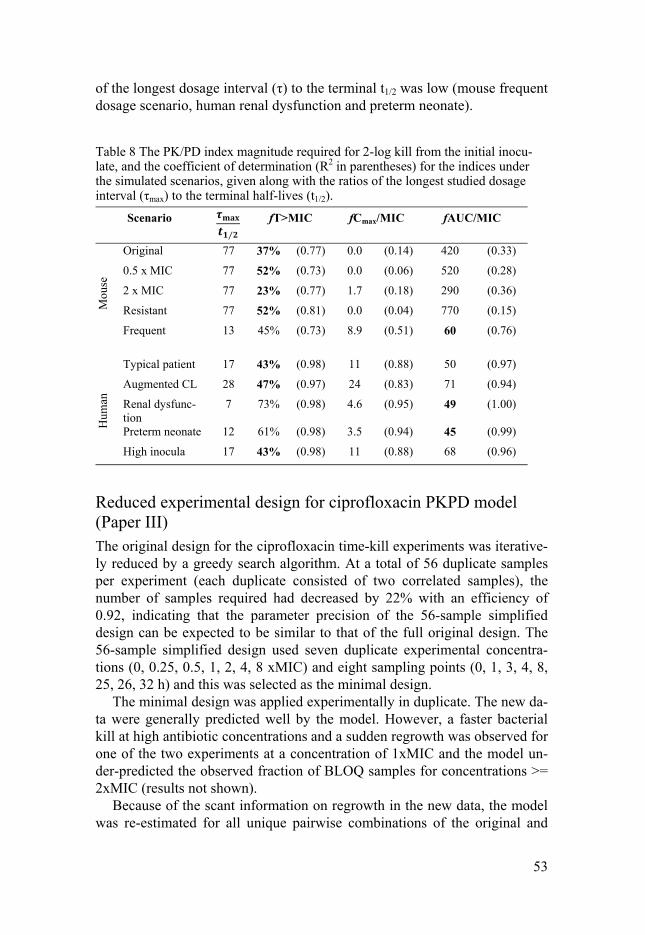
53
of the longest dosage interval (τ) to the terminal t1/2 was low (mouse frequent dosage scenario, human renal dysfunction and preterm neonate).
Table 8 The PK/PD index magnitude required for 2-log kill from the initial inocu-late, and the coefficient of determination (R2 in parentheses) for the indices under the simulated scenarios, given along with the ratios of the longest studied dosage interval (τmax) to the terminal half-lives (t1/2).
Scenario ⁄
fT>MIC fCmax/MIC fAUC/MIC
Mou
se
Original 77 37% (0.77) 0.0 (0.14) 420 (0.33)
0.5 x MIC 77 52% (0.73) 0.0 (0.06) 520 (0.28)
2 x MIC 77 23% (0.77) 1.7 (0.18) 290 (0.36)
Resistant 77 52% (0.81) 0.0 (0.04) 770 (0.15)
Frequent 13 45% (0.73) 8.9 (0.51) 60 (0.76)
Hum
an
Typical patient 17 43% (0.98) 11 (0.88) 50 (0.97)
Augmented CL 28 47% (0.97) 24 (0.83) 71 (0.94)
Renal dysfunc-tion
7 73% (0.98) 4.6 (0.95) 49 (1.00)
Preterm neonate 12 61% (0.98) 3.5 (0.94) 45 (0.99)
High inocula 17 43% (0.98) 11 (0.88) 68 (0.96)
Reduced experimental design for ciprofloxacin PKPD model (Paper III) The original design for the ciprofloxacin time-kill experiments was iterative-ly reduced by a greedy search algorithm. At a total of 56 duplicate samples per experiment (each duplicate consisted of two correlated samples), the number of samples required had decreased by 22% with an efficiency of 0.92, indicating that the parameter precision of the 56-sample simplified design can be expected to be similar to that of the full original design. The 56-sample simplified design used seven duplicate experimental concentra-tions (0, 0.25, 0.5, 1, 2, 4, 8 xMIC) and eight sampling points (0, 1, 3, 4, 8, 25, 26, 32 h) and this was selected as the minimal design.
The minimal design was applied experimentally in duplicate. The new da-ta were generally predicted well by the model. However, a faster bacterial kill at high antibiotic concentrations and a sudden regrowth was observed for one of the two experiments at a concentration of 1xMIC and the model un-der-predicted the observed fraction of BLOQ samples for concentrations >= 2xMIC (results not shown).
Because of the scant information on regrowth in the new data, the model was re-estimated for all unique pairwise combinations of the original and

minimal experiments in order to investigate parameter precision. The covari-ance step of the re-estimations was successful for the pure minimal design data (two minimal experiments), for seven combinations (58%) using the mixed experiments (minimal + original experiments) and 15 runs (67%) using the original design (two original experiments). The resulting RSEs are reported as boxplots in Figure 10. The Emax parameter exhibited a signifi-cantly (p<0.05, two-sided Mann-Whitney U-test) increased (+20 percentage points) RSE for the mixed design group.
Figure 10 Boxplots (1st, 2nd, 3rd quartile + whiskers) illustrating the distribution of parameter precision (as relative standard errors, RSEs) for model re-estimations based on mixed sets of data including the minimal design or sets of data using only the original design. The upper whisker extends to the highest value that is within 1.5 * IQR of the 3rd quartile, where IQR is the inter quartile range. The lower whisker extends to the lowest value within 1.5 * IQR of the 1st quartile. Data beyond the end of the whiskers are plotted as black points. The RSEs of the pure minimal design validation data are plotted as x.
54

55
Colistin and ciprofloxacin interaction study on E. coli (Paper IV) The previously published models for ciprofloxacin on E. coli (19) and col-istin on P. aeruginosa, and a newly developed model of colistin binding to surroundings were combined (Figure 6) to optimise the experimental design of the combination experiments for the two E. coli strains C47 and LM347. The optimal sampling times and concentration combinations for the three interaction scenarios are presented in Figure 11. The predicted standard errors of the interaction parameter I are presented in Table 9.
Figure 11 Predicted time-kill curves for the E. coli strains C47 and LM347 under the three interaction levels (antagonism I=-0.5, additivity I=0, and synergy I=0.5) using the single drug models. Each curve represents one drug combination with the drug concentrations as multiples of the MIC for the drug and strain. The OD derived sampling times are indicated by circles.
The combined model was applied to the experimental data and, after pa-rameter re-estimation (parameters given in Table 10), adequately described the time-kill data for colistin alone (Figure 12a) and for colistin and ciprof-loxacin in combination (Figure 12b). The interaction between ciprofloxacin and colistin was best described by the power model of the interaction in equation 26 which resulted in a drop in OFV of 14 units for LM347 but no interaction parameter was statistically significant (α=0.001) for strain C47 , i.e. the dynamic interaction was concluded to be best described as additive, based on the data. In order to enable comparison with the OD predictions the estimated interaction values and SEs for both strains are presented in Table 9.
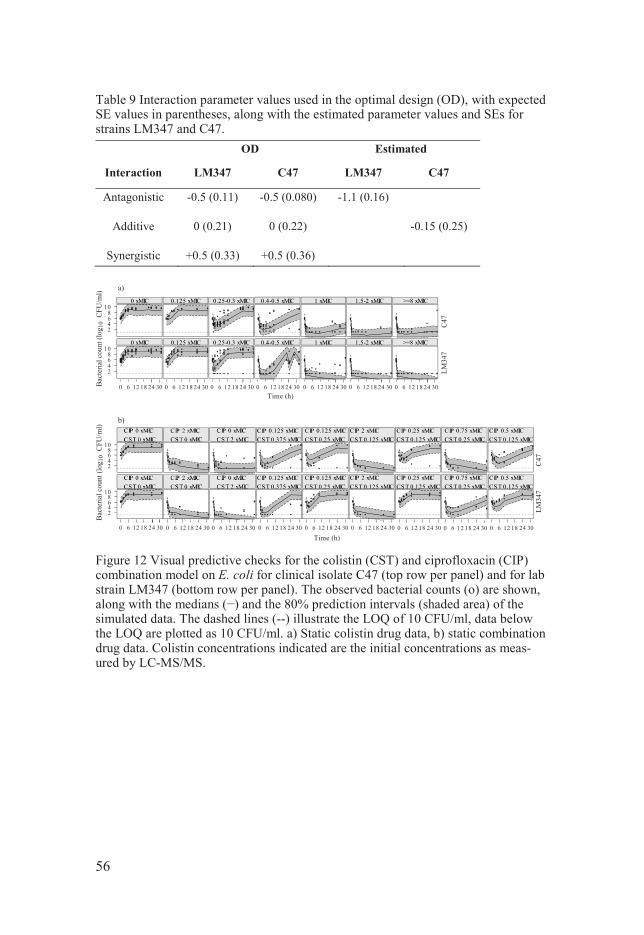
Table 9 Interaction parameter values used in the optimal design (OD), with expected SE values in parentheses, along with the estimated parameter values and SEs for strains LM347 and C47.
OD Estimated
Interaction LM347 C47 LM347 C47
Antagonistic
-0.5 (0.11) -0.5 (0.080) -1.1 (0.16)
Additive
0 (0.21) 0 (0.22) -0.15 (0.25)
Synergistic +0.5 (0.33) +0.5 (0.36)
Figure 12 Visual predictive checks for the colistin (CST) and ciprofloxacin (CIP) combination model on E. coli for clinical isolate C47 (top row per panel) and for lab strain LM347 (bottom row per panel). The observed bacterial counts (o) are shown, along with the msimulated data. The dashed lines (--) illustrate the LOQ of 10 CFU/ml, data below the LOQ are plotted as 10 CFU/ml. a) Static colistin drug data, b) static combination drug data. Colistin concentrations indicated are the initial concentrations as meas-ured by LC-MS/MS.
56

Table 10 Estimated PKPD-model parameters for growth and killing of E. coli for the combined colistin and ciprofloxacin model. RSE in parentheses.
Parameter Explanation Colistin Ciprofloxacin
kgrowth (h-1) growth rate constant 1.70 FIX kgrowth2(h-1) growth rate constant S2 0.384 FIX kdeath(h-1) death rate constant 0.179 FIX Bmax (/h*CFU/mL)
proportionality constant 3.97*108 (1%)
FS2 start fraction S2 8.13e-7 FIX EC50(mg/L) conc. for 50% of Emax C47 1.78 (45%) 0.0879 (21%) LM347 0.441 (37%) 0.0465 (21%) S2 1.25 FIX Emax(h-1) max kill rate constant 273 FIX 7.47 (26%) Hill factor drug effect 1.76 (10%) Hill factor adaptive re-
sistance 0.281 (67%)
Hill factor drug inhibition 1.01 (2%) kon,max(L/mg*h) max rate of resistance
development
C47 7.45 (62%) LM347 0.795 (41%) Con,50(mg/L) conc. for 50% of kon,max C47 2.15 (45%) LM347 6*10-4 FIX koff(L/mg*h) rate resistance reversal 0.128 (13 %) kSNc,max(h-1) max transfer rate constant S
to Nc 3.23 (33 %)
sfNcS (h-1) scale factor kSNc 0.0586 (87 %) kSNc,50 (mg/L) conc. 50% of kSNc,max 0.175 (10 %) tNc (h) Duration for kSNc 5.3 FIX Int interaction parameter C47 0 (additive) FIX LM347 -1.12 (15 %) RES (logn cfu/ml)
residual error SD 3.32 (0.8)
RRES (logn cfu/ml)
replicate residual error SD 0.33 (0.7)
57

Inclusion of IOV in the FIMMAP (Paper V) The inclusion of IOV elements in the FIMMAP markedly shifted the design as compared with the two cases where the IOV was ignored in the optimisation process (Omit and Inflate) which resulted in identical designs (Figure 13). For the 1-COMP model (additive or proportional error) the MAPocc and PO-Pocc methods spread the times for sampling over all available occasions (dos-age intervals) while Omit and Inflate concentrated the sampling at the first and last occasions. For the colistin PK model, the pattern was different. Here MAPocc and POPocc placed the time of measurements at the first occasion only when three samples were available, while Omit and Inflate sampled on the first and last occasions. When the number of available samples was in-creased to six, MAPocc and POPocc added a single sample outside the first occasion while Omit and Inflate added further sampling to the first and last occasions.
The effects of the different sampling patterns were evaluated by simula-tion and re-estimation in NONMEM using the full models. Compared to Omit and Inflate, the MAPocc and POPocc sampling patterns resulted in overall improved individual parameter precision, as given by the NONMEM indi-vidual standard error (iSE), see Figure 14. In addition, the agreement be-tween the NONMEM and PopED iSE was much better for MAPocc and PO-Pocc than for Omit and Inflate, which under-predicted the iSE, indicating that the MAPocc and POPocc individual FIMs are closer to the individual covari-ance matrix computed by NONMEM.
The result was similar when investigating SH in the (Figure 15). The predicted SH (equation 34) based on the MAPocc and POPocc methods were close to the observed SH from the simulation and re estimation in NONMEM for most parameters. In contrast, the observed SH was higher for Omit and Inflate and the SH predictions were optimistic.
The computational effort (as evaluated by one FIM computation) was highest for POPocc, followed by MAPocc, and fastest for Omit and Inflate (Figure 16)
58

Figure 13 PK profiles of models 1-COMP (top) and Colistin PK (bottom), Colistin: solid line, CMS: dashed line) and sampling schedules for Omit, Inflate , MAPocc, and POPocc (from top to bot-tom in each panel) with the number of samples per time point indi-cated on horizontal lines. For all models samples were assumed to be taken post-dose in the respective occasion.
59

Figure 14 Boxplots (1st, 2nd, 3rd quartile + whiskers) of the distribution of indi-vidual SE (iSE) per parameter and design from PopED (SE of
IK) and NONMEM (SE of EBE). The upper whisker extend to the highest value that is within 1.5 * IQR of the 3rd quar-tile, where IQR is the inter quartile range. The lower whisker extends to the lowest value within 1.5 * IQR of the 1st quar-tile.
Figure 15 The pre-dicted SH (PopED) per parameter and design (using the respective methods) compared with the re-estimated SH (NONMEM) (using the full model).
Figure 16 Runtime on a 2.7 GHz intel i7 machine for one FIM calculation for the two models.
60

Sparse sampling schedule for colistin (Paper VI) The MAPocc method developed in Paper V was successfully applied to de-velop an optimal sampling schedule for estimation of colistin individual exposure determinates. The optimal sampling times occurred at 45 minutes (15 minutes after the end of the 1st infusion) and at 22 h (9.5 h after the end of the 2nd infusion).The design was predicted to be satisfactory for individual CL (iCL) estimation, with an expected mean decrease in uncertainty (dSD) of 63% (from the prior population IIV of 42% to the expected individual standard error of 15%) and a low SH of 12%. The individual estimates of intercompartmental clearance Q and residual error magnitude ER were pre-dicted to be less well determined but were judged to have little consequence for individual exposure (AUC) determination. The study protocol was later relaxed to allow inclusion of patients after initiation of treatment but the design was still kept to the 15 minutes and 9.5 h post-infusion sampling times.
Samples from 100 patients have been analysed to date. Twenty-eight of the patients adhered to the original study protocol (early protocol Figure 17a) while 44 patients entered the study after initiation of colistin treatment (late protocol Figure 17b) and the remaining 28 patients did not conform to the optimised sampling schedule (late protocol Figure 17 c).
The colistin PK model was re-evaluated on the new patient data; it pre-dicted the typical values and variability (observed percentiles were within the 95% confidence interval for most bins) reasonably well for colistin and CMS at early (pre-24 h) and late (post-24 h) time points (see pcVPC (89); Figure 18). Similar to a recent PK study on CMS and colistin (98), the high-er than expected CMS peak was explained by a higher fraction of available CMS A+B in the formulation used in the current study. The increased avail-ability was estimated to be 45% here (64% in the recent PK study). In addi-tion, a 35% decrease in the fraction of CMS converted to colistin was esti-mated; this could have been because a higher degree of sulphomethylated colistin was present in the CMS administered in the current study, resulting in more substance available for renal clearance (98). In addition, the data were better explained (dOFV> 10.84) by applying one sampling occasion per dosage interval as opposed to the 24 h occasion duration used in the de-sign optimisation. The remaining population parameters were kept (fixed) at the same values as in the original model.
61

Figure 17 Representative CMS and colistin concentration-time profiles for a) indi-viduals recruited before the initiation of therapy who conformed to the optimised sampling protocol, b) individuals recruited after initiation of therapy who conformed to the optimal sampling times, and c) individuals who did not conform to the opti-mal sampling times. Triangles - nominal 45 min sample observations, circles – nom-inal 22 h observations (10 h after the start of the 2nd infusion), solid lines – popula-tion predictions, dashed lines – individual predictions (excluding occasion variance), dot-dash lines – LOQ.
Figure 18 Prediction-corrected visual predictive check (pcVPC (89)) for CMS (top) and colistin (bottom) at early (pre-24 h) and late (post-24 h) time points. Circles – observations, solid lines – medians (50th percentiles) of observations, dashed lines – 5th and 95th percentiles of observations, shad-ed areas – 95% confidence intervals of the 2.5th, 50th and 97.5th percentiles based on 300 simulations of the sam-ple.
62
The re-estimated model was used to evaluate the design performance for the 28 patients in the early protocol group. For these data, the iCL was estimated with lower precision than used for the simulated study (dSD=39%, p<0.05, t-test) and with higher SH (29%). The iCL estimate for the 44 patients in the late protocol group was estimated with higher precision (dSD=66%, p<0.05, Welch 2-sample t-test) than used for the early protocol group and had an over-inflated iCL distribution (negative SH=-5%). Lastly, the group of 26 patients who did not conform to the optimised sampling times had interme-diate precision in the iCL (dSD=51%). The choice of occasion duration in the model had little impact on the results.
63

Discussion
PKPD models (Paper I and IV) In this thesis, previously developed PKPD models were applied to describe the interaction of colistin and meropenem against P. aeruginosa and of col-istin and ciprofloxacin against E. coli. The effects of combination therapy were successfully described by combining the model structures and estimat-ing an interaction function. This supports these model structures and the general use of PKPD models, including those for combination therapy, in the infectious disease area.
For all three antibiotics and both bacterial strains, resistant bacterial re-growth was observed during the duration of the experiment. The resistance to colistin was described as adaptive and the rate at which it developed was dependent on the drug concentration and the duration of exposure, with a gradual return to susceptibility when the drug concentrations diminished. Adaptive resistance to colistin has been well described for P. aeruginosa (55, 99); it is thought to be a consequence of reduced permeability of the outer membrane caused by alterations to its architecture and the lipid com-position by modifications to the lipopolysaccharides (LPS), and also by re-duced Mg2+ and Ca2+ content on the cell surface (56, 100-104). There is less evidence for adaptive resistance to colistin for E. coli but the adaptive re-sistance model adequately described the data (Figure 12) and the rate of re-versal of resistance was robustly estimated (low RSE, see Table 10), which suggests a similar mechanism.
Resistance to both ciprofloxacin and meropenem was described as pre-existing, i.e. the observed regrowth could be explained by the presence of a subpopulation with decreased susceptibility to the drug at the start of the experiment. The ciprofloxacin on E. coli PKPD model has been extensively covered elsewhere (19) and will not be further discussed here. Support for pre-existing P. aeruginosa resistance to meropenem can be found in studies of wild-type ATCC27853 exposed to meropenem which revealed the pres-ence of bacteria with decreased susceptibility at the start of the experiment (105). The mechanism of resistance was subsequently found to be porin de-letion in combination with efflux pump overexpression for higher degrees of resistance (58), which are recognized as contributing to carbapenem re-sistance for P. aeruginosa (106).
64

The interaction of the drugs in the colistin and meropenem combination experiments on P. aeruginosa and the colistin and ciprofloxacin combination experiments on E. coli was best described by the empirical interaction model in equation 26. The model assumes additivity in effect as null interaction and collapses to the single drug effect model if only one of the drugs is present. Different interaction levels were found for the studied strains for both drug and bacteria combinations: synergistic (meropenem-resistant ARU552) and antagonistic (meropenem-susceptible ATCC27853) for colistin and mero-penem, and synergistic (C47) and additive (LM347) for colistin and ciprof-loxacin. Although an interaction based on equation 26 is labelled as antago-nistic (I<0), it does not necessarily mean that the combination has a lower kill than the single agent. For a drug with its effect described by an Emax function the drug will be antagonistic with itself as: × 2+ 2 < 2 × ×+ 36
In spite of this, few would argue that doubling the concentration would give worse effect. An example of when an antagonistic combination with greater net kill compared to the single agent could be beneficial is when it is impos-sible to increase the dose of the single agent because of toxicity concerns, e.g. for colistin. In such a situation, the additional effect of the added drug could be sufficient to achieve the treatment target, even if the combined ef-fect is less than additive.
The flexibility of the empirical interaction function allowed the models to describe a wide range of interaction scenarios, which was utilized in the optimal experimental design for the ciprofloxacin and colistin combination study. One type of mechanistic interaction which is inherent to both models is subpopulation synergy (88, 107). In contrast to the interaction described above, where the drugs act jointly, in subpopulation synergy the drugs acts efficiently on subpopulations which are susceptible to at least one of the drugs. By eradicating the small pre-existing subpopulation resistant to ciprofloxacin or meropenem but susceptible to colistin at early time points, colistin could prevent regrowth of this sub-population. In the models the interaction parameter was assumed to be identical for the two subpopula-tions. In situations with richer data it may be possible to estimate separate interactions for subpopulations with different susceptibility.
As illustrated, the potential interactions to consider when evaluating combi-nation therapy are manifold. Model-based analysis allows many treatment options and their effects to be evaluated efficiently by simulation in different patient groups.
65

Dose regimen simulation of Meropenem and Colistin in combination (Paper I) The potential of colistin and meropenem combination therapy to overcome meropenem-resistant P. aeruginosa was investigated since toxicities would clinically limit the possibilities for single drug therapy with higher doses of colistin and meropenem. The simulation study, with PK profiles mimicking the in vivo situation, demonstrated that antibiotic combination therapy could clearly enhance the antibiotic activity (Figure 8). In predictions of bacterial killing by the combination, the two highest doses of CMS (loading dose 12 or 9 MU) followed by 4.5 MU every 12 h, and the highest dose of mero-penem (2000 mg, 3 h infusion every 8 h), were needed to achieve 3-log kill at 6 h.
The simulation study could be seen as a tool to guide development of dos-ing recommendations for meropenem and colistin combinations. It should be noted that since the model was developed based on in vitro data, the model predictions may not provide a precise description of the quantitative drug effects in vivo. The here evaluated dosage regimen is similar to the dosage applied within the AIDA project, where individual exposure will be linked to clinical outcome.
Meropenem PK/PD index simulation (Paper II) The meropenem PKPD model developed in Paper I was combined with a mouse PK model to replicate a previously published in vivo PK/PD index study (91). The type (fT>MIC) and magnitude (~40%) of index associated with efficacy in the study was successfully predicted. The ability to predict in vivo data encourages confidence in the applicability of the PKPD models in dosage regimen simulation studies.
The simulation was extended to investigate differences between the true and assumed drug susceptibilities in mice. The magnitude of the index was sensitive to all investigated factors (Table 8) which would in turn lead to different conclusions regarding the extrapolated human dosage regimen. This finding challenges a core assumption of PKPD indices, namely that the magnitude is independent of the PK in the patient population and that the MIC can be an accurate marker for dosage adjustments (9). Additionally it puts into question the method in which clinical breakpoints for antimicrobial therapy are derived, as these investigations assume that the same target mag-nitude holds over a wide (susceptible) MIC distribution (108).
Furthermore, the influence of the PK and the dosage frequency was inves-tigated by simulating a frequent dosage regimen in the mouse, and various human PK scenarios. As demonstrated in Table 8, the most predictive index was associated with the ratio of the longest studied dosage interval and the
66

terminal half-life – if the half-life was short compared to the longest dosage interval, fT>MIC was the most predictive index (original mouse dosage reg-imen, typical and augmented human PK data), and if the half-life was long compared to the longest dosage interval, fAUC/MIC was the most predictive index (frequent dosage regimen in mouse, renal dysfunction and preterm neonatal human PK data). These findings may seem surprising given that fT>MIC is commonly -lactam antibiot-ics. However, the most predictive index is dependent on the PK (12), and it has been shown -lactams up to four times the MIC leads to a faster kill (52, 109). In addition, similar results have been reported previously for benzylpenicillin, for which a shift in the PKPD index from fT>MIC in adults to fAUC/MIC in neonates was observed in a simulation study (17).
The sensitivity of the PKPD index type and magnitude to strain suscepti-bility, dosage frequency and PK challenges the use of PK/PD indices as a dose selection tool. PK differences between patient populations were inves-tigated in this work, and the efficacy was assumed to be directly related to the drug plasma concentration. The assumption may hold for a well perfused muscle (such as the thigh infection model) but additional PK variability ex-ists within a single patient due to differences in perfusion rate, permeation, and affinity of the drug in different body compartments. As previously pro-posed (52), and as indicated by the presented results, such variability seems likely to affect the type and magnitude of the PK/PD index. Physiology based pharmacokinetic models (PBPK) models (110) could be used in com-bination with PKPD models for dose optimisation of infections at specific sites.
OD of in vitro time-kill experiments Despite the usefulness of antibiotic PKPD models, the supporting experi-ments are often designed according to a rule of thumb, the prior experience of the experimentalist, and practical working hours. In this work OD was investigated, and applied in the derivation of experimental designs for anti-biotic time-kill experiments.
Minimal ciprofloxacin time-kill study design (Paper IV) In order to test the potential for rationalising the experimental design of time-kill experiments, we compared an earlier “empirically chosen” design for ciprofloxacin on E. coli (19) with a minimal design that was optimised to conserve the parameter precision and minimise the experimental cost. The design complexity could be reduced by 22% while retaining an expected
67

parameter precision >90% of the original design, with an increased night-time rest at the cost of an extended experimental duration to 32 h.
The in vitro performance of the minimal design was investigated by du-plicate time-kill experiments. As regrowth was only observed in one tube, the model was re-estimated on all pairwise combinations of the new and original datasets in order to relax the dependence on this one experiment. The precision of the parameters was similar between re-estimations on pairs of original data and mixed pairs (Figure 10) although the Emax parameter showed a significantly decreased precision for the mixed group (RSE +20 pp). Given the of 0.05 and 12 tested parameters this is however consistent with chance.
In order to put the 22% reduction in experimental design complexity into perspective, it may be useful to consider a similar simplification of the origi-nal data for the full seven strain model. In this setting, the decrease would correspond to nearly 260 sampling time points and close to 850 plates of CFU counts. As the optimisation relies on a prior model and reliable parame-ter estimates, such a simplification may be overly optimistic, but it is still indicative of the reduction in work load that could be achieved. In addition, the decreased strain on the experimentalist by not being required to take night time samples should not be understated.
OD of colistin and ciprofloxacin in vitro time-kill experiments (Paper III) Reliance on a prior model description of the system is a limiting factor for the applicability of OD. This reliance may be relaxed by using robust design criteria (e.g. ED optimality (20)) and by utilising prior knowledge about the system to be modelled. Both these strategies were used to provide an optimal design for the characterisation of the interaction between colistin and ciprof-loxacin on the C47 and LM347 strains of E. coli.
The concentrations and time points used for the combination experiments were selected by OD to achieve the highest possible precision in the interac-tion parameter over the two strains and three interaction levels (I = -0.5, 0, 0.5, equation 25). Hence, the design focused on maximising the precision of the interaction parameter in the synergy case, which was hardest to estimate. Designs that would achieve higher precision in the cases of antagonism or additivity could also have been generated, but to perform additional experi-ments to cover for each scenario would have increased the experimental load considerably.
The interaction in the experimental data (Figure 12 b) was slightly better described by equation 26, but the precision in the estimated interaction pa-rameter was close to that predicted by the optimal design (Table 9). Even though some parameters (e.g. EMAX for colistin) were fixed due to limited
68

information, the aim of the combination experiments was to maximise the precision in the interaction effect which was estimated with high precision.
IOV in individual OD In order to allow optimization of a sparse sampling schedule for individual exposure determinants within the AIDA project, methods to account for IOV in individual OD were investigated and applied.
Inclusion of IOV in the FIMMAP (Paper V) Two methods were formulated and applied to account for IOV in the optimi-sation for maximum precision in individual parameters. MAPocc included the
FIMMAP (equations 13, 29) while POPocc included the occasion variance in the individual FIM (equation 30). The methods were evaluated against two scenarios of ignoring the IOV (Omit and Inflate) for two models including IOV: the complex CMS/Colistin PK model and a simple constructed 1-compartment model with additive or additive and proportional errors.
Directly accounting for IOV resulted in designs that were markedly dif-ferent from those suggested when ignoring the IOV (Figure 13), with large gains in the precision of the estimated individual deviations (Figure 14). The allocation of all samples to one occasion in the colistin PK model for meth-ods MAPocc and POPocc may seem surprising but a probable explanation is
d-ent in the CMS/Colistin model (39) and hence are separable on one occasion. In contrast, for the 1- e-pendent and hence maximising the number of sampled occasions increased
occ
and POPocc predicted, with a few exceptions, the observed iSE and SH well (Figure 14, Figure 15). In contrast, ignoring IOV, either by omitting the known IOV or by failing to separate IIV and IOV, led to overly optimistic shrinkage and precision predictions, and lower precision in the estimated individual parameters. While differences between MAPocc and POPocc were small, both in the produced design and terms of predictability, MAPocc was computationally much faster in the studied cases (Figure 16) as POPocc re-quires linearisation around the occasion deviations (see equation 31). Anoth-er reason for increased attractiveness of MAPocc over POPocc is that occasion deviations are handled analogously with the individual deviations in the FIMMAP. The POPocc method is, however, easier to implement in PopED and could be advantageous if the number of occasions is large or if it is of inter-est to consider estimating the IOV distribution.
69

Optimisation of a sparse sampling schedule for determination of individual exposure determinants for colistin (Paper VI) Based on the results of Paper V, the MAPocc method was selected to optimise the sampling times for two samples in order to estimate individual colistin PK data within the AIDA project. As in the evaluation (Paper V), both sam-ples were taken on the same (first) occasion (at 15 min and 9.5 h after the first and second doses, respectively). The occasion had, however, been rede-fined as one day (two dosage intervals), in comparison with one dosage in-terval in Paper V, as that was thought to be overly pessimistic (in the original data analysis (42), the interval between occasions was >=24 h). The sam-pling schedule was expected to result in a 63% reduction in uncertainty re-garding the individual CL of colistin and CMS.
After clinical feedback, the study was relaxed to allow patient inclusion after initiation of treatment. Therefore also the sampling was allowed to be performed later than within the first 24 h of treatment. The relative sampling times after the dose were however kept. Surprisingly, the reduction in CL uncertainty was largest for the patients in the late protocol group (-66%), followed by the group that did not comply with the sampling protocol (-51%) and finally by the early protocol group (-39%).
Potential explanations include hydrolysis of the high peak concentrations of CMS to colistin prior to the assay, or small deviations in the actual sam-pling times compared to the recorded 45 minutes, both of which would have greater influence at the low colistin concentrations in the first dosage interval before colistin reaches steady state. This interpretation is supported by the higher than expected variability observed for the early colistin 45-minute samples (Figure 18). Other potential explanations include the slightly higher than expected variability observed at late colistin sampling times, which might allow higher precision in the iCL estimation, or higher than expected IOV at early sampling time points. The potential differences will be further elucidated when results from the whole study population, with associated covariates, become available. It can, however, be concluded that the opti-mised sampling times also worked well for the late protocol group, which is encouraging considering the difficulty of recruiting patients prior to initiali-sation of treatment.
70

OD compared to simulation-based design optimisation The design optimisations in Papers III, IV and VI could in theory have been carried out using stochastic simulation and evaluation (SSE) methods similar to those used to access parameter uncertainty in Paper V; such methods are commonly used to improve study designs (111). Both methods rely on the availability of a tentative model prior to optimisation and as such have simi-lar restrictions and drawbacks. However, because of the high level of com-putational effort associated with model re-estimation on a large number of simulated datasets, the number of tested designs must necessarily be kept low with the SSE procedure, which restricts the complexity of the design process. In comparison, the efficiency of the OD approach allowed us to evaluate more than 100 million unique design variable combinations in the minimisation of the ciprofloxacin time-kill design in Paper III.
71

Conclusion
In this thesis, pharmacometric models of antibacterial agents were developed and their application to describe the growth and kill of bacteria when ex-posed to combination dosage regimens was investigated. The value of opti-mal design (OD) was demonstrated for antibiotic time-kill experiments and methods for handling variability between study occasions (IOV) in the opti-misation of individual parameter estimates were proposed and applied. The methods described in this thesis hold promise to facilitate the development of new antibiotics and to help make better use of existing antibiotics.
Specifically:
Semi-mechanistic PKPD models were developed to quantify the dynam-ic effect of meropenem alone, and in combination with colistin, on P. aeruginosa and of colistin and ciprofloxacin on E. coli. The models were capable of predicting kill and regrowth due to resistance development over a wide range of experimental concentrations. The results support the utility of the model structure.
The meropenem and colistin interaction model was used to explore treatment of P. aeruginosa infections in critically ill patients. The com-bination was predicted to be effective against a meropenem-resistant strain, but had no added value compared to meropenem alone for a meropenem-susceptible strain. A similar dose combination is applied in the colistin study within AIDA. The meropenem PKPD model for P. ae-ruginosa was successfully applied to predict the in vivo determined meropenem PK/PD index type and magnitude. The type and magnitude of the index was sensitive to the antibiotic concentration-time profile, the susceptibility of the strain, and the experimental design, which limit the usefulness of PK/PD indices for dosage selection. However, the abil-ity to predict the result of the in vivo study provides support for dosage regimen predictions using PKPD models.
Application of OD methodology was demonstrated to reduce the exper-imental effort in time-kill curve experiments and was utilized to suggest the experimental design for identification and estimation of an interac-
72

tion between antibiotics. These results support the use of OD for the de-sign of in vitro time-kill studies.
Methods for handling IOV in OD for individual parameter precision were proposed and evaluated. The inclusion of the occasion variability as a discrete occasion deviation parameter in the FIM (MAPocc) was se-lected as the best method based on parameter precision and computa-tional effort. MAPocc was successfully applied in the design of a sparse sampling schedule for the estimation of individual exposure determi-nants for colistin. Plasma concentration samples from the first 100 pa-tients demonstrated that the quality of the individual parameter estima-tion was similar to that predicted by the design evaluation.
73

Populärvetenskaplig sammanfattning
Modern läkevetenskap är beroende av antibiotika både för att behandla enkla sjukdomar som halsfluss och för att kunna genomföra kirurgiska ingrep i livshotande tillstånd. En utbredd överanvändning av antibiotika i kombinat-ion med att bakterier är mycket anpassningsbara har lett till att många bakte-rier utvecklat resistens mot olika preparat. Många infektioner går idag därför bara att behandla med ett fåtal typer av antibiotika, eller går inte alls att be-handla. Utveckling av nya antibiotika är svårt, tar lång tid och är mycket kostsamt. På kort sikt är det därför angeläget att befintliga antibiotikaprepa-rat används så effektivt som möjligt. På lång sikt är utvecklingen av nya metoder viktigt för att förenkla framtagandet av nya antibiotika som är avgö-rande för en fungerande sjukvård i framtiden.
I den här avhandlingen utvecklas metoder baserade på matematiska mo-deller för att studera hur antibiotika omsätts i kroppen och hur antibiotikan verkar på bakterien, det vill säga farmkokinetik (PK) och farmakodynamik (PD). Kombinationer av antibiotika är ett sätt att öka effekten av en infekt-ionsbehandling. Genom att utveckla en modell för att studera hur de två an-tibiotikapreparaten colistin och meropenem fungerar tillsammans på bakte-rien Pseudomonas aeruginosa och använda tidigare publicerande PK mo-deller för hur koncentrationen varierar i kroppen kunde flera kombinationer av doser testas i dator. På detta sätt påvisades en behandling mot infektioner som annars anses vara resistenta mot meropenem. En traditionell metod att bestämma dosering av antibiotika som bygger på djurförsök simulerades för meropenem och visades kunna ge olämpliga slutsatser i människa.
Ingen modell är bättre än den information (data) som används under ut-vecklingen. Om för lite eller för dålig data används kommer också modellen att ge en dålig beskrivning av verkligheten. Informationen kan förbättras genom att datamängden ökas. Fler provtagningar eller fler experiment kan vara svårt att förverkliga av etiska och ekonomiska skäl. Ett alternativ är att använda data med högre kvalité, det vill säga data med större informations-innehåll. Ett sätt att öka informationsinnehållet är med optimal design (OD). Med OD kan till exempel vilka provtagningstider som används optimeras för att ge mesta möjliga information. I den här avhandlingen visades att optimal design fungerar bra på antibiotikaexperiment. Metoden användes för att välja vilka kombinationer av koncentrationer och provtagningstider som var bäst för att utveckla en modell för en kombination av colistin och antibiotikan ciprofloxacin.
74

Med tillräckligt avancerade modeller kan inte bara koncentration och ef-fekt simuleras i en enskild patient, utan även i en hel grupp av individer, en så kallad population. På så sätt går det att studera skillnader i omsättning (PK) och påverkan (PD) även mellan individer. Om dessa individuella skill-nader kan härledas till mätbara faktorer som vikt eller ålder kan behandling-en individanpassas. Colistin är ett intressant antibiotika i detta avseende ef-tersom det kan orsaka relativt allvarliga biverkningar vid liknande koncent-rationer som den önskvärda effekten. Dessutom uppvisar colistin stor varia-bilitet i PK mellan olika individer, och även inom en individ vid olika doseringstillfällen, vilket gör det svårt att förutse effekten. För att kunna bedöma den verkliga nyttan av colistin skulle effekten behöva härledas till koncentrationen i patienten. I den här avhandlingen utvecklades därför en metod för att med OD bestämma provtagningstider för colistin i en stor kli-nisk studie för att uppskatta individuellt PK, utan att störas av variabiliteten mellan tillfällen. Prov från de första 100 patienterna i studien har utvärderats med lovande resultat.
Sammanfattningsvis har de modeller och metoder som utvecklats i denna avhandling potential att förenkla utvecklingen av nya antibiotika och för-bättra användningen av gamla. Avhandlingen bidrar på så vis med en pus-selbit till morgondagens sjukvård.
75

Acknowledgments
The work presented in this thesis was carried out at the Department of Pharmaceutical Biosciences, Faculty of Pharmacy, Uppsala Universitet, Uppsala, Sweden. It was funded by Stiftelsen för Strategisk Forskning (SSF), and in part by the European Union through the AIDA consortium, and Hoff-mann-La Roche.
In addition I would like to express my gratitude to the Apotekarsocieteten and Anna Maria Lundins stipendiefond at Smålands nation for awarding me travel grants that has allowed me to travel to conferences wide and far to present my work.
First and foremost, my main supervisor Prof. Lena Friberg, thank you for all you support. You give more than anyone should ask for.
My co-supervisors: Prof. Mats Karlsson your endless knowledge of, and enthusiasm for, the science of Pharmacometrics is an inspiration. Dr. Pernil-la Lagerbäck, and Prof. Otto Cars, thank you for your support at ICAAC and for not giving up on me, we did get a paper together in the end!
Dr. Joakim Nyberg och Ass. Prof. Elisabet Nielsen * Jocke och Bettan *, ni har inte varit mina handledare på pappret, men jag har alltid kunnat räkna med era råd.
Assoc. Prof. Andrew Hooker, thank you for sharing your knowledge on OD.
Thank you to the group at Roche for allowing me to work with you, Neil J. Parrott, Olaf Kuhlmann, Thierry Lave, and last but not least Pascale David-Pierson. Ami Mohamed and Matti Karvanen, thank you for sharing the au-thor space. David, tack för att du har varit tillgänglig dom här senaste veck-orna – trots att mycket annat har dragit i dig. Lycka till med ditt skrivande! Also, Ulrika Lustig, Charlotte Annerstedt, Sha Cao, Dan Andersson, Diar-maid Hughes, Yael Dishon, Mical Paul, and Britt Jansson, thank you for your contributions to the papers.
A big thank you to everyone: past and present PhD students, post docs, re-searchers, administrators and teachers – You all contribute to the wonderful
76

77
atmosphere at the department. Special mentions: Prof. Margareta Hammar-lund-Udeneaes tack för ditt bidrag till detta.
To my dear office mates, thank you for putting up with the whistling! Paul – would you believe that the dark grotto where you and Jan-Stefan resided, these last years have been bright enough to grow tomatoes in the winter? Oskar – jag kunde behövt dig att beklaga mig för, men jag förlåter din från-varo, Camille – thank you for last minute cover feedback and for being you, I miss having you around!
Tack Magnus, Jerker, Rickard, och Kajsa för att ni har hållit igång allt!
Cheers to the guys in the antibiotics group, past and present, Salim, Win, Tanders. Waqas – I should come vistit!
Yasunori and Anne-Gaëlle, thanks for helping me with Precond and SIR, Sebastian and Eric for being available for PopED questions, Elin, Oskar C, Steve, Marina, it has been fun being at conferences with you! Vijay, Mirjam, Chayan and Brendan – thank you for the parties!
Jörgen, tack för att du introducerade mig för BMC gymmet och för ditt undervisningsengagemang, Irena för din omtanke, och tack Siv för att du är så glad och positiv (nästan) jämt!
Mina goda vänner Olof och Erik, tack för ölen och diskussionerna!
Mamma och Pappa tack för stöd och hjälp, Mormor tack för alla långa stun-der vid köksbordet när jag växte upp (och fortfarande när jag är i Linnevad), Morfar, Farmor, Farfar, ni fick aldrig läsa detta, men jag vet att ni hade varit stolta. Och tack till alla i familjen som gör det så trevligt att komma hem!
Och slutligen, Sandra min älskling. Tack för all hjälp och för att du står ut med mig!
Anders

References
1. S.B. Levy and B. Marshall. Antibacterial resistance worldwide: causes, challenges and responses. Nat Med. 10:S122-129 (2004).
2. A.J. Alanis. Resistance to antibiotics: are we in the post-antibiotic era? Archives of medical research. 36:697-705 (2005).
3. State of the World's Antibiotics, 2015, CDDEP: Whasington, D.C., 2015. 4. M. Bassetti, M. Merelli, C. Temperoni, and A. Astilean. New antibiotics for
bad bugs: where are we? Ann Clin Microbiol Antimicrob. 12:22 (2013). 5. R. Wise, T. Hart, O. Cars, M. Streulens, R. Helmuth, P. Huovinen, and M.
Sprenger. Antimicrobial resistance. BMJ. 317:609-610 (1998). 6. R. Laxminarayan, A. Duse, C. Wattal, A.K. Zaidi, H.F. Wertheim, N.
Sumpradit, E. Vlieghe, G.L. Hara, I.M. Gould, H. Goossens, C. Greko, A.D. So, M. Bigdeli, G. Tomson, W. Woodhouse, E. Ombaka, A.Q. Peralta, F.N. Qamar, F. Mir, S. Kariuki, Z.A. Bhutta, A. Coates, R. Bergstrom, G.D. Wright, E.D. Brown, and O. Cars. Antibiotic resistance-the need for global solutions. The Lancet infectious diseases. 13:1057-1098 (2013).
7. T.P. Van Boeckel, S. Gandra, A. Ashok, Q. Caudron, B.T. Grenfell, S.A. Levin, and R. Laxminarayan. Global antibiotic consumption 2000 to 2010: an analysis of national pharmaceutical sales data. The Lancet Infectious diseases. 14:742-750 (2014).
8. Resistance Map. http://resistancemap.cddep.org/resmap/ (accessed 10-15 2015).
9. W.A. Craig. Pharmacokinetic/pharmacodynamic parameters: rationale for antibacterial dosing of mice and men. Clinical infectious diseases : an official publication of the Infectious Diseases Society of America. 26:1-10; quiz 11-12 (1998).
10. T.P. Lodise, B.M. Lomaestro, G.L. Drusano, and P. Society of Infectious Diseases. Application of antimicrobial pharmacodynamic concepts into clinical practice: focus on beta-lactam antibiotics: insights from the Society of Infectious Diseases Pharmacists. Pharmacotherapy. 26:1320-1332 (2006).
11. J.W. Mouton, M.N. Dudley, O. Cars, H. Derendorf, and G.L. Drusano. Standardization of pharmacokinetic/pharmacodynamic (PK/PD) terminology for anti-infective drugs: an update. J Antimicrob Chemother. 55:601-607 (2005).
12. Y. Kitamura, K. Yoshida, M. Kusama, and Y. Sugiyama. A proposal of a pharmacokinetic/pharmacodynamic (PK/PD) index map for selecting an optimal PK/PD index from conventional indices (AUC/MIC, Cmax/MIC, and TAM) for antibiotics. Drug metabolism and pharmacokinetics (2014).
13. J. Gloede, C. Scheerans, H. Derendorf, and C. Kloft. In vitro pharmacodynamic models to determine the effect of antibacterial drugs. J Antimicrob Chemother. 65:186-201 (2010).
14. E.I. Nielsen and L.E. Friberg. Pharmacokinetic-pharmacodynamic modeling of antibacterial drugs. Pharmacol Rev. 65:1053-1090 (2013).
78

15. E.I. Nielsen, A. Viberg, E. Lowdin, O. Cars, M.O. Karlsson, and M. Sandstrom. Semimechanistic pharmacokinetic/pharmacodynamic model for assessment of activity of antibacterial agents from time-kill curve experiments. Antimicrob Agents Chemother. 51:128-136 (2007).
16. S. Schmidt, S.N. Sabarinath, A. Barbour, D. Abbanat, P. Manitpisitkul, S. Sha, and H. Derendorf. Pharmacokinetic-Pharmacodynamic Modeling of the In Vitro Activities of Oxazolidinone Antimicrobial Agents against Methicillin-Resistant Staphylococcus aureus. Antimicrobial agents and chemotherapy. 53:5039-5045 (2009).
17. E.I. Nielsen, O. Cars, and L.E. Friberg. Pharmacokinetic/pharmacodynamic (PK/PD) indices of antibiotics predicted by a semimechanistic PKPD model: a step toward model-based dose optimization. Antimicrob Agents Chemother. 55:4619-4630 (2011).
18. A.F. Mohamed, E.I. Nielsen, O. Cars, and L.E. Friberg. Pharmacokinetic-pharmacodynamic model for gentamicin and its adaptive resistance with predictions of dosing schedules in newborn infants. Antimicrob Agents Chemother. 56:179-188 (2012).
19. D.D. Khan, P. Lagerback, S. Cao, U. Lustig, E.I. Nielsen, O. Cars, D. Hughes, D.I. Andersson, and L.E. Friberg. A mechanism-based pharmacokinetic/pharmacodynamic model allows prediction of antibiotic killing from MIC values for WT and mutants. J Antimicrob Chemother:dkv233 (2015).
20. A. Atkinson and A. Donev Optimum Experimental Designs., 1992. 21. G.L. Drusano, S.L. Preston, C. Fowler, M. Corrado, B. Weisinger, and J. Kahn.
Relationship between fluoroquinolone area under the curve: minimum inhibitory concentration ratio and the probability of eradication of the infecting pathogen, in patients with nosocomial pneumonia. The Journal of infectious diseases. 189:1590-1597 (2004).
22. A.A. Vinks, J.W. Mouton, D.J. Touw, H.G. Heijerman, M. Danhof, and W. Bakker. Population pharmacokinetics of ceftazidime in cystic fibrosis patients analyzed by using a nonparametric algorithm and optimal sampling strategy. Antimicrobial agents and chemotherapy. 40:1091-1097 (1996).
23. V.H. Tam, S.L. Preston, and G.L. Drusano. Optimal sampling schedule design for populations of patients. Antimicrob Agents Chemother. 47:2888-2891 (2003).
24. T. Gumbo, C.S. Dona, C. Meek, and R. Leff. Pharmacokinetics-pharmacodynamics of pyrazinamide in a novel in vitro model of tuberculosis for sterilizing effect: a paradigm for faster assessment of new antituberculosis drugs. Antimicrob Agents Chemother. 53:3197-3204 (2009).
25. V.H. Tam, A.N. Schilling, R.E. Lewis, D.A. Melnick, and A.N. Boucher. Novel approach to characterization of combined pharmacodynamic effects of antimicrobial agents. Antimicrob Agents Chemother. 48:4315-4321 (2004).
26. R.M. Savic and M.O. Karlsson. Importance of shrinkage in empirical bayes estimates for diagnostics: problems and solutions. The AAPS journal. 11:558-569 (2009).
27. J.W. Mandema, D. Verotta, and L.B. Sheiner. Building population pharmacokineticpharmacodynamic models. I. Models for covariate effects. J Pharmacokinet Biop. 20:511-528 (1992).
28. P.O. Maitre, M. Buhrer, D. Thomson, and D.R. Stanski. A three-step approach combining Bayesian regression and NONMEM population analysis: application to midazolam. J Pharmacokinet Biopharm. 19:377-384 (1991).
79

29. A. Rousseau and P. Marquet. Application of pharmacokinetic modelling to the routine therapeutic drug monitoring of anticancer drugs. Fundamental & clinical pharmacology. 16:253-262 (2002).
30. J.C. Panetta, M. Wilkinson, C.H. Pui, and M.V. Relling. Limited and optimal sampling strategies for etoposide and etoposide catechol in children with leukemia. J Pharmacokinet Pharmacodyn. 29:171-188 (2002).
31. S. Hennig, J. Nyberg, S. Fanta, J.T. Backman, K. Hoppu, A.C. Hooker, and M.O. Karlsson. Application of the optimal design approach to improve a pretransplant drug dose finding design for ciclosporin. Journal of clinical pharmacology. 52:347-360 (2012).
32. J.M. Diver. Quinolone uptake by bacteria and bacterial killing. Reviews of Infectious Diseases. 11:S941-S946 (1989).
33. K. Hoshino, A. Kitamura, I. Morrissey, K. Sato, J. Kato, and H. Ikeda. Comparison of inhibition of Escherichia coli topoisomerase IV by quinolones with DNA gyrase inhibition. Antimicrob Agents Chemother. 38:2623-2627 (1994).
34. EUCAST. Ciprofloxacin - Rationale for the EUCAST clinical breakpoints. www.eucast.org (accessed 10-08 2015).
35. ECDC European Centre for Disease Prevention and Control. Antimicrobial resistance surveillance in Europe 2012. Annual Report of the European Antimicrobial Resistance Surveillance Network (EARS-Net). Stockholm. (2013).
36. M.E. Falagas and S.K. Kasiakou. Colistin: the revival of polymyxins for the management of multidrug-resistant gram-negative bacterial infections. Clinical infectious diseases : an official publication of the Infectious Diseases Society of America. 40:1333-1341 (2005).
37. R.V. Dudhani, J.D. Turnidge, K. Coulthard, R.W. Milne, C.R. Rayner, J. Li, and R.L. Nation. Elucidation of the pharmacokinetic/pharmacodynamic determinant of colistin activity against Pseudomonas aeruginosa in murine thigh and lung infection models. Antimicrob Agents Chemother. 54:1117-1124 (2010).
38. D. Plachouras, M. Karvanen, L.E. Friberg, E. Papadomichelakis, A. Antoniadou, I. Tsangaris, I. Karaiskos, G. Poulakou, F. Kontopidou, A. Armaganidis, O. Cars, and H. Giamarellou. Population pharmacokinetic analysis of colistin methanesulfonate and colistin after intravenous administration in critically ill patients with infections caused by gram-negative bacteria. Antimicrob Agents Chemother. 53:3430-3436 (2009).
39. A.F. Mohamed, I. Karaiskos, D. Plachouras, M. Karvanen, K. Pontikis, B. Jansson, E. Papadomichelakis, A. Antoniadou, H. Giamarellou, A. Armaganidis, O. Cars, and L.E. Friberg. Application of a loading dose of colistin methanesulfonate in critically ill patients: population pharmacokinetics, protein binding, and prediction of bacterial kill. Antimicrob Agents Chemother. 56:4241-4249 (2012).
40. Mohamed, C. O, and L.E. Friberg. A Semimechanistic Pharmacokinetic-Pharmacodynamic Model developed for Colistin on Pseudomonas aeruginosa in vitro with Evaluation of Population PK Variability on Simulated Bacteria Kill, 2012.
41. S.M. Garonzik, J. Li, V. Thamlikitkul, D.L. Paterson, S. Shoham, J. Jacob, F.P. Silveira, A. Forrest, and R.L. Nation. Population Pharmacokinetics of Colistin Methanesulfonate and Formed Colistin in Critically-Ill Patients from a Multi-Center Study Provide Dosing Suggestions for Various Categories of Patients. Antimicrob Agents Chemother. 55:3284-3294 (2011).
80

42. P.J. Bergen, J.B. Bulitta, A. Forrest, B.T. Tsuji, J. Li, and R.L. Nation. Pharmacokinetic/pharmacodynamic investigation of colistin against Pseudomonas aeruginosa using an in vitro model. Antimicrob Agents Chemother. 54:3783-3789 (2010).
43. P.J. Bergen, J. Li, R.L. Nation, J.D. Turnidge, K. Coulthard, and R.W. Milne. Comparison of once-, twice- and thrice-daily dosing of colistin on antibacterial effect and emergence of resistance: studies with Pseudomonas aeruginosa in an in vitro pharmacodynamic model. J Antimicrob Chemother. 61:636-642 (2008).
44. J.B. Bulitta, J.C. Yang, L. Yohonn, N.S. Ly, S.V. Brown, R.E. D'Hondt, W.J. Jusko, A. Forrest, and B.T. Tsuji. Attenuation of colistin bactericidal activity by high inoculum of Pseudomonas aeruginosa characterized by a new mechanism-based population pharmacodynamic model. Antimicrob Agents Chemother. 54:2051-2062 (2010).
45. N. Petrosillo, E. Ioannidou, and M.E. Falagas. Colistin monotherapy vs. combination therapy: evidence from microbiological, animal and clinical studies. Clinical microbiology and infection : the official publication of the European Society of Clinical Microbiology and Infectious Diseases. 14:816-827 (2008).
46. Z.Z. Deris, H.H. Yu, K. Davis, R. Soon, J. Jacob, C.K. Ku, A. Poudyal, P.J. Bergen, B.T. Tsuji, J.B. Bulitta, A. Forrest, D.L. Paterson, T. Velkov, J. Li, and R.L. Nation. Colistin and Doripenem Combination is Synergistic against Klebsiella pneumoniae at Multiple Inocula and Suppresses Colistin Resistance in an in vitro PK/PD Model. Antimicrob Agents Chemother (2012).
47. C. Vidaillac, L. Benichou, and R.E. Duval. In vitro synergy of colistin combinations against colistin-resistant Acinetobacter baumannii, Pseudomonas aeruginosa, and Klebsiella pneumoniae isolates. Antimicrob Agents Chemother. 56:4856-4861 (2012).
48. A.F. Mohamed, O. Cars, and L.E. Friberg. A pharmacokinetic/pharmacodynamic model developed for the effect of colistin on Pseudomonas aeruginosa in vitro with evaluation of population pharmacokinetic variability on simulated bacterial killing. Journal of Antimicrobial Chemotherapy:dkt520 (2014).
49. J.R. Edwards, P.J. Turner, C. Wannop, E.S. Withnell, A.J. Grindey, and K. Nairn. In vitro antibacterial activity of SM-7338, a carbapenem antibiotic with stability to dehydropeptidase I. Antimicrob Agents Chemother. 33:215-222 (1989).
50. G.L. Drusano. Prevention of resistance: a goal for dose selection for antimicrobial agents. Clinical infectious diseases : an official publication of the Infectious Diseases Society of America. 36:S42-50 (2003).
51. J.A. Roberts, S.K. Paul, M. Akova, M. Bassetti, J.J. De Waele, G. Dimopoulos, K.M. Kaukonen, D. Koulenti, C. Martin, P. Montravers, J. Rello, A. Rhodes, T. Starr, S.C. Wallis, J. Lipman, and D. Study. DALI: defining antibiotic levels in intensive care unit patients: are current beta-lactam antibiotic doses sufficient for critically ill patients? Clinical infectious diseases : an official publication of the Infectious Diseases Society of America. 58:1072-1083 (2014).
52. A. Huttner, S. Harbarth, W.W. Hope, J. Lipman, and J.A. Roberts. Therapeutic -lactam antibiotics: what is the evidence and which
patients should we be using it for? Journal of antimicrobial chemotherapy:dkv201 (2015).
81

53. E. Temkin, A. Adler, A. Lerner, and Y. Carmeli. Carbapenem-resistant Enterobacteriaceae: biology, epidemiology, and management. Annals of the New York Academy of Sciences. 1323:22-42 (2014).
54. E.B. Breidenstein, C. de la Fuente-Nunez, and R.E. Hancock. Pseudomonas aeruginosa: all roads lead to resistance. Trends Microbiol. 19:419-426 (2011).
55. L. Fernandez, E.B. Breidenstein, and R.E. Hancock. Creeping baselines and adaptive resistance to antibiotics. Drug Resist Updat. 14:1-21 (2011).
56. L. Fernandez, W.J. Gooderham, M. Bains, J.B. McPhee, I. Wiegand, and R.E. Hancock. Adaptive resistance to the "last hope" antibiotics polymyxin B and colistin in Pseudomonas aeruginosa is mediated by the novel two-component regulatory system ParR-ParS. Antimicrob Agents Chemother. 54:3372-3382 (2010).
57. V.H. Tam, A.N. Schilling, and M. Nikolaou. Modelling time-kill studies to discern the pharmacodynamics of meropenem. J Antimicrob Chemother. 55:699-706 (2005).
58. V.H. Tam, A.N. Schilling, K. Poole, and M. Nikolaou. Mathematical modelling response of Pseudomonas aeruginosa to meropenem. J Antimicrob Chemother. 60:1302-1309 (2007).
59. P. Escobar-Paramo, O. Clermont, A.B. Blanc-Potard, H. Bui, C. Le Bouguenec, and E. Denamur. A specific genetic background is required for acquisition and expression of virulence factors in Escherichia coli. Mol Biol Evol. 21:1085-1094 (2004).
60. L.E. Friberg, E. Karaiskos, A.S. Mohamed, M. Karvanen, K. Pontikis, E. Papadomichelakis, D. Plachouras, O. Cars, A. Armaganidis, and H. Giamarellou. Colistin Pharmacokinetics after Administration of a Loading Dose of Colistin Methanesulphonate (CMS) in Critically Ill Patients with Infections by Multidrug-Resistant Gram-Negative Bacteria (MDR-GNB), poster A1-665, ICAAC, Boston, 2010.
61. G.A. Pankuch, G.R. Lin, H. Seifert, and P.C. Appelbaum. Activity of meropenem with and without ciprofloxacin and colistin against Pseudomonas aeruginosa and Acinetobacter baumannii. Antimicrobial agents and chemotherapy. 52:333-336 (2008).
62. A.P. MacGowan, C. Rynn, M. Wootton, K.E. Bowker, H.A. Holt, and D.S. Reeves. In vitro assessment of colistin's antipseudomonal antimicrobial interactions with other antibiotics. Clinical microbiology and infection. 5:32-36 (1999).
63. A. Dunne. Taca Training - Parmacometric Statistics, 2015. 64. M.O. Karlsson and L.B. Sheiner. The importance of modeling interoccasion
variability in population pharmacokinetic analyses. Journal of Pharmacokinetics and Biopharmaceutics. 21:735-750 (1993).
65. M.O. Karlsson, S.L. Beal, and L.B. Sheiner. Three new residual error models for population PK/PD analyses. J Pharmacokinet Biopharm. 23:651-672 (1995).
66. R.B. Bauer. NONMEM users guide. Introduction to NONMEM 7, ICON Development Solutions, Elicott City, Maryland, 2010.
67. C. Radhakrishna Rao. Information and accuracy attainable in the estimation of statistical parameters. Bulletin of the Calcutta Mathematical Society. 37:81-91 (1945).
68. H. Cramér. Mathematical methods of statistics, Princeton university press, 1999.
69. E.L. Lehmann and G. Casella. Theory of Point Estimation, Springer, 1998.
82

70. Y. Merlé and F. Mentré. Bayesian design criteria: Computation, comparison, and application to a pharmacokinetic and a pharmacodynamic model. Journal of Pharmacokinetics and Pharmacodynamics. 23:101-125 (1995).
71. J.L. Crandon, R.E. Ariano, S.A. Zelenitsky, A.M. Nicasio, J.L. Kuti, and D.P. Nicolau. Optimization of meropenem dosage in the critically ill population based on renal function. Intensive care medicine. 37:632-638 (2011).
72. C. Li, J.L. Kuti, C.H. Nightingale, and D.P. Nicolau. Population pharmacokinetic analysis and dosing regimen optimization of meropenem in adult patients. Journal of clinical pharmacology. 46:1171-1178 (2006).
73. J.N. van den Anker, P. Pokorna, M. Kinzig-Schippers, J. Martinkova, R. de Groot, G.L. Drusano, and F. Sorgel. Meropenem pharmacokinetics in the newborn. Antimicrob Agents Chemother. 53:3871-3879 (2009).
74. T. Katsube, Y. Yamano, and Y. Yano. Pharmacokinetic-pharmacodynamic modeling and simulation for in vivo bactericidal effect in murine infection model. Journal of pharmaceutical sciences. 97:1606-1614 (2008).
75. G.B. West, J.H. Brown, and B.J. Enquist. A general model for the origin of allometric scaling laws in biology. Science. 276:122-126 (1997).
76. E.N. Jonsson, J.R. Wade, and M.O. Karlsson. Comparison of some practical sampling strategies for population pharmacokinetic studies. J Pharmacokinet Biop. 24:245-263 (1996).
77. The European Committee on Antimicrobial Susceptibility Testing. Breakpoint tables for interpretation of MICs and zone diameters, 2015.
78. A.F. Mohamed, O. Cars, and L.E. Friberg. A pharmacokinetic/pharmacodynamic model developed for the effect of colistin on Pseudomonas aeruginosa in vitro with evaluation of population pharmacokinetic variability on simulated bacterial killing. J Antimicrob Chemother. 69:1350-1361 (2014).
79. M. Karvanen. Optimization of Colistin Dosage in the Treatment of Multiresistant Gram-negative Infections, Uppsala University, Disciplinary Domain of Medicine and Pharmacy, Faculty of Medicine, Department of Medical Sciences, Infectious Diseases, Uppsala Universitet, Uppsala: Acta Universitatis Upsaliensis, 2013.
80. D. Khan, E.I. Nielsen, P. Lagerbäck, C. Sha, C. Malmberg, U. Lustig, E. Gullberg, O. Cars, D. Hughes, D.I. Andersson, and L.E. Friberg. Evaluation of Mechanism Based PKPD Model for Antibiotics, PAGE 23, Alicante, 2014.
81. B. Jansson, M. Karvanen, O. Cars, D. Plachouras, and L.E. Friberg. Quantitative analysis of colistin A and colistin B in plasma and culture medium using a simple precipitation step followed by LC/MS/MS. J Pharm Biomed Anal. 49:760-767 (2009).
82. V. Lorian. Chapter 7. Antibiotics in Laboratory Medicine, Williams & Wilkins Press, 1996, pp. 230-295.
83. S.L. Beal. Ways to fit a PK model with some data below the quantification limit. Journal of Pharmacokinetics and Pharmacodynamics. 28:481-504 (2001).
84. D.R. Mould and R.N. Upton Basic concepts in population modeling, simulation, and model-based drug development-part 2: introduction to pharmacokinetic modeling methods. CPT Pharmacometrics Syst Pharmacol. 2:e38 (2013).
85. M. Karlsson and N. Holford. A tutorial on visual predictive checks., PAGE 17, Abstr 1434, 2008.
86. A. Dosne, M. Bergstrand, and M. Karlsson. Determination of Appropriate Settings in the Assessment of Parameter Uncertainty Distributions using Sampling Importance Resampling (SIR), PAGE 24, Abstr 3546, 2015.
83

87. A. Chakraborty and W.J. Jusko Pharmacodynamic interaction of recombinant human interleukin-10 and prednisolone using in vitro whole blood lymphocyte proliferation. Journal of pharmaceutical sciences. 91:1334-1342 (2002).
88. N.S. Ly, J.B. Bulitta, G.G. Rao, C.B. Landersdorfer, P.N. Holden, A. Forrest, P.J. Bergen, R.L. Nation, J. Li, and B.T. Tsuji. Colistin and doripenem combinations against Pseudomonas aeruginosa: profiling the time course of synergistic killing and prevention of resistance. Journal of antimicrobial chemotherapy. 70:1434-1442 (2015).
89. M. Bergstrand, A.C. Hooker, J.E. Wallin, and M.O. Karlsson. Prediction-corrected visual predictive checks for diagnosing nonlinear mixed-effects models. The AAPS journal. 13:143-151 (2011).
90. S.L. Beal. Ways to fit a PK model with some data below the quantification limit. Journal of pharmacokinetics and pharmacodynamics. 28:481-504 (2001).
91. K. Sugihara, C. Sugihara, Y. Matsushita, N. Yamamura, M. Uemori, A. Tokumitsu, H. Inoue, M. Kakuta, E. Namba, H. Nasu, and T. Koga. In vivo pharmacodynamic activity of tomopenem (formerly CS-023) against Pseudomonas aeruginosa and methicillin-resistant Staphylococcus aureus in a murine thigh infection model. Antimicrob Agents Chemother. 54:5298-5302 (2010).
92. J. Nyberg, S. Ueckert, E.A. Stromberg, S. Hennig, M.O. Karlsson, and A.C. Hooker. PopED: an extended, parallelized, nonlinear mixed effects models optimal design tool. Comput Methods Programs Biomed. 108:789-805 (2012).
93. L. Pronzato and E. Walter. Robust Experiment Design Via Maximin Optimization. Math Biosci. 89:161-176 (1988).
94. S. Retout and F. Mentré. Further developments of the Fisher information matrix in nonlinear mixed effects models with evaluation in population pharmacokinetics. J Biopharm Stat. 13:209-227 (2003).
95. F.P. Combes, S. Retout, N. Frey, and F. Mentre. Prediction of shrinkage of individual parameters using the bayesian information matrix in non-linear mixed effect models with evaluation in pharmacokinetics. Pharmaceutical research. 30:2355-2367 (2013).
96. L. Lindbom, P. Pihlgren, and N. Jonsson. PsN-Toolkit—a collection of computer intensive statistical methods for non-linear mixed effect modeling using NONMEM. Computer methods and programs in biomedicine. 79:241-257 (2005).
97. R.J. Keizer, M.O. Karlsson, and A. Hooker. Modeling and Simulation Workbench for NONMEM: Tutorial on Pirana, PsN, and Xpose. CPT Pharmacometrics Syst Pharmacol. 2:e50 (2013).
98. I. Karaiskos, L.E. Friberg, K. Pontikis, K. Ioannidis, V. Tsagkari, L. Galani, E. Kostakou, F. Baziaka, C. Paskalis, A. Koutsoukou, and H. Giamarellou. Colistin Population Pharmacokinetics after Application of a Loading Dose of 9 MU Colistin Methanesulfonate (CMS) in Critically Ill Patients. Antimicrob Agents Chemother:AAC. 00554-00515 (2015).
99. A. Skiada, A. Markogiannakis, D. Plachouras, and G.L. Daikos. Adaptive resistance to cationic compounds in Pseudomonas aeruginosa. Int J Antimicrob Agents. 37:187-193 (2011).
100. H.E. Gilleland, Jr. and L.B. Farley. Adaptive resistance to polymyxin in Pseudomonas aeruginosa due to an outer membrane impermeability mechanism. Canadian journal of microbiology. 28:830-840 (1982).
101. R.A. Moore, L. Chan, and R.E. Hancock. Evidence for two distinct mechanisms of resistance to polymyxin B in Pseudomonas aeruginosa. Antimicrob Agents Chemother. 26:539-545 (1984).
84
102. R.A. Moore, N.C. Bates, and R.E. Hancock. Interaction of polycationic antibiotics with Pseudomonas aeruginosa lipopolysaccharide and lipid A studied by using dansyl-polymyxin. Antimicrob Agents Chemother. 29:496-500 (1986).
103. T.I. Nicas and R.E. Hancock. Outer membrane protein H1 of Pseudomonas aeruginosa: involvement in adaptive and mutational resistance to ethylenediaminetetraacetate, polymyxin B, and gentamicin. Journal of bacteriology. 143:872-878 (1980).
104. N.P. Mortensen, J.D. Fowlkes, C.J. Sullivan, D.P. Allison, N.B. Larsen, S. Molin, and M.J. Doktycz. Effects of colistin on surface ultrastructure and nanomechanics of Pseudomonas aeruginosa cells. Langmuir. 25:3728-3733 (2009).
105. V.H. Tam, A.N. Schilling, and M. Nikolaou. Modelling time–kill studies to discern the pharmacodynamics of meropenem. Journal of antimicrobial chemotherapy. 55:699-706 (2005).
106. K.M. Papp-Wallace, A. Endimiani, M.A. Taracila, and R.A. Bonomo. Carbapenems: past, present, and future. Antimicrob Agents Chemother. 55:4943-4960 (2011).
107. C.B. Landersdorfer, N.S. Ly, H. Xu, B.T. Tsuji, and J.B. Bulitta. Quantifying Subpopulation Synergy for Antibiotic Combinations via Mechanism-Based Modeling and a Sequential Dosing Design. Antimicrobial Agents and Chemotherapy. 57:2343-2351 (2013).
108. J.W. Mouton, D.F. Brown, P. Apfalter, R. Canton, C.G. Giske, M. Ivanova, A.P. MacGowan, A. Rodloff, C.J. Soussy, M. Steinbakk, and G. Kahlmeter. The role of pharmacokinetics/pharmacodynamics in setting clinical MIC breakpoints: the EUCAST approach. Clinical microbiology and infection : the official publication of the European Society of Clinical Microbiology and Infectious Diseases. 18:E37-45 (2012).
109. W. Craig and S. Ebert. Killing and regrowth of bacteria in vitro: a review. Scandinavian journal of infectious diseases Supplementum. 74:63-70 (1989).
110. M. Rowland, C. Peck, and G. Tucker. Physiologically-based pharmacokinetics in drug development and regulatory science. Annual review of pharmacology and toxicology. 51:45-73 (2011).
111. N. Holford, S.C. Ma, and B.A. Ploeger. Clinical trial simulation: a review. Clin Pharmacol Ther. 88:166-182 (2010).
85

Acta Universitatis UpsaliensisDigital Comprehensive Summaries of Uppsala Dissertationsfrom the Faculty of Pharmacy 206
Editor: The Dean of the Faculty of Pharmacy
A doctoral dissertation from the Faculty of Pharmacy, UppsalaUniversity, is usually a summary of a number of papers. A fewcopies of the complete dissertation are kept at major Swedishresearch libraries, while the summary alone is distributedinternationally through the series Digital ComprehensiveSummaries of Uppsala Dissertations from the Faculty ofPharmacy. (Prior to January, 2005, the series was publishedunder the title “Comprehensive Summaries of UppsalaDissertations from the Faculty of Pharmacy”.)
Distribution: publications.uu.seurn:nbn:se:uu:diva-264798
ACTAUNIVERSITATIS
UPSALIENSISUPPSALA
2015