US EPA, Pesticide Product Label, LIQUICHLOR 12.5% SOLUTION ...

Note: All pesticide use data cited are agricultural use data from DPR 2007 unless specified otherwise.
Department of Pesticide Regulation Environmental Monitoring Branch
1001 I Street Sacramento, California 95812
September 21, 2007
Study 248. Long-term Pesticide Monitoring in High-Use Agricultural Areas: Central Coast and Imperial Valley.
Keith Starner
I. INTRODUCTION In California, a wide variety of pesticides are applied throughout the year; in 2005, for example, over 300 pesticide active ingredients (AIs) were applied in agricultural areas of the state (CDPR 2007a). For many of these, recent surface water monitoring data from areas of high use are lacking or outdated. Such monitoring data are needed in order to assess the potential impacts of California pesticide use on aquatic systems. Pesticide active ingredients which are highly toxic to aquatic organisms and have significant use in California were identified through assessments of toxicity and pesticide use data (Starner 2007a, Starner 2007b, US EPA 2007). Two areas of the state, the Central Coast and Imperial Valley (Figure 1), have high agricultural use of several active ingredients identified in this manner (Tables 1 through 3). Recent monitoring results from these areas indicate that, for several of these AIs, concentrations exceeding water quality benchmarks can occur in aquatic environments; for several other AIs with significant aquatic toxicity, recent surface water monitoring data are lacking (Anderson et al. 2005, Starner et al. 2006, Hunt et al. 2006, Starner 2007c). The purpose of this project is to establish long-term (multi-year) monitoring stations in these two areas, monitoring for pesticide AIs identified as having significant toxicity to aquatic organisms. Agriculture pesticide use in these areas is among the highest in the state for a wide variety of active ingredients, including several organophosphate, carbamate and pyrethroid insecticides and a variety of herbicide and fungicide active ingredients. The two areas represent different climates, soil types, treated crops, and agricultural practices, factors which impact the potential for offsite movement of pesticides. Pest pressures, use patterns, and management practices in the areas can vary from year to year. As such, consistent monitoring over time will provide useful data on the environmental fate of current-use pesticides under a variety of conditions, for use in the development of management responses. Targeted active ingredients will be adjusted as use and management practices dictate. II. OBJECTIVE The objective of this study is to provide a long-term assessment of surface water pesticide contamination in portions of the Central Coast and the Imperial Valley of California. Results will provide useful data on the environmental fate of current-use pesticides under a variety of conditions, for use in the development of management responses.

III. PERSONNEL The study will be conducted by staff from the Environmental Monitoring Branch, Surface Water Protection Program, under the general direction of Kean S. Goh, Environmental Program Manager I. Key personnel are listed below: Project Leader: Keith Starner Field Coordinator: Li-Ming He Senior Scientist: Frank Spurlock Laboratory Liaison: Carissa Ganapathy Chemists: California Department of Food and Agriculture, Center for Analytical Chemistry Staff Chemists Questions concerning this monitoring project should be directed to Keith Starner at (916) 324-4167 or by email at [email protected]. IV. STUDY PLAN Monitoring in the two geographic areas will be conducted during the season or seasons of historically high pesticide use (Table 4, Figures 2-13). Central Coast monitoring efforts will be focused on the irrigation season (approximately March through September) in Monterey and Santa Cruz counties. Sampling will take place approximately once per month during this period. Winter monitoring in the Central Coast will be conducted in January or February, will include monitoring for pre-emergent herbicides, and may include sampling sites in San Luis Obispo and Santa Barbara counties. When possible, winter herbicide sampling will be timed to follow or coincide with rainfall events and subsequent runoff. Imperial Valley monitoring will include spring and fall monitoring for OP and carbamate insecticides. Spring Imperial Valley monitoring will include sampling for pre-emergent herbicides. Additional AIs may be added to the monitoring plan for either area in subsequent years. Pyrethroid insecticides are not included in the current monitoring plan, but may be added in subsequent years. Six to ten “primary” sites in each area will be sampled at least once at every sampling interval throughout the multi-year project. Primary sites will be sampled for organophosphate and carbamate insecticides at every sampling event. Samples will also be collected for additional AIs at the primary sites as appropriate based on historical pesticide use. In addition to the primary sites, additional “secondary” sites will be sampled as appropriate based on current pesticide use in the areas. Some sites (primary or secondary) may be sampled multiple times during a single sample event to collect time-series pesticide concentration data. Locations of individual sampling sites will be determined based on recent surface monitoring results and the historical pesticide use patterns in the areas. Site selection will follow the general guidelines in Standard Operating Procedure (SOP) FSWA002.00 (Bennett 1997) where applicable. Monitoring in the two areas is planned to continue through Fall 2009. Including data previously collected, this will provide data through three complete irrigation seasons in the Central Coast and three spring/fall cycles in the Imperial Valley. The project may be extended if additional data are needed. The details presented here, including project budget, apply to year one. Sampling for year one of the assessment will commence in August 2007 and continue through June 2008.
V. SAMPLING METHODS At each sampling site, surface water grab samples for chemical analysis will be collected into 1-liter amber glass bottles. Grab samples will be collected as close to center channel as possible using either a grab pole consisting of a glass bottle at the end of an extendable pole, or other sampling equipment designed to collect a sample directly into a 1-liter glass bottle. Samples may be collected into a stainless steel Kemmerer sampler (Wildlife Supply) and transferred to glass bottles in the field. Glass bottles will be sealed with Teflon-lined lids and samples will be transported and stored on wet ice or refrigerated at 4oC until extraction for chemical analysis. Dissolved oxygen, pH, specific conductivity, and water temperature will be measured in situ at each site during each sampling period. VI. CHEMICAL ANALYSIS Chemical analysis will be performed by the California Department of Food and Agriculture’s Center for Analytical Chemistry. Analytical method titles, analytes, method detection limits, and reporting limits for this study are given in Table 5. Details of the chemical analysis methods and method detection/reporting limits for newly developed methods will be provided in the final report. Quality control will be conducted in accordance with Standard Operating Procedure QAQC001.00 (Segawa 1995). VII. DATA ANALYSIS Concentrations of pesticides in water will be reported as micrograms per liter (µg/L) / parts per billion (ppb) or nanograms per liter (ng/L) / parts per trillion (ppt). Resulting data will be analyzed and reported as appropriate, potentially including the following: Comparison of pesticide concentrations to aquatic toxicity benchmarks, water quality limits and other toxicity data (US EPA 2007, Marshack 2007, CDFG 1994a, 1994b, 1995, 1996a, 1996b, 1998a, 1998b, 2000); spatial analysis of data in order to identify correlations between observed pesticide concentrations and region-specific geographical features such as climate, soil type, cropping patterns and agricultural practices. VIII. TIMETABLE Field Sampling: August 2007 through June 2008 Chemical Analysis: September 2007 through September 2008 Final Report: April 2009

IX. BUDGET
Sample analysis Samples Cost per sample Total Organophosphate 130 650 84500 Carbamates 120 800 96000 Triazines/herbicides 20 900 18000 Dinitroanilines 25 650 16250 (estimated cost) Oxyfluorfen 10 400 4000 (estimated cost) Thiram 15 400 6000 Subtotal 224750 Continuing QC Samples Cost per sample Total Organophosphate 13 650 8450 Carbamates 12 800 9600 Triazines/herbicides 2 900 1800 Dinitroanilines 3 650 1950 (estimated cost) Oxyfluorfen 1 400 400 (estimated cost) Thiram 2 400 800 Subtotal 23000 Total cost 247750
X. REFERENCES Anderson, B.S., Phillips, B.M., Hunt, J.W., Connor, V., Richard, N., Tjeerdema, R.S. 2006. Identifying
primary stressors impacting macroinvertebrates in the Salinas River (California, USA): Relative effects on pesticides and suspended particles. Environmental Pollution 141 402-408.
Bennett, K. 1997. Conducting Surface Water Monitoring for Pesticides. Environmental Hazards
Assessment Program, FSWA002.00. Department of Pesticide Regulation, Sacramento, CA. CDFG (California Department of Fish and Game)1994a. Hazard Assessment of the Insecticide Diazinon
to Aquatic Organisms in the Sacramento-San Joaquin River. http://www.cdpr.ca.gov/docs/sw/hazasm/hazasm94_2.pdf
CDFG 1994b. Hazard Assessment of the Insecticide Chlorpyrifos to Aquatic Organisms in the
Sacramento-San Joaquin River System. http://www.cdpr.ca.gov/docs/sw/hazasm/hazasm94_1.pdf
CDFG 1995. Hazard Assessment of the Insecticide Methidathion to Aquatic Organism in the
Sacramento-San Joaquin River System. CDFG 1996a. Hazard Assessment of the Insecticide Dimethoate to Aquatic Organisms in the
Sacramento-San Joaquin River System. http://www.cdpr.ca.gov/docs/sw/hazasm/hazasm96_4.pdf

CDFG 1996b. Hazard Assessment of the Insecticide Methomyl to Aquatic Organisms in the San Joaquin River System. http://www.cdpr.ca.gov/docs/sw/hazasm/hazasm96_6.pdf
CDFG 1998a. Hazard Assessment of the Insecticide Malathion to Aquatic Life in the Sacramento-San
Joaquin River System. http://www.cdpr.ca.gov/docs/sw/hazasm/hazasm98_2.pdf
CDFG 1998b. Hazard Assessment of the Insecticide Carbaryl to Aquatic Life in the Sacramento-San
Joaquin River System. http://www.cdpr.ca.gov/docs/sw/hazasm/hazasm98_1.pdf
CDFG 2000. Water Quality Criteria for Diazinon and Chlorpyrifos.
http://www.cdpr.ca.gov/docs/sw/hazasm/hazasm00_3.pdf CDPR 2007a. California Department of Pesticide Regulation’s Pesticide Information Portal, Pesticide
Use Report (PUR) data. http://calpip.cdpr.ca.gov/cfdocs/calpip/prod/main.cfm
Hunt, J.W., Anderson, B.S., Phillips, B.M., Tjeerdema, R.S., Richard, N., Connor, V., Worcester, K.,
Angelo, M., Bern, A., Fulfrost, B., Mulvaney, D. 2006. Spatial relationships between water quality and pesticide application rates in agricultural watersheds. Environmental Monitoring and Assessment 121: 245-262.
Marshack, J. 2007. A compilation of water quality goals. California Regional Water Quality Control
Board, Central Valley Region. http://www.swrcb.ca.gov/centralvalley/water_issues/water_quality_standards_limits/water_quality_goals/index.html
Segawa, R. 1995. Chemistry Laboratory Quality Control. Environmental Hazards Assessment Program
QAQC001.00. Department of Pesticide Regulation, Sacramento, CA. Starner, K., White, J., Spurlock, F., and Kelley, K. 2006. Pyrethroid Insecticide in California Surface
Waters and Bed Sediments: Concentrations and Estimated Toxicities. California Department of Pesticide Regulation, Environmental Monitoring. http://www.cdpr.ca.gov/docs/sw/swposters/starner_pyreth06.pdf
Starner, K. 2007a. Assessment of acute aquatic toxicity of current-use pesticides in California, with
monitoring recommendations. California Department of Pesticide Regulation, Environmental Monitoring.
Starner, K. 2007b. Review of US EPA Aquatic Life Benchmarks, with Monitoring Recommendations.
California Department of Pesticide Regulation, Environmental Monitoring. In preparation. Starner, K. 2007c. Research Results: Preliminary Assessment of Pesticide Contamination of Surface
Waters in High Use Regions of California. California Department of Pesticide Regulation, Environmental Monitoring. In preparation. Study protocol is available at: http://www.cdpr.ca.gov/docs/empm/pubs/protocol/study238protocol.pdf
US EPA 2002 Reregistration Eligibility Decision for Fenamiphos.
http://www.epa.gov/pesticides/reregistration/status.htm

US EPA 2005. Dichlorvos (DDVP) Revised Ecological Risk Assessment.
http://www.epa.gov/pesticides/reregistration/status.htm US EPA 2006a. US EPA Office of Pesticide Programs ECOTOX database.
http://mountain.epa.gov/ecotox/ US EPA 2006b. Methamidophos IRED.
http://www.epa.gov/pesticides/reregistration/status.htm US EPA 2007. Aquatic Life Benchmark Table.
http://www.epa.gov/oppefed1/ecorisk_ders/aquatic_life_benchmark.htm

Table 1. Agricultural Use of Monitoring Candidates, Monterey County and Imperial Valley.
Chemical Class Status this project Monterey Co. Use (1) Imperial Valley UseChlorpyrifos Organophosphate insecticide included 61886 77138DDVP (degradate of naled) Organophosphate insecticide included 0 0Diazinon Organophosphate insecticide included 163648 39121Dimethoate Organophosphate insecticide included 41678 29902Disulfoton Organophosphate insecticide included 10293 1753Ethoprop Organophosphate insecticide included 1351 317Fenamiphos Organophosphate insecticide included 4600 0Malathion Organophosphate insecticide included 69950 58358Methidathion Organophosphate insecticide included 9602 69Methyl Parathion Organophosphate insecticide included 100 0Phorate Organophosphate insecticide included 373 3562Profenofos Organophosphate insecticide included 0 443Tribufos Organophosphate insecticide included 0 3698Acephate (degrades to methamidaphos) Organophosphate insecticide candidate for FY 2008-09 57699 14240Methamidophos (degradate of acephate) Organophosphate insecticide candidate for FY 2008-09 10 982Naled (degrades to DDVP) Organophosphate insecticide not included 22069 4072Phosmet Organophosphate insecticide not included 1 16Carbaryl Carbamate insecticide included 4135 3568Methiocarb (Mesurol) Carbamate insecticide included 50 0Carbofuran Carbamate insecticide included 7024 3047Methomyl Carbamate insecticide included 56957 43550Aldicarb Carbamate insecticide included 35 3500Thiram Dithiocarbamate fungicide included 13402 1805Oxyfluorfen Diphenyl ether herbicide under dev. for FY 2007-08 31286 5623Trifluralin Dinitroaniline herbicide under dev. for FY 2007-08 2922 238722Oryzalin Dinitroaniline herbicide under dev. for FY 2007-08 13639 0Pendimethalin Dinitroaniline herbicide under dev. for FY 2007-08 614 24511Ethalfluralin Dinitroaniline herbicide under dev. for FY 2007-08 266 109Endosulfan Chlorinated hydrocarbon candidate for future monitoring 525 8189Chlorothalonil substituted benzene fungicide candidate for future monitoring 15340 36658Simazine triazine herbicide included 16649 0Atrazine triazine herbicide included 0 14750Diuron urea herbicide included 1860 1339(1) Use is average of agricultural use, 2003-2005, in pounds of active ingredient applied.Sources: Starner 2007, US EPA 2007, Starner forthcoming (a).

Table 2. US EPA Aquatic Life Benchmarks for Monitoring Candidates
Chemical Acute fish Chronic fish Acute inverts Chronic inverts Acute Acute Chronic Chemical Class(all in ug/L) nonvascular plants vascular plants aquatic community
Azinphos-methyl 0.18 0.36 0.08 0.16 — — — OrganophosphateChlorpyrifos 0.9 0.57 0.05 0.04 140 — — OrganophosphateDiazinon 45 0.55 0.1 0.17 3700 — — OrganophosphateDimethoate 3000 430 21.5 40 — — — OrganophosphateDisulfoton 19.5 39 1.95 0.037 — — — OrganophosphateEthoprop 150 24 22 0.8 8400 — — OrganophosphateMalathion 2 4 0.25 0.06 — — — OrganophosphateMethyl parathion 500 80 0.07 0.02 5300 — — OrganophosphatePhorate 0.5 1 0.3 0.21 1300 — — OrganophosphateProfenofos 12.5 2 0.45 0.2 — — — OrganophosphateTribufos 122.5 — 13.5 2 148 — — OrganophosphateAldicarb 26 0.46 10 1 50000 — — CarbamateCarbaryl 125 210 2.55 1.5 1100 — — CarbamateMethiocarb (Mesurol) 218 50 3.5 0.1 — — — CarbamateCarbofuran 44 5.7 1.115 0.75 — — — CarbamateMethomyl 265 57 4.4 0.4 — — — CarbamateOxyfluorfen 100 38 40 13 0.29 — — Nitrophenyl etherEthalfluralin 16 0.4 30 24 25 — — dinitroanilinesOryzalin 1440 220 700 — 42 15.4 — dinitroanilinesPendimethalin 69 6.3 140 14.5 5.4 12.5 — dinitroanilinesTrifluralin 20.5 1.14 280 2.4 7.52 43.5 — dinitroanilinesSimazine 3200 960 500 1000 36 140 — TriazineAtrazine 2650 62 360 62 32 18 17.5 TriazineNorflurazon 4050 770 7500 1000 13 86 — PyridazinoneDiuron 355 26 80 160 2.4 — — UreaChlorothalonil 11.5 3 34 39 190 — — Nitrile
Source: US EPA 2007.

Table 3. Additional Toxicity Data for Candidate AIs. Chemical Test Organism Test/Endpoint Concentration (ppb) Source Dichlorvos (DDVP) Waterflea 48 hr EC50 0.07 US EPA 2005 Stonefly 96 hr LC50 0.1 US EPA 2006a Waterflea 48 hr EC50 0.26 US EPA 2005 Scud 96 hr LC50 0.5 US EPA 2006aFenamiphos (1) Daphnid LC50 1.9 US EPA 2002 Bluegill sunfish 96 hr LC50 4.5 US EPA 2006a Mysid shrimp (2) LC50 6.2 US EPA 2002 Mysid 96 hr LC50 6.8 US EPA 2006a Bluegill Sunfish LC50 9.5 US EPA 2002 Bluegill sunfish 96 hr LC50 9.6 US EPA 2006aMethamidophos Blue shrimp (2) 96 hr EC50 0.00016 US EPA 2006b Waterflea 48 hr EC50 0.026 US EPA 2006b Freshwater Prawn 48 hr LC50 0.042 US EPA 2006a White shrimp 48 hr LC50 0.16 US EPA 2006aPhosmet Scud 96 hr LC50 2 US EPA 2006a Brown shrimp 48 hr LC50 2.5 US EPA 2006aThiram Mysid 96 hr LC50 3.36 US EPA 2006a Harlequin fish 96 hr LC50 7 US EPA 2006a (1) Fenamiphos degradates, sulfoxide and sulfone, are equally toxic to aquatic invertebrates. EPA 2002. (2) Estuarine/Marine organism Table 4. Monitoring Plan, Central Coast and Imperial Valley, 2007-2008.
Area Analytical Screen Season Sample events Central Coast Organophosphates Spring though Fall 6 Central Coast Carbamates Spring through Fall 6 Central Coast Organophosphates Winter 1 Central Coast Dinitroaniline herbicides Winter 1 Central Coast Oxyfluorfen Winter 1 Central Coast Triazine herbicides Winter 1 Imperial Valley Organophosphates Spring and Fall 2 Imperial Valley Carbamates Spring and Fall 2 Imperial Valley Dinitroaniline herbicides Spring 1 Imperial Valley Triazine herbicides Spring 1
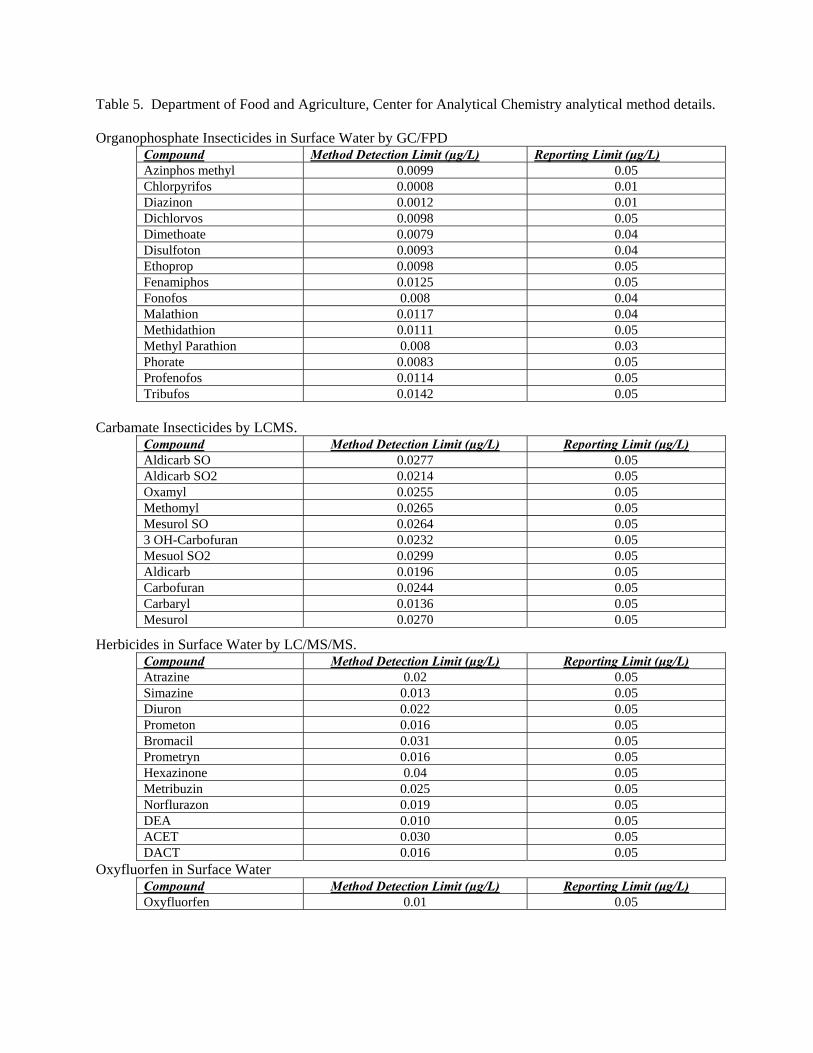
Table 5. Department of Food and Agriculture, Center for Analytical Chemistry analytical method details. Organophosphate Insecticides in Surface Water by GC/FPD
Compound Method Detection Limit (µg/L) Reporting Limit (μg/L) Azinphos methyl 0.0099 0.05 Chlorpyrifos 0.0008 0.01 Diazinon 0.0012 0.01 Dichlorvos 0.0098 0.05 Dimethoate 0.0079 0.04 Disulfoton 0.0093 0.04 Ethoprop 0.0098 0.05 Fenamiphos 0.0125 0.05 Fonofos 0.008 0.04 Malathion 0.0117 0.04 Methidathion 0.0111 0.05 Methyl Parathion 0.008 0.03 Phorate 0.0083 0.05 Profenofos 0.0114 0.05 Tribufos 0.0142 0.05
Carbamate Insecticides by LCMS.
Compound Method Detection Limit (µg/L) Reporting Limit (μg/L) Aldicarb SO 0.0277 0.05 Aldicarb SO2 0.0214 0.05 Oxamyl 0.0255 0.05 Methomyl 0.0265 0.05 Mesurol SO 0.0264 0.05 3 OH-Carbofuran 0.0232 0.05 Mesuol SO2 0.0299 0.05 Aldicarb 0.0196 0.05 Carbofuran 0.0244 0.05 Carbaryl 0.0136 0.05 Mesurol 0.0270 0.05
Herbicides in Surface Water by LC/MS/MS. Compound Method Detection Limit (µg/L) Reporting Limit (μg/L) Atrazine 0.02 0.05 Simazine 0.013 0.05 Diuron 0.022 0.05 Prometon 0.016 0.05 Bromacil 0.031 0.05 Prometryn 0.016 0.05 Hexazinone 0.04 0.05 Metribuzin 0.025 0.05 Norflurazon 0.019 0.05 DEA 0.010 0.05 ACET 0.030 0.05 DACT 0.016 0.05
Oxyfluorfen in Surface Water Compound Method Detection Limit (µg/L) Reporting Limit (μg/L) Oxyfluorfen 0.01 0.05

Imperial Valley
Central Coast
California
100Miles
Figure 1. Monitoring regions.

MONTEREY
SAN BENITO
MERCED
FRESNO
SANTA CRUZ SANTA CLARA
SALINAS R
SAN ANTONIO RES
M o n t e r e y B a y
10Miles
Organophosphate Use, 2005Pounds AI Applied
1 - 500
501 - 1500
1501 - 2500
2501 - 4000
4001 - 8000
Figure 2. Monterey County Organophosphate Use, 2005.

MONTEREY
SAN BENITO
MERCED
FRESNO
SANTA CRUZ SANTA CLARA
SALINAS R
SAN ANTONIO RES
M o n t e r e y B a y
10Miles
Carbamate Use, 2005Pounds AI Applied
1 - 125
126 - 150
151 - 500
501 - 1000
1001 - 3000
Figure 3. Monterey County Carbamate Use, 2005.

MONTEREY
SAN BENITO
MERCED
FRESNO
SANTA CRUZ SANTA CLARA
SALINAS R
SAN ANTONIO RES
Monterey Bay
10Miles
Herbicide Use, 2005Pounds AI Applied
0 - 200
201 - 500
501 - 1000
1001 - 2000
2001 - 4001
Figure 4. Monterey County Herbicide Use, 2005.
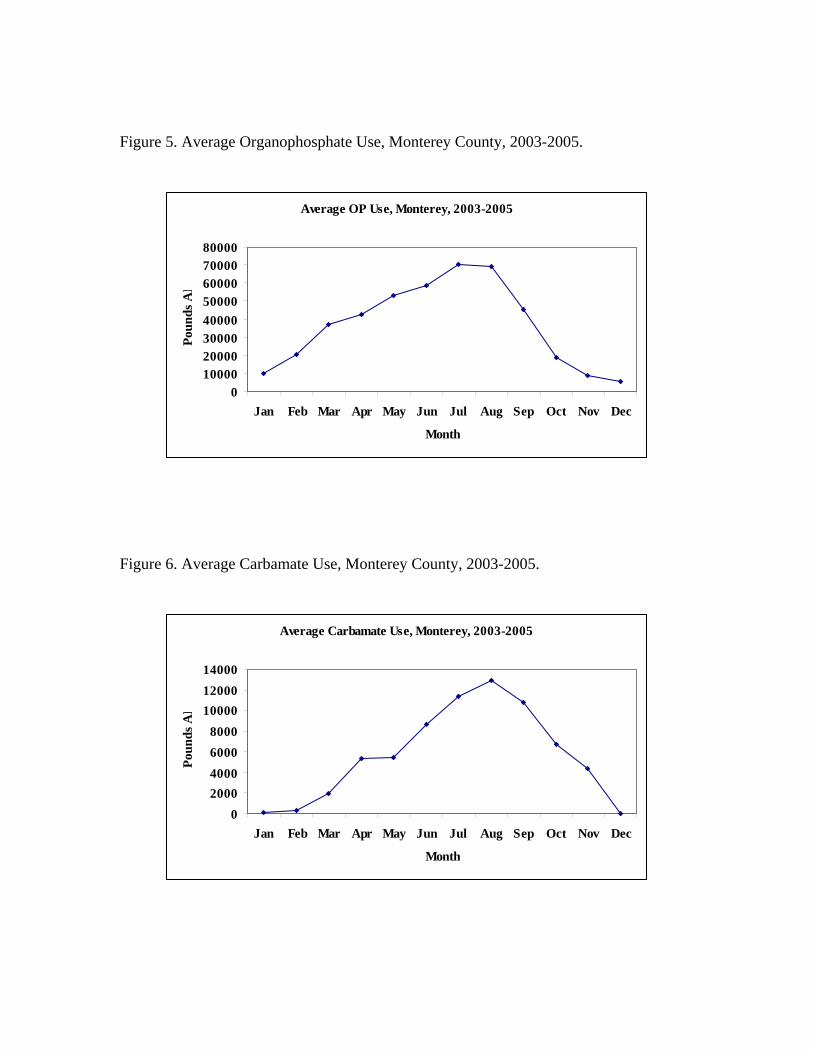
Figure 5. Average Organophosphate Use, Monterey County, 2003-2005.
Average OP Use, Monterey, 2003-2005
01000020000300004000050000600007000080000
Jan Feb Mar Apr May Jun Jul Aug Sep Oct Nov Dec
Month
Poun
ds A
I
Figure 6. Average Carbamate Use, Monterey County, 2003-2005.
Average Carbamate Use, Monterey, 2003-2005
02000400060008000
100001200014000
Jan Feb Mar Apr May Jun Jul Aug Sep Oct Nov Dec
Month
Poun
ds A
I

Figure 7. Average Pre-emergent Herbicide Use, Monterey County, 2003-2005.
Average Herbicide Use, Monterey, 2003-2005
0
5000
10000
15000
20000
25000
Jan Feb Mar Apr May Jun Jul Aug Sep Oct Nov Dec
Month
Poun
ds A
I
Pre-emergent herbicides include oxyfluorfen, simazine, and the dinitroaniline herbicides.

Coachella
El Centro
Brawley
Calexico
Imperial
Heber
Mecca
Seeley
Calipatria
Holtville
Niland
Westmorland
NEW
R
ALAM
O R
10Miles
Figure 8. Imperial County Organophosphate Use, 2005.
S a l t o n S e a
Baja California
Organophosphate Use, 2005Pounds AI Applied
3 - 150
151 - 300
301 - 600
601 - 1200
1201 - 2500
Imperial County

Coachella
El Centro
Brawley
Calexico
Imperial
Heber
Mecca
Seeley
Calipatria
Holtville
Niland
Westmorland
NEW
R
ALAM
O R
10Miles
Figure 9. Imperial County Carbamate Use, 2005.
S a l t o n S e a
Baja California
Carbamate Use, 2005Pounds AI Applied
0 - 100
101 - 200
201 - 350
351 - 550
551 - 1000
Imperial County

Coachella
El Centro
Brawley
Calexico
Imperial
Heber
Mecca
Seeley
Calipatria
Holtville
Niland
Westmorland
NEW
R
ALAM
O R
10Miles
Figure 10. Imperial County Herbicide Use, 2005.
S a l t o n S e a
Baja California
Herbicide Use 2005Pounds AI Applied
1 - 200
201 - 450
451 - 800
801 - 1500
1501 - 2400
Imperial County

Figure 11. Average Organophosphate Use, Imperial County, 2003-2005.
Average OP Use, Imperial, 2003-2005
0
10000
20000
30000
40000
50000
60000
Jan Feb Mar Apr May Jun Jul Aug Sep Oct Nov Dec
Month
Poun
ds A
I
Figure 12. Average Carbamate Use, Imperial County, 2003-2005.
Average Carbamate Use, Imperial, 2003-2005
0100020003000400050006000700080009000
Jan Feb Mar Apr May Jun Jul Aug Sep Oct Nov Dec
Month
Poun
ds A
I

Figure 13. Average Herbicide Use, Imperial County, 2003-2005.
Average Herbicide Use, Imperial, 2003-2005
0
20000
40000
60000
80000
100000
120000
Jan Feb Mar Apr May Jun Jul Aug Sep Oct Nov Dec
Month
Poun
ds A
I