Studies on Hydrogen Sensing by Anodized Nanoporous Titania Thin Film Using Soft Drink Electrolyte
10
Frontiers in Sensors Volume 1 Issue 2 April, 2013 http://www.seipub.org/fs/ 17 Studies on Hydrogen Sensing by Anodized Nanoporous Titania Thin Film Using Soft Drink Electrolyte A. Hazra 2 , S. K. Hazra 3 , D. Dutta 1 , C. K. Sarkar 1 , S. Basu *1 1 IC Design & Fabrication Centre Dept. Of Electronics & Telecommunication Engineering Jadavpur University, Kolkata-700032, India 2 Dept. Of Electronics & Telecommunication Engineering Bengal Engineering and Science University, Howrah-711103, India 3 Dept. of Physics and Materials Science, Jaypee University of Information Technology, Waknaghat-173234, Himachal Pradesh, India *1 [email protected] Abstract Nano-porous titanium dioxide (TiO2) thin films were developed by UV assisted potentiostatic anodization of 99.7% pure titanium foil. The internationally popular soft drink ‘Coca-Cola’ was used as the electrolyte in this anodization process. Electrochemical oxidation and photoetching were carried out at room temperature and at 10 V potentiostatic bias without and with 400 W UV light illumination respectively. The prepared TiO2 thin film was annealed at 150ᴼC for 3 hours. The surface of the prepared TiO2 film was characterized with Scanning Electron Microscopy (SEM) and Atomic Force Microscopy (AFM) to confirm the crystallinity, porous structure and surface roughness. The Optical study revealed a band gap of 3.898 eV. Hot probe method exhibited n-type conductivity of the electrochemically grown TiO2 thin films. Palladium-Silver alloy (Pd-Ag) contacts were deposited laterally on the oxide surface as catalytic metal electrodes to fabricate a planar sensor configuration. The hydrogen sensor study was carried out at different temperatures (100 to 200ᴼC) and in different hydrogen gas concentrations (1000 to 10000 ppm). Nanocrystalline and nano-porous TiO2 sensor was promising to sense hydrogen in air ambient with relatively fast response and recovery times (e.g. ~2.9 s and ~75 s) at the optimum temperature of 150 0 C. Brief mechanism behind the sensing performance has been also discussed. Keywords Electrochemical Oxidation; Coca-Cola Electrolyte; Titanium Dioxide; Nano-Porous TiO2, Hydrogen Sensor; Fast Response. Introduction Titanium dioxide thin film is widely investigated for different applications because of its excellent temperature stability and interesting chemical, electrical and optical properties [Alessandri et al., 2007, Lee et al., 2008]. TiO2 thin film is also a popular gas sensing material because of its very good chemical stability at high temperature and harsh environment [Pakma et al., 2008]. Various methods have been used to prepare TiO2 thin films like DC reactive magnetron sputtering, electron beam deposition, atomic layer deposition, thermal oxidation, electrochemical anodization, plasma enhanced chemical vapor deposition (PECVD) and sol-gel technique [Pakma et al., 2008, Bengi et al., 2010]. Electrochemical anodization is one of the most popular techniques for the preparation of porous and tube like TiO2 thin film structures. Different types of electrolytes like HF , H2SO4, NH4F, H3PO4 [Paulose et al., 2006, Shimizu et al., 2002, Zhu et al., 2008] are reported for the anodization of TiO2 thin film. The porous TiO2 thin film is known to increase the interaction of sensing gas molecules with the oxide surface due to much higher surface to volume ratio leading to higher gas sensitivity at relatively low temperature and low concentration of test gases [Hazra et al., 2006]. Very stable, reproducible and consistent sensing performance were observed at low temperature. Hazra and Basu reported on the preparation of Al doped titania by thermal oxidation of high purity Ti at 800ᴼC and the developmemt of porous structure by UV assisted electrochemical etching using dilute
-
Upload
shirley-wang -
Category
Documents
-
view
218 -
download
0
description
http://www.seipub.org Nano-porous titanium dioxide (TiO2) thin films were developed by UV assisted potentiostatic anodization of 99.7% pure titanium foil. The internationally popular soft drink ‘Coca-Cola’ was used as the electrolyte in this anodization process.
Transcript of Studies on Hydrogen Sensing by Anodized Nanoporous Titania Thin Film Using Soft Drink Electrolyte

Frontiers in Sensors Volume 1 Issue 2 April, 2013 http://www.seipub.org/fs/
17
Studies on Hydrogen Sensing by Anodized
Nanoporous Titania Thin Film Using Soft
Drink Electrolyte A. Hazra2, S. K. Hazra3, D. Dutta1, C. K. Sarkar1, S. Basu*1
1IC Design & Fabrication Centre
Dept. Of Electronics & Telecommunication Engineering
Jadavpur University, Kolkata-700032, India
2Dept. Of Electronics & Telecommunication Engineering
Bengal Engineering and Science University, Howrah-711103, India
3Dept. of Physics and Materials Science, Jaypee University of Information Technology,
Waknaghat-173234, Himachal Pradesh, India
Abstract
Nano-porous titanium dioxide (TiO2) thin films were
developed by UV assisted potentiostatic anodization of
99.7% pure titanium foil. The internationally popular soft
drink ‘Coca-Cola’ was used as the electrolyte in this
anodization process. Electrochemical oxidation and
photoetching were carried out at room temperature and at
10 V potentiostatic bias without and with 400 W UV light
illumination respectively. The prepared TiO2 thin film was
annealed at 150ᴼC for 3 hours. The surface of the prepared
TiO2 film was characterized with Scanning Electron
Microscopy (SEM) and Atomic Force Microscopy (AFM) to
confirm the crystallinity, porous structure and surface
roughness. The Optical study revealed a band gap of 3.898
eV. Hot probe method exhibited n-type conductivity of the
electrochemically grown TiO2 thin films. Palladium-Silver
alloy (Pd-Ag) contacts were deposited laterally on the oxide
surface as catalytic metal electrodes to fabricate a planar
sensor configuration. The hydrogen sensor study was
carried out at different temperatures (100 to 200ᴼC) and in
different hydrogen gas concentrations (1000 to 10000 ppm).
Nanocrystalline and nano-porous TiO2 sensor was
promising to sense hydrogen in air ambient with relatively
fast response and recovery times (e.g. ~2.9 s and ~75 s) at the
optimum temperature of 1500C. Brief mechanism behind the
sensing performance has been also discussed.
Keywords
Electrochemical Oxidation; Coca-Cola Electrolyte; Titanium
Dioxide; Nano-Porous TiO2, Hydrogen Sensor; Fast
Response.
Introduction
Titanium dioxide thin film is widely investigated for
different applications because of its excellent
temperature stability and interesting chemical,
electrical and optical properties [Alessandri et al., 2007,
Lee et al., 2008]. TiO2 thin film is also a popular gas
sensing material because of its very good chemical
stability at high temperature and harsh environment
[Pakma et al., 2008]. Various methods have been used
to prepare TiO2 thin films like DC reactive magnetron
sputtering, electron beam deposition, atomic layer
deposition, thermal oxidation, electrochemical
anodization, plasma enhanced chemical vapor
deposition (PECVD) and sol-gel technique [Pakma et
al., 2008, Bengi et al., 2010]. Electrochemical
anodization is one of the most popular techniques for
the preparation of porous and tube like TiO2 thin film
structures. Different types of electrolytes like HF ,
H2SO4, NH4F, H3PO4 [Paulose et al., 2006, Shimizu et
al., 2002, Zhu et al., 2008] are reported for the
anodization of TiO2 thin film. The porous TiO2 thin
film is known to increase the interaction of sensing gas
molecules with the oxide surface due to much higher
surface to volume ratio leading to higher gas
sensitivity at relatively low temperature and low
concentration of test gases [Hazra et al., 2006]. Very
stable, reproducible and consistent sensing
performance were observed at low temperature.
Hazra and Basu reported on the preparation of Al
doped titania by thermal oxidation of high purity Ti at
800ᴼC and the developmemt of porous structure by
UV assisted electrochemical etching using dilute

http://www.seipub.org/fs/ Frontiers in Sensors Volume 1 Issue 2 April, 2013
18
H2SO4 electrolyte. Shimizu et al reported H2 sensing by
anodically grown TiO2 thin film with controlled
porous morphology by using different electrolytes (e.g.
Aqueous solutions of H2SO4 and NaOH) and different
oxidation temperatures. In the present work Coca-
Cola, one of the most popular soft-drinks throughout
the world, which contains different possible
ingredients like phosphoric acid (H3PO4), Caffeine
(C8H10N4O2), citric acid (C6H8O7), fructose (C6H12O6),
carbon dioxide, sugar and water, was used as an
electrolyte to prepare TiO2 thin film by electrochemical
anodization and UV assisted photoetching. Coca-Cola
is acidic and has the pH value of ~2.6 mainly due to
the presence of phosphoric acid. The advantage of
using Coca-Cola as the electrolyte is more controlled
anodization due to relatively weak electrolyte strength
and slow photoetching. The anodization process was
followed by photoetching using the exposure of UV
light to create a nano-porous oxide surface by
electrochemical dissolution of titanium dioxide. This
nano-porous TiO2 thin film was subsequently used for
hydrogen sensing. Detailed morphological study was
done by SEM and AFM to calculate the pore
dimension, the particle dimension and the roughness
of the titania layer. Planar resistive device structure
was fabricated for sensor study using Palladium-Silver
alloy (Pd-Ag) contact as the catalytic electrode metal.
Hydrogen sensor study showed consistent and reliable
performance with 12.1% response, 2.9 s response time
and 75.9 s recovery time using 10000 ppm H2 in air at
the operating temperature of 150ᴼC.
Experimental
Electrochemical Deposition and UV Assisted Etching
High purity titanium (99.7%) foil (0.25 mm thick) from
M/S Sigma Aldrich, USA was used as the starting
material for the growth of titanium dioxide thin film.
A 14 mm × 14 mm sample was cut and thoroughly
washed in an ultrasonic bath using acetone, methanol
and deionized water. The electrochemical anodization
was carried out in a quartz cell with three electrode
configurations of titanium anode, platinum cathode
and a Ag/ AgCl reference electrode (Fig. 1).
The electrochemical deposition of TiO2 thin film was
carried out using commercial Coca Cola solution as
the electrolyte. Three Coca Cola bottles were
purchased from three different stores and pH of the
Coca Cola solution was measured separately for the
three bottles. The PH value was obtained in the range
2.5 - 2.7. A constant 10 V potential was applied by
using scanning potentiostat (PAR Model 362) between
the cathode and the anode.
FIG. 1 SCHEMATIC DIAGRAM OF THE ANODIZATION SET UP
WITH UV RADIATION SOURCE
The electrode reactions in combination with field
driven ion diffusion lead to the formation of an oxide
layer on the anode surface. After deposition of the
oxide layer that took about one hour, photo
electrochemical etching at the same potentiostatic bias
was started using 400 watt UV radiation from a fiber
optic wave-guide coupled UV source (Model UV-LQ
400, Dr. Gröbel UV-Elektronik GmbH, Germany). The
oxide surface was partially etched out by illuminating
with UV radiation for 20 min. After etching, the
sample was washed with deionized water and dried.
Prepared TiO2 thin film was annealed at 150ᴼC for 3
hours.
Material Characterizations
The grown TiO2 thin film was characterized after
annealing at 150ᴼC for 3 hours. Crystallinity of the
prepared film was confirmed by 2D x-ray diffraction
(XRD) technique. The surface morphology of the
Titanium Dioxide film was studied by Scanning
Electron Microscopy (SEM) (Model: JEOL JSM-
6390LV). Atomic Force Microscopy (AFM) (Model:
NanoScope IIIa , Digital Instruments) employed to
determine the surface roughness, particle diameter
and pore dimension using SPIP 6.01.13 AFM imaging
tool. Optical band gap of the TiO2 thin film was
evaluated by UV-Visible-NIR optical spectroscopy
(Perkin Elmer Lamda-750).
Schematic of gas sensor structure and electrical
contact formation
A 3D view of the planar device is shown in Fig. 2. A 3
mm × 7 mm device with 2 mm separation between two

Frontiers in Sensors Volume 1 Issue 2 April, 2013 http://www.seipub.org/fs/
19
Pd-Ag alloy contact pads was fabricated for sensor
study. Palladium-silver alloy (Pd: 85% and Ag: 15%)
with the dimension 2 mm x 2 mm x 0.2 µm was
deposited on the top surface of the titanium oxide
(thickness 2 µm) by e-beam evaporation using an Al
metal mask. The electrical connections were made by
using fine copper wire attached to the pads using
silver paste.
FIG. 2 THE SCHEMATIC OF THE PLANAR GAS SENSOR
DEVICE (NOT TO SCALE).
Gas Sensor Set Up
The sensor set up consists of stainless steel tube gas
transmission lines fitted with mass flow controllers and
mass flow meters (Digiflow, USA), a closed corning
glass tube with inlet and outlet provisions for gases
and placed co-axially inside a resistively heated
furnace with a 4 cm constant temperature zone and a
precise temperature controller (±10C) with a built-in
copper constantan thermocouple [Kanungo et al.,
2009]. A computer interfaced Agilent digital
multimeter (Agilent U1252A) was employed for the
data acquisition. High purity hydrogen and air were
used for the experiments. The sensing experiments
were repeated using three identically prepared sensor
devices and a variation of ~2% in reading was
observed.
Results and Discussions
Synthesis of Nanocrystalline Titania Thin Film
Coca-Cola is a soft drink with an acidic nature (pH ~
2.6) mainly due to the presence of phosphoric acid
(H3PO4) which is a good but weak electrolyte for
porous TiO2 thin film preparation [Paulose et al., 2006,
Park et al., 2010, Ishikawa et al., 2002]. The thickness of
anodically grown oxide depends mainly on the nature
of the electrolyte and the applied potential [Jackson et
al., 2007]. This experiment was done in the
potentiostatic mode with constant voltage of 10 V.
Current through Coca-Cola electrolyte was recorded
continuously and the current vs time curve was
plotted as shown in Fig 3. The current decreased
slowly from 1.28 mA to 0.34 mA and then saturated
after 60 min in the dim light laboratory environment
that referred to as dark in the manuscript.
0 20 40 60 80 100 120-1
0
1
2
3
4
5
6
7
8
9
Cu
rre
nt
(mA
)
Time (min)
Electrochemical deposition & UV
assisted etching using Coca Cola
electrolyte (pH~2.6)
DARK UV DARK
FIG. 3 CURRENT VS TIME CHARACTERISTICS AT CONSTANT
POTENTIAL OF 10 V DURING THE ANODIZATION PROCESS.
After the application of 10 V constant potential, the
titania layer started to grow and was slowly
transformed to a dense layer when the current
through the electrolyte became saturated. Since TiO2
has higher resistivity than the electrolyte, the applied
voltage would make a potential drop over the oxide
film on the anode [Jackson et al., 2007]. As long as the
electrical field was strong enough to drive the ion
conduction through the oxide, the oxide film would
keep growing as shown in Fig. 4a. The reactions
corresponding to the oxide layer deposition are as
follows [Hazra et al., 2006, Ishikawa et al., 2002]:
eTiTi 44 1(a) HOHOH 444 2 (In acidic medium) 1(b)
44 )(4 OHTiOHTi
1(c)
OHTiOOHTi 224 2)( 1(d)
When the applied potential crossed the dielectric
breakdown limit of the grown TiO2 layer, pores were
created at the weak point of the oxide layer [Choi et al.,
2004]. Ti exposed through the pores in contact with the
electrolyte and more oxide layers formed following Eq.
1 were shown in Fig. 4b and 4c. Electrochemical
oxidation is a combined process of oxide formation
and oxide dissolution in the electrolyte [Sugiura et al.,
1998]. The creation of pores in the oxide layer also
depends on the dissolution rate of the deposited oxide
on the Ti substrate [Choi et al., 2004].
In this experiment, 400 watt UV radiation was applied for 20 min to activate the surface locally to generate excess number of pores on the oxide surface by electrochemical etching as indicated by the increase of

http://www.seipub.org/fs/ Frontiers in Sensors Volume 1 Issue 2 April, 2013
20
current (Fig. 3). The electrochemical etching process upon UV illumination is due to the generation of excess holes & electrons in the valance band followed by the excitation of electrons to the conduction band of the active oxide insulator [Hazra et al., 2006]. These generated charge carriers enhance the ionic conduction through the electrolyte and increase the oxide etching rate under a constant potentiostatic bias, thereby producing the porous structure.
FIG. 4 POROUS TiO2 THIN FILM FORMATION IN THE DARK
AND ON UV ILLUMINATION USING COCA-COLA AS THE
ELECTROLYTE (a) OXIDE GROWTH IN THE DARK (b) PORE
FORMATION DUE TO DIELECTRIC BREAKDOWN AND
EXPOSURE OF Ti (c) FURTHER TiO2 GROWTH INSIDE THE PORE
IN THE DARK (d) EXCESS PORE FORMATION ON UV
ILLUMINATION AND (e) GROWTH OF MORE TiO2 LAYER ON
THE Ti EXPOSED AREA IN THE DARK ENVIRONMENT.
The Oxide was partially dissolved in the electrolytic
solution on UV exposure and pores were generated on
the oxide surface as shown in Fig. 4d [Choi et al., 2004].
Subsequently, the residual titanium surface exposed at
the bottom of the pores got oxidized to form insulating
layer. For this reason the current initially increased
upon UV exposure because of etching of the oxide and
then gradually decreased due to formation of more
oxide on removal of UV illumination. Finally the
current tended to saturate. Fig. 4e shows that all the Ti
exposed in the pores was oxidized in the dark
environment.
Characterization of Nano-porous TiO2 Thin Film
The 2D-XRD model D/max-RAPID Rigaku micro-
diffractometer was used to study the x-Ray diffraction
of the grown titania thin film was identified as anatase
nanocrystalline structure [He et al., 2009].
Scanning Electron Micrograph (SEM) of UV assisted
electrochemically grown TiO2 thin film using Coca-
Cola electrolyte is shown in Fig. 5 which represents
the porous nature of the TiO2 film surface. Most of the
pores are oval in shape with the longitudinal
appearance. TiO2 thin film surface was heavily etched
due to UV exposure which is clearly shown in the
SEM image (Fig. 5).
FIG. 5 SEM IMAGE OF ANODICALLY GROWN POROUS TiO2
THIN FILM USING COCA-COLA AS AN ELECTROLYTE.
The surface roughness of UV assisted anodically
grown TiO2 thin film was measured by AFM. The
sample was scanned over 1000 nm × 1000 nm area and
the AFM images with 3D and 2D topography are
shown in Fig.6. Root mean square roughness (Rq) is
16.5 nm and the difference between the lowest and
highest points on the surface (Rp-p) is 100 nm. Different
types of surface roughness values have been
calculated from the AFM and plotted in Fig. 7.
The Pore size and the particle size were also calculated
from the AFM analysis and presented in Table 1. An
average pore diameter of 16.69 nm was calculated
indicating the nano-porous structure of the anodically
grown TiO2 thin film and an average particle diameter
of 15.57 nm was obtained. Nano-porous structure of
the TiO2 thin film is also clearly shown in the 3D
presentation of the AFM image.
TABLE 1 PARTICLE AND PORE DIAMETER OF TiO2 THIN FILM
CALCULATED FROM AFM ANALYSIS
Dimension Particle
Diameter (nm)
Pore
Diameter (nm)
Maximum 247.45 167.55
Minimum 1.48 1.71
Average 15.57 16.69
Frontiers in Sensors Volume 1 Issue 2 April, 2013 http://www.seipub.org/fs/
21
FIG. 6 AFM IMAGE OF ANODICALLY GROWN POROUS TiO2
THIN FILM USING COCA-COLA AS THE ELECTROLYTE (a) 3D
TOPOGRAPHY (b) 2D TOPOGRAPHY
Roughness Avera
ge
Root Mean Squar
e
Peak to
peak
Core roughness
depth
Maximum vally
depth
Maximum peak
height
nm 10 16.5 107 25.5 20 67.5
0
20
40
60
80
100
120
Different Surface Roughness
FIG.7 SURFACE ROUGHNESS CHART OF ANODICALLY
GROWN POROUS TIO2 THIN FILM USING COCA-COLA AS THE
ELECTROLYTE AS OBTAINED FROM THE AFM IMAGE.
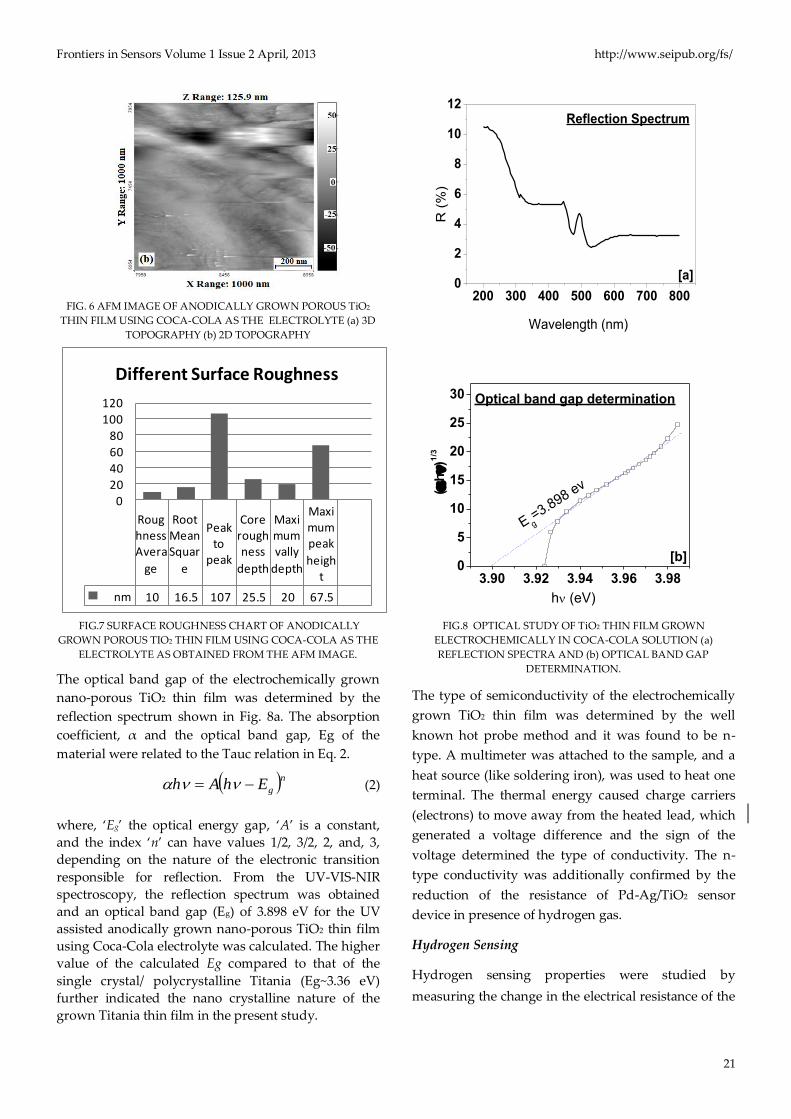
The optical band gap of the electrochemically grown
nano-porous TiO2 thin film was determined by the
reflection spectrum shown in Fig. 8a. The absorption
coefficient, α and the optical band gap, Eg of the
material were related to the Tauc relation in Eq. 2.
ngEhAh (2)
where, ‘Eg’ the optical energy gap, ‘A’ is a constant,
and the index ‘n’ can have values 1/2, 3/2, 2, and, 3,
depending on the nature of the electronic transition
responsible for reflection. From the UV-VIS-NIR
spectroscopy, the reflection spectrum was obtained
and an optical band gap (Eg) of 3.898 eV for the UV
assisted anodically grown nano-porous TiO2 thin film
using Coca-Cola electrolyte was calculated. The higher
value of the calculated Eg compared to that of the
single crystal/ polycrystalline Titania (Eg~3.36 eV)
further indicated the nano crystalline nature of the
grown Titania thin film in the present study.
200 300 400 500 600 700 8000
2
4
6
8
10
12
R (
%)
Wavelength (nm)
Reflection Spectrum
[a]
3.90 3.92 3.94 3.96 3.980
5
10
15
20
25
30 Optical band gap determination
(h)1
/3
h (eV)
E g=3.898 ev
[b]
FIG.8 OPTICAL STUDY OF TiO2 THIN FILM GROWN
ELECTROCHEMICALLY IN COCA-COLA SOLUTION (a)
REFLECTION SPECTRA AND (b) OPTICAL BAND GAP
DETERMINATION.
The type of semiconductivity of the electrochemically
grown TiO2 thin film was determined by the well
known hot probe method and it was found to be n-
type. A multimeter was attached to the sample, and a
heat source (like soldering iron), was used to heat one
terminal. The thermal energy caused charge carriers
(electrons) to move away from the heated lead, which
generated a voltage difference and the sign of the
voltage determined the type of conductivity. The n-
type conductivity was additionally confirmed by the
reduction of the resistance of Pd-Ag/TiO2 sensor
device in presence of hydrogen gas.
Hydrogen Sensing
Hydrogen sensing properties were studied by
measuring the change in the electrical resistance of the
http://www.seipub.org/fs/ Frontiers in Sensors Volume 1 Issue 2 April, 2013
22
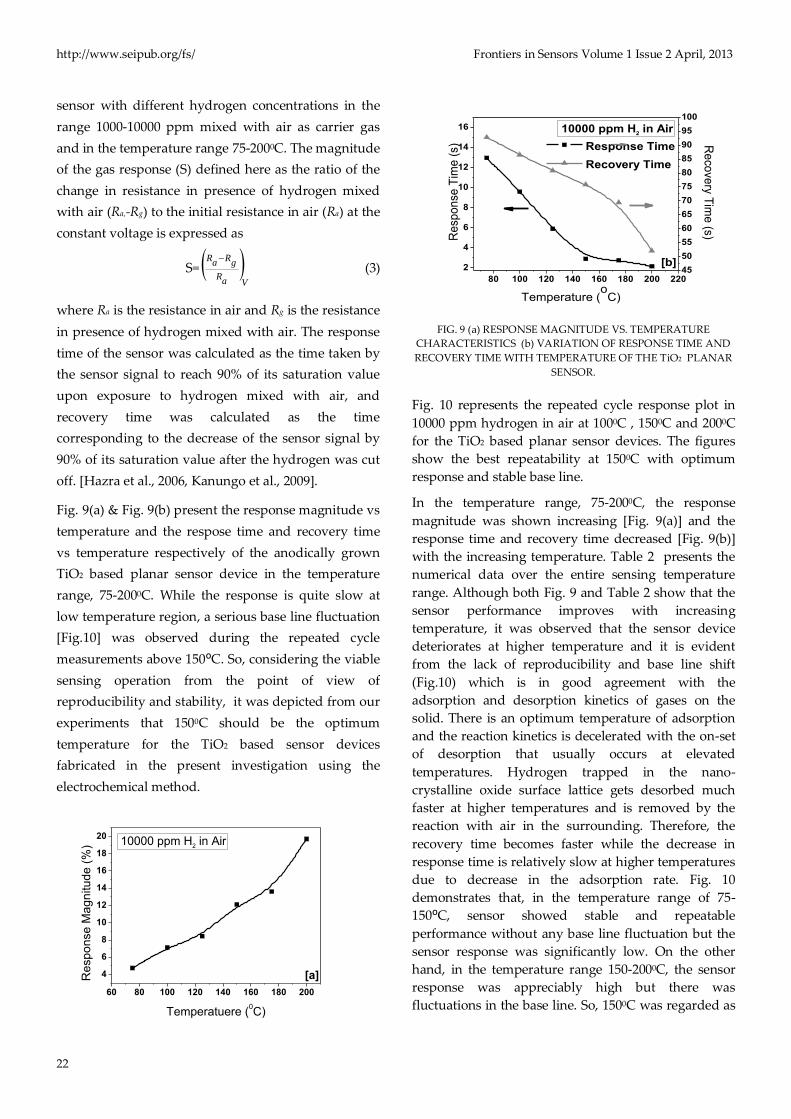
sensor with different hydrogen concentrations in the
range 1000-10000 ppm mixed with air as carrier gas
and in the temperature range 75-2000C. The magnitude
of the gas response (S) defined here as the ratio of the
change in resistance in presence of hydrogen mixed
with air (Ra,-Rg) to the initial resistance in air (Ra) at the
constant voltage is expressed as
S= Va
R
gR
aR
(3)
where Ra is the resistance in air and Rg is the resistance
in presence of hydrogen mixed with air. The response
time of the sensor was calculated as the time taken by
the sensor signal to reach 90% of its saturation value
upon exposure to hydrogen mixed with air, and
recovery time was calculated as the time
corresponding to the decrease of the sensor signal by
90% of its saturation value after the hydrogen was cut
off. [Hazra et al., 2006, Kanungo et al., 2009].
Fig. 9(a) & Fig. 9(b) present the response magnitude vs
temperature and the respose time and recovery time
vs temperature respectively of the anodically grown
TiO2 based planar sensor device in the temperature
range, 75-2000C. While the response is quite slow at
low temperature region, a serious base line fluctuation
[Fig.10] was observed during the repeated cycle
measurements above 150ᴼC. So, considering the viable
sensing operation from the point of view of
reproducibility and stability, it was depicted from our
experiments that 1500C should be the optimum
temperature for the TiO2 based sensor devices
fabricated in the present investigation using the
electrochemical method.
60 80 100 120 140 160 180 200
4
6
8
10
12
14
16
18
20
Re
sp
on
se
Ma
gn
itu
de
(%
)
Temperatuere (0C)
10000 ppm H2 in Air
[a]
80 100 120 140 160 180 200 220
2
4
6
8
10
12
14
16
Response Time
Recovery Time
Temperature (o
C)
Re
spo
nse
Tim
e (
s)
45
50
55
60
65
70
75
80
85
90
95
100
10000 ppm H2 in Air
Re
cove
ry Tim
e (s)
[b]
FIG. 9 (a) RESPONSE MAGNITUDE VS. TEMPERATURE
CHARACTERISTICS (b) VARIATION OF RESPONSE TIME AND
RECOVERY TIME WITH TEMPERATURE OF THE TiO2 PLANAR
SENSOR.
Fig. 10 represents the repeated cycle response plot in
10000 ppm hydrogen in air at 1000C , 1500C and 2000C
for the TiO2 based planar sensor devices. The figures
show the best repeatability at 1500C with optimum
response and stable base line.
In the temperature range, 75-2000C, the response
magnitude was shown increasing [Fig. 9(a)] and the
response time and recovery time decreased [Fig. 9(b)]
with the increasing temperature. Table 2 presents the
numerical data over the entire sensing temperature
range. Although both Fig. 9 and Table 2 show that the
sensor performance improves with increasing
temperature, it was observed that the sensor device
deteriorates at higher temperature and it is evident
from the lack of reproducibility and base line shift
(Fig.10) which is in good agreement with the
adsorption and desorption kinetics of gases on the
solid. There is an optimum temperature of adsorption
and the reaction kinetics is decelerated with the on-set
of desorption that usually occurs at elevated
temperatures. Hydrogen trapped in the nano-
crystalline oxide surface lattice gets desorbed much
faster at higher temperatures and is removed by the
reaction with air in the surrounding. Therefore, the
recovery time becomes faster while the decrease in
response time is relatively slow at higher temperatures
due to decrease in the adsorption rate. Fig. 10
demonstrates that, in the temperature range of 75-
150ᴼC, sensor showed stable and repeatable
performance without any base line fluctuation but the
sensor response was significantly low. On the other
hand, in the temperature range 150-2000C, the sensor
response was appreciably high but there was
fluctuations in the base line. So, 1500C was regarded as

Frontiers in Sensors Volume 1 Issue 2 April, 2013 http://www.seipub.org/fs/
23
the optimum temperature with the response
magnitude of 12.1%, response time of 2.9 s and
recovery time of 75.9 s.
100 200 300 400 500 600 700-4
0
4
8
12
16
20
24
28
Re
spo
nse
Ma
gn
itud
e (
%) 10000 ppm H
2 in Air,
Temperature 1000C
Time(s)
Gas OFF
Gas ON [a]
200 300 400 500 600 700 800-4
0
4
8
12
16
20
24
28
Re
sp
on
se
Ma
gn
itu
de
(%
) 10000 ppm H2 in Air,
Temperature 1500C
Time (s)
Gas OFF
Gas ON [b]
300 400 500 600 700-4
0
4
8
12
16
20
24
28
32
36
Re
spo
nse
Ma
gn
itud
e (
%) 10000 ppm H
2 in
Air, Temp: 2000C
Time(s)
Gas ON
Gas
OFF
[c]
FIG. 10 REPEATED CYCLE RESPONSE FOR THE SENSOR
SAMPLE AT (a) 100℃, (b) 150℃ AND (c) 200℃
TABLE 2 RESPONSE, RESPONSE TIME AND RECOVERY TIME
OF THE ELECTROCHEMICALLY GROWN TiO2 SENSORS IN THE
TEMPERATURE RANGE OF 75-2000C IN PRESENCE OF 10000
PPM H2 BALANCED WITH AIR.
Temperature
(0C)
Response
Magnitude (%)
Response
Time (s)
Recovery
Time (s)
75 4.75 12.9 92.8
100 7.14 9.6 86.5
125 8.45 5.9 80.8
150 12.12 2.9 75.9
175 13.61 2.8 69.4
200 19.71 2.2 52.0
600 800 1000 1200 1400 1600
0
4
8
12
16
20
24
28
10
00
pp
m H
2
20
00
pp
m H
2
40
00
pp
m H
2
60
00
pp
m H
2
80
00
pp
m H
2
10
00
0 p
pm
H2
Transient Response, H2 in Air,
Temperature 1000C
Re
spo
nse
Ma
gn
itud
e (
%)
Time (s)
Gas
OFF
Gas ON
[a]
600 800 1000 1200 1400 1600 1800
0
3
6
9
12
15
18
21
24
27
10
00
pp
m H
2
20
00
pp
m H
2
40
00
pp
m H
2
60
00
pp
m H
2
80
00
pp
m H
2
10
00
0 p
pm
H2
Transient Response, H2 in Air,
Temperature 1500C
Re
spo
nse
Ma
gn
itud
e (
%)
Time (s)
Gas On
Gas
OFF
[b]
600 800 1000 1200 1400 1600 1800
0
5
10
15
20
25
30
10
00
pp
m H
2
20
00
pp
m H
2
40
00
pp
m H
2
60
00
pp
m H
2
80
00
pp
m H
2
10
00
0 p
pm
H2
Re
spo
nse
Ma
gn
itud
e (
%)
Transient Response, H2 in Air,
Temperature 2000C
Time (s)
Gas ON
Gas OFF
[c]
FIG. 11 RESPONSE TRANSIENT WITH DIFFERENT
CONCENTRATIONS OF H2 (1000-10000 PPM) IN AIR AS
CARRIER GAS AT (a) 100ᴼC (b) 150
ᴼC (c) 175
ᴼC.
Fig. 11 presents the sensor response of
electrochemically grown TiO2 sensor upon
interaction with H2 as a function of time at three
different temperatures e.g. 100, 150 and 2000C.
Systematic decrease of sensor response with
decreasing hydrogen concentration is clearly apparent
from the transient response curves. At 100 and 1500C,
there is no base line fluctuation observed in the
transient response curve [Fig.11(a-b)] where as a
serious base line fluctuation is clearly observed in
[Fig.11(c)] at 2000C. This further supports our
arguments in favor of choosing 1500C for studying the
hydrogen sensing properties of Pd-Ag/TiO2 resistive

http://www.seipub.org/fs/ Frontiers in Sensors Volume 1 Issue 2 April, 2013
24
sensor devices.
Sensing Mechanism
According to the space charge layer model, oxygen is
adsorbed from the ambient to the oxide surface at
certain temperature [Akbar et al., 1997]. The adsorbed
oxygen extracts electrons from the film surface and
forms the depletion region near the grain boundary.
For sensing hydrogen when TiO2 thin film is exposed
to the hydrogen gas, electrons are injected back to the
surface. So, the number of electrons increases at the
conduction band thereby increasing the conductivity
of the oxide. The change of the resistance of TiO2 thin
film is measured in presence of hydrogen gas [Lu et al.,
2009, Zakrzewska et al., 2004]. This is, of course, the
most popular and basic gas sensing mechanism to
detect reducing gases by metal-oxide gas sensors.
Electrochemically grown porous TiO2 thin film surface
with a large area due to vertically aligned nano pores
of ~16 nm diameter adsorbed a large volume of
oxygen species [Lee et al., 2011] that interacted with
H2 molecules which diffused efficiently through the
vertically aligned TiO2 nano-pores. Therefore, the
anodically grown TiO2 based hydrogen sensor
detected 10000 ppm H2 quite efficiently at relatively
low temperature of 150ᴼC with a response time of ~2.9
s and a recovery time of ~75 s. However, the
percentage gas response shows quite a low value
(~12%), but it is simple to amplify the sensor response
by standard electronic devices for the practical
applications. It should be mentioned here that
hydrogen makes an explosive mixture with air/oxygen
between 4% and 76%. Therefore, hydrogen sensor
with detectibility of 1% can be considered useful for
commercial purposes.
Palladium (Pd) is widely known catalytic metal used
as electrode in the hydrogen detector because of its
well known hydrogen adsorbing quality. But when it
adsorbes large quantity of hydrogen, palladium can
chemically interact with hydrogen to form two non-
stoichiometric hydride phases, namely, α (∼PdH<0.03)
and β (∼PdH<0.83) [Hüberta et al., 2011].
For the sensing purpose, continuous hydrogen
adsorption and desorption on the Pd surface may
induce a weakening effect of the metal structure and
can cause cracking and/or blistering of the metal films
[Amandusson et al., 2001]. Since alloying Pd with Ag
(12% to 33%) can prevent the hydride formation, Pd-
Ag alloy (Pd: 85% and Ag: 15%) was used as the
electrode material in the present study. Apart from
decreased hydrogen diffusivity, Pd-Ag alloy has
higher mechanical strength than pure Pd which
becomes fragile after certain number of cycles due to
transformation to β hydride phase [Hüberta et al.,
2011, Amandusson et al., 2001]. Pd-Ag lattice is less
influenced by hydrogen and thus it is less brittle than
the pure Pd lattice because the lattice has already been
expanded by the silver atoms [Bohmholdt et al., 1967].
Iwanaga et al reported that the pure Pd electrode
becomes partially oxidized during prolonged air
treatment [Iwanaga et al., 2003]. In the present work,
the sensor study was performed in air used as the
carrier gas. So, there was a strong possibility of PdO
formation at the optimum sensing temperature of
150ᴼC. When the sensor device was exposed to H2,
PdO was reduced to Pd and the work function of the
metal increased [Shimizu et al., 2007]. Therefore, the
barrier height of the metal-semiconductor junction
also increased leading to increased junction resistance.
Simultaneously, H2 gas molecules might be
dissociated to hydrogen atoms on the Pd surface and
got dissolved into the Pd bulk. Work function of Pd
decreased due to dissolution of H atom in the Pd bulk
[Iwanaga et al., 2003]. As a result, the barrier height at
the metal-semiconductor interface decreased and the
junction resistance also decreased. Thus, the two
competitive reactions e.g. PdO to Pd formation and H2
dissociation to H atoms followed by dissolution in Pd
might be the possible reasons of the complications in
the sensing mechanism.
Conclusions
The present study of sensing hydrogen in air using
Titanium dioxide thin film grown by electrochemical
anodization and photoetching in the Coca-Cola
electrolyte is quite interesting from the point of novel
approach of using a commercial soft drink as
electrolyte to make an oxide thin film that may develop
an efficient gas sensor. The advantage of using this
weak electrolyte is to better control the thin film
growth due to slower oxidation rate compared to the
stronger inorganic acid electrolytes normally used to
produce nano crystalline oxide thin films by
anodization method. The photoetching can also be
better regulated by reducing the effect of UV light
passing through the coloured electrolyte. In fact, this
study can suggest to use some dye material in the

Frontiers in Sensors Volume 1 Issue 2 April, 2013 http://www.seipub.org/fs/
25
electrolyte during electrochemical oxidation and photo
etching to produce nano porosity that are mostly
confined near the surface.
ACKNOWLEDGMENT
A. Hazra gratefully acknowledges the Department of
Science & Technology (DST), Govt. of India for the
Inspire Fellowship for pursuing Ph.D degree.
S.K.Hazra thankfully acknowledges IC Design &
Fabrication Centre, Department of Electronics and
Telecommunication Engineering, Jadavpur University
for the collaborative research programme.
REFERENCES
Alessandri, I., E. Comini, E. Bontempi, G. Faglia, L. E.
Depero, G. Sberveglieri, “Cr-inserted TiO2 thin films for
chemical gas sensors”, Sens. Actuators B 128 (2007) 312–
319.
Amandusson, H., L.-G. Ekedahl, H. Dannetun, “Hydrogen
permeation through surface modified Pd and PdAg
membranes”, J. Membrane Science 193 (2001) 35–47
Akbar S. A., L. B. Younkmam, “Sensing Mechanism of a
carbon manoxide sensor based on anatase titania” J.
Electrochem. Soc., 144 (1997) 1750 -53
Bengi, A., U. Aydemir, S. Altındal, Y. Özen, S. Özcelik, “A
comparative study on the electrical characteristics of
Au/n-Si structures with anatase and rutile phase TiO2
interfacial insulator layer”, J. Alloys and Compounds 505
(2010) 628–633.
Bohmholdt, G., E. Wicke, “Zur diffusion von wasserstoff
und deuterium in palladium und Pd-Legierungen”, Z.
Phys. Chem. Neue Folge 56 (1967) 133
Choi, J., R. B. Wehrspohn, Jaeyoung Lee, Ulrich Gösele,
“Anodization of nanoimprinted titanium: a comparison
with formation of porous alumina”, Electrochimica Acta
49 (2004) 2645–2652.
Hazra, S.K., S. Basu, High sensitivity and fast response
hydrogen sensors based on electrochemically etched
porous titania thin films, Sens. Actuators B 115 (2006) 403-
411.
He, B. Bob, “Two-Dimensional X-Ray Diffraction , John
Wiley & Sons, Inc., Hoboken, New Jersey 2009
Hüberta, T., L. Boon-Brett, G. Black, U. Banach, “Hydrogen
sensors – A review”, Sensors and Actuators B 157 (2011)
329– 352
Ishikawa, Y., Y. Matsumoto, “Electrodeposition of TiO2
photocatalyst into porous alumite prepared in phosphoric
acid”, Solid State Ionics 151 (2002) 213–218
Iwanaga, T., T. Hyodo, Y. Shimizu, M. Egashira, “H2 sensing
properties and mechanism of anodically oxidized TiO2
film contacted with Pd electrode”, Sens. Actuators B 93
(2003) 519–525
Jackson, M.K., W. Ahmed, “Surface Engineered Surgical
tools and Medical Device”, Springer Science, 2007.
Kanungo, J., H. Saha, S. Basu, “Room temperature metal–
insulator–semiconductor (MIS) hydrogen sensors based
on chemically surface modified porous silicon”, Sens.
Actuators B 140 (2009) 65–72
Lee, J., D. H. Kim, S-H. Hongb, J.Y. Jho, “A hydrogen gas
sensor employing vertically aligned TiO2 nanotube
arrays prepared by template-assisted method”, Sensors
and Actuators B 160 (2011) 1494– 1498
Lee, H., S. A. Akbar, “Sensing behavior of TiO2 thin-film
prepared by rf reactive sputtering,” Sensors Letter, 6 (2008)
1049-1053.
Lu, C., Z. Chen, “High-temperature resistive hydrogen
sensor based on thin nanoporous rutile TiO2 film on
anodic aluminum oxide”, Sens. Actuators B 140 (2009)
109–115
Pakma, O., N. Serin, T. Serin, Ş. Altındal, “The double
Gaussian distribution of barrier heights in Al/ TiO2/p-Si
(metal-insulator-semiconductor) structures at low
temperatures”, J. App. Phys. 104, (2008) 014501.
Park, J-W., Y-J. Kim, J-H. Jang, T-G. Kwon, Y-C. Bae, J-Y. Suh,
“Effects of phosphoric acid treatment of titanium surfaces
on surface properties, osteoblast response and removal of
torque forces”, Acta Biomaterialia 6 (2010) 1661–1670
Paulose, M., K. Shankar, S. Yoriya, H. E. Prakasam, O. K.
Varghese, G. K. Mor, T. A. Latempa, A. Fitzgerald and C.
A. Grimes, “Anodic Growth of Highly Ordered TiO2
Nanotube Arrays to 134 µm in Length”, J. Phys. Chem. B,
Vol. 110, No. 33 (2006) 16179-16184.
Shimizu, Y., N. Kuwano, T. Hyodo, M. Egashira, High H2
sensing performance of anodically oxidized TiO2 film
contacted with Pd, Sens. Actuators B 83 (2002) 195-201.
Shimizu, Y., T. Hyodo and M. Egashira, H2 sensing
performance of anodically oxidized TiO2 thin films

http://www.seipub.org/fs/ Frontiers in Sensors Volume 1 Issue 2 April, 2013
26
equipped with Pd electrode, Sens. Actuators B 121 (2007)
219–230.
Sugiura T., T. Yoshida and H. Minoura, ““Designing a TiO2
Nano‐Honeycomb Structure Using Photoelectrochemical
Etching” Electrochem. Solid-State Lett. 1 (1998) 175-177.
Zakrzewska, K., “Gas sensing mechanism of TiO2-based thin
films”, Vacuum 74 (2004) 335–338
Zhu, X., J. Chen, L. Scheideler, R. Reichl, J. Geis-Gerstorfer,
“Effects of topography and composition of titanium
surface oxides on osteoblast responses”, Biomaterials 25
(2004) 4087–4103.
A. Hazra received his M.Tech degree in VLSI Design from
Bengal Engineering and Science University, Shibpur,
Howrah-711103, India in 2011. He is presently pursuing PhD
degree from the same university. His present research
interest is TiO2 based chemical sensors and other
semiconductor devices like resistive RAM.
S. K. Hazra obtained his PhD in Materials Science from IIT,
Kharagpur, India, in 2006. After completing his post-
doctoral research, he joined as a faculty member in the
Department of Physics and Materials Science, Jaypee
University of Information Technology, Waknaghat,
Himachal Pradesh, India, in 2010. His present research
interests include electronic materials and solid-state
chemical sensors.
D. Dutta obtained his M.Sc degee from West Bengal State
University, Barasat- 700126, India in 2011. He is now a Junior
Research Fellow of the CSIR project “Development of
Graphene Based Hydrogen Sensor” of IC Design &
Fabrication Centre, Department of Electronics and
Telecommunication Engineering, Jadavpur University,
Kolkata, India. His present research interest is Graphene
based chemical sensors.
C. K. Sarkar received the PhD degree from Calcutta
University, Kolkata, India in 1979 and the D. Phil degree
from the University of Oxford in 1985. He is a Professor in
the Department of Electronics and Telecommunication
Engineering and co-ordinator, IC Design & Fabrication
Centre, Jadavpur University, Kolkata, India. Prof. Sarkar
serves as a Distinguished Lecturer of the IEEE EDS. His
present research interests are thin film and related devices,
CMOS technology and nanoelectronics.
S. Basu obtained his PhD in solid-state chemistry from IIT,
Kharagpur, India, in 1973 and he worked as post doctoral
Research Associate in Max Plank Institute for Radiation
Chemistry, Germany (1975-78).He was a faculty member
(1979-2005) in Materials Science Centre, IIT Kharagpur,
India. At present he is the Research Advisor, Department of
Electronics and Telecommunication Engineering, Jadavpur
University, Kolkata, India. Prof. Basu has more than 200
publications. His present research interests include
nanomaterials, Graphene and solid-state chemical sensors.