STUDIES OF BRITTLE FRACTURE· PROPAGATION IN SIX FOOT … · Complete Fracture Test --A test in...
86
· n ...rb0 ..J- .- -', CIVIL ENGINEERING STUDIES STRUCTUrtAL RESEARCH SERIES NO. 136 STUDIES OF BRITTLE FRACTURE· PROPAGATION IN SIX FOOT WIDE: STRUCTURAL STEEL:, PLATES '.--- .- By R. LAZAR W. J. HAll A TECHNICAL REPORT for the SHIP STRUCTURE COMMITIEE under the BUREAU OF SHIPS, U. S. NAVY Contract NObs 65790 Index No. NS-731-034 Subproject SR-13 7 UNIVERSITY OF ILLINOiS URBANA, ILLINOIS
Transcript of STUDIES OF BRITTLE FRACTURE· PROPAGATION IN SIX FOOT … · Complete Fracture Test --A test in...

· n ~ ...rb0 ~ ~ r.~lf::, ..J- ~\JJ:a~
.- -', '-~ ~~~ CIVIL ENGINEERING STUDIES STRUCTUrtAL RESEARCH SERIES NO. 136
STUDIES OF BRITTLE FRACTURE· PROPAGATION
IN SIX FOOT WIDE: STRUCTURAL STEEL:, PLATES '.--- .-
By R. LAZAR
W. J. HAll
A TECHNICAL REPORT
for the
SHIP STRUCTURE COMMITIEE
under the
BUREAU OF SHIPS, U. S. NAVY
Contract NObs 65790 Index No. NS-731-034
Subproject SR-13 7
UNIVERSITY OF ILLINOiS
URBANA, ILLINOIS


STUDIES OF BRITTLE FRACTURE PROPAGATION
IN SIX Foor WIDE STRUCTURAL
STEEL PLATES
by
R. Lazar
and
W. J. Hall
A Technical Report
for th~
SHIP STRUCTURE COMMITTEE
under the
BUREAU OF SHIPS~ U. S. NAVY
Contract NObs 65790, Index No. NS-73l-034 Subproject SR-l37
Department of Civil Engineering University of Illinois
June 1957
I I f f ~
( le c .. c C ...


ii
TABLE OF CONTENTS
Page
I. INI'RODUCTION. . . . . · · · . · · · · · 1
l. General. . . . . . . . · · · . 1
2. Object and Scope . · · · · 1
3· Brief Review of Previous Work. 3
4. Acknowledgment . · · · · · 4
5· Nomenclature . .. · · · 5
II. DESCRIPrION OF ~IMENS AND APPARATUS. · · · · 6
6. Specimens and Material Properties. · · · · · · · · · · 6
7· Fracture Initiation. · · · · · 7
8. Cooling Apparatus. · · · · · · · · 10
9· Instrumentation. . · · · · · 10
(a) Sensing Devices. • 10 · · (b) Recording Devices. · · · · · · · · · · .. · 12
(c) Input Circuits · · · · · · · · · · · 14
(d) Measurement Procedure and Calibration. 15
(e) Data Reduction · · · · · · · · · · · .. · 16
10. Test Procedure . . · · · · 16
III. RESULTS AND INTERPRE1:ATION OF TESTS · 18
11. Test Records . · · · · · · . · · · · · 18
12. Striking Tests · · · 20
13· Complete Fracture Tests. 22
(a) Fracture Speed · · · . · 22


rI.
(b)
(c)
(d)
(e)
(:f)
TABLE OF CONTENTS (Conrt.)
Dlf,namic strain Measurements.
Crack Path and Texture .•
Semi-Killed Steel Tests ..
Secondary Cracks . . . . .
Steel Temperature During Test. .
l4. Fracture of the Pull Plate . • . • . .
SUMMARY • • •
BIBLIOGRAPHY. •
TAB~ •••••
FIGURES
iii
Page
24
29
30
31
31
32
34
36
37


Table
1
2
Figure
1
2
3
4
5
6
7
8
9
LISr OF TABLES
Title
Outline of Tests ...•.
Tensile and Charpy Data for Pull Plate steel. .
LIST OF FIGURES
Title
Typical Test setup and Properties of Rimmed steel
Fracture Paths and Properties of Semi-Killed Steel
Thermocouple Locations and Typical Temperature Traces
at Time of Test
Input Circuits and Recording Instrumentation
Instrumentation and Record - Test 13
Instrumentation and Record - Test 14
Instrumentation and Record - Test 15
Instrumentation and Record - Test 17
Instrumentation and Record - Test 18
10 Instrumentation and.Record Test 19
11 Instrumentation and Record - Test 21
12 Instrumentation and Record - Test 22
13 Instrumentation and Record Test 23
14 Instrumentation and Record - Test 24
15 Instrumentation and Record - Test 25
iv
Page
37
41


Figure
16
LIST OF FlGURFS (Con 't. )
Title
Instrumentation and Record - Test 30
17 Instrumentation and Record Test 31
18 Instrumentation and Record - Test 32
19 strain Distribution at Various Times Test 23
20
2l
strain Distribution at Various Times - Test 25
strain Distribution at Various Times - Test 31
22 strain Distribution at Various Times - Test 32
23 Fracture Speed in Six Foot Wide steel Plates
24 Distribution of strain Across Plate for Various Loads During
Prestraining - Test 32
25 Typical' Photographic Records for Impact Tests
26 Photographic Records for Test 23
27 Typical Crack Paths
28 Crack Paths From Tests With No Records
29 Typical Crack Texture at Initiation Edge
30 Reinitiation of Fracture From Partly Submerged Crack - Test 18
31 Branching of Crack Near Center of Specimen - Test 20
32 Various Secondary Cracks
33 Pull Plate Fracture
v
1


.,
..J...
I. INTRODUCTION
General
The widespread acceptance of steel as a building material may be
attributed to many factors, foremost of which are its mechanical properties.
One of the most important properties of steel is its ductility 'Which permits
local plastic deformation while retaining the useful load carrying capacity
of the member. Normally, failure at ultimate load is characterized by a
ductile fracture involving a relatively large amount of deformation and
energy absorptiono However, under certain conditions of stress, tempera-
ture and geometry, the normal ductility of steel may not be developed aDd
the steel may suddenly, and. without any previous warning, fracture in a
britt.le manner.
Brittle fractures have a long history of incidence and are not
restricted to one type of' structure. storage tanks, pipe lines, bridges,
and. ships (at sea and at dockside) are typical examples of riveted and welded
structures which have failed in a brittle mamler. During the past fifteen
years J extensive research has revealed many of the factors that may contri-
bute to the initiation, propagation and J occasionally, arrest of brittle
fractures. However, a more thorough understanding of the brittle fracture
mec~~ism is required before satisfactory design procedures and construction
methods ror minimizing the possibility of brittle fracture can be developed.
20 Object and Scope
The object of this investigation is to study the propagation of
brittle fractures in wide structural steel plates. To date the primary effort
on the test program bas been to obtain measurements of crack speed and strain

2
response in the vicinity of the crack during the propagation of the frac
ture. Strain records, computed speeds~ and other results of the six foot
wide plate tests which were completed from November 29, 1955 through Novem
ber 15, 1956 as a part of this program, are presented and discussed in this
report 0
In the case of the tests described in this report, r~ed steel
was used for the seventeen instrumented tests, and semi-killed steel was
used for the four specimens of the pilot tests which were not instrumented.
All specimens were 3/4 in. thick and tested in the as-rolled condition
except for one specimen which was tested after being prestrained to approxi
mately tw'o per cent permanent elongation. Each specimen contained two
symmetrical notches, one on each edge; one notch was used to initiate the
fracture and the other notch was used to avoid eccentric loading of the
specimen. All of the specimens were tested at average stresses of 17.0 to
2005 ksi on the net section.
In fifteen-tests, twelve with instrumentation, a brittle fracture
was propagated completely across the plate at temperatures ranging from +5
to -ll degrees Fo Five tests (with instrumentation) were performed to eval
uate the effect of the fracture initiation method on the measured plate
response 0 This latter group of tests was performed at room temperature,
other conditions being similar to those existing for a complete fracture
test. The one additional test was an unsuccessful attempt to initiate a
brittle fracture in a plate of semi-killed steel.
The brittle f'ract'l;JXe of' a pull plate (A-285 Grade C Flange steel)
with no intentional stress concentration is also reported. This fracture

3
occurred at an average net stress of 32.0 ksi and at room temperature. The
crack initiated from the toe of a fillet weld on the plate edge and propagated
across the entire plate.
3. Brief Review of Previous Work
The first wide plate tests at the University of Illinois were con-
ducted under the direction of Professor W. M. Wilson in 1944-46 and involved
* static tests of internally notched steel plates of various widths (1). A
number of these tests resulted in brittle fractures at stresses slightly
above the yield strength.
In 1953, after the failure of two large oil storage tanks in England,
the Standard Oil Development Company undertook an extensive brittle fracture
test program (2,3) of various compositions of steel plate in widths ranging
from 10 in. to 72 in. In these tests the fractures, initiated by means of
an external impact in much the same manner as the tests described in this
report, propagated across the plates at stresses as low as 10,000 psi and at
temperatures in the range of -40 to 0 deg ~ Fe
With regard to the current program, another report (4) describes
the development work and the tests of two foot wide plate specimens which
preceded the work desc'ribed herein. A recent paper (5) presents a summary
of the foregoing work and includes a brief description of same of the six
foot wide plate tests reported herein.
other experimental and analytical work in the field of brittle
fracture mecbanics is reported in publications by G. R. Irwin (6), E. Orowan
* Numbers in parentheses refer to references listed in the Bibliography.

4
(7), A. A. Wells (8), and T. S. Robertson (9). MOst o~.the important work
in this field may be traced through the extensive bibliographies contained
in each of the cited references.
4. Acknowledgment
The tests described in this report were conducted as a part of a
program enti~led "Brittle Fracture Mechanics"- sponsored by the Ship structure
Committee through the Bureau o~ Ships, U. S. Navy, Contract Nabs 65790, Index
No. NS-731-0,34 (SR-137). The members o~ the Brittle Fracture Mechanics
AdVisory Committee to the Committee on Ship structural Design have acted in
an advisory capacity in the planning of this program.
The tests were per~ormed in the structural Research Laboratory,
Department of Civil Engineering, University of Illinois between November
1955 and November 1956. The project is uDder the general direction o~ N. M.
Ne'WIIl.a.rk, Professor and Head of' the Civil Engineering Department. The authors
wish to thank Dr. Newmark, W. H. MUnse, Research Professor of' Civil Engineer
ing" Ro J. Mosborg, Assistant Professor of Civil Engineering (Supervisor of
Project SR-l,34) and V. J. M:!Donald J Research Assistant Pro~essor of Civil
Engineering (in charge of instrumentation) for their helpful advice during
the course o~ the investigation. The authors greatfully acknowledge the
help of T. J .. Hall, T. M. l\Yna.m, W. H. Walker, J. No Chopy, and particularly
S. T. Rolfe, Research Assistants in Civil Engineering, who assisted in the
laboratory work and with the preparation of the figures.
This report has been drawn ~rom a M.S. dissertation of the same
title by R. Lazar which was submitted to the Graduate College of the Univer
sity o~ lllinois in 1957 (10).

5 · Nomenclature
The following terms are commonly used throughout the text.
Dynamic strain Gage -- SR-4 strain gage whose signal is monitored on
an. oscilloscope during the fracture test.
Static Strain Gage -- SR-4 strain gage read at selected static loads
by means o:f a portable strain indicator.
5
Crack Detector -- A single wire (6-in. gage length) SR-4 Type A-9 strain
gage which is mounted perpendicular to the expected crack path and
which is broken by the fracture. A rough measure of the crack
speed may be obtained :from a knowledge o:f the distance between
detectors and the t~e interval corresponding to breaking o:f adja
cent detectors.
Notch Line -- An imaginary horizontal line connecting the notches on
opposite edges of the specimen.
Submerged Crack -- A relatively short, arrested crack which does not
cleave through the plate surfaceo It is usually wedge driven and
characterized by a clearly defined depression on the plate sur
face.
Complete Fracture Test -- A test in which the fracture propagates across
the entire plate 0
Str~ Test -- A test in which the specimen is subjected to the notch
"'eci.t;e-i.mpact method of initiation at the usual test stress, but at
a temperature generally high enough to prevent complete fracture.

6
ll. DF..OCRIPrION OF ~IMENS AND APPARATUS
6. Specimens and Material Properties
All instrumented specimens were cut from 3/4 in. thick Lukens
rimmed steel plates, heat No. 16445, in the as-rolled condition and with
a nomina] width of 72 in.. The depth of ' the specimen insert was either 32
ino or 54 in. as explained in the next paragraph. The insert was welded
with double-V butt welds made with E7016 electrodes to pull plates in a
3,OOO.1000-lb. hydraulic testing machine. The welding was performed in
such a manner as to keep warping and residual stresses to a minimum. The
pull plates were approximately 6 3/4 f't. long, 6 ft. wide and 1 in. thick.
This made the dimensions of the test member 16 x 6 ft. or 18 x 6 ft. in
plan dimension, depending an the size of the insert, with the thickness
changing .from 3/4 in. to 1 in. at the pull plate insert junction. The net
width at the notch line was 2 in. or 2 1/4 in. less than the gross width
noted in Table 1 because of the notches on each edge.
Each insert originally was 54 in. deep with the notches placed 16
in. below the top of the insert for a complete fracture test and 27 in.
below the top for some of the striking testso If a striking test was to be
performed on the insert, it would always be performed before a complete
fracture test. Since the notch lines for these tests were generally 11 in.
apart (vertically), the insert was not materially affected by the striking
test with regard to subsequent complete fracture tests. In two cases a
striking test was performed on the same notch line as the subsequent com
plete fracture test, but from the opposite notch.. After the first complete
fracture test, the cracked portion would be cut out six ino below the test

7
notch line and. the remaining insert would then be 32 in. deep. The notch
line for the second complete fracture test would be at the center of the
remaining portion of the insert, or 16 in. from either the tap or bottom
weld. One insert (Test 32) was prestrained to approx:ilnately two per cent
permanent deformation before testing. The check analysis and mechanical
properties of the rimmed steel are presented in Fig. 1, together with a
line diagram of a specimen and a photograph of a typical test setup.
Four pilot tests were performed on a 3/4 in. thick USS semi-killed
steel plate, heat Noo 64 M 487, with a nomina..l width of six £'t. The check
analysis and mechanical properties of' this steel are shown in Fig. 2,
together with photographs of the crack paths resulting from the tests. ,
70 Fracture Initiation
One of the first problems encountered in any brittle fracture
propagation test program is that of finding a consistent method of fracture
initiation. Idea1.1y, the conditions .for the tests should be similar to
actual service conditions; this suggests limiting the stress to normal work
ing stresses and the temperature to ordinary service temperatures. However,
at present the static initiation of brittle .fractures under such conditions
cannot consistently be controlled in the laboratory. As a matter of inter
est, of' the forty-odd tests performed in the laboratory as a part of this
program only one failure involving static initiation occurred (this is dis
cussed in Section 14).
After some preliminary work (4,5) the so-called "notch-wedge
impact" method of initiation was perfected and used for all the tests. The

8
notch-wedge-impact method of fracture initiation involves the driving of a
wedge into a prepared notch in the edge of the plate. The driving of the
wedge causes a very high rate of strain at the tip of the notch and for
certain steels under selected conditions of stress and temperature, pro
vides a consistent method of initiating brittle fractures. Only once did
this method fail to initiate a brittle fracture with the stresses and tem
peratures employed in the tests. As explained in Section 12, this method.
of initiation apparently does not affect the propagation behavior of the
fracture significantly.
The notch used in Tests 12 through 25 bad a total length of 1 in.
The first 7/8 in. of the notch was four hacksaw blades in width (approxi
mately 0.141 in.), the next 1/16 in. was one hacksaw blade in width (approx
imately 0.034 in.) and the last 1/16 in. was a jewelers' saw-cut in width
(approximately 0.012 in.). For Test 26 and all subsequent specimens, a
notch baving a total length of 1 1/8 in. was used. The first cut was made
1 in. long, with all other dimensions remaining as noted above. The wedge
used was a standard. 1 in. octagonal cold chisel (included angle of tip was
approximately 160) cut to a length of' 4 3/4 in. and weighing 1.0 lb.
The impact was provided by a gas-operated piston device. The
activating pressure and the stroke of the piston can be varied to produce
any desired impaCt up to 3,000 :ft. lbo The pressure is supplied by bottled
nitrogen gas. A stroke of five in. and a pressure of 280 psi were used in
all the tests. This resulted in a theoretical energy output of approximately
1200 ft. lb. To absorb the reaction of the device during acceleration of

9
the piston, the device is tied to a weight (approximately 120 lb.) which
bears against the far side of the specimen at the notch line.
Several methods have been used to calibrate the piston device in
order to determine the amount of energy delivered to the wedge. The first
attempt involved the measurement of the velocity of the piston which was not
very successful. The most recent method is based on the deformation of brass
cylinders which are 1 1/2 in. long and 1 1/2 in. in diameter; this method is
not exact but gives satisfactory results.
The latter deformation method involves two steps: (1) tests in a
drop-weight machine to obtain the relationship of energy input versus defor
mation of the brass cylinders; and (2) tests of simj] ar brass cylinders with
the gas-driven piston device at various theoretical energy outputs, espe
cially the five inch stroke and 280 psi pressure used in all the tests.
These calibration tests showed that the piston device was occasionally deliv
ering a nruch lower energy output than anticipated, sometimes do'Wn to 40 per
cent efficiency. This fact may possibly account for the failure to initiate
and propagate a brittle fracture in Test 18. A general overhaul and slight
modification of the piston device was made between Tests 25 and 26 as noted
in Table 1. The recalibration results indicated that more consistent opera
tion was then obtained. The efficiency of the modified piston device as
determined by the deformation method was approximately ninety per cent, or
an actual energy output of about 1,080 ft. lb. for a theoretical energy
input of 1,200 ft. lb.

10
8. Coo~ing Apparatus
The cooling of the specimen to the desired temperature is accom-
plished by placing crushed dry ice into specially made 3 in. thick containers
vrhich are hung against the sides of the specimen. Each container is approx-
imately 2 fto by 6 ft. in plan dimension, and three containers are connected
to cover an area of 6 ft. by 6 ft. The tanks are shown in place in Fig .. 1. oJ·
The center tanks are recessed so that neither the ice nor the tanks come in
contact with the specimen near the gage locations. The specimen temperature
obtained by this method of cooling is quite uniform near the notch line,
varying only a few degrees across the entire plate. The thermocouple loca-
tions and typical temperature traces at time of test are presented in Fig. 3.
9 . Instrumentation
(a) Sensing Devices
The strain measurements were made 'with Baldwin SR-4 Type A-7 strain
gages (1/4 in. gage length). These gages were used to obtain both the static
a¢ dynamic gage readings. They were attached to the specimen using a thin
layer of Duco cement, dried as speCified" and then covered with a moisture-
proofing material.. To minimize temperature induced strains, care was taken
to ensure that an equal length of lead wire was used for each gage, and also
that the lengtb of' wire cooled with the specimen was constant for all the
strain gages.
The crack speed was measured through a system of' surface crack
detectors.. These detectors (-SR-4 TypeA-9 single wire strain gages, 6 in.
gage length) were cemented to the specimen using a thin layer of' Duco cement.
As the crack passed and broke the detector, an electrical circuit was

11
interru:pted. From a knowledge of the time corresponding to breaking of the
detectors, and the distance between the detectors, the average surface speed
of the crack may be computed.
The speed of the crack was also computed on the premise that the
strain signals peaked. at the instant the crack passed the strain gages. How
ever, observations indicate that the time of peaking is affected by the dis
tance of the crack path from the gage location. Therefore a slight error
was introduced when gages spaced at varying distances from the crack path
were used to calculate the speed.
It must be emphasized that these methods of s:peed measurements con
stitute an average surface measurement only, and thus may not give the true
speed of the crack front; also, the exact positions of neither the surface
crack nor the interior portion of the crack are known at the instant the
detector breaks or the strain gage peaks. Thus, in computing the crack
speeds it is assumed that all the detectors and strain gages (in this case,
strain gages close to, and a constant distance from, the crack) respond
similarly. These methods of speed determination were considered to be the
best available approximation. However the equipment limitations, the dif
ficulty in defining the actual crack, and the possible detector and strain
gage inconsistencies are recognized. All speeds noted herein are rounded
off to the nearest 50 f'ps.
Two types of triggers were used in these tests. A plate-surface
trigger (SR-4 Type A-9 strain gage denoted by T in the diagrams) was mounted
about one in. beyond the tip of the initiating notch; the breaking of this
gage by the fracture started the recording equipment. The plate-surface
trigger allows the use of a short time base for the test records (approximately

12
three milliseconds) since the crack is already started when the trigger
gage is broken. The external trigger, an electrical circuit activated by
movement of the wedge and denoted by EI' in the, diagrams, requires a longer
time base (approximately six milliseconds) to allow for the time lapse
between the triggering and the actual initiation of the fracture. The
external trigger permits the recording of signals from gages close to the
fracture initiation point; this is not possible with the plate-surface
trigger. In the latter case a short record is obtained while in the former
case a longer, more complete record is obtained. Figure 4 shows the trigger
circuit. In this diagram the triggering devices shown are a SR-4 Type A-9
strain gage, (plate surface trigger), a micro-switch (~) and a strip of
aluminum foil (the external triggers). Any one device can trigger the
circuit but all three types of triggers have been used as a safeguard in
recent tests.
Ten copper-constantan thermocouples are located at' various points
across the specimen to provide a temperature profile during cooling of the
specimen. These thermocouples are installed in No. 54 drill holes about 1/4
in. deep.
(b) Recording Devices
A maximum of nine channels of high-speed cathode-ray oscilloscope
equipment with photographic recording are presently available for strain
and crack speed signals.
eight of these ch:annels.
Four dual-beam cathode-ray oscilloscopes provide
The photograph in Fig. 4 shows nine channels of
oscilloscope equipment, the temperature recorder and calibrating oscillator-

13
All signals are recorded photographically as a ~ction of a
common time base supplied from the single channel oscilloscope. This same
oscilloscope provides all nine beams with the desired unblanking and inten
sifying signals used to minimize fogging of the record before and after
the test period.
The four traces from two dual-beam oscilloscopes are optically
superimposed on a single frame in the interest of maximum photographic
definition. Thirty-five millimeter strip-film. ca.m.eras (used as single
frame cameras) are employed with the dual-beam equipment and a single-frame
thirty-f'ive millimeter camera is used with the single-channel oscilloscope.
This equipment is shown in the block diagram in Fig. 4.
Six of the oscilloscope channels are sufficiently sensitive to
allow at least 1 1/2 in. of trace deflection for 1,000 microinches per inch
of' strain. The other three channels have about one-third this sensitivity.
Whenever possible the latter channels are used to record the highest electri
cal magnitudeso The frequency response of' the single channel oscilloscope
is flat from 0 to 1,000 kc 0 The response of' the dual-beam units is f'lat
f'rom 0 to 100 kc and decreases not more than fifty per cent at 300 kc.
Since the majority of' the records are two or more milliseconds long and the
recorded signals do not approximate step f'uDctions, the latter response is
considered adequate. For example, consider a time base of two milliseconds,
a frequency of' 100 kc per second and a scope f'ace four in. long. Each com
plete cycle or period should then be 0002 ino long 0 Since the recording
spot on the scope f'ace has to be of a definite size and intensity (approx
:i:ma.tely 0001 in. in diameter) to register properly on the film, the resulting

14
record at this high frequency would be a solid band, the height of which
would be the amplitude of the signal. Thus the band width or time defini
tion of the recording equipment surpasses the photographic or optical def
inition of the record. The band width; or frequency response, of the mea
suring gage and its associated wiring has been assumed to be in excess of
any of these values.
The temperature is recorded during the cooling process in order
that the cooling rate and the temperature gradient can be observed before
the test. For this purpose an automatic recorder which provides a sensiti
vity of about 1°F per 001 in. on the record is used. The various thermo
couples are sequentially sampled by a motor driven switch and direCtly
recorded in degrees Fahrenheito
(c) Input Circuits
The, signals fed to the cathode-ray recording equipment consist of
a sweep triggering pulse followed by strain and crack location signals. The
detectors, which fail as the crack crosses the plate, open an electrical
circuit 0 Each detector feeds to the recording channel a different step
voltage whose amplitudes are in the ratio of 1:2:4:8:16. Each step has a
different magnitude and can be identified with the particular detector to
which it is connected, thereby providing a positive identification of
sequence 0
The time base is initiated by the trigger. Opening the trigger
circuit removes the bias signal from a triggering thyratron and allows it
to start conducting. The step voltage, which results at the start of con
duction, is fed into the standard circuits of the single channel oscilloscope

15
unit. Reinitiation cannot occur until the thyratron is reset manually.
This prevents subsequent multiple sweeps which may be triggered by chatter
of the initiating wedge, accidental grounding of the broken trigger wire,
etc., which would obscure the traces of interest on the single recorded
frame"
The strain gages are connected in the customary wheatstone bridge
circuit.. Dul:r.Imy gages which complete the bridge circuit are mounted extern
ally to the specimen 0 These bridges are excited by direct current and their
outputs .fed to the recording channelso Typical input circuits are shown in
Figo 40
(d) Measurement Procedure and Calibration
The strain measuring channels are calibrated by shunting gages with
a resistance whose equivalent strain value is known or measurable. Both the
active arm and the adjacent dummy gage are shunted successively to obtain
compression and tension calibrations" Only one calibrating value is used
because other tests indicated that the linearity of the recording system
was adequate within the limit of' resolution of the record" Crack detector
calibration is obtained by successive~y opening switches in series with the
various detectors and recording the trace steps 0 The time axis is calibrated
by putting a time .signal of' known f'requency on all channels simultaneously
and photographing one sweep. This is done immediately a:fter the test is
completed ..
Although the deflection plates are connected in parallel and are
driven from a common amplifier, individual construction of' the various guns
and de~lection systems results in slight horizontal displacements between

16
the traces and .ill slight differences of de.flection with a simultaneous signal.
The stab"ility of gain magnitude and trace deflection in this system was
found to be satisfactory by a series of ,investigations and by the consistency
of trace lengths and locations in the various tests.
(e) J)3.ta Reduction
A feature of the data reduction that may not be a standard proce
dure is the method of tying the various traces together with respect to time
and the significance of the time axis values. In general, some arbitrary
point is taken along the time base and called zero time. This mayor may
not correspond to the earliest point on the recorded traces. The point is
selected near the early portion of' the sweep at the first peak of the time
calibration sinewave. This provides a convenient and definite reference
point common to all traces. The record is reduced in the customary manner
of reading signal amplitude against time, each trace being read with an
individual calibration on both the time and signal axes. The earliest time
noted for any record is same finite but unknown period of time after the
breaking of the sweep trigger wire, approxima. tely 20 microseconds 0 Thus the
earliest recorded time is a variable.. This time has been tacitly assumed
smalJ.. and occurs some finite time a.:f'ter the initiating wedge enters the
plate.
10. Test Procedure
The notches are cut in the edge of the specimen insert after it
is welded to the pull plate in the testing machine. In the case of the one
prestrained plate, the prestraining was done before the notches were cut
into the plate edges. The strain gages were then attached and the

17
thermocouples installed. The strain gages were checked at room temperature
by cycling (ie. loading and unloading) the specimen to the test load.. This
was done in order to check the gages and the strain distribution in the
specimen. Since many of' the inserts were slightly warped, sizable strain
residuals were sometimes observed f'ollowing one load cycle. To reduce
these residuals the specimen was usually cycled f'our times but never stressed
higher than the test load~
All the wiring adjacent to the cooled specmen was sprayed with a
plastic compound to improve the insulation. Tbegages and wiring also were
covered with a plastic curtain to minimize the amount of condensation coming
in contact with the instrumentation. This curtain also prevented stray
pieces of' dry ice from coming into direct contact with the steel plate.
After the cooling tanks, gas-operated piston device, and reaction
weight were suspended from the upper pull plate, the instrumentation was
connected and checked. The dry ice tanks were f'illed, and as the desired
test temperature was approached, the test load was applied to the specimen
and the recording devices were calibrated. As the specimen reached the tem
perature selected for the test, the gas-operated pis~on device was pressur
ized and fired.
Tbe static strain gage readings were recorded as soon after the
test as possible. In the case of complete fractures an estimate of the resid
ual strains in the plate may be made from these readings. Also at this time
a check of the dynamic strain gages was made to aid later interpretation of'
the test records.

18
llI. RESULTS AND INTERPRETATION OF TESTS
11. Test Records
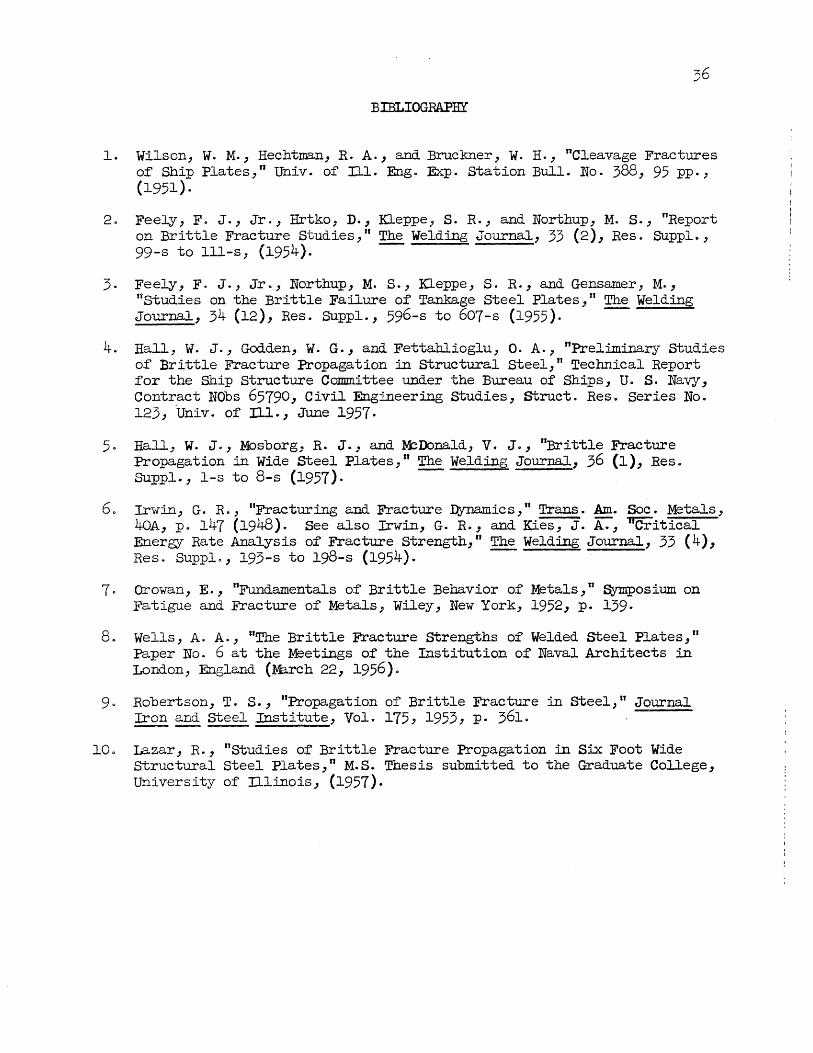
The results of the instrumented tests are shown in Figs. 5 through
22. The tables in each figure indicate the position of the strain gages,
crack detectors, trigger, the vertical position (Y ) of the crack with resc
pect to the notch line, the strain level for each strain gage at test load,
crack speeds as determined from the detectors, and the test conditions. A
record of the strain-time relationships as obtained from the ~ic strain
gages is shown. In all cases the strain traces are plotted to start at a
strain level corresponding to the initial test load strain; thus, the strain
values shown may be considered as absolute strain values. The detector
breaking time is indicated on the record to denote the approximate location
of the crack front.
The quality of the records from the tests varies considerably.
Typical enlarged photographic records of strain traces are presented in Figs.
25 and 26. These were considered to be of good quality. Poor records may
result from many causes, for example, faulty or late triggering, incorrect
focus of the camera or the oscilloscope, or poor lead wire connections. A
record is considered poor also when the strain traces overlap on the record-
ing film to such an extent that it is not possible to determine exactly to
which strain gage the ensuing trace belongs. This generally occurs in the
latter part of the record if it occurs at all. A partial record is one on
which some of the strain traces are recorded, while the remainder are not.
This may be due to a number of factors which cause a failure of the gage or

19
gages, for example, condensation on exposed lead wires, or equipment failure
during the tests.
The strain signal in most records is an erratic, oscillating trace
after the first 1.5 to 2 milliseconds, ie. after the plate breaks completely
(for an example see Fig. 13). This oscillation may be the result of such
factors as motion of gage lead wires, ringing of the plate due to the impact
force, vibration of the two parts of the plate, etc. Many of the strain
signals have high frequency noise superimposed on the actual signal (for an
example see Fig. 18). Normally the noise level was very low and has been
ignored in plotting the record in order to clarify the resulting trace. In
the few cases that a high noise level was recorded the disturbance occurred
at the same time and to about the same degree on all the traces. This was
attributed to an electrical disturbance since all gages are fed from a com
mon source and. are grounded in cozmnon.
To study the strain behavior in the vicinity of the fracture, the
strain gages must be located close to the anticipated fracture path. The
effect of a fracture passing either through or very near (within 1/4 to 1/2
in.) a strain gage may affect the recorded traces in several ways. The
trace for such a gage often exhibits an extremely rapid rise and leaves the
scope face (for the sensitivities used in these tests), and mayor may not
return within the duration of the record. Also, since all the gages have a
common ground wire, the destruction of one gage may cause a voltage jump (or
occasionally noise) in the other gages (for an example see Fig. 14).

20
12. striking Tests
The object of this series of five tests was to evaluate the effect
of the notch-wedge-impact method of crack initiation on the strain response
of the specimen. In the striking tests the specimen was subjected to the
notch-wedge-impact method of crack initiation, but at a temperature gener-
ally higher than the temperature for the complete fracture tests in order to
prevent crack initiation. The standard notch, wedge, and theoretical impact
force was used in these tests. The stress varied from 18.0 to 18.5 ksi; the
temperature was approx:i.mately 750F for four of the tests (Tests 16, 17, 21
and 30) and approx:i.JIla.tely O~ for one test (Test 18).
In three of these tests the strain response in the general vicinity
of the notch was studied. Test 17 (Fig. 8) initiated a 1/2 in. submerged
crack and all gages showed an :i..Imnediate response, several as high as 250
microinches per inch. Test 21 (Fig. ll) showed no sign of any submerged
cracks but all gages showed an immediate response, some as much as 220 micro-
inches per inch of strain. It is of interest to note that gages 3 and 9,
back to back on the specimen, show strain changes of opposite signs. No
record was obtained in Test 16 because of a ~aulty trigger circuit.
The other two tests of this series were concerned with the strain
response of gages located on the fracture-test notch line; the same gages
were subsequently used in a complete fracture test. Test 18 (Fig. 9) is the
only six foot ,"'ide plate specimen which thus far has failed to fracture com-
pletely" under normal fracture conditions. As explained previously in Sec-
tiOD 10, this may be due to the gas-operated piston device delivering a
slightly reduced starting energy. The test resulted in a partly submerged
i I
C
I c
1 i • c ~
~ til
t • c c <:
J
.../

21
crack" approximately 2.3 in. long. This crack is considerably longer than
the cracks :formed by similar tests at room temperature. With the exception
of gage 1, the gages showed strain responses o:f not more than 50 microinches
per inch. Gage 1 peaked to approximately 1,000 microinches per inch, and.
retained about 300 micro inches per inch o:f permanent set, probably because
of its proximity to the crack. Test 30 (Fig. 16), at room temperature, did
not show a~ signs of a submerged crack. The strain response was not over
50 microinches per inch for any gage. The notches used for Tests 18 and 30
were the source of secondary cracks when the inserts were later fractured
completely in tests in which the fracture was initiated from the opposite
companion notch.
It was concluded from the above tests that the present notch-wedge
impact method of fracture initiation produces a relatively small strain res
ponse as compared to the strain response which is recorded during the frac
ture tests. The records indicate that the impact is felt throughout the
plate; however J the strain magnitude, particularly at the center and far side
of the plate, is small.
A question which remains unanswered by these tests is how far must
a crack be driven by the impact force to enable the fracture to propagate
across the entire plate. Obviously, other factors such as stress (or strain
and related strain energy-), temperature, and :imparted :iIrIpact energy-, influ
ence the propagation. The formation (or non-formation) of submerged cracks,
and the variation of their length under similar physical test conditions"
admittedly are not completely understood; on the basis of Test 18, it would
seem that in the range of' stress and temperature in which these tests are

22
being conducted~ the relationship between external impact energy-and driven
crack length must be fairly critical.
13. Complete Fracture Tests
(a) Fracture Speed
The speeds of propagation of the brittle fracture on the plate
surface for the six foot wide plane plate tests are shown in Fig. 23. The
speeds as measured by the crack detectors varied from 2,150 to 3,800 f'ps and.
from 1~800 to 7,550 fps as measured by the strain gages. This wide variation
in speed occurs despite the fact that all the tests were performed under sim
ilar test conditions. However, seventy-five per cent of all recorded speed
data is in the 2,100 to 3,900 f'ps range.
The crack detector.s spaced at intervals of approximately 12 in.
appear to give more consistent values of speed than the strain gages. Ninety
five per cent of the computed speeds from crack detectors are in the 2,100
to 3,900 f:ps range, while only fifty-five per cent of the computed speeds
from strain gages are in this range. other evidence of inconsistencies in
the two methods of measurement may be seen in Test 15 where the speed of the
crack across the latter part of the plate was 4,350 fps on the basis of the
record :from the vertical dynamic strain gages on the east face of' the plate.
For this same distance on the same section of plate, the crack detectors,
also on the east Side, gave an average speed of 2,600 f'ps. The vertical
strain gages on the west side show a speed of 2,100 f'ps in this region. In
Test 19~ the vertical strain gages indicate a speed of' 7,550 fps, the hori
zontal strain gages 4,850 fps, and the crack detectors approximately 3,500
£':ps. In this particular test, the speed for the section between detectors

23
D and E is omitted; detector E was broken in two places, once by the main
f'racture and once by a second.a.r.Y fracture, and it is not known which break
occurred first. All these gages (detectors and strain gages) were located
in the same section on the east face o:f the plate. Again in Test 31, the
speeds on the :first half o:f the plate agree closely with each other and with
other speeds recorded on this section of the plate, while· on the second half
a considerable di:fference in values was noted. However, the speeds as deter
mined by the detectors :for Tests 13, 14, 15, 19, 22 and 31 all agree fairly
well with each other.
The speed of fracture propagation appears to reach a constant value
within the first :four to six inches of the fracture. Test 32 indicates a
speed of 3,150 :fps in the first foot of the plate. Tests o:f this and other
investigations (4), also indicate this same tendency. In most cases the
magnitude of the speed (approxiIDately 3,500 fps) as measured with the crack
detectors, remained about the same as the crack propagated across the plate
spec linen 0
A study of all the speed data from tests of six foot wide plates
(including speed measurements made as part of the Crack Arrestor study, Proj
ect SR-134) in.dicate no definite speed versus average static stress, or speed
versus average temperature relationship, although the average net stress
rang~d from 18 to 33 ksi, and the temperature ranged :from +5 to -33°F. A
slight increase of speed for lower temperature and higher stress seems to
be apparent :from the Crack Arrestor tests, but this is not consistently
observed. The speed of fracture propagation on one test of a semi-killed

steel plate (Project SR-134 data) was not noticeably dif~erent from the
speed of fracture noted in the rimmed steel plate tests.
24
In conclusion, considering each specimen individually, and the
group of specimens as a whole (all tested under similar conditions), it
appears that brittle fracture speeds measured by widely spaced crack detec
tors on the plate surface are more uniform than those computed £'rom simi
larly spaced strain gages. The variation in measured speed is often more
apparent over short lengths o~ the plate. However, there is no reason to
believe that the fracture progresses uniformly across the width of the
plate. It is conceivable that, as the inner portion o~ the fracture pro
ceeds across the width of the plate, the surface may open intermittently;
i.e. the sur~ace fracture may start, skip a section, and then continue on
with the skipped section breaking slightly later. This concept might help
explain why adjacent or back-to-back strain gages do not peak at the same
time, and may also explain many of the apparent inconsistencies in speed
measurements. However, for the tests made under approximately similar con
ditions of stress, temperature, and impact, it seems reasonable to expect
that the average speed of propagation £'rom plate to plate should be approx
imately the same. In any evaluation of the speed data, it must be recog
nized that the methods used provide only app~oximate measurements, but were
felt to be the best methods available (Refer to Section 9 for a discussion
of speed measurements).
(b) Dynamic Strain Measurements
strain-time relationships are shown for ten tests, Figs. 5 through
18. The majority of the strain measurements were made with vertically oriented

25
strain gages in the vicinity of the crack path. Also, several strain traces
from horizontally oriented gages and one strain trace £'rom a gage oriented
450 to the vertical were obtained in the vicinity of the crack.
During the course of the fracture, the vertically oriented strain
gages in the vicinity of the crack path display a similar behavior in that
the signal peaks when the crack approaches or passes the gage location. How-
ever the precise position of the fracture at the time the peak is reached,
is uncertain. The peaks for back-to-back gages, and gages mounted on the
same side and only 0.5 in. apart, were found to be as far apart as 0.3 milli-
seconds (Figs. 5 and 7). In Test 13 (Fig. 5) it is interesting to compare
the signals from strain gages 2 and 4 which were mounted back-to-back at the
center of the plate. The difference in time between the peaking of the two
gages is about 0.4 milliseconds, which for ~~ average speed of crack propa-
gation of 3,400 f'ps would indicate one side of the fracture preceeded the
other by 16 inches. In addition there is a sizable (1,200 microinches per
inch) difference in the amplitude of the strain peaks.. Also in this tes-t,
gage 2 was approached by the crack path before detector C, but the strain
gage peaked 0.16 milliseconds after the crack detector broke.
The foregoing is one basis for the suggestion that the fracture
of the plate surfaces may not be continuous and symmetrical. In addition,
it is found that upon recovery, some of these gages show an increase of
strain over the initial strain, several strain gages show a decrease, and
several show no change at all. To some extent, but not entirely, this dif-
ference in behavior may be correlated with the distance of the strain gage
from the fracture, but just as likely may be related to stretched lead wires,
etc., as discussed later in this section.
.1

The magnitude of the peaks follows no set pattern) although in
comparable records (Tests 23, 24, 31 and 32) there seemE to be a slight
increase in the magnitude of the strain peak for gages located closer to
the fracture path. However this behavior is not consistent" as back-to
back gages which are the same distance from the crack) sometimes have peaks
of greatly differing magnitudes 0 This inconsistency in strain magnitudes
has been noted particularly in records from tests in which the crack passed
through at least one strain gage~ This effect was discussed in Section 11.
The magnitude of peak strains from gages further away from the
crack path is less than the peak strain for gages located very near the
fracture path~ For example J the magnitude of the :peak strain was approxi
mately 1,400 microinches per inch for gages three to four inches away from
the crack path in Test 23, and approximately 1,100 microinches per inch for
gages six to seven inches away from the crack path in Test 320 This would
j.:c.dicate a rapid decrease in magnitude of the strain peak for points :further
away (vertically) from the horizontal fracture; this corresponds to observa
tions reported in Reference (4). It is important to note that the peak
strain magnitude does not show any definite correlation with the gage posi
tions across the plate 0 It. was anticipated that~ as the crack progressed
aGross the plate, it would produce strain peaks o.f lncreasing magnitude;
however, neither this nor aD-0'~ other particular tendency vras observed.
Arter reaching a peak value j the strain signals move tow~rd the
zero strain level. However:many of the traces d.id not return precisely to
this \~lueas noted in Figsa 5, 6 and 120 This variation in leveling-off
or TL~l strain may be caused in part by such effects as the relaxation of

27
residual strains, inelastic strain resulting from fracture, and stretching
of the lead wires after fracture. Also, a comparison of strain readings
made immediately before and ·after the test, with gages used for static mon
itoring purposes, reveals an erratic array of residual strain values; how
ever, in the majority of cases in which the gages were at some finite dis
tance from the crack (greater than 1 to 2 inches) and did not have pulled
lead wires, etc., the residuals (final strains) were smallc
It has been observed that the static strain level at test load
sometimes varies considerably both across the width of the test plate and
through the thickness. Across the width of a plate on one side only,
excluding that region immediately adjacent to the notches, base strains
have been found to vary by as much as 200 microinches per inch. In the
thickness direction a difference in strain values of as much as 200 micro
inches per inch has been noted for an average strain level of approxiInatel:y
600 mic.roinches per inch. The strain response during crack propagation has
been studied to try to ascertain the effects of these large differences in
base strain; it is believed that both the differences in dynamic peak
values and the time lag in peaking of back-to-back gages may be affected to
.some degree by the variation in base strain~
Test 32 (Figs. 18 and 24) was performed on a steel plate prestrained
to approximately two per cent strain. It was believed that the prestraining
would reduce the strain differential in both the width and thickness direc
tions and thus gages mounted back-to-back would have records which would be
in better agreement, both as regards time of peaking and magnitude of strain.
The test results indicate that the magnitudes of the strain peak were quite

28
uniform ~or back-to-back strain gages, but the time o~ peaking was still
inconsistent. In this test, gage 6 peaked a~ter gage 1 and gage 7 peaked
a~ter gage 2, but gage 8 peaked be~ore gage 4. This one test would seem
to indicate the dif~erences in dynamic peak strain magnitudes and the time
lag in peaking o~ back-to-back gages are probably not a~fected markedly by
the variation in base strain.
The distribution across the plate of vertical strain at various
times during the fracture is sho'WIl in Figs. 19 through 22 by bar graphs.
Figures 19 and 21 seem to indicate that a vertically oriented strain gage
located close to the crack path (up to 2.3 in.) is unaware of the approach
ing fracture until quite suddenly the strain trace exhibits a rapid rise
followed by a rapid drop, i.e., there is little change in the strain level
on the uncracked portion of the plate until some time just prior to peaking.
This would indicate that even though there is a reduction in the net section
as the crack progresses across the plate, the strain (and corresponding load)
on the remaining section does not have time to change; thus, there is no evi
dence of a gross redistribution of load on the net section during the frac
ture process. A study of' strain response patterns in Figs. 19 through 22
suggests a strain concentration (associated with the crack front) which tra
vels across the plate, leaving a brittle fracture in its wake.
Some of the tests contain records from gages 8 and 9 which were
located about 104 inches below the notch line, as sho'WIl in Figs. 10 and 12.
The gages are vertically oriented, and in order to eliminate the effect of
bending in the plate, the response from back-to-back gages is averaged elec
trically. The response of these gages is very similar in both tests. Both
29
gages begin to show a decrease in strain at the moment the record commences,
with the gage nearest the striking edge dropping off more rapidly than the
other gage; the rate of change in strain increases, particularly after about
half the plate is fractured. A record of these gages from another test (Proj-
ect SR-134 data) with a longer sweep time indicates that these two gage sig
nals oscillate for some time after fracture, and eventually approach the zerc
load strain value.
Tests 19 and 22 (Figs. 10 and 12) show the records for strain gages
oriented horizontally. The strain records for these horizontal gages are
somewhat different than those observed in the two foot wide tests (4). In
the latter case, the records usually indicated a reduction in the initial
compressive strain as the fracture approaches the gage, followed by a sharp
compressive strain peak at the time the companion vertically oriented gage
peaked in tension. This general type of behavior is seen in Fig. 12, but
not in Fig. 10; in the latter case, there is a large tension peak at the
time there ~ould normally be a compression peak. Although the precise rea
son for this difference in behavior is not known in this case, it may be
due in part to the fact that the fracture passed very close to the particu
lar gage in Test 19 (Fig. 10).
Tbe behavior of a gage oriented 450 to the vertical is quite simi
lar to t~t of ~n adjacent vertically oriented gage, except that it peaks
somewhat l~ter. A typical example is shown in Fig. 12.
( c ) C r-iC 1: Fa th and Texture
The fracture paths have not shown any tendency to follow a parti
cular direction. The great majority of the fractures slope upward from the
point of initiation, then level off or wander. Several crack paths for 6

30
ft. wide plates are shown in Figs. 27 and 28. The crack paths shown in Fig.
28 are from the tests in which no strain records were obtained. The maximum
deviation of a crack path from the notch line for the wide plate tests was
approximately 7.3 in. (Test 32).
The texture of the brittle fractures may vary considerably from
test to test and from one part o.f' the plate to another. The texture of the
fracture surface may range from very flat and smooth (chevrons indiscernible)
to very coarse (chevrons may protrude up to approximately 1/8 in.). Typical
examples of crack texture may be observed in Figs. 29 through 32. In some
specimens the fracture texture is so coarse that small pieces of metal are
torn completely away from the parent plate. The texture for tests of rimmed
steel, prestrained rimmed steel and the semi-killed steel was similar in
that it could not be correlated with other test conditions or results.
It was thought that some correlation might exist between the tex
ture of the fractured surface and the speed of propagation, namely, the
smoother the texture, the faster the speed, and vice-versa. However no def
inite correlation is evident at this time. Measurements indicate a reduc
tion in thickness in the region of coarse texture of .010 in. to .020 in.
(1 to 2 per cent of plate thickness) while there is only .001 in. to .004
in. reduction in ~hickness (0.1 to 0.3 per cent of plate thickness) in
regions of fine texture. This was noticed in the tests of semi-killed
steel specimens also.
(d) Semi-Killed Steel Tests
Four tests (Tests 26 to 29) without instrumentation were conducted
on a semi-killed steel with a Charpy V-notch 15 ft. lb. value of OOF, to

31
determine the stress level necessary for fracture propagation. An interest
ing feature of these tests was that Test 26 at 17,000 psi and -loF did not
fracture, while Test 29 at 17,000 psi and -20 F did fracture. In these tests
the original insert was 3/4 x 60 x 72 in. and after each test the fractured
portion of the plate was cut out and the remainder rewelded to the pull plates
so that the insert for Test 29 was only 3/4 x 16 x 72 in.
Complete fractures were obtained in the last three tests (See Table
1, Tests 27, 28 and 29) leading to the conclusion that the test conditions
required for propagation of a brittle fracture in this semi-killed steel
approach those of the rimmed steel presently used.
( e) Secondary Cracks
A secondary crack is a brittle fracture generally initiated during
the test from the notch opposite the test notch. The chevron markings indi
cate that these secondary cracks propagate toward the advancing brittle
fracture from the notch opposite the point of initiation. They either
arrest within the plate or terminate by joining the main fracture. Typi
cal secondary fractures are shown in Fig. 32. Figure 30 shows the far edge
of the specimen for Test 18 after fracture. The submerged crack from the
previous test on this insert, which propagated only 2.3 in. as shown by the
arrow, reinitiated and joined the main fracture which approached from the
left. Figure 31 shows a close-up of the specimen from Test 20 (Refer to Fig.
29 for the crack path) where the fracture started to branch. There is no
strain record for this test.
(r) Steel Temperature During Test
On several spec:imens an attempt has been made to collect data
involving the change in temperature resulting from the fracture phenomena.

32
Several cooling records beginning a few minutes be.fore the test and extend
ing for several minutes afterward are shown in Fig. 3. Changes of as much
as several degrees F have been noted in a number of the tests immediately
following fracture, but the results are inconsistent and at this time no
conclusions may be drawn.
14. Fracture of the Pull Plate
This fracture resulted during the prestraining of the specimen
insert for Test 32. The fracture occurred at room temperature (approxi
mately +790F) and at an average stress of 32 ksi. The fracture initiated
from the toe of a weld on the edge of the pull plate. The weld held a
bracket which was used to support the initiation and cooling eqUipment for
the regular tests. There was no external load on the bracket at the time
of failure. A secondary crack about three to four in. long was initiated
from the toe of a weld on the opposite edge of the pull plate.
The brittle fracture had a distinct shear edge or thumbnail at
the beginning (see Fig. 33). The texture of most of the fracture varied
from coarse to very coarse.
T~i~ pull plate has a long strain history, but the addition of the
welds on tee edges was quite recent. The original check analysis and tensile
properties ~re shown in Fig~ 33c Recent tensile and Charpy V-notch data are
presente~ iL T~t}e 2~ The recent tests show a lower yield strength, and a
higher ffiJ.ZX.J.:: strength" than originally reported. Of particular interest
is the exhaustion of ductility which is indicated by the strain correspond
ing to the beginning of strain hardening (€sh). This value is tabulated in
Table 2 and indicates that the previous strain history of the plate had

33
exhausted roughly one-half of the foregoing strain (€sh) normally available.
The Charpy V-notch data appear to be in line with other data for the same
type o.f steel as reported by the Standard Oil Development group (3).

34
IV. SUMMARY
A fundamental study of the propagation of brittle fractures in
six foot wide steel plates is described in this report. The plates were
tested under similar stress and temperature conditions, and the fractures
were initiated at an edge notch by a wedge subjected to an impact. The
specimens were instrumented to provide a record of strain response and
crack speed as the fracture propagated across the plate.
Striking tests, in which the specimen was not fractured, indicate
that the strain response resulting from the impact-wedging action is rela
tively small when compared to the strain response recorded during the frac
ture process. Although the records indicate the impact is felt throughout
the entire plate, it appears that the strain at the center and far side of
the 6 ft. wide plate is not materially affected by the wedging action.
The majority of the strain and speed measurements recorded in the
fracture tests have been made in the immediate vicinity of the fracture
path. Strain magnitudes exceeding 2,500 microinches per inch have been
measured on the plate surface near the fracture, with negligible permanent
set remaining after fracture. In general, the nearer a vertically oriented
gage is to the fracture path, the sharper and greater the magnitude of the
strain pulse; as the distance increases, the strain pulse extends over a
longer period of time, but the precise shape of the pulse depends on the
distance from the fracture path. Thus far vertically oriented strain gages
in front of the crack indicate that there is negligible strain redistribu
tion on the remaining section ahead of the crack.

35
strain signals from gages adjacent to the fracture and. mounted back-
to-back on the plate, or immediately adjacent to each other, attest to the
discontinuous nature of the surface fracture; in terms of fracture length the
time lag between strain trace peaks in the case of gages mounted back-to
back has amounted to a differential crack length on the two surfaces of as
much as 16 in. Such measurements may help to explain man;y of the inconsist
encies of speeds and strain patterns which have been observed. Fracture
speeds ranging from 1,800 to 7,550 have been measured, with seventy-.five
per cent of the speeds within the range of 2,100 to 3,900 f'ps. Although a
number of inconsistencies in the speed measurements have been noted, the
speed measured from crack detectors has been ~airly constant across the
plate 0 However, no definite speed versus strain, or speed yersus tempera
ture relationship is apparent as yet.
In the wide plate tests, the fracture appearance in many specimens
has varied from extremely smooth to coarse, but no correlation has been
observed between the fracture appearance and the measured speed or strain
response. Studies show that the smooth texture is accompanied by negligible
reduction in plate thickness while the very coarse texture is generally
associated with reductions in plate thickness of one to two per cent.
The brittle fracture of a pull plate with no artificial stress
concentration is reported. This plate failed at room temperature, in a
brittle manner, and at an average stress of 32 ksi (eighty-six per cent of
the original yield strength).
BIBLIOGRAPHY
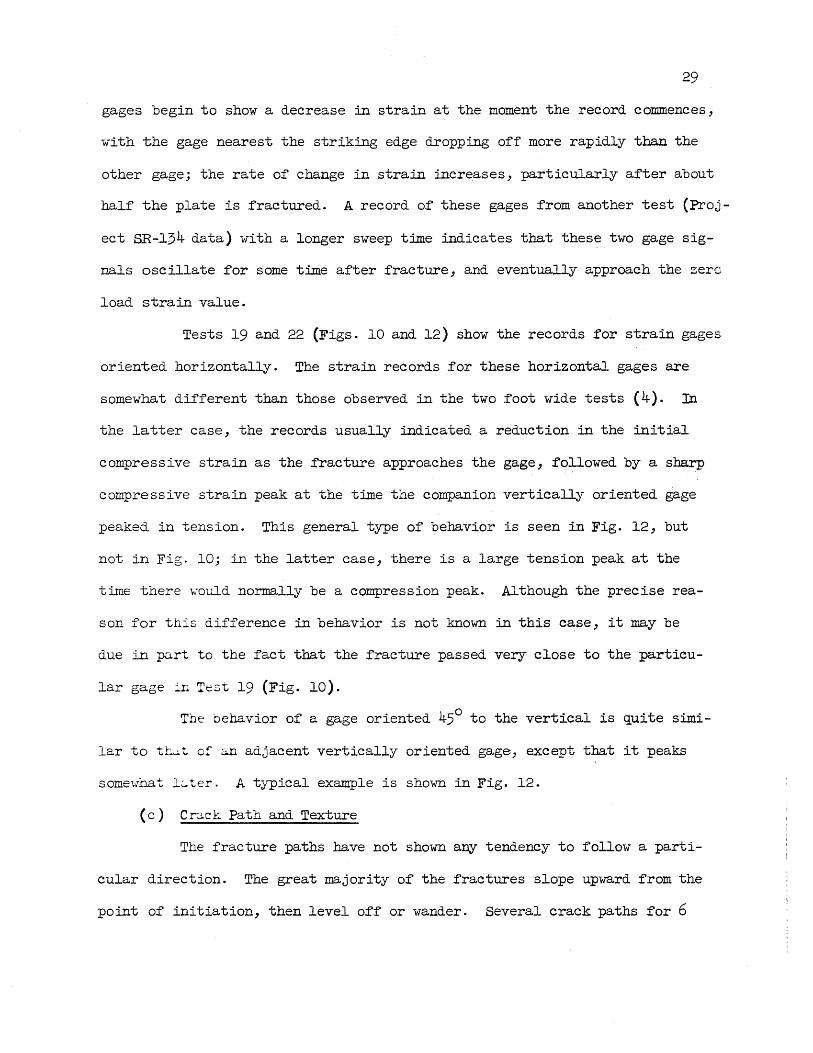
1. Wilson, W. M., Hechtman, R. A., and Bruckner, W. H., "Cleavage Fractures of Ship Plates.," Univ. of ill. Eng .. Exp. Station Bull. No. 388, 95 pp., (1951) .
2. Feely, F. J., Jr., Hrtko, D., Kleppe, S. Ro, and Northup, M. S., "Report on Brittle Fracture Studies," The Welding Journal, 33 (2), Res. Suppl., 99-s to lll-s, (1954). -
3. Feely, F. J., Jr., Northup, M. S., Kleppe, S. R., and. Gensamer, M., "Studies on the Brittle Failure of Tankage Steel Plates,n The Welding Journal, 34 (12), Res. Suppl., 596-s to 607-s (1955). -
4. Hall, W. J., Godden, W. G., and Fettahlioglu, O. A., "Preliminary Studies of Brittle Fracture Propagation in structural Steel," Technical Report for the Ship Structure Committee under the Bureau of Ships, u. S. Navy, Contract NObs 65790, Civil Engineering Studies, Struct. Res. Series No. 123, 'Uni v. of D.l., June 1957.
5. Hall, W. J., Mosborg, R. J., and M:!Donald, V. J., "Brittle Fracture Propagation in Wide Steel Plates, n The Welding Journal, 36 (1), Res. Suppl., l-s to 8-s (1957). -
60 Irwin, G. R., uFracturing and Fracture DynamiCS, n Trans. Am. Soc. Metals, 4OA, po 147 (1948) .. See also Irwin, G. Ro, and Kies, J. A., "Critical Energy Rate Analysis of Fracture Strength, It The Welding Journal, 33 (4), Res. Supplo, 193-s to 198-s (1954).
7.. Orowan, E., "Fundamentals of' Brittle Behavior of' Metals," Symposium on Fatigue and Fracture of Metals, Wiley, New York, 1952, p. 139.
80 Wells, A. A., liThe Brittle Fracture Strengths of Welded Steel Plates, n
Paper No. 6 at the Meetings of' the Institution of Naval Architects in London, England (M:1rCh 22, 1956) ..
9. Robertson, T. S., "Propagation of Brittle Fracture in steel, tt Journal Iron and steel Institute, Vol. 175, 1953, p. 361.
100 Lazar, R., "Studies of' Brittle Fracture Propagation in Six Foot Wide Structural Steel Plates," M.S. Thesis submitted to the Graduate College, University of illinois, (1957).

TEST (FIG.) PIATE DESIGNATION ANDmTE OF TEST
TABLE 1 OurLINE OF TEffrS
INITIAL LOAD
(KIPS)
srRESS ON NEr SEr!TION
(KSI)
AVERAGE TEMP. (OF. )
REMARKS
The tests w'ere conducted on six foot wide specimens of rinnned steel in a 3,000 ,000 lb hydraulic testing machine. The test piece is an insert 3/4 x 54 x 72 in. welded to one inch pull plates to give a specin~n six feet wide by 18 feet long in plan dimension (exclusive of the pull heads). Following the first fracture test on a given specimen, the .fracture is generally cut out and the remaining portion of the insert (32 in. x 72 in.) used for a second test. The former size of insert is designated by an (A), the latter by a (B) in the remarks column. Notch length I in. Dimensions as noted in Section 7 of text.
12
13 (5)
14 (6)
15 (7)
16
17 (8)
ZlFl-l 11-29-55
ZlFl-2 12-7-55
Z2Dl-1 1-10-56
Z2ffi-2 1-19-56
Z2D2-Impact 2 3-20-56
Z2D2-Impact 1 3-20-56
1065.0
1065·0
96000
960.0
990.0
990.0
20.0
20.0
18.0
18.0
18·5
18·5
-10
0
-8
-5
Room temp. (approx. 71~)
Room temp. (approx. 74-)
(A) Complete fracture. Record lost.
(B) Complete fractQ~e. Good record.
(A) Complete fracture. Record extremely poor; considerable noise.
(B) Complete fracture. Fair record.
(A) Final load -- 990.0 kips. No record obtained. Submerged crack 1/2 in. long.
(A) Final load -- 990.0 kips. Good record. Crack 3/8 in. long on cn,st side and l/e in. :~_uX)g on ,·rest side.
\..N --~

TEST (FIG.)
18 (9)
PLATE DESIGNATION AND DATE OF TEST
Z2D2-1 3-28-56
INTrIAL LOAD
(KIPS)
990.0
TABlE 1 (Continued)
ffi'RESS ON NEl' SEJTION
(KSI)
18·5
AVERAGE TEMP. (oF. )
-t8
REMARKS
(A) Final load -- 990.0 kips. Good record. Submerged crack 2 in. long. Essentially a striking test at low temperature.
Notch length changed from 1 in. to 1 1/8 in. Dimensions as noted in Section 7 of the text.
19 (10) Z2D2-2 1070.0 20·5 -7 (A) Complete fracture. 4-20-56 Good record.
20 Z2D2-3 960.0 18.0 0 (B) Complete fracture. 4-30-56 Record lost. Evi-
dence of branching at center of plate.
21 (11) ZlCI-Impact 960.0 18.0 Room temp. (A) Final load -- 960.0 6-14-56 (approx. 85) kips. Good record.
No submerged cracks.
22 (12) ZlC1-1 960.0 18.0 -10 (A) Complete fracture. 6-14-56 Good record.
23 (13) ZlCl-2 960.0 18.0 -11 (B) Complete fracture. 6-25-56 Good record, except
part ",as lost. ~ m

TEST (FIG.)
24 (14)
25 (15)
PlATE DESIGNATION AND DATE OF TFSr
ZlC2-1 8-1-56
ZlC2-2 8-14-56
INITIAL LOAD
(KIPS)
960.0
960.0
TABLE 1 (Continued)
srRESS ON NEI' SEr!TION
(KSI)
18.0
18.0
AVERAGE TEMP. (oF. )
5
2
REMARKS
(A) Complete fracture. Record quality excellent,' validity questionable.
(B) Complete fracture. Good record except part was lost. Duplicate test of ZlCl-2.
The following series of four tests were conducted on six ft. w~de semi-killed steel specimens with the same notch dimensions as above. No instrumentation. Modification of gas operated piston device made here (See Section 1 of text).
26 (2)
21 (2)
28 (2)
29 (2)
X2El-l 9-11-56
X2E1-2 9-11-56
X2El-3 9-14-56
X2E1-4 9-20-56
890.0
1050.0
945.0
890.0
11·0 -1
20.0 5
18.0 -4
11·0 -2
(A) Final load -- 890.0 kips. No submerged cracks.
(A) Complete fracture.
(B) Complete fracture.
Plate X2El-3 (previous test) was cut in half to obtain 16 in. insert. Complete fracture.
\,J-l \0

TEST (FIG.) PIATE DESIGNATION ANDMTE OF TESl'
mrrIAL LOAD
(KIPS)
TABLE 1 (Continued)
srRESS ON NEI' SOOTION
(KSI)
AVERAGE TEMP.
- (OF.)
Instrumented tests resumed on six foot wide rimmed steel specimens.
30 (16)
31 (17)
32 (18)
Z2C2-Impact 10-25-56
Z2C2-1 10-25-56
Z2C2-2 11-15-56
960.0
960.0
960.0
18.0
18.0
18.0
Room temp. (approx. 78)
-3
-1
REMARKS
(A) Final load - - 960.0 kips. Good record. No sub~rged cracks.
(A) Complete fracture. Good record.
(B) Prestrained specimen. - Complete fracture ~:' Good rec ord .
.ro

41
TABLE 2 TENSILE AND CHARPY mTA FOR PULL PIATE STEEL
A285 Grade C Flange steel Tensile and Charpy Specimens were cut from mid-width of plate adjacent to fracture
(a) Tensile Data (0.505 in. dia. round test coupon)
Yield strength, Lower (ksi) M3.ximum Strength (ks i) Elongation in 2 in. (per cent) Reduction in Area (per cent) Strain at beginning of, strain
hardening (€sh) in. lin.
(b) Charpy V-Notch 1)3.ta
Avg. of 2 Specimens Parallel to direction of rolling (Vertical)
32.2 65.2 38 56
0.008
One Spec imen Transverse to Direction o,r rolling
30.2 64.6 36 51
0.005
Spec imen Axis parallel to direction of rolling and transverse to fracture. V-Notch axis perpendicular to plate surface.
Temperature
+196 +190 +180 +160 +120 +100 482 +58 +4D +20 ·.··;:0 -40
Absorbed Energy
48 46 44,47 31,35,40 24,25,26 18,18,20 15,15,16 11,12,12 7,8,8 5,5,6 4,5',Q,7 4,4,4

cb PULL HEAD
j.- 6'--
PULL PLATE
1M THICK
INSERT SPECIMEN
3/4" THICK
PULL PLATE I" THI~K
PULL HEAD
9
J 1
SIX-FOOT WIDE SPECIMEN IN 3,000,000 - LB. MACHINE LINE DIAGRAM OF PLATE SPECIMEN
FIG. I
CD -l
~ LL.
>-(!)
cr w z w a w CD cr 0 (f) CD <t
40
30
20
10
o -30
I ;.--~
I / I : /0 ~
~ 0
yf0
f
o +30 +60 +90 +120
TEMPERATURE 0 F
CHARPY V-NOTCH IMPACT RESULTS FOR RIMMED STEEL
TENSILE TEST DATA FOR LUKENS RIMMED STEEL
HEAT NO. 16445 DIRECTION YIELD ULTIMATE ELONGATION REDUCTION
OF ROLLING STRENGTH STRENGTH IN 2 IN. OF AREA KSI KSI 0/0 0/0
PARALLEL 34.7 68.1 36 58
NORMAL 35.2 68.7 31 52
CHECK ANALYSIS OF LUKENS RIMMED STEEL
HEAT NO. 16445
C Mn P S Si CU Cr NI AI
0.18 0.42 0.013 0.031 0.02 0.23 0.07 0.14 0.003
TYPICAL TEST SETUP AND PROPERTIES OF RIMMED STEEL

TEST 26-
TEST 28-
TEST 29-
FIG. 2
FRACTURE PATHS - SEMI-KILLED STEEL
m 120 ...J
l-LL.
80 >-(!) a:: UJ :z UJ
Cl 40 UJ ro a:: 0 en ro
) . /: ~
~ :/
-~ 1_· ~ <{
0 -30 o +30 +60 +90
TEMPERATURE of
CHARPY V-NOTCH IMPACT RESULTS FOR SEMI-KILLED STEEL
DIRECTION
OF ROLLING
PARALLEL
NORMAL
C
0.20
Mn
0.76
TENSILE TEST DATA FOR US S SEMI-KILLED STEEL
HEAT NO. 64M487
YIELD ULTIMATE ELONGATION
STRENGTH STRENGTH IN 2 IN.
KSI .KSI %
34.9 66.7 39
34.3 60.1 39
CHECK ANALYSIS OF US S SEMI-KILLED STEEL
HEAT NO. 64 M 487
P
0.019
S
0.040
SI
0.03
Cu
0.04
Cr
0.02
Ni
0.16
REDUCTION
OF AREA %
65
59
AI
0.002
- TEST 27
FRACTURE PATHS AND PROPERTIES OF SEMI·KILLED STEEL

y
'3 '6
, 2 , 5
Y
WEST SIDE
TEST 15
~- DIRECTION OF FRACTURE
NO. I
2
3
4
5
~ 7 8
NOTE:
x in
6.0
6.0
6.0
18.0
IB.O
IB.O ---36.0
66.0
THIS
USED
y TEMP. AT in TIME OF TEST
-1.0 -3.B
-7.0 -2.3
5.0 -7.0
-1.0 -2.0
-7.0 -3.2
5.0 -9.3 -1.0 - 3.7
-1.0 -5.6
THERMOCOUPLE LAYOUT
FOR TESTS 12 -18
THERMOCOUPLE LOCATIONS AND TEMPERATURE - TEST 15
NO. X Y TEMP. AT in in TIME OF TEST
I 6.0 4.0 -13.8
TEST 23 2 6.0 -4.0 -12.0
3 21.0 4.0 -11.3
4 21.0 -4.0 -10.0
l "I -=- ~ '~ ____ '_" ___ ~-=: 5 36.0 4.0 -10.8
-X 6 36.0 -4.0 -11.0
I ' 2 • 4 ' 6 ' 8 '10 7 51.0 4,0 -10.6
8 51.0 -4.0 -lOA
I
I
DIRECTION OF __ 9 66.0 4.0 -13.0 FRACTURE 10 66.0 -4.0 -9.B
WEST SIDE NOTE: THIS THERMOCOUPLE
USED FOR TESTS
THERMOCOUPLE LOCATIONS AND TEMPERATURE - TEST 23
r----i-_ TEST 24 - ..... 5 I ------
.1 TEST 25
--~---- -----~-----~-----I
I O~--
...... -THERM. 7-3.1 in.BELOWCRACK ----
. TEST 15
r-~ _ - - - I-- ------1 )J--5_ '{ / ----I \ I
W ,) a:: TEST 23 THERM.7 - 0.4 in. BELOW CRACK
LAYOUT
19 - 32
~ \ I -,O------------=~_~'------T-~~~\.r~----~-------r------+------+------+-----~ ~ -15' ~ / - ----
_201~ ____ ~~-~J~--~In_--~~-_.~T,H-ER-M-.-6-J=~4-in-B-EL~0~IW_C_R_A_C~K~ ____ ~ ____ ~ -l .:'" rES TIME OF FRACTURE
o 1.0 2.0 3.0 4.0 5.0 6.0 7.0 B.O 9.0 TIME- MINUTES
TYPICAL TEMPERATURE TRACES AT TIME OF TEST
FIG. 3 THERMOCOUPLE LOCATIONS AND TYPICAL
TEMPERATURE TRACES AT TIME OF TEST

SIGNAL 4
SIGNAL 5
SIGNAL 6
SIGNAL 7
SIGNAL 8
SIGNAL 9'1
SWEEP TRIGGER
NOTES:
SINGLE BEAM C.R.O.
NOTE B •
------: /
TRACES I TO 4
TRACES 5 TO 8
CAMERA
35mm
NOTE A
CAMERA
35 mm
NOTE A
CAMERA
35 mm ~ TRACE
r::=- ~TIMEBA~E 9SIGNALS N~T:: CHANNELS
'--------. UNBLANKING SIGNALS J I TO 8 (NOTE C)
B. UNIT MODIFIED TO ALLOW C. ALL HORIZONTAL
A. CAMERA SHUTTERS MANUALLY OPERATED
ONE SWEEP WHEN DEFLECTION PLATES TRIGGERED. MUST BE DRIVEN BY A COMMON MANUALLY RESET BEFORE AMPLIFIER. PRIOR TO AND FOLLOWING
TEST. RETRIGGERING.
BLOCK DIAGRAM OF RECORDING EQUIPMENT
~ TRIGGER SIGNAL TO SWEEP GENERATOR
THYRATRON
a:: o f~
GEN ER AL VIEW OF RECORDIN GINS TRUME NTATION
~r----7--~L--7~--~~~L-~~-r--~~~--~~--~
MANUAL TRIGGER
TRrGGER ,..- ~-- -TRIGGER SHORTED
{
I FOIL I FOR CALIBRATION
TRIGGERING LL' DEVICES \.lSW~
SR4 A9 3V
-II +
TRIGGER CIRCUIT
a::
z o ~ <t a:: CD ::J <t U
3V DC
GAGE CIRCUITS
DEI DET DET DET A B C D
CAL. CAL. CAL. CAL. A B C D
-1=-
4-0
-----.J -.l CRACK DETECTOR CIRCUITS
FIG. 4 INPUT CIRCUITS AND RECORDING INSTRUMENTATION
UTPUT
Y
733/8" ====i r-------------------~~------~I ~~~~~-~~~1--,-1-...,
ZIFI-2
16"
~f~ (f~A B (4) C 0 16' E -L _ -:L - - - "- - - -~-<: - X r; Jfit='.I -------r----~'::.---------=t=------~~---------7---
1/ I 212 I
32"
v
TEST CONDITIONS STATIC STRAIN GAGES DYNAM I C STRAIN GAGES
AVERAGE NO. ORIEN - X Y INITIAL ORlEN- X Y Yc INITIAL
STRESS 20 KSI TATION in. in. STRAIN NO.
TATION in. in. in. STRAIN
TEMPERATURE = O°F 10 V +3.5 +1.0 +860 I V 12.0 +1.0 +0.7 + 630
II V + 11.5 +1.0 +680 2 V 35.5 +1.0 +2.7 +715 THEORETICAL IMPACT = 1200 FT LB 12 V +36.0 +1.0 +720 3 V 60.0 +1.0 +3.0 + 660
13 V +59.5 +1.0 +660 4 V 35.5 +1.0 +2.7 + 720
14 V + 3.5 +1.0 +700 o GAGES ON EAST FACE 15 V + 11.5 +1.0 +570 t:) GAGES ON WEST FACE 16 V +59.5 +1.0 +650
5000
NOTE : DETECTORS BROKE AS IND ICATED BY
2500 VERTICAL DASHED
rrCD @H' 4 " LINES II ,i; II II , ,
::t: 2000 I! : : t.) :' i \ z a,-. I 1\ I
~ W I /r® ::t: t.) f500 I \ z I
\ i ! I 0
I
a:: I i i I t.) I ) l I ,-::E : j \ f \ 1 1000 I I
i ~ 1~~ :--z \ I <i .1i ~ ~-- ...... -11 /1:" a:: F':"<~ ',,?, " .J \ - / ' "\ I, .... ._--, ... ,:.
~\ " \ \ I )< __ .~!'J t (f) 500 , ----\ ---\-- --,-~ J \ / "
jJ 0
I\. .
A f3 IC 10
II I I
- 5000
: 0.5 1.0 1.5 2.0 2.5 3D 3.5
TIME - MILLISECONDS
FIG. 5 INSTRUMENTATION AND RECORD TEST
DETECTORS
X NO. SPEED
in. A +12.5 B +24.5
3750
3400 C +36.5
0 +48.5 3450
E +60.5
4.0
13

TEST CONDITIONS
AVERAGE STRESS = IB.O K S I
TEMPERATURE = - BO F THEORETICAL IMPACT = 1200 FT LB
o GAGES ON EAST FACE () GAGES ON WEST FACE
2000
::x:: 1500 (,)
~ "-en w ::x:: (,) 1000 z (5 0:: U
i I
Y
~733/B"--------I Ir-- I
" ," " I
Z2DI-1
CD T A BAC D;tt @ 122 134
fC---"-~-i~--------i------ --------" --r-=- ---- --, - - . - - - .- "---
_ 3 .... " 0
'4) \1.9) \!§!
WEST FACE
.' vA
TT I
16"
1 IX
5 4"
I
STATIC STRAIN GAGES DYNAMIC STRAIN GAGES
NO. ORIEN- X Y INITAL TATION in. in. STRAIN
NO. ORIEN - X Y Yc INITIAL TAT ION in. in. STRAIN In.
10 V 1.0 +1.0 +1340 I V 36.0 +6.0 '+1.5 +160
II V 3.5 ... 1.0 +570 2 V 36.0 + 1.0 +1.5 +300
12 V 35.5 ... 1.0 +320 3 V 36.0 -4.0 +1.5 +450
13 V 59.5 +1.0 ~460 4 V 60.0 + 1.0 +1.4 +480
14 V 3.5 +1.0 +1120
15 V 35.5 +1.0 ... 770 16 V 59.5 ... 1.0 1"790
II
i I /@
~ l /® i (\ II r.... I
'-/ I )~/ \ /
Ii '\ 1\ J ' r, ; I {\ I i I
l!
500 Z <i 0:: ~ (f)
0 ~~ ~\ 1\ 'J !\j
i'V \ / V
j ~/l rv ~I
~ ( \ I
-500
-1000 o
\\ V I
Inl ~'l I t i I\!\
IA ""\ ,B) ~ ,~f \ ~ ~ ~ I ~' I j( : I I I l: : I i
0.5 LO L5 ~O ~5
TIME-MILLISECONDS
FIG. 6 INSTRUMENTATION AND RECORD
j ! l~ j " {
V 3.0 3.5 4.0
TEST
DETECTORS
NO. X
SPEED in.
A 12-5
B 24.5 3700
C 36.5 2850
D 48.5 3450
E 60.5 3250
14

TEST CONDITIONS
AVERAGE STRESS = 18K S I
TEMPERATURE = - 50 F
THEORETICAL IMPACT = 1200 FT LB
o GAGES ON EAST FACE C' GAGES ON WEST FACE
FIG. 7
:::t: (.)
z
" (/) LLI :::t: (.)
Z o a:: (.)
:I I
Z <l a: .... (/)
Y
I
73 3/~
.1 Z2DI-2
r
T • B J D ~ 16"
~~-+-==+----~-----~+--:~4 =----<" -Lx
I
NO.
10
II
STATIC
ORIEN-TATION
V
V
(6 3 7' 32" - \!..1
WEST FACE I ."
I v
STRAIN GAGES DYNAMIC STRAIN GAGES x Y INITIAL in. in. STRAIN 3.5 +1 +800 3.5 +1 +1110
CD
A B C
NO. ORIEN- x Y Yc INITIAL TATION In. in. In. STRAIN
I V 35.5 +1 -0.6 + 640 2 V 36.0 +1 -0.6 + 490
3 V 36.0 -4 -0.6 .. 780
4 V 59.5 +1 +0.9 .. 660 5 V 60.0 +1 +0.9 .. 670 6 V 3!s.f5 +1 -0.6 + 540 7 V 59.5 +1 +0.9 .. 510
I I j NOTE: DETECTORS BROKE
o
AS INDICATED BY -
VERTICAL DASHED
LINES.
E 0~--~-r--~~-r--~~--~~~----4-----~
J I J J I I
I I I
i : : o 0.5 1.0 1.5 2.0 2.5
TIME - MILLISECONDS
INSTRUMENTAT10N AND RECORD TEST
DETECTORS
X NO.
in. SPEED
A +12'.5 .8 +24.5 3050
C +36.5 2800
0 +48.5 2800
E +60.5 2400
15
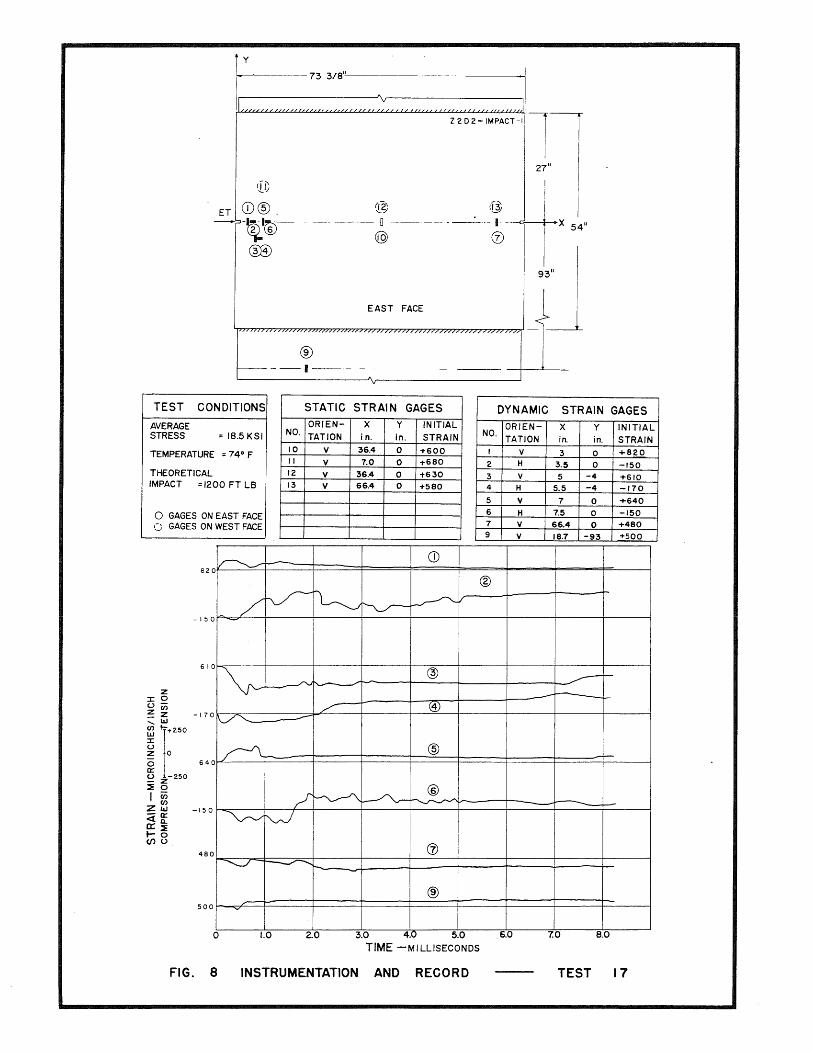
1~~~'-------73 3/8"~'-------------------------I~ ___ , ____________ J~\~ ______________ ,;.,~I
ET CD®. -?-~~-
([®
Z2D2-IMPACT-I II 27" I
I I ~X54"
I
(@ (@ ------ 0 -- --- --~---- I
@ (j)
93"
® f--- - --- I ---- - - ---- --I-~-
A
v
TEST CONDITIONS STATIC STRAIN GAGES DYNAMIC STRAIN GAGES AVERAGE OR/EN- X Y INITIAL STRESS = 18.5 KSI NO. TATION in. in. STRAIN
TEMPERATURE =74°F 10 V 36.4 0 1'600 II V 7.0 0 1'680
THEORETICAL 12 V 36.4 0 -t630 IMPACT =1200 FT LB 13 V 66.4 0 +S80
o GAGES ON EAST FACE () GAGES ON WEST FACE
CD
-150 "'='" I ,
Z :I: 0 U(i)
~ ~ -170~ ....... _. -'-_~_
OR/EN- X Y INITIAL NO.
TATION in in. STRAIN I V 3 0 +820
2 H 3.5 0 -ISO
3 V S -4 .... 610 4 H S.S -4 -170
S V 7 0 .... 640
6 H 7.S 0 -ISO 7 V 66.4 0 .... 480 9 V 18.7 -93 +500
®
rl:"O ~ @_ o 640Li~--~~~~======~====~======~=====i======~====~~--~ ex: ~ Z-250
~o
I~ ZW <ig: o:::~ .... 0 (/)U
/~~~~- ---~ -15 0 k-~----lW--I--+---+---+----+---+---+----=-t-----l
480~ ____ ~ __ ~=-~ ____ ~ ______ ~~CV=7 __ ~ ______ ~ ____ ~ ____ ~ ____ ~ ~ ~~-----~-~----~------i------1------i------i-
® 500 ""V
o 1.0 2.0 3.0 4]) 5.0 6.0 7.0 8.0
TIME - MILLISECONDS
FIG. 8 INSTRUMENTATION AND RECORD TEST 17

ET
y
Jr--. --733/8" ------+ij It -.J'
Z202-1
A B C D E
C?-~I -~- +--ttl~ct @ @ @
:;0.,-0 --- -----0 -- - -- --tr-C:
Q~ ~~ t@
WEST FACE
® ®
D 1[':4' 104"
--- I -- -- ---- 1--- --c-
TEST CONDITIONS STATIC STRAIN GAGES DYNAMIC STRAIN GAGES
AVERAGE STESS = 18.5 KSI
TE MPERATURE =+ 8°F
THEORETICAL IMPACT = 1200 FT LB
o GAGES ON EAST FACE C:: GAGES ON WEST FACE
Z :x: 0 u U5 ~ z
w
510
570
"' '1+250 - 200 C/)
W :x: u fo z (5
! a: 1-250 530 U
::=E z 52
I C/) C/)
Z w a:
<t a.. 540 0: ::=E t- O en U
400
430
NO. OR IEN- X Y INITIAL TATION in. in. STRAIN
10 V 6.0 -II +470
II V 36.0 -II +590
12 v 66.0 -II +590 13 V 6.0 -II +620
14 V 36.0 -II +630
15 V 66.0 -II +680
.,r-/'J{
J ~~ CD
®
Q)
-- @
@
@
®
o 1.0 2.0 3.0 4.0
TIME -MILLISECONDS
FIG. 9 INSTRUMENTATION AND RECORD
NO. ORIEN- X Y INITIAL TATION in. in. STRAIN
I V 3.0 0 +510 2 V 36.5 0 +570 3 H 37.0 0 -200 4 V 64.2 0 +530 5 V 70.2 0 +540
8 V 18.7 -104 +400 9 V 54.7 -104 +430
-
5.0
TEST 18
• ( ~ ( .. C .. .. c a

1
y
~------------------~~
73318'~
TEST CON OITIONS
AVERAGE STRESS ,. 20.5 KSI
TEMPERATURE --7 e F
THEORETICA L IMPACT . 1200 FT LB
o GAGES ON EAST FACE
() GAGES ON WEST FACE
::J: U Z
~ W ::J: U Z
o a: u ~ I
Z
<x: 0::: t(J)
FIG. 10
~-----.--
Z2.D2 2 I 16"
EAST FACE
® ® - t-- _. - ~ ." -+
" v
STATIC STRAIN GAGES DYNAMIC STRAIN GAGES
ORIEN - X Y Yc INITIAL NO. TATION in. in. in. STRAIN NO.
ORIEN- X Y INITIAL TAT ION in. in. STRAIN
10 V 1'7.0 -11.0 + 700 I H 36.0 0 -toO.6 -340 II V +36.S -11.0 + 620 2 V 36~ 0 +0.6 +470 12 V +66.4 -11.0 + 590 3 H 60.!5 0 0.0 -30
13 V + 6.0 0 +S80 4 V 61.0 0 0.0 +550 14 V +70.4 0 +870 5 V 36.5 0 1'0.6 +940 IS V + 7.0 -11.0 +710 8 V .54.7 ~04. 0.0 +490 16 V +36.S -11.0 +670 9 V 18.7 -104. -0.6 +490 17 V +66.4 -11.0 +710
2500
1500
I I I ~\ NOTE:DETECTORS BROKE
20 0 0 I-------+--jl-I,I\ --+: T-, +------t- AS IN D I CA TED 8 Y -
L ~: VERTIcAL DASHED
)'\ :\ :' ,I "
LINES
/( " :' I ::
) \ I'
I Ill:
500 :--.~ ___ -- __ _ ~V \
I
500 F=-=~t>~ ~ f-<® 0./ ~-........ ~j--...-,~"----,~ ~AIB Ie IDEI' V---" :: : : :;r-~ 1'-----""
I I I I I : I I : I
-500 0 0·5 1·0 1·5 2·0 2·5 3'0
TIME- MILLISECONDS
INSTRUMENTATION AND RECORD TEST
DETECTORS
X SPEED NO.
in. A +10.5
B +19.5 3750
C +37.5 3800
0 +54.0 3450 I
E +69.5
19

lY I \-. ----------731/4"
.--------~-------------------~ ~\\\\\\\\\\\\\\\\\
ZICI-IMPACT -rr (161 115, 1141 I I
::J'---D@ ------~t0--------/~--. -, r I lP:® @ ,I,,, I 54"
E'~:l ·;-C2~-------------------c ! J x
~~ (~)
EAST FACE
'\\'\\\\\\\
I
TEST CONDITIONS STATIC STRAIN GAGES DYNAMIC STRAIN GAGES
AVERAGE NO. ORIEN- X Y INITAL ORIEN- X Y INITIAL
STRESS = IS.OKSI TATION in. in. S:rRAIN NO. TATION in. in. STRAIN
10 V 61.25 +11 +630 V 4.0 +3 '+640 TEMPERATURE = S5° F II V 36.0 +11 +560 2 H 4.5 +3 +160
THEORETICAL 12 H 35.75 +10 -160 3 V 5.0 0 -170 IMPACT = 1200 FT LB 13 v 13.25 +11 +620 4 H 5.5 0 +620
14 V .61.25 +11 +420 5 V 4.0 -3 -150
15 V 36.0 +11 1'540 6 H 4.5 -3 +440
0 GAGES ON EAST FACE 16 v 13.25 +11 +570 7 V 9.0 0 +420
() GAGES ON WEST FACE 8 H 9.5 0 +410 9 V 5.0 0 +360
Q) 640
® 160 ---~
-170 @ - -.,... "' ....
Z :x: 2 ....... @ u(/) 620 ZZ "'-" -LIJ
~r" ® ~ 0 -150
0 ~ -250 -0
@ ::1:-I~
ZLIJ 440
-I----' -0:: <ta. 0::::1: 1-0 CJ)u (f)
420
I ....
@ 410
'\oJ'
®
------
360
0 1.0 2.0 3.0 4.0 5.0
TIME -MilliSECONDS
FIG. II INSTRUMENTATION AND RECORD TEST 21

yjl------73 1/4" I II....--------v"'-----
ZICI-I
T A B c
L ~-- ---t----------- 1 - ~-r =~f---=----T ---- ;~ 2
TEST CONDITIONS AVERAGE STRESS = 18 KSI
TEMPERATURE = -10 0 F
THEORETICAL IMPACT = 1200 FT LB
o GAGES ON EAST FACE
(; GAGES ON WEST FACE
FIG. 12
:L: U Z
"C/) LIJ :L: U Z o a: 52 ~
I z <i 0:: l(/)
WEST FACE
® -.------- I
1\ v
STATIC STRAIN GAGES
x Y in. in.
10 V 12.0 0
II V 36.0 0
12 H 37.5 -1.0
13 V 60.0 0
14 V 12.0 0 IS V 36.0 0
16 V 60.0 0
INITIAL STRAIN
+630
-1-560
-160
+620
+420
+540 +570
® 1000~
X
/~ I I I \
I I I \
1.0
® 1--
DYNAMIC STRAIN GAGES
NO ORIEN• TATION
x Y in. in.
Yc INITIAL in. STRAIN
I V
2 D 3 H
4 V
lS H 8 V 9 V
37.0 0 +3.5 + 640
37.lS "O.S +3.5 + 160
~7.s 0 +3.5 -170 61.0 0 +3.5 + 620 61.5 0 +3.5 - ISO
18.6 -104 . '1'2.4 + 42lS S4.6 -104 '1'3.5 + 390
NOTE: DETECTORS BROKE
/.5
AS INDICATED BY VERTICAL DASHED LINES.
2.0 2.5
TIME - MILLISECONDS
INSTRUMENTATION AND RECORD TEST
DETECTORS
NO_
A B
c D
E
22
X in.
12.5 24.5
36.5 48.5
60.5
SPEED
3300

Y
t 731/41~
II rv- ~i
I
TEST CONDITIONS STATIC STRAIN GAGES DYNAMIC STRAIN GAGES AVERAGE ORIEN- X Y INITIAL
NO. ORIEN - X Y Yc STRESS : 18 KSI
NO. TATION in. in. STRAIN TATION in. in. in.
TEMPERATURE :, -II 0 F 10 V 14.5 0 +620 1 V 8.0 0 0.3
II V 35.5 0 +660 2 V 15.0 0 0.7 THEORETICAL 12 V 56.5 0 +630 3 V 22.0 0 1.3 IMPACT = 1200 FT LB 13 V 14.5 0 +530 4 V 29.0 0 2.2
14 V 35.5 0 +530 5 V 36.0 0 3.0 15 V 56.5 0 +570 6 V 43.0 0 3.4
7 V 0 3.5 30.0 o GAGES ON EAST FACE 8 V 37.0 0 3.5 ':) GAGES ON WEST FACE 9 V 64.0 0 3.5
I U ~ '(J) W I U Z o a:: u ~
I z ;;X a: .... (/)
1500r------r------H---~~~--~------4_----_4------4_----~
/\/@C;; ®I\ ® { \ /\ (/ /
looor-----+-----+/~-~il~4h~41--~----_+----~~----+_--~
~5' !0.'/: \ .,y. \ /1 \
t=;;;S;;::::1;_ ~- -:: - . - )< A 500~----_r~~~r+~vL+H--+_~~----4_----_4------4_----~
",~~ \ I I I ~tt::r-=~ _/' -__ --~
[\--\"-r-----r-- -t------~ 0r-----_r------r-----~q_~~------4_----_4------4_----~
'v'-'~_<::::~ -::::==::~. ~~,
-500r-----_r------r-----1-----~------4_----_+------4_----~
-1000 0~----0~.~5------1.~0----~1.~5-----2~.-0-----2J.-5-----3~.0------3~.5----~
TIME - MILLISECONDS
INITIAL STRAIN .+ 6/0 + 820
+ 620
+630
+670 +670
+640 +630
+620
FIG. 13 INSTRUMENTATION AND RECORD TEST 23

y
r--------73 114"'-------------..J
II -----vI' ZIC2-1
1 CD @) ® --- -1------ -1- - -- - -1----- 16" T
~. ® ® ® -1x -~=--.~-:.---""-=_=._'=III----_==_=_==__~~.........c
@ @ @ (l3) @ t~
-I- :-1- -t- --@ ® ®
54"
WEST FACE ~ I vA
TEST CONDITIONS STATIC STRAIN GAGES DYNAMIC STRAIN GAGES AVERAGE STRESS = 18 KSI
TEMPERATURE = + 5° F
THEORETICAL IMPACT = 1200 FT L B
o GAGES ON EAST FACE
\~~ GAGES ON WEST FACE
10RIEN-NO. TATION '
10 I v II I v 12 I V
13 I V
14 I V
15 I V
'I
I I
x y INITIAL in. in. STRAIN
12.5 0 +480 3S.!i 0 +470 SO.!i 0 +490 12.5 0 +S40
3S.5 I 0 "'S30 SO.5 0 +610
NO. ORIEN - 1< y Yc INITIAL TATION In. in. in. STRAIN
I V 12.0 + 8.0 ' +O.!i +570
2 V 12_0 0+0.5 +470
3 V 12.0 -16.0 +O.!i +570
4 V 36.0 +8.0 -0.3 +550 5 V 36.0 o -0.3 +480
6 V 36.0 -16.0 -0.3 +540 7 V 60.0 + 8.0 -0.1 +555 8 V 60.0 o -0.1 +500 9 V 60.0 -16.0 -0.1 +540
200Ga------r---~/+·T_~--+_--_+----~---~--~--~ ® / \~
Z <t 0:: l(/)
r-.. / : -- ----, ---"j :
1500; \ I
\/----r---_ " '/
t :' ®', \ v-(v l : y-.. /1
1000: ~: f ~/ .--I . \~ ..... ,' ,t.._ --" ....
I ;t-.) _-_. ~ I 500 ~t::~( . ---~ f
\ I-,,\:.t-\j§J -- -i;
./', /, ,~-~--- r-- '-v'
- , -,,---------/' ~--_/' \ ...... -------
@ __ <~<~:::~ .):---___ -_ -_.J'
O------r~~~~--_+---=+_--_4----~-----~----~ -", CD ,~\
\~---- I \ -- --------"_,,J" \\, ..... , ... '-,_ .... __ ... _____ " .... _ ....... ___ ............. ___ _
-500r------r----~------1_----_+------+_----_+------+_----~
-10000~----~0~5~--~I~.0~----~1.5~--~2~.0~----2~.~5-----=3~.O~--~3~.5~--~
TIME MILLISECONDS
FIG. 14 INSTRUMENTATION AND RECORD TEST 24

y
Ir--__________ /'--73 114"~
32" ® ® ® ® ® ® ET __ =>---"'-'"I"'---::OI==--::I-=-:..-)=---=1)-::.--==-II-::.-..::.:..:r.::--=u .... .::---=J::.-:..--~-i: -.----X i
@ ® @ I @ (~ @j I~"
WEST FACE
I
TEST CONDITIONS STATIC STRAIN GAGES DYNAMIC STRAIN GAGES
AVERAGE STRESS = 18 KSI
TEMPERATURE ::-. + 2° F
TNEORETICAL I M PACT = 1200 FT LB
o GAGES ON EAST FACE
C GAGES ON WEST FACE
2500
fj) 'I
2000 I U
~ 'I
" ...... " : ' en
w 1500 , , I u Z
I 0 c::
I I , CD : :
LX' ' , / l/
~ 1000 ~
I ~ <l
!-"-<---~ -
1 I
0:: 500 .....
ff)
'-0
NO. ORIEN- X Y INITAL TAT ION in. in. STRAIN
10 v 14.5 0 +610
II V 35.5 0 +590 12 V 56.5 0 +560 13 V 14.5 0 +570 14 V 35.5 0 +610
15 V 56.5 0 +610
(i.,@ " ,;
@) II ',~ il Ii I' , . i
~ !( , ~
" n I. , \ I i I I,
J I
II I I ,I I ) , } ; I I I I
I I J , ' I ' , \ '
I .': ( 1 I / \ ,
I ' ,
... / i / I f'l._ -I I
, I i ~--- .. I .. .' ~ \, --- ---- '---
- ---- -....... -
f--~-C:::::-"'=
----- --- ---::::-::~
NO. ORIEN - X Y Yc INITIAL TATION in. in. in. STRAIN
I V B.O 0 +0.5 + 590
2 V 15.0 0 +0.8 + 610
3 V 22.0 0 +0.7 +610
4 V 29.0 0 +0.7 +560
5 V 36.0 0 +0.9 +600
6 V 43.0 0 + 1.0 +610
7 V 50.0 0 +0.9 + 620
8 V 57.0 0 +0.9 + 610 -9 V 64.0 0 +0.8 + 610
.--.-----:::--:: t;~:-~7- r---~::: ---:.:.-~- -- --' ./ ----/ --- ---------~ "'--,
0.5 1.0 1.5 2.0 2.5 3.0 3.5 4.0
TIME -MILLISECONDS
FIG. 15 INSTRUMENTATION AND RECORD TEST 25

y !f------------73 114"!..-' --------1
1 'Ir--
Z2C2-IMPACT 11 CD @® Q@ @@ 00 @ Q3) ~ P--~-O-+--I-[}----Or ---01--1-0 _._c= --1 x 1
'r~):7: @', 'i?;:g· @: ~[g'
54 N
EAST FACE
T EST CONDITIONS STATIC STRAIN GAGES DYNAMIC STRAIN
AVERAGE STRESS = 18.0 KSI
TEMPERATURE = 78° F
THEORETICAL IMPACT = 1200 FT LB
o GAGES ON EAST FACE () GAGES ON WEST FACE
~ u ~ z " 0 en U5 UJ ~ Z U UJ z
1:"0 0 n:: u i 0 1-250 0 Z 10 0 II U5 ~ en u w z a::
a.. ~ 0 U
Z <{ a:: I-CJ)
NO. ORIEN-TATION
10 V
II V 12 V 13 V 14 V 15 V 16 V 17 V 18 V 19 V
560 .~
560 r--------' i
i i
i
520
,
470
460
i 490
650
I I
I 710
i
o 1.0
X Y INITAL in. in. STRAIN
ORIEN-NO.
TATION 13.3 0 ... 530 I V
25.3 0 +510 2 V
36.3 0 "i-480 3 V
49.3 0 "i-480 4 V
61.3 0 ... 510 5 V
13.3 0 1"640 6 V
25.3 0 +690 7 V 36.3 0 ... 730 B V 49.3 0 +710
61.3 0 't"660
CD ---v-- c- •.• _ o.
.~ ®
~ -
I
@ ~ -
I ! @
® "-"
...... ® -:::.
(J)
®
2.0 3.0 . 4.0 5.0
TIME - MILLISECONDS
FIG. 16 INSTRUMENTATION AND RECORD
X Y in. in. 9.3 0
16.3 0
23.3 0
37.3 0
51.3 0
58.3 0 16.3 0 37.3 0
-=-
--
~ .-
TEST
GAGES
INITIAL
STRAIN +560
+560
+520 +470
+460
"i-490 "i-650.
+710
30

y1 .... ·------73 1/4"
-J' "
Z2C2-1
A B C D E
E.T. @P-~-~~~~F~ Q5 1§ fj) C!:~ ~B ~(~
WEST FACE ,\'
'] .J'
T EST CONDITIONS STATIC STRAIN GAGES DYNAMIC STRAIN GAGES
AVERAGE NO. ORIEN- X Y INITAL NO.
ORIEN- X Y Yc INITIAL
STRESS ::: IB.O KSI TATION in. In. STRAIN TAT ION in. in. in. STRAIN
1 V 15.0 0 +0.1 -t-490 TEMPERATURE = - 3° F
THEORETICAL
10
II
12
v V
V
12.0 0 24.0 0
37.0 0
+510 +480 2 V 22.0 0 +0.1 +460
+480 3 V 36.0 0 +0.9 +470 IMPACT ::: 1200 FT LB 13 V 48.0 0 -t-5/0 4 V 50.0 0 +1.6 +520
14 V 60.0 0 +530 5 V 57.0 0 +1.8 +560
15 V 12.0 0 +660 6 V 64.0 0 +2.3 +1560 o GAGES ON EAST FACE 16 V 24.0 0 +710 7 V 36.0 0 +0.9 +710
17 B V 57.0 0 +1.8 +6150 o GAGES ON WEST FACE V 37.0 0 +730 18 V 48.0 0 +690
FIG. 17
19 V 60.0 0 +640
3500~----+------4-------~---~---41~~~~---~-----~---~
3000~-----+------~------r-----r--~--+-----'-+------~----~
~J i
2500r-----~-----~------r_----_+--!~~4------4-----~----~
J
I. \ I ~@ 2000r-----_+------1_------r_-----r-+-r~~lfi~ ,~~~~~~~~4_--~~
i VI ~V-i !/® J r I'V
1500r----_+------1_------r------r~+---~1I------+_----~-----~
.. il I A 1000~:----_+------1_-----r_----_r¥/~--_7~------+_----~-----~
j"'>J1/ .... i') - _.- -'-'- -- _.- -!---:rr-./ ~ ---------r------~----------./'-),
~oo ._'0 . ._ _ •..••. __ ... __ ,_._ ........ ~
~-'
°0~---~0~.5~-~1~.0~-~1.~5--~2.~0---~2~.~5--~3.~0~-~3.~5--~4.0
TIME -M 1 LLiSECONDS
INSTRUMENTATION AND RECORD TEST 31
DETECTORS
NO. X
SPEED in.
A 12.5
B 24.5 3450 2150
C 36.5
0 48.5 2400 3250
E 60.5

TEST CONDITIONS
AVERAGE STRESS = 18 KSI
TEMPERATURE = -1 0 F
THEORETICAL IMPACT = 1200 FT LB
o GAGES ON EAST FACE C GAGES ON WEST FACE
1000
NO.
10
" 12
13 14
15 16
17 18 19
Y
1--------73 1/4''--' ----------~
~-------------~~--------~
WEST FACE I ~~~~~ J
STATIC STRAIN GAGES DYNAMIC STRAIN GAGES
NO. ORIEN - X Y Yc INITIAL TAT ION· in. in. in. STRAIN
ORIEN X Y INITAL TATION in. in. STRAIN
v 12.0 0 +490 1 V 15.0 0 +2.0 +570
V 24.0 0 -+510 2 V 36.0 0 +6.6 +550
v 37.0 0 +550 3 v 50.0 0 +7.2 +550
V 48.0 0 +520 4 V 57.0 0 +7.1 +540
V 60.0 0 +540 5 v 64.0 0 +6.8 +510
V 12.0 0 +550 6 V /5.0 0 +2.0 i'610
V 24.0 0 -+510 7 v 36.0 0 +6.6 + 630
V 37.0 0 +620 8 V 57.0 0 +7.1 + 570
V 48.0 0 +510 V 60.0 0 -+640
~ r @
Cf /\1 j\ ,\
500
II / ~n ~ r-' \ \ .. ~ ~.-I-...I \ .
I (.)
0 ~ ....... en w
\ , ,-
~ 1 t----.... --- -.... ~ ~ ./"'0.. ~
: ~ ... . "-'.\' 17-.----..... ~::::::-:=:-----.-. . ,:",---._..--
\ ~/ '"' ..... -~/ /----.... , . r-:::-"..-=---:J::.~ ;:--:;::--=~/- --- -----~
I (.) Z 0 a:: (.)
~ CfJ 0 I
z 1000 <{ a:::
f'l ~ (~
j l\ /{ I-(f)
500 ~\ / ./ \
~ '\ ' ~ .... ~~
i
o
-500 o
FIG. 18
\ -v \ \ \, \ I
~ \ \ j
'l ~ \ r, .....---.-~ , ' , "--__ 0, . -~~- p-.::;::.;:.- - -, I ..... /~"'--
,}
0.5 1.0 1.5 2.0 2.5 3.0
TIME - MILLISECONDS
INSTRUMENTATION AND RECORD
~ -~ ~
3.5
TEST
DETECTORS
X NO. in. SPEED
A 2.0 3150
B -'2.5 C 24.5 D 36.5 E 48.5 ;
F 605
32

I <.:> ~ '-(f) W I <.:> z 0 a:: <.:> ~ I z <r 0:: I-Cf)
(REFER TO FIG. 13)
T=O.OO 0
T=0.25 0
T= 0.50
EDGE OF PLATE GAGE
5 6 7
.-8 9
O~----------------~--~--~--~--~--~
T=0.65 0 0 0 It)
+
0
T= 0.85 g 0 It)
I
I T= 1.05 0
I T= 1.16 r. v
-- EDGE OF PLATE
5 6
T=1.23 I 0
GAGE
7 8
-9
T= 1.40 I 1 O~--------~~~~~~
I T=1.54 I 0
T=1:68 I I I 0 I
I I T=1.80 I I 0 .
T=2.00 I I 1 0 • I
FIG. 19 STRAIN DISTRIBUTION AT VARIOUS TIMES TEST 23
!)
i ~

EDGE OF PLATE r EDGE OF PLATE
GAGE ( REFER TO FIG. 15) GAGE I 2 3 4 9 I 2 3 4 9
T = 0.00 0
T = 0.20 0
T= 0.90 0 .
I
I T= 1.00
I 0 - .. I T =0.40
::t: 0 c..> ~
" 0 en I.Ll 0 ::t: IC) c..> + z (5
T= 1.65 a::
I c..> T=0.42 0 ~ 0 - I 0 • I
z <t a: 0 I- 0 CJ)
IC)
I
I T= 0.60
0 ""
T=0.65 T=1.77 ,., II
0 -"" .. II .. T: 1.82 I 0 • . T= 2.20 I T= 0.80 a II
0 I
FIG. 20 STRAIN DISTRIBUTION AT VARIOUS TIMES -- TEST 25

EDGE OF PLATE EDGE OF PLATE
GAGE (REFER TO FIG. 17) GAGE
I 2 3 a 7 4 5 a 8 6 7 5 8 8
T = 0.00
0
T = 1.32
0
T = 1.47
T = 2.31
0
0 :I: U ~ '- 0 T = 1.60 C/) w 0 :I: In U + z 6 0 a: u ~ 0
I z ~ a::: 0 .- 0
In en I
T = 1.67
I T = 2.45
0 0
-
T = 2.59
0 T = 2.20
0
FIG. 21 STRAIN DISTRIBUTION AT VARIOUS TIMES -- TEST 31

EDGE OF PLATE EDGE OF PLATE
GAGE (REFER TO FIG. 18) GAGE
156 257 3 458 5 156 2 e 7 3 458 5
T= 0.00
O~-----JL---------~----~--~--~--~
T = 0.97
o f
T = 0.36
O~ ____ ~~ ________ AL ____ -J __ ~ __ ~ __ -4
T = 1.17
~ r
T= 0.46 0
0 I
:::t: Co)
~ ....... 0 CJ') IJ.J 0 :::t: 10 Co) + z
T= 1.26
I 11 t
(5 ex: Co)
~ 0
I T = 0.52 0 Z ~ a:: 00
I .... 0 10 en I
T = 1.44
~ • f
0
T= 1.70
J1 r I • 1
T = 0.65
I 0 I 0
T = 2.00
n f
. I r I o
FIG. 22 STRAIN DISTRIBUTION AT VARIOUS TIMES - TEST 32

w (!)
o w
o
3750 3400
TEST
NO.
NOMINAL TEMP.
STRESS KSI DEGREE F
1-------- ______ ?_2 Q.~ ______________ ~~ 13 20 o
3700 2850 3450 3250
3050 2800 2800 2400
4350 ON EAST FACE f- -2H)o-or,rWtsi-FA~ ]
14 18 -8
15 18 -5
3750 3800 34_~
J
en t-Z I.LI 60 ~ W a: ;:> Cf)
~ w ~ 40
u.. 0
ci z 20 -.J
~ 0 t-
u.. 0 0
~ 0
FIG. 23
3750
2
I--
r---
r----
J (\J
I -
75!0 1--------- --------~
r----~~~Q----- - ... ,
~-----g~~~-- ---- ~ 3900. 26~ 0 4850 365Q -=----,..-- +-- --t-o- --.;
3 4 5
DISTANCE - FEET
6
FRACTURE SPEED MEASUREMENTS
NOTE:
19 20.4 -7
22 18 -10
23 18 -II
24 18 +5
25 18 + 2
31 18 -3
32 18 -I
NOTE: --S PE ED DETECTORS
- - - - - STRAIN GAGE
I 2.5 STRAIN GAGE MEASUREMENTS
~ 2.1 ORACK DETECTOR MEASUREMENTS
n I J - ..
~ <:t It) CD I'- CD I I I I I I (\J r0 ..;t It) CD I'-
i SPEED XIOOO FPS.
MEASURED SPEED DISTRIBUTION
FRACTURE SPEED IN SIX FOOT WIDE STEEL PLATES

z 3: 0 :I: U)
(!)
z c ~ 0 ..J
0 t-
(!)
z c z 0 0-U)
UJ a: a: 0 (,)
-c:
~ :::l..
z <t a: t-en
E~ST FACE)
WEST FACE
STRAIN DETERMINED BY
SR-4 TYPE A-7 GAGE
10,000 EAST FACE~ •
20,800
WEST FACE~ 20,000 I y-"\ I
;/. I 2300 k /' I
SpOO ( I llMMEDIATEL Y / I BEFORE FRACTURE I 18,000 / OF PULL PLATE) I I I I I
6,000 f I
" 16,000
4,000
14,000
2,000 r 1 I __ =-- 12,000
1,000
0
/'- ..... / ......
/ ............ "- LOAD = 1700k /
/ /
1,000
8,000 0
I'oo:r--__ -LO!.?-=~~::>!j
6,000
I'OOO~ ________ . ___ ~~~_D_=U ~~~j I I I I I I I I I 0 I
___ ~ ___ ~_A~=:~:k ] I
'.oo:b I I
--..,j,
06 6 5 4 3 2 I 0 5 4 3 2 PLATE WIDTH (FT) PLATE WIDTH (FT)
FIG. 24 DISTRIBUTION OF STRAIN ACROSS PLATE
VARIOUS LOADS DURING PRESTRAINING TEST
0
FOR
32

TEST 18
TEST 30
·FIG. 25 ,TYPICAL PHOTOGRAPHIC RECORDS FOR IMPACT TESTS

-FIG. 26 PHOTOGRAPHIC RECORDS FOR TEST 23

TEST 15
TEST 19
TEST 32
FIG. 27 TYPICAL CRACK PATH.S

TEST 12
TEST 20
FIG. 28 CRACK PATHS FROM TESTS WITH NO RECORDS

TEST 24
TEST 32
FIG. 29 TYPICAL CRACK TEXTURE AT INITIATION EDGE

Z2D2-1 NObs 65790
18 K51. O°F 1200 FT - La 28 MAR.. -56
FIG. 30 REINITIATION OF FRACTURE FROM PARTLY
SUBMERGED CRACK ... TEST I 8
FIG. 31 BRANCHING OF CRACK NEAR CENTER OF
SPECIMEN TEST 20

ZIFI-2 NObs 65790
ZOKSI- 1200n·L8-(Jf TESTED 7 DEC. J55
h' l:. ;·--'i .. ~.:!~~,~
\ 't' 1· ',' . ;:;}":r¥-':-,, ,
;:
1
t i
I-I
~~ __ -=-4 ____ ._.
Z2DI-NObs G5790,
18 ~Sl 1200fT-LB O· F TESTED 19JAN.'56
FIG. 32 VARIOUS SECO~JDARY CRACKS
TEST 13
TEST 14
TEST 15

FRACTURE PATH
LOWER PORTION OF FRACTURED PULL PLATE SHOWI N G STR AI N LI N ES
FRACTURE SURFACE IN REGION OF INITIATION
TENSILE TEST DATA FOR A 285 GRADE C FLANGE STEEL
YIELD
STRENGTH
KS I
.37.2
ULTIMATE
STRENGTH
K S I
58.3
ELONGATION
IN 2 IN.
31
CHECK ANALYSIS OF A 285 GRADE C FLANGE STEEL
C Mn P S
0.25 0.49 0.016 0.040
FIG. 33 PULL PLATE FRACTURE