STUDIES OF ADVANCED ELECTRIC POWER GENERATION TECHNIQUES ... · studies of advanced electric power...
134
STUDIES OF ADVANCED ELECTRIC POWER GENERATION TECHNIQUES AND COAL GASIFICATION BASED ON THE USE OF HAT CREEK COAL Prepared for BRITISH COLUMBIA HYDRO AND POWER AUTHORITY and ENERGY, MINES AND RESOURCES CANADA INTERCONTINENTAL ENGINEERING E.P.D. CONSULTANTS SHAWINIGAN ENGINEERING COMPANY THE LUMMUS CO. CANADA LTD.
Transcript of STUDIES OF ADVANCED ELECTRIC POWER GENERATION TECHNIQUES ... · studies of advanced electric power...

STUDIES OF ADVANCED ELECTRIC POWER
GENERATION TECHNIQUES
AND COAL GASIFICATION
BASED ON THE USE OF HAT CREEK COAL
Prepared for
BRITISH COLUMBIA HYDRO AND POWER AUTHORITY
and
ENERGY, MINES AND RESOURCES CANADA
INTERCONTINENTAL ENGINEERING
E.P.D. CONSULTANTS
SHAWINIGAN ENGINEERING COMPANY
THE LUMMUS CO. CANADA LTD.

TABLE OF CONTENTS
VOLUME 1
I PREFACE
II SUMMARY REPORT
STUDY TERMS OF REFERENCE
Ill BASE CRITERIA USED FOR STUDIES
VOLUME 2
IV STUDY A - FLUIDIZED COMBUSTION
V STUDY B - COMBINED CYCLE GASIFICATION
VI STUDY C - SNG, MEDIUM AND LOW Btu GASIFICATION
VOLUME 3
VII STUDY D - ALTERNATE FUELS FOR BURRARD THERMAL GENERATING STATION
VIII LIST OF ABBREVIATIONS
i
I
102
111
129
203
341
409
545

PREFACE
In 1975 B.C. Hydra and Energy, Mines and Resources Canada commissioned five studies to invesltgate potential uses of Hat Creek coal. Three of the studies were directed towards advanced high efficiency, clean methods of generating electric power, and alternatively, to producing synthetic natural gas, while a fourth examined the use of Hat Creek coal in the existing oil/gas fired Burrard plant.
The fifth study was assigned to a ‘coordinating consultant’ who was responsible for c@ordinat!ng the work of the other four studies. The ccmrd;nafing consultant was also djrected to produce a summary report examining and comparing the results which were derived in the other sfudres. The summary report is included in Volume 1 of this report. The three studies examining advanced electric power generation and gasffication are included in Volume 2 and the Burrard conversion study in Volume 3.

SUMMARY REPORT
INDEX
SECTION CONTENTS
1.0
2.0
3.0
4.0
5.0
6.0
7.0
SUMMARY AND CONCLUSIONS. ...................................... 1
PURPOSE OF STUDIES. ............................................... 3
2.1 Introduction .................................................... 3 2.2 Use of East Kootenay Coal. ...................................... 4
2.3 LiquidFuels .................................................... 4
GASIFICATION AND FLUIDIZED COMBUSTION ........................ 5
3.1 Gasification .................................................... 5
3.2 FluidizedCombustion. .......................................... 11 3.3 Fluidized Bed Gasification ...................................... 12
BRlEFREVlEWOFSTUDlESA,B,C&D.. .............................. 14
4.1 Introduction .................................................... 14 4.2 Funding ........................................................ 14 4.3 Sharing of Site Facilities ........................................ 15 4.4 Study A - EPD Consultants/Combustion Engineering Ltd. ........ 15 4.5 Study B - Shawinigan Engineering .............................. 18 4.6 StudyC-TheLummusCo.CanadaLtd .......................... 21 4.7 StudyD-lnteg ................................................ 24
COMPARATIVE USES OF HAT CREEK COAL ........................... 28
5.1 Introduction .................................................... 28 5.2 Hat Creek Coal Properties ....................................... 29 5.3 CostofAlternatives ............................................. 31 5.4 Efficiency of Utilization ......................................... 34 5.5 Energy Cost Related to End Use. ................................. 38 5.6 Combined Generation/Gasification Plant ......................... 41 5.7 District Heating ................................................. 42 5.8 Liquefaction .................................................... 43 5.9 Inflationand Uncertainty ........................................ 43
5.10 Reliability ...................................................... 44
5.11 WaterComsumption ............................................ 44
FUTURE TECHNICAL DEVELOPMENTS ................................ 52
6.1 Conventional Pulverized Fuel Steam Generators .................. 52 6.2 Fluidized Combustion ........................................... 53
6.3 Combined Cycle Gasification. ................................... 55
6.4 SNG Gasification - Advanced Processes ........................ 58
6.5 GasTurbines ................................................... 60
EMISSIONS .......................................................... 69

7.1 SulphurDioxide ................................................. 69 7.2 NOX ........................................................... 69 7.3 co* ............................................................ 71 7.4 co ............................................................. 71 7.5 WaterVapour ................................................... 71 7.6 Particulate.. ................................................... 72 7.7 Noise .......................................................... 72
8.0 RECONCILIATION OF STUDY REPORTS A-D ........................... 74
8.1 Introduction .................................................... 74 8.2 Interest During Construction and Scheduling ..................... 74 8.3 Gasification Costs .............................................. 75 8.4 Gasification Efficiency .......................................... 76 8.5 By-Products .................................................... 77 8.6 PowerCycleCosts .............................................. 77 a.7 Miscellaneous Price Adjustments ................................ 79
9.0 PILOTPROJECTS ..................................................... 80
9.1 Introduction .................................................... 80 9.2 Fluidized Combustion. .......................................... 60 9.3 Gasification .................................................... 81 9.4 Gasification/Combined Cycle. ................................... 82 9.5 FurtherStudy Work ............................................. 89 9.6 District Heating ................................................. 89 9.7 Heat Pump&Domestic Furnaces ................................ 89 9.8 Utilization and Revenue ......................................... 90 9.9 Recommendations .............................................. 90
10.0 REFERENCE COAL AND GAS FIRED CONVENTIONAL PLANTS ......... 92
10.1 Introduction .................................................... 92 10.2 Ash Disposal ................................................... 92 10.3 WaterBalance .................................................. 93 10.4 WaterSupply.. ................................................. 93 10.5 SO,Scrubbing Systems ......................................... 93 10.6 Estimate of Conventional 2000 MW Plant ......................... 94 10.7 Comparison of Estimate with Similar Plants ...................... 94
APPENDIX 1. ......................................................... 98
LISTOFREFERENCES ................................................ 99
TERMS OF REFERENCE .............................................. 102
Study A ........................................................ 103 StudyB ........................................................ 105 StudyC.. ...................................................... 107 StudyD ........................................................ 109
BASE ENGINEERING & COST CRITERIA ............................... 111
APPENDIX6 .......................................................... 118
APPENDIXC ......................................................... 125
APPENDIXD ......................................................... 125
II

LIST OF FIGURES
FIGURE NUMBER
5.1
5.2
5.3
5.4
5.5
5.6
5.7
6.1
6.2(a) 6.2(b)
6.3 6.4
6.5
6.6
9.1
9.2
9.3
9.4
9.5
Emissions from Generating Plants vs Capital Cost ................. Generating Cost vs Coal Cost. ....................................
Comparison of Generating Cost and Emission Levels of Different Generating Plants Against Degree of Maturity .....................
Heating End Use Energy Cost vs Coal Cost ........................
Cost of Energy in End Use vs Utilization Efficiency .................
Energy Utilization SNGlHeat 8 District Heating/Heat Pump PumpAlternatives ............................................... Energy Utilization - SNG 8 Electrical Power Generation ...........
Diagram of Unfired and Supercharged cycles ......................
Simple CycleGasTurbine (197411975) Energy Utilization ............ Unfired Combined Cycle (197411975 Gas Turbine) Heat Utilization
GasTurbinePerformance.. ......................................
Creep Strength for Advanced Turbine Blade Materials ..............
Combined Cycle Efficiency with Different Modesof Cooling ........ Performance Comparison between Exhaust-Heated Unfired-Boiler and Pressurized-BoilerCombinedCycles .......................... Air HeaterCycle - Simplified Diagram ............................
GasTurbine PowerStation with Fluidized Bed Combustion - Elevation ....................................................
GasTurbine Power Station with Fluidized Bed Combustion - Plan .........................................................
Graphical Presentation - Gasification/Combined Cycle Plant ............................................................
From Coal to Synthetic Product - Processing Steps. ..............
45 46
47
48
49
50 51
63
64
64 65
66 67
68
84
85
86
a7 88
III

LIST OF TABLES
TABLE NUMBER
3.1 4.1
4.2
4.3
4.4 4.5
5.1
5.2
5.3 6.1
7.1 7.2
8.1 8.2
10.1 10.2
10.3
ERDA Expenditures ............................................... 11
Adjusted Gasification Plant Costs .................................. 23
SNGCosts ........................................................ 24
Fuel, Production, Transport 8 Storage .............................. 25 Capital Costs, Uninflated .......................................... 25
GeneratingCosts ................................................. 27
Total and Specific Costs ........................................... 32 Cost ($/MM Btu) & Efficiency % of Energy in End Use ................ 39
WaterConsumption ............................................... 44 Predicted Firing Temperatures & Net Cycle Efficiency ............... 58
Predicted and Possible SO, Emissions Burning Hat Creek Coal ...... 72
Predicted NO, Emissions Burning Hat CreekCoal ................... 73
Relative Costs of Gasification Equipment ........................... 78
Relative Efficiency of Integrated Gasification/Combined Cycles ...... 78 Comparative Estimates in$/kW ..................................... 95
Capital Costs for 2000 MW (Net) Conventional Coal Fired Plant ....... 96 Operating Costs - 2000 MW (net) 4 Unit Plant ....................... 97

1.0 SUMMARY AND CONCLUSIONS
The four studies and this summary report provide a comparison of advanced methods of generating electrical power and of coal gasification or liquefaction, using Hat Creek coal. The relative energy costs of electric power and synthetic gas are compared briefly both at the point of production and in final end use.
Although the high inflation rate now in existence makes it difficult to predict future costs, the studies provide relative costs which should be valid for the future.
The summary report also considers advances in technology which may effect the conclusions of the reports. Apart from pressurized fluidized combustion, which is fully described in Study A, advanced gasification combined cycles seem to offer the most potential. Such processes start with the high initial penalty which the cost of the gasification plant represents. In absolute terms gasifying the coal before burning it is an expensive extra conversion step, the cost of which must be carried by the generating equipment. The past achievements of the gas turbine industry and the optimistic predictions which they now make suggest that these processes can be competitive in future for low cost fuels.
While second generation gasification processes may eventually produce improve- ments in production cost, these are unlikely to be large enough to affect the results of these studies.
ELECTRIC POWER GENERATION All the advanced techniques which are examined offer improvements in emission
levels compared toconventional powergeneration.
In assessing the different generation techniques the summary report compares them on the basis of cost, efficiency, level of emissions and degree of maturity. Conventional pulverized coal firing is used as a reference.
Only pressurized fluidized combustion appears to offer large power cost savings with coal priced at about $3 per ton. This process also offers low emission levels, Unfortunately the technique will not be fully developed for 500 MW unit sizes until close to 1990.
The advanced combined cycle/gasification offers slightly lower costs with coal priced at $3 together with lower emissions and reduced water consumption. Again the technology will not be available until about 1990. The high efficiency of such cycles potentially results in the lowest generating cost at coal prices above $10.15lton.
Atmospheric fluidized combustion generates power at about the same cost as conventional coal firing and produces low SO, emissions. NO, emissions are not reduced. The process is less efficient than conventional generation but offers flexibility in burning poor or inconsistent fuels. Atmospheric fluidized combustion should be commercially available at 500 MW in the mid 1985’s if development continues at its present pace.
1

The other generating techniques considered provide lower emissions but at some penalty in generating cost. Conventional coal firing with stack gas scrubbing adds about 1525% to the cost of power. For this premium it offers greatly reduced SO,emissions, but no improvement in NO,emission orwater consumption.
The STEAG cycle, commercially available in the early 1980’s, adds about 20% to the cost of power but eliminates SO,, greatly reduces NO, and reduces water consumption.
Burning low Btu gas in a conventional plant adds 40% to the cost of power but offers the same low level of emissions as STEAG. Water consumption is increased.
SNG GASIFICATION SNG gasification will produce gas at a price which is competitive with the world
market price of oil at $1.87 per million Btu. The gas so produced is relatively free from the effects of inflation because over 60% of its price is in capital charges and depreciation.
The SNG may be economic in supplying existing gas systems, export contracts, and process steam industrial applications. In comparing the cost of energy in end use, it is concluded that electricity generation at Hat Creek provides a cheaper source of power than SNG gasification unless the SNG is used in a process steam/power application.
For heating end use the actual cost of heat provided by SNG heating and resistance electrical heating are similar when the cost of the distribution system and heating equipment are ignored. This I:1 relationship between synthetic gas and electric end use heating costs is so different from the ratio which has been in effect for the last decade that such relative pricing could cause electric heating to make inroads into the gas market.
The relatively high costs of heating energy outlined in the report appear to favour the introduction of heat pumps.
PILOT PROJECTS The Summary Report identifies a number of pilot projects which would be of value
in the development of advanced coal utilization processes in British Columbia, and which would not duplicate work which is being done elsewhere.
In particular, a pressurized fluidized combustion unit employing a gas turbine power cycle is recommended. Such a pilot project could utilize an existing B.C. Hydro gas turbine installation, and could be designed to burn a large range of coals and other fuels.
An important conclusion of the Summary Report is that it is often technically easier to improve the efficiency of energy utilization rather than energy production. For this reason, pilot projects aimed at improving utilization efficiency are also considered, and it is recommended that efforts be made to facilitate the introduction of heat pumps into British Columbia, and to improve the efficiency of domestic gas furnaces.

2.0 PURPOSE OF STUDIES
2.1 INTRODUCTION
The aim of this summary report is to review and compare the alternate uses of Hat Creek coal which are considered in four engineering studies commissioned by B.C. Hydro. The comparison considers present day technology and advances that seem likely to occur within the next fifteen years.
The four engineering studiesare:
Study A E.P.D. Consultants Ltd.; Fluidized Combustion
Study I3 Shawinigan Engineering Go.; Combined Cycle/Gasification
Study C The Lummus Co. Canada Ltd.; SNG, Medium and Low Btu Gasification
Study D Intercontinental Engineering Limited; Conversion of Burrard Thermal G.S. to Alternate Fuel.
These four studies investigate different ways in which Hat Creek coal may be used. Conventional electric power generation by coal fired pulverized fuel boilers is taken as a reference and represents a fifth potential use of the coal. A brief description and costs of such a conventional generating plant, to burn coal or low Btu gas, are included in Section 10of this report.
Studies A and B consider electrical generation from coal by the two methods considered in both North America and Europe to hold the most promise in the short or medium term. These are:
Fluidized Bed Combustion (Study A) Integrated Gasification/Combined Cycle(Study B)
The potential advantagesof these two techniques are:
Low SO, emissions
Low NO,emissions’
High thermal efficiency*
Reduced capital cost through: a) increased use of gas turbines b) decrease in site construction component c) increased modularconstruction
Lower use of cooling water.
‘Pressurized Fluidized Combustion and Gasification/Combined Cycles only.
Study C covers the production of low Btu, medium Btu and pipeline quality gas from coal by available technology and by advanced processes. The resulting gases would
3

be available for power generation, domestic and industrial use, or as the basis for a petrochemical industry. This study investigates Proven and future technology and also investigates coal liquefaction briefly.
Study D investigates the potential use of Hat Creek coal at Burrard Thermal Generating Station.
2.2 USE OF EAST KOOTENAY COAL The use of bituminous coking coal in the Processes which are compared in this
summary is the subject of comments in different parts of the report. In brief, the use of typical Kootenay coal in the different processes would have the following results:
- Fluidized Combustion. Unlikely to have any effect on the atmospheric or pressurized
type. - Gasification. Kootenay coal would not gasify as well as Hat Creek coal in the Lurgi.
There might be difficulties with its caking properties and percentage of fines. It would almost certainly be less reactive and require more steam and oxygen per lb. of coal, and this would also lead to a higher gas exit temperature and lower efficiency.
The performance of the Koppers Totzek gasifier would not be so adversely affected.
Many advanced SNG processes are designed to handle coking coals, and some like the Cogas which Lummus review in Study C, perform better with bituminous coals than sub bituminous.
- Burrard Conversion. Kootenay coal has a lowerash fusion temperature than Hat Creek coal. The rating of the existing Burrard furnaces would probably be lower with Kootenaycoal than the 70% calculated in Study D.
2.3 LIQUID FUELS Although Study C by Lummus evaluates liquefaction of Hat Creek coal, no study
has been made of producing oil as a by-product of electric power generation.
In a number of processes, such as the Ruhr gas or Garrett, the higher fractions of the coal are removed by pyrolysis leaving a residue of carbon plus ash either as coke or char. depending on the coal type. Very approximately 40% of the heating value of the coal can be removed in this way as SNG, oil and tars. The remaining coke or char can be burnt in a power boiler with certain restrictions, which may be severe.
This concept may be important on a national basis as a way of meeting the demand for oil. It does not offer higher energy utilization efficiency but only a means of adjusting the ratioof different energy forms produced.
Among the disadvantages of the concept are:
- It is unlikely to appeal to the utility as it conflicts with its objectives of providing electric power.
- Theoil, tar and gas by-products produced may be in uneconomic quantities.
- The generating plant cost will rise, because of the very difficult nature of the fuel.

3.0 GASIFICATION AND FLUIDIZED COMBUSTION
This section provides a general description of the history and principles of gasification and fluidized combustion.
3.1 GASIFICATION
The detailed examination of alternative gasification plants for Hat Creek which is contained in Study C is necessarily aimed at meeting B.C. Hydro’s Terms of Reference, and in deriving data within a well defined framework of basic assumptions. The study does not attempt to give a simplified overview of the history and principles of gasification, or of some of the development programmes which are in progress. To assist in the overall understanding of Study C, and this Summary Report, a simplified commentary on gasification is incorporated in this section.
3.1.1 HISTORY
A number of coal gasification and liquefaction processes were developed in Europe, particularly Germany, during the 1920’s and 1930’s. The early gasification processes generally produced a medium Btu gas product (300500 BtulSCF) suitable for the existing town gas networks, or a low Btu fuel (<300 BtulSCF) for industrial and chemical synthesis uses. The almost complete reliance of Germany on coal as a source of energy and chemical feedstocks gave a particular stimulus to gasification development in that country.
The advent of cheap natural gas and oil almost completely halted the development of gasification processes, and little work was done for many years, except in South Africa where the development of such processes is seen as a strategic necessity.
In recent years coal gasification has again become the subject of intense development both as a result of dwindling natural gas supplies, and also because of a need for clean sulphur-free power plant fuels.
3.1.2 DESCRIPTION OF PROCESS
In considering the chemical reactions which take place in coal gasification, coal may be regarded as a complex hydrocarbon with a ratio of carbon to hydrogen by mass of between 15:l and l&l. This compares with the mass ratio 3 for methane, 5-6 for light petroleum distillates and about 7 for an average crude oil. In addition to the carbon and hydrogen there is an inert ash content, oxygen, sulphur, nitrogen and other substances such as chlorine.
Low and medium Btu gasification involves the basic reaction;
Coal + Water + Heat (ZOOO’F)-Carbon Monoxide + Carbon Dioxide + Hydrogen
2C + 3H,O co + co2 + 3H,
5

Methane or SNG can be made from low or medium Btu gas as follows:
Carbon Monoxide + Hydrogen-(catalyst) Methane + Water + Heat (65O’F) co + 3H, CH, + H,O
Methane can also be made directly, and this is the aim of second generation processes;
Carbon + Water-Methane + Carbon dioxide 2C + 2H,O - CH, + CO,
It is clear that SNG or methane can only be made from coal if hydrogen is added or if some of the carbon is rejected, as CO,, as a means of providing the 3:l mass ratio required.
3.1.3 CURRENT DEVELOPMENTS IN GASIFICATION In considering the current development of coal gasification, it is Convenient to
separate it into three basic types:
1. Pipeline quality gas to supplement and replace natural gas supplies. Heating value 950-1000 BtulSCF
2. Low or medium heating value gas suitable for power generation. Heating value 100.400 BtulSCF
3. Synthetic gas, generally of low heating value, suitable for the synthesis of various chemicals such as ammoniaand methanol.
At present all techniques aimed at producing pipeline quality gas must produce a low or medium Btu gas as an intermediate step. Some advanced processes attempt to eliminate thisstep.
3.1.4 EXISTING TECHNOLOGY Four important proven gasification processes are now in operation which were
developed in the 1920’s and 1930’s. They are:
PROCESS PRESSURE TYPE GASIFICATION TEMPERATURE
“F
Lurgi Pressurized Moving Bed 1300-1650 (400-500 psig)
Welman Atmospheric Moving Bed 1300-l 65(1 Winkler Atmospheric Suspension 1470-l 830
(Fluidized) Koppers Atmospheric Entrained 1830.2700 Totzek Flow
Each of these processes has its own particular advantages and disadvantages which relate to the method of gasification, the pressure and temperature of the gasification, and the resultant equilibrium reactions which are complex and even now are not always fully understood. The merits of each type of gasifier also relate to the use for which the gas is required.
6

(a) SYNTHETIC OR PIPELINEQUALITY GAS
The economics and feasibility of producing SNG by the Lurgi process are studied in detail in Study C.
SNG, or pipeline quality gas, has a heating value of about 950-970 BtulSCF and generally consists of about 9597% methane. In the production of SNG through a proven gasification process, it is necessary to produce a low or medium Btu gas as a first stage and subsequently clean this gas and turn it into methane. The processes involved in upgrading the low/medium Btu gas to methane are both expensive and inefficient, For this reason it is desirable to produce as much methane as possible in the first stage of gasification process. In this context the Lurgi gasifier is the most effective of the four available proven processes, because its gasification reactions take place at a relatively low temperature and high pressure, and both these factors tend to maximize the formation of methane.
The pressurized design of the Lurgi has a further advantage for SNG production in that the pressure of the raw gas is sufficient to pass the gas through the subsequent clean up and synthesis processes.
A third advantage of the Lurgi moving bed type is that the majority of the liquid fractions from the coal are preserved by the low reaction temperatures and may be extracted from the raw gas. These fractions; tar, tar oil, phenol, naptha and ammonia, have a high commodity value which may have an important effect on overall gas economics.
A lesser advantage of the Lurgi is that the gas flows up through the coal in counterflow mode and is cooled by contact with the incoming cold, wet coal. For this reason, the temperature of the raw gas leaving the gasifier is low, and the amount of heat, which must be rejected in cooling the gas to a temperature suitable for modern clean up techniques, is reduced.
Although the Lurgi process is the most attractive of the existing processes for SNG production it hasa number of serious technical disadvantages:
1. The coal retention time in the gasifiers is long, which means that the specific output of each gasifier is low and a high capital expenditure is required to process large amounts of coal.
2. Until recently it was thought that Lurgi gasifiers could not handle caking coals. This problem appears to have been largely overcome as a result of work done in Scotland.
3. The Lurgi gasifier cannot accept a coal containing more than 7X% fines.
4. The raw gas produced by the Lurgi contains, even with the best gasification coals, only about 10% methane.
The Koppers Totzek process takes place at a high temperature and atmospheric pressure. The high operating temperature, which may be 3500°F at the burner head, allows rapid gasification and a high throughput of coal, but it prevents any valuable liquid by-products being formed. The product gas from a Koppers Totzek gasifier is also substantially methane free, and if SNG is to be the end product expensive and inefficient methanation stage would be required.
The Koppers Totzek process is also less efficient than the Lurgi because the raw gas exists at a high temperature (2300.2700°F) and in cooling it to a temperature at which it can be cleaned there is inevitably a large loss of sensible heat.
7
For these reasons, the Koppers Totzek has not been favoured for SNG production.
The Welman gasifier has not been developed into a large scale unit. The largest Welrnan units process 72 tons of coal per day compared to the600 tons/day of the existing Lurgi units and 1,000 tons/day of the projected five metre unit. The Winkler only gasifies 40% of the coal and is not economic for SNG production.
For the reasons discussed above, the Lurgi has bean universally selected for large North American SNG plants.
(b) LOW HEATING VALUE GAS FOR POWER PRODUCTION
The requirements of the electric utility industry and industrial utility plants are quite different from those of the gas companies, who wish to make a gas with a heating value as high as that of natural gas, and one which is indistinguishable from it. It is possible for utility boilers and gas turbines to burn gas of a much lower heating value than SNG and with a minimum of modification. Consequently the main requirements of any gas which is required for power production is a minimum gas product cost. Low and medium Btu gas can be made at a substantially lower cost per unit of heating value than SNG and such gases are therefore favoured for power production.
If low or medium Btu gas is produced from coal, its energy cost is necessarily significantly higher than that of the coal from which it was made. It is therefore advantageous to~utilize the low/medium Etu gas with the highest possible efficiency, and because it is a high quality fuel suitable for gas turbines this logically leads the use of combined cycles. In such a cycle the low/medium BTU gas becomes the gas turbinr. fuel and is burnt in modified combustion chambers. Low Btu has been burnt in gas turbines for a number of years in Europe, and U.S. manufacturers have now developed suitable combustion chambers. Because the volume of fuel is much higher than the equivalent volume of methane or distillate fuel, modifications must be made to the gas turbine combustion chambers, and the flow of the gas turbine compressor and turbine must be matched. In providing the low/medium Btu gas to a combined cycle, the pressurized gasification systems are at an advantage because further compression of the product gas is not required before it is passed into the gas turbine combustion chamber.
The results of Study C indicate that the Lurgi moving bed process can produce low Btu gas at a substantially lower cost than the entrained flow Koppers Totzek process. This is partly due to the reason given above but also reflects, again, the advantage of liquid byproduct credit which the Lurgi obtains.
(c) SYN GAS FOR CHEMICAL PROCESSES
The classical coal gasification reaction is, in simplified form, C+H,O - CO + H,.
The resulting mixture of carbon monoxide (CO) and hydrogen (H,) is an ideal feedstock for a number of synthesis reactions.
The Koppers Totzek process has generally been favoured as the most economic process to produce syn gas for this purpose. In this case the absence of tars, liquids and methane (CH,) in the raw gas is an advantage because there is no need to extract the liquid by-products, in what may be uneconomic quantities. The high specific output of the Koppers Totzek gasifier vessels and their flexibility in handling different coals are additional advantages.
8

3.1.5 DEVELOPMENT OF EXISTING PROCESSES All four existing processes are now being developed to improve their economics
and overcome technical disadvantages.
(a) Lurgi. Lurgi are developing a larger gasifier vessel, 5 metres in diameter, with a view to reducing specific costs. A single prototype of the large gasifier will be installed in South Africa as part of the second phase of the Sasol development. The transport restrictions of the Hat Creek site would probably preclude the use of 5 metre gasifiers.
- Work at Westfield in Scotland demonstrated that the Lurgi can handle certain caking coals,
- General Electric are working on a coal extrusion feed process whereby the fines can be utilized in the Lurgi gasifier.
- Work is continuing at Westfield on a higher temperature or slagging type of Lurgi in which the bottom ash is tapped off as a liquid. By allowing the ash temperature to rise and the ash to become liquid, the steam requirements of the gasifier are reduced considerably (up to 80% of the steam entering a conventional Lurgi is used for cooling, the remainder is a source of hydrogen and oxygen for the gasification reactions). Early work has suggested the specific output of the gasifier may be increased as much asfourtimes.
(b) Koppers Totzek. Two major development efforts are being undertaken by Koppers Totzek:
- the size and capacity of the gasifiers is being increased. Existing units have two burner heads per vessel but units with six heads are being designed and will be in operation shortly.These units will haveasubstantially highercoal throughput.
- a pressurized Koppers Totzek gasifier is under development which will make the gasifier more suitable for combined cycle power schemes. The pressurized unit should be in the demonstration phase in 1977.
3.1.6 ADVANCED GASIFICATION PROCESSES In addition to development work which is attempting to improve the existing
gasification systems, a great deal of work is being done on the development of new gasification techniques. Most of this work is being funded in the U.S.
The overall objectives of the development work are to reduce costs, to improve efficiency and to improve flexibility by developing gasifiers which can handle any type of coal. There is also a desire to reduce the U.S. dependence on European technology.
Up to 1974 U.S. efforts to develop improved gasification systems were marked by optimism. Claims were made about the merits of different systems, the reduction in gas price which they offered, and the timescale of development, which now appear exaggerated. It was generally thought that the second generation gasification processes might offer a reduction of up to 50% in SNG price. Although it is still recognized that such second generation processes will offer advantages in flexibility, and seem likely to offer an eventual relative saving in cost, these benefits are long term and do not alter current evaluations of the overall merits and economics of gasification. There is a feeling of frustration in the U.S. over delays in the development of new systems and the extended timescale.
9

In Study C Lummus confirm that second generation technology does not appear to offer the promise of an early improvement in the economics of the Lurgi. Lummus studied the Cogas and Synthane processes and concluded that the Cogas is not competitive with the Lurgi using existing by-product credits, and a sub-bituminous coal of the type found at Hat Creek. The Synthane process is more efficient than the Lurgi and has a similar investment cost and may offer an eventual small reduction in gas product cost.
It should be emphasized that in most cases second generation processes for the production of SNG are quite different from processes being developed for the production of low Btu gas for power generation. This is discussed in the following section.
3.1.7 ERDA SPONSORED PROGRAMMES
The Energy Research Development Administration in the U.S. is sponsoring a number of programmes aimed at the production of the following:
- high Btu gas - low Btu gas - liquid fuels - direct combustion of coal by advanced methods
(a) SNG
ERDA have sponsored a number of plants for advanced gasification techniques aimed at producing SNG. The principle ones are:
- Bigas - Bituminous Coal Research Inc. (B.C.R.) Pilot plant is scheduled for for start-up in 1975
- Hygas - Illinois Institute of Gas Technology (IGT). Pilot plant has been in operation since 1972
- Synthane - U.S. Bureau of Mines. Pilot plant expected to commence operation in 1975.
- CO,Acceptor - Consolidated Coal. Pilot plant in operation since 1972. - Agglomerating Ash - Union Carbide - Chemico (UCC). Small pilot develop.
ment unit wascompleted in 1974.
ERDA have sent out a Request For Bids (RFB) for a demonstration plant for operation in 1981.1982. 5 major submissions have been received. It is possible that ERDA will finance several of the proposals through the demonstration phase before choosing a single system to be built on a commercial scale for 1990.
A number of other processes are being investigated in smaller scale bench facilities, and pilot plants are planned.
A further process which has received considerable publicity is the Kellogg Molten Salt Gasifier. This process is now being developed by Rockwell with more emphasis on low Btu power applications.
Details of the processes described in the above paragraph may be found in a large number of technical publications, but in particular in the proceedings of the Clean Fuel From Coal II Symposium, Chicago, June 1975.
It is the conclusion of this summary report that the medium term benefits offered by advanced gasification processes are so small that they are not relevant to the findings or recommendations of the study.
10

(b) LOW BTU GASIFICATION
ERDA is also sponsoring low Btu gasification projects to provide clean fuel for generating plants. These include:
- Fluidized bed gasification - Westinghouse in co-operation with Public Service Indiana, AMAX Coal Company, Bechtel, and Peabody coal together with 11 utilities as associate members. Small pilot in operation in 1975, scaled up pilot plant in 1978.
- Molten salt gasification - Rockwell (.Kellog), a bench scale programme took place between i964-1967. ERDA funding for a pilot plant has not yet been obtained.
- Foster Wheeler - with utility group are building pilot plant for two stage air blown entrained flow process to produce 36 MW from combined cycle.
Other organizations active in the development of low Btu gas processes, both with and without ERDAfunding are:
Combustion Engineering General Electric Institute of GasTechnology (U-Gas) BituminousCoal Research Institute Babcock and Wilcox McDowell Welman
(c) LIQUEFACTION
ERDA is sponsoring a number of liquefaction processes which are based on:
- hydrogenation - pyrolysis - solvent extraction
(d) EXPENDITURES
The relative expediture of ERDA on these programmes can be seen in Table 3.1 below.
TABLE 3.1 PROPOSED ERDA EXPENDITURES
Liquefaction High Btu Gasification Low Btu Gasification Advanced Power Systems Direct Combustion
$,OOO
197s ,977 $89,912 $73,946
53,364 45,054 24,552 331052 10,001 22,500 38,096 52,416
3.2 FLUIDIZED COMBUSTION The basic principles of fluidized combustion are discussed briefly in Study A.
Crushed coal is injected into, and burnt in, a fluidized bed of non-combustible material. The fluidized bed is formed by passing air upwards into the bed at a rate sufficient to fluidize the bed at the desired fluidizing velocity. The fluidizing air also serves to provide the air needed for combustion.
11

The process can take place either at approximately atmospheric pressure or at some higher pressure. A characteristic of the latter is that the combustor dimensions are substantially reduced for the same heat output.
It is a feature of the system that the temperature of the bed is maintained in the range 1380” to 1740°F. lmportanl reasons for avoiding a higher temperature are that ash softening temperatures should not be reached, and that the absorption of SO, in limestone or dolomite becomes ineffective at higher temperatures. In comparison with conventional coal combustion processes, bed temperatures in the range permit easier control of emission of oxides of sulphur and result in lower emission of oxides of nitrogen.
In order to maintain the bed at the desired temperature, heat is extracted from it by some means other than removal of the products of combustion. This can be effected advantageously by heat transfer surface both surrounding and within the bed. It is a feature of fluidized beds that high heat transfer co-efficients are obtained by immersed surfaces. The heat transfer surface is normally used to generate steam or to heat air.
HISTORY OF FLUIDIZED COMBUSTION
Fluidized combustion of coal dates back to 1928 when Stratton developed a fluidized bed boiler to burn crushed coal at gas velocities in the range lo-40 ftlsecond. Thereafter a number of patents were filed in the early 1950’s in both Europe and the U.S. for fluidized combustion with cooling surface immersed or surrounding the bed. The processes were not developed in the U.S. but the lgnifluid boiler was developed in France, and the two stage fluidized combustion in Czechoslovakia.
Research and development work on fluidized bed combustion commenced in earnest in the U.K. in 1963 under the Central Electricity Generating Board and later with the British Coal Utilization Research Association (B.C.U.R.A.) and the National Coal Board (N.C.B.). Experimental efforts and conceptual design studies were aimed at the development of four types of fluidized combustion systems; atmospheric bed utility size systems (120 &60 MW); pressurized fluidized bed combustion systems for combined cycle power generation; industrial boilers of about 50,00O/hr of steam; and package boilers in the range of lO,OOO-100,000 I bslhr of steam.
Following the promising results which came from the early work, projects were formulated in the U.S. by the Office of Coal Research Board, Bureau of Mines and others. These have been in progresssinceabout 1965.
There are a number of atmospheric fluidized combustion rigs in the U.K., the US and other countries. Work on atmospheric systems is proceding at parallel in the U.K. and the U.S., and although Study A related to the U.K. work, the U.S. effort is developing along very similar lines. In the pressurized field, Combustion Systems (CSL). who represent U.K. interests in the field, have more experience on large rigs than U.S. companies.
3.3 FLUIDIZED BED GASIFICATION The process of fluidized bed gasification is under development in parallel with
fluidized combustion. A number of gasification processes including the existing Winkler, the Cogas, Hydrane, Hygas, CO, acceptor, Synthane, U-Gas, UCC and the Westinghouse low Btu process use the fluidized bed technique. Westinghouse low Btu fluidized bed gasification process is of particular interest. In it the sulphur is removed in the bed by absorption in limestone or dolomite. The gas need not be cooled for sulphur extraction and can be introduced into a gas turbine at close to the temperature at which it leaves the gasifier.
12

The advantages and disadvantages of fluidized bed gasification when compared to other gasification techniques are:
ADVANTAGES
1. Provides superior solids-gas con- tact. 2. Can tolerate wide variety of fuel quality and particle size. 3. High capacity per unit ground area. 4. Can be operated over a wide range of output, restricted only by the fluidization characteristicsof the solids mixture. 5. High degree of process reliability, stability, and safety due to high fuel inventory. 6. High degreeof process uni- formity. 7. Product gases are free from tars (an advantage for power cycles)
DISADVANTAGES
1. Moderately high loss of sensible heat in product gases. 2. High carry-over loss in char en- trained in product gases. 3. Loss due to char in ash residue removed from bed. 4. Fluidization phenomenon sensitive to fuel characteristics. Strongly caking coals require pretreatment.
Comparing a power cycle comprising direct pressurized fluidized combustion of coal with Westinghouse’s proposed fluidized gasification/combined cycle the following generalized comments can be made.
The efficiency of the gasification/combined cycle is likely to be higher, if no gas clean up stage is required for NO, control, because the gas turbine firing temperatUre
can be state-of-the-art
The efficiency of the fluidized combustion process is limited by constraints on bed temperature, but the capital and operating costs of the system are likely to be lower. Fluidized gasification requires 2 stages; devolatizing and gasifying rather than the single stage of fluidized combusion.
The SO, emission of both systems will be similar but the NO, emission from a fluidized gasification power cycle might be very much higher, unless a suitable high temperature clean up can be developed.
13

4.0 BRIEF REVIEW OF STUDIES A, 6, C & D
4.1 INTRODUCTION The allocation of time and manhours to these studies has been relatively modest
when compared to the investment which the plants under consideration represent. It has been possible to cover the subjects in some detail because the three engineering companies who performed Studies A-C made use of work which had been compiled during other, much larger, recent studies of similar plants. EPD were able to use the results of two studies done by Combustion Systems Limited for atmospheric and pressurized fluidized combustion systems; Shawinigan Engineering obtained data from STEAG, a West German electrical utility, which is based on a detailed design specification drawn up by STEAG as part of its plans to extend its own generating capacity; Lummus recently completed a major study of SNG plants for American Natural Gas Co., which involved more than 50,000 manhours of work in the U.S., together with a substantial input by Lurgi.
Using this background, it is hoped that the studies will reflect the best information which is available now on these advanced coal conversion techniques. However a comparative assessment of the different processes must take careful account of the extent of development of each process. This question is covered more fully in Section 5 where the costs and performance of each system are compared on the basis of development maturity.
4.2 FUNDING
The technology investigated in Studies A, B and C is generally too expensive and uncertain to be developed by private industry independently. Gasification and fluidized combustion programmes in Europe and the U.S. are usually fully or partially funded by government agencies. It follows that the agencies themselves have an important voice in the direction and the speed of the development of each process. In the U.S. the Energy Research Development Administration (ERDA) is funding a wide variety of competitive processes, and has established objectives which will influence development speed and direction. In some cases ERDA objectives are quite different from those which had previously been set by private industry. An example is ERDA’s decision to develop 260012800°F gas turbine technology before 220012400°F technology, which was the previous industry goal, has been perfected.
As a result, any analysis of processes which may be competitive at a future time must consider the sources of development funding. For this reason, in Study 6, Shaw- inigan have made a considerable effort to investigate U.S. processes which are currently only in the proposal phase, but which appear to have the full backing of ERDA, who are committing substantial funds to specific and relatively short programmes.
Another aspect of any government funding is that groups which are receiving it are unlikely to prejudice their position by quoting cost or efficiency figures which make them appear uncompetitive. For this reason such figures, particularly those quoted for advanced systems, must be considered with reservation, and interpretation of cost
14

data may be impossible. The difficulty is so great that the U.S. government commissioned CF. Braun to do a competitive study covering the cost and efficiency of advanced gasification systems. This study has been underway for several years but the report has not yet been published.
4.3 SHARING OF SITE FACILITIES
Studies A-C base their estimates on the premise that no other plant would exist at Hat Creek at the time of their development, and that they would therefore incur such development costs as site prepration, railroad spur, provision of a new water pipeline, ash lagoons, etc. In fact, if the plants described by these studies were installed as the second phase of the Hat Creek development, significant savings would accrue from sharing costs of this type.
The possible economic advantages of combined gasification/generation or other combined plants is considered briefly in Section 5.
4.4 STUDY A - EPD CONSULTANTS/COMBUSTION SYSTEMS LTD.
4.4.1 GENERAL Study A was performed by EPD Consultants using Combustion Systems Ltd.
(CSL) as a subcontractor. Although the majority of early fluidized combustion work was done in Britain, Study A reviews work done in the U.S. and future international programmes.
The report covers two proposed schemes for a 2000 MW plant at Hat Creek. using fluidized bed combustion technology. The basis of fluidized combustion technology is briefly described.
The Hat Creek coal characteristics are considered and found suitable for fluidized bed combustion subject to tests in experimental rigs. The high ash content will not bea problem.
A scheme using atmospheric pressure boilers with steam turbine generators and a scheme using pressurized boilers in a combined cycle with gas and steam turbine generators are chosen for detailed study. The unit sizes chosen are 648 MW and 623 MW respectively.
EPD chose these unit sizes for reasons detailed in their report; 648 MW was the basis of a previous detailed study of atmospheric fluidized combustion which was done by CSL, and much of the data from that study was quite relevant, while the 623 MW pressurized rating was dictated by the size of available gas turbines.
The report includes plant layout and cycle drawings and the general design of the stations are described. This includes a description of the construction of the boilers themselves together with details of proposed coal feed and ash handling arrangements and other moreconventional generating station equipment.
4.4.2 ENVIRONMENTAL CONSIDERATIONS The environmental impact of the schemes is found to be within current provincial
objectives. The emissions of sulphur dioxide will be below the provincial objective without adding any absorbent substance to the bed, and can be almost eliminated by the addition of about 30 Ibs of limestone or dolomite per ton of coal burnt.
15

The emissions of NO, from atmospheric fluidized combustion rigs have been measured at the equivalent of between 7-18 Ibs per ton of Hat Creek coal burnt. The provincial objective is 27 Ibs per ton while the U.S. EPA level is the equivalent of 13 Ibs per ton. Evidence from larger rigs suggests that NO, emission levels can be kept within the EPA limit if the amount of excess air is controlled.
NO, emissions from pressurized fluidized combustion are predicted to be about 2.6 Ibs per ton of Hat Creek coal.
Particulate emissions from the atmospheric system can be maintained wiihin !he B.C. provincial objective by precipitators with an efficiency of 98.4%. Only 50% of the asn is expected to reach the precipitator inlet; a substantially lower proportion than in a conventional coal fired unit.
The level of particulate emission from the pressurized system rn’Jst be maintained well below the provincial obejctive if excessive damage to the gas turbine is to be avoided. The problem of removing sufficient particulate from the hot gases between the bed and the gas turbine inlet has not been completely solved, but its satisfac;ory solution is a basic requirement of the development of pressurized fluidized combustion.
4.4.3 SIMILAR PROCESSES
The study does not identify any similar process being extensively developed, although it gives particulars of the lgnifluid process. This process is not the subject of a major development effort. EPD also describe work being done by Foster Wheeler Corp. and Pope Evans and Robbins in the U.S., but consider that the U.S. companies are developing the same basic process as CSL, and in fact Foster Wheeler have an agreement with CSL which relates to the development of pressurized fluidized com- bustion.
4.4.4 ADVANTAGES & DISADVANTAGES OF FLUIDIZED COMBUSTION
EPD expect that fluidized combustion, when fully developed, will offer:
(a) Lower capital cost of plant.
(b) More prefabrication of the boiler giving improved quality control and shorter site construction time.
(c) Less gas-side corrosion and fouling.
(d) Reduced emission of oxides of sulphurand nitrogen.
(e) Less difficulty in burning poor quality fuels or fuels of widely varying quality.
(f) Achievement of coal fired combined gas turbines/steam turbine cycle with consequent high efficiency and low fuel cost element of the power cost.
The advantage discussed in paragraph (e) should be stressed. The ash content of the Hat Creek deposit varies significantly and the flexibility of fluidized combustion in handling high ash is important. This would allow B.C. Hydro the freedom to consider schemes in which a better quality low ash coal is exported from the site leaving poorer quality coal for generation. Fluidized combustion also allows the plant to burn a fuel with a widely varying ash content thereby reducing or eliminating the need for coal blending and treatment.
16

The claims seem justified. When a process is in the development stage, as fluidized combustion is, it is never possible to be certain that final costs will be as predicted, or that all development problems will be solved economically. It is possible to say that atmospheric fluidized combustion boilers will be smaller, less complex and more modular than existing pf. boilers and that, given the same degree of devel- opment, and the same level of development costs, they should be 15120% cheaper. This conclusion is confirmed by manufacturers (Babcock and Wilcox, Foster Wheeler), development companies (CSL) and engineers (EPD) alike.
Similarly although many problems remain in the development of pressurized fluidized combustion, the boilers will certainly be much smaller than conventional units, will lend themselves to modular factory construction, and barring unforeseen difficulties will be economical.
In contrast to these advantages, fluidized combustion can be criticized for a number of potential disadvantages of both the atmospheric and pressurized systems. It is difficult to determine whether some of these disadvantages are intrinsic problems which are properties of the cycle, or normal development hurdles. The principal disadvantages raised are:
(a) Control problem resulting from high heat inertia of bed. (This is a particular problem with the pressurized system where the power turbine must be protected on shutdowns.)
(b) Disposal of ash and limelsulphate mixture. This may present a leaching problem.The problem is common to most flue gas scrubbing systems.
For pressurized fluidized combustion only:
(c) Operation of high temperature gas clean up.
(d) Control problem of three flywheels - the bed and the gas and steam cycles. (Although the pressurized system studied in depth includes steam and gas cycles? pressurized fluidized combustion can be used with a gas turbine cycle alone.)
(e) Possible metallurgical problems during two shift or part load operation.
EPD consider that the biggest doubt of the atmospheric system lies in the areas of start.up, shutdown and load changing.
4.4.5 ECONOMICS Study A shows that the capital costs of the atmospheric and pressurized
fluidized combustion generating stations are $435 and $395 per kW respectively if both plants are debited with the same level of interest during construction (IDC) as a conventional plant. The corresponding power costs are 11.2 mills per kWhr and 10.3 mills per kWhr at 80% capacity factory. The compact and modular construction of fluidized combustion boilers, in particular pressurized ones, may allow a lower total IDC cost to be used which might reduce the capital cost by about 5%.
The efficiency of atmospheric fluidized combustion is lower than that of con- ventional p.f. generation due to the high power consumption of the fluidizing fans, the unburnt carbon loss and the heat of the ash.
Pressurized fluidized combustion is expected to achieve net cycle efficiencies of up to 40.42%.(=‘.
17

4.4.6 SCHEDULE
Atmospheric fluidized combustion is relatively well developed and EPD believe that large units could be installed in 1983, though with higher risks than are normal for this class of plant. The development of pressurized systems is less well advanced and large units will probably not beavailable until 1988at theearliest.
4.5 STUDY B - SHAWINIGAN ENGINEERING Shawinigan Engineering’s study on gasification/combined cycles is based on a
subcontract performed for them by STEAG of West Germany, together with discussions with US gas turbine manufacturers.
45.1 SCOPE
Study B deals with the status and feasibility of coal gasification combined cycle technology for power generation purposes. It contains estimates and comparisons of alternative methods for the generation of electricity in a combined cycle plant of 2000 MW nominal capacity using low Btu gas derived from the gasification of Hat Creek coal.
This new technology requires an intermediate step in the conversion of the chemical energy of coal, namely the process of gasification. Through this step, however, coal is converted to a clean burning gas, which is suitable for use in high efficiency combined cycles, whereas coal itself is not. Increased performance and significantly reduced emissions are the benefits when compared to conventional. pulverized coal fired steam power plants.
Four systems are reported on. Three are being developed in the U.S. by General Electric, Westinghouse and United Technologies (United Aircraft) respectively, and work on them is at an early stage. The fourth system, developed in West Germany by STEAG, has reached commercialization after three and a half years of demonstration at the Kellermann PowerStation of STEAG in Lunen.
STEAG’s experience has demonstrated, what is also recognized by the U.S. developers, that the difficulties and risks with this new power generation technology are mainly associated with the coal gasification itself. Both STEAG and General Electric are using the commercially mature Lurgi pressure gasification process with minor modifications to suit their special requirements. Westinghouse and United Technologies are experimenting with new gasification technologies.
In accordance with the Terms of Reference, the emphasis has been placed on the STEAG-Lurgi system. As the suitability of the coal is of vital importance to the Lurgi process, for the purpose of this study analytical tests were performed on a small sample of Hat Creek coal by the Lurgi laboratory in Frankfurt, West Germany. In addition, the probable performance and cost of a Lurgi gasification system required for the 2000 MW plant, were evaluated separately.
4.52 PILOT PLANT
In the report a pilot project is outlined - modelled after the successful STEAG demonstration plant at Lunen - which could serve the dual purpose of providing the basis for a Canadian research and development facility as well as being a commercially useful power generating plant at thesame time.
18

4.5.3 ‘CURRENT STATUS OF THE SYSTEMS At present, four coal gasification combined cycle systems are known to exist at
various stages of development.
Shawinigan consider that the STEAG combined cycle, integrated with a Lurgi gasification plant of 77 tons per hour capacity, has been adequately demonstrated on commercial scale by the 170 MW prototype unit, and that the individual components of the unit are large enough to have validity in the development of 508 MW units. Between its commissioning in February 1972 and October 9th, 1975, the demonstration unit had produced 590 million kilowatthours and had accumulated 6400 operating hours with the power plant and 4600 operating hours with the gasification plant. The unit normally is on peaking duty, requiring 40 minutes to reach full load after an 8 to 12 hour shutdown. Cold start requires two hours. The unit is equipped with auxiliary oil firing, enabling the power plant to operate independently from the gasification plant, The prototype 170 MW unit did not operate reliably during its first three years in service but the majority of the technical troubles related to the design of the gasifiers. These are the first air blown units designed by Lurgi and the vessels were not sized correctly to give adequate separation of zones.
The 500 MW and 1000 MW units, which are the basis of the 2000 MW plant examined, are the results of STEAG’s development work to date. The 500 MW unit is being currently designed. The components of this unit are either improved replicas or close extrapolations of the equipment used in the demonstration plant. The 500 MW unit has been optimized for STEAG’s conditions and for their coal, which is almost twelve times as expensive as Hat Creek coal,
Work on the three U.S. systems is in the conceptual design and component development stage. General Electric’s proposal is based on the standard STAG unfired combined cycle, integrated with a Lurgi gasification plant. The cycle is optimized for low capacity factor and low capital cost at the expense of efficiency. G.E.‘s proposal may also be considered to be a reasonable development from the experience they have with unfired combined cycles. G.E. do not have much experience of low Btu combustion in gas turbines, or gasification itself, but these are not seen as significant hurdles to a company with their resources.
Westinghouse’s proposal incorporates an unproven gasification system (fluidized bed gasification), with a gas turbine inlet temperature which is higher than those of the manufacturer’s current gas turbines. Westinghouse’s proposal has a large content of unproven technology.
United Technologies’ (United Aircraft) proposal also incorporates an unproven gasification system, the Kellogg Molten Salt process. The gas turbine temperature is again higher than those of the companies current machines, although their existing units have been designed for development to similar temperatures. Discussions with United Technologies indicate that they believe the attraction of the unfired combined cycle in integrated gasification systems does not really become apparent until gas turbine firing temperatures increase to above 24OO’F.
4.5.4 DEVELOPMENTTIMESCALE Shawinigan believe that after many years of development and demonstration,
STEAG’s target of being able to commission their first 500 MW commercial unit in 1982, appears realistic in view of the results achieved to date.
U.S. developers cannot, in their opinion, offer commercial units of the 500 MW to 800 MW size before the late eighties, assuming that sufficient maturity - based on
19

adequate and successful demonstration and testing - is a requirement for commercializa. tion. The progress of all three U.S. programmes hinges on advanced gas turbine technology.
Westinghouse and United Technologies hope to have large prototypes in service by 198111962. General Electric claim that they could put a full size commercial pilot plant in service by that time.
4.55 DEVELOPMENT OBJECTIVES
The supercharged gasification combined cycle developed by STEAG is quite different from the unfired U.S. cycles for historical and other reasons. STEAG chose the supercharged cycle because, in a country with high fuel prices, it offered the highest efficiencies which could be obtained with 1960’s and 1970’s technology. The U.S. companies selected the unfired cycle over the supercharged cycle in the 1960’s when combined cycles were being developed for mid range operation on relatively cheap fuels. The unfired cycles offered the best combination of low first cost, modular con- struction, low water consumption and operating simplicity at a time when their relatively poor efficiency, compared to the supercharged cycle, was of little importance. In designing integrated gasification/combined cycle plants the U.S. manufacturers have elected to continue the development of their unfired systems even though these will suffer a performance penalty compared to the STEAG supercharged unit, until gas turbine firing temperatures rise to about 2600°F.
United Technologies have stressed their interest in 2600°F systems which are currently being funded by ERDA for initial availability in about 1982 and commercial availability by 1985. The claimed efficiency of such systems are very high (44145%) with today’s clean up technology and up to 46148% with hot clean up! but any overall pricing is speculative.
General Electric may prefer a continuation of the orderly, internally financed, improvement of firing temperatures through small increments. They point out that 2400°F is possible with existing techniques and materials while 2600°F represents new unknown
technology.
It is probable that we shall see these two approaches developed in parallel in the U.S.; the ERDA sponsored jump to 2600”/28OO”F technology and the slower orderly increase in firing temperatures.
One difficulty which exists in reviewing this subject is that gas turbine temp- eratures have traditionally risen so quickly, also affecting combined cycle technology.
4.5.6 COST OF VARIOUS SYTEMS
The costing of the STEAG combined cycle units is based on their 500 MW design optimized for expensive German coal and includes 100% auxiliary oil firing equipment for the pressurized boiler. The costing of the Lurgi gasification plant comes from an independent study, done for Shawinigan, based on processing Hat Creek coal and on complete desulphurization of all fuel gas produced. Shawinigan believe that the cost of a 2000 MW plant would be significantly lower if it were optimized for cheap Hat Creek coal, without auxiliary oil firing and with partial treatment only of the fuel gas sufficient to satisfy environmental regulations.
The estimate of the General Electric-Lurgi system, for an 800 MW unit, optimized for medium load range, moderate efficiency, low cost and for processing Montana sub. bituminous coal, is based on thecompany’s publications.
20

The cost estimate for the Westinghouse system is taken from recent literature and the United Technologies costs from discussions with that company.
The costs of the four systems appear to be close to one another. As the basis of the individual estimates varies from detailed estimates (STEAG) to conceptional estimates (G.E.) and to allowances, especially for the gasification plant (UT. and Westinghouse), the confidence in the figures must be related to the degree of maturity of the respective system. The same contingencies were used forall systems.
4.5.7 DISADVANTAGES The supercharged STEAG and the unfired U.S. systems each have one important
drawback. With the supercharged STEAG, the gas turbines cannot be operated in- dependently of the boiler and steam turbine. This is possible with the unfired cycles. Neither cycle can run satisfactorily with the steam turbine only.
The unfired cycles suffer performance penalties at high and low ambient temperatures which would pose difficulties in a typical Canadian Interior climate.
4.6 STUDY C - THE LUMMUS CO. CANADA LTD. In this study the technical and economic components in the production of
synthetic gas by coal gasification are developed for various gas products based on Hat Creek coal.
The manufacture of low to medium Btu fuel gas for power generating stations of about 2000 MW and 900 MW is analyzed using the Lurgi and Koppers Totzek processes on the basis that these are the only two processes proven on a large scale. In the case of the Lurgi, the difference in operating and investment requirements between oxygen and air blown gasification is considered.
The technical definition and costs of coal gasification plants based on Lurgi technology for the generation of 250 MW SCFD of town gas for Vancouver Island and 250 MM SCFD of pipeline-quality gas (SNG) were prepared.
The analysis of the Lurgi processes is done on the basis of the document submitted to the Federal Power Commission by American Natural Gas. In order to use the FPC filing document, Lummus assume that Hat Creek coal would gasify similarly to North Dakota lignite, an assumption that has to be verified by Lurgi. The plant area costs listed in that document are adjusted for capacity and escalated to mid.1975. The Koppers-Totzek process is analyzed on the basis of communications between Lummus and Koppers-Totzek, covering a heat and material balance for North Dakota lignite and an order of magnitude estimate of the cost of the Koppers-Totzek sections of the plant.
LICENSORS
Lummus state that caution should be exercised in using the data submitted in their report If the results of their study lead to a phase where a rigorous analysis of technical and economic requirements are needed, they suggest that the services of the gasification process licensers be employed.
In this study Lummus had minimal contact with the licensers of the processes, especially Lurgi, and made use of data that is essentially in the public domain.
21

4.6.1 ECONOMICS OF LOW/MEDIUM BTU GAS The results of Study C show that the Lurgi process produces low Btu gas at a lower
cost than the Koppers-Totzek process. The main reasons for this result are the differences in capital investment and thermal efficiency of these processes.
The cost data indicates that there is little or no economy of scale between a plant capacity of 230 x lo9 BtulD and a plant capacity of 450 x lo9 BtulD.
The comparison between oxygen and air blown Lurgi coal gasification systems shows relatively littledifference in operating or investment costs. Lummus note, however, that the air blown system yields a gas with a heating value (HHV) of 192 BtulSCF, compared to a gas from an oxygen blown system with a heating value (HHV) of 300 StulSCF. This difference in heating values may have significant effects in the design of boilers that would use this gas and will have to be considered if the manufactured gas is to be transported via pipeline over an extended distance.
If the gas is to be burnt in a combined cycle at the gasification site, the air blown Lurgi system has a clear advantage because the gasification and generation cycles can be integrated efficiently. The gas turbine compressor provides an economic source of compressed air for gasification and the power turbine utilizes the pressurized product gas. In this case the production of air blown low Btu gas is more economic than oxygen blown gas.
4.62 ECONOMICS OF TOWN GAS & SNG PRODUCTION The manufacturing cost of the town gas is calculated at $1.45/MM Btu before
enrichment with LPG. The cost of pipeline-quality gas is estimated at $l.Bl/MM Btu.
The comparison between the Lurgi and Koppers-Totzek processes in the pro duction of low Btu gas leads to the conclusion that the Lurgi process results in lower production costs in the manufacture of town gas or pipeline-quality gas, since the upgrading of the gas obtained from the Koppers-Totzek gasifier will require substantially greater facilities than those required by the Lurgi process.
4.6.3 LIQUEFACTION The use of British Columbia coal in Lummus’ “Clean Fuel From Coal” liquefaction
process is evaluated. Cost of service for this process is estimated at $1.78/MM Btu of liquid product.
The yield of liquids from Hat Creek coal is rather low, primarily because of the high ash and moisture contents of the coal.
Lummus estimate an overall thermal efficiency of 55.4% for the liquefaction complex. A factor contibuting to the relatively low thermal efficiency is the high hydrogen consumption required for this particular coal. A major factor in hydrogen uptake for younger coals is their oxygen content. Coals with high oxygen content need more hydrogen, since the oxygen is removed primarily as water.
While for coal liquefaction, a higher unit product energy cost results in comparison to low Btu gasification, Lummus point out that the liquid product is quite storable and thus uncouples the power plant from the conversion plant. Low Btu gas schemes do not offer this flexibility.
22

4.6.4 SECOND GENERATION PROCESSES
Many second generation gasification processes are under development in the U.S., as described in Section 3. In Study C Lummus study two of these processes; Cogas and Synthane.
A preliminary review of the Cogas process shows that for lignite-type coal, this process has a lower Thermal Efficiency than the Lurgi process. The capital investment for a Cogas plant of 230 log BtulD of medium Btu gas is essentially the same as the Lurgi plant of the same size. If Coges is evaluated using a bituminous coal, the results show that Cogas is competitive with Lurgi in both technical and economic areas. The liquid by-product yield from a bituminous coal (Illinois No. 6) is about 4-5 times greater than the liquid yield from a Iignite(Glen Harold, North Dakota)coal.
A preliminary review of the Synthane process indicates that with a lignite- type coal, the process has a higher Thermal Efficiency than Lurgi, and the cost of service is competitive with Lurgi.
Of the second generation processes examined in this report, only Synthane appears to have advantages warranting further study using lignite coals as a feedstock.
4.6.5 CAPITAL COSTS
Lummus have presented their capital costs in such a way that the gasification alternatives can be considered for different sites, different coal costs and different steam supply sources.
1500 psig 950°F steam has been charged at $l.OO/lOOO Ibs and this allows the effect of supplying steam from an existing thermal plant, from burning product, or burning higher priced coal, to be calculated. Power is charged at 10 mills/kWhr.
In fact, the low Btu alternatives would rarely be considered in isolation, and if the gas was to be used for electrical generation, some integration of the gasification and power systems would be logical.
The capital costs quoted by Lummus in Study C are shown in Table 4.1, page 23. If the gasification plant is to be installed in isolation, an allowance must be made for the cost of a steam and power plant to provide steam and power. The extra capital cost of these facilities is alsoshown in Table4.1. TABLE 4.1 S MILLIONS LURGI LURGI LURGI
AIR BLOWN OXYGEN TOWN GAS LURGf SNG HEATING VALUE BtulSCF 192 3.00 280 970 PLANTCAPACITY 104BtulDAY 230 450 70 242.5
Total Capital Costs In LummusStudy 414,302 808,656 166,404 783,129 Complete Steam Plant 46,860 148,026 29,044 74,038 Conventional Electrical Generation at $463/Kw’ 2,917 18,057 5,719 24,679
TOTAL: 458,185 974,739 201,167 881,846
‘This is the cost of thermal electric capacity calculated in Section 10 of this qwrt
In the context of the assumption that a gasification plant would not be installed at Hat Creek in isolation, it is interesting to note that a growing number of U.S. SNG plants are now scheduled to obtain steam from adjacent generating stations..
23

4.6.6 GAS COSTS - RECONCILIATION WITH U.S. FIGURES
Lummus stress that the gas costs quoted in their report appear to be low compared to equivalent U.S. estimates because of the capital charges applied and the relatively low estimated cost of Hat Creek coal. Private industry financing in the U.S. charges interest, depreciation, tax and insurance at about 20%. The utility financing used in these studies utilizes an equivalent capital charge of 11.75% covering 10% interest and 1.75% depreciation amortized over 20 years. (Tax and Insurance are considered with operating costs.)
The effect of different capital charges and coal costs can be seen in Table 4.2, page 24 which shows the basis of Lummus’ costs together with a typical U.S. estimate of gas cost.
The centre column in table 4.2, page 24 shows the breakdown of the gas price if the cost of the steam and power generating equipment is assigned to the gasification plant. The gas price is higher than that calculated in Study C because of the higher operating costs used; these being discussed in section 8.7.2. The centre column shows a higher coal price as it includes the cost of the coal required for steam and power production, but correspondingly the operating cost is lower as it does not include the purchase of steam and power.
TABLE 4.2 SNG COSTS
Capital Charges: B.C. Hydro 11.75% Private Financing 20%
Coal Cost (including coal to $3.00 ton produce steam and power) $4.50 ton Operating Costs-fixed Operating Costs-Variable By Product Credit
ADJUSTEDCOSTS LUMMUS USED INTHIS TYPICAL U.S. STUDY C SUMMARY ESTIMATE
1.14 1.29 2.19
.35 .43 64
.61 .49 .49
.03 .06 (32) (,.$ WI
Total $/Million Btu 1.81 1.87 3.06
US. sources often quote SNG costs of $3.50 per million Btu. Figures at this level can be derived by adding a 30140 cent/million Btu transportation cost to the typical U.S. estimate shown in Figure 4.2, page 24 on the assumption that the gasification plant is at a Western mine mouth site. They also sometimes use about $6.00/tori and capital charges as 21.5% as suggested by the Exxon Corp. in a report to the Environmental Protection Agency to give gas costs approaching $4.00 per million Btu. ‘Includescost of steam and power.
4.7 STUDY D INTEG
This study evaluates the technical and economic feasibility of converting the 900 MW Burrard Thermal Generating Station (Burrard) to burn an alternate fuel. The plant is currently designed to burn natural gas or residual oil.
4.7.1 MODIFICATIONS TO BURRARD
In this study a relatively detailed analysis is done on the combustion of five different fuels in the existing boilers. This analysis demonstrates that the existing units
24

can be modified to produce over 70% of full load, burning Hat Creek coal directly. Alternatively, with a minimum of modlflcation, they will produce 901100% of rated capacity burning low Btu gas of about 300 BtulSCF. They can be converted for fluidized bed combustion orcrude oil firing without derating.
4.7.2 TRANSPORT AND STORAGE
The study investigates many ways of moving the coal from Hat Creek to Burrard and removing the ash. The preferred conventional method is via a rail/barge route using a Squamish terminal. The transport cost of this route, including the coal cost and charges for ash removal, is 78~ per million Btu when the station is operating at 900 MW and 80% capacity factor. The cost of coal delivery is quite sensitive to the annual quantity delivered, and if the plant were derated, or a lower capacity factor used, the delivered coal price would rise significantly. The comparative cost of delivering different types of fuel to Burrard is shown in the table below.
TABLE 4.3 FUEL PRODUCTION, TRANSPORT AND STORAGE-CENTS/MILLION BTU (Incl. Coal Cost)
COAL(INCL. LOW BTU GAS CRUDEOIL ASH REMOVAL) 300 BTUlSCF SNG ($12 PER BARREL)
78 162 202 180
This table shows that using a cost of Hat Creek coal of about 240 per million Btu, coal delivery increases this price by a factor of 3, while gasification and pumping increases it by a factor of about 718. Despite this, the cost of low Btu gas at the station wall is lower than crude oil at $12.00 a barrel, and the gasification plant and pipeline are relatively secureagainst inflation.
4.7.3 CAPITAL COSTS
Table 4.3 below shows the capital costs of the main alternatives, including the cost of the gasification plant and pipeline.
TABLE 4.4 CAPITAL COSTS ($,OOO Sept. 1975 Uninflated)
NEW COAL COALBURNING BURNING OXYGEN BLOWN MODIFICATION BOILERS LOW BTU GAS SNG CRUDE OIL
218,000 267,000 613,000 7301850,000 12,000
The SNG costs depend on whether existing or new pipelines are used.
The capital costs of the coal burning conversions are high. A large coal terminal is required at Squamish or another intermediate point for transfer of the coal from rail to barge. In addition to new coal fired boilers, or modifications of the existing Burrard boilers, new items such as precipitators, pulverizers and a high stack are required. In addition, substantial modifications are required in other parts of the plant such as the water intake structure, the water treatment plant, and the controls.
The cost of the low Btu gas and SNG alternatives are the highest as they include the high cost of the gasification plant and pipeline. The investment for conversion of Burrard to crude oil is relatively small, even if the highest degree of safety is engineered into the modification.
25

4.7.4 FLUIDIZED COMBUSTION 8. SLURRY PIPELINE Two techniques investigated in the study involve relatively unproven technology,
these being fluidized combustion and a coal/water slurry pipeline. Both look attractive economically; fluidized combustion can offer almost complete elimination of SO, emissions at a price which is theoretlcally a little below that of conventional coal burning. The technology is not yet proven at ratings over 10 MW. The coal/water slurry pipeline offers the lowest coal delivery costs and protection against inflation, but there are several problems with this alternative, the most obvious being the potential difficulty of disposing of the slurry water, and the space requirement of the dewatering plant. In any further investigation of converting Burrard to direct coal burning, the slurry pipeline will require further evaluation. In North America it has generally been found that where a railroad already exists, a slurry pipeline has difficulty in competing with it. The difficulties which the geography of B.C. present to a transportation system are such that a slurry appears economic for the transport of coal from Hat Creek to Burrard.
4.7.5 ENVIRONMENTAL The existing BTGS site area provides adequate coal storage for seven days full
load operation, and this is backed up by the ten days storage of residual oil which already exists, and by thirty-two days reserve which would be available at the rail/barge terminal. If more than seven days storage are required at the site, some filling of the inlet would be required.
Conversion of the generating plant itself requires the addition of precipitators and a stack approximately 900 feet high. Using conventional practice this necessitates a certain amount of land reclamation, mainly in the small bay in which the station is located. It would probably be possible to reduce this land reclamation or eliminate it completely. One possible means would be to put the precipitators on the turbine hall roof and the stack on the site of the present switchyard, but the detailed engineering assessment which is required to prove the feasibility of this concept is considered beyond the terms of this study.
Landfilling might be one of the principle environmental objections to converting Burrard to coal. Other objectives might be the aesthetic ones relating to the visible coal pile and 880’ stack, although the lines of the plant itself could be improved by the conversion. The specific emissions of most pollutants would not increase, but it is anticipated that the station would be run on high capacity factor following a coal conversion, and this would lead to increases in the absolute amount of the emissions of NO,, water vapour, CO,, SO, and heat. Particulate emissions would increase but remain within the provincial objective for new plant.
Burning Hat Creek coal, provincial objectives for the emissions of SO,, NO, and particulate can be met, and cost estimates include for the required precipitators.
The operation of covered coal and ash barges to Vancouver Harbour does not constitute a hazard.
4.7.6 INFLATION The effects of inflation on the various alternatives is considered in the study. The
low Btu gas alternatives are the least subject to inflation. Coal burning alternatives are subject to inflation on the two-thirds of the delivered coal price which relates to transport
26
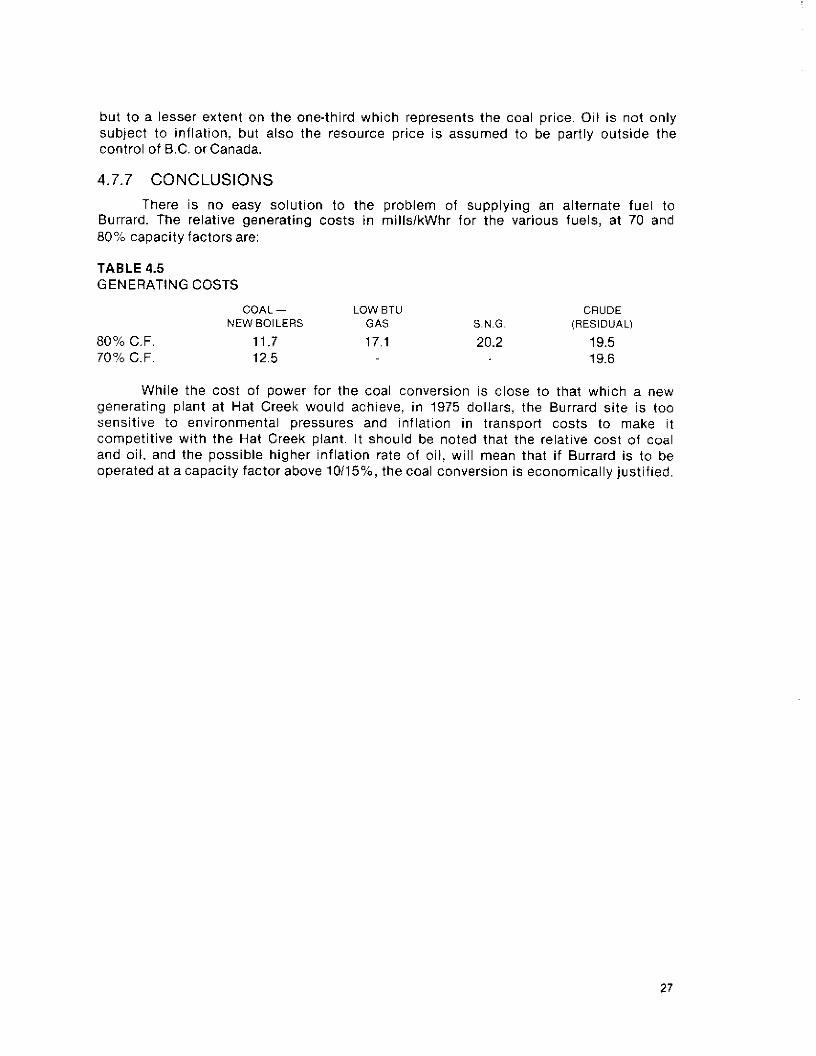
but to a lesser extent on the one-third which represents the coal price. Oil is not only subject to inflation. but also the resource price is assumed to be partly outside the control of B.C. or Canada.
4.7.7 CONCLUSIONS
There is no easy solution to the problem of supplying an alternate fuel to Burrard. The relative generating costs in mills/kWhr for the various fuels, at 70 and 80% capacity factors are:
TABLE 4.5 GENERATING COSTS
COAL - LOW BTU CRUDE NEW BOILERS GAS S.N.G. (RESIDUAL)
80% C.F. 11.7 17.1 20.2 19.5 70% C.F. 12.5 19.6
While the cost of power for the coal conversion is close to that which a new generating plant at Hat Creek would achieve. in 1975 dollars. the Burrard site is too sensitive to environmental pressures and inflation in transport costs to make it competitive with the Hat Creek plant. It should be noted that the relative cost of coal and oil, and the possible higher inflation rate of oil, will mean that if Burrard is to be operated at a capacity factor above 10/15%, the coal conversion is economically justified.
27

5.0 COMPARATIVE USES OF HAT CREEK COAL
5.1 INTRODUCTION
The four engineering studies have considered the following uses of Hat Creek coal:
1. Gasification
(a) by processes available in 1975 (b) by processes currently under development;
2. Liquefaction
3. Electrical Generation
(a) conventional pulverized fuel firing with and without stackgasscrubbers (b) fluidized combustion (c) combined cycle with gasification (d) at Burrard Thermal G.S.
In addition, the study work has led to investigation of a number of related topics. including:
solvent refined coal district heating end useefficiency of energy utilization.
In considering the potential uses of Hat Creek coal it is important to remember that gasification, liquefaction and solvent refining only change the form of the raw fuel. These processes are intended to convert the fuel, initially in the form of coal, into a form which is non-polluting and more easily transported and handled. Although they achieve this they are expensive and a Hat Creek SNG plant would turn coal costing less than 24cents per million Btu into SNG, costing almost $2.00 per million Btu.
In contrast, electricity generation transforms the fuel’s energy into electric power by utilizing it in a heat engine. If the final use of the energy is heating it need not be converted into power but can be used directly as gas. coal or oil. If the end use is power or lighting the energy must be converted in a heat engine either at the central generating plant or at another location. The fuel cell provides the only shortcut whereby a heat engine is not required in producing power.
It is therefore unrealistic to compare gasification with power generation without direct reference to the end use, and for this reason this study will consider heating and power end uses separately.
28
5.2 HAT CREEK COAL PROPERTIES
5.2.1 CLASSIFICATION
Hat Creek coal is classified as a sub-bituminous 8 and has high ash and moisturecontentsand a low heating value.
5.2.2 ASH FUSION TEMPERATURE
The ash is almost entirely composed of silica and aluminum silicate and is low in iron Oxides and other compounds which produce a low melting temperature. The ash fusion temperature is therefore extremely high; up to 700°F above that of many other western sub-bituminous coals which are used for power generation. As a result the design of a conventional furnace to burn this coal is less restricted by the onerous requirement of maintaining a low furnace exit gas temperature. The ash also has little of thosealkaline salts which causeslagging and fouling.
The Hat Creek ash is likely to be erosive which will limit gas velocities. The high ash content should not cause any particular problems if due care is taken with boiler design. In general the coal is likely to be easier to burn than some others being used by Western Canadian utilities.
5.2.3 ASH CONTENT
The ash content varies widely, but for the purpose of these studies it is assumed that the average ash content is 25% and that it would not exceed 31%. The ash content is not critical to any of the processes which are considered. although in every case higher ash contents lead to higher mechanical handling costs.
5.2.4 FINES
Although Hat Creek coal seams appear quite fractured, it is anticipated that normal coal handling and primary crushing will only produce 71/z% fines (less than 3 mm). This contrasts with 25% for some North Dakota Iignites.
The Lurgi gasifier will accept up to 71/2% fines and it is possible that no screening of Hat Creek coal would be necessary to take out the fines before use in a Lurgi.
5.2.5 GRINDABILITY
Hat Creek coal has a Hardgrove grindability index of about 37-47 with 25% ash. The required pulverizer capacity will be high.
In comparison Battle River coal has an index of about 30 which may be the lowest (i.e. hardest to grind) in North America, while other Western Canadian indices are Sundance 45, Wabamun 42, Estevan 49-56, Fording 94, Kaiser 89-92, McIntyre Porcupine 94.
5.2.6 WASHABILITY
Preliminary investigations indicate that the coal has a relatively high inherent ash and that it will be difficult to reduce the ash content, by beneficiation, to below
29

15%. The economics of washing to coal to produce a uniform 1520% ash content deserve serious consideration especially if the coal is to be shipped. The reduction of coal and ash shipping costs for the Burrard conversion would justify a washing cost of $.50 per ton if the ash content were reduced to 15%.
By coincidence, preliminary estimates of washing the coal from 25130% to 15% which were done for B.C. Hydro by Birtley Engineering produce a similar figure - this provides an indication of the effect and economics of washing.
52.7 USE IN FLUIDIZED COMBUSTION
The high ash content of the coal is not a disadvantage to fluidized combustion where the carbon in the bed at any time is usually less than 1% of the total material. There are no problems foreseen using the coal in a fluidized combustion furnace.
52.8 USE IN GASIFICATION
The high ash content is not a problem for gasification in CounterflOw gasifiers such as the Lurgi, although it might be in entrained flow types. Lurgi have written a brief report on the coal which is included in Study B. The conclusions of this report are:
“The coal as represented by the sample submitted to us makes an excellent feedstock for Lurgi gasification. Ash melting characteristics are very favourable so that a low steam to oxygen ratio can be expected. The specific oxygen con- sumption, though expected to be slightly higher than typical for Iignites, is still well below that of, e.g. caking coals. Also, the low steam requirements are likely to offset this penalty. The fact that very little dust is being formed during carbonization is very advantageous and will help ensure a smooth operation. The somewhat above normal ash content does not affect the process per se, it just means accordingly more solids handling.”
Lummus express some reservations about limited laboratory tests of the type performed by Lurgi for these studies. Lurgi statements about North Dakota lignite were not confirmed by tests at Sasol. Lummus believe that until a full scale burn has been done, of the type performed at Sasol and Westfield with a number of North American coals, few definite conclusions can be drawn.
The relatively high moisture content of the coal favours the use of counterflow gasifiers.
52.9 USE OF HAT CREEK COAL AT BURRARD
Although Hat Creek coal is of a low heating value its high ash softening temperature means that furnace exit gas temperature need not be restricted within the small Burrard furnace size. The coal is therefore more suitable for such a conversion than most other low grade coals. However, the high ash and water contents result in high transportation costs from Hat Creek to Burrard and asevere problem of ash disposal.
30

5.3 COST OF ALTERNATIVES
53.1 SUMMARY
An overall summary of the total capital costs, process efficiencies and production costs of the different generating processes is shown in Table 5.1, page 32. The table includes SNG production, from Study C, although it is not strictly comparable with electri- city generation because it produces adifferent form of energy.
A comparison of the cost and efficiency of gasification and electricity generation is only relevant if the end use is considered. This subject is addressed later in this section, but in Table 5.1, page 32, gasification and generation are compared as an intermediate step in the development of end use cost and efficiency figures, and for the perspective the comparison gives on the relative costs of the different energy forms.
Most of the figures in the table are taken directly from Studies A-C, although the cost of conventional coal and gas fired units are those developed in Section 10 and the hypothetical 1990 unfired combined cycle costs are also developed within this report.
Some of the cost figures from other studies are adjusted to provide a common base in terms of interest during construction, operating costs, contingencies, and similar factors. The full rationale behind these adjustments is given in Section 8.
No adjustment has been made for unproven processes, except in the level of contingency which has varied between 10 and 20 percent. This may represent an un- reasonable advantage to immature processes, because so many “new” technologies have suffered enormous cost escalation between the pilot and full commercial phase. The question remains whether an undeveloped process can be penalized realistically by applying a very high contingency and how the level of contingency would be chosen. In this study we have chosen to limit the level of contingencies, but we attempt to highlight the state of development of each process, and to analyse features which should lead to cost savings.
The hypothetical advanced (1990) gasification combined cycle is shown to provide an indication of the possible impact of this cycle.
One of the most detailed studies ever done on advanced gas turbines and combined cycles was that of Robson et al (6). The estimates, done in 1970, (a revised issue is being prepared for the U.S. Department of Health, Education and Welfare), indicated that future combined cycles would have lower specific costs than those of today, because improvements in specific output would compensate for increases in the cost of high temperature materials and design complexity. It was pointed out that the future 500 MW gas turbine would only be 30’ long by 10’ diameter due to gains in specific output.
Even if the cost of future combined cycles does not decrease in terms of 1975 dollars there should be a substantial saving in future integrated gasification combined cycles because the higher efficiency of the power cycle will reduce the cost of coal and ash handling and gasification.
The costs of the 1990 gasification combined cycle are based on United Technologies’ estimate of the relative cost of 3rd generation systems compared to 1975 systems, and then related to present day costs derived in Study B. The resulting generating cost is higher than that projected for pressurized fluidized combustion, with coal in the range $3 to $15, but the benefits of its high efficiency are realized when the coal price rises higher.
31

TABLE 5.1
E TOTAL AND SPECIFIC COSTS ($,OOO SEPT. 1975 UNINFLATED)
STUDY A STUDY B STUOY c REFERENCE200OMWCONVENTlONALP~NT
Net Rating - MW Total Installed
cost - $000(5) Cost - $/Kw Net Efficiencv
1,780 1.821 1,934 885.1(‘) 250 MMSCF 2,000 2,000 2,000 2,000
738,682 622,296 1,110,653(3) 474,704 881,846(4) 926,759 1 .176,759(7) 494,481 838,800 415 342 574 536 298 463 588 347 420
. HHV - % 33.2 36.1 40.3 33.1 54.5(2) 36.3 35.0 36.7 45.0 Annual -Fixed 101.80 85.76 162.51 69.45 143.34 127.73 162.18 98.75 122.73 costs -Fuel
- Var Maim
$ Million -TTO~~I Gen Costs -Fixed
-Fuel Mills/ - Yar Main, Kwhr. -Total Generating Costs at Plant Mills/ Kwhr. $ 6.00Coal
30.04 28.28 26.88 14.98 34.59 30.87 32.02 119.25 24.90 3.74 3.83 4.07 1.86 4.70 4.21 4.21 3.50 4.21
135.58 I 17.87 193.46 86.29 182.63 162.81 198.41 221.50 151.84 8.2 6.7 11.9 11.1 9.1 11.6 7.0 8.8 2.4 2.2 2.0 2.4 2.2 2.3 8.5 1.8 0.3 0.3 0.3 0.3 0.3 0.3 0.3 0.3
10.9 9.2 14.2 13.8 11.6 14.2 15.8 10.9
13.3 11.4 16.2 16.2 13.8 16.5 24.3 12.7 $15.00 Coal
Generating Cost $ per Million Btu at plant cost gas at plant
$/MM Btu
20.5 18.0 22.9 23.4 20.4 23.6 49.8 18.1
3.19 2.70 4.16 4.04 3.40 4.16 4.63 3.19
1.87(6)
(5) IDC is charged as follows: Convention Generation 26.6% Atmospheric Fluidized
Combustion 28.6% Pressurized Fluidized
Comb”stio” 21 % STEAG 8 G.E. Combined
Cycles 21% SNG 23.6%
16) $32 million or 1.4 millsiKwhrdeducted Iur by-product sales 17, Based on 16125 wr Kw for scrubber.

5.32 ELECTRICAL GENERATING PROCESSES
The figures in Table 5.1, page 32, give net generating costs for eight different generating processes, in addition to SNG gasification.
They do not illustrate some of the other important qualities of the different systems, such as degree of maturity, level of emissions, and effect of fuel price, these factors being shown in three figures:
Figure 5.1 Emissions from Generating Plants vs Capital Cost Figure 5.2 Generating Cost YS Coal Cost Figure 5.3 Comparison of Generating Cost and Emission Levels of different
generating plants against degree of maturity.
The relationship between capital cost and emissions is illustrated in Figure 5.1, page 45. In this figure the cost of the gasification plant is included in the total figure for the conventional low Btu fired generating station. Although a low Btu gas fired plant is much cheaper than the equivalent coal fired plant, the saving in no way compensates for the high price of gasification. Figure 5.1, page 45, also gives a good indication of emiSSiOnS against generating cost at low coal costs where efficiency has little effect,
Figure 5.2, page 46, shows the effect of coal prices on generating costs, and demonstrates that the high efficiency systems such as the supercharged combined cycle of STEAG and the advanced 1990 combined cycle, gain when high coal prices are considered.
In Figure 5.3, page 47, the degree of maturity of each technology is considered by showing the cost and emission level of each type against the year in which a full scale unit (500 MW) will enter commercial service for the first time. This figure demonstrates that in 1975 conventional pulverized coal firing is the only proven technology at a rating of 500 MW, with the exception of conventional units burning low Btu gas. The emission levels of the coal fired units are acceptable under current provincial pollution control ob- jectives and a high premium (about 40%) must be added to power costs to obtain the benefit of reduced emissions from burning low Btu gas.
Large conventional units with proven stack gas scrubbing should be in service in the late 1970’s. The extra cost of SO, scrubbing is high but quite competitive with low Btu gas burning units.
Both NO, and SO, removal are effected efficiently by the combined cycle- gasification processes, shown as entering service in the early 1960’s. The generating costs of these systems are within the range of costs for conventional generation with scrubbing, and the emission levels are substantially better. In figures 5.2, page 46, and 5.3, page 47, a wide range of scrubbing costs is shown, from about $70/kW to $170/kW with a mean of $1201125 kW. It would be possible to build a combined cycle gasification plant with no SO, removal, at a lower installed cost, consequently it is not equitable to compare conventional generation without gas scrubbing with gasification-combined cycle processes which removevirtuallyall theSO,
In table 5.1, page 32, the generating cost of the unfired GE system appears slightly lower than the STEAG, although the GE process may be less ‘mature’. The principal reason for this is that GE have optimized their design for low thermal efficiency aiming it at the market for mid-range plant. As a result it is economic at the low Hat Creek coal price. The STEAG system is optimized for high cost coal and base load operation. It would be possible to increase the efficiency of the GE system quite
33

substantially if it were designed for high priced coal, and conversely the STEAG supercharged design could be optimized for a lower cost and lower efficiency. The STEAG supercharged design is better suited to base load high efficiency operation because most of its capacity is in the high pressure steam cycle, rather than gas turbines.
Figure 5.3, page 47, shows that 198511990 technology in the form of the pressurized fluidized combustion and the advanced combined cycle offers a reduction in both capital costand emissions. The costs must be considered with due reservation.
It appears that the 198511990 alternatives of pressurized fluidized bed or advanced gasification-combined cycle will ultimately offer lower capital cost, higher efficiency and lower emissions. It is possible to criticize this result by noting that the two tech- nologies in the earliest state of development appear the most attractive economically because the true cost and complications of the systems have not yet been seen. While there is merit to this argument both pressurized fluidized combustion and the combined cycle seem to offer cost advantages in terms of size or specific output, modular construction, low site costs, simplicity, which should become real when development difficulties have been overcome and costs written off.
Until these two advanced technologies are available reduced emissions will only be achieved at a cost premium. Atmospheric fluidized bed is an exception, but it does not offer sufficient advantage in the time scale of its development to be certain of obtaining enough development funding. Major utilities, when offered the relatively small economic advantages of the atmospheric system, and weighing them against their technical risks, will probably prefer to await the development of the pressurized bed. For all the complications and expense of flue gas scrubbing it has the great advantage that the failure of the scrubbing process does not endanger the ability of the plant to continue to generate power and revenue. This probably explains the commitment of the U.S. utility industry to conventional generation with scrubbing although the STEAG, the unfired integrated gasification combined cycles, and atmospheric fluidized combustion, alreadyappearto be competitive if scrubbing is required.
5.4 EFFICIENCY OF UTILIZATION Using a Hat Creek coal price of $3 per ton and a strict economic evaluation, without
regard for conservation, the cumulative present worth of one percent of efficiency is relatively low.
2000 MW net generating plant (coal) $3.0 million/% - 80% load factor 250 million SCF per day gasification plant $2.9 million/% - 91% load factor
These values consider the fuel component of efficiency only.
These figures demonstrate that if economic criteria, alone, are used the importance of efficiency in reviewing alternative uses of Hat Creek coal is low. Despite this there are several reasons why it is important to establish the overall net efficiency with which the coal is used; the coal price represents the cost of supply including royalty but at some time, present or future, it may be possible to assign a higher value or ‘opportunity cost’ to it; this possibility should not be exaggerated because shipping Hat Creek Coal will always be expensive: interest rates may fall or lower rates might be used in other economic analyses; there is an increasing ecological desire to conserve
34

resources irrespective of strict financial conclusions. In the light of this, the summary report analyzes the overall thermodynamic efficiency of utilization of the coal by various processes.
In applying the figures which are derived in subsequent paragraphs, it is important to remember that the efficiency of any process may vary widely depending on the financial guidelines used in its design. While all processes have a maximum possible efficiency, which is defined by thermodynamic and chemical laws, it is rare that the expense of a fully optimized cycle or process can be justified. Inevitably, efficiency must be weighed against first cost and the loss of reliability that usually comes with complexity. These remarks are of particular significance in considering gasification and gasification/combined cycle processes, where it is not uncommon to see very large differences quoted in the efficiency of various cycles. Close examination usually shows that such difference stem mainly from different financial criteria, the degree of cycle optimization chosen, or site factors, rather than from the basic properties of the cycles.
The efficiency of the different processes is considered in the following paragraphs:
54.1 CONVENTIONAL POWER GENERATION
The parameters which effect the net efficiency of a generating station most are the steam conditions, the exhaust pressure, the size of the steam turbine exhaust and the coal characteristics. The most efficient stations which have been built employ supercritical steam conditions, often with two stages of reheating. Net efficiencies as high as 40% can be obtained, but the high cost of the supercritical boiler, the large turbine exhaust area and condenser which are required, and the loss of reliability of the plant, have led to a general trend away from such high efficiency plants. At subcritical steam conditions, and using cooling towers as the cold sink, the net efficiency of a coal burning modern station is normally in the range of 3536%. (43)
Most plants designed to burn cheap western coal are optimized for an efficiency at the lower end of this range and include turbines with small exhaust area and with minimum condensercapacity.
5.42 FLUIDIZED COMBUSTION
Atmospheric fluidized combustion has an efficiency similar to that of conventional pulverized coal firing, except that the auxiliary load is higher, due to the bed fan power requirements. In Study A the net efficiency is 33.2%.
The pressurized system in Study A is not optimized for high efficiency and is designed for a net 36.1% efficiency. Pressurized fluidized combustion has a potential net efficiency of about 40.42% when used with combined steam and gas cycles. This figure cannot easily be improved because the absorption of sulphur in limestone or dolomite rapidly becomes ineffective if the temperatureof the bed is increased.
5.4.3 GASlFICATlON/COMBINEDCYCLES
A number of different types of combined cycle have been proposed for integrated gasification systems, but only two are now the subject of major development. They are the supercharged fully fired cycle which is utilized by STEAG, the West German utility, and the unfired cycles which are favored in the U.S.A. The supplementary fired cycle has been considered for some gasification applications because it gives more operational flexibility, but it is not favoured by any of the major suppliers of integrated gasification combined cycles considered in Study 6.
35

As in the case of SNG Gasification, different sources quote widely different net efficiencies, but a study of the thermo-dynamics reveals that the basic efficiencies of the cycles varies little. The effort made to optimize the cycles, in areas such as stack gas temperature, two pressure boilers, low back pressure, recovery of sensible heat of raw gas, recovery of heat of miscellaneous flows in gasification process, has a much greater overall effect. This is illustrated in Section 8.0.
The net efficiency of a supercharged STEAG cycle for 1981 commissioning is 40.3%. Future cycles have the potential to improve this to 48% by 1990. Section 6 includes some brief comments on the development of combined cycles.
5.4.4 SNG GASIFICATION The overall efficiency of pipieline or SNG production is quoted by Lummus as
being 67%. This includes all steam and electric power consumed and the heating value of by-products. The figure should be adjusted for the efficiency with which the electric powerand steam are produced from coal.
Coal Steam Electric Power
TOTAL Output, SNG plus by-products Net Efficiency Adjusted 64.6%
FROM STUDY C INPUT 109Btu/DAY
356.9 59.3
4.6 420.8
284.4
ADJUSTED INPUT lo9 q WDAY
356.9 70.6 12.7
440.2
The above efficiency assumes that the full heating value is assigned to by. products. This assumption requires consideration. The value of these by-products is usually credited against the operating costs of the process and their heating value obviously cannot be credited in the same calculation.
In addition many of these by-products are theoretically sold for an end use in which their latent heat is not relevant, i.e. ammonia for fertilizer, phenol for glue.
It might then be reasonable to offset some of the energy of the latter by-products with the chemicals which are required for gas cleanup processes. With these considera- tions in view, it seems equitable to consider two other net process efficiencies.
a) Efficiency with no credit for heating value of by- products Net efficiency 54.5%
This represents the ratio of energy in the SNG product to the energy in the total gasification coal consumption.
b) Efficiency with credit for tar, oil and naptha by- products only Net Efficiency62.4%
Section 6 establishes the prospect that second generation SNG gasification processes may offer an efficiency 10% higher than the Lurgi.
36

5.4.5 SOLVENT REFINING OF COAL
Coal can be converted into a clean fuel by the removal of almost all of the ash and sulphur. In solvent refining these conversion processes have a very high efficiency, which may be up to80%.
It is unlikely that solvent refined coal could be used with end use efficiencies as high as those of electricity generation orSNG.
5.4.6 LIQUEFACTION
In Study C the efficiency of coal liquefaction is quoted as being 55.4%. This route offers poor end use efficiencies because, in most applications such as transport oil is burnt with efficiencies below 40%.
5.4.7 DISTRICT HEATING AND SALE OF STEAM TO PROCESS
If the exhaust heat of a conventional Rankine or combined cycle can be utilized for district heating or to provide process steam to industry, efficiencies of 70.80% can be obtained for power generation. The increasing price of fuels in many parts of the world makesuch schemes increasingly attractive.
In district heating the latent heat of the steam, or the gas turbine exhaust heat is used to provide a circulating supply of hot water or steam. The energy in the steam is used down to an enthalpy of about 100 Etullb. rather than 980 Btullb. in a condenser. The supply of back pressure steam to an industrial process has the same result.
While the relevance of district heating may not be immediately apparent to this summary report, any review of overall process efficiency must consider it because its economics are so convincing when fuel costs are high. If, for instance, the figures derived for conventional generation at Hat Creek in the task force report (46) are used, we see that a generating cost of about 10 mills/kW includes a fuel component of about 25 percent. If the Hat Creek coal price were to rise to the level of similar coals in Germany, at roughly $26 per ton, the generating cost at Hat Creek would be 7.5 mills from capital charges and no less than 25 mills for the fuel compoent, for a total of 32.5 mills. If district heating were used in such a situation the net generating efficiency of 72% compared to 37% would reduce the overall cost of power by 42%: if the full costs of the heating scheme were attributed to heating costs. The development of district heating in Canada is discussed more fully in paragraph 5.7.
5.4.8 NET EFFICIENCY OF END USE
The net end use efficiency resulting from the generation of electricity has been compared to that from gasification (7) (20) (44). These analyses have usually been confined to heating end use only. To be completely valid such calculations should be all embracing and include the energy to build the plant, the energy to run it (gasoline of operators, etc.) and other considerations. For the purpose of this study the net end use efficiency of the various processes are considered by examining heating and power applications separately.
To determine the net overall efficiency of the utilization of the Hat Creek coal energy it is necessary to establish the efficiency of transmission and consumer
37

utilization. To do this a number of assumptions have been made which have been listed below:
EFFICIENCY 96
1. Transmission of electric powerat 500 kV - route length 92 140 miles,and distribution to user
2. Transmission and distribution of SNG - route length 180 miles 98
3. Average utilization efficiency of electricity - Resistance Heat 100 - Heat Pump 200 - Power 80
4. Efficiency of Gas Burning 40-75
The accuracy of these figures is basic to the development of end use efficiency figures. For this reason the basisof the figures isgiven in Appendix 1.
Table 5.2, page 39, incorporates these values and develops overall net efficiencies for heat and power utilizations.
The table includes efficiencies of the Lurgi SNG plant described in Study C, and for the conventional coal fired plant used as a reference in this study.
The effect of generation and gasification efficiencies which may be attainable in 1990 are also shown.
A district heating scheme is shown which is based on ASEA (Stal-Laval‘s) figures from a paper by H. Harboe (45). The scheme is illustrated in figure 5.6. page 50. The relative output of the plant in the ratio of electric power to heat is quite high at 56. The loss assumed in the transmission of power and heat is 10% Using a heat pump coefficient of performance of just over 2 the net efficiency of energy utilization is almost 90%. This figure is artificial because it is predicated by the assumption that all of the electricity is used for heating in heat pumps. The district heating comparison is included to show the relative efficiency of such systems.
5.5 ENERGY COST RELATED TO END USE
To establish the end use cost of utilizing different energy forms it is necessary to calculate the cost of producing the energy, transmitting and distributing it, and finally of using it. This is done in Table 5.2, page 39. The table lists efficiency values for production, transmission, distribution, and utilization and relates them to the cost of production which is calculated in Table 5.1, page 32.
Transmissions costs can be calculated readily for both SNG and electric power. The cost of distribution systems is more difficult to establish, and in this study they are ignored on the premise that we are considering incremental energy costs in an existing system. This is not a completely valid assumption and a more rigorous study of this subject should consider distribution costs in detail. This study also largely ignores the cost of the equipment which utilizes the energy, because to consider such costs would open an enormous avenue of investigation. However this is not necessarily an important omission because having established the cost of energy in end use it is a relatively easy matter to determine the annual saving, or total present worth saving that a particular system may offer. In fact, if we consider heating end use, the cost of a gas furnace and heating system is probably similar to that of an electric heating installation. A heat pump would be more expensive but the total present worth of savings which the heat pump offers: can be compared to theextracost of a heat pump installation.

Efficiency of Energy Conversion or Power Generation % 33.2
Transmission Efficiency % 92.0 Efficiency End Use Heat% 100.0
- heat pump % 200.0 - advanced furnace %
Efficiency End Use Power % ,EO.O Overall Efficiency Heat % 30.5
- heat pump % 61 .o - advanced furnace %
Overall Efficiency Power % 24.4 Cost Energy From
Generating Station (Table5.1) 3.19
36.1 92.0
100.0 200.0
80.0 33.2 66.4
26.6
2.70 Cost Transmission .08 Total Cost 3.27 END USE COST $/MM Btu 1 Power 4.44 2(a) Resistance Heat 3.55 W’) Heat Pump Approx. 1.78
w Advanced furnace
.08 2.78
3.77 3.05 1.51
40.3 92.0
100.0 200.0
33.1 92.0
100.0 200.0
54.5 62.4 98.0 98.0 60.0 60.0
36.3 35.0 36.7 45.0 72.0 92.0 92.0 92.0 95.0 92.0
100.0 100.0 100.0 100.0 100.0 200.0 200.0 200.0 200.0 200.0
80.0 80.0 37.1 30.5 74.2 61.0
75.0 75.0 30.0 30.0 32.0 36.7
29.71 24.4 40.1 41.7 16.0 17.1
80.0 80.0 80.0 80.0 80.0 33.4 32.2 33.8 42.75 66.0 66.8 64.4 67.6 85.5 89.0
26.7 25.8 27.0 34.2 53.0
4.16 4.04 1.87 3.40 4.16 4.63 3.19 .08 .08 .I0 .08 .06 .08 .08
4.24 4.12 1.97 3.48 4.24 4.71 3.27
5.76 5.60 4.61 4.48 2.31 2.24
6.70 3.35 -
4.73 5.76 6.40 4.44 3.78 4.61 6.96 3.55 1.89 2.31 3.48 1.78
2.81 .
(1) I.4
72.0 98.0 65.0
75.0 35.0 45.9
50.0 24.7

It is assumed that new electric transmission lines would be used for electric power and that they would take a relatively direct route to the Lower Mainland. The route length is 140 miles. A new gas line would connect with the existing Westcoast Transmission line at Savona and from there the gas would be pumped to the lower main- land in existing pipelines.
The cost of a 140 mile 500 kv transmission line of 2000 MW capacity is taken as 35 million dollars on the basis of data provided from B.C. Hydro. The operating cost of the line at 80% capacity factor adds 8 cents/MM Btu to the price of electricity, ignoring the efficiency loss which is considered separately in Table 5.2, page 39.
The cost of delivering 250 MM SCF of SNG from Hat Creek to Vancouver is estimated to be 10 cents/MM Btu from discussions with Westcoast Transmission and B.C. Hydro’s gas division.
The overall energy costs in end use are established by the following logic:
Cost of energy at Hat Creek (Table 5.1), page 32. Add Cost of Transmission (8 cents for electricity IO cents for gas) Apply efficiency factor(Table 5.2) page 39, by division. The result of this calculation is presented in Table 5.2, page 39.
The data in Table 5.2 is illustrated by Figure 5.5, page49,which confirms what was already clear, that central electricity generation is far more economical for power production, and hence for lighting, than SNG gasification, unless SNG is to be used in a district heating or process steam application.
The comparison for heating is more complex because of uncertainty about the present day and future average efficiency of domestic furnaces.
Using resistance heating, the actual cost of a unit of heat produced for the consumer is almost the same for electric power as for SNG, assuming that the SNG is utilized at 60% efficiency in an existing domestic or industrial boiler. This is almost certainly an optimistic assumption with existing furnace installations, as appendix 1 indicates, but work is being done on advanced gas furnaces which will have higher efficiencies. Gains of up to 5% in efficiency may be achieved by eliminating the pilot flame and using electric ignition. Theoretically the use of stack gas dampers can provide a substantial improvement in efficiency, but in practice such gains have been small, and the stack gas damper has difficulties relating to its safety. A means of reducing the losses caused by on-off or cycling operation is modulation, but in practice this technique does not greatly reduce stack and draft hood loss and only gives improvements of about 2.4%.
The measure which offers the best improvement in gas furnace efficiency is reducing the flue gas temperature to as low as 12O”F, which is well below the gas dew point. Most of the wet and dry gas losses of the furnace are eliminated, and because the stack temperature is low, the losses relating to on-off operation or cycling are of a much lower magnitude.
Furnaces of this type are under development, although problems of corrosion from operating the stack below dew point remain; the Canadian Gas Association believes these problems will be solved without undue difficulty, but in the higher humidity of B.C.‘s lower mainland they may be a severe hurdle. Typical among furnaces with very low flue gas temperatures is the Pulsamatic which operates with pulse combustion. Over 400 furnaces of this type are in operation in Canada, and net efficiencies of over
40

90% have been measured, but the early Pulsamatic units were very noisy. Advanced furnaces with net efficiencies in the range K-90% could be on the market in 4 years at a price about 33/40% above standard furnaces, if the corrosion problems can be solved.
If baseboard resistance heating is compared to gas heating systems, whether existing or of an advanced type, it gains from flexibility of control. With electric baseboard heating the areas being heated and the timing can be controlled much more closely than with gas systems, with resulting energy savings. SNG is also penalized by the fact that electricity must be supplied to any new development but the supply of gas is optional. Expressed another way, much of the cost of electrical power distribution can be written off against lighting and power needs while the cost of gas distribution systems must be carried by the heating load. These factors make it possible that if the relative pricing of SNG and electricity indicated in Table 5.2, page 39, were in force, gas heating would lose ground to electric resistance heating.
The possibilities of the heat pump which are indicated in Table 5.2, page 39, are enormous, even in private residences. Until now the use of these pumps has generally been limited to large installations because they were competing with cheap gas heat which delayed their acceptance. The relationship between SNG and electricity prices in Table 5.2, page 39, is so radically different from the traditional one on which the economy has developed that it would inevitably be a stimulus to heat pump develop- ment. Hammond &Zimmerman (7) and other references-(19) suggest that with a moderate climate the electric pump can compete with residential gas heating even if the relative price of electric power to gas, at the home, is higher than that shown in Table 5.2, page 39. This assumes a very advanced gas burner in perfect working order operating on a long term on-off cycle and a high heat pump installation cost.
The relative level of 9as to electricity costs at the end use is the important factor raised by Table 5.2, page 39. British Columbia’s heating markets have developed in the last 15 years with gas prices, at the point of distribution, of about 35 cents/MM Btu. SNG, at $2,OO/Million Btu is almost 6 times more expensive than was natural gas in the period 1960-1973. In the same period the cost of generating electricity, using the same economic criteria, has risen by a factor of about 2, from the 6 mills/kWhr of the early Peace River estimate to the 12 mills calculated in this report for a Hat Creek station. Figure 5.4, page 48, shows that the relative end use cost of heat from electrical resistance heating and from SNG are not affected by coal price.
5.6 COMBINED GENERATION/GASIFICATION PLANT There are a number of possible advantages to installing an SNG gasification and a
generating plant adjacent to each other at Hat Creek.
In the sharing of common site facilities, such as the supply of water, site access, site preparation, etc., the total saving for each plant may be in the order of 4%.
The supply of steam and power to the gasification plant can be done economically from a separate generating facility, where the economy of scale reduces the cost of producing the steam and power which gasification needs. In a brief study done for B.C. Hydro by Integ, for a Vancouver Island site, it was calculated that the total saving in the cost of gas and electricity produced in adjacent stations would be in the order of 7 to 8%, but one of the principal savings was in the coal delivery costs which, on a site remote from the mine, aresensitive tovolume.
It would not be economic for the generating plant to burn the gas produced by the gasification plant, even at times of low gas demand. No reduction in the capital cost
41

of the generating plant would result from this concept because the plant would be designed to burn coal during peak gas demand periods. Ignoring the capital cost of the two facilities, the cost of burning gas in the generating plant would be higher than burning coal because of the losses associated with conversion of coal to gas.
It is therefore concluded that while the adjacent operation of gasification and generating plants provides for the convenient sharing of facilities, and economics in the cost of steam and power for the gasification plant, it does not provide any significant cost savings, oroperational flexibility.
5.7 DISTRICT HEATING
More than 30% of the installed electrical capacity in the U.S.S.R. is now associated with district heating. In Sweden, Denmarkand Finland it is also employed quite extensively. Until now conditions have not existed in North America which encourage its adoption, primarily because of the availability of cheap oil and gas. Unfortunately Canadian utilities have not, in the past, encouraged other companies to sell them excess by product power, with the result that the district heating schemes which have been developed in Canada have been built without any associated electrical generating units. The economics of such schemes are quite different from those of combined generating - district heating schemes, and favour the use of high pressure steam heating systems in place of the hot water systems normally used in Europe, where the steam is used in a turbine to the lowest practical temperature. Thus many major Canadian cities. commercial developments and public institutions have existing high pressure heating systems which are not suitable for integration with the hot water system of a generating/ district heating plant.
In general, district heating schemes produce about twice as much heat as electrical energy. In the initial development of European systems, utilities generally installed relatively small generating units (up to 50 MW) associated with quite large district heating schemes, supplying 100,000 kW of heat. As networks developed through cities, they were able to install larger turbines of several hundred MW, and supply the heat produced by such machines to the large network which had been developed. In Canada, where no such networks exist, the investment involved in providing district heating facilities for a generating unit of much more than 50 MW would be high. The country faces a conflict in that the size of generating unit which would normally be considered economic for power generation is far too large for a fledgling hot water district heating network. Studies of providing district heating from the Pickering Nuclear Station have confirmed this point.
Another major difficulty with district heating is that the generating plant must be close to the heating load. This is a particular problem in the B.C. lower mainland and probably precludes the use of district heating in that area unless it is associated with nuclear power or emission free generation by one of the techniques discussed in this section.
Despite these problems, the level to which energy costs have now risen, justify district heating for areas of medium density living if a clean generating source can be found. Swedish sources (36) quote installation costs between 50 and $lOO/kW for heating in medium density residential areas. Schemes currently proposed involve transmitting the hot water over distances in excess of 20 miles.
42

5.8 LIQUEFACTION
Coal is liquified by adding hydrogen by a number of techniques. The hydrogen also removes the sulphur in the coal in a form whereby it can be easily recovered. Provision of the hydrogen is relatively expensive, therefore it is better to minimize the amount of hydrogen to that required to achieve liquefaction and sulphur removal, thus producing a heavy fuel oil. The production of gasoline requires twice as much hydrogen and is consequently more expensive.
After coal is liquified, it is amenable to ash removal to provide a clean fuel free of both ash and sulphur.
Most coal liquefaction projects are now being developed with bituminous coal, but the majority of them can also utilize sub-bituminous or lignitic coals, sometimes with better results because such coals are more reactive. The lower first costs and reactivity of low grade coals are generally countered by their high oxygen content which consumes expensive hydrogen to produce water.
Liquefaction processes now underdevelopment included:
(a) Direct catalytic hydrogenation (b) Solvent extraction (c) Pyrolysis (d) Indirect variations of the above
5.9 INFLATION AND UNCERTAINTY
The figures in Table 5.1, page 32, are all in uninflated 1975 dollars. The projects are all capital intensive and substantial increases in the coal price have a relatively small effect.
One of the big advantages of conventional electrical generating plants is that the technology is well known and firm contracts can be obtained for most of the major equipment. The plant price is then only subject to inflation in line with published Federal indices, together with increases in site labour costs. Even the latter can be covered on many major contracts by obtaining firm erection contracts which are tied to indices of provincial average hourly construction rates. The prices of much of the equipment are well known and prices for some items such as the turbine generator can be obtained from the manufacturer’s price book.
Gasification plant costs cannot be defined so easily as the remarkable increase in the estimated costs for large SNG plants in the U.S. has demonstrated. The El Paso 250 MM SCFlday plant was estimated at $209 million in early 1973 - that figure rose to $437 later that year in a FPC estimate. In mid 1974 it was estimated at $740 million and now approaches $1 billion. Three explanations are advanced for the increases;
1) Many costs discussed in print as late as June 1975 referred to studies conducted earlier, sometime in 197211973.
2) The scope of many estimates was poorly defined. 3) Inadequate understanding of the costs of environmental control equipment and
by product processing.
There is some reason to believe that the recent estimates done on the major U.S. SNG plants are realistic and that further price escalations will not exceed the inflation rate of the equipment. Certainly the estimates in Study C are based on thorough and extensive study work which has endeavoured to cover all possible costs. This argument may be quite convincing but doubts must still remain because
43

although every item of the plant is proven on a smaller scale, no gasification plant has been built on the scale of 250 MM SCFlday with rigorous gas cleaning. It is likely that a larger proportion of the work will not be let on firm contracts.
5.10 RELIABILITY It is reasonable to expect that a 500 MW conventional coal fired unit would attain
a high load factor in the first 12 months of operation, after the commercial in service date. Units of this size are capable of achieving a capacity factor above 80% in the first year. If the IDC charges assigned to the costs summarized in Table 5.2, page 39, are to be valid, all the plants must be capable of an 80% (or 91% for gasification) capacity factor in the first year of operation, because the final calculations have been based on these capacity factors.
5.11 WATER CONSUMPTION
The estimated water consumption of the different processes is shown in Table 5.3.
TABLE 5.3 WATER CONSUMPTION
Conventional Generation Atmospheric Fluidized
Combustion Pressurized Fluidized
Combustion STEAG Supercharged
Combined Cycle G.E. Gasification/
Combined Cycle SNG Plant
PLANT RATING
(NET) MW
2000
1780
1621
1934
685.1 250MM SCFl
day
WATER CONSUMPTION
USGPM
21,200
20,800
17,900
23,800
5,206 7.500
CONSUMPTION USGPMlMW ESTIMATED
10.6 Various
11.7 Study A
9.8 Study A
12.3 Study B
5.9 Study B Study C
All figures are related to a common level of cooling tower blowdown, cooling tower performance and back pressure where possible.
44
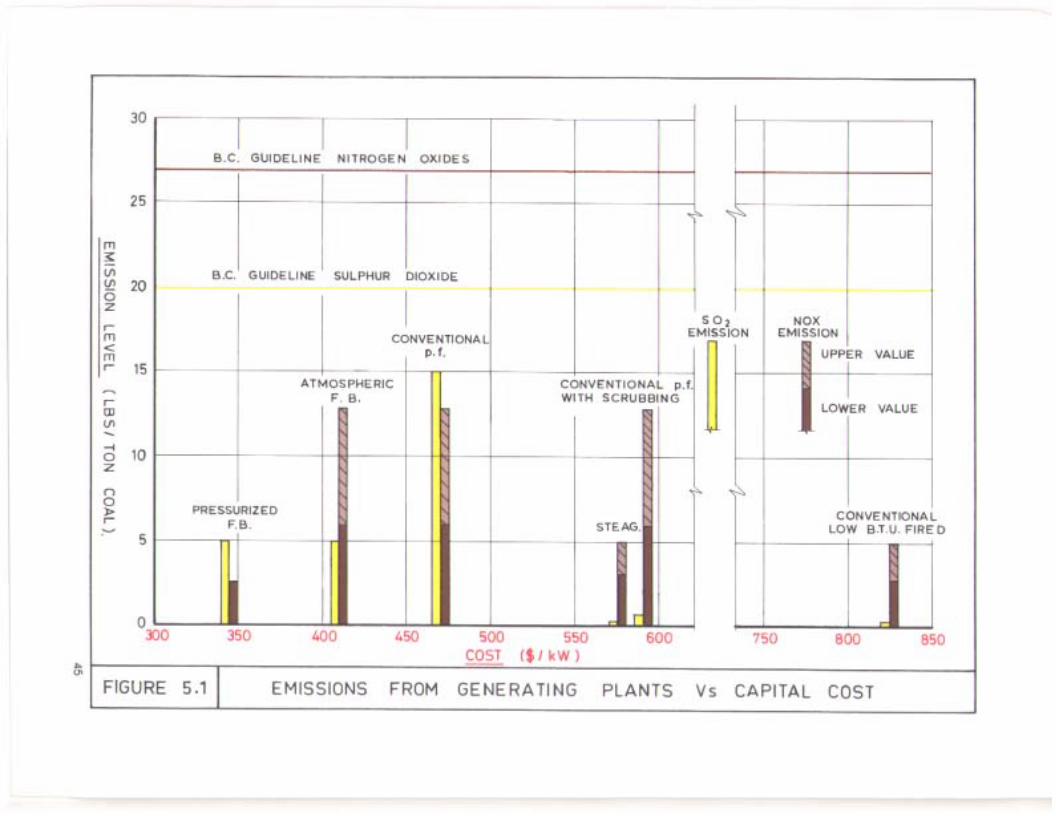


6.0 FUTURE TECHNICAL DEVELOPMENTS
This section discusses the future development of the technologies covered by this report. In most cases the developers themselves have relatively firm plans for the period 19751985, although these plans will depend on many outside factors, including the availability of adequate funding. It is also possible to make predictions about developments from 19851990, though with less confidence.
6.1 CONVENTIONAL PULVERIZED FUEL STEAM GENERATORS During the period from 1945 to about 1965, steam conditions in conventional
generating plants advanced rapidly until they reached a plateau with supercritical conditions at 3500 psig/1oOOO”F/1OOO’F and often a second reheat of loOO’F, and subcritical conditions of 2400 psig/lOoO”F/1OOO”F. In Continental Europe, once through subcritical boilers are common with pressures of about 2712800 psig, while in the U.K. 2350 psig/1050”F/1050’F is used as standard for coal burning units.
In the 1960’s several experimental units were built with steam temperatures of 1100 and 12OO’F, in particular the Eddystone station at Philadelphia Electric, the Bergen station of the Public Service of New Jersey and Drakelow ‘c’ of the Central Electricity Generating Board of the U.K. The reliability of these units has been poor and the two U.S. installations have been down rated to 1000°F. As a result the industry determined that increases in temperature above 1000°F are not justified and no further plans for such units have been announced.
Operation at above 1050°F requires austenitic type stainless steel in the high temperature areas whereas ferritic steels are satisfactory up to approximately 105O’F. These austenitic steels are considerably more expensive than the ferritic steels.
Robson, Giramonti et al. (6) did a brief comparison of the economics of the 2,400 psig/1OOO”F/1OOO”F cycle with a40OO/psig/1200”F/1200”F cycle. The work was done in 1970 and the costs are not representative of today’s figures, but as a percentage they are still relevant. They showed that the material and erection costs for the high temperature boiler would increase its price by about 18120 percent, the turbine price would increase about 30 percent, and other equipment, such as high pressure piping, would bring the total incremental cost for the high temperature system to about 10 or 11 percent. The improvement in efficiency is about 3.4 points. At that time this could not be justified unless the fuel cost exceeded 45/50 cents per million Btu, but with today’s plant costs and interest rates it would require a fuel cost of more than twice that even if the loss of reliability were ignored.
If new high efficiency technology is to be developed gasification/combined cycles and fluidized combustion offer improved efficiency by an easier route and these are likely to obtain development effort. These two techniques can also reduce the trend towards highersite costs.
52

6.2 FLUIDIZED COMBUSTION
Fluidized combustion offers economic, efficient and clean combustion of a wide range of fuels, particularly those considered difficult in normal combustion processes. It provides direct conversion of the chemical energy of the fuel into steam and thence power, in contrast to gasification which employs an extra stage by converting the raw energy form before combustion.
The pressurized fluidized combustion system appears better suited than the atmospheric system to large utility installations. The pressurized system will offer a number of advantages over the atmospheric provided that its development problems can be overcome. Some of these advantages are:
(a) heat transfer rates at 15 atmospheres are up to 15 times those of the atmospheric unit for an equivalent fluidizing velocity. This leads to a significant reduction in steam generator size, and should have the same effect on cost.
(W the pressurized unit is ideally suited to combined cycle operation and has potential for efficiencies in the range 40/42%(22).The atmospheric unit has an efficiency slightly lower than that of conventional pulverized firing at about 33/361/z% and offers littlescopefor improvement in efficiency.
(a the pressurized unit offers the same low level of sulphur emissions but a reduced level of NO., emission.
VJ) the pressurized system incorporates small compact boilers and gas turbines and is better suited to modular factory construction. Site costs are reduced.
Against these benefits the pressurized system pays the penalty of a more complex control system involving three separate flywheel systems, the gas turbine, the bed, and the steam turbine.
6.2.1 DEVELOPMENT OF ATMOSPHERIC FLUIDIZED COMBUSTION
Atmospheric fluidized combustion is at a more advanced stage of development than pressurized, and a number of units are now under construction or in operation. Babcock and Wilcox, U.K., commissioned a 30,000 lblhr unit at Renfrew, Scotland in 1975 and it is operating successfully. Foster Wheeler, in collaboration with Pope Evans and Robbins, have constructed a 300,000 lblhr unit at Rivesville which is scheduled for operation in April 1976.
A 30,000 lblhr unit is under construction in South Africa under a licence agreement between the manufacturer and CSL. CSL have had negotiations with potential licencees in Sweden, Belgium and the U.S.A., and Germany and Brazil are also showing interest.
Foster Wheeler intend to put a 200 MW atmospheric unit into operation in the early 1980s and propose that later units could be based on 200 MW modules. Babcock and Wilcox (U.K.) are prepared to take orders now for units up to about 60 MW.
Combustion Systems Limited are more confident and believe that a large unit could be ordered now with reasonably secure performance definitions. An engineering phase of one year is suggested by CSL prior to finalizing details of the boiler design, giving an overall schedule to commissioning of 7M years.
Study A indicates that while there is no technical reason why a unit of 500 MW cannot be installed by mid-1983, it should be recognized that the process is untried
53

for power generation on a large scale and the risks involved in the initial application of the technology are probably greater than those that would usually be taken in the provision of a large capacity generating plant.
The main development effort of atmospheric fluidized combustion will be towards providing units which can handle varied and difficult fuels. For this reason the atmospheric system will probably find more use in industrial applications than in central utility generation. Many industries will see the opportunity to burn a number of industrial waste and by-product materials in addition to a base fuel such as coal or wood waste.
6.2.2 DEVELOPMENT OF PRESSURIZED FLUIDIZED COMBUSTION
Pressurized fluidized combustion systems appear to be developing on three main fronts:
(4 ERDA Funding - ERDA recently requested proposals for a pressurized fluidired combustion design study for a pilot plant of about 60 MW. It is proposed that the pilot plant be installed on a site owned by a U.S. utility, and that it be followed by a full scale plant (larger than 60 MW). Proposals were received from a number of groups, but it appears, at present, that design studies will be awarded to the following.
General Electric/Foster Wheeler Constortium in co-operation with CSL for pressurized Rankine cycle (combined steam and gas cycle);
Curtis Wright group for pressurized air heater cycle of about the same size - award now confirmed.
It is anticipated that contracts for one or two pilot plants will follow for operation in the early 1980s.
(‘4 The IEA proposes to erect a pilot pressurized fluidized combustion unit at Grimethorpe in the U.K. to act as an advanced test rig. Initially this unit will not have a gas turbine associated with it. The funding is by the U.K.. U.S. and Germany, although there is some possibility that Canada and Holland will take a half share each.
(cl Pressurized combustion air heater cycles of about 60170 MW are being promoted quite actively by a number of companies including Stal-Lava1 (ASEA) and Woodall-Duckham. The air heater cycle is the simplest form of pressurized combustion unit and its sponsors claim that such a unit could be in operation in about five years. One of the advantages of this unit is that the standard gas turbine oil fired combustor can be supplied in addition to the pressurized combustion unit, and in an emergency the gas turbine can be run on oil. A fuller description of this type of unit is given in Section 9.0. While the air cycle appears to have early potential: it is unlikely to be competitive for central utility generation in the long term.
The best prospect for large scale utility plants appears to lie with the pressurized Rankine unit but it is the opinion of Combustion Systems Limited, stated in Study A, that a further five years are required for the development of this type of plant to the point at which a large scale commercial unit could be ordered. This implies that the earliest in-service date of a commercial scale unit is 1988, but even this may be optimisticand will depend on the progress and funding of the ERDA programme.
54

6.3 COMBINED CYCLE GASIFICATION
This is one of the two routes favoured by ERDA and the authorities in Europe for advanced power generation from coal. The technique offers generating efficiencies substantially higher than those envisaged by any other process which does not supply waste heat to an outside source, together with almost complete elimination of SO,, NO, and particulate emissions, and a reduction of site costs through reduced size of components and modular construction. Combined cycles also consume less water than conventional generation.
Although many types of combined cycles have been built and proposed, two principle systems are now being developed seriously, these being the supercharged fully fired cycle favoured by STEAG in West Germany and the unfired systems of the U.S. and other European manufacturers. To understand the difference between the cycles and their relative performance, it is necessary to consider the basics of combined cycle performance and the effect that various parameters have on cycle efficiency. In this section the parameters affecting the types of combined cycle which can be used with pressurized fluidized combustion will also beconsidered.
Figure 6.1, page 63, shows and unfired cycle and a supercharged cycle diagrammatically. In the unfired cycle the gas turbine exhaust heat is passed to a simple exhaust heat recovery boiler, which produces steam for the steam cycle. In the super- charged cycle the pressurized boiler supplies steam to the steam cycle and gas to the gas turbine.
6.3.1 UNFIRED CYCLES
The factors effecting the efficiency of unfired cycles can be understood by considering Figure 6.2, page 64. Figure 62(a), shows that about 66% of the heat input of a 1975 design gas turbine is rejected as waste heat. If this heat is utilized to generate steam, Figure 6.2(b), page 64, shows that the efficiency of the steam cycle is limited to about 21% net. Even with such a poor steam cycle efficiency, the combined cycle net efficiency is 42.2% which exceeds the best supercritical steam plant practice. Note that in Figure 6.2(b), page 64, the gas turbine output is lower than that in Figure 6.2(a), page64, becauseof the back pressure imposed on it by the waste heat boiler.
The reasons for the poor utilization of the gas turbine exhaust heat in an unfired cycle are:
1. The exhaust gas temperature of a lower pressure ratio 1975 gas turbine such as GEs MS 7000E is about 1000°F. Assuming that the minimum acceptable stack temperature is 25O”F, to prevent stack corrosion, only 75% of the gas turbine’s exhaust energy can be used.
2. The exhaust gas temperature of 1000°F limits the upper steam temperature which can be used to about 950°F or lower. This in turn limits the efficiency of the steam cycle.
3. A full regenerative feedheating plant cannot be employed because the gas turbine exhaust gas provides most of the energy required for condensate heating if it is to befullyutilized down to250”F.
The only ways in which the efficiency of the steam cycle can be improved are by increasing the gas turbine exhaust temperature, by utilizing a reheat cycle and as low a back pressure as is feasible, or by adding further heat in the exhaust heat recovery boiler. Of these measures the first, increasing the exhaust temperature of the gas
55

turbine, can only be achieved by developments which increase the firing temperature of the gas turbine, although the exhaust temperature is affected by pressure ratio. It is therefore a function of the development of gas turbine technology.
Improvements resulting from using a reheat cycle and using the best possible back pressure can be assessed from a straight economic optimization of efficiency against cost. In general terms U.S. unfired combined cycles aimed at mid range markets have not used a reheat cycle in the past, but those developed for base load, with increasingly expensive fuels, increasingly will. The third means of improving the steam cycle efficiency does not improve the overall efficiency because heat added at this point will only be utilized with the efficiency of the steam cycle rather than the combined cycle. There is one exception to this; if the addition of heat in the boiler permits the use of substantially better steam conditions than are possible in an unfired configuration, the overall cycleefficiency may improve.
As gas turbine exhaust temperatures have risen, in step with increases in firing temperature, the possible benefits of improving steam conditions by adding heat behind the gas turbine have diminished. With a 1975 gas turbine firing temperature of 1950°F and exhaust temperature of lOOO”F, the possible gains are very small. As firing temperatures increase further it will be possible to use an efficient 2400 psigl 1OOO’F/1OOO”F steam cycle in unfired configuration, and from that time the steam cycle component of combined cycle efficiency will be fixed. The gas turbine efficiency. and hence the overall cycle efficiency, will continue to rise with improvements in firing temperature which have averaged up to 50°F per year in recent years.
6.3.2 SUPERCHARGED COMBINED CYCLE The supercharged fully fired cycle, favoured by STEAG is not so dependent on gas
turbine firing temperature as is the unfired cycle. The STEAG cycle proposed in Study 8, obtains about 74% of its power from the 2800 psig/1000”F/1060”F steam cycleand the gas turbine inlet temperature is a very modest 1560°F. The efficiency of this cycle gains from two important advantages despite the relatively low firing temperature. The first is that the gases passing through the gas turbine are the product of stochiometric combustion (15% excess air) which takes place in the pressurized boiler. As a result the ratio of gas turbine output to the power absorbed by the compressor is much higher than in a normal gas turbine where the compressor must do work on the large quantity of excess air which is required for dilution to keep the firing temperature down. This advantage is worth about 48 MW at the optimum firing temperature of 1562’F proposed in Study 8. The advantage diminishes when compared to future high temperature gas turbines which will themselves move closer to stochiometric combustion. The efficiency of the supercharged cycle also benefits from it suse of normal subcritical conditions.
It is therefore possible to build a supercharged combined cycle with an efficiency of 40.3% using a firing temperature which is already quite conservative. Thus, the supercharged cycle can already offer an efficiency which the unfired cycles will not be able to match until firing temperatures increase several hundred degrees F. However, the efficiency of the supercharged cycle can be improved little with future increases in firing temperature, as Figure 6.6, page 68, which is a Westinghouse curve taken from Study B. demonstrates. The reason for this is explained below.
In the supercharged cycle the gas turbine exhaust heat is used for condensate feedheating. If the amount of heat in the gas turbine exhaust is increased some of the duty of the supercharged boiler will be handled by the exhaust heat recovery unit and in effect the cycle becomesa hybrid where a proportion of the evaporation load is met by the supercharged boilerand the rest by an unfired heat recovery unit.
There is thus a practical limit to the amount of exhaust heat which the gas turbine can produce and this in turn limits the firing temperature which can be utilized for any pressure ratio.
6.3.3 COMBINED CYCLES FOR PRESSURIZED FLUIDIZED COMBUSTION
The major factors influencing the combined cycle for a pressurized fluidized combustion unit are the temperature and pressure of the bed. These parameters effectively define the operating conditions of the gas turbine.
If sulphur is to be removed by limestone or dolomite in the bed, the bed temperature is limited to 1750°F. Above that temperature the absorpiton of sulphur is not effective and drops off rapidly.
In Study A the pressure and temperature are determined by the availability of suitable gas turbines. Most modern single shaft machines such as those of Westinghouse, General Electric and Brown Boveri have a pressure ratio in the range lo/12 and a firing temperature of 1800.2000°F. In Study A the ASEA GT120 is selected because this two shaft machine combines an unusually high pressure ratio of 169 with a low firing temperature. The high pressure ratio increases the heat transfer co-efficient for the tubes immersed in the bed and thereby reduces the bed size.
The pressurized beds selected in Study A are sized for the compressor discharge flow of the GT120. This in turn defines the size of the bed and the output of the associated steam cycle.
If the efficiency of the combined cycle were to be optimized thermodynamically the highest acceptable bed temperature would be chosen and the optimum pressure ratio for that temperature calculated. Such a procedure would require a gas turbine designed and built specifically for the application.
Several U.S. manufacturers hope to improve the efficiency of pressurized fluidized combustion by operating the bed at the highest temperature which is acceptable to state of the art gas turbines. This will undoubtedly improve the cycle efficiency but presents metallurgical problems in addition to the problems of sulphur removal and ash fusion already discussed.
6.3.5 FUTURE DEVELOPMENTS
Having established that the STEAG supercharged cycle can give efficiencies now of a level which the U.S. unfired cycles will not match for several years, it is relevant to consider the potential of the advanced unfired combined cycles which will become available in future, and the overall efficiency of such cycles when integrated with gasification processes. (The subject of future gas turbine technology is discussed separately in 6.4.)
There is no doubt that spectacular increases will be achieved but the companies involved differ quite radically in their predictions of future net efficiency. The matter is complicated by doubts about the reliability and cost of high temperature gas turbines and the availability of high temperature fuel gas clean up systems. The ability of high temperature fuel clean up systems to remove ammonia is also a major uncertainty.
Table 6.1, page 63, illustrates the predictions of the three major U.S. gas turbine manufacturers.
57

TABLE 6.1 PREDICTED FIRING TEMPERATURES 8 NET CYCLE EFFICIENCY
Low Btu Gas Fired Gas Turbines and Combined Cycles
General Electric Westinghouse
UnitedTechnologies
FlRfNG TEMPERATURE
(‘F) MID LATE
1980s 1980s
2400 3000 2600 3000
2600 3000
NET GASIFICATION/ COMBINEDCYCLE DESIGN
EFFICIENCY (%) PHfLOSOPHY
MID LATE 1980s 1980s
38.3(C) 41.9(C) Mid Range 44.5(C) N.A. Base Load 46.8(H) 42/44(C) N.A. Base Load 46/48(H)
The General Electric figures are conservative, and in the cycle design more attention has been paid to capital cost and operating simplicity than to efficiency. The mid-1980’s scheme has a non-reheat steam cycle. Westinghouse show that an improvement of three percentage points can be achieved by the use of a reheat cycle which brings the G.E. figures closer to those of the other two companies.
6.4 SNG GASIFICATION - ADVANCED PROCESSES
The purpose of this section is to examine, briefly, improvements which second generation SNG gasification processes may be able to offer.
All major SNG gasification processes attempt to make methane (CH,) from the carbon and hydrogen in coal. Unfortunately a typical carbon to hydrogen mass ratio in coal is 15.18:l in comparison to 3:l for the methane. In order to convert coal to gas, either hydrogen must be added or carbon must be rejected. It will be shown that the most efficient way is to add as much hydrogen as possible to minimize the rejection of carbon.
6.4.1 HYDRO-GASIFICATION
The basic chemistry of SNG coal gasification is shown simply in the equation CH,, (coal) + Ha0 - 0.6 CH, + 0.4 CO, (1). It can be seen that 40% of the carbon is rejected as CO,. The 40% carbon rejection is the minimum amount which can be discarded, because it represents the amount required to remove the oxygen from the water and thus liberate hydrogen. This type of gasification is called hydro-gasification or hydrogenation, and it is the aim of all second generation processes to produce as much methane as possible directly. (In fact strictly hydro-gasification refers to the reaction of coal and hydrogen, but the hydrogen comes from water.)
6.4.2 SYNTHESIS
In practice it is not feasible to create the above reaction in a single stage because the conditions for the formation of methane are generally such that the reaction
55

is intolerably slow. As a result the conversion is carried out by synthesis reaction; in steps as follows:
- Coal is reacted with steam and oxygen at relatively high temperatures to produce hydrogen and carbon oxides. 2C+3H,O-+CO+CO,+3H, (2) This reaction is endothermic and below 1600°F is unacceptably slow. It is normal to arrange for it to take place between 1900-2500” F.
- The next step is the water-gasshift reaction: CO + H,O-CO, + H, (3) This reaction is controlled so that the product gas contains hydrogen and carbon monoxide in the three to one ratio which is required for the production of methane.
The carbon dioxide is then rejected, the gas cleaned and catalytic methanation takes place by reaction: CO + 3H, -H,O + CH, (4)
The main reason synthesis through reactions (2) (3) and (4) is Less efficient than hydro-gasification through reaction (1) is that reaction (2) requires a large heat input at a temperature level which cannot be satisfied by the exothermic reaction (4). The heat must therefore be supplied by some means such as burning some of the carbon in oxygen. (Electric heat and other methods have been considered). The carbon that is burned to provide heat for reaction (2) adds to the carbon dioxide rejection. Most of the large amount of the heat produced by reaction (4) is wasted, although some of it can be used to raise steam.
6.4.3 SECOND GENERATION PROCESSES Advanced gasification processes generally attempt to maximize the formation of
methane in the gasifier by using a hydrogen-rich gas in a modified form of reaction (1). CH,., + H,, = CH,. This reaction is exothermic and takes place at a high enough temperature level for the heat which it releases to be used in reaction (2) which will be taking place at the same time. By trying to encourage reaction (1) second generation processes reduce the amount of carbon which must be burned to provide heat for reaction (2) and reduce the amount of methanation which must take place by reaction (4) with its resulting heat losses. The total carbon rejected as CO, is also reduced.
IGT estimate that a successful process using hydro-gasification could operate with an efficiency level of 65.70% in contrast to 50.55% for the pure synthesis-methanation process (11).
In fact actual processes generally fall somewhere between the two theoretical concepts. In the Lurgi up to 40% of the methane may be produced in the gasifiers while Hygas and Hydrane process sponsors claim figures of about 75 and 95%.
The efficiency of a Lurgi producing SNG with Hat Creek coal has been calculated by Lummus in Study C as about 63%. Lummus, in Study C, confirm that the Synthane process will be more efficient than the Lurgi in producing Medium Btu gas and SNG but that the improvement in efficiency doesn’t point to any immediate saving in the cost of SNG.
Second generation gasification techniques will offer improvements in efficiency and cost, but it is impossible to predict the magnitude of such improvements accurately. It has already been noted that such costs as are available for second generation processes tend to be ‘safe’. The cost of savings will result from higher
59

materials throughputs and improved gas clean up techniques, but Lummus point out that the proportion of the total cost subject to reductions is quite small. Section 5 noted that reductions in gas price between 10.15% (4) and 20.30% (ll), have been suggested for the second generation processes. It seems unlikely that real savings of more than 10% compared to the Lurgi can beachieved in the medium term.
6.5 GAS TURBINES
The development of gas turbines for industrial generation has been rapid? obtaining its stimulus from the development of military and civil jet engines and the urgent need in the mid-1960s for utility black start peaking plant. In the period 1960.1973 the average firing temperature of industrial gas turbines increased by about 50°F per year, of which 40% or about 20°F per year resulted from improvements in metallurgy and the other 30°F from advances in cooling techniques.
The rapid increase in firing temperatures has resulted as much from an attempt to reduce unit specific costs, as the need to improve efficiency. In fact improvements of specific cost has been more dramatic than those in efficiency, because metallurgical limitations have meant that more than half of the improvement in firing temperature has come from improved blade cooling and while increasing the temperature though blade cooling is an effective way of increasing output it doesn’t improve efficiency much. The improvement in specific cost can be seen by comparing the specific output of gas turbines now available in the U.S. market with the equivalent machines of 10 years ago, and projections for the next 15 years.
GasTurbine RelativeOutput MW Specific Output - HP/lb Airflow
1965 1975 1985 1990
1 1.62 2.46 3.71 105 170 260 390
Although improvements in gas turbine specific power may be of even greater importance to the economics of the combined cycle/gasification plant than improvements in efficiency, it is almost impossible to quantify the improvements in specific cost which the industry may achieve. To do this meaningfully it would be necessary to know the future cost of materials and labour. It should be noted that the specific cost of gas turbines in the US. consistently dropped, until 1973174, from an average of $96 per kW in 1959 to $65 per kW in 1973 (17). The average cost in 1975 was $75 per kW, substantially below the 1959 figure despite the effect of inflation. This success has resulted from improvements in specific output and the figures above suggest that such improvements will continue even if they do not match the rate of inflation.
65.1 IMPROVEMENTS IN EFFICIENCY
Improvements in gas turbine efficiency come from increases in firing temperature, increases in pressure ratio, reduced pressure drops in combustors and from better blading efficiencies in the turbomachinery.
(a) Temperature
It has already been noted that increases in firing temperature can be achieved by increased turbine air cooling, but the air used for cooling is normally bled from the compressor discharge and itself represents a loss by absorbing more work in the compressor than it gives to the turbine. Figure 6.3, page 65, produced by United Technologies (United Aircraft Corp.) shows typical net gas turbine efficiency against turbine inlet temperature, or firing temperature, and pressure ratio for 1975 blade
60
materials and cooling techniques. It can be seen that with pressure ratios between 12 and 20, gains in efficiency are quite small as the firing temperature is increased above 2200°F. Improving gas turbine efficiency beyond this point requires the development of turbine rotor disc and blade materials which will stand higher temperatures or of cooling techniques which require less air. At present, turbine discs in industrial units operate with temperatures of no more than 750°F through cooling by compressor discharge air. This allows the use of relatively inexpensive materials. As gas turbine firing temperatures increase beyond 2200°F disc materials similar to those now used in aircraft engines will be required. Typical materials are IN-100 which can operate at up to 1400°F.
For high temperature blades, the aircraft industry has developed materials which are suitable for short-time high strength applications. An aircraft propulsion unit can afford to operate inefficiently with high cooling air bleed during take-off and it is a feature of such engines that the ratio of take-off to base load power is very high.
Advanced industrial gas turbines will require new materials such as those now being developed for advanced military jet engines, including modified B-19OOA alloy and directionally solified eutectic alloys. In addition some chromium based alloys and coated columbian show great promise. Figure 6.4, page 66, by courtesy of United Technologies show probable material creep strength advances against temperature, for current engines, second generation engines available in the early 1980s and third generation engines availableabout 1990.
To obtain firing temperatures above those which the alloys can withstand, it is necessary to supply air cooling to fixed and moving blades. The amount of turbine cooling air required rises sharply at high temperatures, from about 3% of total flow at 2000°F to 5% at 2200°F 16:l pressure ratio, 6% at 2400°F 16:l and 12115% at 28OO’F. Figure 6.5, page 67, shows the overall effect with the amount of cooling flow and different cooling techniques have on efficiency. There are a number of complex ways of cooling blades and the better ones reduce the cooling flow needed for a given metal temperature. The techniques available are described in the next few paragraphs.
Simple Convection Cooling: - This has long been used in new engines and is now universally employed in the fixed and moving blades of industrial gas turbines. Air flows up from the root of the blade through radial passages and is exhausted radially.
Advanced Impingement Convection Cooling: - This technique should afford baseload operation at turbine firing temperatures as high as 2400°F. It is now used in aircraft units with short term ratings of over 2700°F and baseload ratings of 2400°F. Air flows out of a central cavity in a forward direction and impinges at high velocity on the inside of the leading edge.
Film Cooling: - This method should be available for industrial gas turbines in the mid 1980’s. Air is injected through radial slots in hollow blades to provide an insulating layer.
Transpiration Cooling: - This is the most advanced of the air cooling techniques, in which air is bled through a large number of small drilled holes along the aerofoil surface. This may allow temperatures of 3000°F to be achieved if it can be developed successfully.
Water Cooling: - General Electric have tested water cooled vanes and blades in test rigs at 3500°F and appear to favour them for very high temperatures.
Ceramic Blading - Figure 6.5, page 67, showed the efficiency advantage of ceramic blading. A number of programs are being funded for the development of
61

ceramic blades and discs and encouraging results have been obtained with materials such as silicon nitride and silicon carbide (14) (15) (16). High flexural strengths of 100,000 psi at 2200°F have already been achieved, and the materials do not appear to be as brittle as had been anticipated. In a recent incident on a Westinghouse rig, silicon carbide guide vanes withstood a failure of metal components further upstream which impacted against them at over 2500°F. The vanes also withstood a temperature drop from 3000”Fto600’Finamatterofseconds(18).
One of the great advantages of ceramic blading is higher resistance to corrosion and oxidation attack. All modern blade alloys are most susceptible to attack by vanadium, sodium and potassium above 1100/1200”F, and sulphates above 18OO”F, and although low Btu gas should be almost completely free of these materials, assurance against all forms of corrosive attack is not possible with alloy blades.
(b) Pressure Ratio
High pressure ratios themselves are not a difficult design problem. Aircraft engines are already in service with pressure ratios of above 25, even though these are achieved with 2 or 3 rotors running at different speeds. The industry has the capability of building machines with pressure ratios as high as any which will be required for optimum efficiency in the next 15 years.
(c) Pressure Drop
The pressure drop through the combustion chambers of modern gas turbines is so low that little improvement can begained in thisarea.
(d) Blading Efficiency
Modern gas turbines achieve high blading efficiences in the compressor and power turbine, and it will be difficult to improve overall gas turbine efficiency significantly through improvements in this area.
65.1 REGENERATIVE AND CLOSE CYCLE UNITS
High efficiency can be obtained with regenerative gas turbines and close cycle gas or helium turbines. but these do not appear to have any application with coal gasification.
6.5.2 FUTURE PREDICTIONS
Until two years ago the gas turbine industry was confident that it could maintain its development rate of 5O’F increase in firing temperature per year. The slowdown which the industry has suffered during the oil and gas shortages, has halved the speed of development and left many new engines programs in doubt (23). Recently ERDA announced their intention of funding the development of 2600°F engines because it is their opinion that this is the level which is required for economical integrated gasification combined cycle systems, with unfired boilers. Whether the industry can achieve such temperatures by 198111982 with the funding which ERDA is making available, remains to be seen, but the record of this industry has been most impressive and it appears capableof meeting theseobjectives.
62

Figure 6.1
rfuel stack
UNFIREO CYCLE
compressor
I - L-l turbine
heaters
SUPERCHARGE0 CYCLE

Figure 6.2(a) SIMPLECYCLEGASTURBINE(197411975) ENERGY UTILIZATION
HEAT FROM FUEL
Figure 6.2(b) UNFIRED COMBINED CYCLE(l87411975 GASTURBINE) HEAT UTILIZATION
64

Figure 6.3 GASTURBINE PERFORMANCE
I I I I COMPRESSOR
PRESSURE RATIO
(Courtesy United Technologies)
TURBINE INLET TEMPERATURE, F.
20 I I I I 1 80 100 120 140 160 180
NET POWER PER UNIT AIRFLOW - (KW/l~R/SFC 1
65

Figure 6.4 CREEP STRENGTH FOR ADVANCED TURBINE BLADE MATERIALS (Robson etal. 1970)
)
I 4 AMS 5382-’
-2ND PItiD 3RI STAGE BLADI
SPEC
2-
IM-
\ \ \ i’ \ \ /I )‘- ES
I
.BASE ALLO’
IC WEIGHT L B ‘FT3
IS,
” 584 \
= 555 5
2ND I
5:
1203 1400 1600 1800 21
66 METALTEMPERATURE-F
:C
i
1
I
----I ,
! I
I .“MBI”M-Bd ALLOYS
I COLUMBIUM- AND CHROMIUM-,
BASE ALLOY5
2200
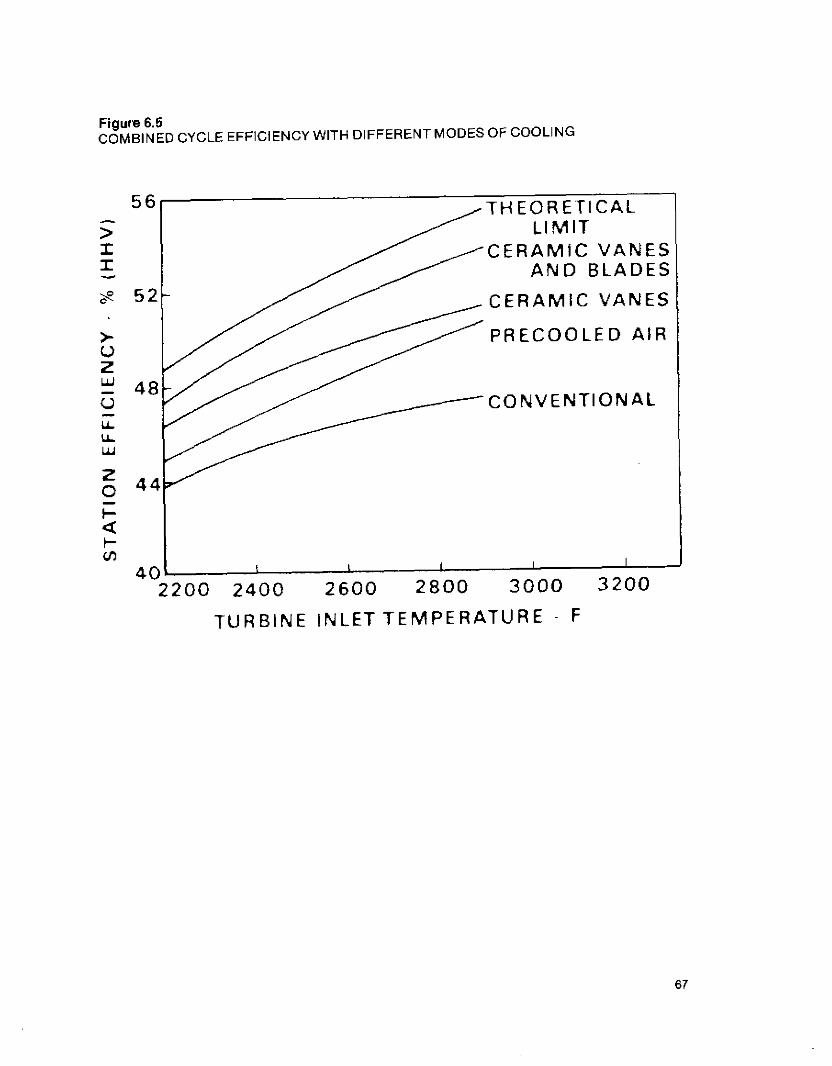
Figure 6.5 COMBINED CYCLE EFFICIENCY WITH DIFFERENTMODES OF COOLING
56 THEORETICAL LIMIT
CERAMIC VANES AND BLADES
CERAMIC VANES
PRECOOLED AIR
CONVENTIONAL
40, t L 1 ! I 2200 2400 2600 2800 3000 3200
TURBINE INLET TEMPERATURE F

Figure 6.6 PERFORMANCE COMPARISON BETWEEN EXHAUST-HEATED UNFIRED.BOILER AND PRESSURIZED-BOILER COMBINEDCYCLES.
7400
5 7600
e
8400
AIR-COOLEDGAS-TURBINE BLADING
EXHAUST.HEATED GNFIRED BOILER
PRESSURIZED BOILER
1800 2000 2203 2400
GAS-TURBINE INLETTEMPERATURE - “F
68

7.0 EMISSIONS
This section examlnes the improvement which the different advanced generation processes offer in the emission of various pollutants.
7.1 SULPHUR DIOXIDE The Hat Creek coal has a low sulphur content; averaging39% by weight, for 25%
ash 20% moisture coal. The emissions from a conventional plant burning this coal are acceptable under present provincial Pollution Control Objectives which define them in relation to the tonnage of coal burnt. In fact, the sulphur oxide emissions would average less than 75% of the allowable limit as Table 7.1, page:72, demonstrates.
There are two special reasons why it might be desirable to reduce the level of sulphur dioxide emissions from a plant at Hat Creek. The first is that future emission standards may be expressed in terms of emission per million Btu’s burnt. This is the way that the Environmental Protection Agency (EPA) in the U.S. defines SO, emissions. Such a method of definition penalized plants burning coal of low heating value such as that at Hat Greek.
In fact, the existing EPA standard when applied to Hat Creek coal gives an emission level which is lower than the British Columbia objectives, and one which a Hat Creek plant might theoretically exceed if the sulphur level were to rise above the average value of .39% for a short period. It is difficult to predict SO, emissions exactly because not all of the sulphur in the coal is emitted as SO,, and the table thereforecontainsan inherent margin.
The second reason why SO, scrubbing may be desirable is that the large deposit at Hat Creek may support successive thermal plants, or power/industrial/petrochemical complexes, and at some future time the valley’s ability to absorb sulphur dioxide may be limited, even though each plant meetsall existing criteria.
Fluidized combustion and the production of power by gasification both enable the problem of sulphur dioxide emissions to be solved; fluidized combustion through the use of a bed of limestone or dolomite inside which the combustion process takes place, and gasification by removing the sulphur from the fuel gas. It is much easier to remove SO, from the relatively cool fuel gas rather than from the hot dilute products of combustion. The levels of sulphur dioxide emission which can be achieved by fluidized combustion and by gasification/combined cycles are also shown in Table 7.1, page 72.
In practice, a gasification/combined cycle system would probably be designed to pass only a portion of the fuel gas through the sulphur removal plant so that emission criteria were met with a reasonable contingencyandat minimum cost.
Practically all of the sulphur is removed from SNG in its production.
7.2 OXIDES OF NITROGEN (N0.J Oxides of nitrogen are produced in all combustion involving air. They are
69

primarily produced as nitric oxide (NO) but small quantities of nitrogen dioxide (NOJ are also produced.
NO, is produced by three basic processes. The first is the oxidation of free nitrogen which occurs at very high temperatures (generally above 3OOO’F) and is extremely temperature sensitive. A change of 200°F in maximum flame temperature will increase NO, produced by this mechanism by a factor of three. The second is by means of reactions involving the highly reactive free radicals of hydrocarbon fuels. It is thought that these reactions can only occur during the combustion process itself. The third is the reaction of nitrogen bound into the fuel, which may be oxidized at lower temperatures than are required for the first two processes discussed above. In conventional power generation and fluidized combustion, the major formation of NO, comes under the first two categories. In gasification combined cycle systems some NO, may also be formed if the low Btu gas cleanup process does not remove all of the ammonia, and consequently this lower temperature reaction may be the most important.
In conventional coal fired boilers, all measures aimed at reducing NO, attempt to reduce the maximum flame temperature and control the amount of excess air available at the point of ~combustion and the residence time at temperature. Using these techniques, conventional boiler designs have been moderately successful in achieving reduced levels of NO, production (2).
Gas turbine manufacturers suffer the disadvantage of a much higher percentage of excess air but they have been successful in reducing NO, emissions. United Technologies now claim that they have a combustion chamber which can meet the stringent rule 67 of Los Angeles County (13), on a 25 MW class machine, without water injection, while burning distillate or methane fuel at 1975 firing temperatures. Other manufacturers have had similar success without water injection for all but the highest firing temperatures.
Table 7.2, page 73, lists the NO, emissions predicted by Studies A and 8, together with some figures produced by United Technologies for advanced high temperature gas turbines and comparable values for conventional boilers. The figures are not precise, perhaps indicating the large effect that small differences in design can produce.
The advanced generation processes generally give lower NO, emissions than conventional coal burning. There are two exceptions to this; atmospheric fluidized combustion gives emissions of the same magnitude as conventional generation. through the developers claim that little effort has yet been expended in reducing NO, emissions and improvements may be possible; the emission of NO, from low Btu gas fired gas turbines can also, in certain circumstances, be high.
The flame temperature of low Btu gas combustion is lower than that of methane or distillate fuels and although the difference may be only 3001500°F it can lead to NO, emisions an order of magnitude lower. With the low temperature clean up systems now available, the gas entering the combustion chamber will be relatively cool, even if regenerative gas heating is applied to the clean gas.
The fuel delivery temperature has a direct effect on the production of NO,. United Technologies quote typical figures; if a fuel with a heating value of 120 BtulSCF is sent directly to a gas turbine combustor from a low temperature clean up process, typically at lOO’F, the adiabatic combustion temperature is about 3660°F. (The combustion air preheat due to compressor work also affects the temperature.) If a high temperature clean up is used, at about 175O”F, the fuel’s sensible plus chemical heat
70

rises to 148 BtulSCF and the adiabatic combustion temperature increases to 4250°F. Using low temperature clean up and reheating the clean gas gives an adiabatic temperature of about 3900” F.
The high temperature clean up techniques are attractive for cycle efficiency and overall economy and there is an enormous incentive to develop them. In addition to the high combustion temperature which they produce, which in itself may increase NO, formation by at least an order of magnitude, high temperature systems currently under development do not effectively remove Ammonia from the fuel. The figures in Table 7.2, page 73, show the resulting high emission level predicted for future high temperature clean up systems.
NO, emissions from the combustion of SNG depend on the furnace design and inlet air temperature but are generally high, resulting from the high flame temperature which SNG produces.
7.3 CARBON DIOXIDE Practically all of the carbon in the coal becomes carbon dioxide in final use, and
therefore the total CO, emissions from the different plants are dependent on the end use efficiency. SNG gasification produces roughly half of its CO, emissions at the gasification site; the remainder at the point where the gas is burnt. Thus the relative CO, polluting effect of SNG production is worse than electricity generation as about half of the CO, is produced in the domestic or industrial area from a low stack.
7.4 CARBON MONOXIDE Carbon monoxide emissions from conventional power plants, fluidized combustion
and gas turbines have been controlled to meet the most stringent codes.
7.5 WATER VAPOUR Water vapour is now considered a pollutant in British Columbia and can be a
severe hazard at times of high humidity and ice fog.
A simple solution is the provision of dry cooling, but the expense of this measure is such that no utilities in the western world have tried it seriously with large units since the initial experiments at Grootvlei in South Africa, Utrillas in Spain. lmmeburen in Germany and Rugeley in the U.K.
With conventional wet cooling towers the amount of water vapour discharged to the atmosphere is a function of the plant capacity, cycle efficiency and the proportion of the cycle capacity invested in the steam Rankine cycle. The processes considered by these studies are generally more efficient than the conventional Rankine cycle, and will therefore automatically produce less heat rejection and water vapour emission. The gasification/combined cycle processes have the added advantage that a substantial proportion of the power is produced by gas turbines which do not require water cooling. In this context the American unfired cycles typically have a ratio of steam to gas turbine power of 1:3.5 compared with STEAG’s ratio of 1:0.34 and use less water. Table 5.3, page 44, shows anticipated relative levels of water consumption+ could be reduced to some extent by careful system design and the use of brine concentrator or
71

reverse osmosis systems. The use of such systems can almost eliminate the cooling tower blowdown loss which, in Table 5.3, page 44, is assumed to be about 17.5% of the waterconsumption.
Cooling tower blowdown can also be reduced if the towers are operated with higher concentrations of dissolved solids in the water. The raw water which will be obtained from the Thompson River isso low in dissolved solids that it is likely that cooling tower blowdown could be eliminated completely, thus reducing the water consumption figures quoted in Table 5.3, page 44.
7.6 PARTICULATE
It is not yet known whether Hat Creek coal is best suited to hot or cold precipitators but there should be no difficulty in meeting provincial objectives for particulate emissions with any of the systems studied, except possible pressurized fluidized combustion. Ths is one of the most important development problems of the pressurized system. If electostatic precipitators are used with pressurized fluidized combustion they will have to operate at an unusually high temperature with a gas which has so little sulphur that precipitatorefficiency may be low.
7.7 NOISE
The design of power plant to provide low noise emissions requires attention and may be costly. There are no inherent noise problems within a power plant which cannot be overcome, and even gas turbines can be installed with virtually no external emissions.
TABLE 7.1 PREDICTED AND POSSIBLESO, EMISSIONS BURNING HAT CREEK COAL (LBS. PER TON BURNT)
B.C. Provincial Pollution Control Objective EPA Level, U.S.A. -Coal
Conventional PowerGeneration Conventional Power Generation with Gas Scrubbing Conventional Power Generation with 85% of gasscrubbed, 15% by-passed. Fluidized Combustion without limestone in bed Fluidized Combustion
- limestone bed - dolomite bed
Gasification/Combined Cycle
20 15.4 converted value for
Hat Creek coal 15.2’
0.3 (full scrubbing)
2.3
15.2’
5 1.5
Can be reduced to any level down to .002 Ibs.
72
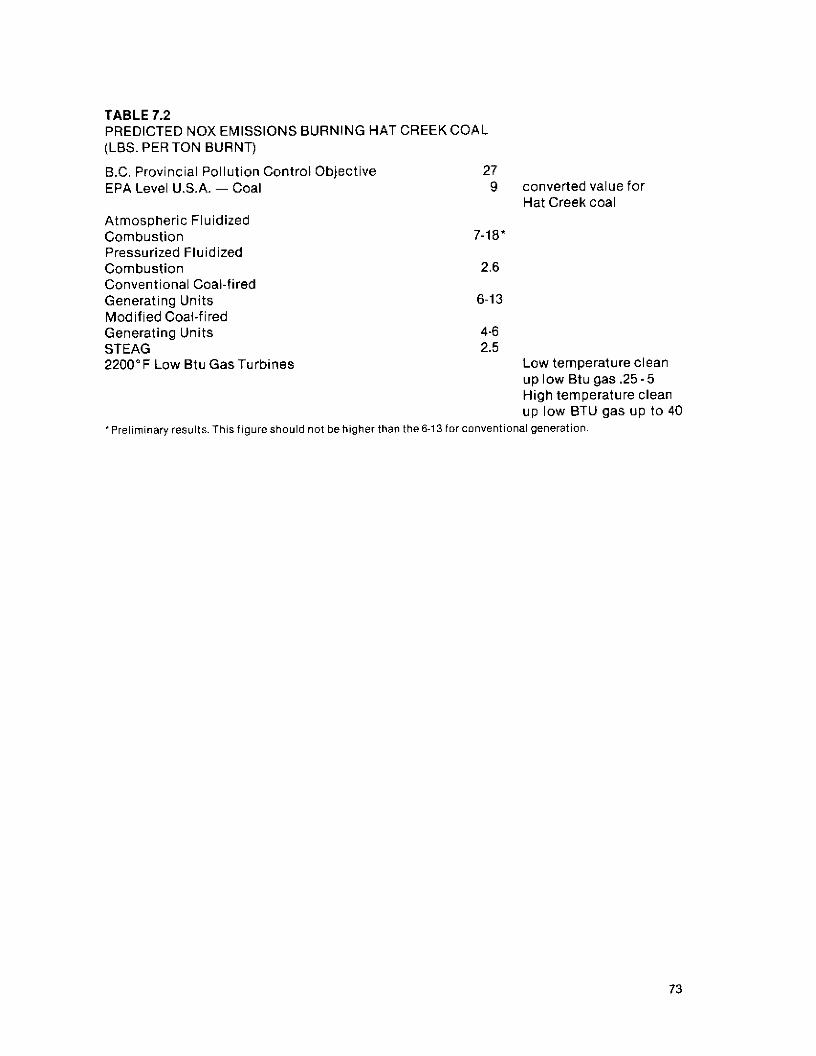
TABLE 7.2 PREDICTED NOX EMISSIONS BURNING HAT CREEK COAL (LBS. PER TON BURNT)
B.C. Provincial Pollution Control Objective 27 EPA Level U.S.A. - Coal 9 converted value for
Hat Creek coal Atmospheric Fluidized Combustion 7.Ia- Pressurized Fluidized Combustion 2.6 Conventional Coal-fired Generating Units 6-13 Modified Coal-fired Generating Units 4-6 STEAG 2.5 2200°F Low Btu GasTurbines Low temperatureclean
up low Btu gas .25.5 High temperature clean up low BTU gas up to 40
‘Preliminaryresults.Thisfigureshouldnot behigherthan the6-13forconventionalgeneration.
73

8.0 RECONCILIATION OF STUDY REPORTS A-D
8.1 INTRODUCTION
The studies overlap in a number of ways and it is necessary to put them on the same basis. Where possible, this was done in the early stages of the studies. by assembling the “Base Engineering and Cost Criteria”. In addition to this, further reconciliation has been required on the results of the studies, especially with respect to contingency, operating costs, extent of supply, IDCand scheduling.
Studies B and C overlap in producing cost estimates for low Btu air blown gas. The comparison between the estimates from the two sides of the Atlantic is valuable, but it must be considered in the context of the relative cost of coal in Germany and Hat Creek.
STEAG put most of their emphasis on efficiency because their design has been optimized for coal costing $27 per ton. The Lummus estimate, being based on Hat Creek coal costing $3 per ton, derives a lower first cost and a lower operating efficiency.
8.2 INTEREST DURING CONSTRUCTION AND SCHEDULING
With interest rates of lo%, all plant cost estimates are sensitive to IDC calculations. and to scheduling. It is possible to calculate total project IDC costs as low as Xl%, or as high as 30% of capital cost, depending on the type of schedule on which the calculation is based. Nuclear units such as the 600 MW Point Lepreau unit in New Brunswick have total IDC costs as high as 33%.
Taking a 4 x 500 MW conventional coal burning station as the reference point, such a station will incur relatively high interest charges if it is built as a single station and the majority of the major civil works are completed at the time the first unit is built. The alternative is to duplicate many items such as the stack and to extend other works on an annual basis, which is uneconomic because contractors are faced with a series of smaller contracts with gaps between them. A station built on a unit basis usually looks unattractive! and may be more expensive to operate and maintain.
If larger units are installed, the IDC will be reduced, but the B.C. Hydro system may not be able to use all of the energy in the first years and the cost of unused capacity might offset the gain in IDC.
It should be stressed, therefore. that although the multi-unit single station concept is usually the most economic in overall terms, it does incur high IDC charges.
These studies have been based on a schedule prepared by B.C. Hydro which produces IDC charges of 26.6% on the total cost of a four unit 2000 MW conventional slant.
74

The same rate has been used in Study A for the atmospheric system. Although the engineering time for fluidized combustion may be long, it has been assumed that the overall IDC should vary little. This assumption may not be valid for the pressurized system, when developed, because the modular construction of the boilers and gas turbines reduces the amount of site construction and the length of the overall schedule. The steam turbine delivery limits the amount by which the schedule can be shortened. A figure of 21% has been used for pressurized fluidized combustion, representing a programme of just over 4 years from the procurement of boiler and steam turbine.
Study B estimates that a construction period of three years with a commissioning period of six months is adequate for the STEAG unit, if two years is allowed for engineering and initial procurement. The steam turbine is probably the limiting item again and the 3% years allowed in Study B for delivery and erection and commissioning is too short a period if competitive offers from different manufacturers are to be obtained. On this basis 21% IDC agains seems reasonable, and the costs of Study B are shown with this level of interest. There might be some justification in using even lower charges for G.E.‘s unfired cycle because all its components are relatively simple and even the steam turbine is a non-reheat unit, but the overall construction time would always be limited by the gasification schedule, shown in Study C to be three years.
In Study C different levels of IDC cost are used for each type of gas production, varying from three years and 22.5% to 64 months and 27.6%. These line up with other rates discussed above.
8.3 GASIFICATION COSTS
The cost for the gasification plant included in Studies 8 and C are compared in Table 8.1, page 78. The Specific cost varies by about 12% which represents about $40 million on the 1934 MW (net) STEAG proposal.
If the gasification price developed by Shawinigan’s consultant is studied it is apparent that about $50 million is included for gas/gas heat exchangers, which are designed to conserve some of the sensible heat of the gas. Lummus, designing a system for a much lower coal cost, use water cooled heat exchangers to cool the gas. and reject the heat to cooling towers. The clean gas is then reheated in tar fired gas heaters. The approximate difference in price between the gas heat exchangers in Study B and the fired heater and water cooling in Study C is $30.$40 million when allowance is made for plant capacity. This lines up with the 12% difference in costs which Table 8.1, page 76, establishes.
The conclusion which these rough figures produce is that the STEAG gasification plant is about $30-40 million more expensive than the Lummus equivalent because of the high cost of coal for which STEAG have designed. It might be possible to reduce the cost of the STEAG proposal by this amount, if it were designed for low cost coal. On the other hand, the STEAG gasification estimate is based on 5 metre gasifiers which are too large to be shipped to Hat Creek, and it does not allow for camp costs which are included in the reference estimateat $26,500,000 including engineering, overhead and IDC.
The costs of the STEAG cycle which are used in Section 5 are established as follows:
75

Price from Study 6 Adjustment to contingencies to bring in line with other studies 5% of 5115,525
Sub Total IDC at 21%
Total
$ 911,345 6,55O(includes en-
gineering and overhead)
917,895 192,758
$ 1,110,653
Other factors - possible reduction for system optimized Extra for 4 metre gasifiers Extra for camp
-$20-$40million + $20 million + $26.5 million
These three factors are not considered. They are approximate and they appear to compensate foreach other.
8.4 GASIFICATION EFFICIENCY The difference in the overall net efficiencies quoted in Study B for four different
combined cycles, is considerable. Some of it stems from the difference in the combined cycle themselves, but the majority from the degree of optimization used. The figures quoted for the STEAG cycle also contrast with those produced by Lummus for the reasons discussed in the above paragraph. The difference is about 16%. Studies B and C do not provide enough information to account for this difference accurately, but the efficiency figure quoted by Lummus is similar to that quoted by G.E.. when both companies use similar economic criteria and designs. Table 8.2, page 78, illustrates this, although this table is an oversimplification because of the complex inter. relationship of the gasification and the power cycle.
The reasons for the different effective gasification efficiencies are varied. The Lurgi will generally give a ‘cold’ gas efficiency - the heating value of the gas as a percentage of the heating value of the coal, of up to 75%; Lummus quote just under 70% in Study C for Hat Creek coal. The gas exiting the gasifier may contain an additional 8% of the coal heating value as sensible heat, and if the heat in the ash, the latent heat of by-products and the energy of other minor flows is recovered, the overall efficiency can reach 92.93%. A lignite or high moisture coal usually produces a lower raw gas exit temperature because the exiting gas is cooled by the incoming wet coal, as it flows upwards, Lignitic and sub-bituminous coals also gasify at a lower temperature than older bituminous and anthracitic coals. These two factors combined can give a difference of over 400°F in the gas exit temperature between a good gasifier coal and a poor one. The amount of sensible heat in the raw gas may therefore vary quite widely. If the cold clean up techniques which are now available are to be used, the gas must be cooled to a maximum of 220°F (for hot potassium carbonate) or lower, and it is difficult and expensive to recover all the heat which is released by this cooling process, especially if the gas temperature exiting the gasifiers is 1000°F or higher. Appendix I in Study C illustrates this point well because the loss in efficiency in cooling the gas from 510°F to 86°F is shown to be almost 10% if none of the heat is recovered.
The high price of coal in Germany has led STEAG to optimize the heat flows in the gasification and combined cycle to a high degree. Their gasification/clean up system efficiency of about 91.25% is close to the maximum which can be attained. This figure is confirmed by G.E. who believe that the irreducible losses of the Lurgi air blown system represent about 7-/z%, while another7Vz% is lost unless ingeneous optimization is used. In their mid range design they only achieve about 80%.
76

The UnitedTechnologies’efficiency is low because:
(a) the Kellogg Molten Salt gasifier produces raw gas at 1000°F and the use of low temperature clean up results in a high loss of sensible heat. United Technologies quote a figure in Study E of 37.6% if hot clean up techniques are available. This illustrates that the counterflow design of the Lurgi gasifier is particularly suitable for low grade coals until hot gas clean up techniques become available;
W the gas turbine proposed for their schemes has too low an exhaust temperature for efficient combined cycle operation. It is a unit designed for eventual use at highertemperatures.
The Westinghouse figures contrast with those of G.E. because their design is intended for base load operation. Even so the steam conditions of 1800 psigl 97O”F/97O”F from a 2200°F 16:l gas turbine seem optimistic without supplementary firing and suggest that Westinghouse have used minimum pinch point values in the conceptual design of their waste heat boiler, and that the boiler surface is large. The Westinghouse figures are based on 2200°F gas turbines which should be commercially available in the early 1980s if not before.
In Table 8.2, page 78, some figures quoted by Sulzer are inserted because they demonstrate the confusion that can arise in comparing the efficiency of cycles which are almost identical. Sulzer quote a net efficiency for a combined cycle of 47.2%. The cycle is an unfired one based on the Westinghouse WllOl gas turbine. The large difference between the quoted 47.2% and the figure of 42% quoted for G.E.‘s STAG systems, is made up by the fact that Sulzer’s figures uses the fuel lower heating value (LHV), the steam turbine back pressure is about 1.0 ins Hg and the stack temperature 216’F. Using this optimized cycle, with an optimized Lurgi, an overall net efficiency as high as 39.6% could be obtained. This represents the highest efficiency which is practically obtainable with 1975 unfired cycles.
8.5 BY-PRODUCTS
The value which should be attributed to by-products of gasification is a difficult question. It is not good economic practice to make the final cost of the main commodity too dependent on by-product sales. For this and other reasons, Lummus have suggested using half of the market price of the oil by-products, with transport costs not deducted. They have credited the ammonia at $180/tori in anhydrous form.
There are other reasons why a conservative value should be used; the possibility that the market for a particular by-product might be saturated; the suggestion by Hammond and Zimmerman (7) that aromatic oils are not suitable for burning because they are linked to human cancer; the cost of storage, transport and marketing and others.
If the full value of oil by-products is allowed, the SNG prices is reduced by about 8 cents to $1.79/MM SCF. This assumes the transport cost is zero. In this study the oil by-products are credited at $9/barrel or s/4 of their full sale value.
8.8 POWER CYCLE COSTS
The costs in Study B for the power cycle appear to line up with the reference estimate for a conventional plant, to the extent that they can be compared. Study B does not, however, allow for camp costs which are included in the reference estimate, but this is discussed in paragraph 8.5.
77

TABLE 8.1 RELATIVE COSTSOFGASIFICATION EQUIPMENT($OOO’sSept. 1975 uninflated)
Cost of complete gasification plant (incl. contingency) $000 Capacity Btu lo’* of gas per year (2) Specific Cost $1109 Btu per year Specific Cost $/IO9 Btu per year adjusted for load factor of 91%
STUDY q STUDY C AIR BLOWN LURGI WITH
STEAG BY-PRODUCTS RECYCLED
328,670 183,984(l) 107.1(3) 76.36 3,069 2,409
2,700 2,409
Notes: (I) Does not include ‘Start Up and Training Costs’, Engineering or Corporate Overhead. Price of coal plant, ash disposal. air compression and expansion and water supply omitted to providecomparison. Contingency reduced to 15% and pro-rated.
(2) It is assumed that scale does not affect specific cost at these ratings: a conclusion of StudyC.
(3) Based on 75% capacity factor.
TABLE 8.2 RELATIVE EFFICIENCY OF INTEGRATEDGASlFlCATlON/COMBINED CYCLES
UNITED STEAG G.E. TECHNOLOGIES WESTINGHOUSE WESTINGHOUSE SULZER
1. Effective Gasification Efficiency (%) 91.25’ 78.5 73.0
2. Combined Cycle Efficiency (without (gasification) (1) (4 W) 44.1 42.2 43.2
3. Steam Conditions Reheat Non Non Reheat
Reheat
4. Gas Turbine Firing Temp. (“F) 1560 1950 1950
5. Integrated Efficiency(%) 40.3* 33.1* 31.4’
6. Degree of Optimization High LOW LOW
85190 85190
48.2
Non Reheat
(5) 44.8
Reheat
2200
42.2,
High
2200
(5) 39.2
High
(3) 44 approv
NOll Reheat
1950
(4) 39.6
‘These figures are taken from Study B. The combined cycle efficiencies for the other suppllers are reterenced whiletheeffectivegasification efficienciesare deduced from theotherfigures.
(1) Efficiency unfired base load STAG System with MS700E gasturbines42.2% ISO. (2) From UnitedTechnolgies data based on 2200°F 16:l gas turbine. (3) Quoted as 47.2% on LHV. (4) With highly optimized Lurgi. (5) Westinghouse figures.
78

8.7 MISCELLANEOUS PRICE ADJUSTMENTS
The costs in table 5.1, page 32, are based on a number of assumptions which are not included in that section.
8.7.1 DEPRECIATION
Depreciation of integrated gasification/combined cycles is 1.75% on gasification equipment, 0.37% on power equipment. A figure of 65% is used for the combined plant.
8.7.2 OPERATING COSTS - SNG
In developing the study economic criteria the same level of operating and maintenance costs was established for both SNG and electricity generation, calculated as a percentage of total capital investment. This was unrealistic because the capital cost of a 250 MM SCF gasification plant is almost the same as that of a 2C00 MW generating plant, yet the former employs more than 600 people, the latter 250 (reference HEPC Nanticoke). An adjustment of $6,750,000 per year has been made, in table 5.1, page 32, to allow for the extra 350 employees. This assumes that the other operating and maintenance costs of the stations will be similar. The total operating and maintenance cost of the SNG plant, after adjustment, lines up with estimates from other sources.
8.7.3 VARIABLE MAINTENANCE - SNG
Variable maintenance costs for the SNG plant are calculated by using the figure established for the generating plant and pro-rating it in proportion to the coal consumed by the two plants. Any attempt to charge variable maintenance to an SNG plant on the basis of energy output (as B.C. Hydro base criteria) is inequitable because of the higher efficiency and output of SNG.
79

9.0 PILOT PROJECTS
9.1 INTRODUCTION The purpose of this section is to try and identify pilot projects which B.C. Hydro
and the Department of Energy, Mines and Resources might build as a prelude to full scale development of one of the advanced technologies described in this report
The section is devoted to those pilot projects which fall below the rather arbitrary figure of about $50 million dollars investment.
An attempt is made to identify those areas in which a pilot project might be of real value to British Columbia or Western Canadian developments, without duplicating work which is being done elsewhere.
9.2 FLUIDIZED COMBUSTION
Both atmospheric and pressurized fluidized combustion lend themselves to a pilot project which should produce relatively firm power soon after the initial development phase. Such a project would give valuable operating and technical experience and could be used to test burn a number of Western coals.
A numberof possibilities are considered:
9.2.1 BURRARD CONVERSION
In Study D atmospheric fluidized combustion units were evaluated as being the most economical alternative, largely because CSL anticipate that a fluidized combustion boiler will be about 17% % cheaper than the equivalent p.f. unit. This saving could well be illusory especially if the units were to incur high development and commissioning costs. The obvious advantages of installing a pilot plant -unit at Burrard are that it should be possible for it to produce reliable power for B.C. Hydro’s system, and also provide valuable operating experience for an existing staff. Burrard is a convenient site for other coals to be tested, being on tidewater. A fluidized combustion unit installed at Burrard could make use of many of the existing plant facilities such as the turbine generator and accessories and water supply.
A major disadvantage of a pilot fluidized combustion unit at Burrard is that with the cost of shipping Hat Creek coal in small quantities would be high.
The cost of the modification of one unit would be about $15 million dollars, excluding manufacturer’s development costs. The cost of coal transported to the site would probably be about $1.00 - $1.25 million Stu, which is a high price compared to the mined cost of the coal, but considerably cheaper than oil at $12 a barrel.
9.2.2 PRESSURIZED AIR HEATER CYCLE
The simplest form of pressurized fluidized combustion cycle incorporates a gas turbine which supplies its compressor discharge air as a fluidizing medium for the bed. Some of the air is usually, but not necessarily, passed through tubes immersed in the

bed. A typical arrangement of this cycle is shown in Figure 9.1, page 84, (courtesy ASEA)
The greatest asset of this proposal is its simplicity. It is effectively a coal burning gas turbine, capable of burning a wide variety of coals with low SO, and NO, emissions. The gas turbine, its auxiliaries and enclosures are little changed from the standard configuration and this provides the additional benefit that the oil burning combustors can be retained. The coal/oil combustor change takes several days, but protects against lengthy problems with the fluidized unit. The unit is not efficient, having a net heat rate close to that of a standard medium temperature simple cycle gas turbine, but this is alleviated by the unit’s ability to burn almost any fuel.
Figures 9.2, page 85, and 9.3, page 86, show a unit which is now being promoted on a reasonably firm basis. This unit is based on ASEA’s 70 MW GT-120 gas turbine, a machine ideally suited to this application. Woodall Duckham, a subsidiary of Babcock and Wilcox, U.K., are offering this unit for about $32-35 million, based on a 66 MW output, a cost which represents about $500 per kW.
Woodall Duckham’s proposal is based on their working with the newly formed Babcock and WilcoxlCSL company, B&W being their parent company. They recommend that the design and construction of such a station proceed in two stages:
“Phase I - Preliminary engineering of the station; testwork to confirm the design data and assumptions; confirmation of capital investment and power generation costs.
Phase 2 - Design, supply, construction and commissioning of the Station.
During this phase, plans for the confirmatory testwork and design studies would be already well advanced, and it is anticipated that sufficient information would be available for final project approval to be given within 12 months from com- mencement of Phase 1. .
Based on the present delivery estimates, it is anticipated that the engine should be ready for commissioning, using oil fired combustors, 32 months after approval of the project. Commissioning and performance testing of the fluidized combustors would follow, once the engine performance on oil has been fully established.”
The economics of the above unit are greatly improved if the gas turbine waste heat can be utilized. Figure 9.1, page 64, shows that this more than doubles the output of energy.
9.23 EXISTING GASTURBINE MODIFICATION
Pressurized fluidized combustors could be added to an existing gas turbine to give a scheme similar to that described above. The small size of these combustors can be gauged from Figures 9.2, page 85 and 9.3, page 86, which show two units with a total gross heat output of about 270 MW. Once again, the existing oil or gas fired combustors could be retained. In this case the specific cost should be much lower than the $500 per kW quoted above.
A suitable site for such a pilot might be B.C. Hydro’s Georgia Station at Chemainus on Vancouver Island.
9.3 GASIFICATION
It is unlikely B.C. Hydro would consider a pilot project for an advanced process. This type of project is better funded by the sponsor and Government. A more
81

reasonable investment would be in a small pilot plant using technology which is basically proven. This pilot would allow a number of Western coals to be extensively tested. As a result the design of a production plant could be much more exact and economical. The pilot would also allow B.C. Hydro to train staff and to experiment with cleanup systems and by-product extraction. The recent report of the Alberta Energy Resources Conservation Board (38) recommends that the provincial government investigate the feasibility of such a pilot plant to be funded by the public and private sectors. (The major interest in Alberta may be towards a plant which will produce a synthetic gas for the synthesis of ammonia and other chemicals rather than SNG.)
El Paso propose to install a single Lurgi gasifier as a prelude to the installation of a major 250 MW SCFlday SNG plant. Investment for this single gasifier is estimated at $19 million (11). Such a pilot could be a reasonable investment for B.C. Hydro if they intend to proceed with a SNG plant, but a detailed review of the environmental problems would be required. Such a single gasifier could not justify the cost of a full gas treatment plant, and it is probable that the raw gas would best be treated by a simple wash to remove tars, tar oil, phenol and ammonia, and that no sulphur cleanup would be included. Tar, tar oil and dust which are removed from a tar separator would be re.cycled to the gasifier while other by-products and contaminants would either be incinerated in a waste heat boiler, or put straight into the furnace of a conventional unit. The gas cleanup of this pilot plant would then be similar to the original installation at Lunen (STEAG).
A first year operating cost for a single gasifier is estimated at $5 million (11).
The Lummus Co. Canada have stated that they do not believe a gasification pilot plant in Canada would be a worthwhile investment. They consider it is more economic to have coal tested either at Westfield, Scotland or in South Africa; this being the route followed in the United States. Lummus believe that at this stage it will be more advantageous to do further analysis of Canadian resources, or do further, more detailed study work of proposed gasification projects.
9.4 GASIFICATION/COMBINED CYCLE
Shawinigan, in Study B, describe a pilot project which has already been proposed by Cangasco, which is a consortium of Shawinigan, STEAG and Alberta Gas Trunk Lines.
The scheme proposed by Shawinigan envisages a commercial size - not pilot plant size - gasification plant preferably installed at an existing conventional coal-fired generating plant. This would easily and economically assure the plant of operating staff! support services, a fuel supply and a market for the electricity produced. Such a plant could also be used as a test facility and provide a base for research and development required for the future expansion of coal gasification technology. At the same time the plant should be largely self-supporting from the sale of electricity produced.
The facility would consist initially of a Lurgi coal gasification plant and a STEAG- type combined cycle plant for power generation built with adequate provisions and features toalsoserveasatesting facility.
Figure 9.4, page 87, is a graphical presentation of the particular objectives, steps and effects of this proposal in four major categories of endeavour listed below.
9.4.1 RESEARCH, DEVELOPMENT, TESTING
The scheme proposed would introduce into Canada the technology of Coal
82

gasification on a demonstration scale and pave the way toward future research. development and testing, with a built-in opportunity to rapidly gain commercially valuable expertise and experience in this field.
9.42 POWER GENERATION VIA COAL GASIFICATION The proposed plant would provide clean, efficient power from coal and through
the use of combined cycle techniques would open the field toward high efficiency. low-cost, water conserving and non-polluting future power plants.
9.4.3 SYNTHESIS GAS FROM COAL The plant would provide the basic, initial facilities essential for the utilization of
coal gasification products i,n the manufacture of ammonia and other synthetic products. in order to augment the manufacture of same now obtained from natural gas and from petrochemical feedstock.
9.4.4 SNG FROM COAL Through gradual development of the technology and by addition of appropriate
process steps, the plant could be extended to produce substitute natural gas and/or serve as a model for large scale SNG facilities built elsewhere. Included in this category are the full scale tests of any type of coal to determine its suitability for gasification, shift conversion and methanation.
Figure 9.5> page 88, shows the processing steps required to obtain these products from coal.
In the interests of minimum capital cost and minimum time to bring the plant into operation, Shawinigan suggest that the plant should be based upon the components of the existing operating Lunen plant but with fewer units and, therefore, be smaller in size. Specifically, they suggest it should utilize the same supercharged boiler as is utilized at Lunen, but only one of these boilers instead of two as at Lunen, and use the same gasifier units as are used at Lunen, but only three such units instead of five. The combustion turbo-generator would be the nearest standard available unit of about 30140 MW in rating, and the steam turbo-generator would be 60 MW in rating.
(1) (2)
(3)
(41
(5)
(6)
(7)
(8)
The result would be a plant with the following characteristics:
It would haveanelectrical output of approximately 100 MW.
It would meet the most stringent requirements as regards pollution of the environment.
Its cost and overall efficiency should be comparable with a conventional plant of the same capacity, if no reheating is used in both cases.
There should be the minimum of teething troubles provided the principle was strictly observed of profiting to the full from Lunen experience.
Any two of the three gasifiers would be adequate for ful! load, with the third available for maintenance? as standby, or as a test facility for different coals. Any or all of the three gasifiers could be arranged for blowing with oxygen as well as air in order to extend their versati!ity for test purposes.
Excess fines in the coal supply to the plant could be disposed of by using these as fuel for the conventional plant at the same site.
The time required for completion of the plant should not be any greater, and might well be less, then foraconventional plant.
In the event of temporary complete shutdown of the gasifier section of the plant. the plant would be operable at full load on either natural gas or a suitable oil as fuel.
83

FLUIDIZED BED
COMBUSTOR
66
36 MWth
MWe
AIR HEATER CYCLE -SIMPLIFED DIAGRAM -~_- _~~~~____
FIGURE 9.1

~{$$$$& Courtesy Woodall -Duckham Flow sequence diagram
FIGURE 9.2

8
POW+KsT TICN ~$g!$&& Courtesy Woodall - Duckham PI al
id
‘I
FIGURE 9.3

DEVELOPMENT OBJECTIVES I
RESOURCES A
FACILITIES I
PROOUCTS I
IN-SITU GASIFICATION TESTS
TRANSMISSION OF LOW-BTU GAS
DEMONSTRATION AND PROVING-OUT OF STEAG-CPG SYSTEM WITH LURGI-GAS
FROM MINED COAL AN0 WITH IN-SITU GAS
FROM UNOERGROUND GASIFICATION
FULL SCALE TESTING OF OIFFERENT
COALS AND RESIDUES EMPLOYING VARIOUS GASIFICATION METHOOS
ALSO, COMMERCIAL TESTING OF FOREIGN COAL
ADVANCED POWER GENERATION SYSTEM
FOR CLEAN, LOW COST. HIGH EFFICIENCY
PROOUCTION OF POWER FROM COAL
PROOUCTION OF SYNGAS FOR
THE MANUFACTURE OF NH3. CH30F. ETC.
PRODUCTION OF SNG
MINED COAL -
I
COAL FIRED STEAM POWER +
STATION
UNDERGROUND COAL
COAL FROH
YEW SOURCES
TAR SANDS <
COKE
RESIDUES
SXA;EA;'DE
CYCLE = PLANT
I- v. I -- -- 1
; con"v"iAiN ' L GAS
-=iIz 1 PURIFICATION t
L J r I I
SYNTHESIS i
PLANT ,
----- .I
w-v-- 1
SNG I PLANT r
=b
AWONIA
METHANOL
ETC.
SNG
TAR OIL NAPHTA SULFUR OFF-GAS PHENOL WATER
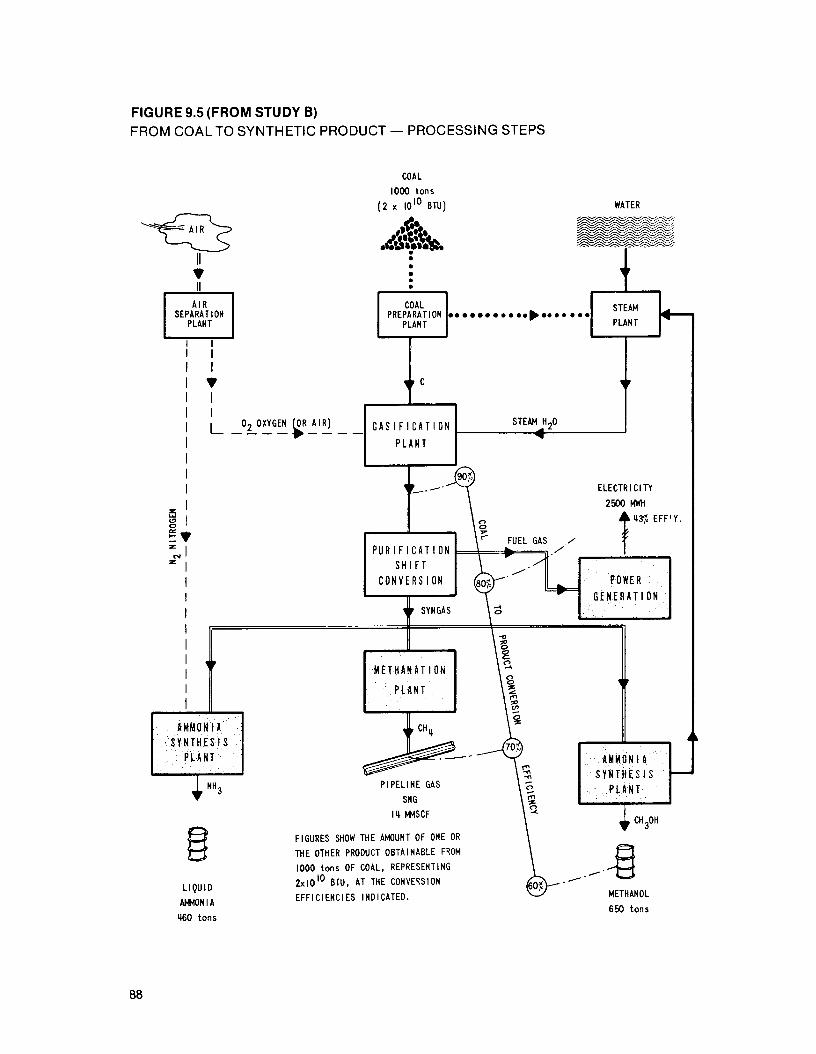
FIGURE 9.5 (FROM STUDY B) FROM COALTO SYNTHETIC PRODUCT - PROCESSING STEPS
COAL
1000 tons
(2 x IO'O BTU) WATER
COAL PREPARATION
PLANT . . . . . . . . ..e........
I I
I v
I I
I I GASIFICATION STEAM Hp'
1
LIQUID
AMMONIA
460 tons
ELECTRICITY
2wOl4vH
4 'US EFF'Y.
PURIFICATION SHIFT
CONVERSION
PIPELINE GAS
SNG
I'+ IMSCF
FIGURES SHOW THE AMOUNT OF ONE OR
THE OTHER PRODUCT OBTAINABLE FROM
1000 tons OF COAL, REPRESENTING
2x10" BTU, AT ME CDNVERSION
EFFICIENCIES INDICATED.
4 CH30H
METHANOL
660 tons
88

9.4.5 UNFIRED INTEGRATED GASIFICATION-COMBINED CYCLE
No pilot project for an unfired integrated gasification combined cycle has been identified. The development of advanced gas turbines is expensive and specialized and will remain the province of the large manufacturing companies. The manufacturers have programs for their own systems which involve pilot projects in the early 1980’s and no benefit would accrue to Canada from attempting to duplicate or compete with these systems. There are two areas where some benefit might be gained, these being in the utilization of low Btu gas and in advanced metallurgy. There is a great shortage of low Btu gas in North America. Major gas turbine and boiler manufacturers have developed designs suitable for low Btu gas but have found it difficult to locate a source of gas with which to test the product. If the pilot gasification plant discussed in paragraph 9.3 was designed or converted for air blown operation the resulting low Btu gas could be used for tests on gas turbine combustion chambers, and small boilers. Experience and information could also be gained on the performance of high temperature gas turbine blading materials. While such a facility would provide gasificiation experience for B.C. Hydro and E.M.R. and would also provide a test best for British Columbian coals, the major benefits of the gas turbine rig equipment and the low Btu gas would be to Canadian organizations such as United Technologies Canada, Rolls Royce Canada, N.R.C., Orenda, International Nickel, Combustion Engineering and Babcockand Wilcox.
9.5 FURTHER STUDY WORK
None of the pilot projects identified in this section could be committed without further study work. As a result of this summary report, B.C. Hydro and the Department of Energy, Mines and Resources might consider a study of pilot projects in general, or a detailed study evaluating a particular type of pilot. Such studies would take between 6 and 9 months. A detailed evaluation of a particular pilot project would probably cost between $200,000 and $300,000.
9.6 DISTRICT HEATING
It is clear from the results of Section 5 that district heating is the only technology which offers immediate high efficiency of utilization of B.C.‘s energy resources. It has already been noted that the introduction of district heating in an area becomes more difficult as the area develops, partly because of the obvious difficulty of installing district heating in a completely developed environment, but also because the economic size of the generating unit becomes, and in fact has already become, far too large to support small district heating schemes. Despite this, the advantages which district heating offers are so great that it is hard to believe that they can be ignored indefinitely. The district heating pilot project is one in which the amount of expenditure can be tailored to meet any budget, and which should provide a direct revenue to cover the majority of capital and operating costs. Such a pilot could be installed with electric heat pump heating in the manner suggested by many of the exponentsof district heating.
9.7 HEAT PUMPS & DOMESTIC FURNACES
A piece of perspective which has come from these studies has been the relative importance of efficiency in initial generation or energy conversion compared to end use. Engineers and the public have long been aware of the inefficiencies of the electric generating process, and enormous amounts of money have been spent in the last 75 years on measures aimed at improving this efficiency. At present the very advanced techniques are the subject of intense development efforts which offer improvements of

only 10 or 15% over a high efficiency conventional steam cycle. When energy utilization is considered it is apparent that not only are the process inefficiencies just as poor, but it appears that substantial gains can probably be made with much less effort. This study has pointed out that the introduction of heat pumps in the Vancouver climate will double the efficiency by which electrical energy is utilized in heating. Similarly, it is reasonable to suppose that development effort could lead to great improvements in the average efficiency of domestic gas burning furnaces. The price of gas has been so low for such a long time that there has been little incentive to improve the efficiency of such furnaces but it is clear from this study that this is an area which will benefit from more attention.
Electric heat pumps offer a small scale pilot project which could be developed in British Columbia to prove the benefits of electric heat pumps designed to operate without an air conditioning mode. It should be possible to manufacture such pumps at a lower price than the combined heat pump/air conditioning now marketed. British Columbia is almost unique in North America in having a summer climate which does not require air conditioning, but a winter climate with relatively high ambients. It follows that the market requires a specialized type of heat pump which industry has not yet developed.
9.8 UTILIZATION AND REVENUE
Of the pilot projects being considered in this section, only the STEAG and the fluidized bed. and district heating offer the possibility of direct revenue earning. A gasification pilot plant would earn some revenue through allowing outside parties to make use of the product gas, but it is unlikely that this would be more than a small proportion of operating costs.
9.9 RECOMMENDATIONS
The development or encouragement of heat pumps in British Columbia should be a priority for B.C. Hydro. A program of this type will soon be sponsored by B.C. Hydro and Ontario Hydro through the Canadian Electrical Association.
It would be advantageous for both B.C. Hydro and the Department of Energy, Mines and Resources to undertake studies of the actual efficiency of the average domestic gas burner, and to fund the development of advanced furnaces or means of improving existing ones. Although the difference between an efficiency of about 4050% and one of 75.85% is obvious and its effect on the overall use of natural gas in Canada would be significant, there is little general awareness of the poor efficiency of existing furnaces, It has long been assumed that they operate at about 75%. In the context of the efforts of the Department of Energy, Mines and Resources to educate Canadians in energy conservation, it appears particularly important that emphasis be put on the poor efficiency of the average gas furnace, and on measures which might be taken to improve it.
Although organizations such as the Canadian Gas Association are working on advanced furnace designs, the energy savings offered by such a programme are so great that they deserve widerattention.
In addition to the minor pilot or development projects suggested above, the major pilot project which appears to offer the most immediate benefit to British Columbia is the pressurized fluidized bed gas turbine air cycle. This pilot project provides a method of producing power for B.C. Hydra‘s grid, and the revenues from such power should defray most of the capital and operating costs. It is quite probable
90

that the economics of such a project would be particularly favourable if the escalation of fuel prices continues. A parallel might be drawn with the economics of the early nuclear units, which seemed to be quite uncompetitive at the time they were built, but within 10 or 15 years were providing cheap power. It is recommended that a fuller investigation be made of a pressurized fluidized bed/gas turbine air cycle. This study would determine whether a completely new unit, or the modification of an existing gas turbine appears the most attractive, would analyze potential sites and coal sources, and determine the overall capital and operating costs, If such a study were to be done it should also consider an attractive alternate pilot project which is an atmospheric fluidized combustion unit of industrial capacity; typically about 100,000 Ibs. per hour. Such a unit could be designed with the needs of the pulp and paper industry in mind and particular attention could be given to its ability to burn a wide range of fuels with low emissions.
If a pressurized bed air cycle is considered for a pilot plant it should be engineered for future conversion to district heating. It would provide a relatively small, clean source of hot water suitable for installation close to cities.
The proposed STEAG type pilot plant would cost substantially over the 50 million target set in this study, and has been the subject of separate discussions with federal and provincial governmentsand utilities.
91

10.0 REFERENCE COAL AND GAS FIRED CONVENTIONAL
PLANTS
10.1 INTRODUCTION
In this section an estimate for a conventional coal fired generating station is developed, to provide a reference for comparison with the advanced generating techniques studied in Studies A and 6.
For this reference estimate, a conventional design is used. It is assumed that the plant would be designed for a relatively low fuel cost and with more emphasis on investment and reliability, rather than efficiency.
The estimate is based on the assumption that the plant would use conventional sub-critical steam conditions with high back pressure and highly loaded turbines. The boilers would be designed conservatively to allow for possible uncertainties about the coal quality. Although the estimate is based on conventional practice, there are a number of features which might be introduced which are novel in Western Canada, or have only recently gained acceptance. These include:
- A single stack for four units might be preferred for aesthetic reasons. This is standard practice in the U.K. and Ontario for four unit stations. The estimate includes for a4 flue 1,000 ft. stack.
- The wide variance is ambient temperature, the low cost of the fuel and generated power, and problems with water vapour and ice fogging might make assisted draft cooling towers economically attractive. These towers represent a compromise between the advantages of natural and mechanical draft types. They are of hyperbolic construction but also have fans spaced around the base. They inherit the advantage of the hyperbolic type of high water vapour dispersion, and yet are flexible to handle wide variations in load and ambient.
Other features of the reference design which are relevant are described in subsequent paragraphs.
10.2 ASH DISPOSAL
Ash sluicing is now forbidden in Alberta, although the principal reason for this may be the desire to force utilities to put the ash back into the mines. In the estimate in Section 10.6, it has been assumed that ash would be sluiced to a settling pond where a water balance would be maintained by seepage and solar evaporation. The Thompson River water used for the Hat Creek plant is very clean, having less than 100 parts per million dissolved solids. It should be possible to run the cooling tower and condenser circuit to very high concentrations thus maintaining blowdown at a reasonable level. While a figure of 3 to 10 concentrations is usually used for cooling tower blowdown, the Thompson River water may allow up to 15 concentrations. Experience in the U.S. shows that the blowdown from cooling towers using this level of con- centration is negligible because of sundry losses. Using 15 concentrations the blowdown
92

for a four-unit 2000 MW station may be reduced from about 3500 GPM to zero. A certain amount of blowdown is required if an ash sluice system is selected.
10.3 WATER BALANCE
It is probable that no liquid discharges will be allowed from the station. This may lead to extra costs which are not included in the estimate in Section 10.6. The assumption made in that section is that a water balance can be maintained between the cooling tower blow-down, ash sluicing water, ash pond evaporation and other flows. This assumption is probably optimistic and it might be necessary to use brine concentrations or reverse osmosis systems to purify effluents, or to use excess liquid discharges for irrigation in the Hat Creek or Ashcroft Valleys.
10.4 WATER SUPPLY
The cost of water supply is based on B.C. Hydro’s estimate for a 26 mile supply of water from the Thompson River. This water supply line would be sized for a 2000 MW plant, the full line being installed for the first unit. The final decision on water supply for the Hat Creek plant may be influenced by the amount of water which must be removed from the mine. 50% of the mine water from the very large West German lignite mines owned by R.W.E. is adequate to supply about 11,000 MW of power plant and the entire city of Dusseldorf. The remaining water is pumped directly into the Rhine, because it is of drinking water quality. In contrast, many European and American mines produce very acidic water, but whether this type of water could be treated in reverse osmosis systems to produce boiler feed water which is competitive with water pumped from the Thompson would depend on its quality.
10.5 S02SCRUBBING SYSTEMS
The question of the need for flue gas scrubbing and the technical merits of various types of gas scrubber is a complex one, well outside the terms of this study.
There is no international concensus on the need to remove SO, from the flue gases of coal burning power plants. In the US. the EPA and other agencies are trying to force utilities to scrub SO, from all coal burning units. The majority of the major utilities, on the other hand, maintain that scrubbers are unproven, unreliable, and expensive, and that tall stacks disperse SO, adequately. In Europe there has been much less concern about flue gas scrubbing and some countries such as the U.K. believe that tall stacks provide the best solution. The subject is complex, and one which is all too frequently the subject of generalizations and half truths.
The proponents of tall stacks (40) believe that if the stack is high enough, it will provide a circular pollution free area around it. If it is in the middle of an industrial area of modest size, it will not add to the pollution within it. The problem is then spread over a much wider area but most areas now have a shortage of sulphates in the soil (40) (41). The main objections to tall stacks are the problems of high concentrations of SO, in industrial areas such as the U.S. Eastern seaboard, and the controversial problem of acidity in rainfall. The latter problem was of particular concern in Scandinavia in the 1960.1970 decade, when there was an alarming downtrend in the pH of rain. In 1969170 there was a return to the level of ten years earlier. Even this issue appears confused.
No judgement on the necessity of scrubbing is made in this report. In this section, estimates are included from two of the manufacturers of leading scrubbing systems, both of which are in operation, Research Cottrell have quoted a wet limestone
93

scrubbing system which is similar to the one in use on Arizona Public Service Company’s 115 MW Cholla Unit 1, and has operated with 91.5% availability since commissioned in December, 1973. (42) The Cholla plant operates with low sulphur levels and a removal efficiency of 98% Research Cottrell now have orders for 2 x 750 MW, 2 x 200 MW and 1 x 250 MW systems for coal burning stations. including an order for Cholla Unit 2.
The other bid was received for the Japanese Chiyoda system which is an absorption oxidation type and produces solid gypsum as a by-product. This process has been successful on a number of installations including the Gulf Power Scholz Station coalfired 23 MW unit. A number of oil fired boilers of 250.350 MW are equipped with Chiyoda units and the process is highly regarded in North America. The Chiyoda process is about 70% higher in first cost than Research Cottrell’s and auxiliary power is 3% compared to 1%.
10.6 ESTIMATE OF CONVENTIONAL 2000 MW PLANT
In Tables 10.2 and 10.3, the capital costs, and operating costs are established for a conventional 2000 MW plant, using pulverized coal or low Btu gas. The estimates are in September 1975 dollars and use the financial criteria supplied by B.C. Hydro. it would not be realistic or economical to try to compile a very detailed estimate at this time, because most of the engineering optimisations have not been done. The estimate is very sensitive to many decisions or assumptions which might be made about factors such as scheduling, interest during construction and site labour productivity. It is assumed that the 2000 MW plant would be built continuously with major facilities including the turbine hall, boiler building, and the majority of the civil and structural work largely done during the construction of the first unit. A saving in capital cost at the expense of high interest during construction is assumed. Some costs have been taken from B.C. Hydro’s own study work and adjusted only for inflation. These include:
- supply of water to plant - ash handling and disposal - site access and preparation - provision of rail spur
10.7 COMPARISON OF ESTIMATE WITH SIMILAR PLANTS
The accuracy of the estimate in this section is essential to the comparison of alternate uses of Hat Creek coal embodied in this report, in particular in Section 5. If the accuracy of the reference conventional plant is in doubt, all the comparisons between alternate generating processes and between generation and gasification are also in doubt.
To provide assurance of the accuracy of the estimate, it has been compared with threeotherestimates of similar plantsThese are:
(a) Estimate in the B.C. Hydro task force report (46).
(b) Estimates done in 1975 for large thermal plants in Alberta, and used as the basis of planning in that province.
(c) Estimate by a major consultant, Ebasco Services of Canada Ltd., provided to lnteg forcomparison.
In addition to comparing the reference estimate with the three estimates listed above, in Section 8 we have also attempted to reconcile the component parts of the reference estimate with the costs in Studies A and B.
94
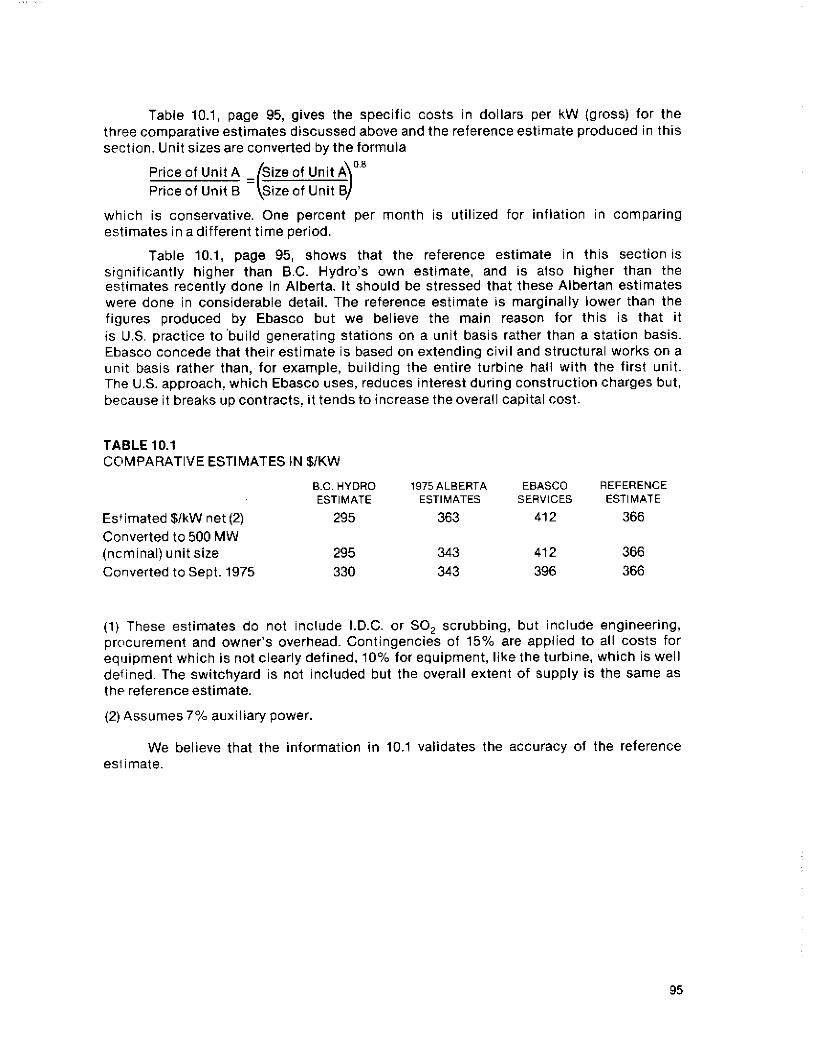
Table 10.1, page 95, gives the specific costs in dollars per kW (gross) for the three comparative estimates discussed above and the reference estimate produced in this section. Unit sizes are converted by the formula
which is conservative. One percent per month is utilized for inflation in comparing estimates in adifferent time period.
Table 10.1, page 95, shows that the reference estimate in this section is significantly higher than B.C. Hydro’s own estimate, and is also higher than the estimates recently done in Alberta. It should be stressed that these Albertan estimates were done in considerable detail. The reference estimate is marginally lower than the figures produced by Ebasco but we believe the main reason for this is that it is U.S. practice to’build generating stations on a unit basis rather than a station basis. Ebasco concede that their estimate is based on extending civil and structural works on a unit basis rather than, for example, building the entire turbine hall with the first unit. The U.S. approach, which Ebasco uses, reduces interest during construction charges but, because it breaks up contracts, it tends to increase the overall capital cost.
TABLE 10.1 COMPARATIVE ESTIMATES IN $/KW
Estimated $/kW net (2)
Converted to 500 MW (ncminal) unit size
Converted to Sept. 1975
B.C. HYDRO 1975ALBERTA EBASCO REFERENCE ESTIMATE ESTIMATES SERVICES ESTIMATE
295 363 412 366
295 343 412 366 330 343 396 366
(1) These estimates do not include I.D.C. or SO, scrubbing, but include engineering, prclcurement and owner’s overhead. Contingencies of 15% are applied to all costs for equipment which is not clearly defined, 10% for equipment, like the turbine, which is well defined. The switchyard is not included but the overall extent of supply is the same as the referenceestimate.
(2) Assumes 7% auxiliary power.
We believe that the information in 10.1 validates the accuracy of the reference esi imate.
95

TABLE 10.2 CAPITAL COSTS FOR 2000 MW (NET) CONVENTIONAL COAL FIRED PLANT
$.OOO SEPT. 1975 LEVELUNINFLATED
Land Rail spur Site preparation Civil and structural including stack Watersupply tostation wall Coal plant Ash handling and disposal 4 - steam generators and auxiliaries 4 - 535 MW steam turbines and auxiliaries 4 - precipitators Cooling towers, pumps, piping Condenserand feedheating plant including piping
and deaerator Electrical equipment HP & LP piping and valves Boilerfeed pumps Water treatment plant and bldg. Instrumentation, data logging, and auto run-up Miscellaneous including insulation Indirect construction costs Camp Engineering 8 Procurement 8%
Corporate Overhead 5% Totals: IDC at 26.6% Totals: CostlkW on 2000 MW net plant output
- without IDC - IDC at 26.6%
STACK GAS SCRUBBERS Complete system between precipitator outlet flange and stack breeching, including all towers, pumps, ID fans, duct work, dampers, controls, power wiring, steel and tanks.
COAL
500 9,344 7,108
59,000 29,670 14,975 22540
182,500 79,200 60,006 29,210
LBTU GAS
500 9,344 7,188
59,000 29,670
128,000 79.200
29,210
32,130 32,130 27,500 27,500 20,000 20,000 8,400 8,400 8,500 8,500
14,500 14,500 4.500 4,500
14,050 11,100 19,050 15,000 54,421 38,699
697,178 522,44 1 34,859 26,122
732,037 548,563 194,722 145,918 926,759 694,481
366 275 463 347
scrubbing 82.4% of gas flow - remaining gas by-
passed by reheating (Research Cottreli)
- $1301000 scrubbing 100% of flow
(Research Cottrell) - $170,000
scrubbing 100% of flow (Chiyoda)
- $227,000
96
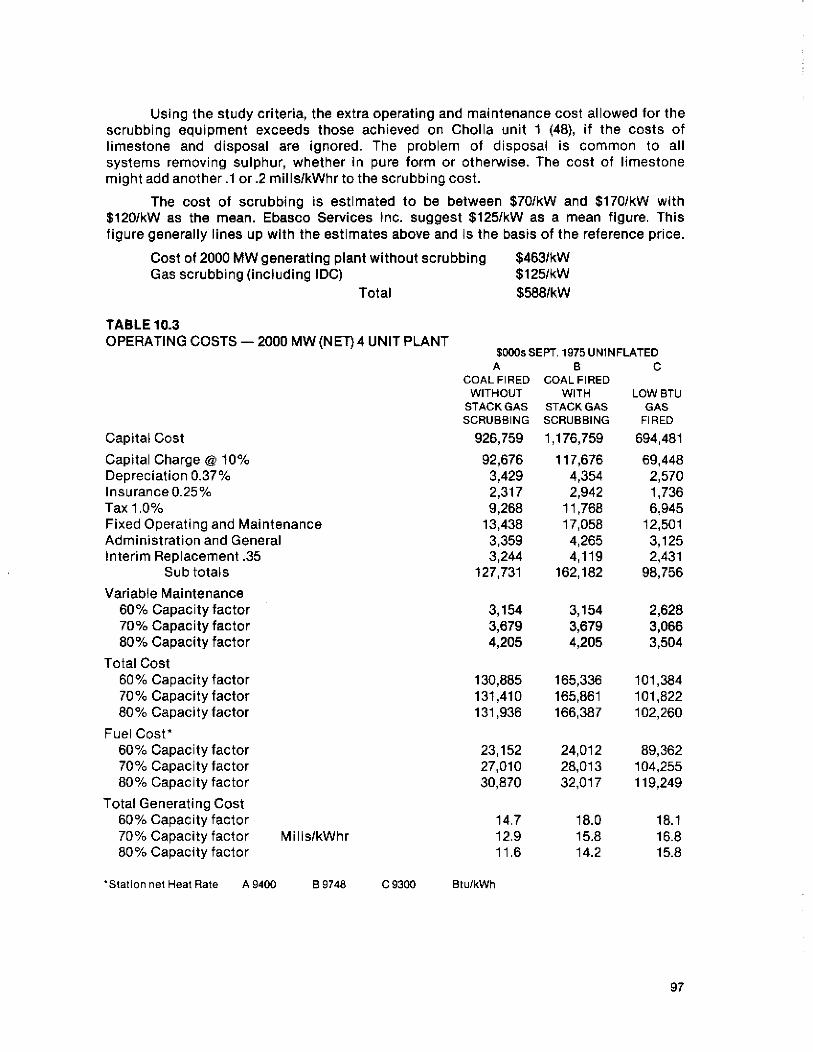
Using the study criteria, the extra operating and maintenance cost allowed for the scrubbing equipment exceeds those achieved on Cholla unit 1 (48), if the costs of limestone and disposal are ignored. The problem of disposal is common to all systems removing sulphur, whether in pure form or otherwise. The cost of limestone might add another .l or .2 mills/kWhr to the scrubbing cost.
The cost of scrubbing is estimated to be between $70/kW and $170/kW with $120/kW as the mean. Ebasco Services Inc. suggest $125/kW as a mean figure. This figure generally lines up with the estimates above and is the basis of the reference price.
Cost of 2000 MW generating plant without scrubbing Gas scrubbing (including IDC)
Total
TABLE 10.3
$463/kW $125/kW $5881kW
OPERATING COSTS - 2000 MW (NET) 4 UNIT PLANT $C0OsSEF’T 1975UNINFLATED
Capital Cost
Capital Charge @ 10% Depreciation 0.37% Insurance 0.25% Tax 1 .O% Fixed Operating and Maintenance Administration and General Interim Replacement .35
Sub totals
Variable Maintenance 60% Capacity factor 70% Capacity factor 80% Capacity factor
Total Cost 60% Capacity factor 70% Capacity factor 80% Capacity factor
Fuel Cost* 60% Capacity factor 70% Capacity factor 80% Capacity factor
Total Generating Cost 60% Capacity factor 70% Capacity factor MillslkWhr 80% Capacity factor
*Station net Heat Rate A 9400 B 9748
A 6 COALFIRED COALFIRED
WITHOUT WITH LOW BTU STACK GAS STACK GAS GAS SCRUBBING SCRUBBING FIRED
926,759 1,176,759 694,481
92,676 117,676 69,448 3,429 4,354 2,570 2,317 2,942 1,736 9,268 11,765 6,945
13,436 17,058 12,501 3,359 4,265 3,125 3,244 4,119 2,431
127,731 162,182 98,756
3,154 3,154 2,628 3,679 3,679 3,066 4,205 4,205 3,504
130,885 165,336 101,384 131,410 165,861 101,822 131,936 166,367 102,260
23,152 24,012 89,362 27,010 28,013 104,255 30,870 32,017 119,249
14.7 18.0 18.1 12.9 15.8 16.8 11.6 14.2 15.8
c 9300 SlulkWh
C
97

1.
2.
3.
4.
5.
6.
APPENDIX 1
BASIS OF EFFICIENCY FIGURES USED IN TABLE 5.2
Transmission and Distribution of electric power 8% average figure for Canada (23). Between 510% typical (5). This efficiency depends on transmission line length and the economic balance between power costs and the cost of wire. Figures as high as lCl/ll%, for long transmission, or as low as 5%, can be valid.
Transmission of SNG. Figure from Trans Mountain Report in Study D.
Distribution of SNG. No Loss. Pressure from pipeline is used for distribution.
Utilization of Electricity: Resistance heating. No loss. In fact electric heating does not generally involve any air changing and the actual efficiency may be 95%, if an allowance is made for ventilation.
Heat Pumps. Coefficient of performance is assumed to be 2 based on data provided by G.E. In fact for the Lower Mainland climate the COP might be slightly higher. (19) (7).
Gas Burners. This figure is the most sensitive used in Table 5.2, page 46, and the value selected has a profound effect on the whole comparison of gas and electricity as energy sources. In the Lower Mainland of B.C. domestic furnaces operate with a very inefficient on/off cycle. This is in part the result of sizing the furnace for the lowest annual ambient, but many are oversized even forthis condition.
The resulting difference between the full load laboratory efficiency of a given furnace, which is usually assumed to be 75%, and actual figures obtained in the field, is enormous. References (7) and (19) suggest 40/45% efficiency as a general figure others propose 58% (34) and 55% (35) for homes, but 517% more for apartments. Industrial furnaces should operate at 65% or 70% if in good working order. Hottel and Howard (5) suggest 60.75% for a furnace operating continuously, as in many industries, but note that water heaters can operate with efficiencies as low as 30%.
An ESSO study noted that the actual efficiency of domestic installations in the U.S. was 53.5% (38), while a similar figure derived for a Pittsburg, Pa. house was 47%.
From a survey of these figures, 50155% seems a good figure for domestic use and 60167% for industrial use. Sixty percent is chosen for Table 5.2, page 46, as a representative average. Advanced furnaces which are under development may offer actual net efficiencies of up to 85190%.

LIST OF REFERENCES
A
B
C
D
(1)
(2)
(3)
(4)
(5)
(6)
(7)
(8)
(9)
(10)
(11)
(12)
(13)
(14)
(15)
(16)
Study A EPD Consultants Ltd.
Study B Shawinigan Engineering Co.
Study C The Lummus Co. Canada
Study D Intercontinental Engineering.
Comparative Transportation Costs of Supplying Low Sulphur fuels to Midwestern and Eastern Domestic Energy Markets. Bureau of MinesCircular 1973.
NO, Emissions from Tangentially Fired Utility Boilers - Bueters, Habett Combustion Engineering.
New Steam Generator Designs for Burning Clean Fuels - Henry, Burbach Combustion Engineering.
Coal Gasification - When If Ever. Martin A. Elliott Consultant, Texas Eastern Transmission Corporation, Houston, 1975.
New EnergyTechnology. Hottel and Howard. MIT Press 1971.
Technological and Economic Feasibility of Advanced Power Cycles and Methods of Producing Nonpolluting Fuels for Utility Power Stations. Robson, Giramonti, Lewis, Gruber. Dec. 1970.
The Economics of Coal Based Synthetic Gas. Hammond, Zimmerman, MIT Energy Laboratory, 1975.
Integrated Gasification - Gas Turbine Cycle Performance. P.H. Kydd, G.E. Annual Meeting, AlChE, Washington. Dec. 1974.
Economics of Power Generation from Coal Gasification for Combined Cycle Power Plants. Ahner, Sheldon, Garrity. G.E. Kasper, Dravo. American Power Conf. May 1975.
Fuel Gas from Coal. P.F.H. Rudolph. A.H.B. Burbach. Lurgi Mineraloltechnik. Chicago, June 1975.
Production of High Btu GasfromCoal. IGT: June 1975.
Heat Pump Data Show Service Variations. Electrical World, October 14, 1974.
Discussions with United Technologies, Hartford, Conn. A.J. Giramonti, Patterson 8 Others, Sept. 9,1975.
Ceramics in Industrial GasTurbines. Delorso, Harrison, Westinghouse, March 1972.
Hot Pressed Silicon Nitride for Gas Turbine Applications. Torti, Weaver, Richerson, Norton Co. March 1972.
Advanced Ceramics for Application in Gas Turbine and Diesel Engines. PK. Bart. Norton Co. March 1972.
99

(17)
(18)
t191
(20)
(21)
(22)
(23)
(24)
(25)
(26)
(27)
(28)
(29)
(36)
(31)
(32)
(33)
(34)
(35)
(3’3
(37)
(36)
(39)
(46)
Gas Turbine Utility Business will never be the same again. Gas Turbine World, May 1975.
Gas Turbine World, January 1975, p. 43. Incident with Ceramic Vanes.
Heat Pump Prospects Show Sharp Gain. Electrical World, August 1 and August 15,1973.
Importance of Coal. Henrik Harboe, ASEA, 1973 Rev. 1974.
Conversion of Coal to High Value Products Symposium “Synthetic Fuels”. Rudolph, Herbert, Lurgi.
State of the Art of Fluidized Combustion. H.B. Locke, C.S.L. Vancouver, October 1975.
Electric Power In Canada. Department of Energy, Mines and Resources, Ottawa, 1969.
Proceedings of World Energy Conference, Detroit, 1974.
Proceedings of “Clean Fuels from Coal II” Symposium, Chicago, June 1975.
Advanced Electric Power Systems. A.J. Giramonti, United Technologies, October 1974.
STAG Combined-Cycle Power Systems. G.E. Brochure, April, 1975.
Combined Steam and Gas Turbine Power Stations. H. Pfenniger, Brown Boveri, September 1973.
170 MW Power Plant with Coal Gasification. Puhr-Westerheide, Marshall. CEA Fall 1974.
Steam Generator Designs for Combined Cycle Applications. Clayton, Singer, C.E. November 1972.
Combined Gas/Steam Turbine Generating Plant with Bituminous Coal High Pressure Gasification. Bund, Henney, Krieb. STEAG.
The Environmental Impact of Coal-based Advanced Power Generating Systems. Robson, Giromonti, 1975.
Production of Heat and Electric Power Separately and Combined. Unden. AB Electra-Invest, 1975.
Disrict Heating - Measure to reduce fuel consumption in Sweden; Gradin, 1975.
Turbinology - A heat, power and fuel balancing problem; N. Muir. ASEA Finspong, 1975.
Nuclear District Heating - Current Economics and Development in Progress. Margen. AB Atomenergi, 1975.
Available Energy Conversion and Utilization in the United States. G.M. Reistad, July 1975.
District heating and the rising cost of Energy. L.R. Pincott ESSO, April 3, 1974.
Prospects for coal gasification in Alberta. Alberta Energy Resources Conservation Board October 1975.
To Scrub or Not to Scrub. Fraser Ross CEGB. Public Utilities Fortnightly Nov. 1975.
100

(41) Operational Status and Performance of the Arizona Public Service Flue Gas Desulphurization System at the ChollaStation. Mundth, November 1975.
(42) Electrical World May 15175. “Scrubber surpassesgO% availability.”
(43) Steam-Electric Plant construction cost and annual production expenses. Federal PowerCommission 1972.
(44) Conversion of Solid Fuels into the energy forms. L. Grainger N.C.B. World Energy Conference 1974.
(45) District Heating and Power Generation. Harbo Stal-Lava1 November 1975
(46) Alternatives 19751990 B.C. Hydro report 1975.
(47) Hat Creek feasibility report and cost estimates. B.C. Hydro System design division. July 1975.
101

1)
2)
3)
4)
5)
6)
7)
TERMS OF REFERENCE CO-ORDINATING CONSULTANT FOR
COALGASIFICATION AND RELATED STUDIES
Provide services to co-ordinate the following coal gasification and related studies to be conducted by a group of consultants as indicated:.
Study A - Fluidized Bed Combustion Study EPDlCSL
Study B - Coal Gasification Combined Shawinigan Cycle Study Engineering Company
StudyC - Review of Coal Gasification Lummus Company Processes Canada Limited
Study D - Conversion of Burrard Thermal INTEG to Coal Base
Following formal confirmation to proceed with the studies, which will be subject to a satisfactory submission and presentation, the co-ordinating consultant shall:-
a) Confirm the cost estimate and terms of reference for the studies;
b) Prepare a target budget for the project including estimated monthly expenditures;
c) prepare notes on all joint meetings held with B.C. Hydro;
d) Submit monthly progress reports which will include expenditures to date;
e) Invoice B.C. Hydro.
In the event of budget over-runs not resulting from changes requested by B.C. Hydro, the consultants involved in the study shall indicate their scale of charges.
Prepare a set of economic and technical criteria in association with B.C. Hydro for use in all the studies. These criteria should place all cost estimates and energy balances on a comparable basis, both between themselves and where possible with recent B.C. Hydro studies.
Prepare estimates for conventional coal and low Btu gas burning 2000 MW (net) generating plants at Hat Creek. including flue gas sulphur removal equipment, to be used as reference for Study A, B and C. and the development of as much common estimating dataas possible.
Prepare an executive summary report and co-ordinating preparation of the final reports:-
i) in draft form by 30 September 1975;
ii) in final form by28 November 1975.
The study shall be controlled and co-ordinated on behalf of B.C. Hydro by the Assistant General Manager, Engineering, or hisappointee.
102

Study A
TERMS OF REFERENCE
FOR
FLUIDIZIED BED COMBUSTION STUDY
1) Provide engineering services to determine the feasibility and cost of a thermal generating station equipped with fluidized bed combustion furnaces. Consider appropriate unit sizes for a total installation up to 2000 MW of conventional or combined cycle thermal plant.
The study will include a detailed review of:-
a) Atmospheric fluidized combustion in combination with conventional steam turbines;
b) Pressurized fluidized combustor furnaces in a combined cycle configuration with gas and steam turbines.
Cost data associated with the pressurized cycle will be indicative because the state of development of this cycle precludes accurate estimation.
2) The study will incorporate a materials and energy balance for each of the main alternatives.
3) The study report will include the following information;
a) Commentson the feasibility of thealternatives considered;
b) Statement on reasons for choosing the unit size used in the study.
4) The study will include a listing and a brief review of all known similar processes which are the subject of a major development effort, including. in particular, the lgnafluid process. The review will incorporate statements on the schedule for development, the mechanism of the process, the possibility of the process becoming attractive commercially, and any special advantages and disadvantages.
5) Identify the possible environmental impacts of such a station in relation to accepted or assumed emission standards. This will include a flow balance for all gaseous, liquid and solid discharges. The site dependent environmental impacts will be excluded.
6) The station would be located in the vicinity of Hat Creek and would be assumed to burn Hat Creek coal. At a later stage in the studies, data will be provided on East’ Kootenay coal. The study will incorporate a brief general analysis of the qualitative changes in the technical resultsand cost estimates in the study.
7) The work shall be in the form of engineering studies carried out utilizing published information and data from discussions with companies considered to

8)
9)
10)
11)
12)
13)
be recognized authorities in the field having regard to present technology and possible technology in the future. In particular, the study will incorporate technical and cost data from Combustion Systems Ltd. (CSL).
Power cost estimates expressed in mills/kWh are to be calculated for range of capacity factors from 60% to the highest considered feasible for the schemes studied. Coal characteristics and costs will be provided by B.C. Hydro from existing data and, as study progresses, from sample tests. Capital cost estimates shall be broken down to clearly itemize the component costs.
Cost estimates shall be in September 1975 dollars and shall be broken down by years. Where possible, agreed common costs received from the co-ordinating consultant will be incorporated. The interest on capital and interest during construction shall be assumed as 10% but itemized in such a way that the effects of an alternative rate can easily be determined. The assumed plant lives will be agreed with B.C. Hydro.
Project schedules shall be prepared for the earliest in-service dates for various sizes and systems considered.
Prepare and submit a report in draft form by 30 September 1975 and in final form by 28 November 1975. In addition, progress reports will be made monthly of the results achieved, the costs incurred and the scheduling of future work and associated costs.
Provision will be made for co-ordination of the work with other parallel studies which are to be undertaken of conventional thermal and coal gasification systems.
The study is to be controlled and co-ordinated by the Assistant General Manager, Engineering, of B.C. Hydro and Power Authority or his appointee.
104

Study B
1.
2.
3.
4.
5.
6.
7
8.
9.
TERMS OF REFERENCE
FOR
COALGASIFICATION COMBINED CYCLE STUDY
Provide engineering services to determine the feasibility and cost of a thermal generating station equipped with gasification-combustion systems. Consider ap- propriate unit sizes for a total installation up to 2000 MW.
The study will be mainly related to the Lurgi-STEAG system but a detailed review and estimate will also be made of an unfired system such as that of G.E. Any other system which appears particularly attractive commercially or technically will be reviewed by relating its economics and technical advantages to those of the Lurgi-STEAG.
The station would be located in the vicinity of Hat Creek and would be assumed to burn Hat Creek coal.
The study will incorporate a materials and energy balance for each of the main alternatives.
The study report will include the following information:.
a) Comments on the feasibility of the alternatives considered.
b) Statement on reasons for choosing the unit sizes used in the study.
The study will include a listing and a brief review of all known similar processes which are the subject of a major development effort. This will incorporate statements on the schedule for development, the mechanism of the process, the possibility of the process becoming attractive commercially, and its special advantages and disadvantages with particular reference to environmental factors.
Identify the possible environmental impacts of such a station in relation to accepted or assumed emission standards. This will include a flow balance for all gaseous, liquid and solid discharges. The site dependent environmental impacts will be excluded.
The work shall be in the form of engineering studies carried out utilizing published information and data from discussions with companies considered to be recognized authorities in the field having regard to present technology and possible technology in the future.
Power cost estimates expressed in mills/kWh are to be calculated for a range of capacity factors for the schemes studied. Coal characteristics and costs will be

provided by B.C. Hydro from existing data and, as study progresses, from sample tests. Capital cost estimates shall be broken down to clearly itemize the component costs.
IO. Cost estimates shall be in September 1975 dollars and shall be broken down by years. Where possible, agreed common costs received from the co-ordinating consultant will be incorporated. The interest on capital and interest during construction shall be assumed as 10% but itemized in such a way that the effect of an alternative rate can easily be determined. The assumed plant lives will beagreed with B.C. Hydro.
11. Project schedules shall be prepared for the earliest in-service dates for various sizes and systems considered.
12. Prepare and submit a report in draft form by 30 September 1975 and in final form by 28 November 1975. In addition, progress reports will be made monthly of the results achieved, the costs incurred and the scheduling of future work and associated costs.
13. Provision will be made for co-ordination of the work with other parallel studies which are to be undertaken of conventional thermal and fluidized bed systems.
14. The study is to be controlled and co-ordinated by the Assistant General Manager, Engineering, of B.C. Hydro and Power Authority or his appointee.
106

Study C
TERMS OF REFERENCE
FOR
REVIEW OF COAL GASIFICATION AND LIQUEFACTION PROCESSES
1. Provide engineering services to determine the feasibility and cost of gasification for distribution and/or firing in a conventional thermal plant.
The processes to be considered would be:-
a) The production of low Stu gas (100-300 BtulSCF) to be used for firing a con ventional thermal plant. The study is to be based on producing 450 billion Btulday alternatively230 billion Btuldayof gas, at/or in the vicinity of Hat Creek;
b) The production of 250 million SCFlday of town gas of 280 BtulSCF by oxygen blown Lurgi gasifiers for distribution on Vancouver Island. The study will consider the production of the gas only which would have a maximum CO content of 7.5% and a maximum H,S content of 5 grains/l00 cubic feet.
c) The production of 250 million SCFlday of SNG gas of 9501970 BtulSGF at/or in the vicinity of Hat Creek.
2. The work under 1.a) and 1.~) above will be based on the following assumptions:-
a) There will be an existing P.C. fired generating plant at Hat Creek which will utilize the fines in the coal at a price of $3.00 per ton at the station storage pile;
b) Steam which is required for the gasification processes will be available at a price to be advised by B.C. Hydro.
3. The low Btu gasification study in item 1.a) will include a detailed and accurate costing of the Lurgi system. Koppers, Texaco and Slagging Lurgi will be costed with the accuracy that their current development allows, through discussions with the process sponsors. Where possible, this costing will be done by relating as much of the process as possible to the central estimate for the Lurgi plant. The study of the Koppers system will be based on an oxygen plant only, although state-of-art comments will be made on the air blown alternative.
4. The SNG study in item 1.~) will be based on methanation of gas produced by the Lurgi process. The methanation estimate will be produced in such a way that it can be applied to other gasification processes.
5. The study will incorporate a materials and energy balance for each of the main alternatives included in paragraph 3 and 4 above.
6. The study will include a listing and a brief review of all known similar processes

7.
8.
9.
10
11
12
13
14,
15,
16.
which are the subject of a major development effort. This will incorporate statements on the schedule for development, the mechanism of the process, the possibility of the process becoming attractive commercially, and its special advantages and disadvantages. Discussions will be held with the companies developing the processes. Among processes to be considered are:-
Eiqas, Hygas, Cogas, Welman, Winkler, Co,acceptor, and synthane.
Identify the possible environmental impacts of a Lurgi plant in l.a), 1.b) and 1.~) in relation to accepted or assumed emission standards. This will include a flow balance for all gaseous, liquid and solid discharges. The site dependent environmental impacts will be excluded.
Determine the feasibility and cost of a 35,000 barrel per day liquid heavy fuel plant at/or in the vicinity of Hat Creek.
Hat Creek coal is assumed to be the fuel.
The work shall be in the form of engineering studies carried out utilizing published information and data from discussions with companies considered to be recognized authorities in the field having regard to present technology and possible technology in the future.
Gas cost estimates expressed in c/IO6 Btu are to be calculated for a range of capacity factors for the schemes studied. Coal characteristics and costs will be provided by B.C. Hydro from existing data and, as study progresses, from sample tests. Capital cost estimates shall be broken down to clearly itemize the component costs.
Cost estimates shall be in September 1975 dollars and shall be broken down by years. Where possible, agreed common costs received from the co-ordinatinq consultant will be incorporated. The interest on capital and interest during con- struction shall be assumed as 10% but itemized in such a way that the effect of an alternative rate can easily be determined. The assumed plant lives will be agreed with B.C. Hydro.
Project schedules shall be prepared for the earliest in-service dates for various sizes and systems considered.
Prepare and submit a report in draft form by 30 September 1975 and in final form by 28 November 1975. In addition, progress reports will be made monthly of the results achieved, the costs incurred and the scheduling of future work and associated costs.
Provision will be made for co-ordination of the work with other parallel studies which are to be undertaken of conventional thermal and fluidized bed systems.
The study is to be controlled and co-ordinated by the Assistant General Manager. Engineering, of B.C. Hydro and Power Authority or his appointee.
108

Study D
TERMS OF REFERENCE FOR A STUDY
OF
CONVERSION OF BURRARD THERMAL TO COAL BASE
1. Provide engineering seryices to determine the feasibility and costs of conversion of the Burrard Thermal Generating Station to coal fuel. Coal handling and transportation is to be included. The study will cover the alternatives listed in the attached Section 6 of the joint proposal.
2. The study will incorporate a materials and energy balance for each of the main alternatives.
3. The study report will include a statement on the feasibility and operational flexibility of each of the alternatives considered.
4. Identify the possible environmental impacts of such a station in relation to accepted or assumed emission standards. This will include a flow balance for all gaseous liquid and solid discharges when burning Hat Creek coal. A comparison will be made between anticipated emissions and those already occurring at the site.
5. Data from Study C, “Review of Coal Gasification Processes”, is to be considered in the alternatives of gasification on site, near the site, or at Hat Creek. Data from Study A is also to be considered.
6. Resulting energy and capacity costs are to be compared with those from natural gas residual and crude oil.
7. The work shall be in the form of engineering studies carried out utilizing published information and data from discussions with companies considered to be recognized authorities in the field having regard to present technology and possible technology in the future.
8. Power cost estimates expressed in mills/kWh are to be calculated for a range of capacity factors from 60% to the highest considered feasible, for the schemes studied. Coal characteristics and costs will be provided by B.C. Hydro from existing data and, as study progresses, from sample tests. Capital cost estimates shall be broken down to clearly itemize the component costs.
9. Cost estimates shall be in September 1975 dollars and shall be broken down by years. Where possible, agreed common costs received from the co-ordinating consultant, will be incorporated. The interest on capital and interest during construction shall be assumed as 10% but itemized in such Amway that the effect of an alternative rate can easily be determined. The assumed plant lives will be agreed with B.C. Hydra.
109

10. Project schedules shall be prepared for the earliest in-service dates for various sizes and systems considered.
11. Prepare and submit a report in draft form by 30 September 1975 and in final form by 28 November 1975. In addition, progress reports will be made monthly of the results achieved, the costs incurred and the scheduling of future work and associated costs.
12. The study is to be controlled and co-ordinated by the Assistant General Manager, Engineering, of B.C. Hydroand PowerAuthorityor his appointee.
110

BASE ENGINEERING AND COST CRITERIA
A. FINANCIAL
1. Inflation Rate (expressed as percentage)
YEAR LABOUR & MATERIALS
1975 base 1976 10 1977 10 1978 IO 1979 10 1980 5 thereafter
COAL
base 10 10 10 10
5 to plant in-service year 4 thereafter
Basic estimates are to be in September 1975 dollars, without discounting, as stated in the Terms of Reference. The above inflation figures shall be used for inflated cash flow curves (see para. 4.1 & 4.2 below) and any other general statements or comparisons which may be necessary.
2. Base Date-September 1975.
3. Auxiliary Power costs - use an incremental energy cost of 10 mills per kWh. (Use in Study D only)
4. Method of Comparing Alternatives; where possible
2 graphs: 1) Plot Differential Inflated Cash Flow (not discounted) versus time. Assumed service dateoctober 1985.
2) Plot Differential Discounted Present Worth versus interest rate. Present worth to include capital operating and coal costs to perpetuity, all inflated. In evaluating the comparison given by this curve use a discount rate of 15%.
5. Interest During Construction Calculation:
IDC in year N is half the interest rate x the Nth year capital cost, plus the interest rate x the accumulated expenditures, including previous IDC, in the preceding N-l years.
I = 10%
111

6. Annual Charge Data (as a percent of capital cost)
OIL AND GAS COAL THERMAL THERMAL GAS COMBINED GASIFICATION
Itern PLANTS PLANTS TURBINES CYCLE PLANT
Operations & Maintenance 1.80 1.45 .50 ’ 1.45
Administration &General .45 .3625 ,125 * .3625
Insurance .25 .25 .lO .25 .25 interim
Replacement .35 .35 .35 * .35 Taxes 1 .oo 1.00 1.00 1 .oo 1.00
Variable Maintenance Charges(miIIs/kWh) .25 .30 1.50 * .30
Depreciation is dependent on plant life and interest rate. At 10% these are:
Plant Life (years) 35 35 35 35 20 Interest Expense (%) 10 10 10 10 IO Depreciation (%) .37 .37 -37 .37 1.75
*Pro-rate proportions of capital cost relating to Coal-Thermal, Gas Turbine and Gasification plant.
7. Contingencies
Where budget estimates have been received for well defined items of plant such as Turbine Generators, Condensers, Feedheating Pumps, Motors, Transformers, Pulverizers 10 %
NOTE: Calculationsof capital cost (1) plant installed cost (2) apply contingency to(l) (3) apply engineering to (1) & (2) (4) apply corporate o/h to (1) + (2) + (3) (5) apply IDC to (1) + (2) + (3) + (4)
Above annual charges apply to total cost (1) + (2) + (3) + (4) + (5)
Boiler and all Site Work Items with poorly defined extent such as all piping systems, electrical, instrumentation and control systems All process plant, proven gasification plant Unproven gasification processes (judgement by Lummus)
8. Engineering Costs
15 %
15% 15%
1520%
For engineering design costs not including procurement or construction super- vision, a 5% charge should be used.
If construction supervision is included, an 8% charge should be used.
9. Corporate Overhead Rate
For projects having an uninflated direct cost of greater than $105 million, a corporate overhead of 5% is added to the uninflated direct costs of the project (see attached Appendix A).
112

10. Land Costs - assume $1000 per acre.
11. Tax & Debt Equity Ratio - assume no tax paid by B.C. Hydro and that financial structure 100% debt.
13. Sales Taxes - Federal sales tax of 12% not payable on generation equipment. Study A, B & D assume entirely exempt. Study C possibly subject to tax. Provincial sales tax to be omitted.
B. HAT CREEK COAL
1. Analysis - Dolmage Campbell report June 27, 1975, (Appendix 8) as amended by Appendix C.
Other data supplied for reference only:
a) Pages 5-16 to 5-19 Coal Resources of British Columbia - 1975, Dolmage Campbell 8 Associates
b) Graph of Ash vs. Calorific Value - No. 1 Openpit Area, Dolmage Campbell &Associates
c) Appendix C, D and E (33 pages) Hat Creek Thermal Power Plant, B.C. Engineering Co. Ltd. 1960.
2. Quality
The reactivity of the coal shall be assessed by Lurgi burning tests. Coking qualitiesare discussed in Analysis References in b)above.
3. Cost and Quantity Available
The cost of Hat Creek coal is to be assumed at $3.00 per short ton in September 1975 dollars. This includes provincial royalties and a contingency allowance.
The consultant is to assume there would be sufficient coal available.
4. Percentage Fines Relating from Crushing &Handling
Assume 7% of coal less than 3mm. This coal is not to be used in Lurgi Gasifiers.
5. Sulphur Content
0.10% Pyritic 0.28% Organic 0.01% Sulphate
0.39% Total
Assume all sulphur becomes sulphur dioxide. It should be assumed that the organic sulphur, and hence the sulphur dioxide levels, will not exceed these figures.
6. MoistureContent 20% as plant feed.
10% inherent 10% surface
113

7. Calcium in Ash
Assume 90% as silicate 10% as carbonate. The absorption of sulphur by the carbonate may be discussed but the report should be based on the assumption in para 5 above.
8. Designs to be based on 25% ash with consideration of effect of 31% ash content.
9. Ash softening temperature2750’F plus.
C. HAT CREEK SITE
1. Elevation
Assume 3000 feet elevation for the site.
2. Temperature
Climatic data isattached in Appendix D.
D. HAT CREEK WATER
1. Make-Up Water Quality - Thompson River 1 mile above Ashcroft.
Total Dissolved Solids 87-92 PH 7.1-7.5 Suspended Solids 6
2. Limitations on Water Quantity Available
No limitations.
E. LABOUR COSTS (HAT CREEK AND BURRARD)
The studies should be based on the labour rates attached, assuming 25% payroll burden and a 37Y2 hour week without regular overtime. Where possible, costs should bequoted on a unit basis.
F. OTHER INFORMATION
1. Total gross turbine generator output for Hat Creek conventional coal-fired station 2140 MW.
2. Load Factor
Conventional Generation 60.80% Combined Cycle/Gasification 60.80% Gasification 60 - 90%
A combined gasification/combined cycle plant should be designed so that the load factors match.
3. Credit for Elemental Sulphur Produced
Assume zero credit (i.e. assume the market value of sulphur equals the cost of transporting it).

4. Credit for Other Products
NH, $180 Canadian per ton as anhydrous. Other hydrocarbons to be advised by Lummus.
5. Cost of Outages
To be discussed between consultants. Consultant should assess the forced outage rate of equipment and show as an extra the cost of forced outages at 10 mills per kWh.
It is estimated that a conventional plant will have a annual outage of four weeks with an 8 week outage every five years. Any plant requiring longer planned outages than this should be debited at the above rate.
6. Availability and Cost of Natural Gas and Oil
Oil $12.00 per barrel - September 1975 cost Natural gas $0.576 per MSCF (subject to revision).
Natural gas would not be available at Hat Creek.
With respect to Burrard, assume natural gas and oil would be available for start.up. Oil would also be available in limited quantities for operation.
7.
a.
9.
Pollution Control Objectives
The following pollution control objectives should beconsidered:
i) Provincial Pollution Control Board Level AGuidelines.
ii) Pollution Control Objectives for the Chemical and Petroleum Industries of British Columbia.
iii) Pollution Control Objectives for the Mining, Mine-milling and Smelting Industries of B.C.
iv) Canadian Ambient Air Quality Objectives for Air Contaminants.
Stack Height Requirements
1000 feet. Price in para 19 below.
Philosophy of Station and Unit Manning Levels.
4 staff of 0.15 men per MW is to be assumed for conventional thermal plant.
10. Plant Design Life
The plant design life can be assumed at 35 years for generation plant and 20 years for gasification and process equipment.
11. Start-UpConcepts.
The consultant should discuss various concepts but not include the cost of alternatives.
12. Special Civil Considerations
None.
115

13. Seismic Zone - 1
No special costs were included in B.C. Hydro study work.
14. Transportation Access
A spur line, graded for the transportation of equipment only, would be constructed to connect the B.C.R. siding at Pavilion with the turbine house in the Hat Creek thermal plant.
maximum width 12’6”viaBCR 13’8”viaCNR
It is considered that very minor improvements would be necessary for highway access; thecost being included in site preparation.
Cost of Rail Spur $8,125,0OO(Sept. ‘75) to be included
15. Holding Pond
This cost is included in the water supply system. (Total $25.8 million including the main pumphouse, pipeline, pond, pond pumphouse and piping to the station wall.)
16. Site Preparation and Camp
Site preparation $6.25 million including road works, drainage, fencing and all site dependent factors.
Camp $19 per man day.
17. Coal Handling Requirements
Consultants receive coal after primary crushing as it goes to storage pile. For prices see 19 below.
18. Philosophy of Standby Protection.
Forelectrical auxiliaries 2x 50% Steam driven auxiliaries 1 x 100% ~1~~30% standby.
19. Equipment Cost
Ignore switchyard and transmission costs. Pricing to high side of generator transformer.
Other costs supplied to consultants separately by lnteg are those shown in reference estimate of summary report.
G. PERFORMANCE
1. Gas Turbines
Maximum base load firing temperature 1950°F Ratings to be site elevation and 40°F Silencing to NEMA C at 400’
Performance figures to include silencing and filtration pressure losses,
116

2. Boilers - performance by ABMA Standard including manufacturers tolerance.
3. Net heat rates - to include for all auxiliaries inside the plant including the coal plant from ROM hoppers, pumping power from river, etc.
Mine power - to be omitted.
River pumping power - see Appendix E
FIGURE A CORPORATE OVERHEAD RATES
THE CORPORATE OVERHEAD FOR PROJECTS OF LESS THAN $ 1.0 MILLION IS 20%
0 IO 20 30 40 50 60 70 80 90 IO0 110 120 8 OVER
UNINFLATED DIRECT COSTS OF PROJECT (INCL. ENGINEERING)
-$ MILLIONS -
CORPORATE OVERHEAD (TO THE NEAREST 0.5%) TO BE ADDED TO THE UNfNFLATEO DIRECT COSTS OF PROJECTS TO ODTAIN THE TOTAL COSTS DEFORE INTEREST OURItJG CONSTRUCTION AND BEFORE INFLATION.
117

HAT CREEK PROJECT
INTERIM REPORT ON COAL ANALYSES NO. 1 OPENPIT DEPOSIT
J.F. MCINTYRE, P.ENG. JUNE27,1975
INTRODUCTION
In a letter dated June 18, 1975, from Dr. H. M. Ellis to Dr. D. D. Campbell. information was requested on the proximate, ultimate and ash analyses of coal in the No. I Openpit area of the Hat Creek coal deposits. In addition, an estimate was requested of the anticipated percentage of less than 3 mm coal in a feed crushed to a maximum size of 30 mm. The information is required by consultants investigating gasification and related advanced combustion technologies.
This interim report provides the best information presently available. Within one week, all proximate analysis data will have been computerized and summary tables at varying ash cut-offs produced. Revised figures incorporating significant changes will be submitted when this new information becomesavailable.
BACKGROUND INFORMATION
By letter dated May 8, 1975, to Dr. H. M. Ellis, Dr. L. T. Jory summarized the then available ash and gross calorific value data. A graph showing the relationship using the mean values of each drill hole was included and a copy of the same graph is attached to this report.
The proximate analysis data available on May 8 were a computer summary of all 195759 drill holes and individual summaries for each of the 1974-75 drill holes. Since that time minor corrections have been made to the 1957-59 data but no further computer output is available for the 1974-75 data since overall summaries are being withheld pending inclusion of proximate analyses data on the reeampled. higher ash portions of the cores. All of the higher ash data has now been keypunched.
The range of coal quality will depend principally on the degree of selective mining employed.
The mean ash and calorific value data submitted on May 8 are detailed in the following section and form the basis for other proximate analysis data discussed in this report. For purposes of showing selective vs non-selective mining of all but major waste beds, an arbitrary ash cut-off of 44% at 20% moisture was used. The mean of samples below 44% ash likely yields a grade closely approaching the best condition possible by maximum selective mining employing excavators of moderate size. The mean of all samples likely yields a grade approaching the worst condition employing
11.3

excavators of moderate size but removing by selective mining only major waste beds. Should large and relatively inflexible bucketwheels or draglines be employed, the grade attained would suffer by more excessive dilution.
It is arbitrarily concluded that to produce coal averaging less than 25% would prove economically undesirable because too high a percentage of the coal would have to be discarded. Similarly, it is concluded that the worst average grade resulting from the selective removal of only the major waste beds would be 31% ash. Hence, for this report data are developed for an assumed maximum quality range of 25 to 31% ash for the No. 1 Openpit deposit as a whole. For this report no consideration is given to the possibility of upgrading the coal by washing.
PROXIMATE ANALYSIS
ASH AND GROSS CALORIFIC VALUE
The presently known mean ash and calorific values for 1957-59 and 1974-75 samples are as follows: GROSS
MOIST. % ASH % BTU/LB.
Samples below 44% ash 20.00 25.72 6266 Samples above 44% ash 20.00 56.36 2785 All samples 20.00 28.09 5931
The mean values are weighted for core lengths but are not weighted geologically on the basis of bed or seam correlations or information on faults. When applied, such weighting will probably increase slightly the mean ash content for the deposit as a whole. The mean ash content will also increase slightly when the analyses for higher ash portions of the cores are included.
The 20% in situ moisture value is the present best estimate.
FIXED CARBON AND VOLATILE MATTER
The mean fuel ratio(fixed carbon:volatile matter) is noticeably different in 1957-59 drill holes and 1974.75drill holes. Resultsareas follows:
MEAN OF: FUEL RATIO
1957-59 samples 0.813 1974-75 samples 0.979 All samples 0.899
The fuel ratio of individual drill hole composites for 1974-75 drill holes varies from 0.837 to 1.155, and none are as low as the 1957-59 mean. The difference is likely due largely to better analytical work in 1974-75 rather than to the particular locations of the drill holes. Hence, it is concluded that a figure closely approaching the 1974-75 fuel ratio should be used. This is arbitrarily chosen at 0.95.
The 0.95 ratio is uncorrected for the difference between mineral matter and ash. For Hat Creek coal, the correction is significant as shown on the accompanying ash vs calorific value graph. On the graph, the regression line intersects the Y axis (zero calorific value) at about 84% ash. Traditionally, the mineral matter vs ash correction applied to proximate analysis data is the Parr formula (A.S.T.M. Designation D 368-66) developed for average eastern U.S. bituminous coals. For Hat Creek coal, application of a Parr-type formula tailored to the observed analytical data, gives a~ fuel ratio of about 1.2 rather than 0.95.
119

SULPHUR
Mean sulphur analyses of proximate samples vary between 1957-59 samples and 1974-75 samples. Based on 20% moisture they are as follows:
MEAN OF: SULPHUR%
1957-59 samples 0.32 1974.75 samples 0.41 All samples 0.37
A plot of ash YS sulphur was made for the 1974.75 ultimate analyses samples. From the plot (not attached) it is not apparent that any consistent relationship exists between ash and sulphur. Hence, the mean value of 0.37% sulphur for the deposit as a whole should be used for the time being without regard to ash content variations.
However, for extended periods of time the sulphur content of mined coal might vary significantly above or below the mean. For example, for just the ultimate analysis samples, only 80% of the sulphur values fall within the range of 0.37 + 0.24%. Thus, plant design could conceivably have to accommodate feed ranging from 0.13% to 0.61% or more in sulphur. Blending of coal to produce a uniform ash plant feed might reduce this range of sulphur contents substantially but this cannot be determined at this time.
SUMMARY OF PROXIMATE ANALYSES
Based on 20% moisture, varying selective mining conditions, and uncorrected and corrected fuel ratios, the following mean values are presented for the No. 1 Openpit deposit at Hat Creek.
FUEL RATIO(1, FUEL RATIO (2) 0.95 1.2
1. Maximum selective mining Moisture - % 20.0 20.0 Ash - % 25.0 25.0 Vol. Matter - % 28.2 25.0 Fixed Carbon - % 26.8 30.0 GrossCal.Value - Btullb. 6410 6410 Sulphur- Mean % 0.37 0.41
Range % 0.13-0.61 0.13-0.61
2. Minimum selective mining Moisture - % 20.0 20.0 Ash - % 31.0 31.0 Vol. Matter - % 25.1 22.3 Fixed Carbon - % 23.9 26.7 Gross Cal. Value - Btullb. 5470 5470 Sulphur - Mean % 0.37 0.37
Range % 0.13-0.61 0.13-0.61
Notes: (1) Uncorrected fuel ratio (2) Fuel ratio corrected by Parr-type formula adapted to Hat Creek
analytical data.
A range of values are shown only for sulphur. In point Of fact, Of Course.
significant variations will occur in the plant feed for all coal quality parameters.

HARDGROVE GRINDABILITY INDEX
The Hardgrove grindability index is a measure of the energy required to pulverize coal. The higher the index, the lower the energy expenditure required to achieve a given degree of pulverization.
The 1957-59 program yielded only fragmentary information. Hence, only 1974-75 work is discussed here. A plot of ash vs Hardgrove index shows that a valid relationship exists wherein the cleaner the coal, the more difficult it is to grind. However, factors other than ash contribute to grindability. Hence, for extended periods of time the grindability might vary substantially higher or lower than the mean and prudent design would accommodate the worst condition. The choice is arbitary, however 80% of all tests done fall within & 5 units of the mean regression line and this would seem to be adequate for design purposes at this time.
Mean values and ranges for 25% and 31% ash coals, based on 20% moisture, are as follows:
PRODUCT
25% ash 31% ash
HARDRO”ElNDEX MEAN RANGE
42 37-47 48 43-53
All tests were carried out under the normal laboratory moisture condition of the sample. The moisture level can affect the grindability index so at some time, tests should becarried out undervarying moisture conditions.
ULTIMATE ANALYSIS
Ultimate analyses have been carried out on 53 samples composited from proximate analysis samples from the 1974-75 drill holes. Ultimate analyses are reported on a dry basis. Means of results as reported and corrected to 20% moisture are as follows:
Carbon Hydrogen Nitrogen Chlorine Oxygen (by difference) Sulphur Ash Moisture
ORY BASIS 20.0% MOISTURE BASIS % %
43.50 34.80 3.39 2.71 1.06 0.85 0.03 0.02
14.92 11.94 0.51 0.41
36.59 29.27 0.00 20.00
121

The range of ultimate analysis, based on 20% moisture, for maximum and minimum selective mining would be as follows:
Carbon Hydrogen Nitrogen Chlorine Oxygen (by difference) Sulphur Ash Moisture
25% ASH PRODUCT 31% ASH PRODUCT % %
37.72 33.62 2.94 2.62 0.92 0.62 0.02 0.02
12.93 11.51 0.41 0.41
25.00 31 .oo 20.00 20.00
It should be noted that these sulphur values are the 1974-75 means and have not been corrected for variation in ash content. Also the mean value, as quoted earlier! for all 1957-59 and 1974-75 drill holes is 0.37%. This figure could be validly substituted, if desired, by simply accommodating the difference in the oxygen content.
MINERAL ANALYSIS OF ASH
For the samples on which ultimate analyses were obtained, a chemical analysis of the ash was also carried out. The average values and range are presented below. These values are all arithmetic averages rather than weighted mean values. Weighted mean values will be submitted later following regression analysis of individual constituents and determination of their relative significance. It is not practical at this time to attempt to determine the values at 25% and 31% ash.
CONSTITUENT
Phosphorous Silica Iron Alumina Titania Lime Magnesia Sulphur Potassium Sodium Undetermined (by difference)
DRILLHOLEAVE A”E.OFALL EXPRESSED AS: RANGE SAMPLES
PA .12- 33 .24 SiO, 50.73 - 55.65 54.33
Fez% 5.54-10.11 7.40 4% 26.34 - 30.73 26.80 TiO, .65- 99 .a3 CaO 2.25. 3.54 2.66 MgO .64- 2.60 1.40 so3 1.49. 2.68 1.80 K&J .24- .97. 53
NA,O .69- 1.52 1.12 .20- 1.94 .91
122

SIZE CONSIST OF COAL
It is desired to know what percentage of coal feed would be less than 3 mm in screen size after crushing the coal to a top size of 30 mm. Lacking data on a representative bulk sample mined and processed in a generally similar manner to production conditions, only avery rough estimate can be made at this time.
Hat Creek coal is generally not well banded. Rather it tends to be massive with an irregular, somewhat woody texture. As such it would tend, on mining and crushing, to have a relatively low content of fines. Drilling results to date indicate that about 11% of coal footage drilled is closely broken with individual fractures at one inch or less spacing. Screening of several samples from a number of such broken zones indicates that the minus 3 mm fraction in these zones does not exceed lo%, hence it would be expected that the less broken coal would yield even less fines.
Generally speaking, a coal of this rank might be expected to have a fines content of roughly 5 to 15% passing 3 mm size. Indications so far are that Hat Creek coal is uncharacteristic in this regard and would contain less fines than many coals of similar rank. All that can be offered at this time is an “educated guess” that the fines contents of raw Hat Creek coal, crushed to a top size of 30 mm, would likely fall within the rangeof 5 to 10% passing a3 mm squarescreen.
Respectfully submitted,
DOLMAGE CAMPBELL & ASSOCIATES LTD.
123

-
\
,- .-
I I I

APPENDIX C
HAT CREEK COAL - B.C. HYDRO
Revised Coal Analysis
PROXIMATE (adjusted)
Moisture Ash CombustibleVolatiles Fixed Carbon IncombustibleVolatiles HHV
2590 ASH 31% ASH
20 20 25 31 21.1 18.8 27.19 24.2
6.7 6.0 6402 5436 Basis High
Add ,rom letter July 4.1975.
APPENDIX D
MEAN DAILY TEMPERATURE(DEG. F) JAN FEE MAR APR MAY JUN JUL AUG SEP OCT NOV DEC YEAR
12.2 21.7 28.8 38.7 48.3 54.2 59.1 57.5 50.9 39.4 25.9 17.1 37.8
MEAN DAILY MAXIMUM TEMPERATURE (DEG. F) JAN FE0 MAR APR MAY JUN JUL AUG SEP OCT NOV DEC YEAR
22.8 33.8 40.2 51.1 62.4 68.2 75.1 73.2 66.1 51.3 35.4 26.7 50.5
125
-

MEAN DAILY MINIMUM TEMPERATURE(DEG. F) JAN FEB MAR APR MAY JUN JUL AUG SEP OCT NOV DEC YEAR
1.5 9.6 17.3 26.2 34.1 40.2 43.0 41.7 35.7 27.5 16.3 7.5 25.1
EXTREME MAXIMUM TEMPERATURE(DEG. F) JAN FEB MAR APR MAY JUN JUL AUGl SEP OCT NOV DEC YEAR
53 56 63 70 82 93 94 94 88 74 54 50 94
EXTREME MINIMUM TEMPERATURE(DEG. F) JAN FEB MAR APA MAY JUN J”L AUG SEP OCT NOV DEC YEAR
-41 .13 -18 12 18 26 31 28 19 IO -22 -45 -45
MEAN RAINFALL (INCHES) JAN FEB MAR APR MAY JUN JUL AUG SEPT OCT NOV DEC YEAR
0.10 0.11 0.21 0.32 0.70 1.38 1.14 1.25 0.79 0.84 0.26 0.14 7.24
MEAN SNOWFALL(INCHES) JAN FEB MAR APR MAY J”N JUL AUG SEP OCT NOV DEC YEAR
14.5 6.2 4.0 3.2 1.5 0.0 0.0 0.0 0.2 1.5 9.1 12.2 52.4
MEAN TOTAL PRECIPITATION (INCHES) JAN FE8 MAR APR MAY JUN JUL AUG SEP OCT NOV DEC YEAR
1.55 0.73 0.61 0.64 0.85 1.38 1.14 1.25 0.81 0.99 1.17 1.36 12.48
GREATEST RAINFALL IN 24 HRS.(INCHES) JAN FEB MAR APR MAY JUN JUL AUG SEP OCT NOV DEC YEAR
0.40 0.20 0.12 0.32 0.65 0.89 1.53 1.18 1.05 0.69 0.21 0.30 1.53
126
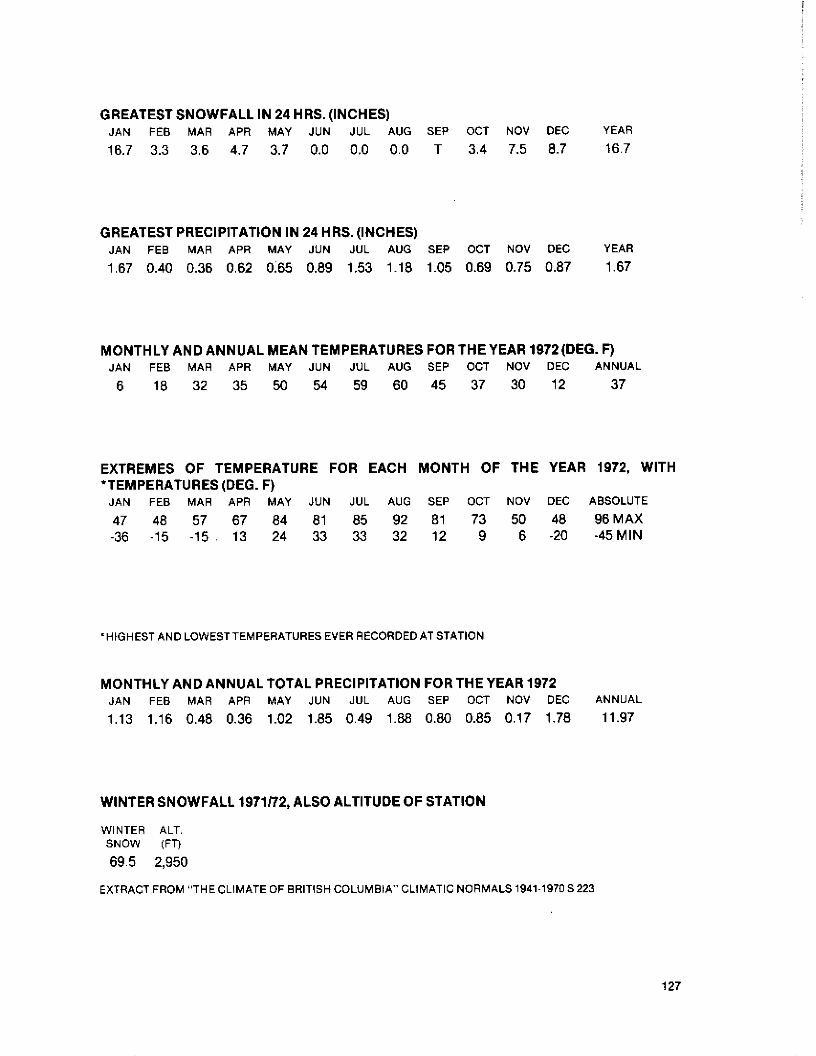
GREATESTSNOWFALL IN 24 HRS.(INCHES) JAN FE8 MAR APR MAY JUN JUL A”G SEP OCT NOV DEC
16.7 3.3 3.6 4.7 3.7 0.0 0.0 0.0 T 3.4 7.5 8.7
YEAR
16.7
GREATEST PRECIPITATION IN 24 HRS. (INCHES) JAN FEE MAR APR MAY JUN JUL AUG SEP OCT NOV DEC YEAR
1.67 0.40 0.36 0.62 0.65 0.89 1.53 1.18 1.05 0.69 0.75 0.87 1.67
MONTHLY ANDANNUALMEAN TEMPERATURES FORTHEYEAR 1972(DEG. F) JAN FEE MAR APR MAY JUN JUL AUG SEP OCT NOV DEC ANNUAL
6 18 32 35 50 54 59 60 45 37 30 12 37
EXTREMES OF TEMPERATURE FOR EACH MONTH OF THE YEAR 1972, WITH *TEMPERATURES (DEG. F)
JAN FES MAR APR MAY JUN JUL AUG SEP OCT NOV DEC ABSOLUTE
47 46 57 67 84 81 85 92 81 73 50 40 96 MAX -36 -15 -15 13 24 33 33 32 12 9 6 -20 -45 MIN
‘HIGHEST AND LOWESTTEMPERATURES EVER RECORDED AT STATION
MONTHLY AND ANNUAL TOTAL PRECIPITATION FOR THE YEAR 1972 JAN FE0 MAR APR MAY JUN JUL AUG SEP OCT NOV DEC ANNUAL
1.13 1.16 0.48 0.36 1.02 1.85 0.49 1.88 0.80 0.85 0.17 1.78 11.97
WINTER SNOWFALL 1971172, ALSO ALTITUDE OF STATION
WINTER ALT. SNOW (FT,
69.5 2,950
EXTRACT FROM “THECLIMATE OF BRITISH COLUMBIA” CLIMATIC NORMALS 1941.197OS223
127
-