STUDIES IN PHOTOELECTRIC INTERFERENCE … · STUDIES IN PHOTOELECTRIC ... Factors affecting the...
309
STUDIES IN PHOTOELECTRIC INTERFERENCE SPECTROSCOPY IN THE ULTRAVIOLET by Brian Bates M.Sc. A Thesis submitted for the Degree of Doctor of Philosophy Department of Physics Imperial College of Science and Technology London. August 1966.
-
Upload
vuongkhanh -
Category
Documents
-
view
216 -
download
1
Transcript of STUDIES IN PHOTOELECTRIC INTERFERENCE … · STUDIES IN PHOTOELECTRIC ... Factors affecting the...

STUDIES IN PHOTOELECTRIC
INTERFERENCE SPECTROSCOPY
IN THE ULTRAVIOLET
by
Brian Bates M.Sc.
A Thesis submitted for the
Degree of Doctor of Philosophy
Department of Physics
Imperial College of Science and Technology
London.
August 1966.

ABSTRACT.
The superior angular dispersion of the Fabry-Perot interferometer
and its large gain in luminosity over grating dispersers is now widely
exploited in laboratory spectroscopy. These advantages of the inter-
ferometer are of considerable importance for astronomical spectroscopy
from space vehicles.
Factors affecting the performance of the interferometer and Fabry-
Perot type interference filters in the far and vacuum ultraviolet are
considered. An improvement in performance of the interferometer and
filters in the far ultraviolet and an extension of their useful spectral
range into the vacuum ultraviolet is reported arising from the development
of new semi-transparent reflecting coatings. Methods of preparation
and optical properties of aluminium and aluminium-magnesium fluoride
coatings for multiple-beam interferometry in the ultraviolet (71800 R )
are discussed. Effects of evaporation conditions on optical properties
are considered and a comparison made with computed data. The coating
performance for interferometry is summarised and illustrated with inter-
ferograms of.A 1849 R of Hg I.
Transmission characteristics of filters for wavelengths 1700 - 2400 R
are described. Peak transmissions of 25% with bandwidths.C300 R are
obtained for first order filters. Second order filters give a narrower
bandwidth. Effects of optical properties of the reflecting layers on
filter performance are discussed.
The application of the interferometer combined with an electron -
11
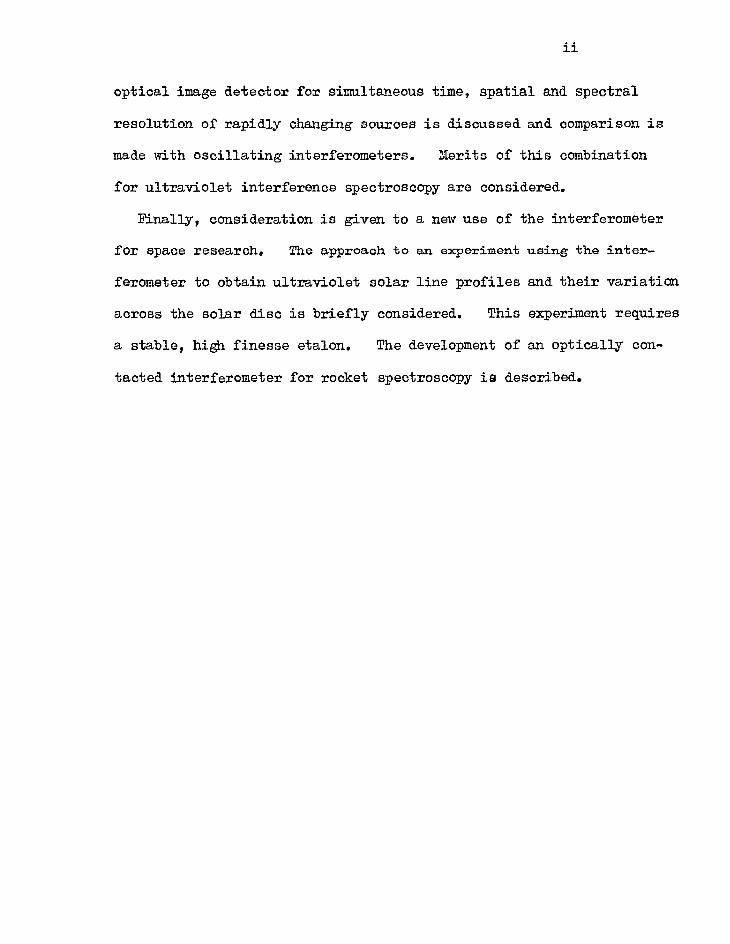
optical image detector for simultaneous time, spatial and spectral
resolution of rapidly changing sources is discussed and comparison is
made with oscillating interferometers. Merits of this combination
for ultraviolet interference spectroscopy are considered.
Finally, consideration is given to a new use of the interferometer
for space research. The approach to an experiment using the inter-
ferometer to obtain ultraviolet solar line profiles and their variation
across the solar disc is briefly considered. This experiment requires
a stable, high finesse etalon. The development of an optically con-
tacted interferometer for rocket spectroscopy is described.

iii LIST OF CONTENTS.
Page.
Chapter 1. A Background to the Present Investigation. 1
1.1. Introduction 1
1.2. The Extension of the Spectral Range of the 6
Interferometer into the Far Ultraviolet.
1.3. The Extension of the Spectral Range of Interference a
Filters.
1.4. The Wavelength Region covered by the Present 11
Investigation.
1.5. The Elementary Theory of the Etalon 13
116. The Phbtographic Use of the F.P. Interferometer 17
147. Photoelectric Spectrometry Employing the F.P. 17
Interferometer
1.8. Exploration of the Spectrum 18
1.9. Further Aspects of the Present Investigation 19
1.10. The Aims and Development of the Present Investigation 22
Chapter 2. The Relevent Theoretical Background of the F.P. Etalon 26
and F.P. Interference Filters.
2.1. Introduction 26
2.2. Spectral Resolution 27
2.3. A More Detailed Theory of the Etalon 29
2.3.1. The Airy Function 30
2.3.2. Imperfections of the Etalon Plates 33
2.4. Resolving Power and Resolution Limit 37
iv Page.
2.5. Luminosity 39
2.6. The Choice of Coating Reflectivity 42
2.7. F.P. Type Interference Filters 43
Chapter 3. Reflecting Coatings and Filters for the Far and 50 Vacuum Ultraviolet.
3.1. Introduction 50 3.2. The Optical Properties of Semi-Transparent Aluminium 54
Films Prior to the Investigations of Hass and
Co-Workers.
3.3. The Necessary Conditions for Producing High Ultraviolet 57
Reflectance, Aluminium Films.
3.3.14 Aluminium Purity 57
3.3.2. The Evaporation Pressure and Speed of Evaporation 58
3.3.3. Substrate Temperature 60.
3.3.4. The Vapour Angle of Incidence 61
3.4. The Improved Performance of Semi-Transparent 63
Aluminium Films
3.5. The Ageing Properties of Exposed Aluminium Films 64 3.6. The Reflectance of Unexposed Aluminium Films 65 3.7. The Aluminium-Dielectric Double Layer Combination 67 3.8. Filters for the Ultraviolet 70
3.8.1. Absorption Filters 70 3.8.2. Interference Filters for the Far and Vacuum Ultraviolet 72.

Page
Chapter 4. Relevent Thin Film Theory and Computed Optical 76
Properties for Transmitting Aluminium and Aluminium-
MgF2
4.1. Introduction 76
4.2. The Absolute Phase Change on Reflection
4.2.1. The Boundary Between two Non-Absorbing Media 79
4.2.2. The Boundary Between Absorbing and Non-Absorbing Media 79
4.3. The Aluminium-Me2 Film Combination - Conditions for 81
Maximum and Minimum Reflectivity
4.4. The Method used for Computing Optical Properties 85
4.5. The Optical Constants used for Computation of Film 86
Properties.
4.6. Results of Computed Film Properties
4.6.1. Single Aluminium Films 88
4.6.2. The Aluminium - MgF2 Combination 89
4.6.3. The Calculated Effect of a Surface Oxide Layer 95
Chapter 5. The Apparatus and Method for Producing Interferometer
Coatings and Interference Filters for the Far Ultraviolet
5.1. . Introduction 100
5.2. The Evaporation Plants
5.2.1. Unbakeable Glass Demountable System 102
5.2.2. Bakeable Metal Demountable System 105
5.2.3. The Pumping Performance 109
5.2.4. The Substrate Holder and Shutter Mechanism 110
vi Page.
5.3. Apparatus for Controlling Film Thickness during Deposition
5.3.1. The Choice of Monitoring System 115
5.3.2. The Light Source and Detectors 117
5.3.3. Preliminary Considerations of the Control Circuit 118
5.3.4. Description of the Control Circuit 121
5.3.5. The Shutter Actuating Circuit 122
5.4. Substrate Preparation 127
5.5. The Evaporation Procedure 128
Chapter 6. Optical Properties of Evaporated Aluminium and
Aluminium - MgP2 Films and Transmission Characteristics
of F.P. Type Interference Filters in the Far Ultraviolet
6.14 Introduction 131
6.24 Method of Measurement.
6.241. Method for Measuring the Reflection and Transmission 132
Coefficients of the Interferometer Coatings.
6.2.2. Measurement of Filter Transmission Characteristics 137
6.2.3. Corrections for Substrate Losses 138
6.3. The Optical Properties of Semi-Transparent Aluminium
Films in the Fax Ultraviolet.
6.3.1. Films Prepared under the Poorer Vacuum Conditions 142
6.3.2. Films Prepared under the Improved Vacuum Conditions 145
6.3.3. Optical Microscope Examination of Aluminium Films 149
6.3.4. Comparison between Measured and Computed Optical
Properties for Single Aluminium Films 151

vii Page.
6.4. A Discussion of the Optical Properties of Single
Aluminium Films.
6.4.1. Film Absorption - Dependence on the Preparation 154
Conditions
6.4.2. Changes in Optical Properties with Time 161
6.4.3. Film Absorption - Dependence on Film Thickness 164
6.5. The Optical Properties of the Semi-Transparent
Aluminium - Me2 Double Layers
6.5.1. Films Prepared under the Poorer Vacuum Conditions 168
6.5.2. Films Prepared under the Improved Vacuum Conditions 171
6.5.3. Comparison Between Computed and Measured Optical 174
Properties of the Double Layer Coatings
6.6. A Discussion of the Optical Properties of the 176
Double Layer Coatings.
6.7o Application to Naltiple-Beam Interferometry 178
6.8. F.P. Type Interference Filters for the Far Ultraviolet 185
6.8. First Order Filters 187
6.8.2. Second Order Filters 193
6.8.3. Change in Filter Characteristics with Time 195
Chapter 7. Image Intensifiers Applied to Interference Spectroscopy
7.1. Introduction 199
7.2.
The Optimum Conditions for Matching the Interferometer 202
to the Dectector.
7.3. Image Intensifiers 204

viii Page.
7.3.1. The Single Stage Intensifier 204
7.3.2. Cascade Image Intensifiers 204
7.3.3. Transmission Secondary Emission Intensifiers 206
7.3.4. Electronographic Image Intensifier 207
7.3.5. Channelled Secondary Emission Image Intensifiers 208
7.4. The F.P. Interferometer - Image Intensifier Combination 209
7.4.1. The Channelled Intensifier 209
7.4.2. The Single Stage Intensifier 213
7.5, Time-Resolved Photoelectric Recording of P.P.
Interferograms
218
7.5.1. Single Stage Intensifier 220
7.5.2. T.S.E. .Tube 220
7.5.3. Cascade Tube 222
7.5.4. Lenard Window Tube 222
7.5.5. A Comparison of the Different Intensifiers for Time- 224
Resolved Spectroscopy
7.5.6. A Comparison between the Oscillating F.P.Spectrometer
and the Etalon-Intensifier Combination
226
7.5.7. Electron-Optical Sweeping 229
7.6. The Wavelength Selective Photocathode 230
Chapter 8. Some Recent Developments in the Application of the F.P.
Interferometer to Space Research.
8.1. Introduction 234

ix Page.
8.2. Some Advantages of the F.P. Interferometer in Space 241
Spectroscopy
8.3. A Rocket Spectrograph Employing the P.P. Interferometer 246
6.4. An Optically Contacted Permanently Adjusted F.P. 250
Etalon
Chapter 9. Summary 258
Acknowledgements 262
References 263.

CHAPTER 1.
A BACKGROUND TO THE PRESENT INVESTIGATION,
1.1. Introduction.
The definition of the term 'interference spectroscopy' given by
Jacquinot (1960) is one of degree rather than kind since in reality, all
the techniques of spectroscopy involve the phenomena of interference.
The term interference spectroscopy has now become generally applied to
techniques in which high orders of interference are used by employing
instruments such as the Lummer plate, the Michelson echelon or the Fabry-
Perot interferometer. For these instruments, the interference order
is usually in excess of 104. This definition thus excludes grating
instruments where the order of interference is only a few units or ex-
ceptionally several hundreds of units as in the case of the echelon grating.
The subject matter covered in the present investigation is largely con-
cerned with the development and the application of one instrument which
has been widely used for interference spectroscopy - namely, the Fabry-
Perot interferometer.
The interferometer first described by Fabry and Perot in 1897 was
one of several high resolution instruments developed in the latter part
of the last century. However it was not widely used for the examination
of spectral lines until 1927 when the discovery of the relation between
nuclear spin and hyperfine structure resulted in a considerable interest
in high resolution spectroscopy. Even so, in spite of the many well known
uses of the interferometer in astronomical spectroscopy, high resolution

2.
speotrocopy, wavelength standard determinations etc, the apparatus was
very little developed until Jacquinot and Dufour described the first
scanning interferometer (the P.P. spectrometer) in 1948. Since this
time there has been a great revival of interest in the use of the inter-
ferometer.
With the development of laser sources the F.P. interferometer has now
become a commonplace instrument in many laboratories since the high re-
solving power required for the spectral examination of such sources can
be acheived by interferometric means only. However for some recent app-
lications, the interferometer has not necessarily been used for its ability
to provide a high spectral resolving power, for which it is most commonly
known, but for its superior angular dispersion and light gathering power
compared with grating instruments of the same area and resolving power.
(Jacquinot 1954). These superior qualities have been exploited for the
increasing number of problems in which time resolution and repetition
rate are of major importance in particular for laboratory plasma physics
where few instruments have thevcroatilityr and simplicity of the scanning
F.P. interferometer for measuring time-resolved spectral profiles. Yet
for high spectral resolution and time-resolved interference spectroscopy
in the nanosecond region, and this is now required with the development
of Q spoiled laser systems, the F.P. spectrometer has several limitations
which at present make such a time resolution impracticable. The reasons
for this short coming will be discussed in later sections where consider-
ation is given to the interferometer-image intensifier combination which
overcomes many of the limitations of the scanning interferometer.

3. Dunham (1956) has shown how the high luminosity and the large angular
dispersion of the interferometer can be exploited for astronomical spec-
troscopy from ground based telescopes when a high spectral resolving power
is required and the 'seeing, conditions are not necessarily very good. A
similar consideration can be made for space research applications where
the guidance limitations of the space vehicle now replace the seeing res-
trictions introduced by the earth's atmosphere. With the added advantage
of speed of recording and compactness it is likely that in the near future
the interferometer will become exploited for the first time in the field
of space spectroscopy from rockets and satellites (Bradley 1966). Much
of the subject matter of this present investigation has been concerned with
Okdevelopment of the interferometer and with techniques of interference
spectroscopy with this end in view.
The interferometer as first described consisted of two transparent
optical flats each coated with a semi-transparent reflecting film. The
flats were aligned so that the reflecting layers, separated by an air
gap, were mounted parallel to each other. In the original form of the
instrument one of the plates was mounted on a movable carriage enabling
the plate separation to be easily changed. However, this form of the
instrument soon became obsolete because of the difficulty in working the
movable carriage to maintain the high degree of accuracy required in the
plate parallelism. (Some 60 years later this problem, and the additional
difficulty of rapidly vibrating one plate about a mean position, was over-
come leading to the development of oscillating interferometers for time
resolved spectroscopy). In a later instrument described by Fhbry and Perot
the plates were separated by fixed spacers of quartz and parallelism was
obtained by a small mechanical compression of the plates against the spacers.
This form of the instrument became known as the Fabry-Perot etalon.

4.
For many years the P.P. etalon employed with the photographic method
of detection played an important role in high resolution spectroscopy and
the majority of investigations of hyperfine structure of spectral lines
have been made by this method(Tolansky 1947). So too has the interfero-
meter employed in the spectrographic method of use played a significant
role in astronomical spectroscopy (Ring 1956). Fabry and Perot themselves
measured wavelengths of Fraunhofer lines in the solar spectrum as early as
1902 and in 1911 Fabry and Agg= investigated the spectrum of the great
nebula of Orion. Many of the earlier applications of the interferometer,
including its very important use for establishing absolute wavelength
standards, have been reviewed by Kuhn (1951).
For a long time the apparatus was very little developed and its use
was limited to the above types of investigation. In 1948 it was shown
that the interferometer could be sucessfully used outside the photographic
region and the first really major development of the instrument came with
the description of the F.P. spectrometer by Jacquinot and Dufour (1948). •
In this method of employment, the wavelength transmitted by the etalon was
varied (scanned) by variation of the pressure (and therefore refractive
index) of the gaseous medium between the elaton plates. Line profiles were
recorded from the light flux received by a photoelectric detector after
passing through a small diaphragm. placed at the centre of the Holdings=
ring pattern. Subsequently various scanning systems, other than that
of pressure variation, have been devised (see later).
Recent advances in the practical development of the interferometer
5.
have made it necessary to examine in greater detail the theoretical aspects
of the instrument. In particular, the main theoretical progress has
been due to Chabbal (1953), (1958) who has investigated the parameters
which influence the properties of resolution and luminosity of the P.P.
spectrometer. Chabbal has shown that these properties are very mach
dependent on the quality of the etalon flats and on the optical quality
of the reflecting coatings. The results of Chabbal's analysis which
are relevant to the present investigation are discussed in Chapter 2.
A further major theoretical development has been due to Jacquinot
(1954) who compared the luminosities of grating, prism and F.P. spectrometer
under the conditions of equal areas of dispersing element and equal resolving
powers. This analysis showed that the interferometer could have a gain
of some two orders of magnitude in luminosity over that of grating dis-
persers which themselves are more favourable in this respect than prisms.
The realisation of this has lead to the increasing use of the inter-
ferometer as already stated.
Mich of the emphasis of the present work has been largely concerned
with a further phase in the development of the interferometer, namely
the extension of its spectral range into the far and vacuum ultraviolet.
For space research applications, for diagnosis of high temperature
plasma sources and for spectroscopic examination of laser light higher
harmonics the superior qualities of the interferometer will be increas-
ingly required for this spectral region. In the past, attempts at using
the interferometer in the far ultraviolet have been restricted by certain
technological limitations. These limitations are considered in the
E;.
following sections where also, the aims and the approach to the present
investigation will be discussed.
1.2. The Extension of the Spectral Range of the Interferometer into the
Far Ultraviolet.
Applications of the F.P. interferometer have been largely confined
to wavelengths greater than 2400 2and apart from absolute wavelength
determinations to about 2200 2, it has been seldom used in the far ultraviolet. There have been no reported applications of the interfero-
meter at wavelengths shorter than 2000 2. The two factors whichl in the
past, have limited the spectral range of the interferometer in the ultra-
violet have been the transmission and optical finish of the interferometer
flats and the availability of suitable reflecting coatings. Of these
limitations, the latter has been the major obstacle and this will be
considered first.
At wavelengths greater than 2400 2 there has been an improved performance in terms of resolution and luminosity of the interferometer
resulting from improved semi-transparent coatings. In particular, this
has been realised by the development of dielectric multilayer films
capable of giving a high reflectivity together with a very low absorption
loss. (The significance of coating reflectivity and absorption is dis-
cussed in Chapter 2.). The worst situation occurs at wavelengths shorter
than 2400 2 since in this spectral region there is no high index material
at present available of sufficiently low absorption for dielectric multi-
layer films.
7. In the 1950ts the accelerated interest in vacuum ultraviolet
spectroscopy resulted in a great deal of effort being devoted to easing
experimental limitations which had existed for such a long time. One of
the significant advances in this direction has been the development of
high reflectance films for the vacuum ultraviolet. It had been known
for some years that opaque, evaporated aluminium films possessed a higher
normal incidence reflectance than any other single material studied for the
wavelength regian1100 to 3000 R (Sabine 1939). However, the practical
use of such films was severely restricted in the far and vacuum ultra-
violet because of the decrease in reflectance caused by oxidation of the
film, the effect of oxidation becoming more serious with decreasing wave-
length.
A detailed study by Hass, Tousey and co-workers of the factors
influencing the optical properties of evaporated aluminium films led
to the production of coatings having a much improved reflectance in the
vacuum ultraviolet. However, it was more the technique of overcoating
a high quality aluminium film with MgF2 or LiF to prevent oxidation and
enhance reflectance, which has enabled the real advance to be made. Such
coatings are now widely exploited for mirrors and gratings to be used in
the vacuum ultraviolet.
In 1961, Hass and Waylonis produced semi-transparent aluminium films
having considerably improved optical properties over previously reported
measurements and they extended experimental data to )\ 2200 R. The
methods of preparation and the optical properties of these aluminium and
the above aluminium-dielectric films are discussed in Chapter 3 since

0.
they provide a considerable part of the background to the present in-
vestigation.
The improved techniques for producing aluminium films and the
principle of overcoating an opaque aluminium film with a transmitting
dielectric layer suggested that an improvement could be made to the optical
performance of semi-transparent films similarly overcoated. The main
emphasis of the present work has been the preparation and an investigation
of the optical properties of semi-transparent aluminium and aluminium -
11e2 coatings with which the aim was to extend the spectral range of F.P.
interference spectroscopy as far as possible into the ultraviolet. Special
techniques devised for the preparation of these coatings are described
in Chapter 5 and their optical properties and application to multiple
beam interferometry are discussed in Chapter 6. During this investigation,
the first reported F.P.interferograms obtained fort .2000 R were obtained
employing the coatings developed in this work.
1.3. The Extension of the Spectral Range of Interference Filters.
Closely allied to the problem of producing low absorption interfero-
meter coatings for the far ultraviolet is that of manufacturing P.P. type
interference filters for the same spectral region. In the F.P. etalon
two independently worked flats are employed and the parallel reflecting
surfaces are separated by a distance generally in excess of 1 m.m. The
simplest form of interference filters are prepared by vacuum deposition
onto a plane substrate of two semi-transparent reflecting films separated
by a thin spacer layer. The transmission characteristics of such filters

9.
consist of a series of bands which become more widely separated in wave-
length as the thickness of the spacer layer is reduced. Usually, this
layer is made only one or a few half-wavelengths in optical thickness.
Both the peak transmission and the spectral width at half peak transmission
i.e. the filter bandwidth, are very much dependent on the optical properties
of the reflecting films (See Chapter 2).
In the first type of F.P. interference filters, which appear to
have been developed by Geffken in Germany during World War II, silver
reflecting films were employed separated by a magnesium fluoride or
oryolite spacer layer (see e.g. Kuhn 1951). Later, the metal reflecting
films were replaced by highly reflecting, low absorption multilayer
steaks giving much improved performance in terms of peak transmission and
filter bandwidth. (Ring and Wilcock (1953) Lissberger and Ring(1955) )
Again, the main obstacle in extending the spectralrange of inter-
ference filters into the far and vacuum ultraviolet, as in the case of in_
terferameter coatings, has been the lack of a suitable high index material
for dielectric multilayer 2eflectance stacks.
For broad-band photometry and for auxilAwyfiltering of spectrometers
and spectrographs flown in rockets and satellites, the isolation of a few
hundreds of angstroms is now required for wavelengths shorter than 3000 R.
With their high luminosity, compactness and simplicity of mounting P.P.
type interference filters are particularly suitable for space spectroscopy.
In addition, the transmission characteristics of this type of filter can,
within limits, be optimised during manufacture to suit particular experi-
mental requirements.

10.
The first major discussion regarding the feasibility of producing
interference filters forthe far &vacuum ultraviolet was given by Schroeder
(1962) on the basis of an extropolation of the optical constants derived
by Hass and Weylonis (1961) from measurements of the properties of semi-
transparent aluminium films. Schroeder computed transmission character-
istics of filters of the type aluminium - lIgP2 - aluminium concluding that
filters having a peak transmission of 25% and bandwidths less than 250 2 could be produced for wavelengths down to X1500 R. Such filters are
of extreme importance for both space research and laboratory applications
and they possess a particularly attractive feature in that they become
'self-blocking' at longer wavelengths because of the atte=cation of the
aluminium films.
Because of difficulties in experimental technique (Chapter 3)
Schroeder gives only one experimental transmission curve for a filter
having a wavelength peak <A2000 . and this filter had a peak transmission ( atA1950 R ). Also, all Schroeder's filters show characteristics
which are inferior to theoretical expectations. This was in part due to
experimental technique (Chapter 3) but also due to an error in calculating
filter bandwidths since a phase change term on reflection at the alum-
inium - MgF2 boundaries was omitted (Chapter 2).
A second aspect of the present investigation, and one which is
closely related to the development of the interferometer coatings, has
been the production and an investigation of the properties of interference
filters for wavelengths shorter than 2400 R. During this work, interference
filters having transmission peaks at wavelengths <1900 R were reported.

11.
(Bates and Bradley 196. Methods of filter preparation are described
in Chapter 5 and characterstics of first and second order filters and
the effect of the optical properties of the aluminium reflecting films
on filter performance are discussed in Chapter 6. The relevant formulae
used for calculating spacer layer thickness etc. are given in Chapter 2.
1.4. The Wavelength Region Covered by the Present Investigation.
The optical properties of the semi-transparent aluminium and alum-
inium - MgF2 coatings have been determined only to a wavelength of 1800 R. Restriction to wavelengths above this value enables measurements of re-
flection and transmission coefficients to be made using relatively simple
techniques by employing a reflectometer attached to a nitrogen purged
grating manochromator (see Chapter 6). For measurements at shorter
wavelengths a vacuum monochromator is essential and experimental techniques
become considerably more difficult (e.g. Madden 1963). However, the
emphasis in the present work has been on the type of coatings which
might be successfully employed for F.P. spectroscopy at wavelengths below
2400 R and this investigation is merely a first step towards this end. This restriction in wavelength to 1800 . is not terribly serious since at present it is not forseeable that the spectral range of the inter-
ferometer can be extended to wavelengths much shorter than 1650 R. The
reason for this is two fold. On the one hand it will be seen in Chapters
4 and 6 that the properties of the aluminium - Me2 coatings for multiple
beam interferometry are deteriorating with decreasing wavelength. This
illustrates the need to extend measurements of coating properties to
12
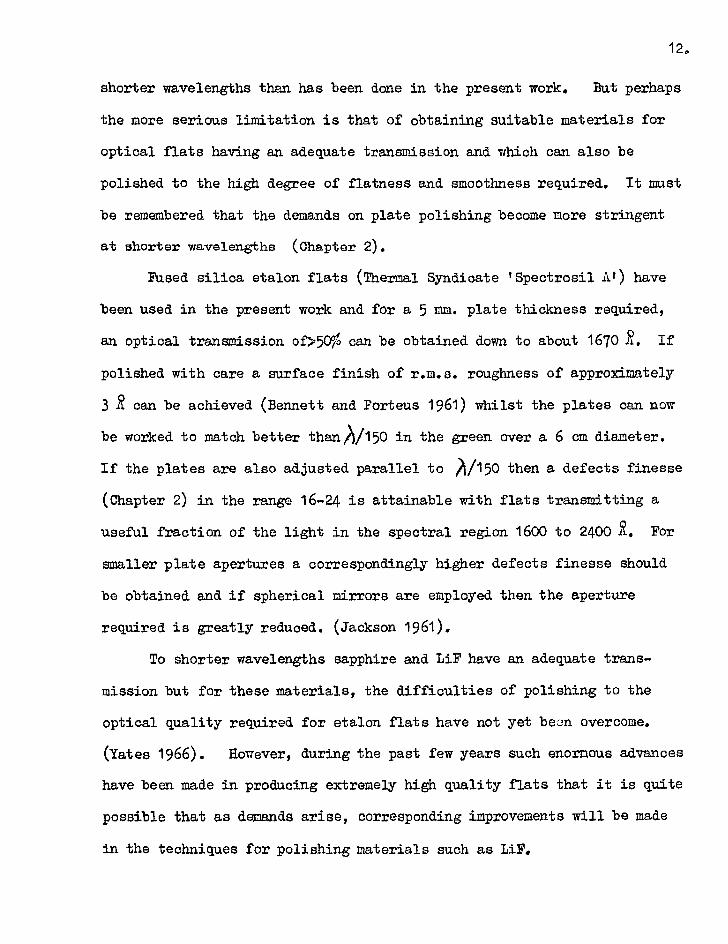
shorter wavelengths than has been done in the present work. But perhaps
the more serious limitation is that of obtaining suitable materials for
optical flats having an adequate transmission and which can also be
polished to the high degree of flatness and smoothness required. It must
be remembered that the demands on plate polishing become more stringent
at shorter wavelengths (Chapter 2).
Fused silica etalon flats (Thermal Syndicate 'Spectrosil Al) have
been used in the present work and for a 5 mm. plate thickness required,
an optical transmission of>50% can be obtained down to about 1670 R. If
polished with care a surface finish of r.m.s. roughness of approximately
3 R can be achieved (Bennett and Forteus 1961) whilst the plates can now
be worked to match better thanA/150 in the green over a 6 cm diameter.
If the plates are also adjusted parallel to A/150 then a defects finesse
(Chapter 2) in the range 16-24 is attainable with flats transmitting a
useful fraction of the light in the spectral region 1600 to 2400 R. For
smaller plate apertures a correspondingly higher defects finesse should
be obtained and if spherical mirrors are employed then the aperture
required is greatly reduced. (Jackson 1961).
To shorter wavelengths sapphire and LiF have an adequate trans-
mission but for these materials, the difficulties of polishing to the
optical quality required for etalon flats have not yet been overcome.
(Yates 1966). However, during the past few years such enormous advances
have been made in producing extremely high quality flats that it is quite
possible that as demands arise, corresponding improvements will be made
in the techniques for polishing materials such as LiF.

13.
For interference filters the demands on the optical finish of the
substrate are not so critical since the evaporated reflecting and spacer
layers contour the substrate surface (Tolansky 1960). In this applications
LiF and sapphire may be used as substrate material to extend the spectral
range of interference filters below the absorption limit of 'Spectrosil'.
Techniques for measuring the transmission characteristics of filters are
easier than those involved in the measurement of optical properties of
coatings and the author has been fortunate to obtain the use of vacuum
monochromators (at Imperial College and the U.K.A.E.A. Culham Laboratory)
to determine filter characteristics to;\1500 .. (Chapter 6).
The extension of the spectral range of the interferometer by the
few hundreds of Angstroms covered in this investigation is an important
advance in its development since this range of wavelength is equivalent
to an energy range in excess of that covered by the whole of the visible
spectrum. However before other aspects of the present investigation
are discussed it is convenient at this point to briefly consider the
elementary theory of the etalon.
1.5. The Elementary Theory of the Etalon.
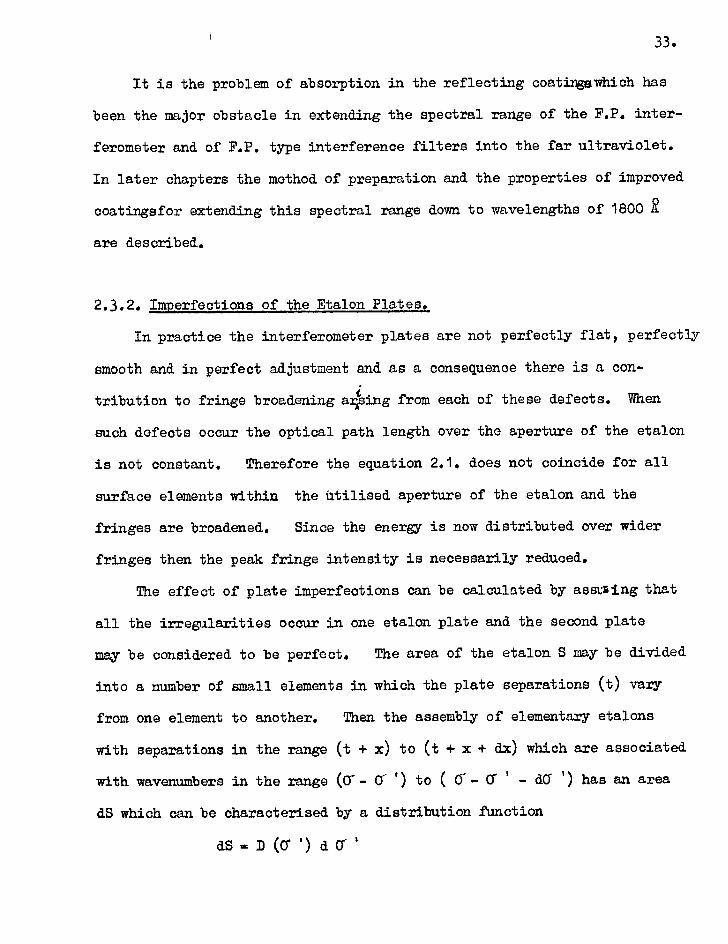
The interferometer consists of two transparent plates of which the
faces are, in principle, perfectly flat, smooth and parallel and are
coated with reflecting layers of reflection coefficient (H), transmission
coefficient (T) and absorption coefficient (A) (Fig.1.1.).
An incident ray at an angle of incidence i4 suffers multiple
reflections at the two surfaces and the transmitted rays which emerge
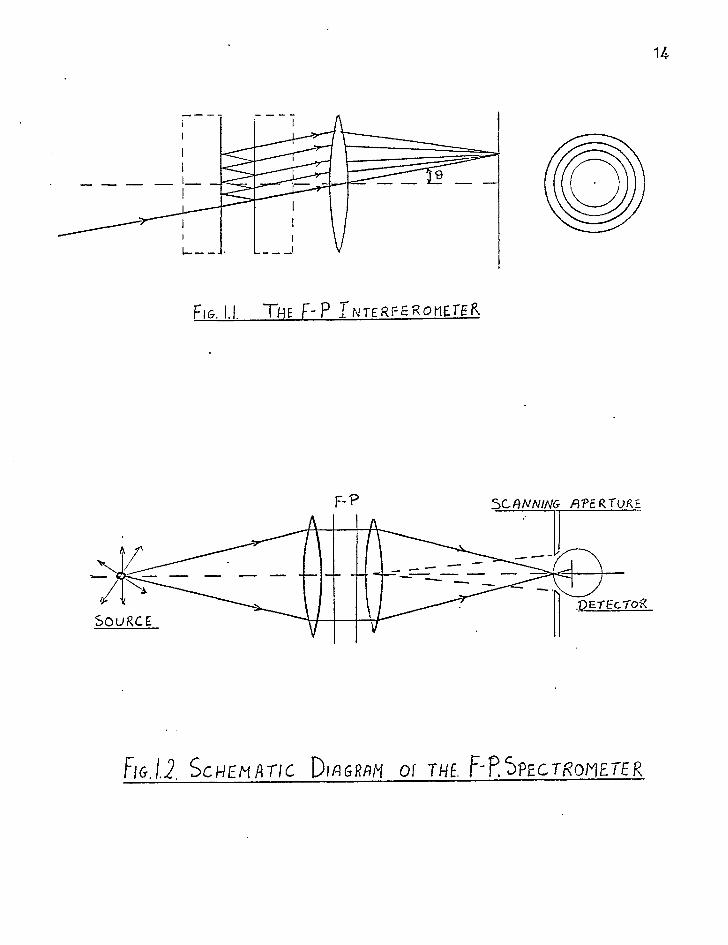
SCANNING APERTURE
DErEc..-roR
F-P
SOURCE
14
FIG. I.I. THE F-P TNTERFERotlETER
SCHEMATIC DIAGRAM Of THE FID.5PECTROMETER
15.
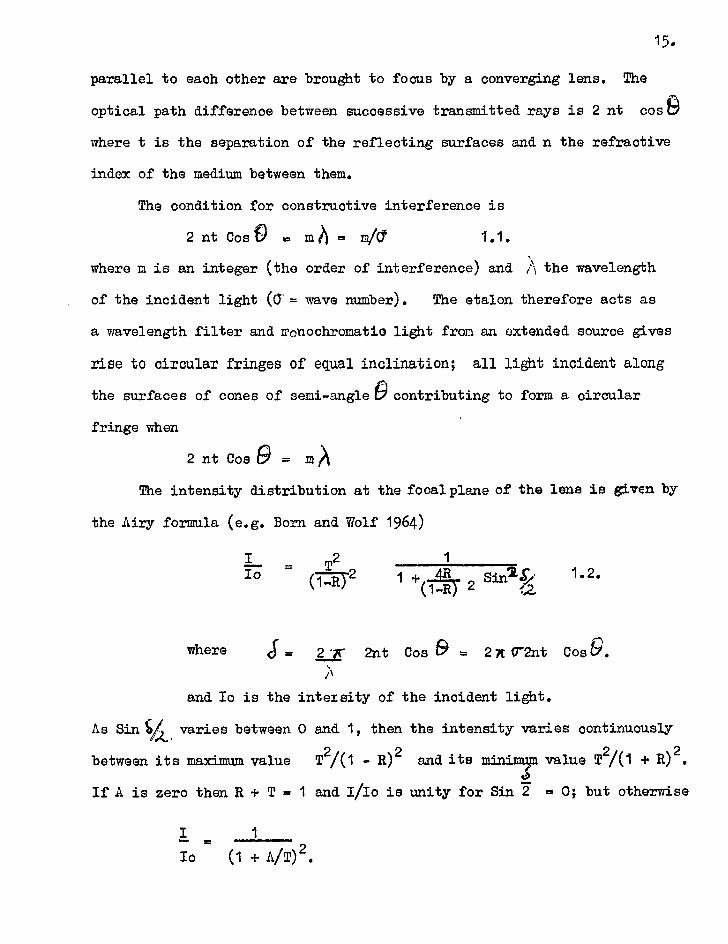
parallel to each other are brought to focus by a converging lens. The
optical path difference between successive transmitted rays is 2 nt cost;
where t is the separation of the reflecting surfaces and n the refractive
index of the medium between them.
The condition for constructive interference is
2 nt Cos f) m 1 = mid` \
where m is an integer (the order of interference) and /1 the wavelength
of the incident light (C = wave number). The etalon therefore acts as
a wavelength filter and monochromatic, light from an extended source gives
rise to circular fringes of equal inclination; all light incident along
the surfaces of cones of semi-angle 0 contributing to form a circular
fringe when
2 nt Cos 6) =
The intensity distribution at the focal plane of the lens is given by
the Airy formula (e.g. Born and Wolf 1964)
I io = T
2
(1:ET2
1
1 + 4R Sin24> 1.2. (1-R) 2
where
Ci = 2LE 2nt Cos (9 = 2;R: Gr2nt Cos 9.
and Io is the intersity of the incident light.
As Sin Vt varies between 0 and 1, then the intensity varies continuously
between its maximum value T2/(1 - R)2 and its minimum value T2/(1 + R)2.
If A is zero then R + T = 1 and I/10 is unity for Sin 2 = 0; but otherwise
I 1
Io r (1 + A/T)2.
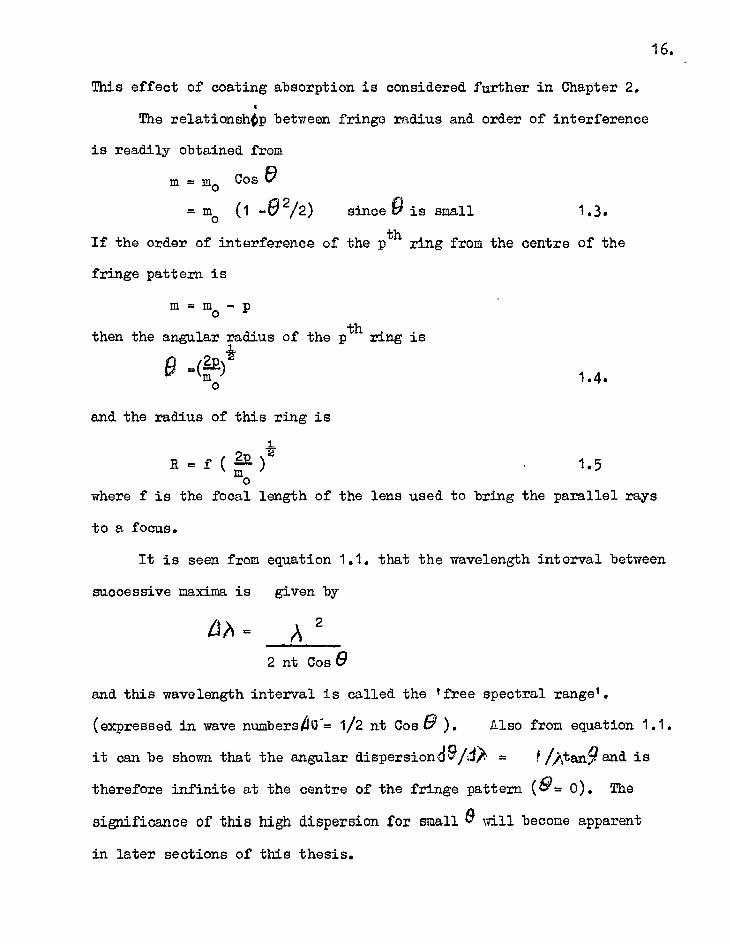
16. This effect of coating absorption is considered further in Chapter 2.
The relationsh$p between fringe radius and order of interference
is readily obtained from
m mo Cos e mo -°2/2) since is small 1.3.
If the order of interference of the pth ring from the centre of the
fringe pattern is
= m p
then the angular radius of the pth ring is
=(?)
1.4.
and the radius of this ring is
R = f ( m 1.5 o
where f is the focal length of the lens used to bring the parallel rays
to a focus.
It is seen from equation 1.1. that the wavelength interval between
successive maxima is given by
= A 2
2 nt Cos 0
and this wavelength interval is called the 'free spectral range'.
(expressed in wave numbersAC= 1/2 nt Cos 9 ). Also from equation 1.1.
it can be shown that the angular dispersiona9/0 = fAtantiand is
therefore infinite at the centre of the fringe pattern (9= 0). The
significance of this high dispersion for small 8 will become apparent in later sections of this thesis.

17.
The elementary theory of the etalon is somewhat insufficient to ex-
plain completely' the intensity distribution in the fringe pattern.
This will be considered in more detail in Chapter 2.
1.6. The Photographic Use of the F,P. Interferometer.
In the spectrographic method of using the etalon the optical path
difference 2ntCos9depends on the inclinations9. Different radiations
of the spectrum are transmitted in different directions and a photographic
emulsion placed at the focal plane of the camera lens records a series
of circular fringes for each radiation, according to Cosh= mA/2nt. For
two close lines separated by a wavenumber difference dLr , the corresponding
fringes will be separated by a fraction of an ordertlinsuch that
d Cr= dm/2nt Cos 9 Various methods for evaluating the quantity dm from measurements
made upon the fringes have been discussed in some detail (e.g. Tolansky
1947).
1.7. Photoelectric Spectrometry Employing the F.P. Interferometer.
In this application of the interferometer the photographic emulsion
is replaced by a photoelectric detector placed behind a suitable dia-
phragm. This diaphragm isolates a region of the focal plane which receives
rays of the same wavelength. Since the etalon behaves as a wavelength
filter, the wavelength transmitted can be altered by variation of 2 nt
Cos 9. This may be acheived by varying 0 (i.e. translation of the
ring pattern in front of the diaphragm) or by varying the optical thickness

18.
nt (expansion and contraction of the ring pattern in front of the fixed
diaphragm ).
1.8. Exploration of the Spectrum,
Many different methods have been suggested for exploring i.e.
scanning the spectrum employing the interferometer. One method, namely
that of the pressure scanning system of Jacquinot and Dufour (1948) has
already been briefly mentioned. The subject matter of this thesis is
not intimately connected with a scanning interferometer but in a later
chapter a comparison will be made between the use of the etalon with an
electron-optical image detector and a fast scanning F.P. spectrometer for
time-resolved spectroscopy.
The most satisfactory method for scanning, where time resolution
and repetition rate of scan are of importance, is that in which the
separation of etalon plates (t) is varied. A displacement of one of
the plates by an amount i/2 is sufficient to explore the free spectral
range at all wavelength resolutions. The major difficulty in developing
toscillatingl P.P. interferometers has been that of maintaining plate
parallelism during scanning. An electromechanically driven scanning
interferometer discussed by Tolanaky and Bradley 1959, Bradley (1961),
(1962) enabled the free spectral range to be explored in a time of 10-4
secs whilst the finesse was maintained better than 25. More recently,
a system has been devised in which scanning is achl.ved by the rapid
extension and contration of a piezo-electric tube to which one of the A
interferometer plates is attatohed. (Cooper and Greig 1963). This inatru-

19.
ment is reported to have an ultimate time resolution•-)107 secs. Further
developments in this field include a piezo-electric scanning interfero-
meter with automatic control to maintain paralle1942 during scan (Ramsey
and Mugridge 1962. ). Details of scanning interferometers and
the relative merits of these instruments have been given by Bradley (1961)
and Greig (1965).
1.9. Further Aspects of the Present Investigation,
The oscillating F.P. interferometer has proved to be a very powerful
tool in time-resolved spectroscopy particularly for the diagnostics of
plasma discharges. In a plasma source the physical conditions are
changing considerably during the discharge and the recording of radiation
without time scan is not in general very enlightening. Studies of the
shape of emission lines can yield information on the ion temperature
(Doppler broadening), electron number density( Stark broadening) or the
magnetic field (Zeeman effect). The application of the piezo-electric
driven interferometer to electron density determinations has been dis-
cussed by Peacock, Cooper and Grieg (1964). Profiles of hydrogen and
helium lines in a critically damped Z pinch were recorded in times of
lo-6 secs with an etalon finesse of about 10.
A disadvantage of the oscillating F.P. is that time and wavelength
dispersions are superposed. It is therefore necessary to scan at a rate
N times greater than the rate of change of the phenomena studied (N being
the etalon finesse, Chapter 2) which leads to a decrease in the signal-
noise ratio obtainable with a given source and in addition does not permit
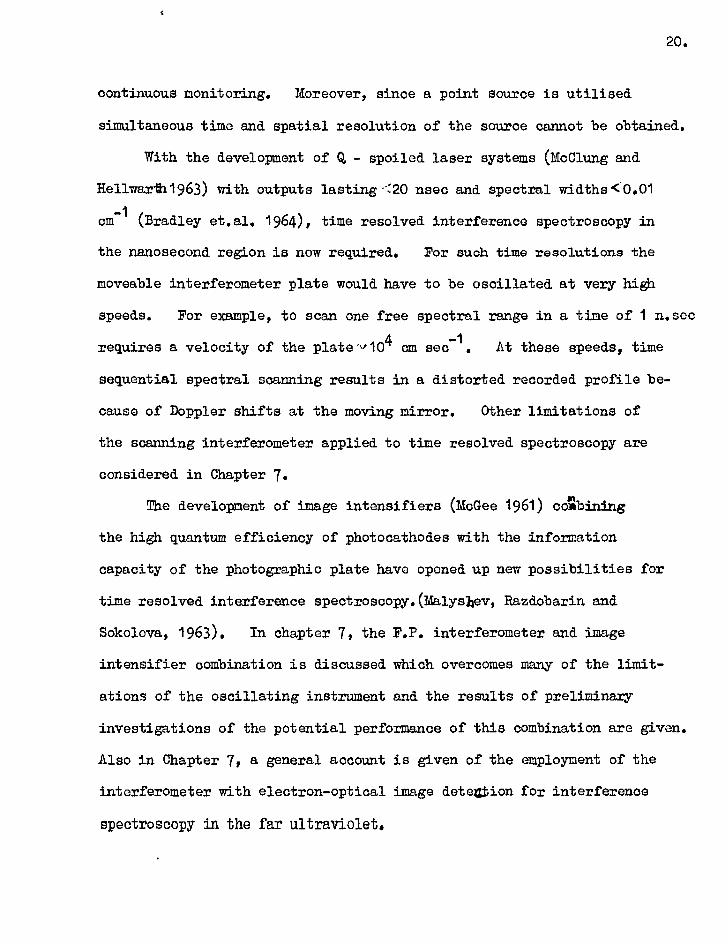
20.
continuous monitoring. Moreover, since a point source is utilised
simultaneous time and spatial resolution of the source cannot be obtained.
With the development of Q - spoiled laser systems (McClung and
Hellwarlh1963) with outputs lasting<20 nsec and spectral widths<0.01
-1 cm (Bradley et.al. 1964), time resolved interference spectroscopy in
the nanosecond region is now required. For such time resolutions the
moveable interferometer plate would have to be oscillated at very high
speeds. For example, to scan one free spectral range in a time of 1 n.sec
- 1 requires a velocity of the plate -v104 cm sec . At these speeds, time
sequential spectral scanning results in a distorted recorded profile be-
cause of Doppler shifts at the moving mirror. Other limitations of
the scanning interferometer applied to time resolved spectroscopy are
considered in Chapter 7.
The development of image intensifiers (McGee 1961) colibining
the high quantum efficiency of photocathodes with the information
capacity of the photographic plate have opened up new possibilities for
time resolved interference spectroscopy.(Malysllev, Razdobarin and
Sokolova, 1963). In chapter 7, the F.P. interferometer and image
intensifier combination is discussed which overcomes many of the limit-
ations of the oscillating instrument and the results of preliminary
investigations of the potential performance of this combination are given.
Also in Chapter 7, a general account is given of the employment of the
interferometer with electron-optical image detelation for interference
spectroscopy in the far ultraviolet.

21.
Finally, in Chapter 8 some consideration is given to a new application
of the interferometer, namely that of its use for solar and stellar spec-
troscopy from space vehicles. Because of its very high angular disper-
sion the interferometer should permit, for a given resolving power, greater
tolerance in the guidance requirements of the space vehicle. In addition,
there is the added profit of physical compactness arising from the use of
the etalon spectrometer or spectrograph. The superior luminosity and
illumination of the interferometer can be exploited to give shorter ex-
posure times and greater time resolution. This would allow for example,
a greater spatial coverage of the solar disc to be made in the limited
observation time during a rocket flight.
With the type of coatings developed in the present investigation it
should now be possible to undertake high resolution studies of the solar
Fraunhofer spectrum down to A1800 R. Also of course, the interferometer
will permit absolute wavelength determinations to be made. Used Photo-
graphically, it will be possible to determine the shape of particular line
profiles and simultaneously, their variation across the solar disc. This
is a problem of particular importance. In addition, a scanning inter-
ferometer could be employed to determine time-resolved line profiles at
particular points on the solar disc.
Two experiments are already in progress in which the interferometer
will be used in both the spectrographic and spectrometer methods to study
profiles of the resonance lines of Mg II (2795, 2802 R). These experiments
are briefly discussed in Chapter 8. The first of these experiments
requires a very stable fixed gap interferometer and in Chapter 8, ih►e

22.
development of an optically contacted etalon is described which remains
stable in adjustment over very long periods of time.
1.10. The Aims and the Development of the Present Investigation.
It is apparent from thexevious sections that the work covered in this
thesis embraces several different fields of study. It will perhaps assist
the reader if the relationship between these different topics and the
development of the present project is traced out.
The work was begun in February 1962 in the Applied Physics Dept.
(Prof.J.D. McGee) at Imperial College under the supervision of Dr. D.J.
Bradley. Very broadly, the initial aims of the project were two fold:-
(1) To investigate the image intensifier - F.P. interferometer com-
bination for time-resolved spectroscopy and for far ultraviolet spectros-
copy.
(2) To extend the spectral range of the interferometer and the tech-
niques of multiple-beam interferometry as far as possible into the ultra-
violet (for space research applications and for plasma and laser source
diagnostics) by developing suitable reflecting coatings. This aspect
of the work was a natural development to the investigations of Hass and
co-workers on opaque aluminium - me2 films and on improved semi-transparent aluminium films.
In the early stages of this programme it was not foreseen that the
techniques of preparation and the optical properties of the interferometer
coatings would have quite such an impact on the production of interference
filters for the far and vacuum ultraviolet. This was fully realised early

231
in 1963 following the publication in December 1962 by Schroeder who
discussed the feasibility of producing aluminium - MgF2 filters for
this spectral region. With the first promising results of coating and
filter properties the author's investigation swung more in this direction.
It was decided in mid-1963 to design and construct a new coating plant
giving much improved vacuum conditions over that used for the initial
investigations, in an attempt to improve on the optical properties of the
filters and coatings. Results of investigations obtained using the two
different conditions for preparation are compared and constxasted in
Chapter 6. In addition, the optical properties of coatings of the type
developed in this investigation have been computed from extrapolated
optical constants to give a comparison with experimental data (Chapter 4).
In late 1962 and early 1963 investigations were carried out concurrent
with the work on coatings on the use of the interferometer with different
types of image intensifier for time-resolved spectroscopy. The technique
used was a simple one employed merely to illustrate the potential of
the method and to enable a rapid assessment of performance to be made.
This work was started by the author and continued by C.O.L. Juulman who
undertook most of this investigation. Some results of this investigation,
which are given in Chapter 7, show that the technique is indeed a powerful
one ideally suited to time-resolved examination of plasma and laser sources.
This aspect of the work has been further developed with much success by
using the image tube as an optically active element. (Bradley and Majumdar
1966)
The construction of an image intensifier with ultraviolet transmitting

24.
window (S.Majumdar) and the development of the ultraviolet coatings
enabled the author to obtain F.P. interferograms of %:1849 2 of Hg I
(Feb 1964). These were the first interferograms reported for;\(:2000 R.
An additional project, although one which has not yet seen fulfillment,
was concerned with the development of an image intensifier with a 'solar
blind' CsI photocathode. The CsI cathode responds only to radiation
shorter than'Y2000 2 and would therefore eliminate the effects of stray
light of longer wavelengths which so often are an undesirable feature of
vacuum ultraviolet spectroscopy. The usefulness of such an image tube
is made apparent from the interferograms of ;k1849 (Hg I) obtained by
direct photography using interference filters to isolate this line. For
in this case the more intense .2537 radiation causes a background to the
1849 2 fringe pattern which could be eliminated by using a tube with a
Cs I cathode. In view of the promise of such a device for ultraviolet
interference spectroscopy it is hoped that difficulties encountered
(Majumdar 1966 ) will be overcome and that it will be possible to continue
this work. More generally, the image intensifier applied to ultraviolet
interference spectroscopy permits conversion of the incident radiation to
a visible output. The advantages of this process are illustrated and
discussed in Chapter 7. In addition for a given spectral resolving power
the large angular dispersion of the interferometer reduces the demands
made on the linear resolution of the detector. This is important for
space research applications if image tubes including T.V. camera tubes
are to be employed and the potential of the interferometer combined with
a simple image tube is illustrated in Chapter 7.
25.
The emphasis of the author's work in the latter part of this in-
vestigation shifted more towards space research applications of the
interferometer. This followed the proposals by Dr. D.J. Bradley for
two experiments to study solar Mg II resonance lines employing Skylark
rocket flights utilising the servo-guidance system developed by U.K.A.E.A.
(Culham Laboratory). Some considerations of the design of the first of
these experiments and the use of the interferometer for space research
applications are given in Chapter 8.
Published Reports.
Some of the contents of this thesis has already been published or
submitted for publication in a condensed form.
Bradley, Bates and Juulman (1963)
Bradley, Bates, Juulman and Majumdar (1964 a); (1964 b); (1964 c).
Bradley, Bates, Juulman and Kohno (1966).
Bates, Bradley, Xohno and Yates (1966).
Bates and Bradley (1966 a); (1966 b).
26.
CHAPTER 2.
THE RELEVANT THEORETICAL BACKGROUND OF THE F.P.
ETALON AND F.P. INTERFERENCE FILTERS.
2.1. Introduction.
The purpose of the F.P. spectrometer and spectrograph is to produce
a recorded spectral profile which gives a representation of the variation
'of luminous intensity -with wavelength of a source under examination. How-
ever, because of distortions introduced by both the dispersing element
and the detecting system employedothis representation is not perfect.
It is found that when the recorded profile is made a progessively closer
copy of the true spectral profile, that is when the resolution of the
instrument is increased, then the amount of light flux falling on the
detector becomes progressively smaller. There is therefore, a compromise
to be made between the properties of resolution and luminosity and this
is also true of spectroscopic instruments employing prism and grating
dispersers. Jacquinot (1954) has compared the properties of different
types of spectrometer and has shown that for equal areas of dispersing
element and for the same resolving power the luminosity of the F.P. spec-
trometer can greatly exceed that of a grating instrument which in turn is
much superior to spectrometers employing prism dispersers.
The departure of the F.P. interferometer from ideal performance, that
is the performance represented by the Airy function (Chapter 1), has been
the subject of several investigations in particular by Chabbal (1953),(1958).
Chabbal has discussed in great detail the dependence of the properties of

27.
resolution and luminosity of the F.P. spectrometer on the quality of the
reflecting surfaces and the optical flats of the etalon. Such detail
is not required here. In this chapter the main emphasis is simply to
illustrate how the performance of the interferometer and the transmission
characteristics of F.P. type interference filters are dependent on the
properties of the reflecting surfaces, since in a later chapter the optical
properties of coatings for the far ultraviolet are given and their app-
lication to multiple-beam interferometry in this wavelength region is
discussed.
irB (0) d0" 0.0
is located in a wave number interval of zero width (i.e. B(0) 40"- 00);
Cfbeing the Dirac function) then the spectral profile of this line yielded
by the instrument is spread out over a small wave number interval des-
cribed by the function
Y = W ( cY ao )
where W ( 0 - ) is defined as the 'Instrument function/ and To is the
wavenumber corresponding to the centre of the spectral line.
Thus, if the instrument is illuminated by radiation of spectral
density B(0') (the source function) then the spectral profile produced
by the instrument differs from the source function according to
2.2. Spectral Resolution.
The property of resolution of a spectroscopic device is completely
determined by the representation it gives of a perfectly monochromatic
spectral line. If the total luminance of the source aa

28.
Y (0) . \W (0 - 06 ) B(06) dOo
The function Y is obtained from the convolution of the instrument
function with the source function and may be written symbolically as
Y (a) = w (a) 4( B(0).
The area of Y (Cl) is equal to the product of the areas of W (0) and
B (6) and the halfwidth (y) of the function Y is dependent on the half-
width and the form of the functions B and V.
As the width w of the instrument function becomes smaller in comparison
with the variations in the source function then the spectral profile
yielded by the instrument resembles the source function more and more
closely.
Two monochromatic lines may be considered to be resolved when their
wavenumber separation ( 02 - CSC ) exceeds a certain valve (..'2 0, the effective
limit of resolution. The relationship betweentf0" and 77 depends on the
criterion adopted for resolution, on the form of the instrument function
and also on the definition of the width of the instrument function.
Jacquinot (1960) has used the relation SCI= w as a criterion of
resolution and defines w to be the width at half height of a Gaussian curve
or the separation between maximum and first zero of a diffraction curve.
29.
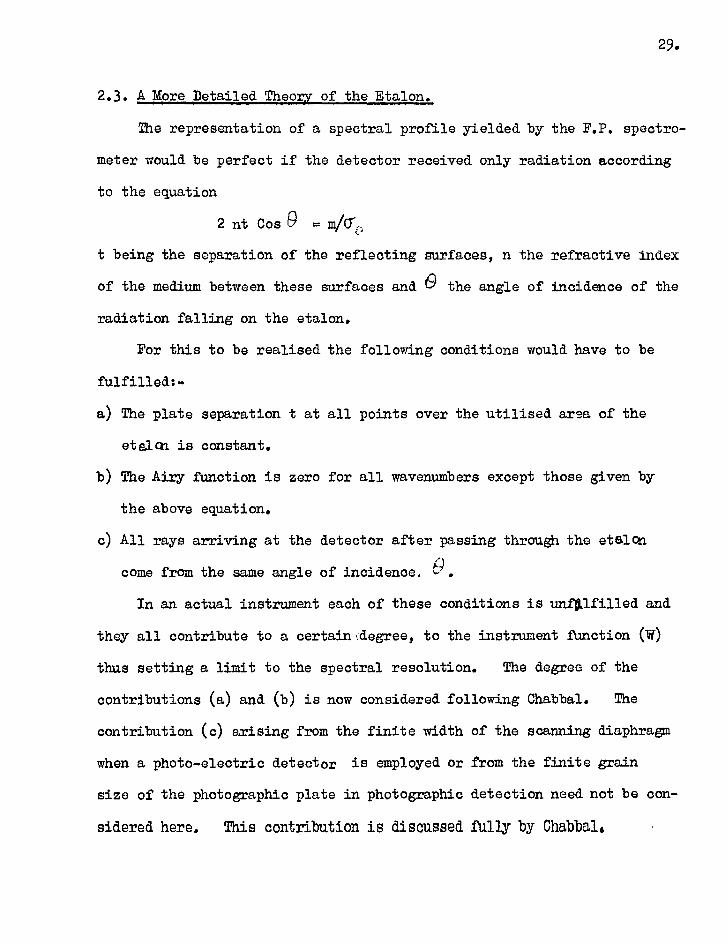
2.3. A More Detailed Theory of the Etalon.
The representation of a spectral profile yielded by the F.P. spectro-
meter would be perfect if the detector received only radiation according
to the equation
2 nt Cos 9 . mAre, t being the separation of the reflecting surfaces, n the refractive index
of the medium between these surfaces and 6) the angle of incidence of the
radiation falling on the etalon.
For this to be realised the following conditions would have to be
fulfilled:-
a) The plate separation t at all points over the utilised area of the
etalon is constant.
b) The Airy function is zero for all wavenumbers except those given by
the above equation.
c) All rays arriving at the detector after passing through the etalon
come from the same angle of incidence. 0. In an actual instrument each of these conditions is unfllfilled and
they all contribute to a certain..-degree, to the instrument function (Tir)
thus setting a limit to the spectral resolution. The degree of the
contributions (a) and (b) is now considered following Chabbal. The
contribution (c) arising from the finite width of the scanning diaphragm
when a photo-electric detector is employed or from the finite grain
size of the photographic plate in photographic detection need not be con-
sidered here. This contribution is discussed fully by Chabbal.

30.
2.3.1. The Airy Function.
For perfect interferometer flats which are also in perfect adjust-
ment for parallelism, the optical path difference between succesive in-
terfering beams is
= 2 nt cos 9 . If the reflection coefficient of the coatings was unity and if the
plates were sufficiently large so that no beams were lost then there
would be an infinite number of interfering beams each having an amplitude
of unity. In such a case, interference would be destructive for all
wavenumbers except those satisfying the relationship
Oin = M /N
Under these conditions, the instrument function would be represented
by a series of infinitely sharp peaks of the form
ff W = —7 6 (6 — 6m) et
and the peaks would be separated by a wavenumber inerval given by
\ 6 = 1 = 1 \
2 nt Cos 0.
This wavenumber interval is the 'free spectral range'.
Since of course the coating reflectivity must be less than unity,
the instrument function is given by the Airy function (e.g. Born and
Wolf 1964).
I = A(0) f _ T 2. N IO ‘1 - R I 1 +(1-R0-2
1
.. Sin 2 r .1 L. 2.1.
where R and T are the reflection and transmission coefficients of the

31.
coatings.
The half intensity width (a) of any particular fringe in the trans-
mitted intensity distribution (expressed in wavenumbers) is the half
intensity width of the Airy function and is given by
a =6Cr11-111 = dor.
Thus 'at is dependent only on the free spectral range (hence plate sep-
aration) and the coating reflectivity. A value NR can be defined such
that dl . /16 FIT
where NR = TT, R2 /(1-R).
is termed the 'reflection finesse' of the etalon coatings and is clearly
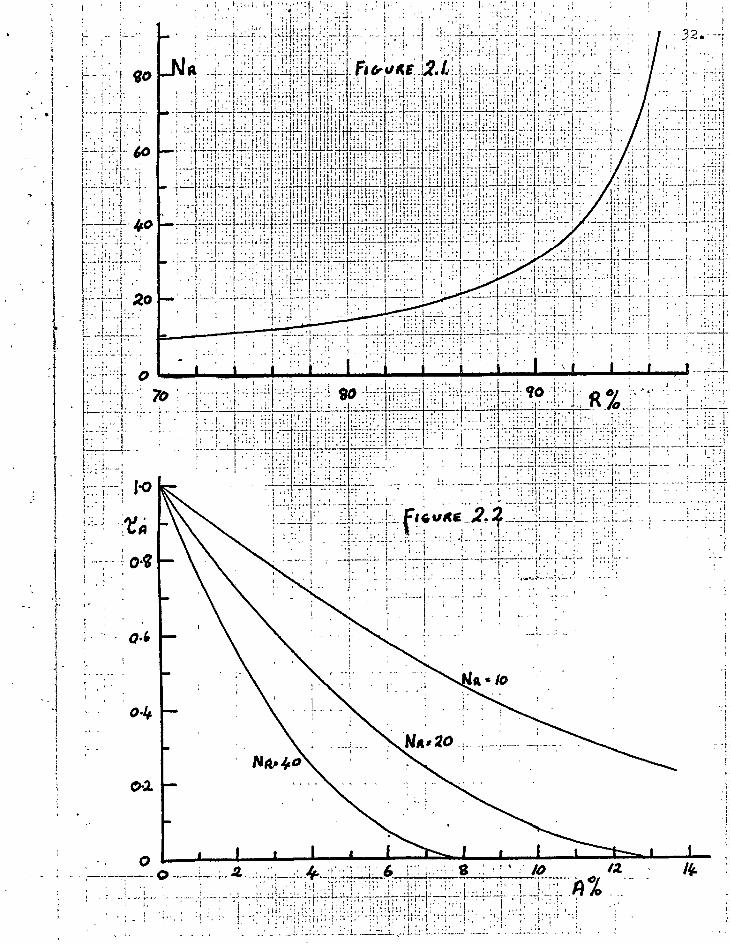
a mesure of the optical resolution attainable with the etalon. The /4.
dependence of NR on R is shown in figure 2.1.
The transmission of the fringe maximum has the value from equation 2.1.
A = 'MAX Io
T2 .7)2
2.2. (1 + T )2
This value differs from unity simply because of absorption (A) in the
reflecting coatings. There are two effects of this absorption in the
reflecting layers:-
1) It reduces the maximum value of R and hence NR since R + T + A = 1.
2) It reduces the value of (—A. For a given reflectivity and hence NR,
film absorption reduces the value of CA in the manner shown in figure 2.2.
l• 4-
r
Nit, 2 NR, ,go
C>2.
1
.2
33. It is the problem of absorption in the reflecting coatings which has
been the major obstacle in extending the spectral range of the F.P. inter-
ferometer and of F.P. type interference filters into the far ultraviolet.
In later chapters the method of preparation and the properties of improved
coatingsfor extending this spectral range down to wavelengths of 1800 R
are described.
2.3.2. Imperfections of the Etalon Plates.
In practice the interferometer plates are not perfectly flat, perfectly
smooth and in perfect adjustment and as a consequence there is a con-
tribution to fringe broadening arising from each of these defects. When
such defects occur the optical path length over the aperture of the etalon
is not constant. Therefore the equation 2.1. does not coincide for all
surface elements within the utilised aperture of the etalon and the
fringes are broadened. Since the energy is now distributed over wider
fringes then the peak fringe intensity is necessarily reduced.
The effect of plate imperfections can be calculated by assuLing that
all the irregularities occur in one etalon plate and the second plate
may be considered to be perfect. The area of the etalon S may be divided
into a number of small elements in which the plate separations (t) vary
from one element to another. Then the assembly of elementary etalons
with separations in the range (t + x) to (t + x + dx) which are associated
with wavenumbers in the range (or- o- ') to ( ' - dcf I) has an area
dS which can be characterised by a distribution function
dS = D (7 I) d Cr

34. where D ((a'') is the 'surface defects' function. Chabbal has derived
formulae for D (CT ') for each of the three major plate defects; spherical
curvature, surface irregularities and lack of parallelism. The results
of Chabbal's analysis are as follows:-
Spherical Curvature.
The plate curvatures met in practice are small and can be approxim-
ated to spherical curvature, If the departure from flatness is by an
amount X1 (fig. 2.3.(a) ) then the defects function for this imperfection
is a rectangular function. The width of this function expressed in
wavenumbers (d0'1) can be given in terms of a 'defects finesse' character-
istic of this defect and the free spectral range. Thusy
dO" = AO- 1 ND1
The value of ND1 is dependent on the value of the sagitta X1 and is ND1 =
A/2 X1. It is usual to express the plate flatness to a fraction of
a wave such that the sagitta X1 =/n1 in which case the value of ND
becomes
ND = n1/2. 1
Surface Irregularities.
Etalon flats suffer from surface micro-defects which may be assumed
to be random and to follow a Gaussian distribution. r- 12
If the r.m.s. deviation from smoothness is 4X2
and if this
is expressed as a fraction of a wave /1n2 then the width (in wavenumbers)
of the function characterising this type of defect is

FIG 2 3 b Gaussian
Distribution
35.
FIG 2,3 a
r-- CI al —11
Dig
DI)
X 3:)./r2.3
FIG 2,3 c
cicr3
D(4 3

where ND2
Again expressing this width in terms of a defect finesse then
dO2 = 11U
ND2
212/4'7'
36.
dCf2 = 0 132 ln
1)0- 4.7 n2 n2
Departure from Parallelism.
The defect function characterising a departure from parallelism is
a parabalic function of halfwidth
d03
= .13 L 0" n3
where the departure from parallelism X3 is expressed as a fraction of a
wave ?/n3 (fig.2.3.(c) ). Again the halfwidth of this function can
be expressed in terms of a defects finesse such that
dcT3 = LA CT
ND3
where Nn n3
In practice the three types of defect will exist simultaneously and
although the individual defects functions take different forms they can
all be approximated to rectangular functions. To a reasonable approx-
imation the overall defects finesse ND is given by
1 . 1 1 4. 1 2
2 2 2
ND NDi
ND2
ND3

37. Since the width of the resulting defects function is
= t ND
it is apparent that as the coating reflectivity is increased the fringe
sharpness approaches a limit dependent on the magnitude of the imperfect-
ions of the etalon plates.
The existtnce of plate defects presents a further difficulty in
extending the spectral range of the interferometer into the far ultra-
violet. If for example, the major plate defect was plate curvature and
if the plates were figured to /1100 ()l 5500 R ) then the limiting finesse
at the wavelength I\ would be 50. However, at a wavelength 1850 R
then the limiting finesse is now in the order of 17. Therefore, the
demands on plate flatness, smoothness and their adjustment for parallelism
became more stringent when used at shorter wavelengths.
2.4. Resolving Power and Resolution Limit.
It has already been stated that the limit of resolution of the
F.P. spectrometer is determined by the width (w) of the instrument
function (w) and it is seen that w is dependent on the Airy function (A)
and the plate defects function (D). The etalon is then followed by a
detecting system from which the final record of the intensity distribution
of the fringe pattern is obtained. Again there is introduced a con-
tribution to fringbroadening which can be characterised by a scanning
function (F) and which arises in the manner briefly mentioned in section
2.3. For the present work however we are concerned only with the etalon

38.
itself and the scanning function need not be discussed in detail here.
When the etalon is illuminated by a perfectly monochromatic source
the resulting intensity distribution will be a series of peaks separated
by a wavenunber interval
a = 1
2 nt Cos
each peak having a half width do- = W = /Al/N, where 11 is the overall
finesse taking account of both NR and ND.
R = CS . 0 x 41s: dor /J d cr
2 nt Cos
2 t N
Thus for a given value of a the resolving power can be increased by
an increase in t or N. Increasing t will reduce the free spectral range.
Obviously t must be chosen such that the free spectral range is sufficiently
large to avoid overlapping of orders and the value of t is in general set
by the particular type of problem under consideration. It is preferable
to increase the finesse N but this factor cannot be increased indefinitely
because of the inherent limitation ND.
If the width (f) of the scanning function (F) was zero then the
instrument function would be the convolution of the functions A ((s) and
D (a)
Thus, Y (0) = B (0)* A(0)* D(0)
= B (0)* E(0)
where E (0) is termed the 'etalon function'. For f other than zero
39.
then.
Y (0) B (a)* E (0)* F (0)
The following conclusions regarding the halfwidth (e) of the function
E can be made in terms of the half widths (a) and (d) of the functions
A and D.
a) e is greater than the individual values a and d.
b) e is smaller than a + d
c) e = if a=d
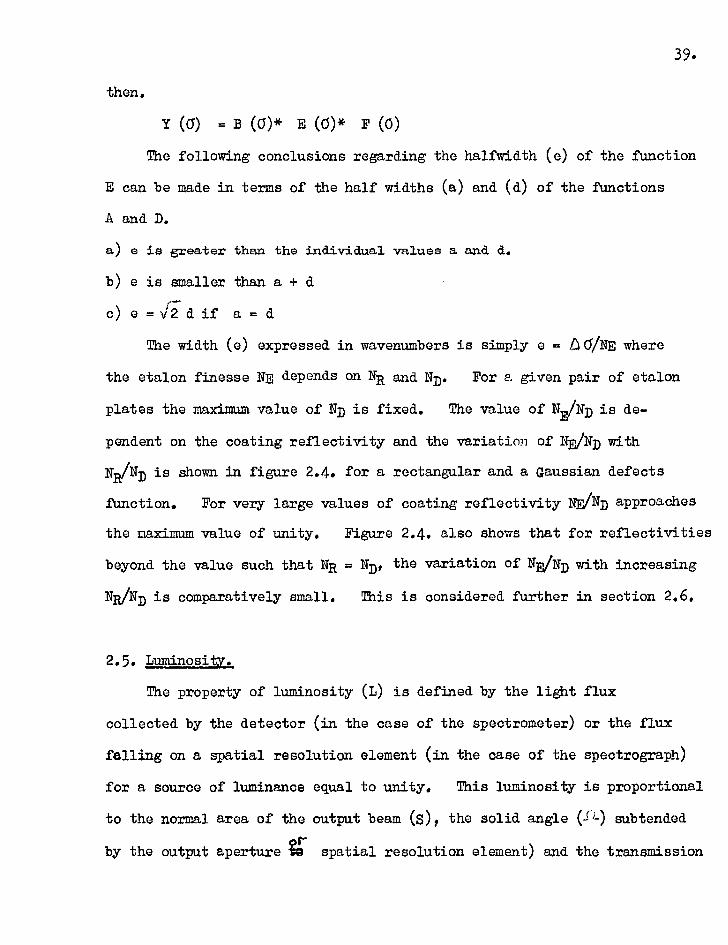
The width (e) expressed in wavenumbers is simply e = i40/NE where
the etalon finesse NE depends on NR and ND. For a given pair of etalon
plates the maximum value of ND is fixed. The value of HE/ND is de-
pendent on the coating reflectivity and the variation of NE/ND with
NR/ND is shown in figure 2.4. for a rectangular and a Gaussian defects
function. For very large values of coating reflectivity NE/ND approaches
the maximum value of unity. Figure 2.4. also shows that for reflectivities
beyond the value such that NR = ND, the variation of NE/ND with increasing
NR/ND is comparatively small. This is considered further in section 2.6.
2.5. Luminosity.
The property of luminosity (L) is defined by the light flux
collected by the detector (in the case of the spectrometer) or the flux
falling on a spatial resolution element (in the case of the spectrograph)
for a source of luminance equal to unity. This luminosity is proportional
to the normal area of the output beam (3), the solid angle (11) subtended
or by the output aperture to spatial resolution element) and the transmission
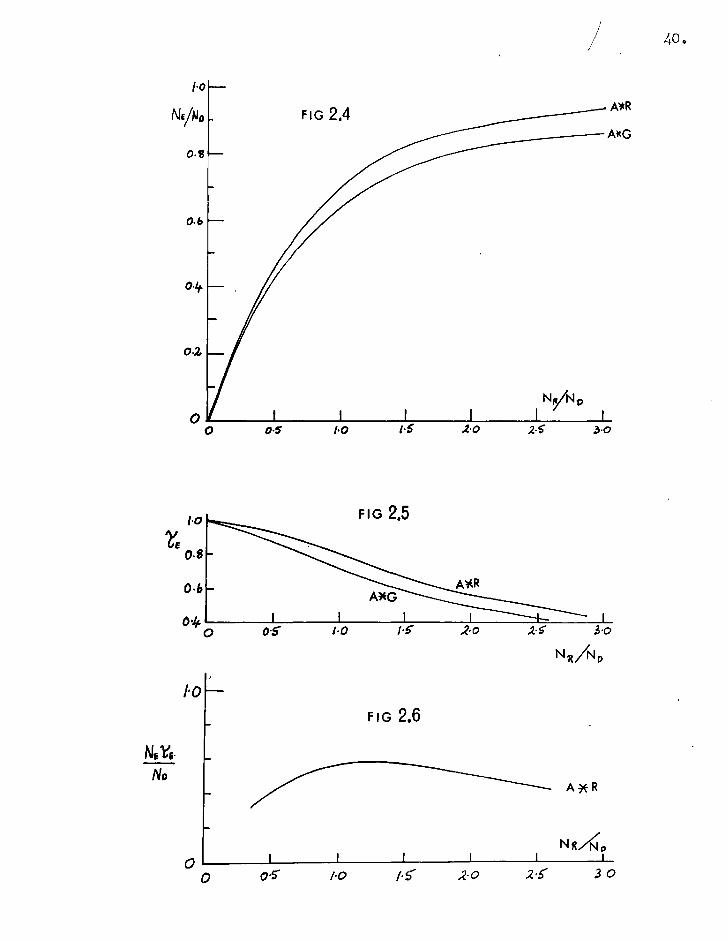
FIG 2,5
FIG 2.6
A)tlt
0 06" l•0 ,2.0 z S 3 0
40.
1.0
NE ie.. No
0

41.
coefficient of the whole system (-E: ). Thus, the maximum flux passing
through the output aperture for a source of llminance B at the wavelength
concerned is r
= B S
The transmission coefficient (T.:), is itself the product of several
factors, and in the case of the F.P. spectrometer is
= B E t F.
The factor'.) arises because the source is not monochromatic and/ B -F
is the transmission coefficient associated with the scanning aperture.
Again Chabbal has treated these transmission coefficients in great detail
deriving curves showing the variation of CE and $:F with the width
of the functions B, E and F. For the present work we are concerned
only with the properties of the etalon itself and thus in the factors
andr.k.
The factorl:,'A, which has already been discussed in section 2.3.1,
is the maximum fringe transmission given by the Airy function and is
L A= 'MAX Io
= 1 A 2 (1 +
This would be the maximum fringe transmission if the etalon plates were
perfect in all respects. In such a case the flux per unit solid angle
which would pass through an etalon (area S) having perfect flats would
be
B.M AM S. where Am is the peak of the Airy function. (r.d. Because of plate

42,
imperfections the actual flux is
1 = EM EM S.
where EM is the maximum value of the etalon function. The transmission
coefficient'eE is defined as the ratio of these fluxes and is therefore
EM AM
A ( 6 - 0;)) D (0)
The value of ? E is dependent on the form of the functions D (0)
and on the ratio of the widths of the functions D (0) and A (0). For
perfect etalon plates the width of the function D (0) is zero and;
is unity but otherwise, 'G E is less than unity and its variation with
NR/ND is shown in figure 2.5. (Chabbal).
2.6. The Choice of Coating Reflectivity.
The properties of resolution and luminosity of instruments employing
the etalon are dependent on the ratio of NR/ND. Chabbal has made
several conclusions regarding the optimum condition for the use of the
F.P. etalon. The optimum choice of coating reflectivity for a particular
pair of flats having a finesse ND can be derived from Figures 2.4. and
2.5. It is seen that increasing the reflectivity increases the value
of NE but also causes a reduction inTE. Figure 2.6. shows the product
NE7:E as a function of NR/ND and NEE is a maximum for reflectivities
such that NR" ND. Provided NR/ND lies between the values 0.75 and 1.75

43. then associated values of NE ''E are within 90% of the maximum value
of this product.
This conclusion is of great importance because as we have already
seen, the defects finesse ND decreases with decreasing wavelength and it
is therefore apparent that the demands on the value of the coating re-
flectivity for optimumunebecome less critical in the far ultraviolet.
2.7. F.P. Type Interference Filters.
When a P.P. etalon is placed in a parallel beam oftwhitet light there
is a maximum in transmission for wavelengths (N) satisfying the relation-
ship.
cf . 2r 2 nt Cos + 2 (7-': -JR) =2m7'. 2.3.
A where nt is the optical thickness of the spacer layer separating the
reflecting surfaces and Pis the absolute phase change on reflection at
the spacer—reflecting layer boundary. This phase change is discussed
in Chapter 4. In the previous discussion of the etalon the term/:3
has
been neglected from the expression for the optical path between the re-
flecting surfaces since in general t is greater than 1 m.m. If however
the optical thickness of the spacer layer is made only one or a few half-
wavelengths in thickness then the transmission bands are of low order
(m) and become more widely separated in wavelength. For such small
optical thicknesses the phase charge term becomes very important.
P.P. interference filters are prepared by evaporating onto a plane
substrate the reflecting and spacer layers. In the present work inter-
ference filters have been produced for the far ultraviolet which are of

44. the type aluminium - Me,- aluminium and are illustrated schematically
in figure 2.7.
If for normal incidence a filter of this type is to have a so called
mth order peak at a wavelengthi\o then the optical thickness of the spacer
layer (nt) is (from equation 2.3.).
nt = >\o ( (m-1) 7v + ). 2.4. 2iv
which for an Al-Met-Al filters having a 1st order peak centered on > 2000 R
(m = 1 ; t6 = 112°) gives nt = 622 R. The equation 2.4. gives the thick-
ness of the spacer layer without ambiguity since it involves the aboolute
phase change (I ) on reflection at the MgF2 - aluminium boundary strictly
defined in Chapter 4 (equation 4.3.).
As in the case of the F.P. etalon there is an upper limit to the
useful reflectivity for the reflecting layers which is set by the defects
finesse (ND) arising from variations in the optical separation of the
reflecting surfaces over the aperture of the filter. For interference
filters however, departures from planeness of the substrate surface on
which the filter is prepared are not so critical since the evaporated
films contour the substrate surface (Tolansky (1960) ). Thus, the
variation in optical separation of the reflecting layers can be made
much smaller than is possible for the two independently worked flats of
r••• the etalon and consequently higher reflectivities may be erployed since
ND is correspondingly greater.
If the optical separation of the reflecting surfaces is constant
over the utilised area of the filter then the peak transmission (?)

SUBSTRATE
45.
AL
MG F2
FIGURE 2.7
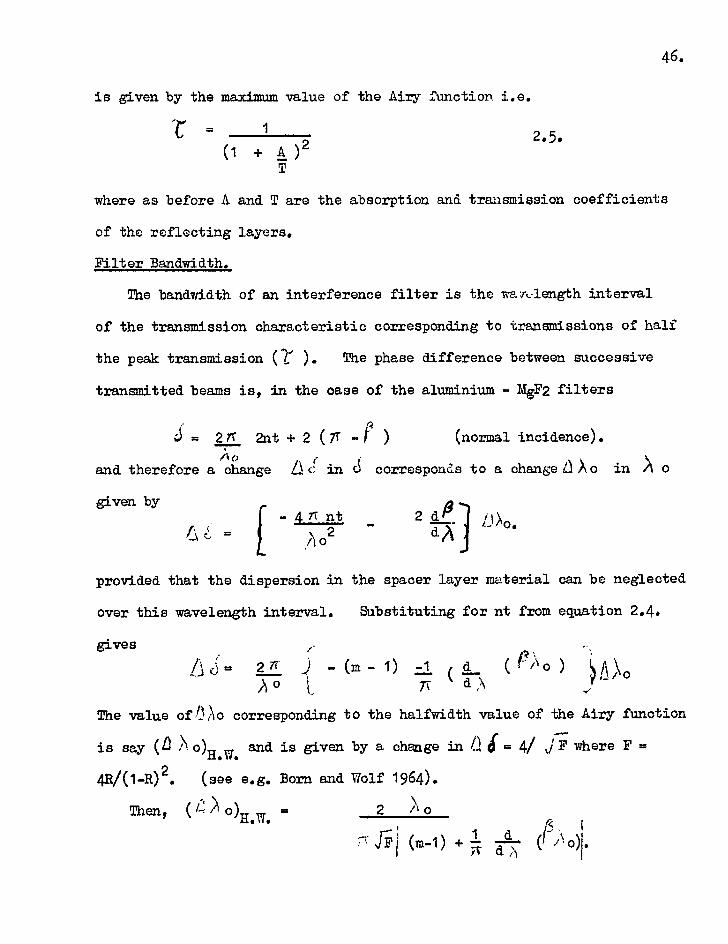
is given by the maximum value of the Airy function i.e.
1
(1 + A )2 T
where as before A and T are the absorption and transmission coefficients
of the reflecting layers.
Filter Bandwidth.
The bandwidth of an interference filter is the wavelength interval
of the transmission characteristic corresponding to transmissions of half
the peak transmission (5 ). The phase difference between successive
transmitted beams is, in the case of the aluminium - Me2 filters
27T 2nt + 2 (7T ) (normal incidence). Ao
and therefore a change L.ti cr in c corresponds to a change 6 )'o in o
given by
- 4 n nt 2 SI
,A 02
provided that the dispersion in the spacer layer material can be neglected
over this wavelength interval. Substituting for nt from equation 2.4.
46.
2.5.
gives
= 2r 4,1 - (m - 1) -1 )1 o 7`
d (PA0 ) (
The value ofino corresponding to the halfwidth value of the Airy function
is say (L o)H.vic and is given by a chige in 6 = 4/ j F where F
44/(1-R)2. (see e.g. Born and Wolf 1964).
Then, ( °)11.17. = 2 :e\ o
(m-1) + 51 . d

o
NR (m-1) + 1 -c21- ( P o) a
In the derivation of this expression for the filter halfwidth it is
assumed that the optical thickness of the soacer layer is constant over
the utilised aperture of the filter and that the 'defects' finesse can
be neglected. Furthermore this expression does nol: take into account
the variation of the reflection and transmission coeZzicients of the
reflecting coatings with wavelength over the range (4J/\o)R.vir. An assess-
ment of the effect of variation in the optical thickness of the spacer
layer can be readily made using equation 2.4. For a first order filter
/\ (nt) A A O. 2.7. 27-i
where A is the shift in wavelength of the transmission peak caused
by a variation of optical thickness (nt). An examination of ex-
perimental filters over an area 6 x 5 mm in sections of 6 x 1 mm ( the
area of sample normally used for determination of filter transmission
characteristics), reveals a shift L o of 15 R or less. This implies
from equation 2.7. that for ):o " 2000 R;f'112° the variation in optical
thickness (nt) over this area is in the order of 5 R. For such a small
variation in optical thickness, the corresponding defects finesse can
be neglected and equation 2.6. may be used to derive the value NR for
the reflecting surfaces.
The second factor to be considered regarding the use of equation 2.6.
namely that of the variation with wavelength of the optical properties
(R, T and A) of the reflecting coatings, is one which is more difficult
47.
2.6.

48.
to assess. The transmission of the filter is
6-A 1 1 + F Sin 24/2.
and equation 2.6. has been derived on the assumption that F is not
wavelength dependent. This is not always the case and it will be seen
in later chapters that there is a decrease in R and an increase in A and
T for aluminium films in the far ultraviolet as the v,velength is decreased,
Because of the dependence of the factor F on wavelength the transmission
profile for aluminium - Mg F2 - aluminium filters will not be symmetrical
about the wavelength (i\ o) of` the transmission peak but will be narrower
at wavelengths greater than 1o. However, the expressions for the
filter bandwidth and peak transmission may be used to permit a useful
comparison between optical properties of the reflecting coatings derived
from measured filter characteristics and this has been done in Chapter 6.
Schroeder (1962) has used the expression for a 1st order filter
o)H.w.
NR
and omits the phase term given in equation 2.6. Thus calculated values
of bandwidth given by Schroeder are low on account of the omission of
this phase term.
In order to produce a narrow band filter then the reflectivity of the
reflecting coatings should be as high as possible. The limitation in
increasing the reflectivity is that the coating transmission becomes
comparable with and eventually less than the coating absorption and there
is a corresponding decrease in the peak transmission of the filter.

In chapter 6 the properties of 1st and 2nd order filters for the far
ultraviolet region will be discussed.
49.

50.
CHAPTER 3
REFLECTING COATINGS AND FILTERS FOR
THE FAR AND VACUUM ULTRAVIOLET.
3.1. Introduction.
It was shown in Chapter 2 that the properties resolution and
luminosity of the P.P. interferometer and the transmi3sion characteristics
of P.P. type interference filters are very much dependent on the optical
quality of the reflecting coatings. In recent years, improvements to
the quality of reflecting coatings have been an important factor to the
general improvement of F.P. spectroscopy, particularly in the visible and
near ultraviolet regions of the spectrum.
The optimum *conditions for using the etalon require that the reflect-
ivity of the coatings be chosen such that the reflection finesse is
approximately matched to the plate defects finesse. In the visible and
near ultraviolet this condition can be fulfilled by the use of multilayer
dielectric films. In many cases, evaporated silver films may be adequate
for the visible region (Bradley 1963) with the added advantage that
when necessary these coatings can be more easily removed and fresh coatings
applied.
In the ultraviolet, multilayer dielectric coatings are now commerc-
ially available down to wavelengths of about 2500 R. It is below
this wavelength that the real difficulties of producing suitable in-
terferometer coatings arise since no high index transmitting material
suitable for multilayer dielectric coatings has been discovered so far.

51.
(Apfel (1966) has reported on the use of MgO as a high index material
for multilayer films for the ultraviolet to 2000 R. Used with 140F2
as low index material the ratio of refractive indices is 5:4. In view
of this low ratio raanylV4 layers are required to give a high reflectance
stack. For a 27 layer film combination a reflectance of 96.8% was
obtained for j 2200 2 which is higher than any know metal or metal-
dielectric combination at this wavelength. Extensi,-,1 of this high
performance to wavelengths 4'2000 2 is prevented by the rapidly in-
creasing absorption in the oxide film)
Evaporated aluminium filmspossee5a higher normal incidence re-
flectance than any other single material in the far and vacuum ultra-
violet to wavelengths of approximately 1100 2 and during the past few
years there has been much effort devoted to the improvement of the optical
properties of such films for this wavelength region. The reflectance
of opaque aluminium films has been found to be strongly dependent on
many of the factors involved in their preparation, However, even if
produced under 'optimum' conditions exposed aluminium films show a
deterioration of reflectance with time due to oxidation. Whilst for
wavelengths above 2200 2 the effects of a thin oxide layer on reflect-
ance are relatively small(for highest quality films) this is not the case
at shorter wavelengths where the oxide layer has an increasingly de-
trimental effect on reflectance as the wavelength is reduced. Because
of this oxidation the practical use of unprotected aluminium films
is severly restricted in the vacuum ultraviolet.
The oxidation of an evaporated aluminium film can be considerably

52.
reduced if it is immediately overcoated with a transparent dielectric
film. Moreover, if this overcoated layer is of correct thickness
then a reflectance enhancement can be obtained arising from multiple
interference between waves reflected from the vacuum-dielectric and die-
lectric-allppinium boundaries. To date, the aluminium-dielectric com-
bination is the most efficient reflector in the vaculIT ultraviolet
(to about p 1000 R ) and is now widely exploited.
By comparison with the recent work on opaque films there has been
comparatively little study of the properties of partially transmitting
aluminium layers in the far and vacuum ultraviolet. A detailed in-
vestigation of the optical properties of semi-transparent aluminium films,
from which the optical constants of aluminium have been derived, has
been made down to a wavelength of 2200 R. (Hass and Waylonis 1961)
These optical constants are used in Chapter 4 for the purpose of comput-
ing the properties of an aluminium - MgF2 film combination. However no
such systemiatic investigation has been made for wavelengths shorter than
2200 R although the optical constants for aluminium films have been
determined at a few isolated wavelengths between 1000 and 2000 R .
(serning, Hass and Madden 1960).
In this chapter, the parameters involved in the preparation of
evaporated aluminium films which have been found to influence the re-
flectance in the far ultraviolet are discussed, since the results of these
investigations have been applied to the present work. The inadequacy of
unprotected aluminium films due to oxidation is illustrated and results
are given for the aluminium-dielectric film combination showing the much

53. improved performance over that of single aluminium films. Finally,
a brief review is made of both absorption and interference filters for
the far ultraviolet.
The emphasis in this chapter is on the type of reflecting films
which might provide a basis for coatings for multiple-beam interferometry
in the far ultraviolet. This is at present limited in practice to
aluminium and aluminium-dielectric film combinations, A considerable
number of investigations have been made on single ra8terials and com-
binations of different materials for reflectors at wavelengths shorter
than about 1400 R. Such materials are outside the scope of the present
work but have been discussed in a comprehensive review made by Madden
(1963). Also, the present work is concerned largely with wavelengths
shorter than 2400jwhere multilayer dielectric films are at present
impracticable.
In view of this emphasis on wavelengths shorter than 2400 R, the
properties of multilayer dielectric coatings and all dielectric inter-
ference filters which are currently employed in the ultraviolet will not
be discussed. Much of the earlier work in this field has been reviewed
by Jacquinot (1960) but this review is now somewhat dated and no sub-
sequent one appears to have been made. This in part is due to the fact
that information regarding the choice of materials, the number of layers
and the techniques of preparation of many commercial multilayer films
and filters is not readily available.(Bifford 1966).

54.
3.2. The Optical Properties of Semi-Transparent Allminium Films Prior
to the Investigations of Hass and Co-workers.
It is appropriate at this point to briefly consider some of the
earlier investigations of the properties of transmitting, evaporated
aluminium films in the ultraviolet. This will at least fulfil\ the
purpose of illustrating the progress which has been made during recent
years.
Crawford et.al. (1949) noted that the optical pi?operties were de-
pendent on the rate of deposition but this factor was not examined in
very great detail. Values of film reflectivity (R) and transmission (T)
were measured in the wavelength region 4000 to 2500. ii for films prepared
at 1 fabtl deposition rates (deposition time of 20 secs) and 'slow 1
deposition rates (deposition time 20 mins to 2 hours). The values of
(R + T) obtained for the fast deposition rates were in the range 88%
(/14000 . ) to 83% ( 2500 R ). For films prepared at slower rates the
(R + T) values were much lower and need not be considered here.
The deposition rate corresponding to the fast evaporation was in
the order of 10 to 15 2 sec -1. Compared with the work of Hass and
that of the present investigation this would be considered to be a slow
deposition.
Burridge et.al. (1953) made a more detailed study of the dependence
of optical properties on the deposition time. It was found as above,
that the higher optical quality films were associated with the shortest
deposition times but again, the deposition rate was comparatively low.
The shortest deposition times used were 30 secs corresponding to a

55.
a deposition rate of the order 5 to 10 R sec -1. The evaporation
pressure in these experiments was about 10-5 Torr
However, the optical quality of these films was superior to those
of Crawford et.al. whilst the values of (R + T) were found to decrease
almost linearly with increasing film transmission. Ati12600 .R, the
shortest wavelength of measurement, (R + T) varied be...,ween 88% and 91%
for films transmitting 10% and 1% respectively. It "..s not very clear
why the optical quality of these films was superior to those of Crawford
since the deposition rates and evaporation pressure were closely com-
parable.
However, this improvement may have been due to improved aluminium
purity, substrate cleaning etc which are known to have a considerable
influence on optical performance. Full experimental details are not
given by the former authors.
It was concluded by Burridge et.al. that the quality of the evaporat-
ed film is dependent on the relative rates of arrival at the substrate
of the vapour atoms and impurity gas molecules present in the coating
chamber. On this basis, it would be expected that improved vacuum
conditions and the use of faster deposition rates would lead to an im-
provement in optical performance. This was indeed found to be the case
by Hass and co-workers whose results are discussed in following sections.
From the point of view of ar?lication to multiple beam interferometry,
an analysis of the results of Burridge et.al. shows that at 2600 R
values of NR = 20 with 1 could be obtained with their aluminium
coatings.

56
Les and Les (1962) have also given properties of semi-transparent
aluminium to wavelengths of 2900 R; films were prepared at a pressure
of 5 x 10⁻⁵, Torr. Values of (R T) were found to decrease with in-
creasing film transmission but insufficient data is given to form any con-
clusions on the dependence of (R + T) with T.
The Optical quality of their film:- were slightly inferiof
to those of Burridge et.al. but because of lack of er,vJorimental details, in
particular that of deposition rate, an explanation for this cannot be
readily given. However, a more intersting aspect of this work is that
of overcoating an aluminium film (R = 60 to 70%) with alternate layers of
MgF2 and PbF2 (see also Les, Los and Gabla 1963). In the wavelength
region 2600 to 2800 the absorption for an aluminium film overcoated with
6 layers of effective optical thickness equal toA/4 is only 2.5%. This
is roughly one third that obtainable with best quality single aluminium
films and is also closely comparable with high quality multilayer films
in this wavelength region.(Perkin-Elmer Inc. 1965). The advantages of
the metal-dielectric combination over that of all dielectric multilayers for
P.P. coatings is that they readily permit visual adjustment of the etalon.
Moreover, this type of coating reduces transmission of visible radiation
because of the attenuation of aluminium layers at longer wavelengths. This
second aspect might well be of importance for application to ultraviolet
spectroscopy from rockets or satellites for additional filtering of visible
radiation.
The most detailed investigation so far reported on semi-transparent
aluminium films has been that of Hass and Waylonis (1961) in which the

57.
detailed influence of evaporation conditions on optical performance
have been considered and measurements of film properties extended to
A 2200 R. These results are considered in section 3.4. In the follow-
ing section, the conditions for producing high reflectance opaque aluminium
films for the far ultraviolet will be outlined since these conditions
form a considerable part of the basis for the develoi:-.ent of the coatings
produced in the present investigation.
3.3. The Necessary Conditions for Producing High Ultraviolet Reflectance,
Aluminium Films.
Since the mid 1950's an extensive programme in far and vacuum ultra-
violet reflectance problems has been undertaken by the Engineer Research
and Development Laboratory (Fort Belvoir) and the Naval Research
Laboratory (Washington). Much of the effort has been centred on the
effects of the conditions of preparation on the reflectance of aluminium
films. As a result of these investigations there has been a much
improved efficiency in the quality of mirror and grating coatings for
the vacuum ultraviolet. This of course is of tremendous benefit to
spectroscopy in general and it has been a considerable factor in the
improvement of speed of recording of ultraviolet spectra obtained from
rocket investigations
3.3.1, Aluminium Purity.
The effect of aluminium purity on the reflectance of opaque alum-
inium films in the wavelength region 900 to 2200 R has been studied

58.
by Hass, Hunter and Tousey (1957). For wavelengths between 1400 and
2000 R, films prepared from 99.99% pure material posses a reflectance
some 10% greater than film prepared from 99.57/10 pure aliminium. In the
visible region of ;the spectrum this corresponding difference in reflect-
ance in only some 0.5%.
The main impurities in the deposited film (99.90 purity) were
found to be eye and Si in the same proportion as in .he original material
Tungsten wire filaments were used to evaporate the aluminium charge but
no trace of tungsten was found in the deposited film.
3.3.2. The Evaporation Pressure and Speed of Evaporation.
These two parameters have a considerable influence on the reflect-
ance of opaque aluminium layers in the vacuum ultraviolet. Figure 3.1.
shows the effect of these factors on the reflectance of an opaque film
(800 R thick) deposited in the times indicated (Hass and Tousey 1959).
Again it is seen that the shortest evaporation times yield the
highest quality films as found by the authors cited in section 3.2. In
this case however, much faster rates of deposition were used up to
400 R sec-1. For the fastest deposition rates there appears to be little
difference in reflectance for films deposited at pressures of 10-4 or
10 5 torr. However, it should be noted that these films were exposed
to the atmosphere for 24 hours prior to measurement and later work shows
that below t 2000 R there is a decrease in reflectance occurring only
seconds after deposition arising from oxidation. (Madden and Cranfield
1961; Madden et. al. 1963).

1000 AA
z000
F 1 G. 3,1
SECS.
P=10 TO RI?
P010-44 TORR
59.
0
1606A
60
40
12161' 20
0 1 1 1 0.1 1 10 100 10,000
AGE (HOURS) nt.,,tamArovr•gaspremA •Pr, • •in • • ,
FIG.3.2. A2200;39
ioo
AZ . 80
60.
The improved quality of aluminium films deposited at low pressures
and high deposition rates is due to the fact that under these conditions
fewer oxygen and other residual gas molecules of the coating chamber
are trapped in the film; the film is therefore more compact and grows
a thinner, tighter oxide layer than those prepared unger poorer conditions
and lower deposition rates. (Hass and Tousey 1959). Under normal evap-
oration conditions for film preparation there is ample opportunity for
residual gas molecules to be trapped in the growing film. Since the
concentration of impurity molecules trapped in the film during deposition
depends directly on the evaporation pressure and inversly proportional
to deposition rate (Dushman - 1949) it is not surprising that an improved
optical efficiency should result from an improvement to these two factors.
A further aspect arises from the effect of deposition rate on the
structure of the deposited film. This has not been dismissed by Hass
and co-workers but it is a factor which is briefly considered in Chapter 6.
3.3.3. Substrate Temperature.
Aluminium like many other materials has an improved adherence if it
is deposited onto a heated substrate. With increasing substrate temp-
erature however crystal size and surface roughness will increase and
this can cause a significant drop in the specular reflectance in the far
and vacuum ultraviolet. This parameter has been studied by Hass, Hunter
and Tousey (1957) who found that if the substrate temperature is raised
above about 60°C during deposition then there is an associated decrease
in specular reflectance. The reflectance of an opaque film (ati‘2200 R)

61.
deposited onto a substrate at a temperature of 50°C is 91% whilst the
corresponding reflectance for a film deposited onto a substrate at 200°C
is only 81%. The effect of substrate temperature on reflectance becomes
far more pronounced at shorter wavelengths.
Besides the effect of substrate temperature on surface roughness
and crystallite size of the deposited film it must an:, be remembered that
the oxidation of the aluminium layer will be enhanced as the substrate
temperature is raised.(see e.g. Eley and Wilkinson 1959).
During the present investigation the aluminium films and aluminium
- MgF2 double layers have in general been deposited onto a substrate at
room temperature. No attempt has been made to make a systematic exam-
ination o4 the effect of substrate temperature on the properties of the
transmitting films. It has been observed however that several films
deposited onto substrates at a temperature of about 90°C possessed lower
values of R and (R + T) by some 2-* (atA2200) compared with films de-
posited onto a non-heated substrate. This difference in optical properties
is somewhat greater than corresponding values obtained by Hass and Tousey
for opaque films at n 2200 R.
3.3.4. The Vapour Angle of Incidence.
The angle of incidence of the vapour stream onto the target substrate
can greatly influence the reflectance of aluminium films. This effect
has been studied by Hass and Waylonis (1961) who measured for wavelengths
down to 2200 .R, the properties of films approximately 600 and 2000 R thick
prepared at vapour angles of incidence of 0°, 30° and 60°. Two sets of

62.
evaporation conditions were chosen
'Optimum' - deposition rate 300 . Sec-1; pressure 10-5 Torr.
'Poor' - deposition rate 10 R Sec-1
; pressure 10-4 Torr.
Films of thickness 4,600 R prepared under optimum conditions show
little variation of reflectance with vapour angle of incidence. This
variation increases for thicker films and depends on ,..-Taporation con-
ditions in the following manner. (Values of reflectan:e (%) are given
for 2200 R, the shortest wavelength of measurement).
Vapour Angle of Incidence 0 30° 60°
t = 600 R; optimum conditions 91.5 91.4 90.4
t = 2000 R; optimum conditions 91.2 90.7 75.0
t = 600 R pour conditions 83.5 82.6 81.4
t = 2000 R poor conditions 65.9 60.5 31.8
An explanation for the dependence of reflectivity of an aluminium
film on the vapour angle of incidence has been proposed by Holland (1956).
For a smooth substrate surface the vapour atoms are fairly uniformly
condensed over the surface and the nuclei are evenly dispersed. As
deposition proceeds and the film thickens then for vapour atoms arriving
at high angles of incidence the nuclei tend to grow preferentially in the
direction of the incident vapour beam. Condensation is then restricted
to the upper surfaces of the grains which further prevent vapour atoms
reaching the inter-spaces between grains. The resulting film therefore
possesses an irregular surface, the magnitude of the irregularities in-
creasing with the film thickness. Expressions relating the roughness

63.
of a plane reflecting surface to its reflectance have been given by
Bennett and Porteus (1961). This analysis shows that the surface rough-
ness has an increasingly detrimental effect on specular reflectance with
decreasing wavelength.
For the present work, films of thickness in the order of 200 to 300 R
have been required and vapour angles of incidence have been kept below
80. For such film thicknesses this vapour angle of incidence should not
greatly influence the film properties.
3.4. The Improved Performance of Semi-Transparent Aluminium Films.
Following the improvements in deposition technique Hass and Waylonis
(1961) have investigated the properties of semi-transparent aluminium
films in the visible and ultraviolet down to wavelengths of 2200 R.
From measurements of film reflectance (R) transmittance (T) and film
thickness, the optical constants for aluminium films have been derived
from equations developed by Hadley and Dennison (1947).
Films were prepared at an evaporation pressure of 10- 5 Torr using
deposition rates in the order of 100 A Sec-1. The values of (R T) are
the highest reported for semi-transparent aluminium films in the ultra-
violet (91.8% at p 2200 R).
An analysis of the Hass and Waylonis results shows that for multiple-
beam interferometry a reflecting finesse of 20 with a value of 1:1A 20%
can be obtained at a wavelength of 2200 R. For the same reflection
finesse this is a factor of two in improvement of performance over the
results given by Burridge et.al. for a wavelength of 2600.x.

64.
There are two features of these results which are quite different Ate YIP0"
previously reported data (section 3.2.). Firstly, the values of
(R T) show only a small variation with wavelength and secondly, the
(R T) values in the far ultraviolet are independent of film thickness.
In Chapter 6, the results of Hass and Waylonis will compared with the
results of the present investigation.
3.5. The Ageing Properties of Exposed Aluminium Films,
The change in optical properties of exposed aluminium films is of
obvious practical importance. Figure 3.2. shows the decrease in
reflectance for films 800 R thick which were produced under 'optimum'
conditions and stored over long periods of timepSt(Hass and Tausey 1959).
The reflectance decreases with time in an approximately exponential
manner, with a larger rate of decrease in reflectance at shorter wave-
lengths.This decay an was attributed to the growth of oxide layer on
the surface of the aluminium film.
To support this conclusion, calculations of the effect of an oxide
layer on the reflectance of aluminium films have been made for a number
of wavelengths and the oxidation rate of pure aluminium films in air has
been measured (Berning, Hass and Madden 1960). It was found that for
films deposited under optimum conditions an oxide layer some 10 - 12R
in thickness was formed in the first hour of exposure. This layer in-
creased in thickness to 15 . after 1 day and 22 R after one month. There
is little increase in oxide thickness after this period of exposure.

65.
From these results and using the optical constants of aluminium
(at M216 ?) derived from measurements of reflectance as a function of
angle of incidence, a reasonable close agreement was found between measured
and calculated values for the decrease in reflectance with time. For
wavelengths above 2200 R the change in reflectance wftth time was found
to be very small but as the wavelength is decreased a given thickness
of oxide has an increasingly detrimental effect on the reflectance.
There are two reasons for this. Firstly, the absorption of the
oxide increases at the shorter wavelengths and secondly, the changes in
the optical constants of aluminium and its oxide at the shorter wave-
lengths cause the phase change at the aluminium - aluminium oxide in-
terface to be more conducive to absorption.
The mechanisms suggested for the kinetics of the oxidation of
aluminium films have been summarised by Eley and Wilkinson 1959, and
the rate of uptake of oxygen by an aluminium film studied as a function
of pressure, temperature and film thickness. The experiments showed
that at a constant pressure and temperature the oxide layer increased
in thickness as a logarithmic function of time in the early stages of
growth.
3.6. The Reflectance of Unexposed Aluminium Films.
In the previous section the decrease in reflectance of opaque
aluminium films exposed to the atmosphere was considered. Madden et.al.
(1963) have made investigations to determine the 'true' reflectance of
unexposed aluminium films. The films were prepared at an evaporation
66.
pressure of Torr at high deposition rates. A reflectometer
was constructed such that measurements could be made in vacuum starting
some 10 secs after the completion of the evaporation. Results of re-
flectance as a function of time and wavelength are shown in figure 3.3.
From these curves it is seen that even under the.,,. conditions the
decay in reflectance is quite rapid at the shorter wa,..3lengths. The
effect of admission of oxygen and nitrogen to a pressu.::.; of 10-3 to:cr
on the reflectance decay curve was also studied at a wavelength of 1216 R,
The admission of nitrogen caused no significant decrease in reflectance
but in the case of oxygen, there was a sudden decrease of about 12%. It
was concluded from this evidence that the partial pressure of oxygen in
the coating chamber was the controlling factor in the rate of decrease in
reflectance of aluminium films.
An indication of the true reflectance of unexposed aluminium films
can be obtained by extrapolating the curves of figure 3.3. to zero time.
It is then found that aluminium possesses a reflectance of 900 or greater
from the infra red down to wavelengths of about 1500 2, if prepared under
these stringent conditions previously outlined.
The work of Madden et.al. allows a comparison to be made between
measured values of reflectance and calculated values obtained by ex-
trapolating the optical constants determined by Hass and Waylonis to
shorter wavelengths Ochroedar1962, see also Chapter 4). It is found
that computed values of reflectance for the wavelength region 2000 to
1200 2 agree quite closely with the directly measured values given for

67
times of measurement within 200 to 250 seconds after deposition.
3.7. The Aluminium-Dielectric Double Layer Combination.
The potentially high reflectance in the vacuum ultraviolet of single
aluminium films cannot be preserved upon exposure to the atmosphere be-
cause of the growth of a thin oxide layer. Hass and Tousey (1959) were
the first to show that in the vacuum ultraviolet there was a great in-
crease in reflectance over that of single aluminium films if the aluminium
layer was quickly overocated with an evaporated MgF2 film. The MgF2
coating prevents the formation of an oxide film and moreover, if the
MgF2 layer is of correct thickness, there is a reflectance enhancement
over that of the single film which arises from multiple interference
between waves reflected from the vacuum-dielectric and dielectric-
aluminium boundaries. Figure 3.4. shows a comparison between aluminium
and aluminium - MgF2 double layers. In this case the MgF2 deposition
was commenced some 30 secs after the completion of the aluminium evapor-
ation. It is probably because of this delay time that the reflectance
of the double layer film is lower than that of 'unexposed' aluminium
films (section 3.6.) indicating that the aluminium film was partially
oxidised before the MgF2 coating was applied. The deposition rate for
the MgF2 film was 20 2 seo -1.
For wavelengths shorter than about 1200 2,MgF2 becomes inefficient
as a reflectance increasing coating because of the high absorption in
the MgF2 layer. The spectral range of the double layer film may be
extended to about 1000 2 by using LiF rather than MgF2. At 1000
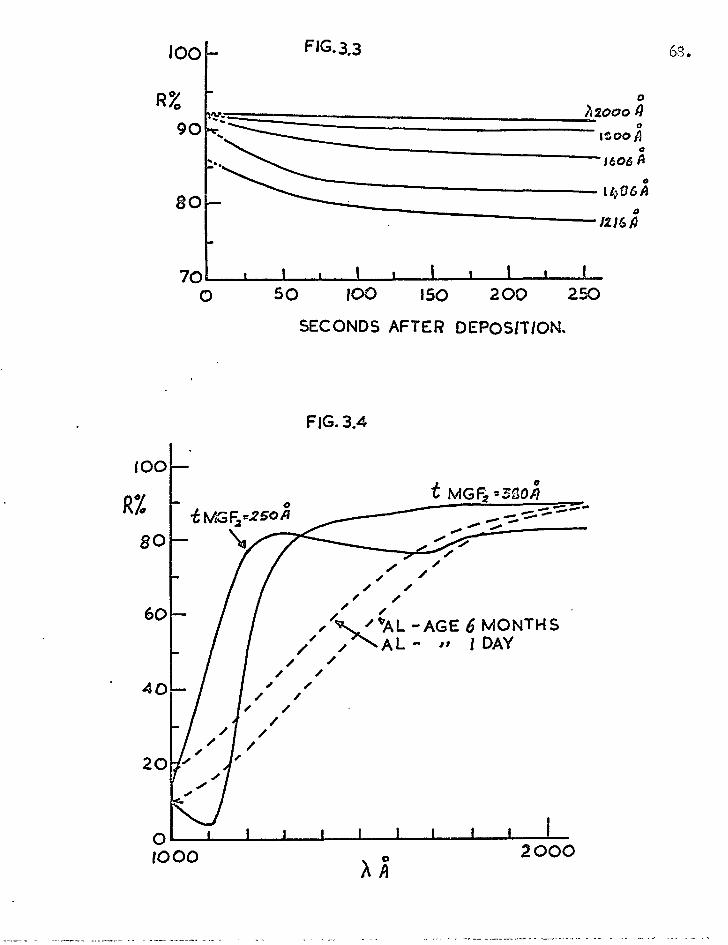
FIG. 3,3
R% 0 A2000
50 100 150 200 250
t MGFi .3acji ••• so.
=O. am. •••••
20
R/0 0 t‘/F2=25.071
100
1 1 1
AA
0- 1000 2000
FIG. 3.4
• ••• •
• • • •
• • • , •e / N)! °AL -AGE 6 MONTHS
• / A L - IDAY •
• / /
/ •
60
40
SECONDS AFTER DEPOSITION.
68.

69.
an aluminium - LiF mirror (LiF thickness 170 R ) has a reflectance of
55%. (Angel, Hunter and Tousey 1961). The reflectance for an aluminium
mirror exposed to air for 24 hours is only about 18%.
The change in reflectance with time for dielectric coated mirrors
is very small. Aluminium MgF2 films stored under normal laboratory
conditions (humidity 30 to 50°A for up to two years were found to e.eorease
in reflectance by only 1 to ea in the vacuum ultraviolet. With LiF
protected mirrors again the deterioration with time is small provided the
humidity is controlled to less than 40%. For humidities exceeding this
value the reflectance decreases rapidly. This might be expected since
the solubility of LiF in water is 0.27 gm am-3 whilst that of MgF2 is
only 0.0076 gm am 3.
The aluminium -MgF2 combination is now widely exploited for mirror
and grating coatings in the vacuum ultraviolet. In the present in-
vestigation the techniques for producing high quality opaque aluminium
- MgF2 reflectors have been applied to the case of semi-transparent
aluminium films. The optical properties of such films to a wavelength
of 1800 R are described in Chapter 6 and their performance for multiple-
beam interferometry in the far and vacuum ultraviolet is discussed.
70.
3.8. Filters for the 'Ultraviolet.
3.6.1. Absorption Filters.
AqueM solutions of nickel sulphate and cobalt sulphate have a
fairly high transmission in the ultraviolet between 2300-3300& 2300.4000 kres-
peetively.The former solution also has transmission peaks at 5000 R
and 9000 R whilst the latter solution absorbs strongly at these wavelengths.
Anacquecussolution containing both nickel and cobalt sulphates can yield
a filter having a transmission of 50% for the wavelength region 2450-
3200 R with low transmission at other wavelengths. The transmission
characteristic of such a filter is dependent on solution concentrations
details of which have been given by Kasha (1948), (Braga and Iamb 1966).
Chemical solutions in conjunction with Corning glasses can be used
to construct a set of band-pass filters for the region 2400 - 3800 R.
These filters have a maximum transmission of 30% and a typical bandwidth
of about 200 R. Details of solution concentrations and type of Corning
glass required are given in the literature (see e.g. Kasha (1948) Bass
(1948) Mohler and Loofbourow (1952) ).
More recently organic compounds dissolved in polyvinyl alcohol or
polystyrene substrates have provided a range of cut off filters from which
absorption type filters can be produced. The properties of a series of
short wavelength cut off filters are shown in figure 3.5. (McBride 1963).
A chemical filter particularly suitable for studying the A1849 line
of HgI since it has a low transmission to the considerably more intense
A2537 radiation has been digscribed by Wolffand Pertel (1964). This
filter consists of a solution of 9,10- dimethyl anthracene (DMA) in
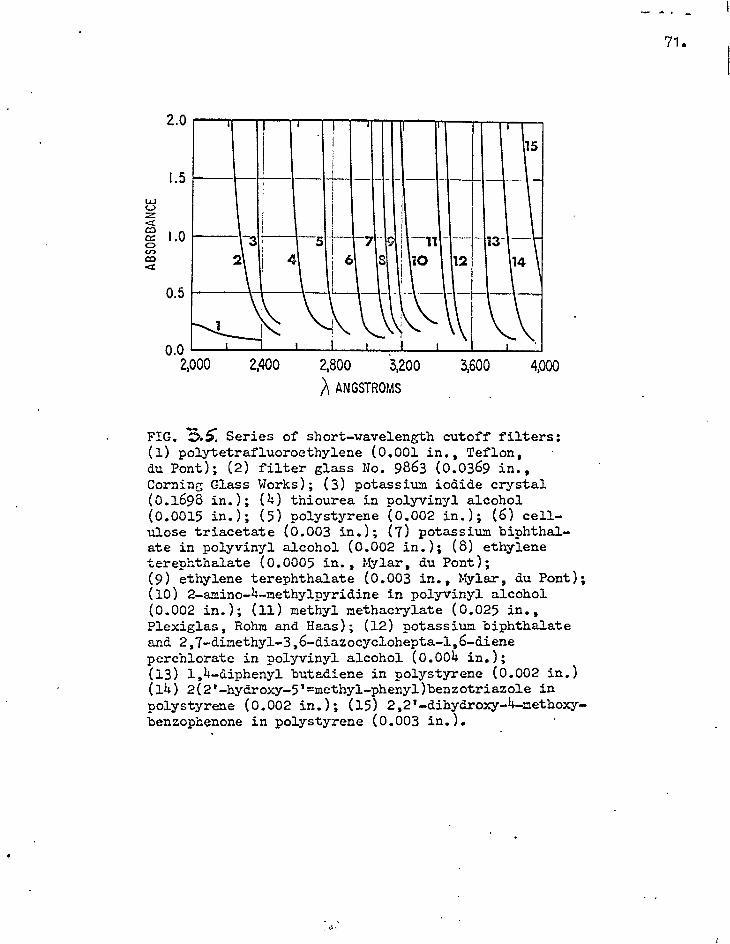
0.0 7-1 2,000 2,400 2,800 3,200
ANGSTROMS
4,000 3,600
ABSO
RBAN
CE
2.0
1.5
1.0
0.5
FIG. 154: Series of short-wavelength cutoff filters: (1) polytetrafluoroethylene (0.001 in., Teflon, du Pont); (2) filter glass No. 9863 (0.0369 in., Corning Glass Works); (3) potassium iodide crystal (0.1698 in.); (4) thiourea in polyvinyl alcohol (0.0015 in.); (5) polystyrene (0.002 in.); (6) cell-ulose triacetate (0.003 in.); (7) potassium biphthal-ate in polyvinyl alcohol (0.002 in.); (8) ethylene terephthalate (0.0005 in., Mylar, du Pont); (9) ethylene terephthalate (0.003 in., Mylar, du Pont); (10) 2-amino-4-methylpyridine in polyvinyl alcohol (0.002 in.); (11) methyl methacrylate (0.025 in., Plexiglas, Rohm and Haas); (12) potassium biphthalate and 2,7-dimethy1-3,6-diazocyclohepta-1,6-diene perchlorate in polyvinyl alcohol (0.004 in.); (13) 1,4-diphenyl butadiene in polystyrene (0.002 in.) (14) 2(2'-hydroxy-5'=methyl-phenyl)benzotriazole in polystyrene (0.002 in.); (15) 2,21-dihydroxy-4-methoxy-benzophenone in polystyrene (0.003 in.).
71.
72
cyclohexane. Absorption properties of the filter for the wavelengths
1849 and 2537 R are given as a function of the solution concentration
and cell length, By appropriate choice of these parameters it is possible
to obtain a filter having a transmission of 200 at,,1849 .R and only 0.1%
at /2537 R. However increasing the filter transmission atM849 causes
a reduction in contrast.
The properties of alkali metal films were studied by R.NWood in
the late 19301 s. Thin sodium. films (0.5 to 1 p. thickness) transmit/
below/ 2100 and absorb strongly at higher wavelengths. For potassium
films of similar thickness the cut off is about A3400. More recently
the methods of producing Na - K alloy filmsof thickness 0.3 - 1pin
a quartz cell and the properties of such films have been described by
Shaw and Foreman (1959). For an alloy of composition 25% Na; 75% K
and thickness 0.5/.., a transmission of 20% is obtained at 2000 R whilst
at 4000 R the transmission is reduced by a factor of approximately 105.
3.8.2. Interference Filters for the Far and Vacuum Ultraviolet.
The diffAculties which have been discussed concerning the production
of high reflectivity coatings for the far and vacuum ultraviolet apply
also to the problem of producing F.P. type interference filters for this
wavelength region. Thus, all dielectric interference filters have been
produced for wavelengths to about 2400 R but the extension of the spectral
range of filters of this type is limited by the lack of a suitable high
index1 low absorption material. However, Baumeister and Coati& (1965)
have designed an interference filter for the 1849 line of HgI which is

73.
aimed to have a high rejection for A 2537 R. This is acheived by using
the system:-
Vacuum (HL)10 H M L" M Substrate.
where M = Aluminium film 175 R thickness
H = layer of Th F4, optical thickness A1/4 for /‘ 2537 R
L = layer of Na3 A1F6, tig
L'= 0.65 L.
IP= 0.89 Li
The transmission values of the filter at 1849 R and 2537 .R are
15g and 0.2% respectively although the transmission increases again at
longer wavelengths. This design of filter is considerably complex and
appears to have little advantage over the more simple Al-Me2-A1 filters
to be described, apart from the fact that the ratio of transmissions
T1849/T2537 is 75 compared with about 45 obtainable with 1st order
Ai-MgF2 filters.lii. However, two simple Al-MgF2 44. series will give a
much improved performance over the above complex filter.
According to Baumeister (1965) the optical properties of ThF4 have
not been studied at wavelengths shorter than 2000 R.
The most suitable type of interference filters for wavelengths
shorter than 2400 R appear at present to be those which employ aluminium
reflecting films. From extrapolated optical constants of aluminium
films Schroeder (1962) has computed the transmission characteristics of
filters of the type (L) M D 14 where hi and D represent the aluminium and
MgF2 films and L the total number of layers. For 3 la D M 1st order
filters having a peak transmission of 25%, a bandwidth of less than 200 R

74.
is to be expected from Schroederts analysis for filters having trans-
mission peaks for wavelengths down to about 1700 R. At wavelengths shorter
than this there is an increase in bandwidth which arises from the deter-
ioration in the properties of the aluminium reflecting layers.
The computed contrast of this type of filter, which Schroeder
arbitarily defines as the ratio of peak transmission to transmission at
A 4000 2, lies between 80 and 120. (This definition is given for filters
peaked for the wavelengths near 2000 2). Contrast can be increased by
using multiple stacks of 3MDMfilters. For example, a 5 M D M filter
( M - D - M' - D - M where M' has twice the thickness of M) gives a contrast
of approximately 20 times that ofa3MDMfilter. A further gain of
about 20 in contrast can be obtained from a 7 M D M filter.
Schroeder's experimental results for filters peaked near 2000 2
are disappointing and this was largely the result of difficulties in con-
trolling the thickness of the aluminium films at the high deposition rates
required. For a 3 M D M 1st order filter centred on 2050 2 a band-
width of 400 2 with a peak transmission of 35% and a contrast of 100 was
obtained. The transmission characteristics of two 5 M D M filters are
given having transmission peaks in the region 1900 - 2000 R. For a filter
having two 1st order spacer layers the bandwidth is 325 2 and for a
combined 1st and and order filter the bandwidth is 200 R. In both cases
however, the peak transmission is only some 0.0.
The bandwidths of the experimental filters are larger than calculated
values. This was partly due to the fact that the aluminium films were
deposited at less than the optimium rates. Also, Schroeder omits the

75.
phase change term on reflection at the aluminium - MgF2 boundary in
computing filter bandwidths.(See Chapter 4).
In Chapter 6 improved 1st and 2nd order filters for the far and
vacuum ultraviolet are discussed and transmission profiles given. From
these experimental transmission curves the properties of the aluminium
reflecting layers are derived.

CHAPTER 4.
RELEVENT THIN FILM THEORY AID COMPUTED OPTICAL PROPERTIES
FOR TRANSMITTING ALUMINIUM AND ALUMINIUM - MgF2 FILMS.
4.1. Introduction.
Methods for calculating the optical properties of single and militilaye
thin films from a knowledge of the optical constants of the individual
materials, have received much attention in past years. Indeed, such
theoretical approaches will also receive considerable attention in future
years as the search for combinations of different materials for specific
optical design problems is aided by modern methods of computation.
By present day standards, the calculation of the optical properties
of a transmitting aluminium film overcoated with a thin dielectric layer
may be considered to be a trivial problem. Yetlin the background to this
present work the author has found that there is a considerable confusion
of terms in the literature largely because the assumptions regarding sign
conventions, the method for writing Fresnells equations and the definition
of phase change onreflection are not clearly stated.
In the present investigation semi-transparent aluminium - MgF2
double layers and aluminium - MgF2 - aluminium interference filters have
been produced for the far ultraviolet. The thickness of the MgF2 layer
determines the wavelength for optimum reflectance of the double layer
film and also the wavelength of the principd pass-band of an interferenoe
filter. However, the actual thickness of the MgF2 film which is required
for both of these problems is dependent on the phase change on reflection
76.

77..
at the MgF2 - aluminium boundary.
The absolute phase change on reflection at a metal-dielectric boundary
has been strictly defined by Bennett (1964).
The equation derived by Bennett for an intensity maximum in the
transmitted light for a F.P. interferometer consisting of two parallel
metal surfaces separated by a medium of refractive index (n) is
2 nt - Jslfr 7'
where t is the geometrical separation of the reflecting surfaces and
leis the absolute phase change on reflection at each dielectric - metal
boundary. This equation can be used to calculate the thickness of spacer
layer for an interference filter which is required to have a transmission
peak at a particular wavelength ()o). The minium value of t is obtained
from the above equation by putting N = 0 which is the condition for a
so called 1st order filter at wavelength 4o. For a so called 2nd order
filter N = 1 etc.
On the other hand Schroeder (1962) gives the optical thickness of
spacer layer as
m = 2nt + A cr 71
where m = 1 for 1st order filter but the phase change term (oc) is not
the absolute phase change on reflection. In this chapter the appropriate
formulae are given for the dielectric layer thickness of the double layer
films which without ambiguity satisfy the experimental conditions and
which involve only the absolute phase change on reflection. This phase
change term has already been met in connection with interference filters

76,
in Chapter 2.
Also in this chapter results are given for computed optical properties
of aluminium and aluminium - dielectric double layers in the far ultra-
violet. The optical constants for aluminium films determined by Hass
and Waylonis (1961) at wavelengths above 2200 R have been extropolated
to shorter wavelengths in the same manner as discussed by Schroeder (1962)
who was concerned with the feasibility of using aluminium films for
interference filters in the far ultraviolet. Calculations of the optical
properties of single aluminium films have been made. In addition, the
optical properties of the more important semi-transparent aluminium films
overcoated with MgF2 have been computed. This investigation was con-
sidered to be important for several reasons:-
1) To obtain an indication of accuracy required for the control of
the MgF2 layer thickness in order to obtain close to optimum performance.
2) To determine for a particular film combination the wavelength
region over which there is a reflectance enhancement compared with single
aluminium films.
3) To serve as a comparison with experimental data which will be
discussed in Chapter 6.
The calculation of the optical properties of the double layer films
is not a particularly difficult problem but one which is extremely
lengthy. For the present work suitable programmes were devised for the
Elliot 803 computer which was used for all the following calculations.

79
4.2. The Absolute Phase Change on ReflectiGr.
4.2.1 The boundary Between Two Non-Absorbing Media.
Fresnel's equations form the basis for relating values of reflectance,
transmittance and phase change to optical constants of a material.
For a plane wave incident normally on an interface between two di-
electric media having refractive indices of ao and n1, then the Presnel
amplitude reflection coefficient (r) for the electric vector (E) is (for
the wave incident from the medium no)
r = Er Ei
= no - n
1 no n1 4.1.
For n17.3.no , r is negative and the reflected electric vector Er will be
180° out of phase with the incident vector Ei.
4.2.2. The Boundary Between Absorbing and Non-Absorbing Media.
Equation 4.1. holds for the boundary between a dielectric medium
(index no) and an absorbing medium n1
if the index of the absorbing medium
is allowed to be complex. If the refractive index of the absorbing
material is written as
n1 • n1 - ik1
where k1 represents the attentuation of the wave per vacuum
wavelength 1 may be written in other forms, see e.g. Heavens 1955),
equation 4.1. then becomes.
r = Er Ei
• no - n1 no
4- ci 1

which on rationalisation is
r = o2
- n1 - k:2 2i no(..)
( no n1)2 k12
Pe1-16
60.
4.2.
where p 1-7 and I are real.
The tangent of the phase angle between Er and Ei is the ratio of the
imaginary to the real part of equation 4.2. and is given by
tan = 2 no k1 4.3. 2 2
no - ni - kl2
The angle' is defined as the absolute phase charge on reflection.
rj
A test for whether or not/ is the absolute phase chang e is to
consider the limiting case of k-> o. In this limit
tan 4,1
for no> ; tan 0 is positive ie. —4 o
L47 no < n ; tan fi is negative i r i % .e.
( 4
The above equation for / is for an optically 'thick' absorbing
(e.g. metallic ) film. In the case of an optically ithintmetallic film,
the effects of multiple reflections must be considered and a new value for
As obtained which is extremely lengthy in form (see e.g. Bennett 1964).
For the present work alminium films of thickness 200 to 300 i have been
used. For films of this thickness and in the wavelength region con-
sidered the variation of the phase change with film thickness is small

(Schroeder 1962) arid the value oft, gien . ,quation 4.3. is satisfactorgo-
deterrfnLn-; the ug2 layoL, thicknc,sE. for: the interferometer
coatings and interferepoe filters.
4.3. The Aluminium - Mg 2 Film Combination - Conditions for Maximum and
111", 2eflectivit.
The type of coating considered is an aluminium film (index n2 =
n2 - ik2) of thickness t deposited onto a thick non-absorbing substrate of
index n3' the aluminium film being overcoated with a MgP2 layer (assumed
non-absorbing) of index ni and thickness d. However, in order to simplify
the problem of obtaining an expression for the thickness of MgF2 layer
required to give a maximum reflectivity, the aluminium film will be firstly
considered as opaque. Later in this chapter computed values will be
given for the practical problem under consideration which is defined by
the parameters given above.
If the light is normally incident on the aluminium - MgF2 combination
from a medium of index no(considered throughout as vacuum), then the
Fresnel amplitude reflection coefficient for the vacuum-dielectric boundary
is simply
r1 • no - ni = Eri
no + n1 Ei
Thus, at this boundary, the electric vector of the reflected wave
suffers a phase change of 7 relative to that of the incident wave.
Similarly, the Fresnel coefficient for the MgF2 - aluminium boundary
is given by
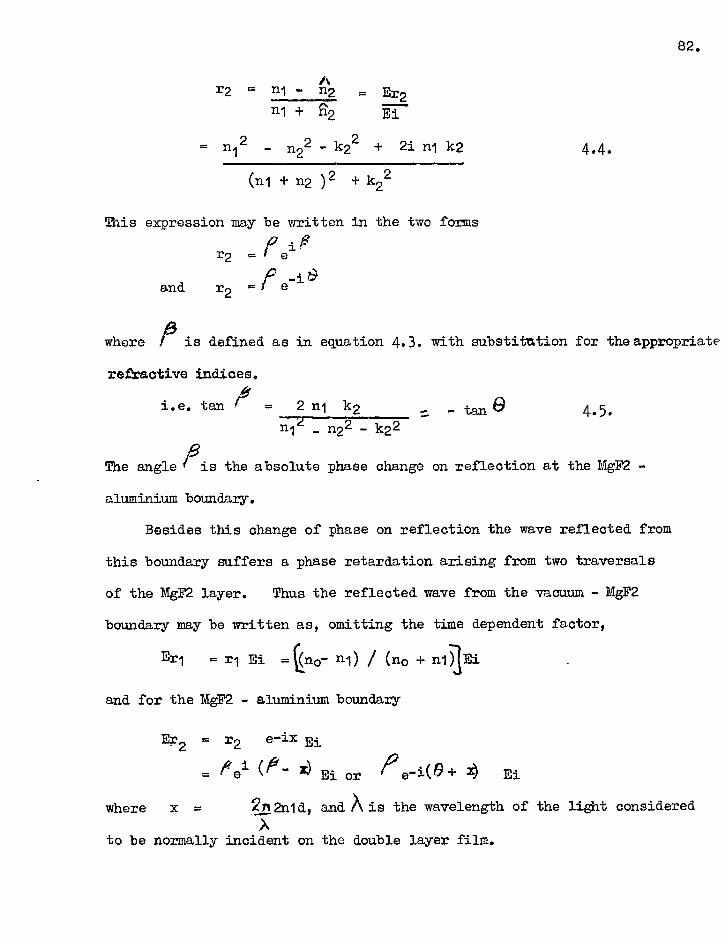
r2 = n1 - n2 = Erg n1 + n2 Ei
2i ni k2 _ n12 n22 k22 4. - -
(ni + n2 )2 + k22
This expression may be written in the two forms
r2 = Pe
and r2 = e f
where P is defined as in equation 4.3. with substitution for the appropriate refractive indices.
i.e. tan P = 2 nl k2 - tan e 4.5. 111 - n22 - k22
The angle is the absolute phase change on reflection at the MgF2 -
aluminium boundary.
Besides this change of phase on reflection the wave reflected from
this boundary suffers a phase retardation arising from two traversals
of the MgF2 layer. Thus the reflected wave from the vacuum - MgF2
boundary may be written as, omitting the time dependent factor,
Er1 = r1 Ei Ano- 111) / (no + n1T1Ei
and for the MgF2 - aluminium boundary
Erg r2 e -ix Ei
fief (fr- 3 Ei or =+ Ei
where x = 2712n1d, and. is the wavelength of the light considered
to be normally incident on the double layer film.
82.
4.4.

83.
An expression for the complex Fresnel amplitude coefficient for the
film combination can be derived by considering multiple reflections at the
two above boundaries. Such an expression is given in the literature
(see e.g.Heavens (1955); Vasicek (1960) Born and Wolf (1964) ) and is
4 c,t• -
2 e- • rl r2 e -ix
1 4.7.
The equation 4.7. can be used for the present application if we write r2 in its complex form either as r2 =
a. .10 e or r2 e` It It is •
sometimes more convenient to consider r2 in the second form since the
phase change (0) on reflection acts in the same manner as an increase
in the thickness of the MgF2 layer. Substituting for r2 then gives
p
+ a e -i(x e ) 4.8. 1 + i(x +6i )
The reflectivity of the combination is obtained by multiplying equation
4.8. by the conjugate complex expression r e-irIC and is
r12
+ 2 + 2 r1 / Cos (x+0 )
4.9. 1 + r1
2 /9 2 2 r1, Cos(x + )
Pi However, the use of the more convenient expression r2 = e-lam
has
introduced an ambiguity arising from the fact that 9 is not the absolute
phase change on reflection. This can be seen from equation 4.5. since:- when k2 710- o: tan&
o
but for nini , tan `j is positive and 6 o.
re Ti
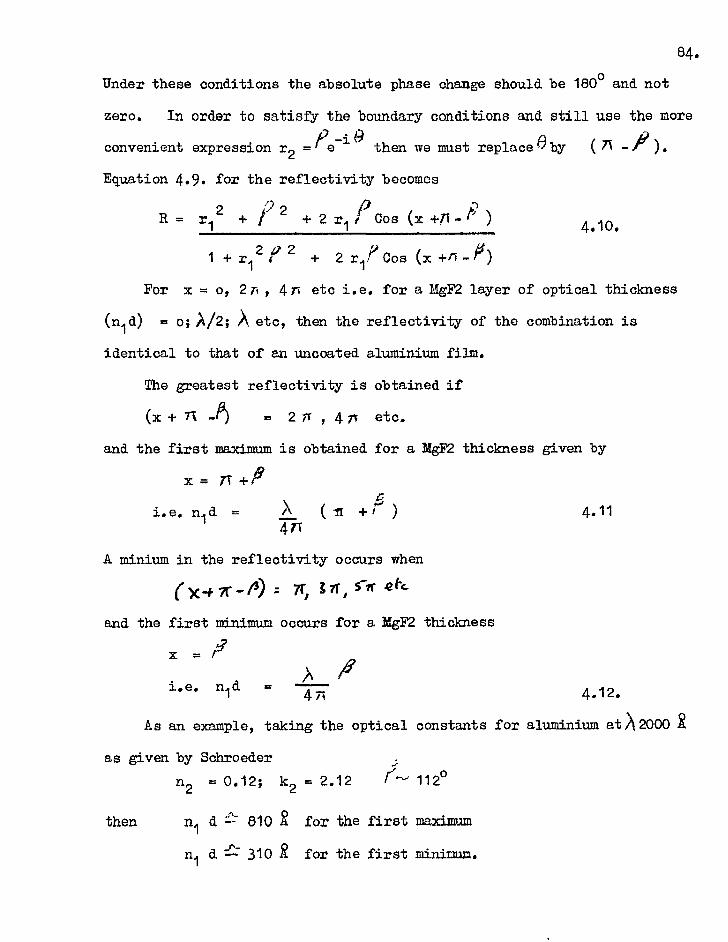
A fl x
i.e. n1d = 4 71 4.12.
84. Under these conditions the absolute phase change should be 180° and not
zero. In order to satisfy the boundary conditions and still use the more
convenient expression r2 =Pe-4° then we must replaceeby (71 -?).
Equation 4.9. for the reflectivity becomes
R = r12 + 2 + 2 r1 PCos (x +TT- I - ) 4.10.
1 + r124° 2 + 2 r1 ?Cos (x +/-1 -#)
For x = o, 471 etc i.e. for a MgF2 layer of optical thickness
(nid) = o; A/2; Aetc, then the reflectivity of the combination is
identical to that of an uncoated aluminium film.
The greatest reflectivity is obtained if
(x + TT -f) = 2 ir , 4 n etc.
and the first maximum is obtained for a MgF2 thickness given by
x= TT +
i.e. n1d = X ( -fr + 1 ) 4.11 4,71
A minium in the reflectivity occurs when
x 7t. - /3) = 71 lir , 5-71. Fc
and the first minimum occurs for a MgF2 thickness
As an example, taking the optical constants for aluminium at)\2000 X
as given by Schroeder ...7- n2 = 0.12; k2 = 2.12
I"— 112°
then n1 d '21 810 R for the first maximum
n1 d -217 310 R for the first minimum.

85
The values of maximum and minimum reflectivity for the film combinations
are obtained from equation 4.10 and are simply
i
R max = r1 i)-!2 /
1
and R min = 11'1 _ /, 2
1
The equation 4.10. for the reflectance of an absorbing film overcoated
with a dielectric layer of any optical thickness is unambiguous since it
involves only the absolute phase change on reflection strictly defined in
equations 4.3. and 4.5. and the Fresnel amplitude coefficients defined in
equations 4.1. and 4.4.
4.4. The Method used for Computing Optical Properties.
Two main problems have been considered.
1) The properties of a thin absorbing film deposited onto a thick non-
absorbing substrate e.g. an aluminium film on a 'Spectrosill substrate.
Values of R and T have been calculated for different thicknesPof aluminium
at various wavelengths.
2) The properties of a thin absorbing film overcoated with a non-absorbing
layer again deposited onto a thick non-absorbing substrate.
In both cases calculations have been limited to radiation at normal
incidence.
The method adopted for calculating R and T is the matrix method which
uses the fact that there is a linear relationship between the Fresnel
amplitude reflection and transmission coefficients for the electric vectors

86.
in successive layers of a multilayer film combination. Heavens (1955)
has discussed in detail this method for calculating the optical properties
of multilayer films and its application to specific problems similar to
the type considered in the present work.
Film properties have been calculated from values of optical constants
and film thicknesses by devising suitable programmes for an Elliot 803
computor. Programmes have been kept as simple as possible by introducing
the appropriate optical constants for a given wavelength in the data input.
Film properties are then calculated for a range of film thickness
appropriate to the present investigation. The actual programmes used
need not be described.
4.5. The Optical Constants used for Computation of Film Properties.
The calculation of the optical properties of single films and of
different film combinations is dependent on a knowledge of the optical
constants of the individual materials. In the case of evaporated alum-
inium films, the optical constants have not been experimentally determined
in any detail for the wavelength region 1000 to 2200 R . The optical
constants (n1k) for aluminium films deposited under 'optimum' conditions
(see Chapter 3) have been determined by Hass and Waylonis (1961) for
wavelengths down to 2200 R. Optical constants were derived from measure-
ments of reflectance, transmittance and film thickness using equations
relating those parameters given by Hadley and Dennison (1947). No
allowance was made for the thin oxide layer formed on the aluminium
films in deriving these optical constants.

87.
An extrapolation of the optical constants of aluminium to wavelengths
shorter than 2200 R has been carried out in the same manner as described by Schroeder (1962). Extrapolations were made using the Cauchy Equations
, -2 n = Bl + B2 A + B3 -4
k = Cl + C2 /1-2 + C3 A -4
where the complex refractive index for an aluminium film is expressed as
n = n ik. The coefficients in these equations were determined by
applying a least - squares fitting to the experimental data of Hass and
Waylonis.
The optical constants for MgF2 have been taken from experimental data
given by Hall (1957), Fabre (1964) and Fabre, Romand and Vodar (1964).
For these calculations the k value in the complex refraztfore index has
been taken as zero, since from the above experimental data k ?al' 0.02 for
A1600 R and decreases at longer wavelengths. For calculations of the effect of a MgF2 layer on an opaque aluminium film at X1216 ., Cranfield, Hass and Waylonis (1966) have taken a value of k for MgF2 = 0.03. This
value of k is lower than the value reported by Fabre et.al. The cal-
culated effect of a surface film of n = 1.6 and values of k ranging from
0 to 0.1 on the reflectance of aluminium at 1216 R have also been given
by Cranfield et.al.
For the purpose of computing the effect of an oxide layer on the
optical properties of an aluminium film,the oxide has been taken as
non-absorbing of index 1.85. This of course is only an approximate
representation of an oxide layer in the wavelength region considered

88.
(1800 to 2800 .R). The optical constants for A1203 and sapphire are
similar (Hass and Tousey 1959) and values of n for sapphire range from
1.81 (\3000 R) to 1.83 ()\2537 R ) (Malitson, Murphy and Rodney 1958).
Optical properties of A1203 given by Bauple et.al. (1950) for the wave-
length region 1400 to 2000 1 indicate that at 1900 R n = 1.86 but the
absorption begins to rapidly increase at shorter wavelengths. Hass,
Hunter and Tousey (1957) for calculation purposes have taken the oxide to
be non-absorbing of index 1.85 at 2200 R.
The main reason for this particular calculation in the present case
was to determine whether or not a surface oxide layer might account for
the differences in optical properties of aluminium films prepared under
two different evaporation conditions (Chapters 5 and 6).
4.6. Results of Computed Film Properties.
4.6.1. Single Aluminium Films.
The dependence of reflectance (R) and transmittance (T) on the thick-
ness of an aluminium film deposited onto a substrate of refractive index..1.55,
is shown in figure 4.1. for the wavelengths 1600, 1800 and 2200 R. The
wavelength 2200 R corresponds to the lower wavelength limit of the ex-
perimental data given by Hass and Waylonis. According to these authors
there is excellent agreement between computed and directly measured film
properties for film thicknesses greater than 100 R.
At 2200 R, the dependence of (R + T) on film thickness is small.
For example, (R + T) = 91.E for a film 350 R thick and 92.070 for a film
125 R thick. 'With decreasing wavelength however, the dependence of (R + T)

89.
on film thickness becomes greater and at 1600 R calculated values of (R + T) for the two thicknesses 350 and 125 R are 84.4% and 89.8% res-pectively.
The variation of optical properties with wavelength is shown in
figure 4.2. for films of thickness 175 and 275 R. This figure shows the
decreasing values of R and (R + T) with shorter wavelengths. These
results shown in figures 4.1. and 4.2. will be compared with experimental
results obtained for wavelengths down to 1800 R and will be discussed more fully in Chapter 6.
Values of optical constants used for these calculations are given in
Table 4.1.
4.6.2. The Aluminium - Me2 Combination.
The design of a suitable programme for calculating the optical
properties of the aluminium - MgF2 film combination involved two main
considerations.
1) The variation of optical properties with the thickness of both the
aluminium and the MgF2 layers.
2) The wavelength dependence of the optical properties of a particular
film combination.
The data used in this computation is given in table 4.1, the refractive
index of the substrate being taken as 1.55.
Figure 4.3. shows for the wavelengths 1800 and 2500 . the values of R and (R + T) for an aluminium film 275 2 thick overcoated with different
thicknesses of MgF2. The difference between maximum and minimum

80 4▪ -
ce ▪ 60
40
100 Figure 41
K 80 --- - ... I-. VI •••'" / , •
\ •
60 \\. / • `\ / / _ A 220o A
V • — — — A !BOOR
N -•- A i600R
40 \ . \\ \-
20
100 200 300 400 500 600 tAt..
100 Figure 42 (111-1)
t ,275A Ar
20 t/75/1
= t:27.4)
0 i I i l L l ------r
i
1600 1700 1800 1900 2000 2100 2200 2300 A A
90.
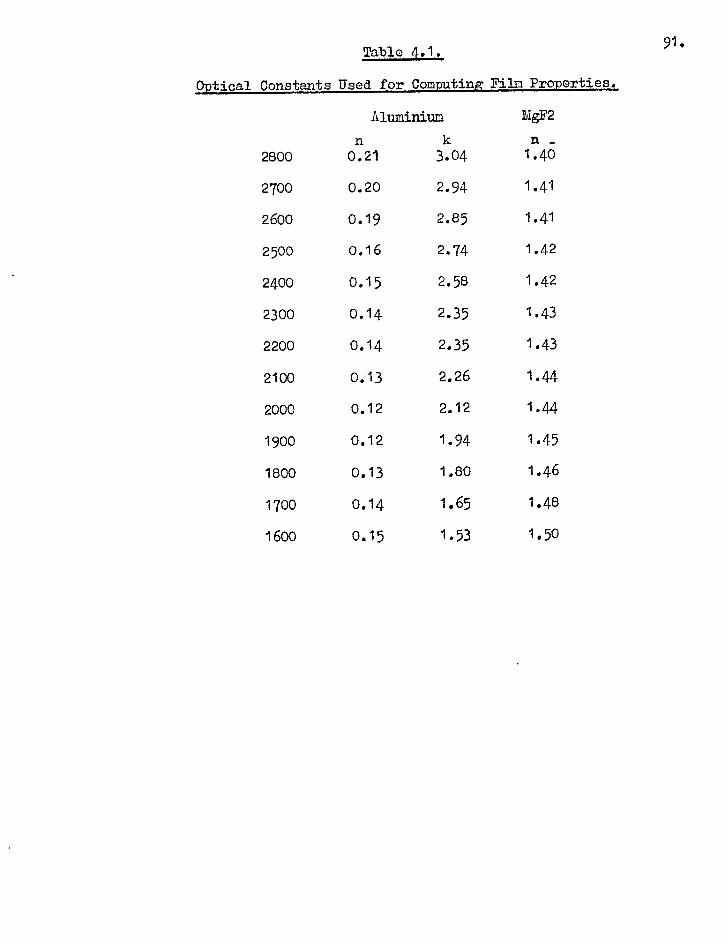
91. Table 4.1.
Optical Constants Used for Computing Film Properties.
Aluminium n k
NgF2 n _
2800 0.21 3.04 1.40
2700 0.20 2.94 1.41
2600 0.19 2.85 1.41
2500 0.16 2.74 1.42
2400 0.15 2.58 1.42
2300 0.14 2.35 1.43
2200 0.14 2.35 1.43
2100 0.13 2.26 1.44
2000 0.12 2.12 1.44
1900 0.12 1.94 1.45
1800 0.13 1.80 1.46
1700 0.14 1.65 1.48
1600 0.15 1.53 1.50

•
S. • / • •
S.
/
80 • •
70 -
/ /
• • • • •
• • • • -
••••
A 2500 A
• /
/ • • • • •
1800 A
60 ' I I I j II
0 100 200 300 400 500 600 700 800 900 1000
3 Thickness ( A)

93.
reflectivity becomes greater as the wavelength decreases as also does
the reflectance enhancement of the double layer film combination compared
with the single aluminium film.
For a MgF2 film thickness corresponding to a maximum reflectivity
there is also an increase in the value of (R + T) compared with that of
the single aluminium film. Computed values showing the advantage of the
double layer film over single aluminium films are summarised in Table 4.2.
in which:-
a) t max and t min are the MgF2 thicknesses which give maximum and minimum
reflectivity at the given wavelength; tAL = 275 R.
b) RAL, T)AL are appropriate values for a single aluminium film of
the same thickness.
c) R max and R min are values of reflectivity for the double layer film
corresponding to MgF2 thicknesses of t max and t min.
d) (R + T) max and (11 + T) min are values of (11 + T) for the double layer
film corresponding to t malt' and t min.
The superiority of double layer films over single films increases
with decreasing wavelength. Computed film properties show little variation
in (11 + T) as the aluminium film thickness is varied in the range 200 to
350 R.
Of particular interest is the wavelength variation of the optical
properties of a film which has been designed to give a reflectance
maximum at a particular wavelength. This variation is shown in figure 4.4.
for an aluminium film 275 R thick coated with MgF2 whose thickness has
been chosen to give a maximum reflectivity at the three wavelengths

94.
R t max
2 t min
R RAL%
TABLE 4.2.
R min% (R+T)maX% (111-T)min% (R+T)At% R m8►
2800 860 360 87.6 91.6 88.6 78.9 92.3 85.8
2700 820 340 87.4 91.6 88.5 78.6 92.3 85.7
2600 780 32o 87.4 91.6 88.5 78.5 92.4 85.7
2500 740 300 87.9 92.4 89.1 79.3 93.2 87.0
2400 700 280 87.0 92.2 88.4 78.1 93.o 86.9
2300 660 260 86.4 91.7 88.0 77.0 92.7 86.0
2200 620 240 85.8 91.6 87.6 76.4 92.7 86.1
2100 600 220 85.8 91.7 87,8 76.4 92.9 86.3
2000 560 200 85.0 91.1 a7.3 75.6 92.9 86.4
1900 520 190 82.6 90.6 85.6 72.1 92.2 84.9
1800 480 160 80.2 89.1 83.9 69.0 91.1 82.9
1700 440 150 77.1 87.1 82.0 64.6 89.9 80.0
1600 400 120 74.7 85.3 80.7 62.0 88.8 77.9

95.
1600, 1800 and 1900 R. The different wavelength variation of the
properties of the Al-MgF2 double layers compared with the single aluminium
film is clearly evident.
From the practical stand-point, the computed results show that the
demands on the control of the MgF2 thickness are not too critical (Figure
4.3.). For example, at a wavelength of 1800 R an error in MeF2 thickness
of t 40 R from the optimum thickness of 480 2 will reduce R by 0.3% and
(R + T) by 0.2%. However, this same error in thickness has a greater
influence on the optical properties at longer wavelengths as seen from
figure 4.3.
A comparison between these computed results and direct)ey measured
film properties is made in Chapter 6.
4.6.3. The Calculated Effect of a Surface Oxide Layer on the Properties
of an Aluminium Film.
It is well known that freshly evaporated aluminium films become
rapidly oxidised even when maintained at ambient pressures <106
Torr
(Eley and Wilkinson, 1960 Madden, Cranfield and Hass 1963). Hass and
Tousey (1959) have shown that the deterioration in reflectance of exposed,
opaque films of aluminium in the vacuum ultraviolet and their change in
reflectance with time can be largely attributed to the growth of a thin
surface oxide layer. The thickness of oxide and its rate of growth are
much reduced if films are prepared at high deposition rates and at low
evaporation pressures (see Chapter 3.).
In the present investigation it has been found that the optical

70 I I 1 I 1 I 1 I 1 I i I 2000
T% 0
>‘ii 2800 2400
90
R+T ..... .......
_ Figure 4.4 AL
".... ss.
.... ....
......." ......
.--. ..... cx,
..„ .... -.... -....
---.... ......
z
0 I 1600 2000 2400 2800
1600
96.
1 1 i I__I I 1 I , I I

97.
properties of the exposed films were very much dependent on the vacuum
conditions of preparation even when prepared at deposition rates of 100
to 150 R sec-1 (Chapter 6). Also, the change in optical properties with
time has been found to be greater for films prepared under Ipoorerfevapor-
ation conditions. On the other hand, the properties of the aluminium -
11g2 double layers do not appear to be so critically dependent on the
two different evaporation conditions which have been used.
At first sight these observations appear consistent with the fact that
the single aluminium films produced under the poorer evaporation conditions
grow a thicker oxide layer upon exposure to the atmosphere. 'Whilst this
is undoubtedly true it is important to establish whether or not an in-
creased growth of oxide can account completely for the difference in film
properties. For this reason, calculations have been made of the effect
of different thicknesses of surface layer of index 1.85 (see Section 4.5.)
on the properties of an aluminium film having optical constants as given
in table 4.1. Such a calculation is complicated by the fact that when
there is a growth of surface oxide filnythe thickness of the aluminium
film is reduced.
In order to obtain an indication of the effect of this oxide layer,
values of R and T have been calculated for different aluminium and'oxide
film thicknesses. Calculated values of R and T for an aluminium film
275 R thickness are shown in Figure 4.5. These results clearly show
the effect of an increase in thickness of a non-absorbing layer on the
properties of a semi-transparent film, even if the aluminium film thickness
remained unchanged. In fact, the changes in R and T will be greater than

98.
92
(R+T) X 2800 R•
(R+T) x 2000 A
86 R, x 2800
x 1800 R
R, a 2000R
R, 1, 1§00 A
70 1 1 I L.. 0 10 20 30 40 50
Thickness(,)
14 T, 1800 A
T, 2000 R 0,0 8 I-
6
80
T, 2800 R
2
0 0
10 20 30 40 50 Thickness(R)
---, • igur t-,,,
90
88
78
76
74
72
12
10
4

those shown in figure 4.5. because of the reduction in the thickness of
aluminium during oxidation. This is discussed in greater detail in
Chapter 6 where a comparison is made between computed and experimental
data for exposed aluminium films.
99.
100.
CHAPTER 5.
THE APPARATUS AND METHOD FOR PRODUCING INTER1MOMETER
COATINGS AND INTERFERMCE FILTERS FOR THE FAR ULTRAVIOLET.
5.1. Introduction.
In Chapter 3 the evaporation conditions necessary for producing high
reflectivity aluminium films for the far and vacuum ultraviolet were discussed
and it was shown that high optical quality films could only be produced
if fast evaporation rates and low evaporation pressures were used. This
led to the difficulty in the present work of depositing aluminium films
at the fast rates required and yet controlling the film thickness to give
a generally required transmission of a few per cent in the far ultraviolet.
The requirements of high deposition rate and reproducobility in film
thickness are too demanding for manual operation and as a consequence, it
was found necessary to design a system whereby the thickness of the
aluminium films could be automatically controlled during deposition.
A further requirement was for the control of the thickness of the
dielectric layer used to overcoat the aluminium in the case of
reflectance increasing coatings and for the control of the spacer layer
thickness of the P.P. type interference filters. In this case however,
the rate of evaporation need not be very great and the film thickness
can be readily controlled by manual operation. The overall requirements
for a film thickness monitoring and control system for the present work
may be summarised as follows:-

101.
1) Deposition of Aluminium films to thicknesses generally in the
region 200 - 400 . controlled to an accuracy within t 30 R at a deposition rate of about 100 Risec.
2) Deposition of dielectric films (MgF2) to a chosen thickness in
the range 400 - 1000.E generally within an accuracy t 20 R. Rate of
deposition not necessarily high.
3) Delay time between completion of the aluminium evaporation and
commencement of dielectric evaporation to be kept as short as possible.
4) Monitoring system should be insensitive to the light produced
by the heater vapour source filaments.
The design and construction of a control unit which has been develop-
ed to meet as simply as possible the requirements itemised above is
described in section 5.3.
The importance of low evaporation pressure on the optical properties
of aluminium films in the far and vacuum ultraviolet was also shown in
Chapter 3. The development of ultra-high vacuum apparatus has made
it possible to construct evaporation plants using getter ion pumps or
high speed diffusion pumps with which pressures below 10-9 Torr can be
obtained (Holland 1960). In order to attain these low pressures the
apparatus must be baked to about 400 °C in order to lower the desorption
rate and consequently, the cost of such a plant can be extremely high
for a system of any reasonable size and complexity.
At the other end of the scale it is relatively simple to construct
an unbakeable, demountable coating plant at low cost which uses elastomer
gaskets for sealing and with which pressures in the order 10-5 Torr can

102.
be obtained. It is the pressure region between 10-5 to l0-9Torr which is
inadequately covered by present coating plant design. This, however,
is an important pressure region since it permits an improvement in the
purity of deposited films with out involving the high cost and numerous
difficulties associated with producing a coating plant capable of operating
at pressures below 109 Torr.
Mach of the present coating work has been carried out using a glass
demountable system giving an evaporation pressure of about 10 5 Tcrr.
This plant is not particularly novel in its construction and is only
described briefly. During the courseof the present work it was con-
sidered necessary to improve the evaporation conditions in an attempt to
improve the quality of the transmitting aluminium films, upon which the
performance of the F.P. interferometer and F.P. filters are so critically
dependent. In section 5.2.2. a relatively simple and comparatively low
cost evaporation plant is described which is designed to operate in the
pressure region 10-6 to 10-8 Torr. With mild baking, evaporation pressures
towards the lower end of this range can be obtained.
5.2. The Evaporation Plants.
5.2.1. Unbakeable Glass Demountable System.
The general outline of the vacuum system is shown schematically in
figure 5.1. The coating vessel was evacuated by a mercury diffusion
pump ( Leybold Quick 100 ) and an air ballasted rotary pump (Edwards
2SC 50 B). A mecury rather than an oil diffusion pump was used since
vapour emerging from the nozzelsO_ of an oil pump condenses in the water

103
cooled wall of the pump body where it forms a film. In time, oil may
creep along the inside metal surfaces of the system into the vacuum
chamber and oil molecules evaporating from this film will form part of
the residual gas atmosphere. 'Teflon' creep barriers which do not
become wetted by oil can now reduce considerably the effect of oil
creepage. However, for the present work it was decided that possible
hydrocarbon contamination should be avoided wherever possible.
The diffusion pump having a a" throat and a nominal pumping speed
of 100 litres/sec at 10-4 Torr, was connected to the chamber base plate
through a 'butterfly valve' and a short pumping stem, neoprene '0' rings
providing the appropriate vacuum seals.
A Pirani gauge head (Edwards type 145B) was mounted both in the
backing line and immediately below the coating chamber. The latter
gauge enabled pressure measurements to be made during the discharge
cleaning process whilst low pressure measurements were made with an
ionisation gauge also mounted in the pumping stem immediately below the
coating chamber.
The toughened glass base plate 14" diam, -le' thick had provision for
three copper electrodes (4 " diam) which were connected to the base
plate as shown in figure 5.2.(a). The chamber consisted of a toughened
glass cylinder seated into 'Duralium' rings at either end using 'Araldite'
both for mechanical and vacuum seal. Bach ring was grooved to take
a 4E" tot ring (fig.5.2.b.). A toughened glass lid completed the
chamber.
With this system an evaporation pressure of between 5 x 10⁻⁶ and 10-5
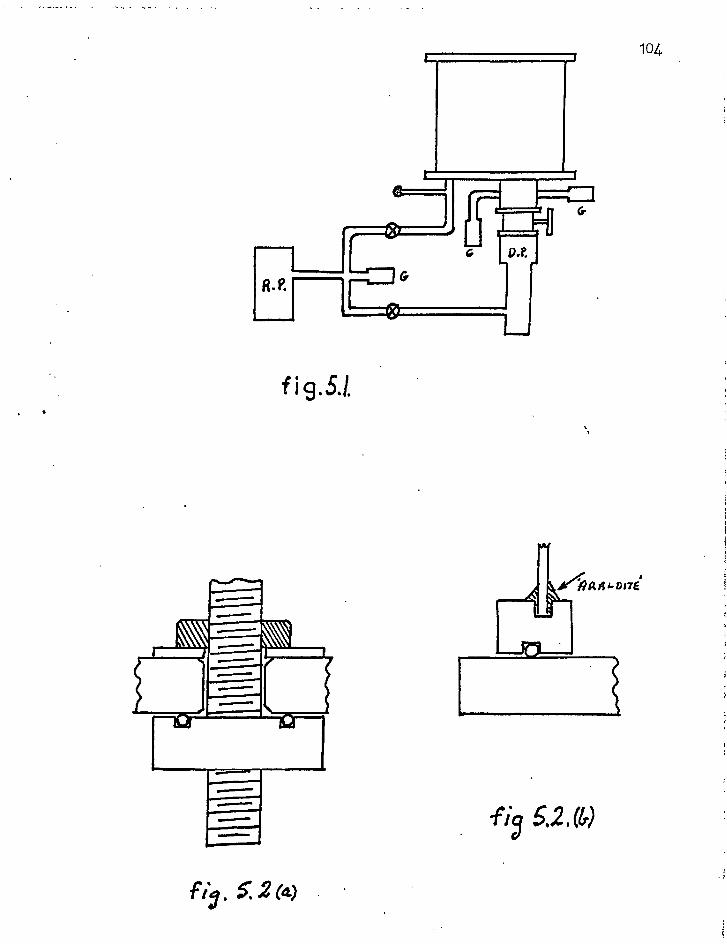
R.P.
104
5.2.(0

105.
Torr could be obtained. In the absence of metal parts in the vacuum
chamber the ultimate pressure recorded was 10-6 Torr.
5.2.2. Bakeable Metal Demountable System.
A lower working pressure can be attained either by reducing the
desorption rate from the vessel walls, gaskets etc. or by tolerating
this outgassing and using faster pumping speeds. If however, too much
reliance is placed on pumping speed then the film substrate can be
exposed to molecular beams issuing from the gaskets and vessel walls,
since the pressure inside the vessel is unlikely to be uniform. Thus,
to reduce substrate contamination and the absorption of gases by a growing
film it is necessary to keep the desorption rate to low values and not
to rely exclusively on fast pumping (Holland and Bateman 1962).
For a vacuum system of large size and of fairly high complexity,
for example where several power inputs are required into the coating
chamber then metal rather than glass is to be preferred because of its
greater robustness. Stainless steel has a low outgasing rate and is
ideally suited to general vacuum use (Flecken and Miler 1962). On the
basis of the above considerations an evaporation plant has been constructed
in which the components and materials have been chosen for their low
outgassing properties whilst bearing in mind .3.se of assembly and general
versatility of use. The plant to be described was constructed by
Edwards High Vacuum Ltd. according to the design of Nr.N.Angel(Bdwards)
and the author.

106.
Coating Chamber.
The stainless steel chamber, shown in figure 5.3, has an internal
diameter of 12" and an internal height of 15". It is basically
constructed from three parts, a cylinder 48, thick, a top plate 1"
thick and a lower ring 14" thick. These components are sealed together
by argon aro welds. Viewing ports are mounted on both the top and the
side of the chamber, the windows being either of fused silica (Spectrosil
B) or toughened glass (-1--" thick). A vacuum seal is made by forming
an overlapping loop of indium wire (0.5 ram diam), which is planed between
the window and the stainless steel component. A flange with eight
fixing screws for even compression holds the window in place and allows
the indium wire to be compressed sufficiently to obtain a vacuum seal.
The seal between base plate and chamber is the only one which is
required to be broken in order to gain access to the chamber. This seal
is a Viton '0' ring (bakeable to 20000) which seats in a groove in the
lower ring of the chamber as in figure 5.2.(b). Although a metal
seal is to be preferred because of its lower outgassing rate the advantage
of the greater verstitility of the Viton seal for gaining access to the
chamber outweighs the disedvantage of slightly greater outgassing rate.
Moreover, provided care is taken to ensure that only small areas of
Viton are exposed then the problem need not be serious. Also, the effect
of outgacsing from this seal can be reduced still further by the use of
a liquid nitrogen cooled trap inside the vacuum chamber as discussed in
the following section.
In order to allow a controlled leak into the chamber for control of

107
the discharge cleaning pressure a needle valve (Edwards type L B-1)
is connected to the chamber through a 6" long, e diam tube. The
purpose of this tube is to reduce the outgassing rate from the valve
which cannot be baked much above 60°C.
The Base Plate and Accessories.
The arrangement of the stainless steel baseplate (132" diam, i" thick)
is shown in figure 5.4. Seven electrodes of the type shown in figure 5.5.
are fixed to the base plate. Also mounted on the underside of the base-
plate is a window to enable light entry for film thickness monitoring
and an ionisation gauge head (Milliard I 0G 12) for low pressure measure-
ments. All of these components are held in clamping flanges and each
vacuum seal between componkent and baseplate is of indium.
The Meissner liquid nitrogen trap made of diem. copper tubing
is mounted to the upper side of the baseplate using a Viton gasket for
vacuum seal. This trnp is roughly circular in form and is arranged to
be in close proximity to the Viton 'o' ring seal between chamber and
baseplate. (fig.5.4.) The purpose of this trap (Deissner 1960) is
to condense vapours, particularly those of water and hydrocarbon, which
then have a negligible vapour pressure at the trap temperature. A further
function in the present case is to trap mercury atoms which may back
stream beyond the cold trap of the diffusion pump into the chamber.
This is acheived by the copper disc brazed to the Meissner coil (fig.5.4•)
which is arranged to be just above the pumping part in the base plate.
Typically, a lowering of the chamber pressure by almost an order of
magnitude (in the pressure region 10-5 to 10-7 Torr) is obtained when

14. .tea"finn
40.1111111c: f
fi3 5.4.
0=3 0=1
fig 5.5.
=7:2 7777777W2
t-
ig. 5.3

109.
the trap is cooled to liquid nitrogen temperature.
Connecting the diffusion pump to the baseplate is a stainless steel
pumping stem 7" long, a" internal diameter which is welded to the base-
plate, the seal between the- pump and the stem being a Viton '0' ring.
The stem has provision for mounting a Pirani gauge head in order that
pressure measurements can be made for the discharge cleaning process.
In the present system the 'butterfly' valve between diffusion pump
and coating chamber (as in fig.5.1.) has been dispensed with since this
valve cannot be baked. Consequently, the chamber is initially evacuated
by pumping directly through the diffusion pump and the by-pass(roughing
out) system shown in figure 5.1. is not incorporated in the present
design.
A further addition, not shown in figure 5.1, is the inclusion of
a liquid nitrogen trap mounted in the pumping line between the rotary and
diffusion pumps. This acts as a trap for water vapour and also prevents
back streaming of oil molecules from the rotary pump into the high
vacuum line. An isolation valve is placed between this cold trap and
the diffusion pump. This is closed at the end of the pumping cycle so
that, as the cold trap is raised to ambient temperature the released
vapours do not pass into the high vacuum line and the coating chamber.
5.2.3. The Pumping Performance.
In the absence of any metal parts inside the chamber the chamber
pressure falls to approxin]ately 2 x 10⁻⁶
Torr in 45 mine. Continued
pumping for sevQal hours reduces the pressure by only a small degree

110.
and the ultimate pressure reached is about 10-6 Torr. A mild bake of
the entire system above the liquid nitrogen trap of the diffusion pump
(up to a temperature of about 11000) causes the pressure to increase by
an order of magnitude and then to fall slowly. On coolinglthe pressure
continues to fall reaching about 7 x 10⁻⁸ Torr at room temperature. Liquid nitrogen circulation through the Meissner coil gives a further
lowering of pressure and when the trap temperature reaches liquid nitrogen
temperature, the final steady pressure obtained is about 10-8 Torr.
The work holder discharge cleaning unit, electrodes etc. introduce
a considerable volume of outgassing parts to the coating chamber and
there is a corresponding deterioration in pumping performance. Typically,
a pressure of 8 x 10⁻⁶ Torr is reached prior to baking. After the baking
cycle (110 00) the chamber pressure reaches about 8 x 10⁻⁷ Torr. and falls
to the evaporation pressure of 8 - 10 x 10-8 Torr when the Meissner coil
is cooled to liquid nitrogen temperature. There is an increase in
pressure during the aluminium evaporation but the chamber pressure falls
within seconds to a pressure < 5 x 10⁻⁷ Torr.
5.2.4. The Substrate Holder and Shutter Mechanism.
A tripod system consisting of VT diam. 'Duraliuml rods screwed into
the base plate supports the H.T. discharge cleaning assembly and the
substrate holder and shutter (fig.5.6). The discharge cleaning unit
consists basically of two aluminium ring electrodes, shielded from the
vapour source, which are connected to a 4 K.V. A.C. supply. This is a
standard technique described in detail by Holland (1956).

The 11" diam. aluminium substrate holder (fig.5.7.) has provision
for two 6 cm diam. and two 4.5. cm diem. substrates, although in general
only one sample is coated at a time. Figure 5.7. also shows the monitor
plate holder with provision for eight separate open positions, The
monitor plate itself is a glass disc (6 cm. diam.) which seats in the
rotary holder. Prior to evacuation of the chamber the monitor plate holder
is wound against a circular spring and is held in an open position by
locating pins mounted on the underside of the holder. These pins engage
with the solenoid arm shown in figure 5.7. When the solenoid is
energised the monitor plate rotates through 222° and on de-energising
through a further 222" i.e. into position for the next evaporation. This
system was found to be a fast and reliable method for moving the monitor
plate from one evaporation position to the next. Speed is important
since as previously discussed the time interval between the completion
of the aluminium evaporation and the commencement of the MgF2 evaporation
must be kept as short as possible to minimise the oxidation of the
aluminium flim. This method for moving the monitor plate was developed
for the bakeable metal plant. For the previous glass vacuum system
a slower method had been used in which themonitor plate was moved from
one position to the next by means of an external magnet.
The choice of the reliable electro-mechanical method for operating
the monitor plate and shutter mechanism (described below) introduces
the problem of overcoming outgassing from the solenoid coils which are
mounted inside the vacuum chamber. Enamelled covered copper wire whose
electrical insulation 0-11 withstand baking up to 180°0 was wound round

714.5.6.
112•

a Duralium former. The coil was inserted into a close fitting glass
cylinder having a short pumping stem, and a mechanical seal made between
the coil former and glass cylinder using 'Araldite'. (Fig.5.8.). A
vacuum se-1 was established by overcoating the sealing compound with
'Torr Seal' resin (Varian Associates Inc.) which has a very low vapour
pressure and which can withstand about 12000 baking. One end of the
coil is earthed to the coil former and the other end is brought out
through the side of the glass cylinder, a vacuum seal being made as above.
Finally, the complete assembly was evctouated and baked to 100°C before
sealing off at a pressure of about 10-5 Torr. This method produced a
reliable solenoid coil of good electrical insulation and having low
outgassing properties.
Figure 5.9. shows the underside of the substrate holder and the
shutter used to intettjt the vapour stream from both the target substrates
and the monitor plate. The aluminium shutter is mounted below the
substrate holder and is able to revolve freely on a 'ball-race' bearing
shielded from the evaporation sources. The shutter is wound up against
a 4" long coiled steel spring and can be lield in an 'open' or 'closed'
position, in a similar manner to that described above, when the coil
is energised or de-energised respectively. Since the aluminium
deposition is fast (2-3 secs) then the shutter must also be fast acting.
The present design gives nine open and closed positions and with the
1 TH spring under full tension the shutter closes in 27- sec. The
shutter speed decreases with decreasing spring tension and is about
113.

FoRMEg. Sac -r (RON CaRE: ]
VAecvvit 6'0g
AC" 1.3 s.w. G.
oeaeo 6S° 00 - -
A VAcvvfri Pvtie
.- p LIRA,. vf4
Fr EivcApsui,...9-rea 5oLEN010 Fok C DArfiv6. c NAmitssg.
F 16 5:1.

115
1 TAI T5 sec after the seventh shutter position.
Duralium lead-in electrodes are used to connect the glass-metal
electrodes sealed in the chamber base plate to the vapour source fila-
ments. Because of the danger of stressing these electrodes and breaking
the glass-metal joint the 'lead-in' electrodes are made in two sections
and joined by lengths of copper braiding which relieve any stress
developed. The copper braid is shielded from the glow discharge to
prevent sputtering of the copper and possible substrate contamination.
The vapour source filaments were connected to a common earth. For
the present work, tungsten coils made from three strand 0.5 mm diam. wire
have been used for the aluminium evaporation and a molybdenum boat
(Made from 0.002" thick sheet) for the MgF2 evaporation, The merits
of different materials for vapour source filaments have been discussed
in detail by Holland (1956).
The power supply for each filament is a 10V 2509 transformer whose
input is controlled by a 'Variac'. Each filament has a separate
power supply so that the MgF2 boat can be heated whilst the aluminium
film is deposited. This reduces the delay time between evaporations.
5.3. Apparatus for Controlling Film Thickness during Deposition.
5.3.1. The Choice of Monitoring System.
Various types of apparatus have been developed for monitoring the
thickness of both metallic, and dielectric films during depositon. Where
optical properties are of importance the ideal arrangement is to monitor

116.
the reflectivity or the transmission of the sample at the wavelength
region where the film is to be used. Such methods for monitoring in the
visible and near ultraviolet regions have been described in the literature
(see e.g. Holland 19,Heavens 1955). However, the monitoring of film
thickness in the far and vacuum ultraviolet presents many technological
difficulties although for the present work it is not essential that this
method is used. In the present case, film thickness has been monitored
in the visible and related to the properties of the films in the far
ultraviolet.
Also, it is not readily possible in the present work to monitor
directly from the actual specimen required, particularly in the case of
the F.P. interference filters. With this type of filter the princip41
wavelength of the pass-band can only be readily Xdetermined once the
final metallic layer has been deposited, since this wavelength depends
not only on the thickness of the spacer layer but also on the phase change
at the metal-spacer boundary. Thus, a system was chosen in which a fresh
monitor plate was used for each deposition.
The choice between monitoring reflectivity or transmission depends
largely on the problem under consideration, although transmission
monitoring is technically easier. In the present work however, reflect-
ivity was monitored since for multiple-beam interferometry this is the
parameter which is usually required to be controlled and which determines
very largely the finesse of the F.P. etalon or the bandwidth of a P.P.
interference filter.
The choice of monitoring system finally decided on requires that a

117.
relationship be determined between the optical properties of the coated
substrate and a parameter dependent on the monitor plate reflectivity.
For the aluminium deposition the optical properties of the coated substrate
were measured in the far ultraviolet and related to a particular setting
of the input load resistance of the control unit (section 5.3.4.) For
the MgF2 layers the film thickness ou the substrate is related to a
change in reflectance of the monitor plate, which is measured during
deposition. Film thickness was measured by the Fizeau fringe technique
described by Tolansky,(1948) and was also obtained from the pass band of
interference filters.
5.3.2. The Light Source and Detectors.
Light from a tungsten filament lamp is chopped at a frequency of
1000 c/s and is partially reflected by a plain glass plate onto the
'Comparator' photomultiplier. The transmitted beam is reflected through
the base plate window to strike the monitor plate where it returned through
the same window onto the 'Monitor' photomultiplier. The angle of incidence
of the beam striking the monitor plate is approximately 2°.
The light source is a 12V 36 watt bulb which is operated from a
1ZV transformer. A constant voltage transformer provides adequate
stability in the source intensity, which is also variable by 'Variac'
control of the 12V transformer input. Light from the lamp filament
passes through a 1/32 " aperture and is then chopped by a rotating disc
having twenty equispaced circular holes. The disc is rotated at a speed
of 3000 r.p.m. to give an approximate square wave light output of 1000 c/s.

118.
The small aparture is focussed onto the cathode of the 'Monitor'
photomultiplier where the image size is about diam.
Both photomultipliers are of the type EMI 6097 C and are operated
from a stabalised high voltage supply (Philips P17 4024/01) giving a
deviation of 00.05% in output voltage for a 10% fluctuation in mains
voltage. Under operating conditions the overall voltage is IKV
representing a bleeder chain current of 1204A whilst the photocurrent
is 104 A.
The monitoring wavelength is selected by placing Kodak Wratten filters
Nos 35 and 45 immediately before each photomultiplier photo cathode. In
series, these filters isolate a wavelength region centred on 4400 R
having a bandwidth of approximately 250 R.
5.3.3. Preliminary Considerations of the Control Circuit.
Basically the control circuit consists of a valve voltmeter which
compares the input signals from the Comparator and Monitor photo,Mult-
ipliers. For a given source intensity the signal from the Monitor
depends on its variable load resistance and on the reflectance of the
monitor plate whilst the signal from the Comparator, having a fixed load
resistance, depends only on the source intensity. These signals are
compared and their difference is amplified and applied to the grid+ of a
triode which has a relay in its anode. For large differences between
these signals the relay is energised. During the aluminium deposition,
the monitor plate reflectance increases and the signal difference decreases
until a pre-determined point is reached where the relay becomes de-energised.
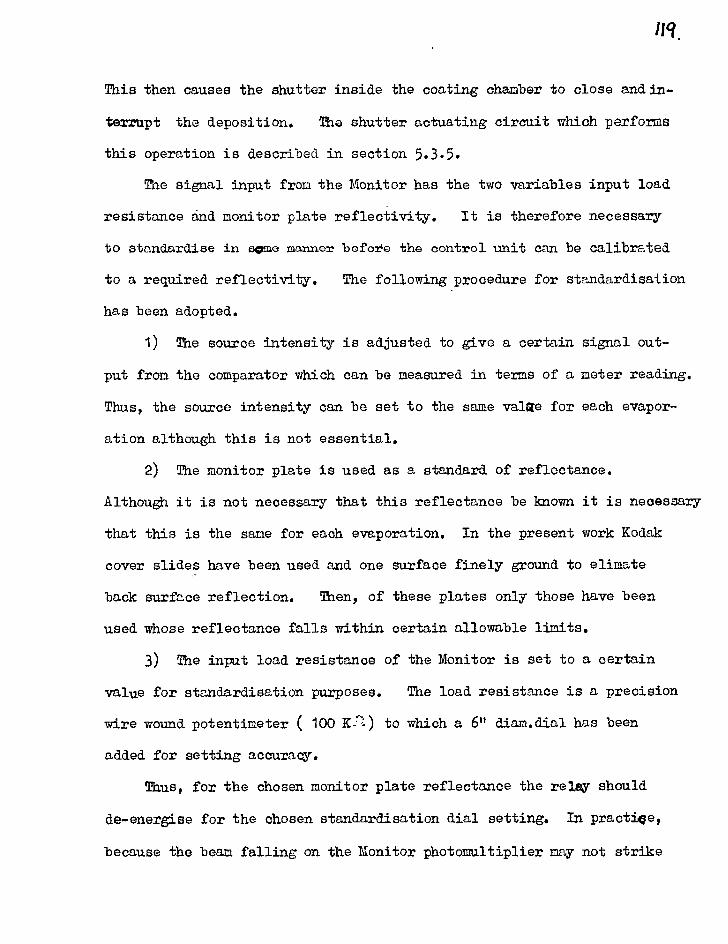
lig.
This then causes the shutter inside the coating chamber to close and in-
terrupt the deposition. The shutter actuating circuit which performs
this operation is described in section 5.3.5.
The signal input from the Monitor has the two variables input load
resistance and monitor plate reflectivity. It is therefore necessary
to standardise in some manner before the control unit can be calibrated
to a required reflectivity. The following procedure for standardisation
has been adopted.
1) The source intensity is adjusted to give a certain signal out-
put from the comparator which can be measured in terms of a meter reading.
Thus, the source intensity can be set to the same valtle for each evapor-
ation although this is not essential.
2) The monitor plate is used as a standard of reflectance.
Although it is not necessary that this reflectance be known it is necessary
that this is the same for each evaporation. In the present work Kodak
cover slides have been used and one surface finely ground to elimate
back surface reflection. Then, of these plates only those have been
used whose reflectance falls within certain allowable limits.
3) The input load resistance of the Monitor is set to a certain
value for standardisation purposes. The load resistance is a precision
wire wound potentimeter ( 100 Kn) to which a 6" diam.dial has been
added for setting accuracy.
Thus, for the chosen monitor plate reflectance the relay should
de-energise for the chosen standardisation dial setting. In practice,
because the beam falling on the Monitor photomultiplier may not strike

120.
the same area of cathode each time or because of dust on the mirrors
used to reflect the beam along its path , the relay may not de-energise
at the chosen dial setting (input resistance). This has been overcome
by passing the monitor signal through a stage with variable gain before
feeding it into the valve Voltmeter' The gain control is then altered
so that the relay de-energises at the chosen input resistance.
The standardisation therefore sets the conditions for the relay to
de-energise for a constant factor Ro ro, Ro being the reflectance of the
uncoated monitor plate and ro the input resistance (dial setting). During
the aluminium deposition the monitor plate reflectance R will increase
and it is only necessary that the input resistance r is set so that,
for a required reflectivity R, then Rr = Ro ro. When this condition
is reached the relay will de-energise and the deposition will be in-
terrupted. The required value of r (in terms of dial setting) is
determined from a calibration experiment in which the optical properties
of the coated substrate are measured.
In the case of the MgF2 deposition the method of monitoring is
simpler largely because the evaporation rate is much slower and can
be controlled manually. The reflectance of the uncoated monitor plate
is set in terms of a meter reading to fdll scale deflection by adjusting
the Monitor input resistance (dial setting). As deposition occurs then
the reflectance, which is a function of film thickness, firstly decreases
reaching a minimum when the optical thickness of the film is >A and then
increases to the uncoated value when the optical flickness 14,
being the monitoring wavelength. Thus, the thickness of the MgF2 film
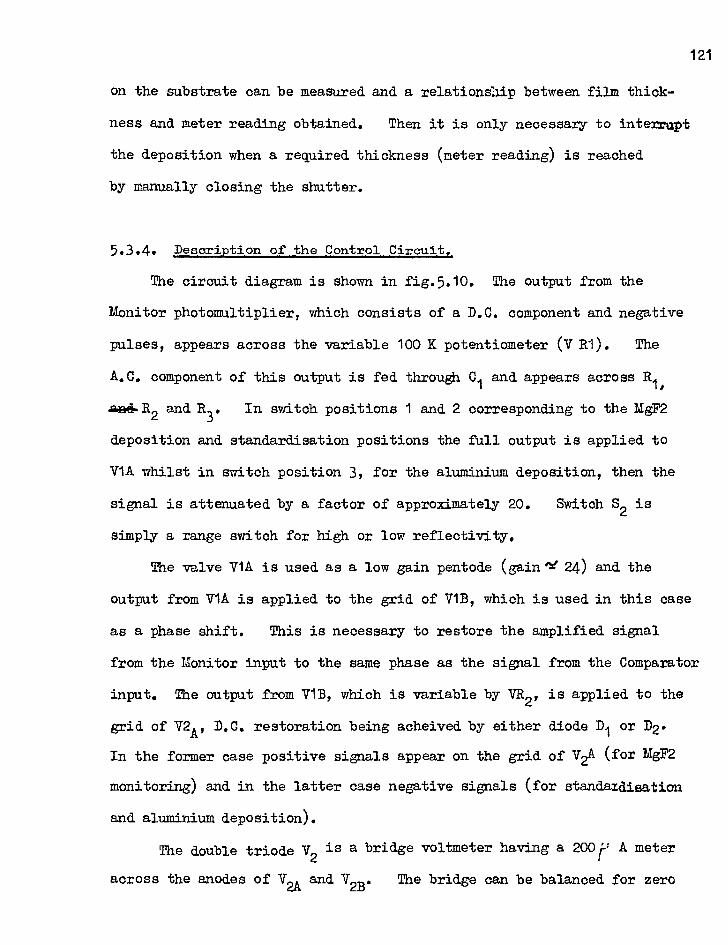
121
on the substrate can be measured and a relationdllip between film thick-
ness and meter reading obtained. Then it is only necessary to interrupt
the deposition when a required thickness (meter reading) is reached
by manually closing the shutter.
5.3.4. Description of the Control Circuit.
The circuit diagram is shown in fig.5.10. The output from the
Monitor photomultiplier, which consists of a D.C. component and negative
pulses, appears across the variable 100 K potentiometer (V R1). The
A.C. component of this output is fed through C1 and appears across Ri,
affiA,R2 and R3. In switch positions 1 and 2 corresponding to the MgF2
deposition and standardisation positions the full output is applied to
ViA whilst in switch position 3, for the aluminium deposition, then the
signal is attenuated by a factor of approximately 20. Switch S2 is
simply a range switch for high or low reflectivity.
The valve ViA is used as a low gain pentode (gain "Y 24) and the
output from VIA is applied to the grid of V1B, which is used in this case
as a phase shift. This is necessary to restore the amplified signal
from the Monitor input to the same phase as the signal from the Comparator
input, The output from V1B, which is variable by VR2, is applied to the
grid of V2A, D.C. restoration being acheived by either diode D1 or D2.
In the former case positive signals appear on the grid of V2A (for MgP2
monitoring) and in the latter case negative signals (for standardisation
and aluminium deposition).
The double triode V2 is a bridge voltmeter having a 200t, A meter
across the anodes of V2A and V2B. The bridge can be balanced for zero

122.
input by VB3. The output from the Comparator appears across R19 and is
applied to the grid of V2B, D.C. restoration being obtained by D3. In
switch position 1, a small positive voltage is applied to the grid of
V2B to balance the contact potential of Di.
Differences between the output of V2A and V2B will be indicated by
the 200t4A meter and will also result in a signal across the primary of
Ti. This difference in signals is amplified by Ti which is peaked at
1000 c/s (gain T. 9) and applied to the grid of V3A, a triode amplifier
having a gain V 11. The output from V3A is rectified and smoothed
(C9, R24,D4) to provide a positive voltage on the grid of V3B. The diode
D5 in the primary of T1 prevents reappearence of the signal once the
balance point has been passed.
A high positive voltage applied to the grid of V3B causes the
anode current to rise and energise the relay in the anode of V3B. As
the aluminium deposition occurs and the monitor plate reflectance increases,
then the voltage difference across the bridge and hence the voltage on
the grid of V3B will decrease. Eventually, a point is reached where
for a given signal difference the relay will de-energise. The grid
voltage at which this occurs can be varied by VR5 and is.mormaly set to
12V.
5.3.5. The Shutter Actuating Circuit.
The shutter which inters deposition when the required reflectance
is reached is operated by a solenDid mounted inside the vacuum chamber.
This solenoid in turn is controlled by the relay in the anode of V3B.


Rio
ComP kt.?)-Aron
iNPOf A v3 8
R rq R22
F-1
TI t:q I
0
1117
SID 0- ce- 3 3
c 6
O D3
R fl
1t7 C2
t4i
1123
6
1•1. 04. ••••1.1,...111. 0..00
vRZ
C3
R10
DI D2
518
C4
‘=. A V2
•••• ORM MID
g25
Cl mmoim110
C7
R26
Vitc
SWITCH P05 irroNS S1
I Ma Fa STANDARD 15 47-10N
3 fiLumpvium
52 c.A.ose0 FoR HOW lifFLEcTIVITy
FIG. 5.10
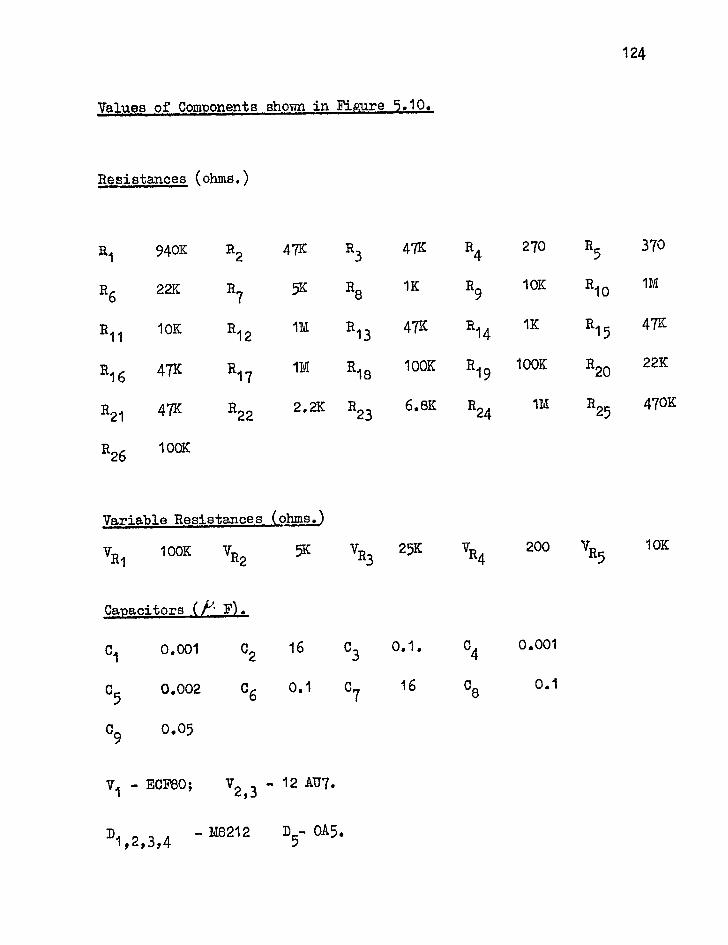
Values of Components shown in Figure 5.10.
124
Resistances (ohms.)
Ri 940K R2 47K R3 47K
R6 R7 5K 22K 10K R8 1K
RII 10K R12 1M R13 47K
R16 47K R17 1M R18 100K
R21 47K R22 2.2K R23 6.8K
R26 100K
R4 270 R5
370
R9
R10 1M
1114 1K R15 47K
R19 100K R20 22K
R24 1M R25 470K
Variable Resistances (ohms.)
VRI 100K V,2 5K VR3 25K V
R4 200 IT.B.5 10K
"
Capacitors (/'''• F).
C1 0.001 c2 16
c5
0,002 06
c9
0.05
C3
0.1. C4
0.001
16 08 0.1
V1 - ECF80; V2,3 - 12 AU7,
D - M8212 D5- 0A5.

125
for the aluminium (automatic) deposition or it can be operated manually.
The circuit for actuating the solenoid shutter is shown in figure.5.11.
Automatic Operation.
Switch S2 is set to automatic which opens both S211. and S2B. Prior
to deposition relay 1 in the anode of V3B is energised throUgh a 22
resistance connected to the H.T. supply (t300V). The shutter is opened
manually by switch S1 and deposition occurs. When the required ref-
lectivity is reached relay 1 de-energises and its contacts short the coil
of relay 2 which then also becomes de-energised. In this conditioni the
solenoid circuit is broken and the shutter closes. However, with the
shutter closed there will be a large voltage on the grid of V3B and relay
1 will again energise. The purpose of introducing relay 2 is to prevent
the shutter from automatically re-opening as would otherwise occur. In
fact, the shutter cannot be opened again until switch SiA has been
manually opened since the contacts of relay 2 short its own coil and
prevent it from energising.
Manual Operation.
Switch S2 is set to manual which closes both S2A and S2B thus
shorting the coils of relays 1 and 2. The shutter is now controlled
by switch 1 only. On manual operation the shutter is open for fairly
lengthy periods and to prevent undue heating of the solenoid a 10 ohm
resistance is switched in series with the solenoid approximately 4 sec
after it has been actuated. Thus, although it requires a current of
about 1.2 A to actuate the solenoid it requires only 0.4 A to maintain
the solenoid energised. The contacts of relay 3 open and unshort the


SV RELAYS
52E3 3ov
$ IC I 2
1
RELAy2. coNvicr5
I
I I I
C
1
61V RELAY; CONTACTS towtomon1
Cott. EN6RG-15ED
Cott. ENERets60
---->
47.A. 200 frF
24oV
Fla 5. H. SHUTTER AcTvi9TING C lac WT.
5 Hurrgg
Sol-Eivoto
Si IN PovirioN -- Sivvr Tea OPEN 1* It I • Of C.L.OSE
52 it I OPERAMPAI Q IS . 19(1 roifelTIC ff
SWtrc to Postrtons SHowlv Foft f)Lirorogrtc SHtiiTER OPERATtom.

127
10 ohm resistance 4 sec after opening Slc, the time delay being provided
by the 200/4F condenser and the 1 K ohm resistance. When the shutter
is closed (i.e. SiC closed) the 200tLF condenser is discharged through
the 47iLresistance ready for the next cycle.
The 1/4F condenser across the shutter solenoid and the 0.1/4F across
relay 2 absorb back e.m.f's produced on de-energising these coils which
could otherwise pass back to the bridge.
A similar circuit (not shown) is used to actuate the monitor plate
movement between evaporations.
5.4. Substrate Preparation.
A number of techniques have been advocated for preparing highly
clean glass surfaces before depositing films by vacuum evaporation since,
in order to obtain adherent, low absorption coatings free from 'pin holes'
a substrate must be free from contaminant films such as grease, absorbed
water, dust particles etc.
Putner (1959) has found that vapour degreasing in isopropyl alcohol
produces a high standard of cleanliness although if the surface is
grossly contaminated ultrasonic cleaning is necessary prior to the vapour
degreasing. A cleaned surface rapidly becomes 'dirty' when exposed to
the atmosphere even for short periods of time, but such surface contamin-
ants condensed from the atmosphere can be removed from the substrate
by subjecting it to bombardment from high velocity ions in the vacuum
chamber prior to deposition.(Holland 1956). Surfaces can be cleaned by
rubbing with cotton wool impregnated with detergent and subsequently

128.
dried by rubbing with several changes of cotton wool. The author, in
the present work, has found that this is not a satisfactory method for
producing high quality films since the surface develops an electrostatic
charge which attracts minute particles firmly to the cleaned surface.
The following procedure for cleaning fused silica substrates was found
to be very satisfactory for the present work producing surfaces free from
streaks and water marks.
The substrates were soaked in dilute (50 - 50) HC1 for about 30 mins,
washed and ultrasonically cleaned in a 'Teepol' detergent solution for
2 mins. After further washing the substrates were mounted and held by
their edges in spring loaded racks and were then rinsed in de-ionised
water followed by A.R. isopropyl alcohol. The rack was then immersed in
an isopropyl alcohol degreasing chamber and was withdrawn and trans-
ferred to a dessicator when the substrates had reached the temperature
of the vapour. After cooling in the dessicator, the substrates were
loaded onto the coating jig and the chamber was immediately evacuated.
In general, substrates were exposed to the atmosphere after removal
from the degreasing bath, for a period of less than 20 sec.
The aluminium charge was cleaned before loading onto the tungsten
filaments by immersion in 50-50 Hcl, washing in water and acetone and
ultrasonically cleaning in acetone.
5.5. The Evaporation Procedure.
The vacuum chamber is initially flushed with dry, oxygen free
nitrogen during the early stages of evacuation with the rotary pump

129.
(This technique was not used for films produced in the glass demountable
vacuum system). When the chamber pressure falls to 4:10 Torr nitrogen
is again admitted to raise the chamber pressure to 0.03 - 0.06 Torr,
at which pressure the glow discharge cleaning is carried out by applying
a voltage of about 1.5 KV (current 2 150m A) for about 3 mins to the
aluminium ring electrodes (section 5.2.4.).
With the substrate shielded from the vapour source filaments and
at a chamber pressure ofc10-5 Torr both the aluminium and MgF2 charges
are heated. In the case of the MgF2, evaporated from a molybdenum
boat, the boat temperature is raised to the evaporation temperature of
MgF2 over a period of about 20 mins in order to slowly autgas4 the charge.
For the aluminium, the tungsten filaments are heated to melt the aluminium
and the filaments are held at a temperature just below the melting point
of aluminium for a period of about 10 mins.
Approximately 15 rains before evaporation, liquid nitrogen is pumped
through the Meissner coil to reduce the chamber pressure to 10-7 Torr.
At this stage the film thickness control unit is standardised and set to
the required reflectivity as described in section 5.3.3. With the
shutter between source and substrate closed the MgF2 charge is raised to
dull red heat to reduce the delay time between completing the aluminium
evaporation and commencing the MgF2 evaporation. The aluminium charge
is then heated and when evaporation proceeds at a fast rate the shutter
is opened and deposition occurs. It is important that the aluminium
is allowed to evaporate at a fast rate before commencing the deposition
since the initial aluminium stream acts as a getter for oxygen and also

130. reacts with water vapour to form A1203 and H2. (Holland 1956).
when the required reflectivity is reached the shutter automatically
closes interrupting deposition and the tungsten filaments are switched
off. The MgF2 charge is then raised quickly to evaporation temperature,
the monitor plate moved to the next evaporation position, the shutter
re-opened and. the control unit set for monitoring the MgP2 film thickness.
These processes can be carried out quickly and the deposition of the
MgF2 layer generally begins some 20 secs after completing the aluminium
evaporation. The MgF2 evaporation rate is about 15 R/sec and when the
required thickness is reached the shutter is closed manually.
For the case of the F.P. type interference filters the process is
repeated as additional layers of aluminium and MgF2 are required.

131. CHAPTER 6.
OPTICAL PROPERTIES OF EVAPORATED ALUMINIUM AND
ALUMINIUM-Me2 FILMS AND TRANSMISSION CHARACTERISTICS
OF P.P. TYPE INTERFERENCE FILTEHS IN THE FAR
ULTRAVIOLET.
In this chapter the optical properties of semi-transparent aluminium
and aluminium-MgF2 coatings are given down to a wavelength of 1800 R.
Two different vacuum conditions of preparation have been used for
preparing the coatings and the effect of these different conditions on
the optical properties is discussed. The superior optical properties
of the aluminium-dielectric combination over single aluminium films are
olearly evident and the performance of this combination for multiple-beam
interferometry in the far ultraviolet is discussed and illustrated by
F.P. interferograms obtained for the 1849 line of HgI.
In the final part of this chapter the transmission characteristics
of F.P. type aluminium -EgF2-aluminium filters for the wavelength region
1700 to 2400 I are described. From these characteristics the optical
properties of the aluminium reflecting layers have been derived. The
effects of these properties on filter performance are considered and a
comparison is made between calculated and measured values of filter
bandwidth for a given filter peak transmission.
The methods which have been employed for measuring the optical
properties of the coatings and the transmission characteristics of filters
are described in the following section.

132.
6.2. Method of Measurement.
6.2.1„ Method for Measuring the Reflection and Transmission Coefficients
of the Interferometer Coatings.
The principle of the method employed for measuring the reflection(R)
and transmission (T) coefficients of the coatings is illustrated in
figure 6.1. A substrate (30 .m.m dia; 1 m.m. thick) nArrying the de-
posited film is mounted above a movfable table upon which the detector
];t) is mounted. The position of the sample is arranged so that the
axis of rotation of the table passes approximately through the reflecting
surface. The substrate holder can be rotated about an axis '01 to
allow the incident light beam to fall directly onto the detector.
The reflectometer is attached to a nitrogen purged optioa OF4
grating spectrometer and is enclosed in a light tight box which can also
be purged. Measurements of film properties at wavelengths shorter than
3800 R are made using a deuterium lamp as source and in the visible
region a tungsten filament lamp is employed. The wavelength interval
isolated for measurement can be altered by simultaneous adjustment of
the exit and entrance slits of the monochromator. The dispersion is
20 R m.m.-1 in the plane of the exit slit. For measurement of coating
properties a wavelength interval of 10 to 20 R is normally employed.
The spectrometer output slit is imaged onto the detector by a concave
mirror of focal length = 15 cm. With this optical system the maximum
area of sample inspected at a time is approximately 2 m.m. x 6 m.m.
for a sampling bandwidth of 20 R.
In position I the detector receives light from the source either
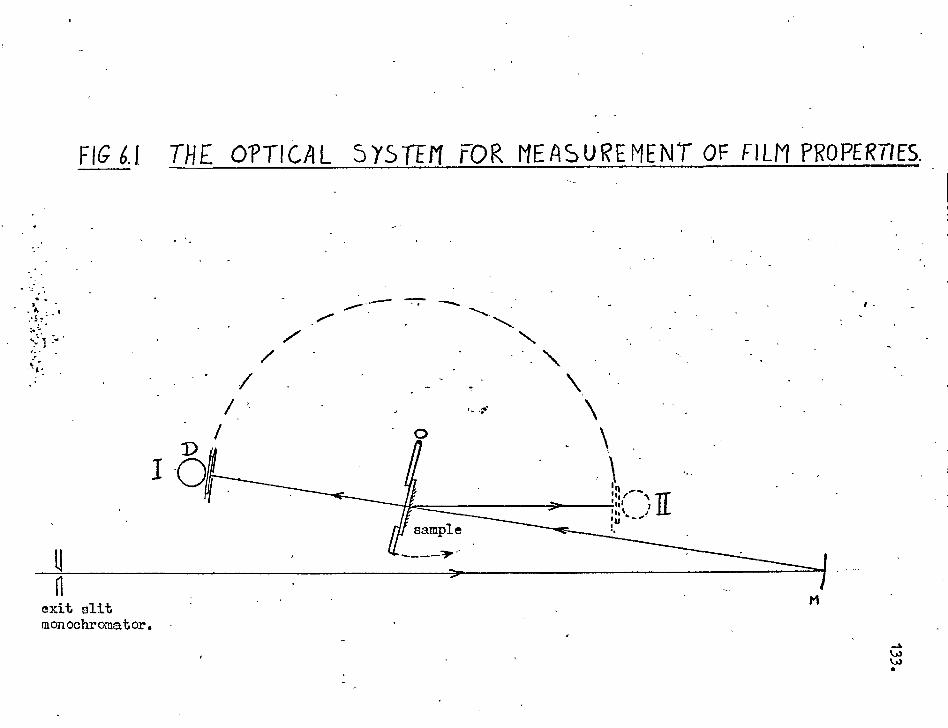
FIG 6.1 THE OPTICAL sys-rEn FOR MEASUREMENT OF FILM PROPERTIES.
11 11
exit slit monochromator.
134.
direotly or after passing through the sample. In position II it receives
light reflected from the sample at an angle of incidence of about 100.
Thus, the intensities observed in those two positions will be in the ratio
of I:T:R.
The procedure adopted for setting up the reflectometer is as follows.
Using visible light, an image of the exit slit is focussed onto a ground
glass screen mounted approximately 1 m.m. in front of the photomultiplier
(detector) window. Mounted in front of this screen is a slit aperture
of dimensions slightly larger than the image of the monochromator exit
slit. The concave mirror is arranged such that the incident light beam
passes through the centre of the specimen and the aperture position is
adjusted so that the whole of this beam falls onto the glass screen. The
detector is turned to the position for reflectivity measurement and the
substrate holder is adjusted by a 3 screw, spring loaded mount so that
the angle of incidence of the beam onto the sample is about 10° and
also to ensure that the reflected beam passes through the slit aperture,
After these adjustments the incident and reflected beams are approximately
normal to the axis of rotation of the detector platform.
The photomultiplier (Type E.M.I. 9662 A) is enclosed in a metal
container to shield the cathode from stray light. Also, since the
aperture of the photomultiplier used is small then diffuse reflection
from the sample does not greatly contribute to the photomultiplier signal,
Stray and diffuse reflected light was found to have a negligible effect
on measurements,
In the method of measurement adopted the detector is rotated until

135.
a maximum signal response is obtained for all three measuring positions;
direct, transmitted and reflected intensities. The photomultiplier
has a thin. ISpectrosill envelope and can be employed for radiation
intensity measurement to a least 1800 R. However, it was found that
if the 7hotomultiplier was used directly then the signal response as a
functicn of photomultiplier position was very critical and did not enable
the maximum response to be located both precisely and rapidly. A more
convenient arrangement was found to be one in which a sodium salicylate
screen was mounted just in front of the photomultiplier. Very uniform
phosphor screens were produced by a method similar to that described
by Knapp (1963) in which the salicylate is dissolved in alcohol and
sprayed onto a cleaned glass substrate which, in this caseg, was heated
to a temperature of about 6000. The efficiency of such screens as a
function of salicylate thickness has been discussed by Seya and Masuda
(1963), In the present work a surface density of about 1.5. m.gm. cm-2
was employed by spraying onto the substrate a given volume of solution
of known concentration. A solution concentration of 20 m.gm om
was found to be very satisfactory for this purpose. Using this phosphor
screen method the photomultiplier response was still sufficiently sharp
for the maximum to easily located. The reduction in sensitivity which
resulted from the employment of the phosphor screen was not at all serious.
No differences in values of R and T (within limits of experimental error)
were obtained from the two methods of use but because of the ease of
rapidly locating the maximum response, the phosphor screen method was
preferred.

136.
The photomultiplier was connected directly to a galvanometer
whose linearity to current was checked. Signal currents of up to 5 A
were used and the bleeder chain current was normally about 300,0A.
°applied by a Philips stabilised high voltage supply (section 5.3.2.)
Eaoh value of R and T for a particular wavelength was determined from
at least 6 readings and disagreements in individual values of R greater
than 0.5% were seldom found. The most difficult spectral range for
measurement was between 1800 and 1900 R where instabilities in the rate
of flow of the purging gas could cause some fluctuations in the readings.
For this spectral region the number of observations for each value of
R and T was increased. It was found that it was possible to remove and
replace the sample such that the value of R was reproduced to within
± 0.3%. The experimental error in the determination of R was estimated
to be within 0.3% whilst the accuracy in T was a little greater. Thus,
the error in the value of (rt + T) should seldom exceed 0.0.
As a check on the accuracy of optical properties of coatings de-
termined from the reflectometer measurements the values of R and T
were derived for a number of samples by employing the normal incidenoe
method of Giacomo (1952). In this method only the comparatively
more simple transmission measurements are required. Two samples are
used and the transmission of each (T1 and T2) is determined. The samples
are set up as in the F.P. etalon with the two reflecting surfaces
parallel to each other. The transmission (T3) of the assembly is then
determined using a source of spectral widthbA2/2t (t being the
seporation of the reflecting surfaces) such that the spectral width of

137.
the source covers several successive orders of interference. The
optical properties are obtained using the relationship
T3 T1T2 ( 1 + R2 + R4 - -
T1T2
1 - R2
where R2 is the product R1R2. Corrections must be made for reflections
from the uncoated substrate surfaces and the magnitude of these corrections
can be easily determined. It was found that the results obtained for
single aluminium films were in good agreement with reflectometer values
within the error of (R + T) of t 0.5g
6.2.2. Measurement of Filter Transmission Characteristics.
The transmission characteristics of filters have been determined
to a wavelength of 1800 R using a similar experimental arrangement
as described in the previous section. In this case a narrower bandwidth
of about 4R was generally employed. A vacuum Seya monochromator
(Spectroscopy Group, Imperial College) was used to check measurements
to 2400 R and to extend the transmission characteristics to 1500 E.
The properties of a number of filters were also checked in the wave-
length region 1500 to 1900 . using a normal incidence vacuum mono-
chromator (Dr.C.B.Lucas, U.K.A.E.A. Culham Laboratory).
Filter transmissions were measured at normal incidence over an
area of sample approximately 1 m.m. x 6 m.m. The accuracy of measure-
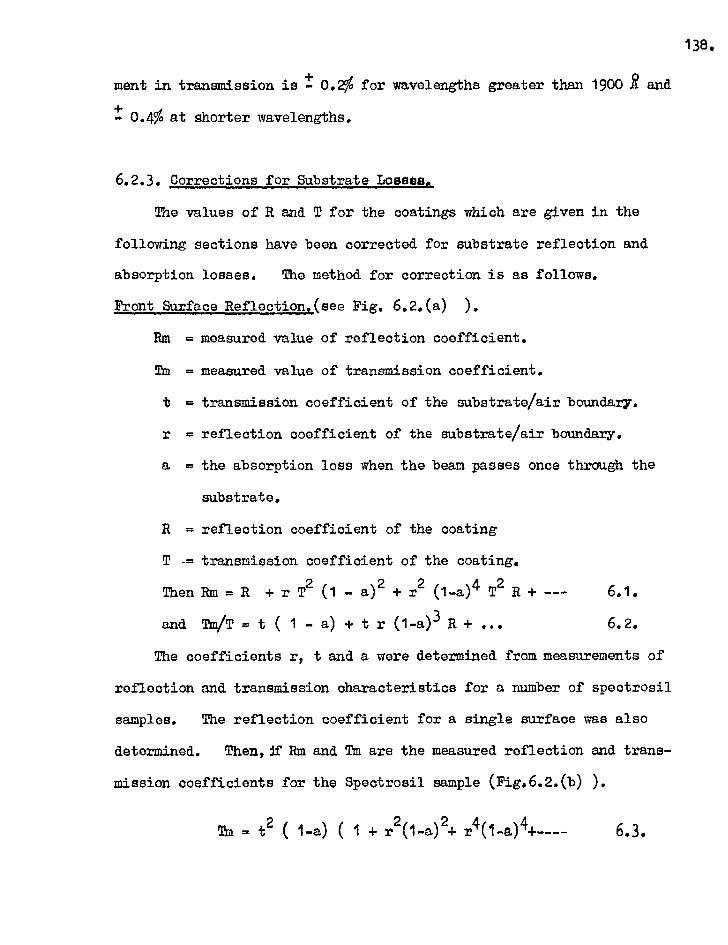
ment in transmission is - + 0.2% for wavelengths greater than 1900 R and
- 0.4% at shorter wavelengths.
6.2.3. Corrections for Substrate Losses.
The values of R and T for the coatings which are given in the
following sections have been corrected for substrate reflection and
absorption losses. The method for correction is as follows.
Front Surface Reflection.(see Fig. 6.2.(a) ).
Rm = measured value of reflection coefficient.
Tm = measured value of transmission coefficient.
t = transmission coefficient of the substrate/air boundary.
r = reflection coefficient of the substrate/air boundary.
a = the absorption loss when the beam passes once through the
substrate.
R = reflection coefficient of the coating
T -= transmission coefficient of the coating.
r T2 (1 a)2 r2 (1-a)4. T2 R Then Rm = 6.1.
and Tm/T = t ( 1 - a) + t r (1-a)3 R + 6.2.
The coefficients r, t and a were determined from measurements of
reflection and transmission characteristics for a number of spectrosil
samples. The reflection coefficient for a single surface was also
determined. Thenl if Rm and Tm are the measured reflection and trans-
mission coefficients for the Spectrosil sample (Fig.6.2.(b) ).
Tm = t2 ( 1-a) ( 1 + r2(1-a)2 r4(1.404+____ 6.3.
136.

r4r4 /1 -0044 rr4 (!-a)L
Fig 6.2 a
Fig 6.2 b
F ig 6.2 ,

140.
and Rm = r t
2r (1-a)2 t2 r3 (1-a)4 6.4.
The value of r determined from the single surface reflection was
found to be in reasonable agreement with r derived from refractive
index data given for spectrosil toA2000 R by Gerrard and Turpin (1965).
(see r1 in Table 6.1.).
Table 6.1. gives measured data obtained for several 1.m.m thick
Spectrosil samples.
The magnitude of the corrections for substrate absorption and re-
flection losses can be obtained from table.6.1. For example, if R>70%
then the second term of equation 6.1. is only =' 0.05% whilst higher terms
can be neglected. In equation 6.2, the first term is '= 0.95, the second
term '1-'0.04 and remaining terms of r2and higher can be neglected. The
errors in r, t and a used for corrections cause an insignificant increase
in the errors of R ant T derived from measurements of Rm and Tm. These
experimental errors are within 1. 0.3% and t 0.2% of the incident light.
Back Surface Reflection (Fig.6.2.(c) ).
The optical properties of a number of samples have also been derived
from measurements of back surface reflectance i.e. measurements made
with the substrate facing the incident beam. The purpose of these
measurements was to determine whether or not a deposited film showed a
different reflectance between the. initial layers in contact with the
substrate and the final exposed layers ( after allowing for substrate
refractive index).
The correction for Rm is given by (see fig.6.2.c.)
Rm = r + t2R(1 .402 t2 r R2(1-a)4 6.5.

141. Table 641..
T40.2Y0 t r 0 rt
2800 92.0 0.9610.002 0.043±0.003 0 0.039
2600 91.8 0.958 0.044 0 0.040
2400 91.5 0.956 0.045 0 0.041
2200 91,5 0.956 0.046 0 Q.043
2000 91.0 0.955 0.04E4.004 0 0.046
1900 89.5 0.945 0.051 ^ 1
1800 88.5 0.940 0.05410.005 owl
Values of a were calculated from eqns. 6.3. and 6.4.

142.
where in this case R is now the reflection coefficient for the film-
substrate boundary.
The relationship between T and Tm is identical with that given in
equation 6.2. It is now seen that the error in the derived value of R
will be increased since it involves the term (Rm-r). The value of R
was corrected from a film-substrate boundary to a film-air boundary using
optical constants for aluminium given by Hass and Waylonis (1961) and
refractive index data for spectrosil given by Gerrard and Turpin.(1965)
6.3. The Optical Properties of Semi-Transparent Aluminium Films in the
Far Ultraviolet.
In this section the optical properties for single aluminium films
are given which were prepared under the two different vacuum conditions
described in Chapter 5. These results will be put into the too categories
according to the vacuum conditions of preparation:-
1)1Poorer ctimditons, - in which coatings were deposited in the
glass demountable coating system.(initial evaporation pressure
10-5 Torr)
2) 'Improved conditions' - films prepared in the stainless steel
coating plant in which special attention was paid to reducing
the water vapour content of the residual gas atmosphere.
(Initial evaporation pressure of 10-7 Torr.)
6.3,1. Films Prepared under the Poorer Vacuum Conditions.
The variation of the reflection coefficient (R) and the transmission

143.
coefficient (T) with wavelength for a number of aluminium films deposited
on to 'Spectrosil B' substrates is shown in figure 6.3. These films
were deposited in a time of 2 to 3 secs (deposition rate of about 100 to
150.E sec 1 ). Film properties shown in figure 6.3. were measured
after 2 to 24 hours exposure to air. Values of R and T have been corrected
for substrate reflection and absorption losses as described in section 6.2.
The optical properties of these films were very disappointing.
Values of (R + T) are some 2.5 to 3% lower than corresponding values
reported by Hass and Waylonis (1961) for the wavelength region 2200 to
2800 R. At shorter wavelengths (R + T) values are also about .3% lower
than the reflectance of opaque aluminium films reported by Hass, Hunter
and Tousey (1957). These results were somewhat surprising in view of
the fact that there was not a great difference between the deposition
rate and evaporation pressure used during this investigation and that
of Hass and Waylonis. In addition, the (R + T) values at 2600 . are little different from those of Burridge et.al.(1953) where the deposition
rate was approximately an order of magnitude lower.
Opaque films prepared in this plant also possess values of R closely
following the curves 1,2, shown in figure. 6.3.
Back Surface Measurements.
Values of R and T have also been measured for several of the thicker
films and for opaque films from the substrate side of the coating. Values
of (R + T) obtained after correction for substrate losses and refractive
index are shown in figure 6.3. (curve (R T)'B). Considering the
greater errors in the back surface measurements (section 6.2.3.) the

,..
.11.....
1,2 3' (R+r)
2 R
92
90
88
°,---: 86
84
82
80
78
76
74
72
70
68
66
64
62
60 1E,
58
56
AL — 13 = 10-5 Torr (R+-01
(R+T)Ft
144.
2000 2200 2400 2600 2800
ax
-- " —1T ...... .....
....., ...„, ...... N..
...........
..... ....
— — -2 i
3"
--' 3'T -3
3 R
..:
26
24 cx,
22
20
18
16
14
12
10
8
6
4
2
0
Figure 6.3.

145
difference in (R + T) values is not greatly significant. These optical
properties derived from back surface measurements are still very much
inferior to those of Hass and Waylonis.
Change in Film Properties with Time.
Figure 6.3. also shows the change in R and T with time for optical
properties mr.snred after 15 mins and 24 hours exposure to the atmosphere
(curves 3 and 3' respectively). The magnitude of the changes in both
R and T increases at the shorter wavelengths. Changes in the optical
properties of aluminium films with time are discussed further in section
6.4.2.
Variation of Film Absorption with Film Thickness.
No significant variation of film absorption with film thickness
was observed for samples transmitting up to about 12% (atA 2000 2).
However, films having a transmission greater than this value are
characterised by an increased film absorption. The absorption increases
as the thickness of the aluminium film is reduced.
6.3.2. Films Prepared under the 'Improved' Vacuum Conditions.
An investigation of the optical properties of single, semi-
transparent aluminium films has been made in which the coatings were
prepared under the improved vacuum conditions described in Chapter 5.
The rate of deposition was the same as that used for preparing films
under the poorer vacuum conditions.
The variation of RI T and ( R + T) with wavelength for a number
of samples is shown in figure 6.4. Optical properties were measured
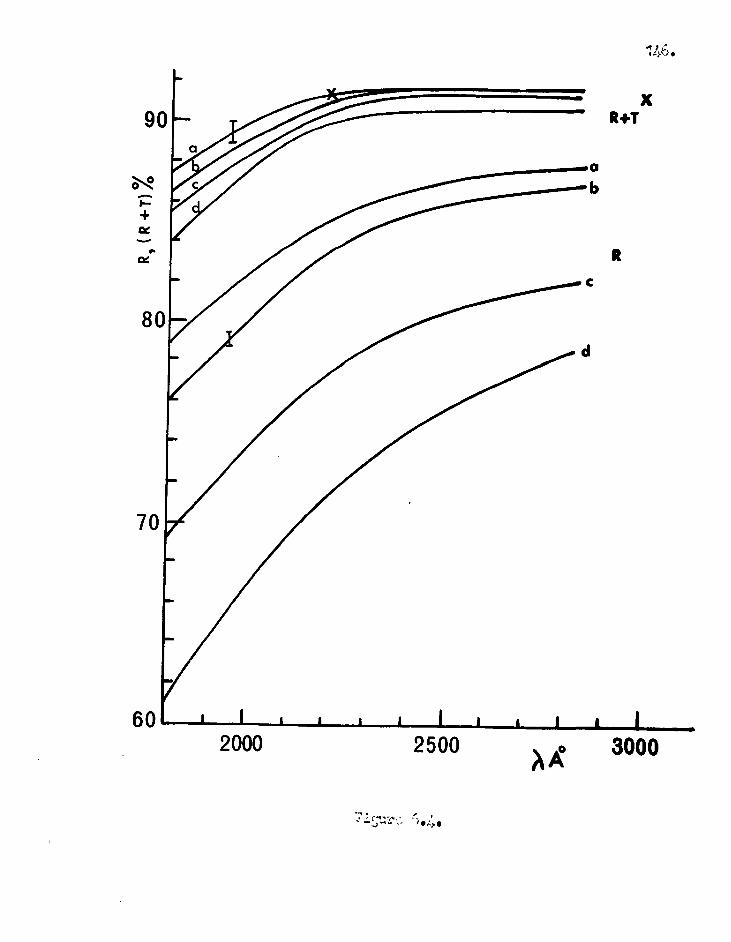
2000 2500
3000
4,7
after 24 hours exposure to the atmosphere. It can be seen that the
improved vacuum conditions have resulted in an overall improvement in
optical performance. Poi/wavelengths above 2200 R the values of (R + T)
are in close agreement with corresponding values given by Hass and Waylonis
whose results are indicated at the wavelengths 2200 and 3000 R. In
the wavelength region 1800 to 2200 R, these (R T) values also agree
closely with values of reflectance reported for opaque aluminium coatings,
(Hass, Hunter and Tousey 1957).
Back Surface Measurements.
Optical properties were again determined, for several thicker and
opaque films from back surface measurements. Results for OR + T)(corrected
for substrate refractive index) are shown in figure 6.3.(curve (R+T)"B).
These values of (R + T) so derived are greater than for films produced
under the poorer vacuum conditions (fig.6.3.). The back surface
measurements reveal little difference in reflectance between the
aluminium-substrate boundary (corrected for substrate refractive index)
and the reflectance at the exposed aluminium surface.
The Effect of Deposition Rate.
Whilst the effect of deposition rate on film properties has not
been studied in great detail figure 6.5. compares the values of R and
(R + T) for films deposited in times of 2 and 20 secs under the improved
vacuum conditions. Also shown is the effect of interrupting deposition.
In this case the total evaporation time was 20 secs but the substrate
was shielded from the vapour stream for a period of 4 secs after de-
position has proceeded for 12 seconds. The influence of the deposition

R •••• ••••
. ••••"" ••••••• /
•
•
T 20 SeZsintn'ruptccl.
I I I 3000
I I 2000
I I 2500
A A 0
•••••10 • • • ffa • rim••• - R
•
T Zsecs _ _T 20 Secs
CC
ac
80
1.
/
•
70 /
90
/ •
q3
0
•
•

149.
rate on film absorption is very marked for wavelengths shorter than 2200 .
and it is seen that the higher absorption is due to a decrease in reflectance.
Change in Optical Properties with Time.
Changes in values of R and T which occur upon exposure to the
atmosphere for films prepared under the improved vacuum conditions are
discussed in section 6.4.2.
Variation of Film Absorption with Film Thickness.
Figure 6.4. shows that the film absorption for the aluminium films
prepared under the improved vacuum conditions increases as the film
thickness is reduced. The dependence of absorption on film transmission
is nearly a linear relationship for values of T up to approximately 20%.
For thinner films, absorption increases more rapidly with increasing T.
This dependence of absorption on film thickness for the thicker films
was not found previously for the poorer quality coatings. In addition,
it is contary to the findings of Hass and Waylonis who observed that at
2200 R the film absorption was independent of thickness for film thicknesses
greater than 120 R. However, in the present work slightly lower
deposition rates have been employed than those used by Hass and Waylonis.
6.3.3. Optical Microscope Examination of Aluminium Films.
Several aluminium films prepared under the two different evaporation
conditions have been examined in transmission using a Vickers optical
microscope. Photographs 6.6.(a) and (b) were obtained for films pre-
pared under the poorer and improved conditions respectively. The
magnification in the prints shown is approximately a factor of 500.
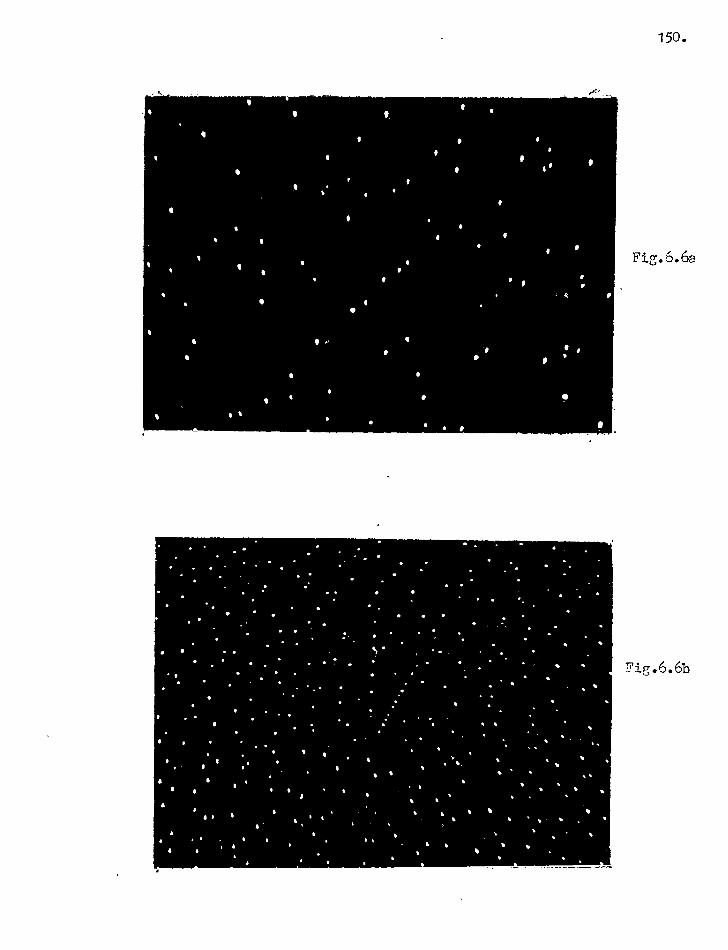
•
•
•
•
• •
•
•
•
•
S •
• • •
• •
• • -
•
• •
•
•
• •
•
•
•
•
•
•
•
• •
• •
• •
• • •
•
•
•
•
• • • •
• •
•
• • • •
• • . •
•
• •
• • • • • •
•
•
• • •
•
• • •
•
• •
• • v. •
• • • • •
a I •
• •
• • • •
• • • •
• •
• 11 •• • •
Ivy •
• • •
•
•
• . , •
• • •
• % • • •
• •
•
•
•
• • • •
•
•
• • • • • •
. : • . • I 1 • •
a a • a ' • • I
•
•
•
150.
Fig.6.6a
Fig.6.6b
151.
These photographs show that 'microholes' have been formed in the
aluminium films but there is both a difference in hole density and size
for the two evaporation conditions. The mean size and surface density
has been determined and is as follows.
Poorer Conditions Improved Conditions.
Mean diam(cm) 2.7 x 10⁻⁴ 1.6 x 10⁻⁴
Mean Density cm-2 of sample 2 x 10⁵ 106
Surface Area of sample approx. 1%
approx. 2%
occupied by pinholes.
The formation of these holes has been examined for a film produced
under the improved vacuum conditions. Upon removal from the coating
plant the sample is completely free from defects. After 40 hours
storage in a dessicator a few holes are present and many more appear
to be developing, and after 90 hours most holes appear to have formed.
A suggested mechanism for the formation of those holes is given in
section 6.4.1.
For the aluminium - MgP2 double layers (section 6.5.) all samples
examined showed no evidence of pinhole formation for storage periods
of up to 3 years.
6.3.4. A Comparison between Measured and Computed Optical Properties
For Single Aluminium Films.
In chapter 4 results were given for computed values of R and T
for a single aluminium film deposited onto a non-absorbing substrate of

152
index 1.55. Figure 6.7. shows measured values of R and (R + T) compared
with computed optical properties for an aluminium film 275 R thick.
Measured film properties are for a coating prepared under the improved
conditions at a deposition rate of 100 -150 .? sec-1.
It is seen from figure 6.7. that measured values of (R + T) after
15 hours exposure are considerably lower than those Obtained from
calculation, particularly at the shorter wavelengths. This difference
between computed and measured properties is largely due to lower values
of R. However, the optical properties of exposed aluminium films change
with time (Chapter 3) and in figure 6.7. experimental values of R and
(R + T) are given for measurements made after 15 minutes exposure to air.
In this case the agreement between computed and measured values of (R + T)
is well within limits of experimental error over the entire wavelength
region 1800 to 2800 R. The change in optical properties with time is
further examined in section 6.4.2.
It must be remembered that the optical constants for aluminium films
given by Hass and Waylonis were derived from measurements of films
possessing a surface oxide thickness of about 15 R (corresponding to
24 hours exposure) and therefore they do not represent an idealised, oxide
free film. This therefore questions the validity of extrapolating these
optical constants to wavelengths shorter than 2200 R. However, according
to Schroeder (1962) the extrapolation gives a reasonable agreement with
the optical constants derived from opaque aluminium films at 1216 R
(Berning, Hass and Madden 1960).
From the present investigation it can be concluded that the extra-

YY 000Z 00g3 AMP 000C I
L 09
/ 0
OEM0
el ^ 1.: 1,7 LYE,
• :.•T- 461,.
1 WOW
0
0
0 0
06 0 000 0 di°. -

154
polated optical constants can be used for calculating the properties
of (thick) aluminium films to 1800 R and values so derived are in good
agreement with experimental values (prepared under the above conditions)
and also with measured values of reflectance for opaque, unexposed
aluminium films (Chapter 3). This is of importance particularly for
extending the work to include computation of the properties of protected
types of films such as aluminium - MgP2. A comparison between computed
and measured properties for such films is made in a later section.
However, for wavelengths less than about 1800 R it must be realised that
the experimental film properties will be dependent upon the delay time
between completing the aluminium evaporation and applying the protective
coating.
6.4. A Discussion of the Optical Properties of Single Aluminium Films.
6.4.1. Film Absorption - Dependence on the Preparation Conditions.
As already stated in section 6.3.1. the absorption values for the
single aluminium films prepared under the poorer evaporation conditions
were higher than had been expected. Whilst the properties of the
aluminium - MgP2 films (Section 6.5.) prepared under the same vacuum
conditions are very much superior, it was because of the poor optical
quality of these aluminium films that an improved coating plant was con-
structed during the course of the present investigation.
The remarkable difference in optical properties between the aluminium
films produced under the two different evaporation conditions must be
purely due to a difference in the content of the residual gas atmosphere

155.
in the coating chambers since other pertinent parameters such as the
rate of deposition, aluminium purity, source-target distance, substrate
cleaning etc were the same in both cases. It is found that reducing
the evaporation pressure from 10-5 Torr to 10-7 Torr causes a reduction
in film absorption of some 2 to 3 over the wavelength region 1800 -
2800 R. (Fig.6.8). This reduction in absorption is seen to be due to
higher values of reflectance. Hass and Tousey (1959) found that
changing the evaporation pressure from 10-5 to 10-4 Torr had little
effect on the reflectance of opaque aluminium films deposited at rates
of 400 .R sec-1. For lower deposition rates however, the effect of in-
creasing the evaporation pressure was to cause a significant decrease in
reflectance (Chapter 3). Differences in reflectance were attributed to
the fact that during deposition residual gas molecules in the coating
chamber become trapped in the film. For high deposition rates at low
pressures fewer impurity molecules are trapped and the resulting film
is more compact and grows a thinner, tighter oxide layer upon exposure
to the atmosphere. It is the oxide layer which causesa decrease in
reflectance. The difference in optical properties of the present semi-
transparent films is now considered on a similar basis.
According to Berning, Hass and Madden (1960) an aluminium film
deposited under optimum conditions grows an oxide layer of about 15 2
after 24 hours exposure to air and will reach a limiting thickness of
some 22 2 after about 1 month. If the film is deposited at a slow rate
then the formation of a granular structure is promoted and the oxide
layer can reach a limiting thickness of 90 2 (Holland 1956). At /12200 2
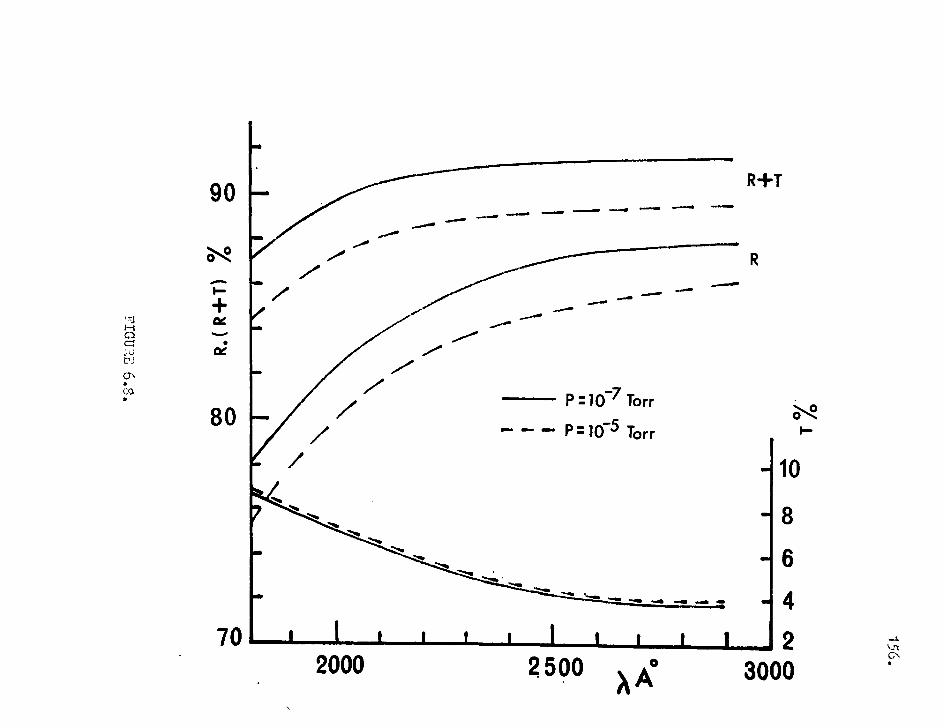
90 R+T .••••••• •••••••••
••••=1.1=11 •••••••••• •••••••••11
.ftweval.
I- P =167 Torr
- P=10-5 Torr
-10
I-
80
70 2000
— 8
—6 —4
11 2 2 500 A° Xral 3000

157.
values of (R + T) of 91% are obtained for the transmitting films deposited
under the improved conditions (aged 24 hours). The corresponding ( R + T)
values for the poorer conditions is 80. Computed results for aluminium
filmsovercoated with a non-absorbing layer of index 1.85 (refractive index
for A1203is 1.85 at 2200 R. Hass, Hunter and Tousey 1957), show that
( R + T) is 91% for an oxide layer of thickness = 15 R (See Chapter 4).
For an (R + T) value of 88% the corresponding oxide thickness would be
some 65 R assuming the same n and k values for aluminium.
However, one must also consider the fact that not only has the
evaporation pressure been reduced by two orders of magnitude but the
composition of the residual gas atmosphere is also likely to have been
altered. The residual gases present in the atmosphere of the coating
chamber are emitted from the various components present in the system.
Holland and Bateman (1962) have shown that the '0' ring seals can become
a dominant factor if made from silestic. A high content of water vapour,
oxygen and nitrogen has been observed in the residual atmosphere by
these authors when silastic seals have been employed and this has
been largely attributed to the permeability of these gases through such
seals. In the glass demountable system there was a considerable area
of seals of this type partly exposed to the coating chamber and it is
not unreasonable to assume that there was a high concentration of oxygen
and water vapour present in the residual atmosphere.
In the improved metal coating plant all seals were either of indium
or Viton A. With these types of seals the above authors found that there
was a considerable reduction in the amount of water vapour present in

158,
the residual gas atmosphere whilst the concentration of oxygen was
reduced to an extremely low level. In addition, the inclusion of the
liquid air Meissner trap inside the metal coating chamber condenses water
vapour which then has a neglimple vapour pressure at the trap temperature.
Typically, the chamber pressure falls by about an order of magnitude when
the liquid air is circulated through the trap. The effect of residual
oxygen in the gas atmosphere on the optical properties of aluminium
films has been discussed in Chapter 3. However, the presence of water
vapour will also have a serious detrimental effect on film properties
since aluminium will react with water vapour to form A1203 according to
the reaction
2 Al 3 H20 —* A1203 +3H2.
Comparison of the back surface measurements made on thick and opaque
films shows that lower absorption values are obtained for the improved
conditions of preparation resulting from a higher reflectance at the
aluminium-substrate boundary. This would suggest that under the poorer
conditions the substrate surface might suffer greater contamination
because of the higher water vapour content of the residual gas atmosphere
in the coating chamber. Also, under the poorer conditions not only is
the number of impurity molecules in the chamber atmosphere greater than
for the improved conditions but the relative concentration of oxygen and
water vapour is likely to be much higher. During deposition the growing
film will trap more impurity molecules and the film will be less compact
and grow a thicker oxide layer upon exposure to air. However, it is
perhaps unlikely that the oxide film will grow to 65 .R as indicated by

159.
computation since substrate contamination and other factors besides
oxide layer formation must be considered which will contribute to film
absorption.
After the discharge cleaning process (Chapter 5) the substrate
surface will become contaminated by the residual atmosphere of the
coating chamber. Water vapour will be condensed on the substrate surface
which may become covered with an adsorbed film. The adsorbed film can
be expected to lower the surface attraction forces of the substrate and
also its surface tension (Holland 1964). If the substrate contamination
is very great then water droplets are likely to spread over a larger
surface area of the substrate (because of the lower surface tension forces)
than if the water vapour concentration in the atmosphere is very small.
When the aluminium is deposited residual gas molecules in the chamber
atmosphere and vaporised substrate surface contaminants will become
trapped in the growing film.
Films deposited under the poorer conditions are likely to posses
a more porous structure and larger inclusions than those deposited
under the better vacuum conditions. After deposition and upon exposure
to the atmosphere the extent of the oxidation for the more porous film
will be more pronounced. Also, within the films oxidation will occur
because of the trapped oxygen and water vapour and again this will
probably be of a greater extent for the more porous films. The attack
of the aluminium by oxidation upon exposure to air and oxidation within
the films, and the presence of irregularities and inclusions caused by
trapped gases may lead to the breaking-up of the films observed in the

160.
optical microscope examination (section 6.3.3.). If this is indeed the
case, then it is to be expected that the size of the 'microholes' for
the more porous films will be larger than those which develop in the
films produced under the better vacuum conditions.
It was seen previously that the poureroptical properties were
associated with the films having a smaller surface area of microholes
but holes of a larger size. Whilst these films show a smaller density
of holes it is likely that the deposited aluminium is of a poorer quality
for the reasons outlined above. However, a more detailed explanation
of the formation of the microholes and differences in optical properties
brought about by the two vacuum conditions requires additional experimental
evidence. In particular, a detailed structural examination of the films
for the two preparation conditions would be required.
Nothing has yet been said of the aggregation or granularity of
the deposited films. The optical microscope study of the aluminium
films was not of a sufficiently high resolution to observe any indication
of an aggregated structure. From a molecular view-point, a continuous
layer will only be formed if the forces binding the aluminium atoms
to the substrate are greater than the forces binding the metal atoms
together (see e.g. Weaver 1962). It would therefore be expected that
any factor which will reduce the binding forces of the aluminium to the
substrate will contribute to an increased aggregation in the deposited
film. Thus, substrate contamination and the presence of trapped impurity
molecules are likely to result in an increased degree of aggregation
which also depends on many other factors including the surface mobility
/61
of the incident vapour atoms.(e.g. Heavens 1955). Again no definite
conclusions can be made in the absence of a detailed structural examination
of the films.
6.4.2. Changes in Optical Properties with Time.
Although the change in the optical properties of semi-transparent
aluminium films exposed to air has not been previously studied in the
far ultraviolet, extensive measurements have been made on the decrease
in reflectance of opaque films. For coatings prepared under 'Optimum'
conditions there is little change in R with time for wavelengths longer
than 2200 R. At shorter wavelengths however, the decrease in R becomes
very substantial. This change in reflectance has been attributed to
the growth of a surface oxide layer.(Chapter 3).
For transmitting films in the far ultraviolet it has been found in
this investigation that there is an increase in T and a decrease in R
and (R+T) with time during exposure to the atmosphere. The magnitude
of these changes becomes greater at shorter wavelengths (fig.6.3. and
fig.6.7.). For films deposited under the improved vacuum conditions
there is little change in optical properties after 24 hours exposure to
the atmosphere.
Again, the changes in optical properties for the transmitting
films can be examined on the basis of surface oxide layer growth but in
this case, any analysis is complicated by the uncertainty of the thick-
ness of aluminium converted to oxide. For an opaque aluminium coating
this problem is not so important. Because of this partial conversion
of aluminium to aluminium oxide it would be expected that an oxide layer

162.
would have a greater effect on the properties of transmitting films
than for opaque layers and this indeed has been found to be the case.
Turbadar (1959) has calculated the thickness of aluminium converted
to oxide purely from density and molecular weight considerations of the
aluminium and aluminium oxide.
Thus, h1 2M1 d2 h2 M2 d1
where h1 . the thickness of aluminium converted to oxide.
h2 = the total thickness of the oxide layer
rlil = the atomic weight of aluminium (27).
M2 = the molecular weight of oxide (102)
d1 = the density of aluminium (2.7 gmic.c.).
d2 = density of oxide (3.7 gm/c.c.)
On this basis, for an oxide layer of 20 R thickness, the thickness
of aluminium converted to oxide is 14.5 . and the increase in total
thickness of the deposited film is 5.5 R. Previously Hass (1949)
reporting on the properties of anodised aluminium films had found that
the thickness of the oxide coatings is 1.38 times thicker than that of
the aluminium layer replaced. This is in agreement with the above
relationship of Turbadar although the agreement is somewhat false in that
Turbqdar has taken a higher density than normally accepted for the A1203
layer 3.2 gm cm-3. However, employing the relationship h2/h1 = 1.38 an
indication of the expected change in R and T can be obtained by using
computed optical properties for aluminium films coated with different
thicknesses of non-absorbing surface layer of index 1.85 (Chapter 4).
As an example, the case of an oxide layer increasing from 5 to 15 R

163. in thickness will be considered. This change in oxide thickness is
approximately what might be expected for exposures to the atmosphere
ranging from a few minutes to about 24 hours, for a film deposited under
optimum conditions (Chapter 3). From the relationship given above this
increase in oxide thickness by 10R will reduce the aluminium thickness
by some 7 R. Suppose the original film (after a few minutes exposure)
is 275 R aluminium + 5 . oxide then after 24 hours exposure the resulting film will be 268 R aluminium + 15 R oxide. Computed changes of optical properties under these conditions are given below. These computed
changes are compared with values for a film prepared under the improved
vacuum conditions measured after 15 mins and 15 hours exposure to air.
(Optical properties change very little between 15 hours and 24 hours
exposure).
Change in Optical Properties with Time.
Wavelength(A) Calculated% Measure*
R T (R+T) R. T (R+T)
2600 -0.8 +0.5 -0.3 -0.7 +0.2 -0.5
400 -1.7 +1.0 -0.7 -1.6 +0.6 -1.0
1800 -2.5 +1.5 -1.0 -2.1 +0.9 -1.2
These measured and computed changes in optical properties are in
reasonably close agreement considering the assumptions which have been
made regarding thicknesses of oxide layer, conversion of aluminium to
oxide, optical constants of aluminium and oxide etc. At least these
computed results serve to illustrate that the changes in oxide layer
thickness which might be expected during exposure to the atmosphere, may

164.
to a considerable extent, account for the observed changes in optical
properties with time.
:n the case of the films deposited under the poorer vacuum conditions
great= changes in optical properties with time were observed (fig.6.3.
curves 3 and 3'). A similar calculation to the above could be made
to cv)mpare with measured values. However, in this case, the thickness
of cxide for different exposures is even more uncertain since for films
pro'iuced under poorer vacuum conditions it is known that the oxide grows
to a greater thickness and at a faster rate (Chapter 3). More important,
it is seen from comparing figures 6.7. and 6.8. that the aluminium films
p:epared under the poorer conditions can in no way be represented by the
crotical constants for aluminium which have been used for computation in
Chapter 4. For this reason, there is little information to be gained
by a comparison between computed and experimental data as was done for
the better optical quality films.
6.4.3. Film Absorption - Dependence on Film Thickness.
Hass and Waylonis (1961) state that the optical constants of
aluminium films evaporated at high deposition rates, remain unchanged
down to film thinknesses of 100 R. Their experimental results show
that atik5461 R a decrease in film thickness from 320 to 120 .R causes
an increase in absorption by about 5A whilst at 2200 R the corresponding
change in absorption is insignificant. These results are .strikingly
different },previously reported data and it has already been stated
(Chapter 3) that Burridge et.al. 1953 observed an almost linear increase

165.
of absorption with decreasing film thickness (atN.2600 2). However,
the deposition rate used was very much lower than that employed by Hass
and Vlaylonis.
The absorption of electromagnetic waves in a metal film arises from
both free and bound electrons although, depending on the wavelength of
the radiation, one of these sources of absorption may be dominant. The
contribution to film absorption from bound electrons would not be expected
to depend very greatly on the state of aggregation of the film but on
the other hand, the contribution from free electrons will depend quite
considerably on this factor due to scattering from the boundaries of the
e.ggregates(see Heavens 1955). Absorption arising from free electrons
is more important for longer wavelengths and the contribution to absorption
from bound electrons predominates at shorter wavelengths.
Sennett and Scott (1950) found thatfor visible wavelengths aluminium
films showed a maximum in absorption for film thicknesses of approximately
250 R. These authors have studied the effect of evaporation rate on
the structure of several types of metal films and suggest that the
migration of a metal atom after reaching the substrate is probably the
most important factor IadeterminiAgthe stable form of thin metallic
films. This migration depends on the nature of the metal, the nature
of the substrate and the substrate temperature. Also, the migration of
an atom is altered by the arrival of other atoms in the same vicinity
and this in turn is dependent on the rate of deposition. The principal
factors influencing the mobility of adsorbed atoms have been discussed
by Heavens (1955). Sennett and Scott found that aluminium films deposited

166.
in 2 secs 'had an aggregated structure for all thicknesses less than
300 R. The aggregates appeared to have poorly defined boundaries but
to maintain their individuality even in quite thick films.'
Levenstein (1949) also studied the structure of evaporated metal
films and found that the tendency to form agglomerates decreased as the
evaporation rate was increased. It was suggested that at a high rate
nuclei/ are initially formed from which a fine grain of deposition more
deposit grows.
Lebedeva and Lebedev (1965) have
of the propagation of electromagnetic
considered the theoretical aspects
waves in an homogeneous conducting
layer and derived expressions for the dependence of R and T on film
thickness (d). It was found that the absorption curve A = f(d) has a
maximum value when R and T are equal and it was concluded by these
authors that an experimentally observed absorption maximum of a film
at the intersection of the R=f(d) and T=f(d) curves can be regarded as
being a qualitative indication of the uniformity of the film. (It should
be rembered that Sennett and Scott observed an absorption maximum at a
thickness of 250 R and in the visible region R 89% and T'Z 2% for a
film of such a thickness.)
Experimental evidence regarding the dependence of absorption of
aluminium films on their thickness is far from conclusive. Walkenhurst
(1941) finds that for aluminium films deposited at fast rates there is
an absorption maximum (atA5500) for a film thickness of about 70 .
where a result which is strikingly in contrast to that of Sennett
and Scott. Other notable investigations have already been mentioned.
167
In the present investigation again this dependance is not at all
clear. For the films prepared under the poorer conditions there appears
to be very little variation of absorption with film thickness except for
very thin films (t;17/0) which are characterised by an increased absorption.
On the other hand, for coatings prepared under the improved vacuum conditions
there is a definite increase in absorption as the film thickness is
reduced, even for thicker films (fig.6.4.). It should be pointed out
however that in the former case film properties were determined after
times of 2 to 24 hours exposure to air and of course optical properties
are changing during this period (Section 6.4.2.). In the latter case,
unless otherwise stated, optical properties were always determined after
24 hours exposure and this gives a more suitable comparison of films of
different thickness. Yet even so, this cannot be the real explanation,
since it will be seen for protected aluminium films (whose optical
properties rennin stable with time) that no system4atic variation of
absorption with thickness was observed for films prepared under the
poorer conditions whilst for the improved conditions, again absorption
was found to increase as the altminium thickness was reduced.
Because of this dependence of absorption with thickness, agreement
between computed and experimental optical properties of the films
developed in this investigation can only be expected for the thicker films
and not over the wide range of thickness as found by Hass and Waylonis.

6.5. The Optical Properties of the Semi-Transparent Aluminium -MgF2
Double Layers.
In this section results are given for the optical properties of
transmitting aluminium - MgF2 films prepared under the two different
vacuum conditions previously discussed.
6.5.1. Films Prepared under the PorgVacuum Conditions.
A number of samples have been prepared in which the thickness of
the MgF2 layer (t) has been chosen to give optimum performance for the
wamiength region 1850 - 1900 R. From chapter 4 this requires a value
of t given by
nt = )o ri + 161 ) 4n
where n is the refractive index of MgF2 at the wavelengthAo and P is
the absolute phase change at the MgF2 - aluminium boundary. For Ao
1850.E and 1900 . values of t of 500 R and 520 R are required. As a
check on the MgF2 thickness several of the films were oonverted into
filters by the addition of a second aluminium layer after measurement
of optical properties had been completed. The thickness of MgP2 can
be determined from the wavelength of peak transmission (A) using the
relationship (chapter 4)
nt = 2ri
and the value of f appropriate to) . For t = 500 R the value of X
should be 2175 .R and it was found for all samples checked thatthe peak
transmission occurred close to this wavelength.
168

169,
Results of measurement of film properties after 24 hours exposure
to air are shown in figure 6.9. The delay time between completing the
aluminium evaporation and commencing the MgF2 deposition is about 30 secs.
The difference between the properties of these double layer films and
the single aluminium films prepared under identical conditions is quite
evident. The increasing value of R with decreasing wavelength arises
from interference of the waves reflected from the air-MgF2 and MgF2 -
aluminium boundaries. At wavelengths between 1850 - 1900 R the per-
formance should be optimum. However, the actual maximum in R occurs
at a wavelength of about 2100 R and not 1850 R simply because the re-
flectance of the aluminium is decreasing with wavelength.
In figure 6.9. the range of (R+T) values is shown for all but the
sample with the thinnest aluminium film (No.5.). No systemNatic variation
of film absorption with film thickness was found for all samples
transmitting up to about 12%. At 1850 . the range of the (R + T) values
is between 89.6 and 91.7%. This is to be compared with the (R + T) values
of some 85% obtained for aluminium films (aged 24 hours). The practical
aspect of this reduced absorption from the point of view of application
to P.P. spectroscopy is considered in section 6.7.
The optical properties of these double layer films were found to
be extremely stable with time. No variation in optical properties,
within the limits of error of the R and T values, were observed for
samples stored for several months in a dessicator.
The pronounced effect on ultraviolet optical properties caused by
overcoating an aluminium film with MgF2 is clearly ill13trated in figure 6.10.

92
90
88
86
84
82
80
78
76
74
72
70 5,R
68
66
64
62
60 I 1800 2000
I I i
2200
41E1=6 .Mam• 1111•=1, ••=11. 4=1•••
I I • 2400 2600 2800
22
20 tc'
18
16
14
12
10
8
6
4
2
"774J-:-

171.
Two samples are shown. For sample 1 the MgF2 thickness was chosen to
give optimum performance at a wavelength of 2000 R. (MgF2 thickness =
570 R). The MgF2 thickness of sample 2 was 230 2 to give a min lam A
reflectance at 2000 R. The difference in the (R + T) values at this
wavelength brought about by the different MgF2 thicknesses is over 7%.
6.5.2. Films Prepared under the Improved Vacuum Conditions.
In addition to the improvements made in the evaporation conditions
experimental techniques were also developed such that the MgF2 deposition
could be commenced within 20 secs after the completion of the aluminium
deposition. Also, improvements were made to give a closer control of
the MgF2 thickness during deposition. The variation of R, T and (R + T)
with wavelength for a number of samples is shown in figure 6.11. The
MgF2 thickness was chosen to give an optimum performance at 1850 2
(MgF2 thickwss = 500 .R)
The effect of a 450 2 MgF2 layer on the optical properties is
illustrated in curve d. The reduction in the (R + T) value caused by
the different MgF2 thickness is quite smn11 at 1850 2 but at longer
wavelengths the 50 R difference in thickness has a much greater effect
on optical properties. This is as expected from the computed curves given
in Chapter 4.
It is seen from figure 6.11 that the (R + T) values are dependent
on the thickness of the aluminium film as was found for the single
layer films deposited under the sane evaporation conditions.
Again optical properties have been found to be stable for coatings
stored in a dessicator over periods of several months.

, 90
R+T
R-- _.
, 2
T
1 I I . I I I I I I ' I 0 3 000 2000 2500
>I )41
70
60
172.
10
P. 1—
Figure 6.10,

80
70
90
a
b
(R+T)
d
a, R
•••• rm. .1•=8 •••••• ••••• •••••• •••••
gam
d,T
b,R
c,R ,
NM. ...... ....... ...... N.. ..or m... Nor ...... .... ... ammo . ..m. ••••• ... .... ..... „... ... .... ...... .... .,• ..m. ... ... .... .... ...• ••••• WM/ ••••• ...a C ••••
b
..mon ••••=1,
MIN
60 2500
0 3000
a, T
20
10
173.
FIGU LtE 6.11.
174.
6.5.3, A Comparison between Measured and Computed Optical Properties
for the Double Layer Coatings.
Figure 6.12 compares measured optical properties for a double
layer film prepared at 10-7 Torr with computed values for a 275 R thick
aluminium film overcoated with a 500 R thick MgF2 layer. The reasons
for the differences in the (R + T) values at shorter wavelengths is
not very clear, particularly in view of the good agreement between com-
puted and measured optical properties for the single aluminium films.
It is difficult of course, to establish if the double layer films are at
fault ori in fact:if the computed values are over optimistic. Measured
optical properties have been found to be perfectly reproducible. However
it is seen in figure 6.12. that after allowance for experimental errors,
the difference between measured and computed values of (R + T) is only
some 0,4%
Heavens and Smith (1957) have pointed out that the representation
of thin evaporated dielectric films by parallel-sided, isotropic homo-
geneous layers of constant refractive index is likley to be an over
simplification (see also Gonella and Robrieux 1962). Often films are
not homogeneous but can contain voids and also may consist of large
numbers of crystallites which may be randomly orientated or orientated
in preferred directions. This tendency for crystal growth is dependent
on the thickness of the deposited films. Schulz (1949) states that MgP2
films of thickness less than 1000 R are amorphous whilst according to
Heavens and Smith, electron diffraction studies indicate crystallites of

R + T )
2000
2500
Computcd propertics.
1Tcasurccl. II It
94
,x392
+ 90 cc
88
86
84
82
80
1700 x A

176.
size 50 - 100 R in films only a few hundred Angstroms thick. The
presence of such crystallites in the deposited film may lead to the
appearence of appreciable scattering, the magnitude of which will increase
at shorter wavelengths. This could perhaps partly account for the above
small difference in the (R T) values as also could strain in the double
layer films. (Schulz and Tangherlini, 1954).
6.6. A Discussion of the Optical Properties of the Double Layer Coatings.
At first sight a somewhat surprising feature of the results obtained
for the double layer films was that the (R T) values were not so critically
dependent on the two vacuum conditions of preparation employed, unlike the
case of the single aluminium films. It had been hoped that the improve-
ment of the optical quality of the aluminium films, would lead also to
an improved optical performance for the double layer coatings. The
subsequent increase in the (R T) values is not very great as can be
seen by comparison of figures 6.9. and 6.11.
The different forms of the R and T curves as a function of wavelength
are largely due to slight differences in MgF2 thickness. It will be
remembered that for the poorer vacuum conditions optimum performance
was aimed for the wavelength region 1850 - 1900 R whilst for the improved
conditions the MgF2 thickness was more strictly controlled for optimum
at 1850 R.
It is apparent from previous discussion that in reality the double
layer films are not simply aluminium µ MgF2 but are really of the form
aluminium - A1203 - MgF2. It might be expected that the delay period

177,
before applying the protective dielectric coating will have quite an
influence on optical properties. Cranfield, Hass and Waylonis (1966)
have studied the effect of this delay on MgF2 protected, opaque aluminium
films. At a wavelength 1216 .x, the reflectance of the combination is
lowered by approximately 1% if the delay time is increased from 15 secs.
to 90 secs. (pressure during delay being 10-6 Torr). Cranfield et.al.
have also shown that the effect of an interposed oxide layer on reflect-
ance is not so severe as the effect of a surface oxide layer of the same
thickness. For the different delay times used in the present investigation
(20 and 30 secs.) it would be expected that this difference would have
only a very small effect on optical properties, especially at wavelengths
above 1800 R where effects of oxidation on optical properties are not
so severe as at 1216 R.
It would appear from the evidence available in this investigation
that it is oxidation which is the dominant factor likely to account for
the different optical properties of the single aluminium films. For the
poorer vacuum conditions, it can be expected that the more porous structure
caused by inclusion of oxygen and water vapour will lead to more extensive
oxidation upon exposure to air than for the films prepared under the
improved vacuum conditions. However, when the aluminium films are
protected from oxidation by the MgF2 layer then, if in fact oxidation is
the dominant factor, smaller differences in optical properties would be
expected for the double layer films prepared under the two different
evaporation conditions. Small differences in (R + T) values which have
been observed for these double layers may be due to substrate contamination,

178.
structural differences in the aluminium films and oxidation before the
protective layer is applied. Evidence from the optical microscope exam-
ination would also suggest that oxidation plays an important role in the
breaking-up of the aluminium films (section 6.3.3.)f since for the
protected aluminium coatings no tmicroholest were formed in films stored
over periods of three years.
It should be pointed out that the main emphasis of this investigation
has been more concerned with the development of coatings suitable for
ultraviolet interference spectroscopy rather than with a detailed study
of mechanisms accounting for different optical properties. The models out-
lined above, in the absence of additional experimental evidence, can only
partly explain the experimental results discussed in previous sections.
In particular, a structural examination of the films is likely to give much
useful evidence.
The performance of these coatings from the point of view of application
to F.P. spectroscopy is considered in the following section.
6.7. Application to Multiple-Beam Interferometry.
The performance of coatings for P.P. spectroscopy are best presented
in the form ''A - NR (Jacquinot 1960). Such curves are particularly
sensitive to variations in coating absorption. (Chapter 2). For example,
if NR is 17 corresponding to a reflectivity of 83% the two values A = 10%
and A = 12% give respectively values of ''A = 17% and i.e. a difference
in absorption of 2% results in a factor of nearly two in peak transmission.
The effect of absorption becomes more pronounced for high coating reflect-

179. ivities as was shown in figure 2.2.
Figure 6.13 compares the performance of aluminium films prepared
under the two different vacuum conditions. The influence of the evaporation
conditions on performance is clearly evident, particularly at the shorter
wavelengths. In figure 6.14. results are summarised for both the single
and double layer coatings at a wavelength of 1850 R. The superiority of
the double layer films over single al, minium films is clearly evident and
the aluminium - MgF2 coatings at 1850 .R have a performance comparable
with that of highest quality aluminium films at 4000 R (Hass and Waylonis).
Moreover, the optical properties of the MgF2 overcoated aluminium films
remain stable over long periods. It should be remembered that much
hyperfine structure and absolute wavelength determination work has been
carried out in the past at longer wavelengths with coatings of poorer
performance than the present aluminium - MgF2 coatings at 1850 R. Whilst it is necessary that the aluminium film in the double layer
coatings must be thick in order to achtive a high reflectivity, the
transmission in the visible (for most applications) is still sufficient
to allow visual adjustment of a F.P. etalon employing these coatings.
This is an additional practical advantage over the single aluminium films
which must necessarily be more dense in order to obtain the same reflect-
ivity. As a consequenge, when single aluminium films are employed the
fringe intensity in the visible is much reduced making visual adjustment
of the etalon considerably more difficult.
As an example of what is now possible with the coatings developed
in this work, F.P. interferograms have been obtained of/\1849 of HgI.
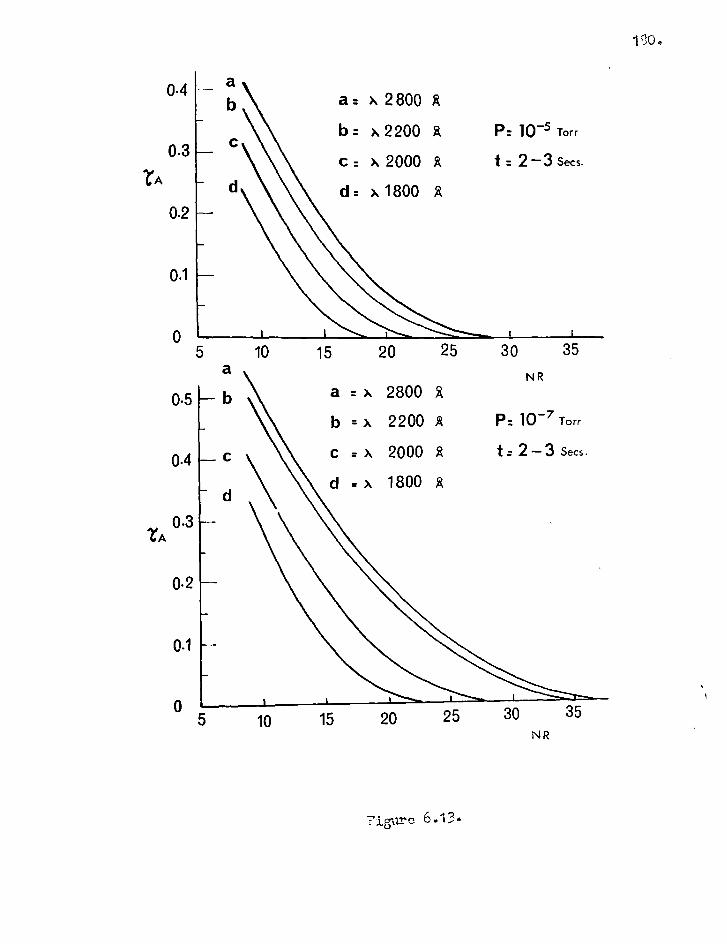
Torr
t = 2 -3 secs.
15 35 25 20 30
25 20 15 30 35 NR
NR a 2800 g
b = x 2200 A P: 10-7 Torr
C= X 2000 A t: 2- 3 Secs.
= x 1800 g
0.1
0 5
a
0.5 b
0.4 — c
d
10
10
a = x 2 800 A
b: x2200 A
c x 2000 A
d x 1800
0.4
0.3
0.2
0.3
0.2
0.1
c10
rigurc 6.13.

i N OE OZ SC SZ
0 01 S 1
Ji0.1. 6...01= d 0S81, X lb, — V
St 1
l'O
Z*0
E*0
V „2,
P*0
co• •••••••=,
'71. •9 °.1z12T1.i
(s!uoixom pur) ssoH) 00017X iv — CJ
OSEll X ZABwi ly — D
.4101 L-01. = d OS81 X iv — 9

182.
The 1849 line was isolated by two F.P. type interference filters (section
6.8.) which gave a transmission of 40 to 1849.E with a reduction in trans-
mission for the more intense 2537 R radiation by a factor of 700. The
fringe pattern was focussed onto the photographic plate (Ilford Type Q 2 )
using a 20 cm focal length 'Speotrosil ' lens. Focussing was achieved
by a method of trial and error todlotain optinum.(In chapter 7 the advantage
of an image converter camera for this purpose is illustrated). Because of
oxygen absorption of0849 radiation, the entire optical system between
source and emulsion was purged with dry, oxygen free nitrogen.
Etalon flats worked to match better than/150 in the green (Optical
Surfaces Ltd.) over a 6 cm diameter were coated over a 3 cm aperture with
aluminium - NgF2 to give a reflectivity of 800. The plates were assembled pi-64
in a convent' mount (Tolansky 1947) and adjusted for parallelism by a
small differential spring pressure. A plate separation of 1.m.m. was
employed.
Figure 6.15 shows interferograms obtained using a Hg198 electrociess
source operated from a 2500 Mc/s oscillator. In figure 6.15.(a) the fringe
pattern (etalon tilted) was obtained after the lamp had been switched
only for a few seconds. The recorded pattern after 5 minutes is given
in figure 6.15. (b) where there is now evidence of line broadening and
self absorption in the hotter source. Exposure times were 10 seconds.
Self absorption is more clearly shown in figures 6.16 (a) and (b) in
Which an Eastern Blackligbt 11-SC1 pencil lamp was used. Figure 616 (a)
shows recorded fringes for a 'hot ' and. 'cool/ source. It is seen from
these interferograms that there is some background in the fringes. This

FIG= 6.15(a)
FIG= 6.15(b)
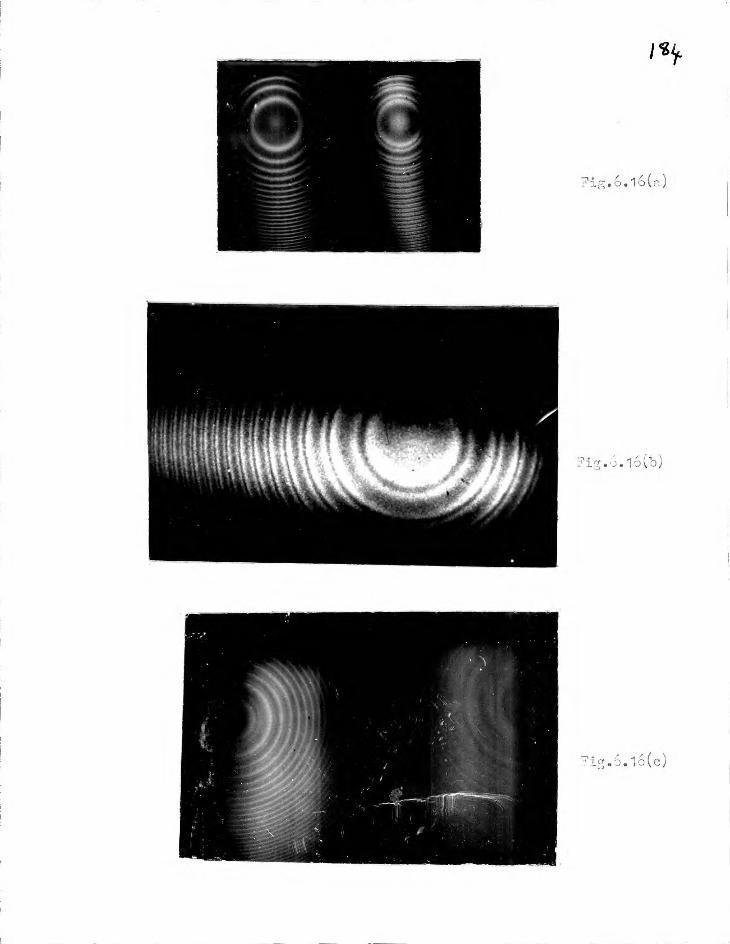
Fig.6.16(a)
Fig.o.16(b)
7ig.6.16(c)

185.
partly arises from the non-foccussed 2537 R fringe pattern because of
transmission by the filters of this more intense radiation. Figure 6.16 (c)
shows the contribution of this background. Recorded patters were obtained
with the optical system purged and non-purged (acme exposure). In the
latter case much of the 1849 radiation is absorbed by atmospheric oxygen,
The results given previously for the double layer films show that
coatings designed for optimum performance at a wavelength of 1850 R still
posses5useful values of R and (R + T) at longer wavelengths. Thus, a
satisfactory performance for application to multiple-beam interferometry
should still be obtained over a fairly wide spectral range with such
coatings. This performance at longer wavelengths is illustrated in figure
6.17 which shows recorded F.P. interferograms for/\2537 . of Hg I using
the same coatings and etalon plate separation as above. In figure 6.17.(a)
the source was a mercury 198 electrodeless discharge lamp and in figures
6.171(b) and(c) a natural mercury low pressure lamp (Philips) was employed.
Again self absorption is clearly evident.
6.8. F.P.Tvpe Interference Filters for the Far Ultraviolet.
The filters prepared in this investigation are of the type aluminium-
MgF2 - aluminium as discussed in Chapter 2 and shown schematically in
figure 2.7. A final MgF2 overcoating deposited onto the three layer
filter serves two functions. It prevents oxidation of the second aluminium
film and it also acts as an anti-reflecting layer at a wavelength corres-
ponding to the transmission peak, thus increasing the filter peak .brans-
mission. This requires a MgF2 layer of optical thickness (nd) given by

1516
Fig*6.17(a)
Fig.6.17(b) Fig.6 •17(c)

187.
nd =Ao P/4 /I
where Ao is the wavelength of peak transmission of the filter and is
the absolute phase change on reflection at the MgF2 - aluminium boundary
(Chapter 4).
Methods of filter preparation and measurement of filter transmission
characteristics have been described in Chapter 5 and section 6.2. respect-
ively. (The contents of this section have been published.Bates and Bradley
1966 (a) ).
6.8.1. First Order Filters.
Experimental transmission curves for a number of first order filters
are shown in figure 6.18. These filters were deposited onto fused silica
'spectrosil Bt substrates of either 1 or 2 m.m. thickness.
The spacer layer of filter A was chosen to give a peak transmission
at a wavelength of about 1725 R. However, the actual peak occurs at
1780 R due to the effect of increasing absorption of the spectrosil
substrate. If a thinner spacer layer had been employed, then a narrower
bandwidth could have been obtained since the transmission characteristic
of such a filter would be largely determined by the properties of the
reflecting layers at wavelengths longer than thel,peak wavelength and by
substrate absorption at shorter wavelengths.
The optical properties of the aluminium reflecting films can be
derived from filter characteristics (after correction for substrate
reflection and absorption losses) in the manner discussed in Chapter 2.
These derived optical properties given below clearly show the deterioration

1800 1900 2000 2100 2200 2300 2400 2500 -)?. x
1500 1600 1700
X(A) c xo(R) A 6X'
A 310 180 1780 B 280 330 1920 12.0 290 C 220 500 2000 11.0 260 D 185 350 2190 8.5 205 E 280 200 1825 12.5 305
CJ
Qs • —4,
•
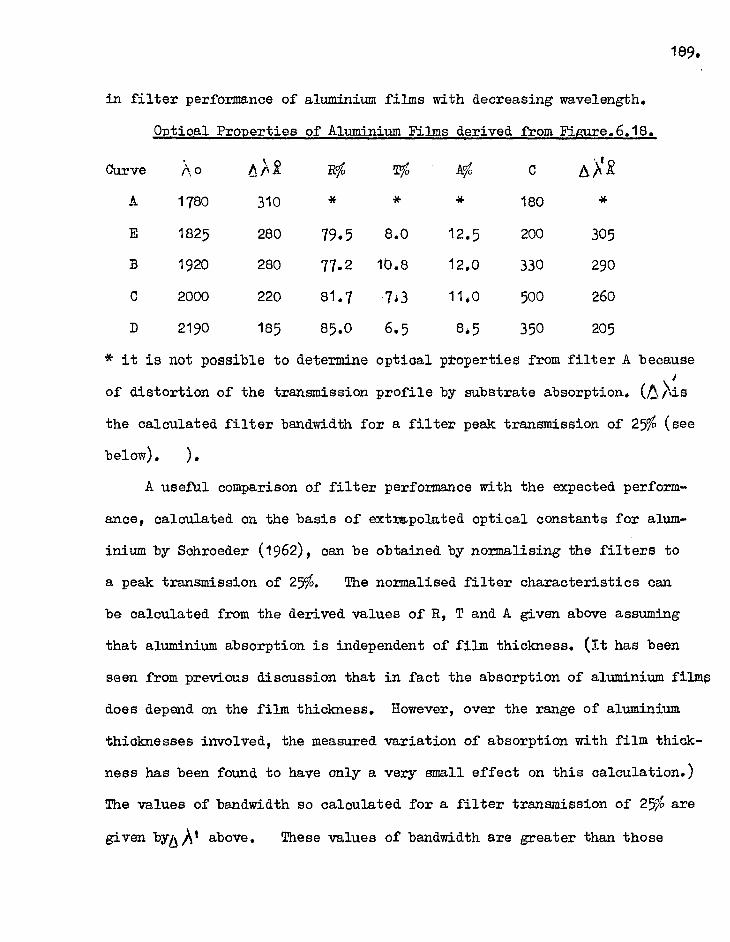
189.
in filter performance of aluminium films with decreasing wavelength,
Optical Properties of Aluminium Films derived from Figure.6.18.
Curve ?‘0 I\ ‘P-R R°16 T% A% C hit'R
A 1780 310 * * * 180 *
E 1825 280 79.5 8.0 12.5 200 305
B 1920 280 77.2 10.8 12.0 330 290
C 2000 220 81.7 7.3 11,0 500 260
D 2190 185 85.0 6.5 8,5 350 205
* it is not possible to determine optical properties from filter A because ki
of distortion of the transmission profile by substrate absorption. (Aids
the calculated filter bandwidth for a filter peak transmission of 25% (see
below). ). A useful comparison of filter performance with the expected perform-
ance, calculated on the basis of extrapolated optical constants for alum-
inium by Schroeder (1962), can be obtained by normalising the filters to
a peak transmission of 25%. The normalised filter characteristics can
be calculated from the derived values of R., T and A given above assuming
that aluminium absorption is independent of film thickness. (It has been
seen from previous discussion that in fact the absorption of aluminium films
does depend on the film thickness. However, over the range of aluminium
thicknesses involved, the measured variation of absorption with film thick-
ness has been found to have only a very small effect on this calculation.)
The values of bandwidth so calculated for a filter transmission of 25% are
given by6At above. These values of bandwidth are greater than those

190.
computed by Schroeder who did not take into account the phase change on
reflection at the aluminium - MgP2 boundaries.(Chapter 2.)
Figure 6.19, shows calculated values for filter bandwidth given by
Schroeder and recalculated values in which this phase term has been taken
into account (for filter peak transmissions of 25%). It is seen that
± there is good agreement, within 20 R, between correctly calculated
bandwidths and those derived from the experimental filter characteristics.
QN>t1 given above). The deterioration of the aluminium coatings at shorter
wavelengths is shown by the variation of NE with wavelength.
An important characteristic of a filter is its contrast or its ability
to reject light at wavelengths distant from the pass band. An arbitary
definition of contrast, which never the less permits useful comparisons to
be made between filters, is the ratio of peak transmission to the trans-
mission at 4000 R (Schroeder). Contrast values C for the first order filters
are given above. For a first order filter peaking at 1800 R the contrast
is of the order of 200. At wavelengths longer than 4000 R the trans-
mission of the filter is steadily decreasing due to the decreasing trans-
mission of the aluminium films with increasing wavelength.
Peak transmissions at wavelengths shorter than those shown in figure
6.18 may be obtained by employing lithium fluoride, calcium fluoride or
sapphire substrates. Figure 6.20. shows a first order filter deposited on
a sapphire substrate of 1.m.m. thickness. A narrower bandwidth would be
obtained with a thinner spacer layer by shifting the transmission peak
to shorter wavelengths as discussed above. An improved performance over

Nr
450
400
191.
350 -41
300
250
200
X 150
100 I I I I
20
18 ±
16
14
12
10
8
6
4
2
0
1500 2000 2500 X g
7IGUI-1E 6.19.

14
192.
T%
12
10
Sapphire Substrate
t = 1mm.
Cc 70
8
6
4
2
0
1500
2000 2500
X(g)
FIGURE _6.20.

193.
that shown in figure 6.20. would be expected from a filter deposited on a
lithium fluoride substrate because of the higher transmission of this
material compared to that of sapphire.
6.8.2. Second Order Filters.
It was shown in Chaptex 2 that for a given reflectivity of the alumin-
ium films, the filter bandwidth at a wavelengthAo can be reduced by in-
creasing the spacer layer thickness to employ higher interference orders.
The properties of several second order filters having transmission peaks
centred on wavelengths close to 2000 R are shown in figure. 6.21.
The optical properties of the aluminium films have been derived as
before from the filter transmission characteristics.
The Optical Properties of Aluminium, Films derived from Figure 6. 21.
Curve )%o Rf Tg A 7\i AA
B 1990 105 77.0 7.0 16.0 155
C 2130 80 82.5 6.2 11.3 110
A 2190 155 70.0 16.6 13.4 130
(6/;is again the calculated filter bandwidth for filter peak trans-
missions of 25A
Comparison with the optical properties derived from first order filters
shows that the aluminium films of these second order filters have an
apparently inferior performance characterised by higher absorption values.
This greater absorption may, infact, be due to increased scattering in the

V X
009p OOPP 00ZP 000t 008E 009E 0092 OM 0011 000Z 0091
°hi
011 E'll 09 OM D SS1 0-91 SOL 0661 0E1 rEl SC1 061Z V
ry ,V (g)X9 (11)°X
0
01
OZ
OE
195.
spacer layer since MgF2 become more crystalline for thicknesses greater
than 1000 Ro (Schulz 1949). For a first order filter peaked at a
wavelength of 2000 R, the spacer layer thickness required is approximately
420 R. However, for a second order filter peaked at the same wavelength
the corresponding spacer thickness required is about i100 R. Although
in this investigation no attempts have been made to construct filters of
higher than second order, the scattering within the spaoer layer with
increased thickness may well prove to be a serious limitation in the
performance of such filters.
6.8.3. Change in Filter Characteristics with Time.
The stability or otherwise, of filter transmission characteristics
over long periods of time is a matter of extreme importance for space
research applications. 'Whilst no attempt has been made to make a detailed
investigation of the change in properties with time the following obsaT-
vations have been made.
All filters show a change in properties within the first few days
after preparation and exposure to the atmosphere. The changes are
characterised by a shift in the transmission peak to a longer wavelength
and by a reduction in the peak transmission. This is illustrated in
Figure 6.22 which shows the transmission characteristics of a first ores
filter measured one day and fourteen days after preparation. During this
period no special precautions were taken other than storing the filter in
a dust-free atmosphere. No changes in properties have been observed after

196.
18 I
16-- \ ‘" • I
14 I
12
10
8
6
4
2 •
• • • • •
AGED J DAY •
)) 14 DAYS
0
OM.
MIN
1800 2000 2200A 2400
FIGURE 6.22.

197.
the first week up to periods of eight months after preparation.
These changes in properties of filters during the first few days after
preparation may be due to structural changes in the MgF2 spacer layer,
increasing absorption of the aluminium films because of continuing oxidation
or strain relief at the aluminium - magnesium fluoride boundaries,
(Schulz and Tangherlini 1954).
All the filter characteristics which have been shown were obtained
from measurements made at least one week after manufacture, after which
time the properties have become stable.
Conclusion.
First order interference filters with characteristics close to
theoretical values at wavelengths above 1800 R have been produced and
filters with 25% peak transmission and bandwidths of 300 R or less can be
made for the wavelength region 1800 - 2400 R not covered by multilayer
dielectric filters. This is a satisfactory performance for broad-band
photometry and three filters produced during this investigation will be
flown in 1966 for the purpose of obtaining stellar spectral energy dis-
tributions at wavelengths near 2000 R in an experiment designed by the
Royal Observatory, Edinburgh. For laboratory applications such filters
will permit additional filtering of longer wavelength stray light often
present in ultraviolet spectrometers and spectrographs. For some sources
440. these filters permit a simple and efficient means of isolating
particular radiations without the necessity of other methods of pre-
dispersion (as discussed previously for the 1849 line of Hg I).
198.
At wavelengths shorter than 1800 R, because of the increasing
absorption of aluminium films with decreasing wavelength, filter per-
formance deteriorates. Also, the demands on preparation technique become
more stringent if the expected performance shown in figure 6.19. is to
be realised.
The effective contrast of first order filters can be increased by
employing them in combination with wavelength selective detectors to
eliminate response at longer wavelengths (Dunklaan, Fowler and Hennes
1962; see also section 7.6.). Similarly, it would be necessary to suppress
the longer wavelength first order transmission of second order filters.
Composite filters consisting of two or more filters in series on the same
substrate would also substantially improve the contrast (Schroeder 1962;
see also Chapter 3).
CHAPTER 7.
199.
IMME INTENSIFIERS APPLIED TO 'NISH
CE SPECTROSCOPY. • Di
7.1. Introduction.
An additional aspect of the present work has been an evaluation of
the F.P. etalon - image intensifier combination. An apparatus to be
used for spectroscopic investigations may be broadly characterised by
the following parameters:-
1) Wavelength resolution.
2) Luminosity.
3) The number of spectral elements simultaneously recorded by the
detector (a spectral element being the wavelength interval corresponding
to the resolution limit of the entire apparatus.)
4) Time resolution.
5) Detector sensitivity.
6) Wavelength range.
7) Spatial resolution of the source.
The role of the photographic emulsion in spectroscopy is well known
but it possesses a major disadvantage, amongst other shortcomings
(Wilcock and Geake 1956), in its low sensitivity. Nowadays photoelectric
methods of detection have gained ground largely because the development
of multiplier photocells offersgreat advantages in sensitivity compared
with the photographic emulsion. The fundamental advantages of the
photoelectric detector lie in the high quantum efficiency of photo-

200.
cathodes and their linear response to radiation intensity. Modern photo-
cathodes can have an efficiency of conversion of photons to photoelctrons
in the order of 10% whilst the corresponding figure for the activation
of silver halide grains by photons incident onto a photographic emulsion
may be only about 0.1% (McGee 1961). At very low levels of light flux
the photographic reciprocity law breaks down and the emulsion becomes
progressively less efficient. Thus, the information gathered in one
spectral element in a given exposure time by the photographic emulsion
may be compared with that obtained by applying a photoelectric detector
to about 100 spectral elements in the same exposure time.
Against the inherent advantages of the photomultiplier as a detector
must be offset the fact that it records the total light flux and hence
only one spectral element at a time. On the other hand, the emulsion
can record simultaneously data from a large number of spectral elements.
Thus while one spectral element is being measured the light flux in
remaining elements is wasted and it is apparent that for the study of
extended spectra the photoelectric instrument will be relatively slow.
However, the type of problems which will really benefit from the use
of the photoelectric instrument are those in which only a few spectral
elements are required and in which the radiant flux in each element
is small. Such problems include high spectral resolution examination
of weak sources and diagnostics of sources at a high time resolution.
In such cases the accuracy of intensity measurement is limited by 'noises
arising from random disturbances inherent in the detector itself or in
the sense of statistical fluctuations arising from the random arrival

201.
of photons at the detector. These fluctuations can in principle be
averaged out by integrating over long time periods since, if on the
average n photons arrive per unit time at the detector then the R.M.S.
fluctuation in the number arriving in a time of observation t is given
.1 statistically as (nt)2.
photon stream is
s = nt = (nt) 2
This ultimate limit could only be reached if each incident photon produced
one detectable event which could be recorded. However, if q is the
quantum efficiency of the detector defined as the average number of independ-
ent detectable events produced by each photon then the highest signal-noise
ratio attainable is 1
s= ( n q
The significance of the greater quantum efficiency of photocathodes over
that of the emulsion where the integration time is to be limited is
immediately obvious.
The high quantum efficiency and the linear response to light intensity
of photoemissive surfaces combined with the information capacity of
photographic plates makes the image intensifier a particularly attractive
device for spectroscopic applications. For time-resolved spectroscopy
the F.P. etalon - image intensifier permits continuous monitoring of a
given source and more over enables spatial resolution to be simultaneously
obtained. Nothing of this sort is obtainable with scanning interferometers.
For ultraviolet spectroscopy an additional feature of the image intensifier
The signal-noise ratio associated with the

202.
which can be used to great advantage is its property of image conversion.
In this chapter some investigations of the etalon - intensifier com-
bination with particular emphasis on time-resolved and ultraviolet spec-
troscopy are given. The first part of this chapter deals with the
matching of the interferometer to the linear resolution limit of the
detector employed.
7.2. The Optimum Conditions for matching the Interferometer to the Detector.
In the spectrographic method of employing the etalon it is necessary
for optimum use to match the projected fringe halfwidth to the linear
resolution limit of the detector. The radius of the per' ring from the
centre of the fringe pattern has been given in equation 1.5. and is
rp =I 2pi
rfto 1
= f ( pit CI-) 2
where f is the focal length of the camera lens employed. The linear
halfwidth of the pTH fringe (6 r ) is given by a change in
p by an amount/1p = 1/N; N being the etalon finesse.
. = f 1 1 2
2N (t U p) 7.2.
Thus to match the halfwidth of a particular fringe p2 to the linear
resolution limit (g) of the detector requires a lens of focal length
f = 2gN (t p2 6 ) 2 7.3.
Since the spectral resolving power R.'f'" 2 Nt0. (see Chapter 2) then
f e•' g (2N p2 R)2
7.1.
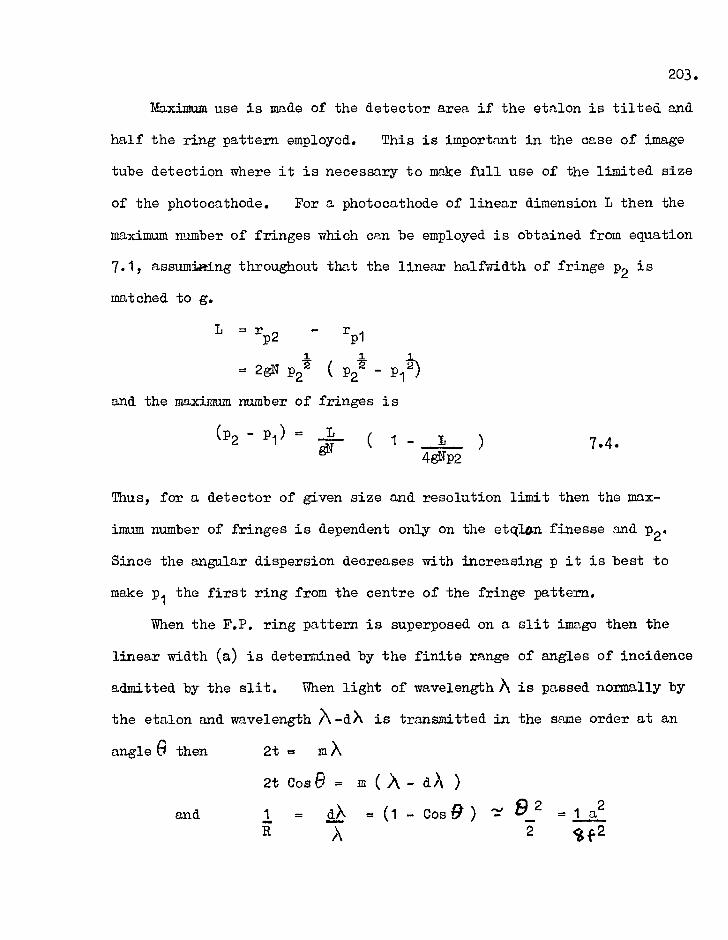
203.
Maximum use is made of the detector area if the etalon is tilted and
half the ring pattern employed. This is important in the case of image
tube detection where it is necessary to mrOce full use of the limited size
of the photocathode. For a photocathode of linear dimension L then the
maximum number of fringes which can be employed is obtained from equation
7.1, assumiRing throughout that the linear halfwidth of fringe p2 is
matched to g.
L r p2
20. p22
rp1
( P21 - P12)
and the maximum number of fringes is
(P2 — Pi) = ( 1 — L 7.4. giT 48VP2
Thus, for a detector of given size and resolution limit then the max-
imum number of fringes is dependent only on the etqlan finesse and p2.
Since the angular dispersion decreases with increasing p it is best to
make p1 the first ring from the centre of the fringe pattern.
When the P.P. ring pattern is superposed on a slit image then the
linear width (a) is determined by the finite range of angles of incidence
admitted by the slit. When light of wavelength A is passed normally by
the etalon and wavelength .A-dX is transmitted in the same order at an
angle e then 2t = mX
2t Case = m (A- clA )
and 1 = = (1 - cos 9 ) = 92 = 1 a2 R A

204.
which gives a linear slit width of
a = 4g J-1172. 7.5.
In an evalAion of the F.P. etalon-image intensifier combination for
time-resolved spectroscopy (section 7.5.) the fringe pattern superposed
on a slit image is swept across the photocathode of the intensifier.
Spectral resolving power of the swept image is little affected by ring
curvature for a slit of width given by equation 7.5. For the pTE ring
the maximum height of the fringe chord can be obtained from equations
7.1., 7.3 and 7.5. and is g (p2/p)1-. This is also the same value as the
halfwidth of fringe p calculated from equations 7.2 and 7.3. and therefore
the effect of fringe curvature does not alter from fringe to fringe.
7.3. Image Intensifiers.
In this section Only a brief account is given of the image intensifiers
which have been employed in the present investigation. Further details
of construction and performance may be obtained from reviews made by
McGee (1961) and Morton (1964).
7.3.1. The Single Stage Intensifier.
The simplest form of image intensifier is that in which an optical
image is focussed onto a photocathode producing free electrons. These
electrons are then accelerated and focussed to form an electron image on
a phosphor screen.where the electron energy produces a fluorescent light
image. Electron focussing may be acheived by electrostatic lenses or
by employing both an accelerating electric field together with a parallel,

205.
uniform magnetic field. If the photocathode and phosphor effeciences
can be made high enough and if a sufficiently high accelerating voltage
can be applied to the image tube, then a greater number of photons may be
produced by each photoelectron striking the phosphor than was required to
produce each photoelectron.
An analysis of this process has been given by Mandel (1955). For
example, for a ZnS; Ag activated phosphor screen the wavelength of the
emitted light is = 4500 .E (corresponding photon energy f.:f 2.75 eV).
Assuming a 20% eff4ciency of conversion of photoelectrons to photons for
electrons accelerated up to 15 KV(Bril and Klasens 1952), there will
be approximately 1100 photons liberated for each photoelectron striking the
1 rA screen. However, approximately — 3 of these photons are absorbed by the
phosphor screen and the glass window upon which the screen is deposited.
An opaque aluminium backing screen deposited onto the phosphor layer
serves to reflect photons into the forward 25direction and to prevent
light from being radiated back towards the photocathode. Approximately
66% of the photons produced in the screen emerge in the forward 2 solid
angle.
For a photocathode of 10afo efficiency this would represent a light
gain of about 70. If the phosphor output is to be photographed by eon-
veational optics this overall gain is necessarily reduced. For an F1
camera system the efficiency of transfer for unit magnification is about
4% and the overall photon gain is roughly a factor of 3. An order of
magnitude gain over this figure has been reported for contact print
recording (McGee and Wheeler 1961).

206.
7.3.2. Cascade Image Intensifiers.
An increased photon gain can be acheived by effectively cascading
a series of single stage intensifiers. Considerable effort has been
devoted to the development of cascaded phosphor-photocathode intensifying
screen tubes following the patent of the method by Philips Gloeilampen-
fabrieken in 1928 (see e.g. McGee 1961). In this method the phosphor
of one stage is deposited on one side of a thin glass or mica membrane
and the photocathode is deposited on the opposite side of the membrane.
Overall tube voltages of 30 - 40 XV have been employed.
The following values indicate the type of tube performances which
have been reported.
Number of Stages Light Gain Resolution / Reference (Line pairs mm -.)
4
3
105 r-v 10
15-18
23
Davis 1963
Catchpole 1963
3 5 x 10⁴ 50 Aslam 1965
2 900 65
The light gain referred to here is for input radiation of approx-
imately the same wavelength as that emitted by the phosphor output screen.
7.3.3. Transmission SecondnrJy Emission Intensifiers. T.S.E.
Image intensification may also be realised by accelerating the
primary electrons and focussing them onto a thin screen which has the
property of ejecting secondary electrons when bombarded with high energy
primaries (alcock, Emberson and Weckley 1960 a, b.). The screen or
dynode consists of an aluminium oxide supporting film coated on one side
with an aluminium backing 17m, and at the opposite side
207.
with the secondary emitting material. Both KC1 and BaF2 have been
employed for this purpose. Electron gain is achiped by accelerating
and focussing these secondary electrons onto a further dynode, a process
which is repeated until adequate electron multiplication is obtained.
The electrons from the final dynode are then accelerated and focussed onto
the output phosphor screen.
For an efficient dynode consisting of a 500 R thick A1203 film
and an equal thickness of KC1, a secondary emission ratio of 4-5 and 6-7
is obtained for primary electron voltages of 4 KIT and 5 KV respectively.
A serious disadvantage arises from the penetration of primary electrons
through the dynodes. For the above primary electron voltages this can
amount to about 10% and 25% of the primary electrons (Morton 1964).
These higher velocity electrons are not focussed on the output screen.
(see Section 7.5.). Also, the signal-noise ratio for this type of
intensifier is poorer than for the cascade tube due to greater fluctuations
in the multiplication process.
Light gains of about 105 and a resolution of 30 line pairs mm1 have
been acheived. Further developments in progress include that of making
the secondary emitting films of a porous structure and then applying an
electric field across the film. Secondary emission ratios of 50 or more
have been acheived in this process (see Morton 1964).
7.3.4. Electronogranhic Tmage Intensifier.
Much progress has been made at Imperial College by McGee and co-
workers on the development of an imPge intensifier in which the photo..

208.
electrons are accelerated upto a sufficiently high energy to penetrate a
thin mica window (approximately 4frethick). Recording of the electron
image is made with a nuclear emulsion which is pressed against the mica
window (Wheeler 1962, Khogali 1964). A remarkable image resolution of
90 line pairs mm-1 has been reported with a gain factor of some 10-20
over direct photography,
7.3.5. Channelled Secondary Emission Image Intensifiers.
In this method of intensification propooed by McGee 1953 the image
is divided into a two dimensional array of picture points. The photo-
electrons produced from each picture point are then multiplied in/lumber
in separate channels by the process of reflected secondary emission. The
multiplied output electron currents from the multipliers are then combined
to produce a fluorescent image on a phosphor screen or may be used to
generate a picture signal. Provided electrons can be prevented from
straying from their correct channels, then the definition of the final
image will be determined by the number of channels employed. The main
limitation of this device has been the difficulty in making the channels
sufficiently small and correctly aligning the dynodes in order to give a
reasonable image definition.(McGee, Flinn and Evans 1960; Flinn 1962;
Theodorou 1963; Wiley and Hendea 1962). Electron gains of 2 x 10⁴ with
a resolution of 2 line pairs mm-1 have been reported for experimental tubes
developed at Imperial College.
For this type of tube a high working voltage is not essential and
moreover this voltage need not be very precisely stabilised from the point
209.
of view of resolution, since the voltage does not affect the focus. No
magnetic focussing is required. Because of the small size and weight of
this device, the low working voltage (<10 KV) and its simplicity of use
then its main application may lie in the field of space research. For
in this type of application these advantages may outweigh the major
disadvantage of this device, namely its low resolution. The use of the
channelled intensifier with the F.P. interferometer is considered in the
following section.
7.4. The F.P. Interferometer - Image Intensifier Combination.
The results described in this section are for the F.P. interferometer
used with both a channelled and a single stage intensifier. The latter
tube was used to record first reported F.P. interferograms at a wave-
length<2000 R. (Bradley,Bates, Juulman and Majumdar 1964 a).
7.4.1. The Channelled Intensifier.
For a given resolving power, the superior angular dispersion of the
interferometer compared with grating dispersers reduces the demands made
on the linear resolution limit of the detector. For example, the angular
dispersion for an echelle grating of blaze anglee employed in a Littrow
mounting is 2 tanO/A. If the detector resolution limit is gi then the
focal length of camera lens required is
f = gi 11/2 tan()
where R is the resolving power.

210.
In the case of the P.P. spectrograph, then for the same values of
f and R the detector resolution limit required is g2 (section 7,2.) where
f= g2 (2 N p2 R)2
1 gl = 2 tang (2 N P2)2 -1-
g2 R2
For a blare angle of 63° then comparing the grating instrument with
an etalon of a finesse = 10, then for P2 = 4 we obtain
Ag
g2
Thus, for a resolving power of 104 the resolution limit of the detector may
be 2.5. times greater for the F.P. spectrograph than that required in the
case of the grating instrument.
In effect, for a given detector the focal length of the camera lens
employed in the grating instrument must be greater than that of the F.P.
spectrograph in the ratio W2 tan a(2 N p2)2. Since the illumination of
a spectral elemento(1/f2 then this increase in f leads to a reduction
in illuminationeeirecay '4/proportional to the resolving power.
The gain in illumination of a F.P. spectrograph over that of a
blazed grating spectrograph employed in the Littrow mounting is approx-
imately
G =A
Al 8 tane2 p2N.
where A and Al are respectively the utilised areas of etalon and grating
and equal transmissions of flux by each system is assumed. Taking the
211.
values of e p2 and N given above then Gr,' 0.8 for R = 104 and 80 for
R = 106 assuming an etalon area of 1/10TH that of the grating area. Use
of the grating off blase angle leads to a reduction in angular dispersion
and an increase in the value of G. The gain in illumination is entirely
due to the reduction in the focal length of the camera lens made possible
by the greater dispersion of the interferometer.
In the channelled intensifiers developed at Imperial College the
diameter of the separate multiplying channels is 0.5 mm giving an effective
resolving limit of 1-2 line pairs mm1
A tube with such a limited
resolution still permits a spectral resolving power of about 104 for a
camera focal length of 30 cm, an etalon finesse of 10 and employing the
second fringe(p2 = 2), of the Haidinger pattern (eqn.7.3.) Figure 7.1.
showsX5461 R interferograms of HgI recorded with a developmental
channelled intensifier made at Imperial College. The source was an
10sramt low pressure lamp and the 5461 line was isolated with a Kodak
filter. The camera lens focal length was 30 cm and the etalon finesse
for the 2 cm aperture employed was approximately 10, giving a spectral
resolving power of about 104 .
The etalon plate separation was 0.04 mm. and this was achtj.ved by
using 3 ball bearings as spacers. The steel balls were mounted 120°
apart in a stainless steel annulus and were polished to equal thickness.
Plates and spacer were placed in a conventional mount with spring adjust-
ments (Tolansky 1947) and parallelism achieved by a small differentiml
spring pressure. It should be mentioned here that whilst plate

212.
FIGU 7.1.

213.
parallelism could be easily achieved the use of ball bearings of this size
/ 1". . vm is not to be recommended, since for only small spring pressures the
steel balls caused indentations on the etalon plates. For steel balls
of greater than 3 times this diameter no troubles of this type were
experienced.
The gain of this experimental tube was not very uniform(fig.7.1)
but the results indicate the potential of the interferometer, simple image
tube combination in particular for space research applications.(section.
7.3.5.).
7.4.2. The Single Stags Intensifier.
It has already been seen in section 7.3. that the photographic gain
of the simple, single stage image intensifier is not particularly high.
However, one attractive feature of such an image tube is its property of
image conversion. Concurrent with the development work on ultraviolet
coatings for F.P. spectroscoy, a single stage image tube was constructed
by S. Majumdar (1966) and F. Barlow (Imperial College) having a fused
silica 1Spectrosil' end window and cathode plate. This image converter
camera and the newly developed coatings were both employed to obtain
the first reported P.P. interferograms of A1849 HgT.
The photocathode was SbCs3 of sensitivity 20//A lumen -1 equivalent
to a quantum effeciency of about 5%. Focussing of the electron image
onto the output phosphor screen (ZnS: Ag) was achieved with a uniform
axial magnetic field. The 1849 2 line was isolated using a prism mono -
chromator and the entire optical system from entrance slit to converter

214.
camera was purged with dry, oxygen free nitrogen in order to reduce the
air absorption of this radiation.
An Eastern Blacklight -ipe - 1 low pressure Hg lamp was mounted
within 1 ram of the monochromator entrance slit. This source was operated
with a choke and ballast resistance directly from the mains supply and the
operating current of 10 - 15 mu was not staWised. The 60° 'spectrosil'
prism was set for minimum deviation atA1850 R and the image converter
greatly aided this adjustment. A standard Hilger and Watts interferometer
type B297 with 1" diameter plates of flatness quoted asA/70 (in the green.)
was employed. The plates were coated with Al - MgF2 over a 2 cm aperture.
Because of the large source width of the 1849 2 resonance line of
this lamp (which was not cooled) it was necessary to use a large free
spectral range for the etalon. For this purpose 3 aluminium spacers
were made from foil of 0.075 mm. thickness and the foil folded to give
a spacer thickness of 0.15 mm. The spacers were mounted between the
etalon plates at 120° intervals and the plates adjusted for parallelism
by differential spring pressure. Using this method it was found to be
somewhat difficult to adjust for parallelism since if one spacer was
compressed too greatly it was then necessary to dismantle the etalon and
remake the spacers. However, once adjustment had been made for
parallelism the adjustment was found to be very stable and it would
appear that the thin foil had made a reasonable optical contact with the
etalon plates. This method was found very suitable for setting up
interferometers of small plate separation in spite of the frustrating
procedure for adjustment. In chapter 8 a more sophisticated approach
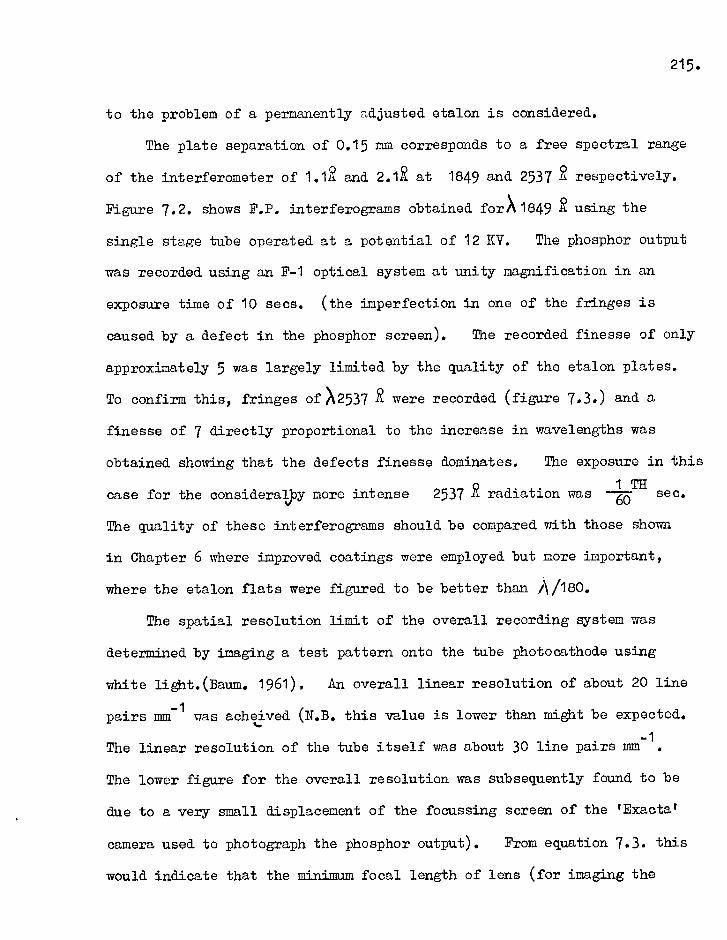
215.
to the problem of a permanently adjusted etalon is considered.
The plate separation of 0.15 mm corresponds to a free spectral range
of the interferometer of 1.1k and 2.1k at 1849 and 2537 . respectively.
Figure 7.2. shows F.P. interferograms obtained for)11849 R using the
single stage tube operated at a potential of 12 KV. The phosphor output
was recorded using an F-1 optical system at unity magnification in an
exposure time of 10 secs. (the imperfection in one of the fringes is
caused by a defect in the phosphor screen). The recorded finesse of only
approximately 5 was largely limited by the quality of the etalon plates.
To confirm this, fringes ofX2537 .R were recorded (figure 7.3.) and a
finesse of 7 directly proportional to the increase in wavelengths was
obtained showing that the defects finesse dominates. The exposure in this
1 0 TH
case for the consideralby more intense 2537 R radiation was 6 — sec.
The quality of these interferograms should be compared with those shown
in Chapter 6 where improved coatings were employed but more important,
where the etalon flats were figured to be better than )080.
The spatial resolution limit of the overall recording system was
determined by imaging a test pattern onto the tube photocathode using
white light.(Baum. 1961), An overall linear resolution of about 20 line
pairs mm-1 was acheived (N.B. this value is lower than might be expected.
The linear resolution of the tube itself was about 30 line pairs mm-1.
The lower figure for the overall resolution was subsequently found to be
due to a very small displacement of the focussing screen of the 'Exacta'
camera used to photograph the phosphor output). From equation 7.3. this
would indicate that the minimum focal length of lens (for imaging the

• •
FIGUYIE 7.2
•
MD
FIGU_IF 7.3.
216.

217.
fringe pattern) required to 7- atch this detector resolution limit need
be only about 4 cm. In fact, the focal length of camera lens used was
20 cm giving adequate resolution and the quality of the recorded fringes
should in no way be affected by the resolution limit of the detector
for this focal length lens.
A real advantage of the image converter camera over direct photography
for ultraviolet F.P. spectroscopy is that it enables the fringe pattern
to be focussed visually and a final photographic record to be obtained
using convential optics. For direct photography at wavelengths shorter
than 2200 R it is necessary to use the rather fragile ultraviolet
sensitive emulsions. (e.g. Ilford Q emulsion - Chapter 6) whilst the image
converter system permits the use of the standard photographic films
currently employed in the visible region. There is a further advantage
arising from the property of image conversion when it is required to
make relative intensity measurements in the ultraviolet over a range of
wavelengths. For example, intensity measurements from F.P. interferograms
requires a knowledge of the film sensitivity to the incident radiation
i.e. density as a function of relative exposure. This film sensitivity
is dependent upon the wavelength of the incident radiation. Using
the converter camera, the wavelength of the output radiation is dependent
only on the type of phosphor screen employed and is not dependent on the
incident radiation. This means that the film saafftcan be directly
obtained by projecting onto the converter camera a calibrated density
wedge and for this purpose visible radiation can be used. The value of
the film gamma so derived (for given development conditions) may then
218
be used for relative intensicy measurements for any other radiation of
different wavelength incident on the converter camera. This method was
used to determine the fringe intensity halfwidths for the interferograms
shown in figures 7.2. and 7.3. for the wavelenths 1849 and 2537 R,
by recording a white light image of a calibrated dens:Ity wedge with th,)
converter camera. Without the image converter it would have been necessary
to determine the film sensitivity at both these wavelengths. The full
benefit would of course be derived when a wide range of wavelengths is
to be recorded.
7.5. Time-Resolved Photoelectric Recording of F.P. Interferograms
In this section results are given of preliminary investigations
made toen.--aius:;;ethe performance of the F.P. etalon with electron-optical
image detection for time-resolved spectroscopy. It has already been
stated in chapter 1 that the oscillating F.P. spectrometer, which has
been powerfully applied to plasma diagnosis, suffers from a serious
disadvantage in that the time and wavelength dispersions are superposed,.
The use of the etalon with image tube detection overcomes many limitations
of the oscillating instrument and a brief comparison of the two methods
is given in section 7.5.6.
The principle of the method which was used to examine the performance
of the etalon-intensifier combination for time-resolved spectroscopy is
illustrated in figure 7.4.(a). The F.P. ring pattern superposed on a
slit image, as in the spectrographic method of use, is swept across the
photocathode of the image intensifier and the recorded output from the
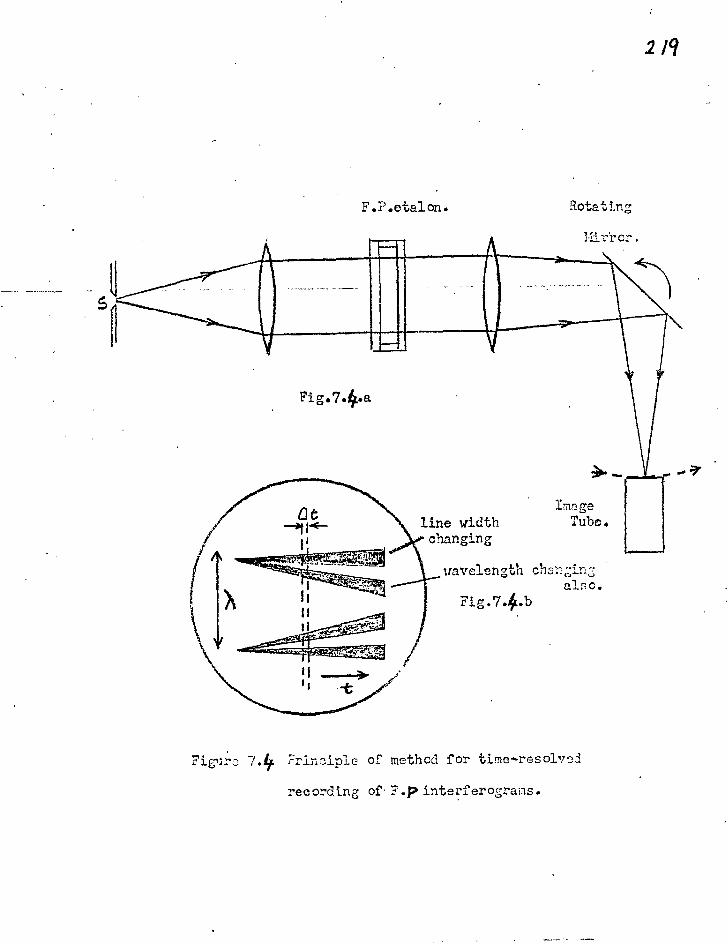
line width changing
F.P.etalon. Rotating
Image Tube.
Mirror.
Fig.7.4Aa
%rave-length chanzin,z also.
Fig .7.4.b
2/9
rie;r0 7.4F Frincipie of method for time-resolva3
recording of-F.pinterferograms.

220.
phosphor screen will appear as shown in figure 7.4.(b). It is now seen
that with such a system the time and wavelength dispersions are in
mutually perpendicular directions. For simple testing of the performance
the time scan was obtaining by using a rotating mirror. The phosphor
output of the image intensifier was recorded using an F-1 camera system
at unity magnification.
7.5.1. Single Stage Intensifier.
Initial tests were carried out by the author using a single stage
magnetically focussed image tube. The light source was a high pressure
Hg lamp and the 5461 2 line was isolated using a Kodak filter. For the
etalon plate separation of 4 mm and silver coatings of -0- 89% reflectivity
a spectral resolving power of about 3.2. x 105 was obtained.
Figure 7.5. shows a swept scan of the 5461 R fringes at a time
resolution of 6 x 10⁻⁴ secs. There are 60 time elements on each fringe.
A microdensitometer trace of the central fringes is shown in figure 7.6.
Variations in intensity and halfwidth arise from instabilities in the
high pressure Hg lamp.
Further tests using essentially the same technique were carried out on
cascade, T.S.E. and Lenard window tubes. This work was undertaken
by C.O.L. Juulman. (Bradley, Bates, Juulman and Majumdar 1964 b) and
these results will be merely summarised.
7.5.2. T.S.E.Tube,
The system was tested with a 5- stage T.S.E. intensifier (20th
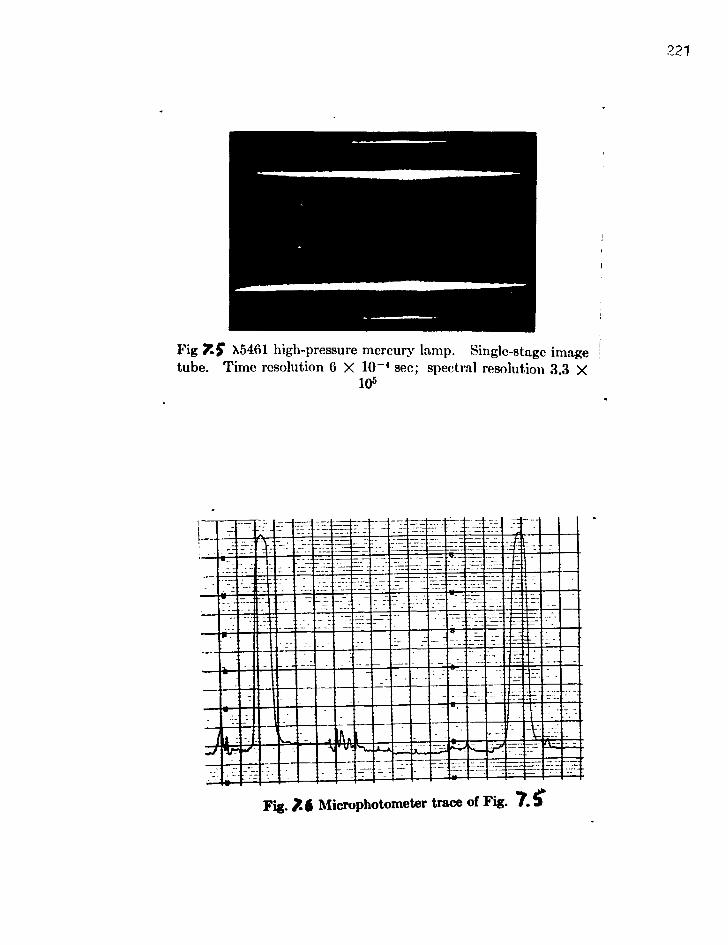
Fig Z5 X5461 high-pressure mercury lamp. Single-stage image tube. Time resolution 6 X 10⁻⁴ sec; spectral resolution 3.3 X
105
NB EMU "MEE MOIMMIN11111111 11111111111111111MINEFIEM9NIIIIIII 1111111111M111111111111111111111111111111 1111111101111111111E11111111111PMEN1111 1111111.11111111111$1111211111111E1111111 111111111111111111101011111111111111111111111 1111111111.111111111.11111111111111111M1111 10.1111111111111111111111111•11111111111 111111111111111111‘11111111111111O1111111.1111111 1111111111121iiiiiIIIMMEMEE
Fig. Z6 Microphotometer trace of Fig. 7.
221

222,
Century electronics Type I P M 29/25) which was magnetically focussed.
This tube had a linear resolution of 30 line pairs mm1 and a blue
light gain of 105 at 33 KV. The background scintillations at this
voltage amount to 103 sec cm2. Figure 7.7. shows a swept scan for the
A 5461 line of a high pressure Hg lamp using a tube operating voltage of 26
KV. The time resolution limit corresponds to 2 x 10⁻⁶ secs and 80
time elements per fringe are shown. Spectral resolution in this case
is about 3 x 10⁴.
Figures 7.8.(a) and (b) show respectively static fringes obtained by
direct photography and recorded with the T.S.E. tube. The presence of
a signal induced background is clearly evident.(section.7.5.5.).
7.5.3. Cascade Tube.
Figure 7.9. shows scanned fringes obtained using a 3 stage magnetic-
cally focussed cascade tube developed at Imperial College (McGee and
Catchpole 1962). Time resolution in this case is 10-5 secs with 50
time elements on each fringe. The spectral resolution is again approximat-
ely 3 x 10⁴. Unfortunately the light gain of this tube had fallen at
the time of these experiments and a greater time resolution could not
then be attained.
7.5.4. Lenard Window Tube.
A Lenard window tube also developed at Imperial College was
employed (McGee and Wheeler 1962) but due to a low cathode photosensitivity
only a moderate time resolution was achieved, The tube was operated
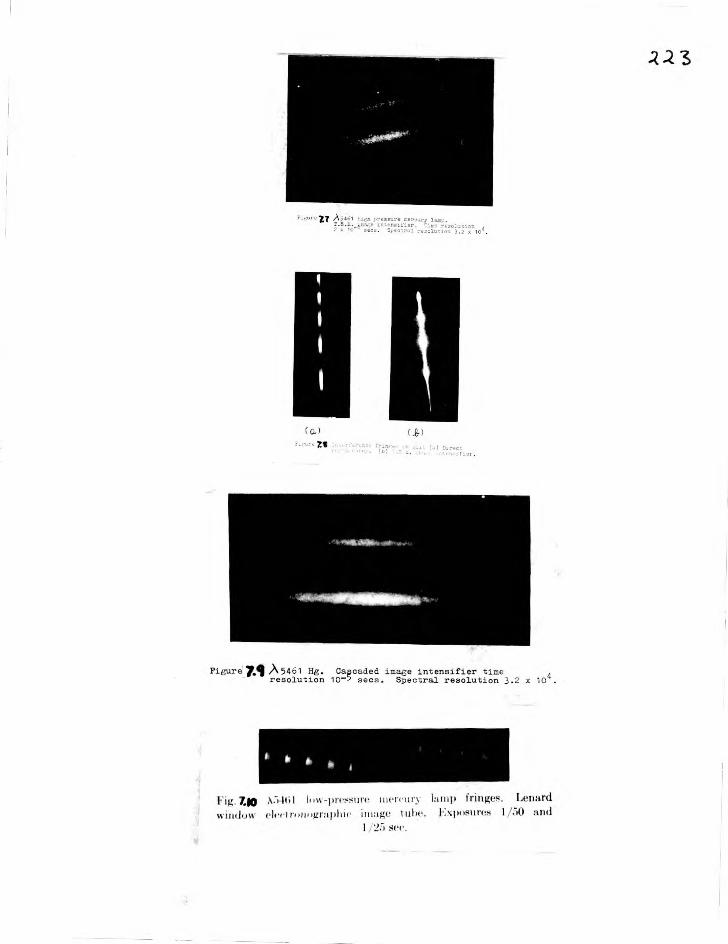
Figure/7 ,k54I51 high pressure mercury,lasp. T.S.B. eage intensifier. '3,1se resolution , 2 x 10— secs. Spessrul resolution 3.2 x 10'.
(a) (41 Fus.rs Zgl c rn (u) airest
FigureltlIA5461 Hg. Capcaded image intensifier time resolution 10-2 secs. Spectral resolution 3.2 x 10⁴. •
•
Fig. Zip A5-161 low-pressure mercury lamp fringes. Lenard window elect ronographie image tube. Exposures 1/50 and
1 /25 sec.

224.
at 40 KV and the electron image was recorded on Ilford G 5 nuclear emulsion
using the technique described by McGee and Wheeler (1962).
Figure 7.10 shows A 5461 R fringes obtained using a low-pressure Eg lamp in exposure times of
I/50 and
I/25 sec. The spectral resolving
power is 3 x 10⁴. Because of the low photocathodes sensitivity it was
not possible to obtain a time resolution -1(10-3 secs with the lamp
employed.
7.5.5. A Comparison of the Different Intensifiers for Time- Resolved
Spectroscopy
From these preliminary experiments on the performance of the
etalon - intensifier combination it is possible to draw some conclusions
regarding the suitability of the different types of intensifier for time-
resolved recording of F.P. interferograms. For the T.S.E, tube, which
was operated only at a potential of 26KV, the signal induced background
and noise and the wide spread in multiplication factor in producing
secondary electrons causes a decrease in the effective signal-noise ratio
in the recorded image. This presents a severe limitation in the applica-
tion of this device to the problem under consideration.
The fact that the noise is signal induced and not due to dark
background was confirmed by operating the tube with no incident signal
of the photocathode. For the period of exposure equivalent to that
shown in figure 7.7, no background was discernible. The signal in-
duced noise is mainly due to the effect of unfocussed penetrating primary
electrons, whilst the signal induced background is probably largely

225.
the result of focussed electrons. This latter effect arises from the
incident radiation transmitted by the photocathode being reflected back
to the cathode from the first dynode.
For the single stage intensifier the signal induced background is
much smaller since there are no penetrating primary electrons and in
addition, the incident radiation transmitted by the photocathode is
reflected from the aluminium backing layer of the phosphor screen situated
some 20 cm from the cathode. In the case of the T.S.E. tube the first
dynode is situated about 7 cm from the cathode. Because of tie much
smaller solid angle subtended at the cathode by the phosphor output
screen compared with the solid angle subtended by the first dy3 ode of the
T.S.E. tube, the effect of back reflected light is considerably reduced.
In the case of the cascade intensifier there are again no penetrating
primary electrons and the signal-noise ratio is much superior to that
of the T.S.E. tube.
For the Lenard window intensifier the signal-noise performance is
outstanding and the excellent recording of the fringe pattern is in-
dicated by the absorption line in the fringes shown in figure 7.10.
Additional gain for this devi& could be achieved by the inclusion of
a phosphor-photocathode gain stage. The gain stage would increase the
photographic speed by a factor of 50 - 100 although this would be at the
expense of some loss in linear resolution. The Lenard window tube
certainly appears to have a high potential for spectroscopy in view of the
superb signal-noise performance. In addition, this tube has an
advantage of a linear density -exposure relationshipoNcGee and Wheeler

226
1962).
7.5.6. A Comparison between the Oscillating F.P. Spectrometer and the
Etalon-Intensifier Combination.
A real disadvantage of the oscillating spectrometer arises from
the fact that time and wavelength dispersions are superposed. Thus,
if the(-talon finesse io N, it is necessary to scan at a rate N times
faster than the rate of change of the phenomena under investigation. This
leads to a waste of photons and consequently a reduction in the signal-noise
ratio attainable with a given source. Continuous monitoring of the
phenomena is evidently not possible. In addition, since a point source
must be employed simultaneous time and spatial resolution cannot be
obtained.
L further disadvantage arises from the dynamical bowing of the moving
etalon plate at high scan rates (Greig 1965) which consequently places a
restriction on the finesse attainable. However, although in the current
oscillating F.P. spectrometers the minimum resolvable time is set by
practical limitations, there is a theoretical minimum resolution time
whenever the F.P. interferometer is employed. This limitation is set
by the time taken for a wavefront to pass through the etalon forming a
large number of transmitted wavefronts which interfere to form the
Haidinger fringe pattern. Ideally the number of interfering beams is
Infinite and the intensity distribution is given by the Airy formula
(Born and Wolf 1964). However, when the number of interfering beams
is other than infinite but is some finite value p , the resulting in-

227.
tensity distribution is the same as for the Lummer - Gehrcke interferometer.
1 + G Sint (1 /2 ( 1 - 0)2
Io 1 + F Sin2(1 /2
where G = 4 RP/(1-0) 2
4 R /(1-R)2
(Born and Wolf.)
and phase difference between successive beams
(4r1nt Cose/A )
When p is finite then it is found that the etalon finesse N has the
same value as obtained for an infinite value of p (chapter 2) provided
the reflectivity of the coatings is not too large. For a coating ref-
lectivity of 94% an etalon finesse of 50 is obtained for p infinite
(perfect plates are assumed). However if the number of interfering
beams is 30 then the resultant finesse for this reflectivity is only 30
(see Born and Wolf 2nd revised edition p 346). For an etalon plate
separation of 0.25 cm (corresponding to a free spectral range of 1R at
A5000 R) the time taken to build up the fringe pattern for the 30
interfering beams is 5 x 10⁻¹ °secs, which is the fundamental time resol-
ution limit for this given spectral resolving power (1.5 x 10⁵). Thus,
with the oscillating F.P. spectrometer such a time resolution can only
be achy.pmd at the expense of spectral resolution. Or alternatively,
if the spectral resolving power is to be maintained, then a sacrifice
must be made in time resolution by a factor N (in this example = 30).
In addition, since a photomultiplier is employed in the F.P. spectrometer,
variations in time of electron flight for light incident on different

228.
positions of the photocathode lead to an ultimate time resolution, Recent
developments in photomultiplier design have greatly reduced these variations
- and photomultipliers capable of a time resolution of about 10
10 secs for
employment of a cathode area of a few m.m. have been reported.(Rees and
Parker Givens 1966). According to Butslov et.al. (1962) an image inten-
sifier exceeds the best photomultipliers by at least 3 orders of magnitude
with respect to time resolution.
The luminosities of the F.P. spectrometer and the etalon - intensifier
combination are not very different. There is a gain in luminosity over
the spectrometer arising from the fact that the fringes are continuously
and simultaneously recorded and not for just 1/Nth of an order at a time.
(Nalyshev, Razdobarim and Sokolova 1963). If m fringes are utilised
the total gain is m N. However, there is also a loss in luminosity
since for a slit width (a) then only a fraction of the complete ring is
recorded given by (section 7.2.).
si2n r = (Np)2
Best use is made of the photocathode area if the etalon is tilted and only
half the ring pattern employed. Thus, for each fringe the gain in
luminosity is
G 1 (
I
which for normal values of N and P employed differs little from unity.
However, it must be remembered that because of the parabolic
dispersion of the interferometer then, whilst the density of each fringe
remains constant, the elementary resolution area decreases with increasing
P. Thus, by increasing p to gain spatial resolution a small sacrifice
has to be made in the luminosity. This follows from equation 7.3. since

229
the focal length of the camera lens must be appropriately chosen to match
the halfwidth of fringe p to the detector resolution limit.
A comparison of the two methods of using the interferometer is based
on the assumption that the signal-noise ratio of the intensifier is not
lower than that of the photomultiplier. In the intensifier the device
noises do not add up since each point on the input cathode is represented
by a point on the output phosphor screen. However, it has been seen
that in the case of the T.S.E. tube the signal-induced background and
noise is at present a serious drawback in the use of this device for
time-resolved spectroscopy. This drawback was not encountered for the
other intensifiers which have been tested.
7.5.7. Electron-Optical Sweeping.
The preliminary investigations discussed above indicated that the
etalon-intensifier combination is a powerful method for time-resolved
spectroscopy, particularly since it overcomes many of the drawbacks
of the oscillating instrument. This work has since been continued and
further developed by Bradley and Majumdar (1966) using the intensifier as
an active element employing techniques for image storage (McGee,Beesley
and Berg 1966) and electronic shuttering (Mandel 1961). A multiple-beam
tube has been developed which is designed to produce consecutive discrete
time-resolved interferograms. For diagnostic spectroscopy only a small
picture area is required and it is possible to store time-dispersed
photoelectron images inside an equipotential drift section which are
separated out into time sequential frames by multiple reflection and

deflection in mutually perpendicular electric and magnetic fields. The
application of a low voltage gating pulse at the end of the event being
investigated then extracts these frames which are imaged onto the in-
tensifier output phosphor screen. (Majumdar 1966).
7.6. The Wavelength Selective Photocathode.
In recent years there has been considerable development of wavelength
selective photoemissive surfaces which respond to radiation in the far
and vacuum ultraviolet but which are insensitive to light of longer
wavelengths. Such surfaces have been described as beinglsolar blip d
indicating that they are relatively unresponsive to radiation of wave-
lengths longer than 3000 .R corresponding to the approximate ultraviolet
cut off of solar radiation by the earth's atmosphere (Dunkelman 1955).
A review of the properties of solar blind photodetectors has been given by
Dunk]zpman, Fowler and Hennes (1962).
Spectrally selective photocathodes are particularly attractive
for astrophysical applications and also for laboratory applications
wherever long wavelength stray light is undesirably large. The
spectral response curves for representative ultraviolet photocathodes
are shown in figure 7.11. (Dunkelenan and Hennes 1964). It is seen
that the Cal cathode is relatively unresponsive to wavelengths greater
than 2100 2 and at 1850 R the quantum efficiency is about 0.7%, which
increases at shorter wavelengths, The use of a photomultiplier with
CsI cathode together with experimental interference filters developed
in the present work for broad band stellar photometry below 2000 R has
230.

Cs-Sb
10330 Fiin(Relative)
z
1-10
a
100
rt
Cs-1
K-Br
Cs-Te
Sapplse
11
r.-
POO 1500 2000 2500 3000 3500 4000 4500 '000 5500 cono WAVELENGTH (ANGSTROMS)
Spectral response of typical UV photocathodes.
(7) Lir C) CaF2
- 0 Sapphire 141203) 1,1111
1000 1500
Fused Slir.a 0 Coming 9-54
0 ADP 0 Coming 9100
NiSO4 1112016 ® Corning 0-54
2000 2500 3000 WAVELINGTH (ANGSTROMS)
UV optical materials. Transmittance curves, uncorrected for surface reflections, are shown for materials of thickness: 1-1.2 mm; 2-1 mm; 3-1 mm; 4-1 mm: 5-2.5 mm; 6-3 mm; 7, 8, and 9 are each about 2mm.
CaF 2 Fused Silica
o-'
a
0 1
Spectrally selective UV photodetectors. These curves are produced by combining some of the cathodes and filters
2003 2500 WAVELENGTH (ANGST01MS1
1 1 t 3000 3500 1000 1500
, 7

232.
already been mentioned in Chapter 6. It is quite apparent that an image
intensifier with a selective cathode would also have many advantages for
fax ultraviolet spectroscopy. Dunkelman and Hennes (1964) have described
an image converter camera employing a OBI photocathode.
Such an intensifier would have been of great benefit in recording
the 'ph1849 HgI interferogrames shown in Chapter 6. These fringes were
recorded by direct photography employing interference filters to isolate
the 1849 R radiation. Because of the long wavelength .:7:11.1 of these
filters it is seen that the considerably more intense 2537 R radiation
contributes a background to the 1849 R fringe pattern. Recording of
the fringes with an intensifier employing a CsI cathode would eliMinate
response to the 2537 A° radiation giving a much improved constrast. On
the more practical side, the property of image conversion from ultraviolet
to visible would greatly facilitate focussing of the fringe pattern.
More generally, for application to vacuum ultraviolet spectroscopy the
effects of stray light of wavelengths longer than 2100 R would be eliminated.
In the present programme on developing techniques for ultraviolet
interference spectroscopy, the construction of an image intensifier for the
far ultraviolet was begun but for a variety of technical reasons has not
yet been completed. Constructional details of the tube, cathode preparat-
ion and expected performance have been discussed by Majumdar (1966).
Essential]y the proposed device consists of a CsI photocathode and a con-
vential output phosphor screen but with the inclusion of a phosphor-pho',-0-
cathode gain stage (section 7.3.). The operating voltage of the tube
would be 30 - 35 KV and a uniform axial magnetic field used for focussing

the electron image.
For a good quality phosphor-photocathode sandwich an incident photo-
electron of energy t' 20 KeV should realise a yield of 70 to 100 photo-
electrons. These electrons are then accelerated through a potential
of ed 15 KV and focussed onto the output screen. For a Cal cathode of
0.7% efficiency then a photon gain of about 400 could be realised. Two
stage intensifiers developed at Imperial College have been reported in
which the linear resolution in 65 line pairs mm 1 (Aslam 1965).
It is apparent that an intensifier of this type would have a high
potential for vacuum ultraviolet spectroscopy. The first stage of
development was for a tube using a 'Spectrosill end window and cathode
plate. Extension to shorter wavelengths could be acheived by employing
LiF in place of the Spectrosil. At shorter wavelengths additional
photon gain would be realised because of the increasing quantum efficiency
of the CsI cathode Uhilst no such tube has been completed,
although near completion was reached on more than one occasion, valuable
experience has been gained in the techniques required, in particular
for the preparation of the CsI photoemissive surfaces (Majumdar 1966).
In view of the promise of such a device it is hoped that this work will be
continued.
Furier useful developments might include the extension of the
spectral range of the Lenard window tube into the vacuum ultraviolet
with also the inclusion of a phosphor-photocathode gain stage.
233.

234.
CHAPTER 8.
SOME RECENT DEVELOPMENTS IN THE APPLICATION OF
THE F.P. INTERFEROMETER TO SPACE RESEARCH.
Introduction.
Advances in the detection, identification and measurement of wave-
lengths in the solar spectrum have usually followed new developments in
optical instrumentation. Spectrographic equipment is required which
possesses a sufficiently high spectral resolution and dispersion such that
closely spaced lines can be separated. Additionally, the spectrograms
must be calibrated with sufficient accuracy so that meaningful wavelength
assignments can be made.
TR During the 19 century advances were made in spectroscopic tech-
niques which provided the basis for the mapping of the visible solar
spectrum. Fraunhofer ruled a plane transmission grating and visually
observed 571 dark lines in the solar spectrum. Angstrom measured the
wavelengths of over 1000 Fraunhofer lines whilst during the period 1895 to
1897 some 20,000 solar absorption lines in the wavelength region 2975 to
7330 R were measured by Rowland with his new concave grating as the dis-
persing element. In 1902 Fabry and Perot applied their interferometer
to the accurate determination of wavelengths in the solar Praunhofer
spectrum.
The current method for improving the resolution and dispersion of
spectrographic instruments designed for the visible spectrum is to rule
larger gratings and to construct larger spectrographs. The standard

235.
solar atlas currently used for this wavelength region was obtained with
a plane grating spectrograph 23 metres long having a reciprocal plate
factor of 0.3. m.m.-1 and a theoretical resolution of 1.5 x 10⁵
(Minnaert, Molders and Houtgast, 1940).
From ground based observatories, ultraviolet solar emissions can
be detected only down to wavelengths of about 2900 2. This abrupt
termination in the spectrum was shown by Fabry and Buisson in 1913 to be
due to absorption by ozone in the earth's atmosphere. Later high
altitude balloon flights were still unsuccessful in penetrating this
ozone layer. In 1946 captured German V2 rockets enabled spectrographic
equipment to be carried above the ozone layers and for the first time
photographs of the solar spectrum were recorded at wavelengths shorter
than 2900 2 by the U.S. Naval Research Laboratory (Baum et.a1,1946 see
also Tousey 1961). The spectrogram extended the range of the solar
spectrum to 2200 2 and of considerable interest was the intense absorp-
tion doublet of ionised. Mg at A2803 and 2795 2 corresponding to the
well known near ultraviolet H. (3968 2 ) and K (3934 2) lines of singly
ionised Ca.
It is obvious that rocket-bolirne experiments present many special
difficulties which are not encountered from ground based observatories.
Firstly there is the limited time for observation above the ozone layer;
secondly, the roll pitch and yaw of the rocket have to be encountered
imposing limitations on the pointing accuracy of the optical payload
and thirdly, the rocket vehicle imposes restrictions as to the size and
weight of equipment flown. These are but a few of the difficulties.
236.
Of course, satellites offer a means of overcoming the observation time
limitation and many advances in solar and stellar spectroscopy are to be
expected with the development of orbiting observatories.
For a few years after the first N.R.L. flight only moderate advances
were made in solar ultraviolet spectroscopy until a biaxial pointing
control, designed to keep the spectrograph pointed at the sun regardless
of the attitude of the rocket, was developed by the University of Colorado.
(Stacey et.al. 1954). With this control it became possible to point the
spectrograph at the sun within an accuracy of 1 arc minute (N.B. the
angular diameter of the sun from the earth is approximately 30 arc mins).
Following this development there came an improvement and many advances in
rocket ultraviolet spectroscopy (see e.g. Friedman 1962).
The first thirteen years of rocket spectroscopy provided an excellent
survey of the solar spectrum from the ozone cut off into the extreme
ultraviolet. It next remained to improve on instrumention in an endevour
to re-examine the ultraviolet region in greater detail. An example of
improved instrumentation and technique is demonstrated by the discovery of
the reversal of the solar hydrogen Lyman-alpha line at /N1216 R (Purcell
and Tousey 1961), The determination of the true profile of a spectral
line in the solar spectrum requires a resolving power of 105 to 106. The
development of the echelle grating by Harrison (1949) and subsequent im-
provements in the technique for ruling echelles have made it possible to
build spectrographs of a high resolving power but of small enough di-
mensions for rocket work. Purcell, Boggess and Tousey (195e) designed a
spectrograph to photograph the solar spectrum between 2200 and 3000

237.
with sufficiently high spectral resolution to separate Fraunhofer blends
and to obtain contours of the Mg II doublets. The dispersing element
was an echelle grating of 80 grooves mm-1. in . the Littrow mounting crossed
with a Car2 prism. Difficulties were encountered in flight such that
the spectral resolution achieved was 0.1 R although the pre-flight
laboratory performanCe was found to be 0.04 R. Never the less, line
profiles of the Mg Il4oublet were obtained in new detail shoving the
half-widths of the emission lines to be approximately 0.4 A.
An improved performance using the essentially the same technique
was obtained in a very sucessful later flight described by Purcell,Garrett
and Tousey (1963). A section of their echelle spectrogram is shown in
figure 8.1, in which the intense Mg II doublet is clearly seen. A
comparison was made between the instrument profiles of this spectrograph
and that of the 21 foot Gottingen spectrograph. The width of both profiles
is 0.03 R at half maximum intensity and they are essentially the same
down to about 10% maxipum. Below this intensity level the rocket spect-
rograph profile broadens out into ghost like wings which are produced by
the echelle itself. (Fig.8.2.).
The contours of the Mg II lines are also given in figure 8.1.
(linear density scale). The strong broad absorption is the first com-
ponent of each line of the doublet which nausea the continuum to be de-
pressed over many Angstroms. The emission lines form the second com-
ponent and an absorption in each line forms the third component. These
lines are very similar to their Ca II H and K oounterparts but the
emission components are much more intense than H2 and K2. The reasons

1 1 1 1
Mg IL (I)
1
I 1 2791
2 3
JFe OR Fe II
IDENTIFIED
UNIDENTIFIED
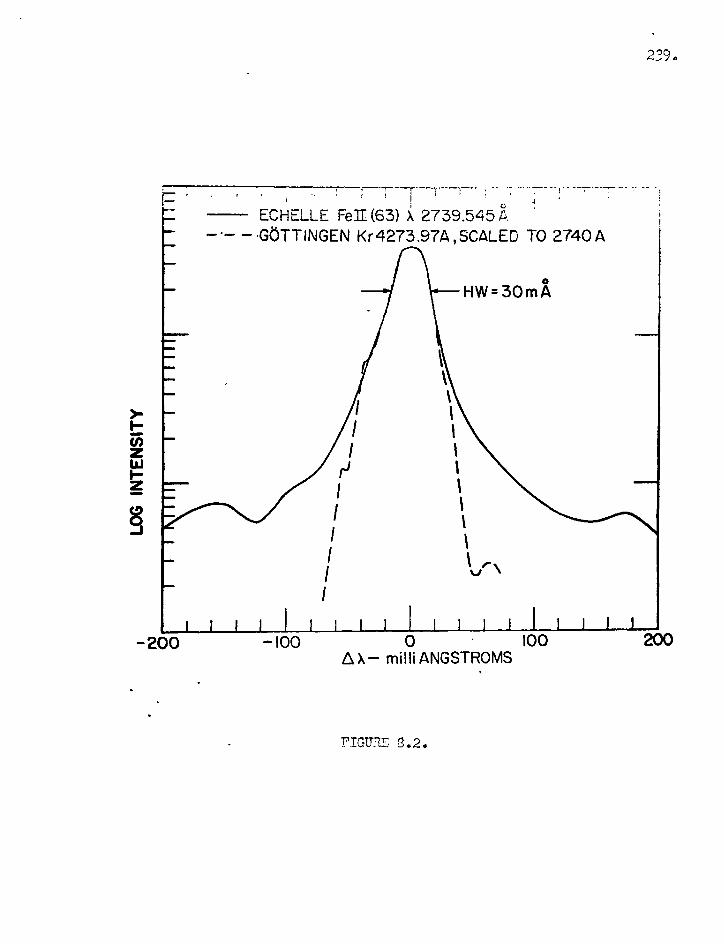
200 —200 —100 0 100 X— milli ANGSTROMS
1 1 1 1 1 1 I 1 1 1 1 1 I 1 1 1 1
IFIGUTZE 8.2.
239.
, --,-- , , -----! - --7-7- . • ,. , .
A ECHELLE F X eE(63) 2739.545 —*— — .GOTTINGEN Kr 4273.97A ,SCALED TO 27404
INTE
NSI
TY

240.
for this are that there is more ionised Mg than Ca at high levels in
the solar atmosphere and also the continuum is far less intense at
2800 2 than at 3950 R. Vthen one considers the considerable information
which has bean gained from studies of the Ca II H and K lines it is quite
apparent that the Mg II doublet is likely to be of tremendous importance
in solar spectroscopy.
In 1961 the need for a British stabilised rocket was examined by the
National Committee for Space Research and it was decided to develop an
attitude control unit (A.C.U.) to operate on payloads carried by the well
proven 'Skylark' rockets. The initial specification was for the unit to
be sun pointing sta4lised in 3 axes with the lateral control to be better
than one degree and the roll control to be of the order of a few degrees.
Further developments include Stage II - improved sun pointing accuracy
and Stage III - a moon pointing system for night sky observations:
For a series of experiments to study the ultraviolet emission of
the chromosphere and corona the U.K.A.E.A. (Culham Lab.) required a sun
pointing accuracy better than 1 arc min. which considerably exceeds the
stage I specification for the A.C.U.
This laboratory has developed an optical servo alignment system
which operates on a collector mirror to maintain the position of the
solar image on the spectrograph slit. Results from earlier flights
show a rerarkable degree of stab lisation in that the maximum lateral
error of the fine alignment system is approximately 13 arc secs (r.m.s.
- 2 - 3 arc secs). The corresponding roll figures are"' 10o peak t6
peak (Black et.al. 1965). An improved performance was achieved on later

241
flights which is such that a lateral displacement of t 5 arc secs and a
roll of 2 degrees might now be expected (Shenton 1966).
Two joint experiments with the Culham laboratory are now in progress
in which the aim is to exploit both the fine optical alignment system
developed by Culham and the high luminosity and great angular dispersion
of the F.P. interferometer, The purpose of these experiments is to
obtain high spectral resolution profiles of the Mg II doublet with a
spatial resolution of the solar disc of the order of 6 arc secs In the
following section some advantages of the interferometer for space spectros-
copy are discussed and in the later sections a brief description is given
of the method of approach to the first of these experiments,
8,2. Some Advantages of the F.P. Interferometer in,Space Spectroscopy.
Dunham (1956) has discussed how the P.P. spectrometer can be ex-
ploited for high spectral resolution, stellar spectroscopy from large
ground based telescopes. In the method considered, the stellar image
is focussed onto the slit of a grating monochromater which is used to
provide the necessary pre-dispersion for the etalon. The etalon may be
placed in the parallel berm either preceding or following the grating.
For a resolving power R , the angular diameter required for the analysing
diaphragm centred on the optic axis and in the focal plane of the fringes, 1
is 2 (2/R)2.(Jacquinot 1954). For maximum efficiency, the optical system
must be designed so that the total flux in the stellar image passes
through the diaphragm.
Dunham considers the case of an etalon of 4" aperture used in con-
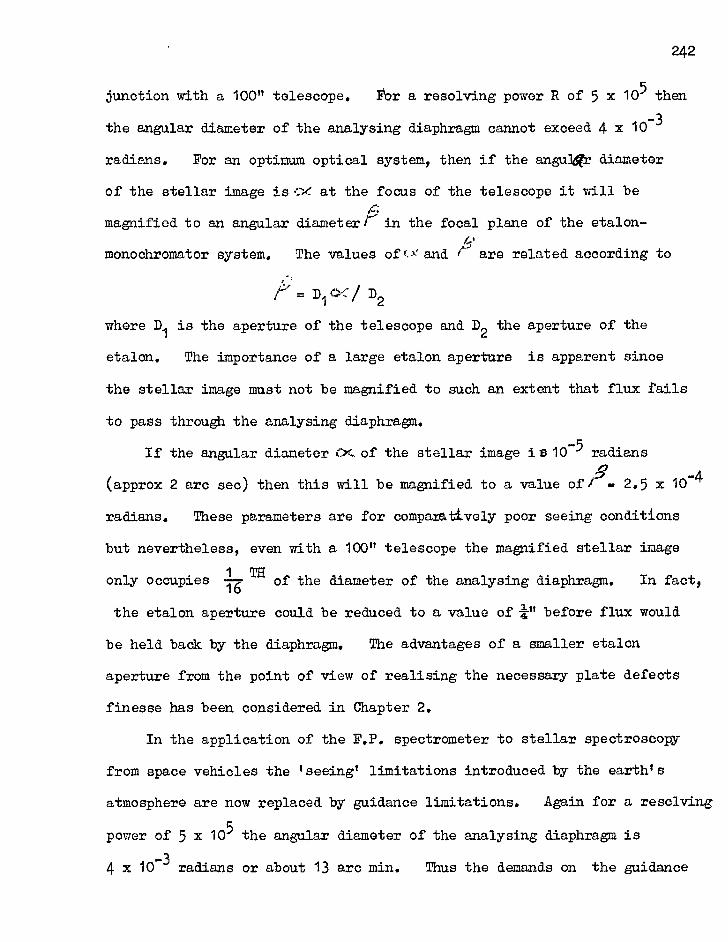
242
junction with a 100" telescope. For a resolving power R of 5 x 10⁵ then
the angular diameter of the analysing diaphragm cannot exceed 4 x 10⁻³
radians. For an optimum optical system, then if the anguJig'r diameter
of the stellar image is c at the focus of the telescope it will be do,
magnified to an angular diaraeterf in the focal plane of the etalon-
i? monoohromator system. The values of(A' and ? are related according to
/v. = D10/:/ D2
where D1 is the aperture of the telescope and D2 the aperture of the
etalon. The importance of a large etalon aperture is apparent sinoe
the stellar image must not be magnified to such an extent that flux Pails
to pass through the analysing diaphragm.
If the angular diameter Cx. of the stellar image il3 10-5 radians
(approx 2 arc sec) then this will be magnified to a value of/ . 2.5 x 10⁻⁴
radians. These parameters are for compaxtively poor seeing conditions
but nevertheless, even with a 100" telescope the magnified stellar image
TH only occupies 1 of the diameter of the analysing diaphragm. In fact,
the etalon aperture could be reduced to a value of ;I" before flux would
be held back by the diaphragm. The advantages of a smaller etalon
aperture from the point of view of realising the necessary plate defects
finesse has been considered in Chapter 2.
In the application of the F.P. spectrometer to stellar spectroscopy
from space vehicles the 'seeing' limitations introduced by the earth's
atmosphere are now replaced by guidance limitations. Again for a resolving
power of 5 x 10⁵ the angular diameter of the analysing diaphragm is
4 x 10⁻³ radians or about 13 arc min. Thus the demands on the guidance

243.
tolerance is only some ± 62 arc min. If a telescope aperture of 6 am
diam. is employed with a 3 cm F.P. aperture then the magnified stellar
image will become 10-5 radians (an angular stellar diameter of 1 arc sec
is assumed). Thus, the magnified stellar image occupies only 1/400 TH
of the diameter of the analysing diaphragm. This means that for the
same telescope aperture and resolving power the etalon aperture could
be reduced to only 75i, before any flux in the stellar image is held back
by the diaphragm. However, whilst the use of such a small etalon aperture
would be extremely desirable from the point of view of realising the
necessary etalon finesse, in practige such a small aperture could not be
employed except in the case of a very narrow gap etalon. The reason
for this arises from the lateral displacement of succesive beams
transmitted by the interferometer. For examples in the above case if
an etalon gap of 0.05 cm is employed (Comparable with the plate separat-
ion required for the experiment described in the following section) then
for a coating reflection finesse of 50 the number of interfering beams re-
quired to give an intensity halfwidth within 1% of the ideal Airy half-
width is approximately 1.4 Nil (Born and Wolf 1964; Greig 1965). In such
a case, the minium etalon aperture required is approximately 300,0 .
A comparison of this performance of the F.P. spectrometer may be
made with an echelle grating used under the most favourable conditions
in the Littrow mounting. For a resolving power R a beam width W is
required given by
R = 2W Sin /A .

244.
Using a grating of blare angle f4. 63° then for = 2800 R the value of 1.'28 cm. for R = 5 x 10⁵. The aperture of the echelle appears very
fore shortened from the collimator and a ruled operating length of 1/
Cost%A..18 cm is required.
If all the flux collected by the telescope fills the collimator
then the angular diameter of the stellar image subtended at the collimator
(#) is given by the usual relation
/r)=', = fl/ f2 = D1/D2
where f1 is the focal length of the telescope of aperture D1
f2 is the focal length of the collimator of aperture D2
and04:is the angular diameter of the star at the focus of the telescope.
Accordingly, for a 6 cm aperture telescope the value of 'is 3.75 x 10⁻⁶
radians for a value of', = 1 arc sec. The angular dispersion of the
echelle employed in the Littrow mounting is Ofor a blare angle
of 63o and an angular slit width of 8 x 10
-6 radians is required.
Under these condtions the stellar image occupies approximately one half
the slit width and the guidance tolerance would become a severe value
of - t arc sec.
Besides this important advantage in the relaxation of the demands
on guidance tolerance the interferometer possesses several other advantages
over grating instruments for application to space research. For the
same resolving power the P.P. spectrometer is considerably more luminous
than grating dispersers of equal area.(Jacquinot 1954), This superior
luminosity permits a higher speed of recording and more rapid scanning of

245.
line profiles; Thus, a greater number of spatial resolution elements
could be covered during the limited observation time of a single rocket
flight. Also, the P.P. spectrograph has a much greater illumination
than gating spectrographs for a resolving power greater than about 2 x 10
(see section 7.4.1.). It has already been shown in Chapter 7 that in
addition the superior angular dispersion of the interferometer permits
a relaxation on the demands of the linear resolution of the detector.
This has been illustrated by using a channelled image intensifier of only
2 line pairs mm-1
resolution for recording F.P. interferograms.
Because of the superior angular dispersion of the interferometer the
P.P. spectrograph can be made considerably more compact than is possible
with grating instruments; This is of vital importance in space spectros-
copy where full Use must be made of the limited space available in the
vehicle.
For many aikrophysical problems where resolving powers of 105 to 106
are required the echelle and the F.P. interferometer are the only dis-
persers capable of providing this high resolving power. However in the
ultraviolet 4:2500 the resolving power of the echelle falls of rapidly
because satellite intensities near line centres are increasing and
scattered light begins to intrude (Learner 1965).(see also figure 8.2 .)
Finally, mention should be made of another important property of
the interferometer, for which it is well known, namely that of its unique
use for accurate, absolute wavelength determinations. The interfero-
meter will therefore permit absolute wavelength measurements to be made
of solar Fraunhofer lines at wavelengths shorter than 2900 R.
246
It is apparent that the interferometer possesses several advantages
over the echelle grating for space research applications. In the
followihg two sections brief consideration is given to the approach of
an experiment exploiting some of these advantages and also to some of
the difficulties to be overcome.
8.3. A Rocket Spectrograph Employing the P.P. Interferometer.
The resonance lines of Mg II at 2795 and 2802 R are particularly
important for studies in solar physics. A first experiment, which is
already in progress, will employ the F.P. etalon for a detailed study of
the profiles of these lines and their spatial distribution over part of
the solar disc. For this experiment a sun pointing stab4lised Skylark
rocket will be used which will include a fine optical alignment system
operating on a collector mirror to maintain the solar image to a pointing
accuracy within * 5 arc secs.
This first experiment is purely photographic and the dispersion of
the interferometer is crossed with an echelle spectrograph. The system
will be optimised for the Mg II lines to give a spectral resolution in the
fringes of about 0.03 R. For a free spectral range of iR required at
2800 R the dalon plate separation is 0.04 cm and for the required spectral
resolution an etalon finesse of 30 is necessary. The approach to this
problem is discussed in section 8.4. The echelle slit will be set to
give a resolution limit of 0.25 R.
A schematic outline of the optical system for the rocket spectro.
graph is shown in figure 8.3. The echelle has 300 grooves mm-1 blaged

Vl
M
Si
/ Li b PrismCI
L
Echelle
5' .... I
247.
.r.3.gurc !).3.
248.
at an angle tan = 2. AtX2800 1 the free spectral range of the echelle is 120 R and a thin prism pre-disperser is used to isolate 100 R
centered on 2800 R at the entrance slit of the echelle spectrograph.
The etalon is placed in the parallel beam preceding the echelle
since the width of the parallel beam is smallest in this region. A
maximum etalon aperture of 2.5 cm will be employed. A major problem in
the design of the spectrograph in view of the limited space available
was the difficulty in preventing obstruction of the diffracted beam by
the interferometer and mount, If the angles of incidence and diffraction
are (t4 x ) and ( -X )1 (9being the blaze angle, then the ratio of
the widths of the diffracted and incident beams w'/w increases with x
in accordance with the relationship
w'/w = Cos (6 - x)/Cos (9 4-x )
Also, an increase in x causes a reduction in the angular dispersion of
the echelle since
/ d / / d = 2, ( C ot + tan ).
The value of x should therefore be kept as smell as possible. In the
present design the smallest value of x which could be achived was 60.
For a 50 cm focal length collimating mirror an echelle slit width
of 147p is required to isolate 0.25 R. Using a camera mirror of 40 cm
focal length this slit width is reduced to 118p on the photographic film.
For the parposes of microdensitometry of F.P. interferograms such a slit
width has been found to be adequate. The effective solar diameter on
the film (equivalent to slit height) is about 1 cm. Across this solar
diameter there will be 9 fringes which requires that the etalon is tilted
249
through an angle ()fa= (pA /t) (^J7.50) where the value of ple 25
is obtained from equation 7.4.
The angular halfwidth of fringe p (see eqn.7.2.).
is de = 1 ( 2 N t p
= 1
(2NRp)
For N 30, R = 105 and p 25 the value of d94°8 x 16-5 radians. For
the 40 cm focal length camera the corresponding F.P. resolution width of
approximately 30p represents a spatial resolution of the solar disc of
about 6 arc secs.
The echelle slit (= 0.25 R ) crossed with F.P. fringes will occupy
a strip ti 21 arc secs wide of the solar disc across a solar diameter.
Spatial resolution along a solar arc will depend on the rocket roll which
is the most difficult axis for stabilisation but it is hoped to ach2ve a
resolution along a solar arc of 2 degrees. The optical alignment system
will be programmed so that between exposures the solar disc will be moved
relative to the fringes to give a wider spatial coverage. Different
exposures will perhaps be obtained by reducing the width of the etalon
aperture using an iris diaphragm. This method has the advantage that
an improved finesse is likely to be obtained for the reduced etalon
aperture. In addition to the data on the Mg II doublet a spectral region
of about 80 R close to 2800 R will be photographed with the same spectral
and spatial resolutions. The final photographic record will be contained
in a film area of approximately 4 x 1 cm.
250.
A second planned experiment will employ a scanning F.P. crossed
with an echelle spectrometer. In this case the high luminosity of the
centre fringe will be exploited by scanning through many line profiles and
recording photoelectrically with two solar blind e.g. CsTe photomultipliers
at a spectral resolution of '..V 0.03 R. An estimated scan time of 101
secs is required to record the emission lines with this resolution. For
an observation time in one flight of 300 secs above 100 Km; 3 x 10³
spatial resolution elements of 10 x 10 arc secs could be recorded. This
corresponds to roughly 10% of the solar disc. Full details of methods
of scanning and maintainence of parallelism during scan have yet to be
decided upon but plans for an. experimental piezo-electric system are already
in progress4
8.4; An Optically Contacted Permanently Adjusted P.P. Etalon.
For the rocket spectrograph a permanently adjusted etalon with a
finesse of approximately 30 is required. It is therefore apparent that
the final performance in the experiment will be amitically dependent on
the adjustment and the stability of the interferometer.
All dielectric multilayer coatines(Perkin Elmer Inc) will be em-
ployed to give a reflectivity of 94% (NR= 50) with an absorption of less
than 2%, enabling a value of GA in excess of 45% to be obtained. With
these coatings, then for an overall finesse of 30 to be achieved, the
defects finesse cannot be much less than 37 at A 2800 R over the aperture
of 2.5. cm. to be employed. These demands are of course very great
particularly when it is realised that the etalon has to withstand the

251
rigokrous conditions to be expected in launch and flight. There are
three main approaches to the problem of obtaining a permanently adjusted
etalon; solid interferometers, automatic servo-control for parallelism
and optically contacted air gap interferometers.(
Solid interferometers (Lau 1931) have been reported in the past but
it is extremely difficult to work both faces of the material over a re-
asonably large area for flatness and smoothness and particularly for the
parallelism required. Any inhomogeneitylatheirefractive index of the
material would also result in a lower defects finesse. In addition, the
reflectivity at the plate-reflecting surface boundary would be less than
that for an air gap instrument. Consequently, higher coating reflectivities
would have to be employed and this would lead to a decrease in the in-
terferometer transmission. (Chapter 2). For the free spectral range of
1 R at 2800 2 the thickness of the solid etalon if made from fused silica
would be approximately 0.27 m.m. This would be an extremely fragile plate
even assuming that the required optical polishing could be achieved for
a plate of this thickness.
Barium titante ceramicswhose length can be varied in response to
an electrical signal have been used to obtain the correcting movements
necessary to maintain precise control for parallelism of two etalon flats
(Ramsey 1962). A similar approach is being considered for the second
experiment where a F.P. spectrometer will be used for scanning profiles
of the M II doublet. However, the degree of complexity of such a system
is necessarily high and requires considerable development. Since the
first planned experiment is purely photographic it was deeided to use an
252
approach which kept the design and complexity of the spectrograph as
simple as possible, particularly in view of the fact that the first
experiment is an explorpory one in which experience gained will be used
for more detailed subsequent experiments.
The most logical choice appeared to be an optically contacted air
gap interferometer. Such an interferometer with 10 cm spacers has been
previously employed in the near infrared but the fringe finesse obtained was
nbt recarded.(Jackson and Kuhn 1935). For a 10 am gap it would not have
been possible to measure the instrument profile.with the light sources
then available. For the present work, the etalon plates of 'Spectrosil AI
(Thermal Syndicate Ltd.) of 6 cm diameter and 1 cm thickness are polished
to a flatness of better than/1/180 (in the green) over their full physical
apertures. three spacers also of spectrosil were out pat from erected
portions of a large plate of 0.4 mm thickness worked flat and parallel to
better than )1/40 over a 4 cm length. The spacers of 6 mm diameter are
optically contacted onto both plates on a pitch circle diameter of 5.4. CM
at angular intervals of 120°. The polishing of the plates and spacers
and the assembly of the etalon was carried out by Mr. H.W. Yates (Optical
Surfaces Ltd.)
Before optically contacting the assembly, the interferometer plate
surfaces were coated with silver films over a 3 cm. central aperture.
The silver was overcoated with a thin layer of MgF2 to prevent deterioration
of the coating during testing. Optical properties of the coatings were
determined by the method of Giacomo (1952) and the mean reflectivity

253.
for the two surfaces was approximately 94%.
Figure 8.4. shows fringes obtained for the A 5461 line of a Hg198
source employing a 2 cm etalon aperture. The fringes were recorded on
Kodak Tri-X film with an exposure of 15 secs. To determine the finesse
of the etalon from microdensitometer traces it is necessary to obtain the
film 'Gamma'. This was achlved by photographing a calibrated density
wedge also in A 5461 and a value of X= 0.9 ± 0.1. was determined for
the development time of 11 mins. The corresponding microdensitometer
trace for the above fringes is shown in fig.8.5. in which the density
scale is linear. The position corresponding to the intensity halfwidth
is indicated and a recorded fringe finesse of 30 - 3 was derived.
The recorded finesse was found to depend on the etalon aperture.
If the aperture is increased to 3 cm the fringe finesse falls to 22
whilst for an aperture of 1 cm a finesse of 43 is obtained. Over a period
of two months the adjustment was found to be perfectly stable and pressure
could be applied and then removed from the plates without affecting the
finesse. The decrease in the recorded finesse with increasing aperture
is due to a slight wedge effect. It could be observed visually that
one of the spacers was not completely contacted over its full area and
this may have been due to incomplete cleanliness during the contacting
process.
The fact that the variation in finesse with etalon aperture was due
to a wedge was verified by placing the etalon in an invar noant with
3 phosphor bronze spring adjustments. It was found that the wedge could
be eliminated with a very small differential pressure and a recorded

254..
FIGURE 1.4.

E
•
t • a.
4
255
■ • • • a I • Vonsuirp sai Ls0.0 • av Figure 1.5,
256.
finesse of approximately 50 was then obtained. Fringes obtained for
)0461 of Hg 198 for a 3 cm aperture with the etalon mounted and free are
shown in figure 8,6,a.b. respectively. The adjustment also remains
stable for the etalon in the mount with spring adjustments and the etalon
finesse was found to be very little dependent on the etalon aperture as
expected if the wedge is eliminated. The recorded finesse of 50 is now
mainly limited by the coating reflectivity employed. Some initial ex-
periments show that placing the etalon into a vacuum chamber appears to
have no effect on the optical contacting of the spacers and the performance.
The above experiments are only first steps in the investigation
but they indicate the great promise of the optically contacted etalon for
the particular application considered. Farther experiments will be
carried out using high reflectance coatings at 2800 R. Additional
experiments will also include the effect of r.gorous vibration testing
of the etalon. However, in view of its permanent adjustment, such an
optically contacted etalon has a high potential for F.P. spectroscopy
for applications besides those of space research. This is particularly
true for experiments in which long time exposures are required for in
these cases stability in adjustment is of prime importance.
With care the optical contacts can be broken and new spacers of
different thickness contacted onto the same etalon plates. This is an
advantage over the solid interferometer in that the optically contacted
etalon retains the property of stability in adjustment yet possesses
an advantage of choice of plate separation and therefore, free spectral
range. In addition, for a large free spectral range the optical contacted
interferometer has the important advantage of a considerably greater
robustness.

FIG..6(a)
257.
FIG.1.6(b)
258
CHAPTER 9.
SUMMARY.
It is seen that much of the emphasis in this investigation has been
more on the development of techniques for far ultraviolet interference
spectroscopy rather than one of the application of such techniques. The
feasability of extending the spectral range of the F.P. interferometer
into the far and vacuum ultraviolet using the newly developed semi-trans-
parent aluminium - MgF2 coatings has been clearly demonstrated. It would
appear that the optical properties of the double layer films do not fall
far short of optimum performance. Yet, the author feels this in only a
first step and there is little doubt that an improved performance can be
obtained over that of the present double layer films. The next likely
stage of development is to consider the deposition of several dielectric
layers deposited onto a high quality aluminium film. Evaporated fused
silica or barium fluoride films might provide a basis for extension of
techniques.
The optical performance of the present coatings is suitable for many
problems to a wavelength of 1800 2. Measurement of optical properties
should next be carried out on films optimised for wavelengths shorter
than 1800 R. It has already been stated that much hyperfine structure
and absolute wavelength determination work has been carried out in the
ocoLEg past at longer wavelengths employing coatings of P plum= performance than
the double layer films at 1850 2. Whilst the author's own interest is

259.
more on the employment of the F.P. interferometer for space research
applications (as discussed in Chapter 8), there are immediate laboratory
applications of some of the techniques developed in this work. For
example, these could include the determination of absolute wavelength
standards (e.g. GeI lines 1800 to 2200 R) with subsequent extension to
shorter wavelengths by the Combination Principle (Edlen 1963). In additions
high resolution studies of the hyperfine structure and isotope shifts of
lines such as the 1849 R line of HgI (Popescu and Novikov 1964) could be
made perhaps in the detailed manner as discussed by Schweitzer (1963) for
the very much studied 2537 . line.
The F.F. type interference filters developed in this investigation
have already seen application. For space research applications broad
band photometry has been carried out by employing the combination of
wavelength selective detectors with different absorbing materials. The
spectral profile of such a combination is of course governed by the
absorption and sensitivity characteristics of a limited choice of materials.
However, the techniques developed in this programme offer a means of
constructing a set of band-pass filters for the far ultraviolet in which
the spectral transmission characteristics can be controlled (within
certain limits) to suit particular experimental requirements.
Again, as in the case of the coatings, one can envisage improvements
in filter performance from that given in Chapter 6. If two independently
worked flats coated with the aluminium - MgF2 layers could be separated
by a very small vacuum gap and adjusted for the parallelism required,
then the bandwidth of such a filter would be approximately half of that
260.
obtained with the present filters for the same value of peak trans-
mission. Of course, this means a sacrifice must be made in the simplicity
and convenience of use since nothing much simpler than the present filters
can be obtained for isolating a wavelength interval of a few hundred R
with the same high transmission. From previous considerations it will
be realised that any improvements which can be made to the optical
properties of far ultraviolet coatings can be applied to give an improve-
ment to filter performance. Again this emphasises the need for further
development and for extension of measurements of optical properties to
shorter wavelengths.
Progress in this direction can be greatly aided by computational
techniques but these of course require the ability to ascribe meaningful
optical constants to give a representation of the coating layers employed.
Such progress is often hindered by the fact that optical properties are
so much dependent on the conditions of preparation as illustrated in
the case of aluminium films. The author feels that the main application
of the present coatings (and of subsequent improved coatings) to filter
work might lie in extending in%o the far ultraviolet tunable, narrow
band filters of the type described for visible wavelengths by Ramsey
and Tanaka (1965). Such filters used alone or in conjunction with
the P.P. interferometer would have a considerable potential for both
space and laboratory applications.
On the image tube side, the construction of an intensifier with
wavelength selective photocathode is to be encouraged. For application
to interference spectroscopy from space vehicles the channelled intensifier

261
with a spectrally selective cathode might also be a particularly useful
device for it has been seen that the main drawback of this type of in-
tensifier, namely its low resolution, need not be too serious for this
application (chapter 7.).
In chapter 8, some advantages of the F.P. interferometer over grating
instruments for space research applications were considered. It now
remains to overcome several technical difficulties to see if these
advantages can be fully realised. If this is indeed the case, then
techniques can be extended to satellites for solar work and for investigation
of weak nebular sources and interstellar lines.
In conclusion, the main objectives of this programme which were set
out in Chapter 1 have been fulfilled. It was stated in Chapter 1 that
little development of the interferometer had taken place for many years
until 1948 when the F.P. spectrometer was first described. Since then,
advances in development have been considerable and new applications are
increasing. It is to be hoped that this investigation has contributed
to a further phaseia_development by extending its spectral range into
the far ultraviolet. The new application of the interferometer to the
field of space research should offer the opportunity of much exciting and
rewarding research in future years.

262
Acknowledgements.
The author is indebted to Professor J.D.McGee F.R.S. for the
facilities of his laboratory and for the loan of several image intensifiers
used during this investigation.
An experimental programme of the type which has been described
requires considerable technical backing. The author wishes to thank
members of the Applied Physics technical staff for their considerable
help during this investigation, in particular to G.E. Busby for his
enthusiastic participation in the design and development of the automatic
film thickness control unit.
In addition, thanks are also due to S.Majumdar, F. Barlow, C.O.D.
Juulman, T. Kohno and to the technical staff of the Physics Department,
Royal Holloway College.
Finally, the author wishes to express his gratitude to Dr.D.J.Bradley
not only for his interest and •supervision of this programme but also
for his considerable contribution of ideas during the course of this
investigation.

263
References,
Angel D.W., Hunter W.R. and Tousey R. - (1961) J.Opt.Soc.Am. 51. 913
Apfel J.H. (1966) Paper presented to Opt.Soc.Am.
March. 1966.
Aslam M. (1965) Ph.D. thesis Univ.London.
Bass A.M. (1948) J.Opt.Soc. Am. /2.977.
Bates B. and Bradley D.J. 1966(a) Applied Optics a 971 1966(b) trer—be submitted to J.Opt.Soc.Am.
Bates B.,Bradley D.J., Kohno T.
and Yates H.W. (1961) J.Sci.Instrum. 43 476.
Baum W.A. (1961) Proc.2nd.Symp.on Photoelectric
Imaging Devices p.391(Academic Press
Baum, W.A. et.al. (1946) Phys.Rev. E, 781.
Baumeister P.W. (1965) Private Communication.
Baumeister P.W. and Costich V.R.(1965) Applied Optics 364.
Bauple R. et.al. (1950) J.Opt.Soc.Am. 42 788.
Bennett J.M. (1964) J.Opt.Soc.Am. 5A 612.
Bennett H.E. and Porteus J.0.(1961) J.Opt.Soc.Am. al, 123.
Berning P.H. Hass G, and Madden R.P. J.Opt.Soc.Am. .52 586.
(1960)
Bifford I.H. (1966) Applied Optics a 105
Black W.S. et.al. (1965) Nature 206 654.
Born M. and Wolf E.(1964) Principles of Optics (Pergamon Press
Bradley D.J. (1961) Ph.D. Thesis Univ. of London.

264.
Bradley D.J. (1962) J.Sci.Instr. 41
(1963) Applied Optics 2 539
(1966) S.A.D.E.S.I. (in Press)
Bradley D.J., Bates B. and Proc.VI Conf.Phenomenes d'Ionization
Juulman C.O.L. (1963) dans le Gaz 4 791
Bradley D.J. et.al. (1964) Nature la 1281
Bradley D.J., Bates B. Proc.Symp.Orsay 1966.
Juulman C.O.L. and Kohno T. (1966) (to be published in J.de Physique).
Bradley D.J., Bates B.
Juulman C.O.L. and Majumdar S.
1964 (a) Nature 202 579
1964 (b) Japanese J.Appl.Phys.
Suuplement 1. 467.
1964 (c) Applied Optics 3 1461
Bradley D.J. and Majumdar S. (1966) to be published J.Photo.Science.
Braga C.L. and Lumb M.D. (1966) J.Sci.Instr. Ai 341
Bril A. and Klasens H.A. (1952) Philips Res.Repts. 401
Burridge J.C., Kuhn, H. and Pery A.(1953)Proc.Phys. Soc. B. LIM 963
Butslov M.M. et.al. (1963) Optics and Spectroscopy 12 229.
Catchpole C.E. (1963) Ph.D. Thesis Univ. of London
Chabbal R. 1953 J.Rech C.N.R.S. (Paris)24 138
1958 Rev. d'Optique .31 49,336,501,608.
Cooper J. and Greig J.R.(1963) J.Sci.Instrum. /2 433.
Cranfield L.R., Hass G. and Applied Optics a 45 Waylonis J.E. (1966)

265
Crawford M.F.,Gray
Schawlow A.L. and Kelly F.M. (1949)
Davis G.P. (1962)
Dunham T. (1956)
Dunkelman L. (1955)
Dunkelman L. and Hennes J.P. (1964)
Dunkelman L., Fowler LB. and
Hennes J.P. (1962)
Dushman S. (1949)
Edlen B. (1963)
Eley D.D. and Wilkinson P.R.(1959)
Fabre D. (1964)
Fabre D., Romand J. and Vodar B.(1964)
Flecken F. and Noller H.G.(1962)
Flinn E.A. (1962)
Friedman H. (1962)
Gerrard H.G. and Turpin J.(1965)
Giacomo P. (1952)
Gonella J.R. and Robrieux B.(1962)
Greig J.R. (1965)
Hadley L.N. and Dennison D.M. (1947)
Hall J.F. (1957)
Harrison G.R. (1949)
J.Opt.Soc.Am. a 888.
Adv.Elect.and Elect.Phys. 16 113.
Vistas in Astronomy 2 1223
J.Opt.Soc.Am. 41 134.
Jap.J.Appl.Phys. A sup1,1 p.511
Applied Optics 1 645.
Vacuum Technique p.19. OTiley.)
Repts.Prog.Physics MI 181
Structure and Properties of
Thin Films (Wiley). p.508
Rev. d'Optique Al 504.
J.de Physique g5 55.
Vacuum Symp.Trans. p.58
Pergamon Press (Oxford.)
Ph.D. Thesis Univ. London.
Repts.Prog.Physics XXV 163.
J.Opt.Soc.Am. 52 453.
C.R.Acad. Sci. (Paris. ) 2,1627
Optica Acta. 101
Ph.D. Thesis Univ.London.
J.Opt.Soc.Am. j 451
J.Opt.Soc,Am. E. 662 J.Opt.Soc.Am. 22. 522

266.
Hass G. (1949) J.Opt.Soc.Am. 22 352
Hass G. and Tousey R. (1954) J.Opt.Soo.Am. 42 593
Hass G. and Waylonis J.E. (1961) J.Opt.Soc.Am. .51 719
Hass G. Hunter LB.. and Tousey R. J.Opt.Soc.Am. E. 1070
Heavens 0.S. (1955) Optical Properties of Thin
Solid Films - Butterworths (London)
Heavens 0.S. and Smith S.D.(1957) J.Opt.Soc.Am. 4.1 469.
Holland L. (1956) Vacuum Deposition of Thin Films
Chapman and Hall.
(1960) Vac.Symp.Trans. p.168.
(1964)
Pergamon Press (Oxford.)
The Properties of Glass Surfaces
Chapman and Hall.
Holland L. and Bateman S.K. (1962) Vac.Symp.Trans. p.1201.
Pergamon Press (London)
Jackson D.A, (1961) Proc.Roy.Soc. A.2.61 289
Jackson D.A. and Kuhn H. (1935) Proc.Roy.Soc. A.10 335.
Jacquinot P. (1954) J.Opt.Soc.Am. m 761
(1960) Repts.Prog.Phys. 23 267
Jacquinot P. and Dufour C. J.Rech.C.N.R.S.(Paris) 6 1.
Kasha M. (1948) J.Opt.Soc.Am. 22929
Khogali A. (1964) Ph.D. Thesis Univ.London.
Knapp R.A. (1963) Applied Optics 2 1334.
Kuhn H. (1951) Repts.Prog.Phys.suir Gu
Lau E. (1931) Ann.der Physik 10 71

267.
Learner R.C.M. (1965) Private Communication
Lebedeva V.V. and Lebedev.I.V.(1965) Optics and Spectroscopy XVII 58
Les,F. and Les Z, (1962) Acta Physica Polonica XXI 523
Les.F. Les Z. and Gabla L. (1963). Acta Physica Polonica XXIII 211
Levenstein S. (1949) J.Appl.Phys. 20 306
Lisaberger P.H. and Ring J. (1955) Optica Acta. 2 42
Madden R.P. (1963) Physics of Thin Films p. 123
Academic Press London.
Madden R.P. and Cranfield L.R.(1961) J.Opt.Soc.Am. 51. 838
Madden R.P. Crenfield L.R. and Hass G. J.Opt.Soc.Am. a 620
(1963)
Majumdar S. (1966) Ph.D. Thesis Univ.London.
Malitson I.H., Murphy F.U. and J.Opt.Soc.Am. 48 72
Ro(*.ney W.S. (1958)
Malyshev G.M. Razdobarim G. T. and Sov.Phys.Doklady j 701
Sokolova L.U. (1963)
Mandel L. (1955) J.Sci.Instrum. 32 405 (1961) Proc.5th.High Speed Photography
Conf.Washington.
McBride W.M. (1963) J.Opt.Soc.Am. paper F.C.II.
McClung F.J. and Hellwarth R.W.(1963) Proc.I.E.E.E. 51 46. McGee J.D. (1953) Brit.Patent No. 790416
(1961) Repts.Prog.Phys. XXIV 167
McGee J.D. Beesley J. and Berg A.D. J.Sci.Instrum. a 153 (1966)

268.
McGee J.D. and Catchpole C.E.(1962) Brit.I.E.E.Conf.Rept.Series 5.p182
McGee J.D., Flinn E.A. and Evans H.D. Adv.Elect.& Elect.Phys. 12 87
McGee J.D. and Wheeler B.E. (1961) J.Photograph.Sci. 2 106
(1962) Adv.Elect.and Elect.Phys. 16 47
Meissner C. (1960) Vac.Symp.Trans. p.196
Pergamon Press (Oxford .)
Minnaert M., Mulders G.F.W. and Photographic Atlas of the Solar
Houtgast J. (1940) Spectrum p.5. Schnabel (Amsterdam,)
Mohler N.H. and Loofbourow J.R.(1952) Amer.J.Phys. 20 499, 579.
Morton G.A. (1964) Applied Optics 651
Peacock N.J. Cooper J. and Greig J.R. Proc.Phys.Soc. 22 803
(1964)
Perkin-Elmer Inc.(1966) Manufacturers Information
Popescu I.M, and Novikov L.N.(1964) C.R.Acad.Sci,(Paris.) 25.2, 1321
Purcell J.D. and Tousey R.(1961) Proc.1st.Int.Space.Sci.Symp.1960
p.590 (North Holland Publishing Co.)
Prucell J.D., Boggess III A. and I.G.Y. Rocket Rep.Ser.No.1.p.198
Tousey R.(1958)
Prucell J.D. Garrett D.L. and Proc.3rd.Int.Space Sci.Symp.1962
Tousey R.(1963) p.781 (North Holland Publishing Co.
Putner T. (1959) Brit.J.Appl.Phys. 10 332
Ramsey J.V.(1962) Applied Optics 1 411
Ramsey J.V. and Mugridge E.G.V.(1962) J.Sci.Instrum. 12 636
Ramsey J.V. and Tanaka K. (1965) J.Scianstrum. 42 334
Rees J.D. and Parker Givens M.(1966) J.Opt.Soc.Am. 56 93.

269
Ring J. (1956)
Ring J. and Wilcock W.L.(1953)
Sabine G.B. (1939)
Schroeder D.J. (1962)
Schulz L.G. (1949)
Schulz L.G. and Tangherlini F.R.(1954)
Schweitzer W.G. (1963)
Sennett R.S. and Scott G.D. (1950)
Seya M. and Masuda.F. (1963)
Shaw C.H. and Foreman W.T.(1959)
Shenton B. (1966)
Stacey D.S. et.al.(1954)
Theodorou D. (1963)
Tolansky S. (1947)
(1948)
(1960)
Tolansky S. and Bradley D.J. (1959)
Turbadar T. (1959)
Tousey R. (1961)
Vasicek A. (1960)
Astronomical Optics and Related
Subjects p.381 (North Holland Pub.Co.
Nature.11:_'1 648
Phys.Rev. 1064
J.Opt.Soc.Am. 52 1380.
J.Chem.Phys. ii 1153.
J.Opt.Soc.Am. 11, 357
J.Opt.Soc.Am. .52 1055.
J.Opt.Soc.Am. 42 203
Science of Light 12 9.
J.Opt.Soc.Am. 4.2, 724
Private Communication.
Electronics a 149. Ph.D. Thesis Univ.London.
High Resolution Spectroscopy
Metheun (London.)
Multiple-Beam Interferometry
of Surfaces & Films
(Clarendon Press Oxford.)
Surface Microtopography, Longmans.
N.P.L. Symp.on Interferometry p.375
(H.M.S.0. London.)
Vacuum ,, 139.
Science la 441
Optics of Thin Films.
(North Holland Publishing Co.)
270
Weaver C. (1962)
Wheeler B.E. (1962)
Wilcock W.L. and Geake J.E. (1956)
Wilcock W.L., Emberson D.L. and
Weekley B. (1960) (a)
(1960) (b)
Wiley W.C. and Hendee C.F. (1962)
Wolf C,M. and Pertel R. (1964)
Walkenhurst W. (1941)
Yates H.W. (1966)
Adv.in Phys. XI 83
Ph.D. Thesis Univ. London.
Estratto dai Supplementi alle
Memorie della Societa Astronomica
Italiana.
Nature 125. 370.
Trans. I.R.E. NS-7 p.126
Trans I.R.E. NS -9 p.103
J.Opt.Soc.Am. a 1168. Z. Tech.Phys. 22 14.
Private Communication.

(Reprinted from Nature, Vol. 202, No. 4932, pp. 579-580, May 9, 1964) ,
Multiple-beam Interferometry in the Vacuum Ultra-violet
Fon orbiting astronomical telescopes and photometers, interference filters and the Fabry—Perot interferometer have considerable advantages in luminosity, speed of recording and compactness over prism and grating instru-ments'-3. Thus it is important to extend the range of multiple-beam interferometry into the vacuum ultra-violet.
--- The limitation so far has been in obtaining suitable reflecting coatings. Below 2400 A there is no high-index material for dielectric multilayer films". However, reported measurements' on the optical properties of semi-transparent aluminium films down to 2200 A, when analysed, showed that aluminium improves in performance for multiple-beam interferometry with decreasing wave-length, provided a reflecting finesse of 20 is sufficient. It must-be remembered that the defects finesse also decreases with decreasing wave-length and, even with the best-quality flats, will not greatly exceed 18 at 1800 A, so that a higher reflecting finesse is neither required nor desirable'. For interference., filters, the band-width decreases with decreasing wave-length and, for a given band-width, the finesse required is proportionally smaller, provided the resulting decrease in contrast can be tolerated.
This analysis and recent improvements7 in the tech-nique of depositing opaque aluminium films, overcoated with thin layers of magnesium -fluoride to prevent oxida-tion and to enhance reflectivity in the vacuum ultra-violet, led us to believe that a similar improvement could be obtained in the performance of semi-transparent coatings for this spectral region. Our first results' indicated that thinner aluminium films, similarly overcoated, were suitable for multiple-beam interferometry down to 1900 A. IN e now wish to report our results on filters with peak transmittances at — 1800 A and Fabry—Perot inter-ferograms of A1849 of HgI.
Fig. 1 shows the transmission characteristics of two Fabry—Perot type first-order interference filters deposited on fused quartz substrates, each consisting of two alumin-ium reflecting layers separated by a half-wave layer of magnesium fluoride. The outer aluminium layer is pro-tected from oxidation by a magnesium fluoride coating, approximately 400 A thick. Curve A represents a filter peaking ,at 1825 A. Below 1800 A the finesse decreases because of the falling reflectivity of the aluminium layers, but at approximately 1660 A the rapidly increased absorp-tion of the `SpectrosiP substrate leads to a sharp cut-off.

1,600 1,700 1,800 1,900 2,000 2,100 2,200 2,300 2,400 2,500 2,600 Wave-length (A)
Fig. 1. Transmission curves of first-order Fabry—Perot type filters
Fig. 2. Fabry—Perot mterfcrogram of 21849 HgI. Interferometer spacing, 0.15 mm
The transmission profile above 1800 A corresponds to a half-width of 225 A and a finesse (N) of 8. The recorded peak transmission of 0.19 when corrected for absorption in the substrate becomes 0.21, giving for the aluminium films a mean reflectivity I t = 0.68, transmissivity T = 0.15, and an absorption A = 017.

-Table 1. OPTICAL PROPERTIES 01? ALUMINIUM FILMS DERIVED FROM FIG. 1 Curve N R T A (R + T)
A 8 0.68 0.15 0.17 0.83 B"-- 8'5 0.69 0.135 0.175 0.825 C 8.5 0.70 042 0.18 0.82
Curve B is the same filter tilted through 8° to displace the peak wave-length to 1805 A, and curve 0 represents another filter with a peak transmission of 0.15 (corrected 0.165) at 1910 A. Because of an error in monitoring the second aluminium layer the performance of this filter is not optimum. The optical properties of the aluminium films derived from the longer wave-length half-profiles of these curves are summarized in Table 1.
The transmission curves below 2000 A were measured on a vacuum Seya monochromator. Curves A and B were obtained when the filter was six weeks old and had been frequently exposed to ultra-violet light. Curve C was determined on the day following the manufacture of this filter. The longer wave-length tail of curve A was measured on a Perkin—Elmer 350 spectrophotometer. For this filter the transmission falls to 0.4 per cent at 2600 A and to 0.3 per cent at 2800 A. Greater contrast and a narrower band-width could be obtained with a second-order filter provided a selective detector' is used to suppress the longer wave-length peak. Alternatively, two filters could be used in series or deposited as a double filter" on the same substrate.
So far as we knoW these are the only results reported for interference filters < 2000 A apart from Schroeder", who reports a double filter with a half-width of 200 A but a peak transmission of only 0.7 per cent at 1900 A.
Finally, `Spectrosil' Fabry—Perot plates were coated, Fig. 2 shows fringes of X1849 of He obtained with a
-,`Spectroline' 11SC-1 lamp. The line was isolated by a `Spectrosil' prism spectrograph purged with nitrogen. A single-stage magnetically focused image converter, with a `Spectrosil' window and cathode substrate, constructed for this work greatly facilitated detection and recording of the fringes (the imperfection in one of the fringes is caused by a defect in the image converter phosphor). The fringe finesse of about '5 is mainly limited by the quality and adjustinent of the interferometer plates, which are, of course, very critical at these short wave-lengths. To confirm this, fringes of X2537 were recorded and a finesse of 7 directly proportional to the increase in wave-length was obtained, showing that the defects finesse dominates. These are the first reported Fabry—Perot interferograms below 2000 A. A high-quality interfero-meter is being constructed and we hope to extend £he spectral range to 1600 A or less so as to permit the utiliza-tion of the instrument, either in its oscillating form" or in its spectrographic method of uses, for plasma diagnostic spectroscopy in this spectral region, in addition to space research applications.

We thank Prof. J. D. McGee for his advice, Prof. W. R. S. Garton for lending us equipment, and Mr. D. S. Widner for making the filter measurements on the Seya monochromator. Assistance from the British National Committee for Space Research for the purchase of equipment and the support of one of us (C. 0. L. J.) is gratefully acknowledged. One of us (S. M.) is supported by a Colombo Plan fellowship.
D. J. BRADLEY B. BATES C. 0. L. Ju uLMAN S. MAJUMDAR
Department of Physics. Imperial College of Science and Technology,
London, S.W.7.
Jacqulnot, P., J. Opt. Soc. Amer., 44, 761 (1954). Dunham, T., Vistas in Astronomy, 2, 1223 (Pergamon Press, London,
1956). ' Bradley, D. J., Proc. Roy. Soc., A, 262, 520 (1961/. 'Hordes', G., and Krebs, K., Z. Physik, 156, 117 (1959).
Hass, G., and Wayonlis, J. E., J. Opt. Soc. Amer., 51, 719 (1961). ° Chabbal, R., J. Rech. C.N.R.S., 24, 138 (1953). Hunter, W. R., Optica Acta, 9, 255 (1962).
' Bradley, D. J., Bates, B., and juulman, C. 0. L., Proc. Sixth Conf. Phenomenes d'Iartization dans le Gaz, 4, 79 (Paris, 1963).
Dunkelnuin, L., Fowler, W. B., and Hennes, J., App. Optics., 1, 695 (1962).
" Schroeder, D. J., J. Opt. Soc. Amer., 52, 1380 (1962). " Bradley, D. J., Proc. Conf, Optical Instruments and Techniques, 31 (Chap-
man and Hall, London, 1961).
Printed in Great Britain by Fisher, Knight & Co.. Ltd., St. Albans.

APPLICATION OF PHOTOELECTRIC INTERFERENCE SPECTROSCOPY
AND IMAGE INTENSIFIERS TO PLASMA DIAGNOSIS by
D.J. BRADLEY , B. BATES and C.O. L. JUULMAN
Instrument Technology Section Physics Department, Imperial College, London S. W.T.
Abstract
A method of employing a Fabry-Perot interferometer -image intensifier combination to obtain simultaneously time, spatial and spectral resolution is described. Comparison is
made with an oscillating Fabry-Perot interferometer. Three
types of image tube were tested and time resolution of
2 x 10⁶ sec obtained. Causes of signal-induced background are discussed as is also the combination of an oscillating interferometer with the system. First results are given of
aluminium films making possible the extension of the interferometer spectral range into the vacuum U.V.
Introduction.
The advantages and optical principles of an oscillating
Fabry-Perot spectrometer for time-resolved spectroscopy have been previously discussed(1 '2) and instruments employing electro-mechanical(3) and piezo-electric drives(4) have since
been fully developed. In addition to the superior luminosity of the interferometer the high quantum efficiency of a photo-multiplier is utilized and a linear intensity display is
immediately obtained. However, this method of use of the interferometer suffers from the serious disadvantage that
time and wavenumber dispersion are superposed. It is thus necessary to scan at a speed sufficiently greater than the
rate of change of the phenomenon studied so that photons are
wasted and continuous monitoring is not possible. Moreover a point source is utilized and simultaneous spatial and time
resolutions are not then attainable. Other minor disadvantages
are the limited number of scanned fringes which can be recorded on the oscilloscope screen if accuracy is to be maintained
and, with piezo-electric drives, the change in finesse from
111
fringe to fringe. Also since a photomultiplier is employed variations in electron path length and time-of-flight lead to a time resolution limit of to" to 10-10 sons.
The development of image intensifiers(5) combining the high quantum efficiencies of photocathodes with the information
VIII 19 -79-
content of photographic plates, led us to investigate the
possibility of employing the Fabry-Perot interferometer in its classical photographic method of use for time-resolution
spectroscopy. The principle ofthe method is illustrated in figure 1. The image of the slit crossed with interference fringes is swept by a rotating mirror across the photocathode
of the image-tube. Alternatively, electron-optical sweeping may be employed") but at a coat of linear resolution in
the image-tube. The advantges of the method are immediately obvious.
Firstly a continuouo time record is obtained since wave-
number and time dispersions are now crossed. Secondly, since there is a one-to-one correspondence between source and ring
pattern, simultaneous spatial resolution is achieved, also crossed with the time dispersion. Finally there is a gain in
luminosity depending upon the order of the fringe employed.
The Interferometer.
As usual it is necessary to match the linear resolution g of the image tube to that of the projected fringe halfwidth.
This requires, for the pth ring from the centre, a focal
length of f = 2g1417;i, N is the finesse, a) the wavenumber
and a the interferometer separation. Maximum use is made of
the image-tube photocathode area if the interferometer is
tilted and only half of the ring pattern employed. For
a cathode of linear dimension 1,the maximum number of
rings is then (13 - p1 ) = 1/2q, independent of p1 , p2
if the halfwidth of the p2th ring from the centre is
matched to g. Angular dispersion decreases from the centre so it is beat to start with the first ring out. Then
p1 G 1. Also for a given image-tube the maximum number
of rings depends only on the finesse.
The angular width ofthe slit is determined by the
usual relation 0( = Na9 giving a linear width
a . 4gR. Spectra resolving power of the swept image
is littll affected by ring curvature for a slit of this
width. A typical value of g is 100 - 200/4Vso that for a
2 cm photocathode 100 - 200 time resolution elements are
obtained on each of the 5 or 10 fringes.
The gain in luminosity over the oscillating Fabry-Perot spectrometer arises from the fact that the fringes are continuously and simultaneously recorded not just (1/N) of an order at a time. If m fringes are utilized the total
gain is mN. However there is a loss in luminosity since
only a fraction of a fringe (eviroip) of a complete ring
is recorded for a slit of width a. So for each fringe the
gain G in luminosity isIT217. This gain decreases with
increasing p and has its maximum value at p = (the
central fringe). For p = 1, N = 10 the gain is about unity.
It is not very useful to consider the total gain in
luminosity6 for while the density of each fringe remains
constant, because of the parabolic dispersion of the inter-ferometer the elementary resolution area decreases from the central fringe outwards so the information rate decreases.
This also follows from the decrease in luminosity for increasing p. Thins spatial resolution has to be paid for
to a small extent by decreasing the rate of scan. Putting

-80- VIII 18
p = 5, N = 10 gives GV 0.5., The information in the central
rings is of course correspondingly greater.
The Image Detector.
The above comparison of the two methods of use of the
interferometer is based on the assumption that the signal-to-
noise ratio of a photomultiplier and an image-tube with
photographic recording of the output can be made equal.
Unfortunately this is not always true of all image-tubes
presently available. Though tube background is negligible
for rapid time-resolved spectroscopy, with some tubes signal
induced background can be serious.
The system was first tested with a five-stage magnetically
focused transmission secondary-emission image intensifier
(20th Century Electronics Type 1PM 29/25) of the type
developed at Imperial College5. This tube has a linear
resolution of 30 lam, a 20 mm photocathode of 29% A/lumen
sensitivity and a blue light gain of 105 at 33 kV with a
tube background of 103 ScintilJations sec-1 cm-2. An inter-
ferometer separation of 0.4 mm and coatings of 85$ reflec-
tivity gave a spectral resolving power of 32,000 for A 5461
MgI. Fig. 2 shows the swept fringes oqk5461 of a high
pressure mercury lamp with a tube voltage of 26 kV. The
alit width of 125/W was magnified to 25018L, on the tube photo-
cathode giving 80 time resolution elements per fringe which,
with a mirror speed of 100 c/s, corresponds to a 2 x 10⁻⁶ sec
time resolution limit. The effect of signal-induced back-
ground is immediately apparent as is also the wide spread in
the multiplication factor for individual photoelectrons, both
effects leading to a decrease in the effective signal/noise
ratio in the recorded image.
The signal-induced background is mainly due to unfocused
penetrating primary electrons combined with focused photo-
electrons from light reflected back from the first dynode.
The photocathode transmits some of the incident light sad this
is of course common to most types of image intensifier.
Thicker photocathodes should help to reduce the effect which
would be expected to be wavelength dependent also. The
magnitude of the penetrating primaries effect is dependent
on such factors as the thickness and structure of the dynodes.
It is to be hoped that both these effects can be greatly
reduced but meanwhile signal-induced background limits the
use of transmitted secondary-emission image intensifiers for
swept time-resolved spectroscopy. This type of background
is clearly seen from figure 3. A'125 slit croseedvith
interference fringes was focused on the tube photocathode,
of which all but a narrow slit was covered over no that any
possible scattered light effect was eliminated. The output
was recorded in 10-3 secs with a F 1 camera system. On the
left is a direct photograph of the fringes on a 300e slit.
A single stage magnetically focused tube Was employed to
test the relative importance of signal-induced background
arising from back reflected light. The aluminium backed
phosphor screen of this tube is 20 cm from the photocathode
compared with 7 cm between photocathode and first dynode of
the transmitted secondary-emission tube. The gain of such
a tube with P 1 optical coupling to a photographic recorder
is about 5 or with contact print recording about 50.5 Figure
4 shows a swept scan of )0461 of the high pressure mercury
lamp. Spectral resolving power is now 3.2 x 10⁵; the time
resolution limit is 6 x 10⁻⁴ seconds with 60 time elements
on each fringe. Variations in intensity and halfwidth arise
from source instability. A microphotometer trace through
the two central fringes is shown in figure 5. The greatly
improved signal-to-noise ratio is immediately evident and
can be accounted for by the absence of penetrating primary
electrons and the smaller solid angle subtended at the
photocathode by the phosphor output screen.
Finally a three-stage magnetically focussed cascaded
phosphor-photocathode image intensifier of the type developed
at Imperial College by McGee and Catchpole was employed as
detector. This tube originally had a blue light gain of
80,000 at 45EV but the gain has since dropped somewhat.
Optical coupling to the phosphor output was again a F1
system. Figure 6 shone a swept scan of A5461. A slit
width of 0.5 mm on the phosphor screen corresponds to a
time resolution limit of 10 r sec with 50 resolution elements
per fringe. A faster scan giving 3 p sec resolution was
also obtained but the density is not so high. Figure 7 shows
a microphotometer trace of Figure 6. Spectral resolving
power is again 3.2 x 10⁴. The signal-to-noise ratio of the
cascaded phosphor-photocathode tube(run at 33 XV) is much
superior to that of the T.S.E. tube.
Combination of Oscillating Fabry-Perot and Swept Slit Image.
Figure 8 shows the expected result if an oecalaung
Fabry-perot, instead of a fixed gap interferometer, is
employed in the above arrangement. Such a system is ideally
suited for a source of cylindrical symmetry. A continuous
record of a line profile is obtained as a function of radial
distance. Along the axis of the recorded pattern the usual
oscillating interferometer record is obtained.
Conclusion
The combination of a Pabry-Perot interferometer and an
image intensifier provides a powerful diagnostic tool for
plasma physics, providing as it does simultaneous spectral
spatial And time resolution. Image intensifiers are of course
still being developed and perfected and the above results
will undoubtedly be greatly improved upon. For very rapid
time spectroscopy electron-optical sweeping permits shorter
time resolution and it is hoped to test such a system.
Recent developments in coating techniques (7) make
possible extension of the spectral range of the interferometer
into the extreme ultra-violet region. An automatic evaporation
plant has been built for this purpose. Aluminium films
are evaporated in about 3 seconds and immediately, without
breaking the vacuum, overcoated with magnesium fluoride to
both prevent oxidation of the metal and enhance reflectivity.
The optical properties of interferometer type coatings have
not been previously measured below )1\2200 (8). Early results
from our new plant indicate that a reflecting power oi93%
with about 34 transmission is obtainable at k.900 with
magnesium fluoride coated aluminium. Below A2200 the absorptio

4011 I I
11
1
slit EP
width changing
wave) ngth changing also
Figure 1: Principle of the Method.
image tube
laim or rotating miry
1111
Val 19 -81-
Of semi-transparent aluminium alOne increases rapidly from
0.1 to 0.24 at )0900.
Finally we would like to point out that when only an
isolated line without any neighbouring satellites is being
examined, as is frequently the case in plasma diagnosis,
high reflecting powers,as normally employed for hyperfine
structure work, of, 85 % are not always necessary.
Luminosity can often be greatly decreased by reducing the
reflectivity of the interferometer coating ( to as low as
76 ) and at the same time maintaining the spectral resolving
power by increasing plate separation.
Acknowledgement.
We wish to thank Professor J.D.McGee and Mr. C. Catchpole
for useful discussions and for the loan of one of their
cascaded image intensifiers.
A preliminary report on some of this work was given
at the annual meeting of the Spectroscopy Group of the
Institute of physics and the Physical Society in London
1962.
References.
1. Tolansky, S. and Bradley, D.J., Symposium on Inter-ferometry, London, H.M.S.O. 375 (1959).
2. Bradley, D.J., Proc.Roy.Soc.A 262, 529 (1961).
3. Bradley, D.J., Proceedings of Conference on Optical Instruments and Techniques, p.31. London, Chapman & Hall (1961).
4. Cooper, J., Greig, J.R. and Peacock, N.J. This Conference (1963).
5. McGee, J.D., Reports on Progress in Physics 21, 167 (1961).
6. Malyehev, G.M. Razdobarim G.T. and Sokolova, L.V., Soviet Physics - Dokiady j, 701 (1963).
7. Hunter, W.R., Optica Acta 2, 255 (1962). 8. Hase,G. and Waylonis, J.B., J.Opt.Soc.Am. 21, 719 (1961).
Figure/7 M46: high pressure mercury: E Amage intensifier. Timei
1— resolution
2 x 10- secs. Spectral resolution 3.2 x 10⁴.
(
Figure zi; Interference fringes on slit (a) Direct 'photography, (b) T.S.B. image intensifier.
(&)
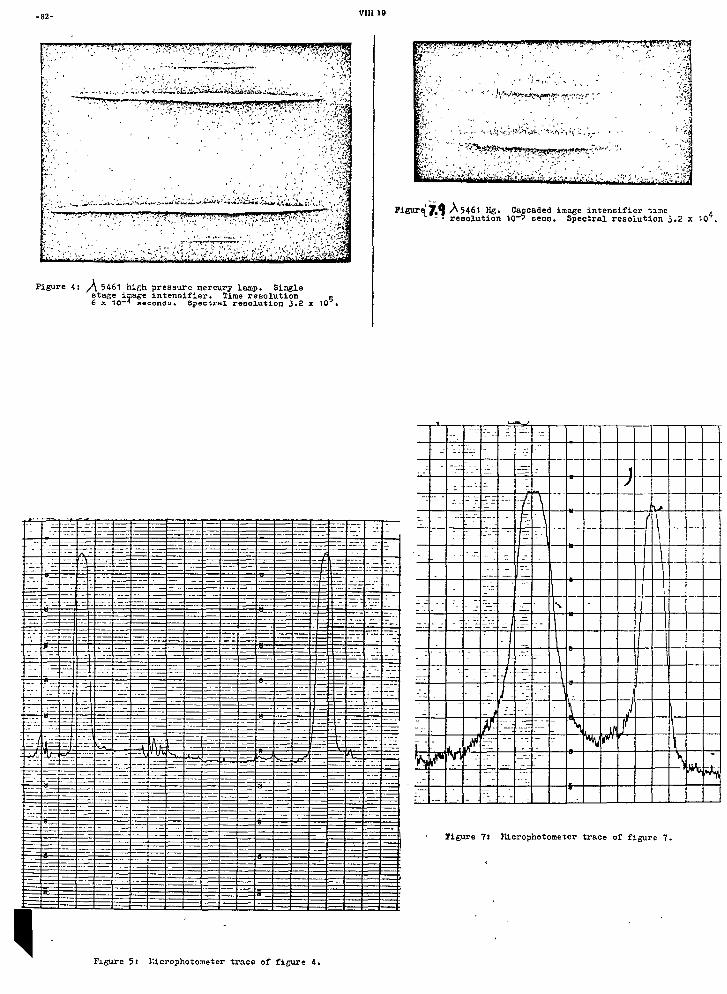
Figure 7: Microphotometer trace of figure 7.
)
144400
S
S
-82- VIII 19
Figure 41 A 5461 high pressure mercury lamp. Single stage image intensifier. Time resolution 6 x 10⁻⁴ second°. Spectral resolutiOn 3.2 x 10⁵.
Figuret VS 15461 Hg. Cascaded image intensifier time - • resolution 10-- secs. Spectral resolution 3.2 x 10⁴.
Figure 5: Licrophotometer trace of figure 4.
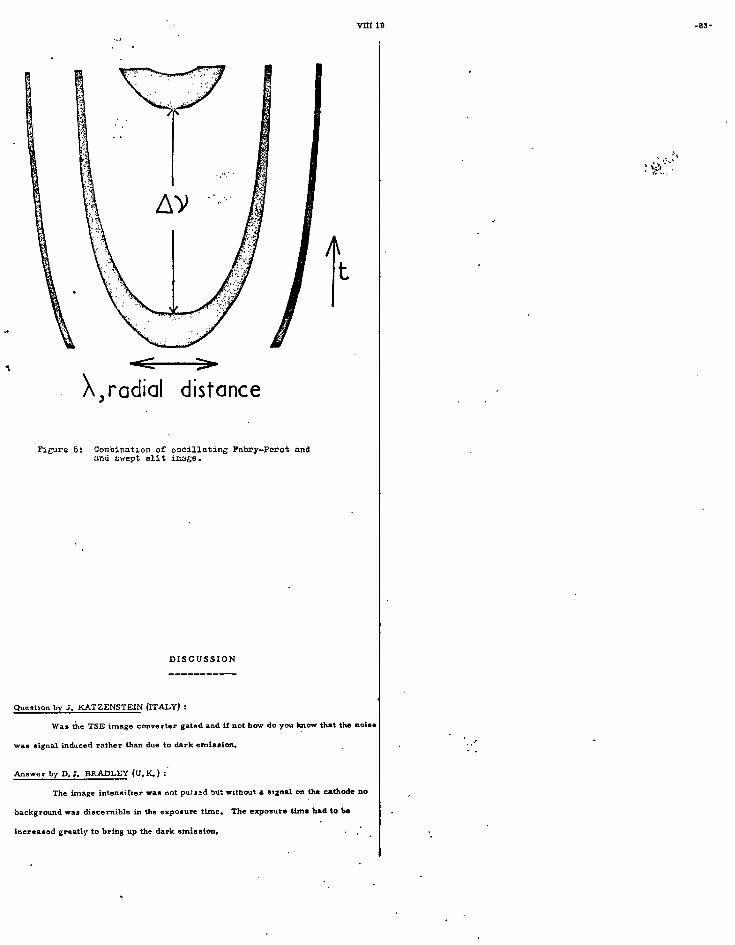
VIII 19 -89-
X radial distance
Figure 8i Combination of oscillating Fabry—Perot and and swept alit image.
DISCUSSION
Question by 3. HAT ZENSTEIN (ITALY) :
Was the TSE image converter gated and if not how do you know that the noise
was signal induced rather than due to dark emission.
Answer by D.J. BRADLEY (U. IC.)
The image intensifier was not pu:sed but without a signal on the cathode no
background was diecernible in the exposure time. The exposure time had to be
increased greatly to bring up the dark emission.
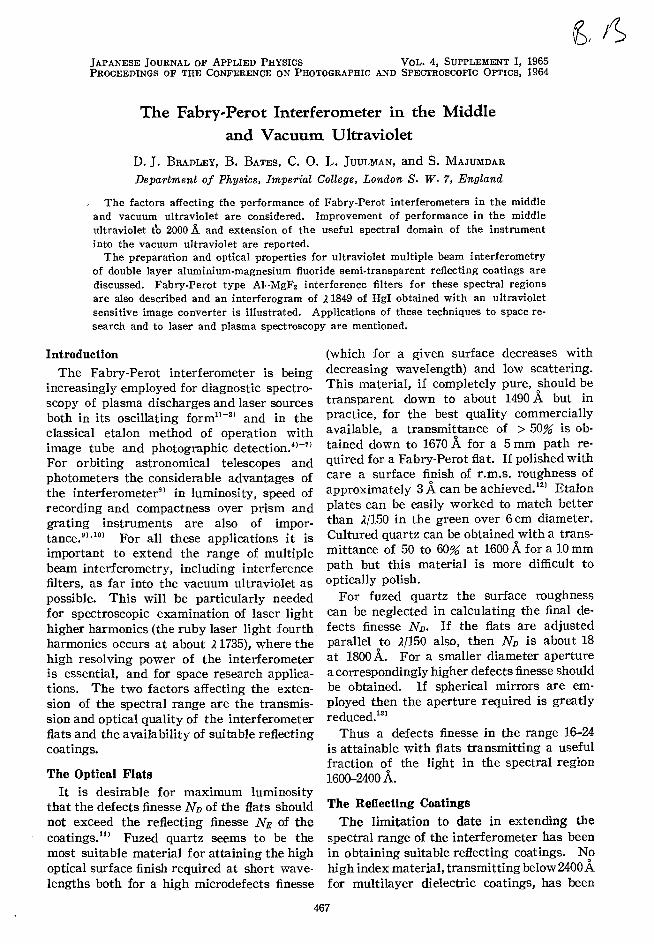
E iS JAPANESE JOURNAL OF APPLIED PHYSICS VOL. 4, SUPPLEMENT 1, 1965 PROCEEDINGS OF THE CONFERENCE ON PHOTOGRAPHIC AND SPECTROSCOPIC OPTICS, 1964
The Fabry-Perot Interferometer in the Middle and Vacuum Ultraviolet
D. J. BRADLEY, B. BATES, C. 0. L. JUULMAN, and S. MAJUMDAR
Department of Physics, Imperial College, London S. W. 7, England
The factors affecting the performance of Fabry-Perot interferometers in the middle and vacuum ultraviolet are considered. Improvement of performance in the middle ultraviolet t'o 2000 A. and extension of the useful spectral domain of the instrument into the vacuum ultraviolet are reported.
The preparation and optical properties for ultraviolet multiple beam interferometry of double layer aluminium-magnesium fluoride semi-transparent reflecting coatings are discussed. Fabry-Perot type Al-MgF2 interference filters for these spectral regions are also described and an interferogram of 21849 of HgI obtained with an ultraviolet sensitive image converter is illustrated. Applications of these techniques to space re-search and to laser and plasma spectroscopy are mentioned.
Introduction The Fabry-Perot interferometer is being
increasingly employed for diagnostic spectro-scopy of plasma discharges and laser sources both in its oscillating form' and in the classical etalon method of operation with image tube and photographic detection.' For orbiting astronomical telescopes and photometers the considerable advantages of the interferometer" in luminosity, speed of recording and compactness over prism and grating instruments are also of impor-tance.9).10) For all these applications it is important to extend the range of multiple beam interferometry, including interference filters, as far into the vacuum ultraviolet as possible. This will be particularly needed for spectroscopic examination of laser light higher harmonics (the ruby laser light fourth harmonics occurs at about 2 1735), where the high resolving power of the interferometer is essential, and for space research applica-tions. The two factors affecting the exten-sion of the spectral range are the transmis-sion and optical quality of the interferometer flats and the availability of suitable reflecting coatings.
The Optical Flats It is desirable for maximum luminosity
that the defects finesse ND of the flats should not exceed the reflecting finesse NR of the coatings.' Fuzed quartz seems to be the most suitable material for attaining the high optical surface finish required at short wave-lengths both for a high microdefects finesse
(which for a given surface decreases with decreasing wavelength) and low scattering. This material, if completely pure, should be transparent down to about 1490 A but in practice, for the best quality commercially available, a transmittance of > 50% is ob-tained down to 1670 A for a 5 mm path re-quired for a Fabry-Perot flat. If polished with care a surface finish of r.m.s. roughness of approximately 3 A can be achieved.' Etalon plates can be easily worked to match better than 2/150 in the green over 6 cm diameter. Cultured quartz can be obtained with a trans-mittance of 50 to 60% at 1600 A for a 10 mm path but this material is more difficult to optically polish.
For fuzed quartz the surface roughness can be neglected in calculating the final de-fects finesse ND. If the flats are adjusted parallel to 4150 also, then ND is about 18 at 1800 A. For a smaller diameter aperture a correspondingly higher defects finesse should be obtained. If spherical mirrors are em-ployed then the aperture required is greatly reduced.'
Thus a defects finesse in the range 16-24 is attainable with flats transmitting a useful fraction of the light in the spectral region 1600-2400 A. The Reflecting Coatings
The limitation to date in extending the spectral range of the interferometer has been in obtaining suitable reflecting coatings. No high index material, transmitting below 2400 A for multilayer dielectric coatings, has been
467

468 D. J. BRADLEY, B. BATES, C. O. L. JUULMAN, AND S. MAJUMDAR
discovered so far. H } However, reported measurements1S) on the optical properties of semitransparent aluminium films down to 2200 A, when analysed by us, showed that aluminium improves in performance for multiplebeam interferometry with decreasing wavelength, provided a reflecting finesse of 30 is adequate. This is illustrated in figure 1,
004
0.3
+ 2537.4
2200.4. .2700.4 (,) 2600.4. 2700.4.
ClIo 2600 A
61
\ 0
r 2600)(\ 21,0CA 02500.4 0.2 ~ 2600;' 0 0
\ ~ . . K2800A 0 2850 A \ 2600 A " 0.1 \ Ie 2500;'
\ K 0 0
" 2400A
0.00 10 20 N 30 40 50 R
+ RbI + Na3 AI Fi; x Cs/+Mg~
II» Al + MgF2 + PbF2
o Pb~ + Na3 AI F6
Fig. 1. AI, AI-dielectric multilayers and dielectric multi· layers in the ultraviolet spectral region. Al 2200 A and 3000 A;lS} Al 2600 A;16} AI-MgF2-PbF2 multilayers;26} CsI-MgF2 multilayers;27} RbI-NaaAIF6 multilayers;28} PbF2-NaaAIF6 multilayers. 14}
which includes plots of the interferometer transmission 7: as a function of the reflecting finesse NR for aluminium films based upon the results of Hass and Waylonis. 1S} It can be seen that for a given value of NR the peak fringe transmission 7: is greater at 2200 A than for 3000 A for all values of N R •
The points corresponding to various dielectric and dielectric-aluminium multilayer combinations for wavelengths > 2400 A, also given in the figure, indicate their superiority over aluminium films for the longer wavelengths. The curve for 2600 A derived from earlier results on aluminium films16} shows the advance obtained with improved evaporation techniques.
Since, as we have seen, the defects finesse decreases with decreasing wavelength so that the reflecting finesse required decreases also, N R =20 will be adequate at 2200 A.
Previous to this analysis improvements17 }
in the evaporation technique of depositing opaque aluminium films, overcoated with thin layers of magnesium fluoride to prevent oxidation and to enhance reflectivity in the vacuum ultraviolet, led us to believe9 } that a similar improvement could be obtained in the performance of semi-transparent aluminium films so as to permit extension to this spectral region for interference spectroscopy from an earth satellite. Our first results4 }
indicated that thinner aluminium films similarly overcoated are suitable for multiplebeam interferometry down to 1900 A. Since then we have further studied the optical properties of such films down to 1800 A and employed them in Fabry-Perot type interference filters and for interference spectroscopy.
Method of Film Preparation and Optical Measurements
Aluminium of 99.99% purity is rapidly evaporated from heated tungsten wire filaments in an automatically controlled evaporation plant evacuated by a mercury diffusion pump. The reflectivity of a metal film is controlled by a. shutter actuated by a reflectance monitoring unit, while the thickness of the magnesium fluoride overcoating is similarly controlled by monitoring the front surface reflection from a glass plate during the evaporation. In both cases the monitoring light is of wavelengths 4300-4500 A. The aluminium is evaporated in about 3 seconds at a deposition rate of the order of 100 A per second. The MgF2 evaporation begins within about 20 seconds after the completion of the aluminium evaporation and takes about 50 seconds to complete. The initial pressure is about 5x10⁻⁶ mm of Hg though there is a slight increase during the aluminium evaporation. The results obtained are quite reproducible provided care is taken in cleaning both the aluminium and substrate.
The "Spectrosil" B substrates, usually 30 mm diameter discs 2 mm thick and polished to plate glass finish (2 fringes) are ultrasonically cleaned in detergent, then immersed in isopropyl alcohol with a final isopropyl alcohol vapour wash. The aluminium wire is cleaned in 50-50 hydrochloric acid, washed in water and then in acetone. Before evaparation, glow discharge cleaning is
,)
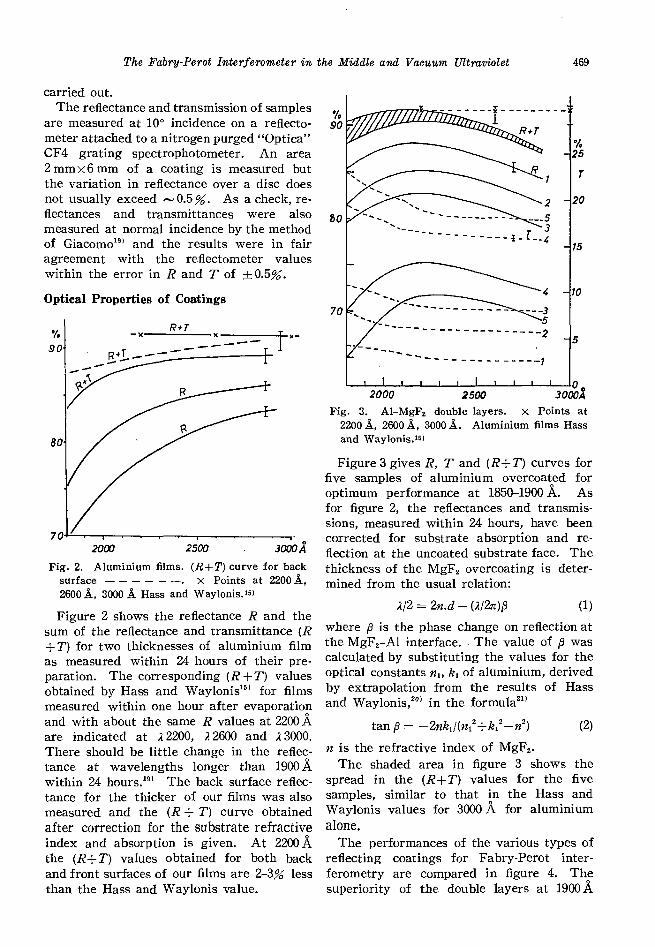
The Fabry-Perot Interferometer in the Middle and Vacuum mtraviolet 469
carried out. The reflectance and transmission of samples
are measured at 10° incidence on a reflectometer attached to a nitrogen purged "Optica" CF4 grating spectrophotometer. An area 2 mmx6 mm of a coating is measured but the variation in reflectance over a disc does not usually exceed ,..., 0.5 %. As a check, reflectances and transmittances were also measured at normal incidence by the method of GiacomolBI and the results were in fair agreement with the reflectometer values within the error in Rand T of ± 0.5%.
Optical Properties of Coatings
% 90
R+T -x:--~~---x------~T~x-
---- 1 R+T _ --:~-_-_-__ --+ -----Q.~'\
2000 2500
Fig. 2. Aluminium films. (R+T) curve for back surface - - - - - -. x Points at 2200 A, 2600 A, 3000 A Hass and Wayionis. 151
Figure 2 shows the reflectance R and the sum of the reflectance and transmittance (R + T) for two thicknesses of aluminium film as measured within 24 hours of their preparation. The corresponding (R + T) values obtained by Hass and Waylonis151 for films measured within one hour after evaporation and with about the same R values at 2200 A are indicated at j/ 2200, j/ 2600 and j/ 3000. There should be little change in the reflectance at wavelengths longer than 1900 A within 24 hours.191 The back surface reflectance for the thicker of our films was also measured and the (R + T) curve obtained after correction for the substrate refractive index and absorption is given. At 2200 A the (R+ T) values obtained for both back and front surfaces of our films are 2-3% less than the Hass and Waylonis value.
---
----
2 --_5
3 - - - - - - i - L-4
4
---3 5
-----------------2 - - - - - - - - - - - - - - --1
% 25
T
20
15
10
5
Fig. 3. AI-MgF2 double layers. x Points at 2200 A, 2600 A, 3000 A. Aluminium films Hass and Waylonis.'51
Figure 3 gives R, T and (R+ T) curves for five samples of aluminium overcoated for optimum performance at 1850-1900 A. As for figure 2, the reflectances and transmissions, measured within 24 hours, have been corrected for substrate absorption and reflection at the uncoated substrate face. The thickness of the MgF2 overcoating is determined from the usual relation:
j//2 = 2n.d - (j//2n)I' (1)
where I' is the phase change on reflection at the MgFz-AI interface .. The value of I' was calculated by SUbstituting the values for the optical constants n" k, of aluminium, derived by extrapolation from the results of Hass and Waylonis,2ol in the formula2ll
tan I' = -2nkd(nlz+k,z-nz) (2)
n is the refractive index of MgFz. The shaded area in figure 3 shows the
spread in the (R+T) values for the five samples, similar to that in the Hass and Waylonis values for 3000 A for aluminium alone.
The performances of the various types of reflecting coatings for Fabry-Perot interferometry are compared in figure 4. The superiority of the double layers at 19ooA..
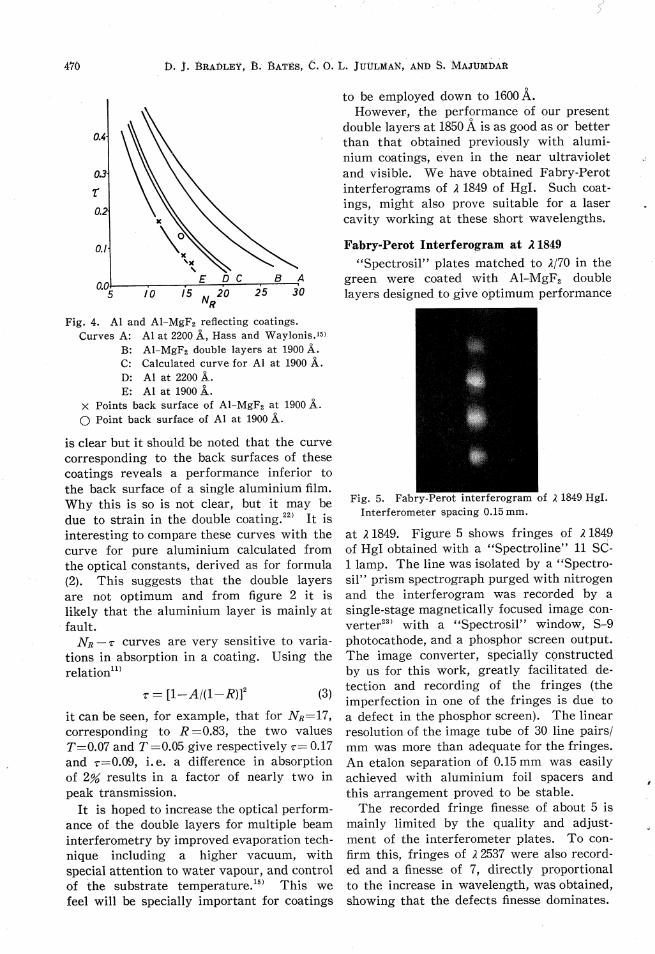

LsA=115A
The Fabry-Perot Interferometer in the Middle and Vacuum Ultraviolet 471
A high quality 6 cm diameter Fabry-Perot interferometer with plates of "Spectrosil A" matched to better than 2/150 in the green has now been constructed and we hope to extend the spectral range below 1700 A for diagnostic spectroscopy and space research applications, employing the instrument both in its oscillating form and in its spectro-graphic method of use. Image intensifiers incorporating time resolution devices and solar blind photocathodes are being de-veloped for this work.°
Fabry-Perot Type Interference Filters For satellite and rocket photometry it is
important to obtain interference filters cap-able of operation at wavelengths below 2000 A. Such filters could also be used to isolate line structures for higher resolution study by the interferometer (e. g. 21640 of Hell). We have already reported') on the transmission characteristics of first order interference filters deposited on "Spectrosil" substrates. These filters consist of two aluminium reflecting layers separated by a magnesium fluoride spacing layer of thick-
ness d given by
(m-1)2 =2nd—(2/277)213 (4)
where n and t3 are the same as in equations (1) and (2) above, and m is an integer. The outer aluminium layer is protected from oxi-dation by a magnesium fluoride overcoating.
In figure 6, curve A is the transmission characteristic of a filter peaking at 1825 A. Below 1800 A the finesse decreases because of the falling reflectivity at the Al-MgF2 interfaces, but at about 1660 A the rapidly increasing absorption of the substrate leads to a sharp cut-off. Above 1800 A the trans-mission profile corresponds to a halfwidth of 225 A and a finesse of 8.
Curve B is the transmission characteristic of the same filter tilted through 8° to dis-place the peak wavelength to 1805 A. Also indicated on the figure is the halfwidth of 115 A for a filter with peak transmission of 19% at 1825 A, composed of two double-layer Al-MgF2 reflectors separated by a vacuum gap. The half width and peak trans-mission are calculated from the results shown in figure 3.
20
18
16
J4
12
JO
0 1600
Fig. 6. Transmission curves of first-order Fabry-Perot type filter.
Conclusion The feasibility of multiple beam inter-
ferometry down to 1800 A has been demon-strated and weo hope to extend the spectral range to 1600 A for diagnostic spectroscopy and space applications. Employing lithium fluoride or sapphire substrates interference filters should be feasible to about 1500 A. Interferometric determination of wavelength standards in this spectral region is now pos-sible with extension to shorter wavelengths by the Combination Principle.'
Acknowledgements We thank Professor J. D. Mc Gee for his
advice and encouragement, Professor W. R. S. Garton for helpful discussion and the gene-rous lending of equipment, and Mr. D. S. Widner for making the filter measurements in the Seya monochromator. Assistance from the British National Committee for Space Research for the purchase of equip-ment and the support of one of us (C. 0. L. J.) is gratefully acknowledged. One of us (S. M.) is supported by a Colombo Plan Fellowship.
1800
2000 2200A

472 D. J. BRADLEY, B. BATES, C. O. L. JUULMAN, AND S. MAJUMDAR
References 1) S. Tolansky and D. J. Bradley: N. P. L. Sym
posium on Interferometry (R. M. S. 0., London, 1959).
2) N. J. Peacock and E. T. Hill: U. K. A. E .. A. Culham Laboratory Report on Time-Resolved Interferometric Measurements of Emission Line Profiles (U. K. A. E. A. Culham Laboratory, Culham, 1964).
3) D. R. Herriot: Applied Optics 2 (1963) 865. 4) D. J. Bradley, B. Bates, and C. O. L. Juulman:
Proc. Sixth Conf. Phenomenes d'Ionization dans Ie Gaz 4 (C. 1. P. 1. G., Paris, 1963), p. 79.
5) G. M. Malyshev, G. T. Razdoharim, and L. V. Sokolova: Soviet Physics - Doklady 7 (1963) 701.
6) D. J. Bradley, B. Bates, C. O. L. Juulman, and S. Majumdar: Applied Optics 3 (1964) 1461.
7) D. J. Bradley, A. W. De Silva, D. E. Evans, and M. J. Forrest: Nature 199 (1963) 1281.
8) P. Jacquinot: Reports on Progress in Physics 23 (1960) 267.
9) D. J. Bradley: Proceedings of the Conference on Optical Instruments and Techniques (Chapman and Hall, London, 1961), p. 31.
10) T. Dunham: Vistas in Astronomy, Vol. 2 (Pergamon Press, London, 1956), p. 1223.
11) R. Chabbal: J. Rech. C. N. R. S. 24 (1953) 138.
12) H. E. Bennett and J. O. Porteus: J. Opt. Soc. Am. 51 (1961) 123.
13) D. A. Jackson: Proc. Roy. Soc. A 263 (1961) 289.
14) G. Honica and K. Krebs: Z. Physik 156 (1959} 117.
15) G. Hass and J. E. Waylonis: J. Opt. Soc. Am. 51 (1961) 719.
16) J. C. Burridge, H. Kuhn, and A. Pery: Proc. Phys. Soc. B 46 (1953) 963.
17) G. Hass and R. Tousey: J. Opt. Soc. Am. 49' (1959) 593.
18) P. Giacomo: Compt. Rend. 235 (1952) 1627. 19) P. H. Berning, G. Hass, and R. P. Madden: J ..
Opt. Soc. Am. 50 (1960) 586. 20) D. J. Schroeder: J. Opt. Soc. Am. 52 (1962) 1380. 21) J. M. Bennett: J. Opt. Soc. Am. 54 (1964) 612 .. 22) L. G. Schulz and F. R. Tangherlini: J. Opt.
Soc. Am. 44 (1954) 357. 23) J. D. McGee: Reports on Progress in Physics,
24 (1961) 167 .. 24) D. J. Bradley, B. Bates, C. O. L. Juulman, and
S. Majumdar: Nature 202 (1964) 579. 25) B. Edlen: Reports on Progress in Physics 26-
(1963) 181. 26) Z. Les, F. Les, and L. Gabla: Acta Physica
Po Ionic a 23 (1963) 211. 27) A. Stendel: J. Phys. Radium 19 (1958) 312. 28) R. Lennuier: J. Phys. Radium 19 (1958) 319_
DISCUSSION
Mangus, J. What size, diameter, plates are you using? Bradley, D. J . We have now 6 cm plates flat to Af150 in the green. Hariman, P. L. What material are you hoping to use for 4th harmonic generation
of ruby light? Bradley, D. J. Crystal quartz.

Reprinted from APPLIED OPTICS, Vol. 3, page 1461, December 1964 Copyright 1964 by the Optical Society of America and reprinted by permission of the copyright owner
Time Resolved Photoelectric Spectrography by Electron-Optical Image Detection of Etalon Interferograms
D. J. Bradley, B. Bates, C. 0. L. Juulman, and S. Majumdar
The application of a Fabry—Perot etalon combined with an electron-optical image detector to obtain simultaneously time, spatial, and spectral resolution of plasma and laser sources is discussed, and com-parison is made with oscillating Fabry—Perot interferometers. Matching of the interferometer to the image tube is considered, and optimum conditions are determined. Four types of image tubes were tested and the effects of signal-induced background and noise are described. Finally, the interpretation of time-resolved interferograms of wavetrains of very short duration, such as obtained from laser giant pulses, is dealt with, and extension of the interferometer spectral range in the vacuum uv reported.
Introduction The superior angular dispersion and large light gath-
ering power of photoelectric interferometric spectro-meters are being increasingly exploited for plasma diag-nostic spectroscopy. In particular, the oscillating Fabry—Perot interferometer has proved to be a power-ful tool for time-resolved spectroscopy, and the tech-nique has been extended to laser spectroscopy where the high spectral resolving powers required can be ob-tained by interferometric means only. The advantages and optical principles of the oscillating interferometer for time-resolved spectroscopy have been previously discussed, '.2 and instruments employing electromechan-ical'.3-5 and piezoelectric drives6-8 have since been fully developed. However, this method of use of the interferometer suffers from the serious disadvantage that time and wavenumber dispersion are superposed. It is thus necessary to scan at a speed N times greater than the rate of change of the phenomena studied (where N is the interferometer finesse) which leads to a decrease in the signal-to-noise ratio attainable with a given source. Also, continuous monitoring is not possible, and, since a point source is utilized, simultaneous spatial and time resolutions are not obtained.
With the development of Q-spoiled laser systems9 with outputs lasting <20 nsec and spectral widthsi° <0.01 time-resolved interferometric spectroscopy in the nanosecond region is now required. At these speeds, time-sequential spectral scanning results in a distorted recorded profile because of Doppler shifts at the moving mirror. However, the increase in the time
The authors are with the Physics Department, Imperial Col- lege, London, England.
Received 25 March 1964.
resolution limit by the factor N (usually about 20) is the most serious limitation, since the time resolution limit set by the source itself cannot be achieved, as will be shown, and time resolution is obtained only at the expense of spectral resolving power, and the study of phenomena such as multimoding would not be pos-sible."
The development of image intensifiers" combining the high quantum efficiencies of photocathodes with the information capacity of the photographic plate led us to explore the possibility of employing the Fabry—Perot interferometer in combination with an image-tube detector for time-resolved spectroscopy to overcome the limitations of the oscillating instrument, and re-ports of our preliminary investigations have been made."'" We now wish to summarize these, and more recent results employing electronography, to comment further on the optimum conditions of match-ing the interferometer and the image tube, and to dis-cuss the application of the method to laser spectroscopy.
The Photoelectric Spectrographic Method The Fabry—Perot ring pattern superposed on a slit
image, as in the classical photographic method of use, is swept across the output phosphor of an image tube to give a continuous time record, since wavenumber and time dispersions are now crossed. We have initially tested the system with a rotating mirror system (Fig. 1). The slit-ring pattern was swept across the photocath-odes of four different types of image tube. The time resolution limit of 2 µsec was set entirely by the inten-sity of the mercury arc source. For laser and plasma source, electron-optical sweeping14,15 or a multiple-beam image tube" may be employed.
The advantages of the method are immediately obvious. The only limit to time resolution is now the
December 1964 / Vol. 3, No. 12 / APPLIED OPTICS 1461
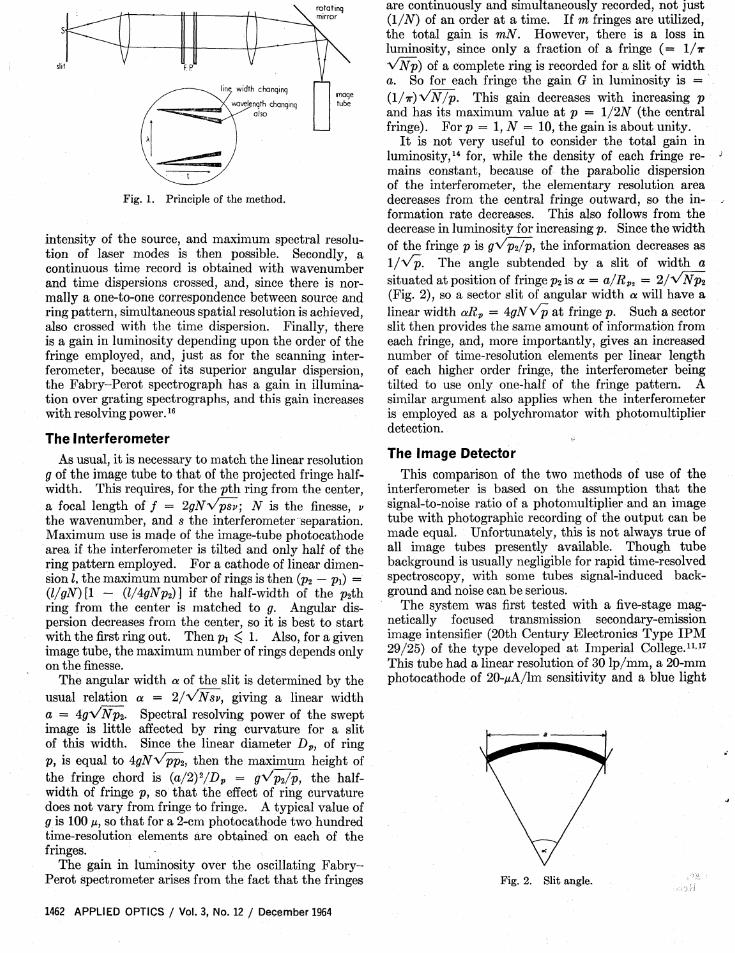
slit FP
line width changing
wavelength changing also
Fig. 1. Principle of the method.
Image tube
intensity of the source, and maximum spectral resolution of laser modes is then possible. Secondly, a continuous time record is obtained with wavenumber and time dispersions crossed, and, since there is normally a one-to-one correspondence between source and ring pattern, simultaneous spatial resolution is achieved, also crossed with the time dispersion. Finally, there is a gain in luminosity depending upon the order of the fringe employed, and, just as for the scanning interferometer, because of its superior angular dispersion, the Fabry-Perot spectrograph has a gain in illumination over grating spectrographs, and this gain increases with resolving power. 16
The Interferometer
As usual, it is necessary to match the linear resolution g of the image tube to that of the projected fringe halfwidth. This requires, for the pth ring from the center, a focal length off = 2gNVpsv; N is the finesse, v the wavenumber, and s the interferometer separation. Maximum use is maqe of the image-tube photocathode area if the interferometer is tilted and only half of the ring pattern employed. For a cathode of linear dimension l, the maximum number of rings is then (P2 - Pi) = (l/gN) [1 - (lj4gNp2) 1 if the half-width of the P2th ring from the center is matched to g. Angular dispersion decreases from the center, so it is best to start with the first ring out. Then Pi ~ 1. Also, for a given image tube, the maximum number of rings depends only on the finesse.
The angular width a of the slit is determined by the usual relation a = 2/VNsv, giving a linear width a= 4gVNp2. Spectral resolving power of the swept image is little affected by ring curvature for a slit of this width. Since the linear diameter D p , of ring p, is equal to 4gN~, then the maximum height of the fringe chord is (a/2)2/D p = gVp2/P, the halfwidth of fringe p, so that the effect of ring curvature does not vary from fringe to fringe. A typical value of g is 100 p" so that for a 2-cm photocathode two hundred time-resolution elements are obtained on each of the fringes.
The gain in luminosity over the oscillating FabryPerot spectrometer arises from the fact that the fringes
1462 APPLIED OPTICS / Vol. 3, No. 12 / December 1964
are continuously and simultaneously recorded, not just (l/N) of an order at a time. If m fringes are utilized, the total gain is mN. However, there is a loss in luminosity, since only a fraction of a fringe (= 1/11" VNP) of a complete ring is recorded for a slit of width a. So for each fringe the gain G in luminosity is = (1/1I")VN/p. This gain decreases with increasing p and has its maximum value at p = 1/2N (the central fringe). Forp = 1, N = 10, the gain is about unity.
It is not very useful to consider the total gain in luminosity,14 for, while the density of each fringe remains constant, because of the parabolic dispersion of the interferometer, the elementary resolution area decreases from the central fringe outward, so the information rate decreases. This also follows from the decrease in luminosity for increasing p. Since the width of the fringe p is gV P2/ p, the information decreases as 1/v'P. The angle subtended by a slit of width a situated at position of fringe P2 is a = a/Rp2 = 2/vNp2 (Fig. 2), so a sector slit of angular width a will have a linear width aRp = 4gNVp at fringe p. Such a sector slit then provides the same amount of information from each fringe, and, more importantly, gives an increased number of time-resolution elements per linear length of each higher order fringe, the interferometer being tilted to use only one-half of the fringe pattern. A similar argument also applies when the interferometer is employed as a polychromator with photomultiplier detection.
The Image Detector
This comparison of the two methods of use of the interferometer is based on the assumption that the signal-to-noise ratio of a photomuItiplierand an image tube with photographic recording of the output can be made equal. Unfortunately, this is not always true of all image tubes presently available. Though tube background is usually negligible for rapid time-resolved spectroscopy, with some tubes signal-induced background and noise can be serious.
The system was first tested with a five-stage magnetically focused transmission secondary-emission image intensifier (20th Century Electronics Type IPM 29/25) of the type developed at Imperial College. U •17
This tube had a linear resolution of 30 Ip/mm, a 20-mm photocathode of 20-p,A/lm sensitivity and a blue light
1+----- a ---'---001
Fig. 2. Slit angle.

Fig. 3. X5461 high-pressure mercury lamp. Single-stage image tube. Time resolution 6 X 10⁻⁴ sec; spectral resolution 3.3 X
105 sec.
gain of 105 at 33 kV with a tube background of 103 scintillations sec-1 cm-2. An interferometer separation of 0.4 mm and coatings of 85% reflectivity gave a spectral resolving power of 32,000 for X5461 HgI of a high-pressure mercury lamp. The slit-width of 125 was magnified to 250 g on the tube photocathode, giving eighty time-resolution elements per fringe which, with a mirror speed of 100 cps, corresponds to a 2 X10⁻⁶ sec time resolution limit. Even with a tube voltage of only 26 kV, the signal-induced background and noise and the wide spread in the multiplication factor for individual photoelectrons resulted in such a decrease in the effective signal-to-noise ratio in the recorded image as to make it unsuitable for diagnostic spectroscopy.
The signal-induced noise is mainly due to unfocused penetrating primary electrons, whereas the signal-induced background arises from focused photoelectrons from light reflected back from the first dynode. The photocathode transmits some of the incident light, and this is, of course, common to most types of image in-tensifier. Thicker photocathodes should help to reduce the effect which would be expected to be wavelength-dependent also. The magnitude of the penetrating primaries' effect is dependent on such factors as the thickness and structure of the dynodes. It is to be hoped that both these effects can be greatly reduced, but meanwhile signal-induced noise limits the use of transmitted secondary-emission image intensifiers for swept time-resolved spectroscopy.
A single-stage magnetically focused tube was em-ployed to test the relative importance of signal-in-duced background arising from back reflected light. The aluminum-backed phosphor screen of this tube is 20 cm from the photocathode compared with 7 cm between photocathode and first dynode of the trans-mitted secondary-emission tube. The gain of such a tube with F 1 optical coupling to a photographic re-corder is about 5 or with contact print recording about 50.11 Figure 3 shows a swept scan of X5461 of the high-pressure mercury lamp. Spectral resolving power is now 3.2 X 10⁵, and the time-resolution limit is 6 X 10⁻⁴ sec with sixty time elements on each fringe. Variations in intensity and half-width arise from source instability. A microphotometer trace of the two central fringes is shown in Fig. 4. Penetrating primary electrons are
absent, of course, and the smaller solid angle subtended at the photocathode by the phosphor output screen re-duces the effect of back reflected light.
Next a three-stage magnetically focused cascaded phosphor-photocathode image intensifier of the type developed at Imperial College by McGee and Catch-pole" was employed as detector. This tube originally had a blue light gain of 80,000 at 45 kV, but the gain had dropped somewhat. Optical coupling to the phosphor output was again an F 1 system. Figure 5 shows a microphotometer tracing of a swept scan of N5461. A slit-width of 0.5 mm on the phosphor screen corresponds to a time-resolution limit of 10 sec with fifty resolution elements per fringe. A faster scan giving 3-Asec resolution was also obtained, but the density was not so high. Spectral resolving power is again 3.2 X 10⁴. The signal-to-noise ratio of the cascaded phosphor-photocathode tube is much superior to that of the transmitted secondary-emission multiplier tube.
11111/WEE-MILMINSUNIIIII IlEilmilEMEMEMENIVEMIIN INIIIIIENEEMEEMNIMIMME
11111111111111111
WarrabrialitHE Fig 4. Microphotometer trace of Fig. 3
Fig. 5. Microphotometer trace of X5461 fringes. Cascaded image intensifier. Time resolution 10-6 sec, spectral resolution
3.2 X 10' sec.
December 1964 / Vol. 3, No. 12 / APPLIED OPTICS 1463
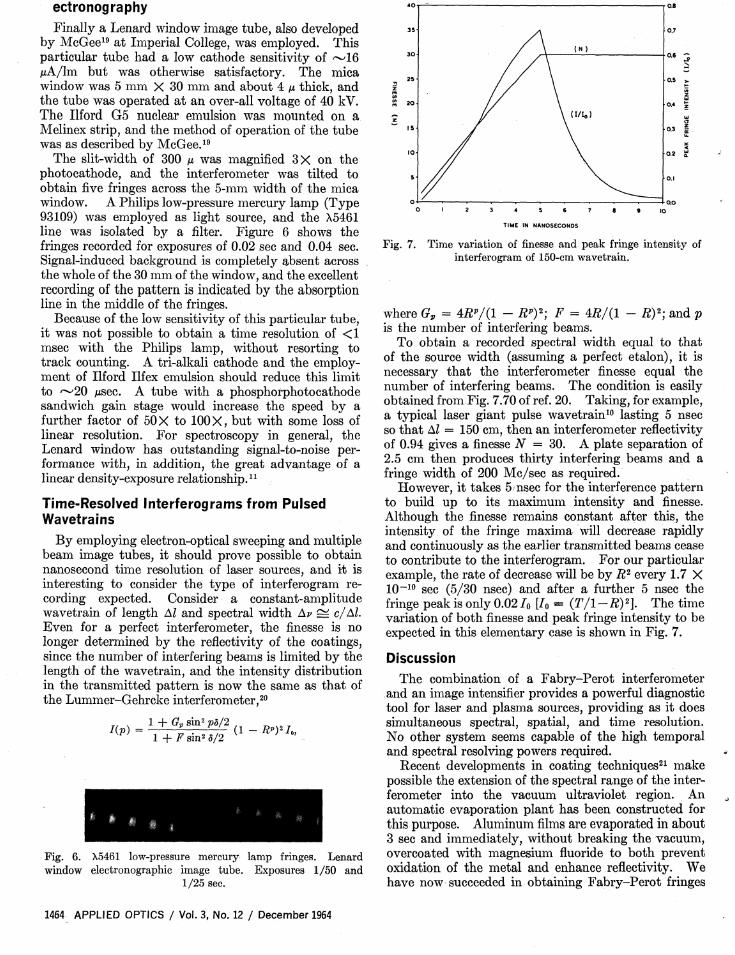
ectronography
Finally a Lenard window image tube, also developed by McGee19 at Imperial College, was employed. This particular tube had a low cathode sensitivity of ",,16 /LA/1m but was otherwise satisfactory. The mica window was 5 mm X 30 mm and about 4 /L thick, and the tube was operated at an over-all voltage of 40 kV. The Ilford G5 nuclear emulsion was mounted on a Melinex strip, and the method of operation of the tube was as described by McGee. 19
The slit-width of 300 /L was magnified 3 X on the photocathode, and the interferometer was tilted to obtain five fringes across the 5-mm width of the mica window. A Philips low-pressure mercury lamp (Type 93109) was employed as light source, and the A5461 line was isolated by a filter. Figure 6 shows the fringes recorded for exposures of 0.02 sec and 0.04 sec. Signal-induced background is completely absent across the whole of the 30 mm of the window, and the excellent recording of the pattern is indicated by the absorption line in the middle of the fringes.
Because of the low sensitivity of this particular tube, it was not possible to obtain a time resolution of <1 msec with the Philips lamp, without resorting to track counting. A tri-alkali cathode and the employment of !lford Ilfex emulsion should reduce this limit to '""-'20 /Lsec. A tube with a phosphorphotocathode sandwich gain stage would increase the speed by a further factor of 50 X to 100 X, but with some loss of linear resolution. For spectroscopy in general the Lenard window has outstanding signal-to-noise' performance with, in addition, the great advantage of a linear density-exposure relationship. 11 .
Time-Resolved Interferograms from Pulsed Wavetrains
By employing electron-optical sweeping and multiple beam image tubes, it should prove possible to obtain nanosecond time resolution of laser sources, and it is interesting to consider the type of interferogram recording expected. Consider a constant-amplitude wavetrain of length ,1l and spectral width ,1p '" c/ ,1l.
Even for a perfect interferometer, the finesse is no longer determined by the reflectivity of the coatings, since the number of interfering beams is limited by the length of the wavetrain, and the intensity distribution in the transmitted pattern is now the same as that of the Lummer-Gehrcke interferometer,20
J() 1 + Gp sin' po/2 p = 1 + F sin' 0/2 (I - Rp)' J,.
Fig. 6. >.5461 low-pressure mercury lamp fringes. Lenard window electronographic image tube. Exposures 1/50 and
1/25 sec.
1464 APPLIED OPTICS / Vol. 3, No. 12 / December 1964
'0 0.8
0.7
0.' :; :::
~ c.,
~
~ in
0.' ~ z '" " 0.3 !O
f: ~ ..
0.2 w .. 0.1
,-I-'-~----~----~----=:=).o.o 10
TI~E IN NANOSECONDS
Fig. 7. Time variation of finesse and peak fringe intensity of interferogram of IS0-cm wavetrain.
where G1' = 4R1'/(1 - RP)2; F = 4R/(1 - R)2; and p is the number of interfering beams.
To obtain a recorded spectral width equal to that of the source width (assuming a perfect etalon), it is necessary that the interferometer finesse equal the number of interfering beams. The condition is easily obtained from Fig. 7.70 of ref. 20. Taking, for example, a typical laser giant pulse wavetrain10 lasting 5 nsec so that ,1l = 150 cm, then an interferometer reflectivity of 0.94 gives a finesse N = 30. A plate separation of 2.5 cm then produces thirty interfering beams and a fringe width of 200 Mc/sec as required.
However, it takes 5,nsec for the interference pattern to build up to its maximum intensity and finesse. Although the finesse remains constant after this, the intensity of the fringe maxima will decrease rapidly and continuously as the earlier transmitted beams cease to contribute to the interferogram. For our particular example, the rate of decrease will be by R2 every 1.7 X 10⁻¹⁰ sec (5/30 nsec) and after a further 5 nsec the fringe peak is only 0.0210 [10 == (T /1-R)2]. The time variation of both finesse and peak fringe intensity to be expected in this elementary case is shown in Fig. 7.
Discussion
The combination of a Fabry-Perot interferometer and an image intensifier provides a powerful diagnostic tool for laser and plasma sources, providing as it does simultaneous spectral, spatial, and time resolution. No other system seems capable of the high temporal and spectral resolving powers required.
Recent developments in coating techniques21 make possible the extension of the spectral range of the interferometer into the vacuum ultraviolet region. . An automatic evaporation plant has been constructed for this purpose. Aluminum films are evaporated in about 3 sec and immediately, without breaking the vacuum, overcoated with magnesium fluoride to both prevent oxidation of the metal and enhance reflectivity. We have now succeeded in obtaining Fabry-Perot fringes

at X1.849 and an interference filter with a bandwidth of 200 A and 19% peak transmission at this wavelength."
Finally, we would like to point out that when only an isolated line without any neighboring satellites is being examined, as is frequently the case in plasma diagnosis, high reflecting powers, as normally employed for hyper-fine structure work, of >85%, are not always neces-sary. Luminosity can often be greatly increased by re-ducing the reflectivity of the interferometer coating (to as low as 75%) and at the same time maintaining the spectral resolving power by increasing plate separa-tion.
We wish to thank J. D. McGee for his interest, en-couragement, and helpful discussion during the course of this work and, in particular, for the loan of both cascade and Lenard window image tubes. S. Majumdar is supported by a Colombo Plan Fellowship and C.O.L Juulman by the British National Committee for Space Research.
References 1. S. Tolansky and D. J. Bradley, N.P.L. Symposium on
Interferometry (Her Majesty's Stationery Office, London, 1959), p. 375.
2. D. J. Bradley, Proc. Roy. Soc. (London) A262, 529 (1961). 3. D. J. Bradley, Proceedings of Conference on Optical Instru-
ments and Techniques (Chapman and Hall, London, 1961), p. 31.
4. D. J. Bradley, J. Opt. Soc. Am. 52, 222 (1962).
5. D. R. Herriot, Appl. Opt. 2, 865 (1963). 6. J. Cooper and J. R. Greig, Nature 195, 371 (1962). 7. J. V. Ramsay, Appl. Opt. 1, 411 (1962). 8. N. J. Peacock and E. T. Hill, "Culham Laboratory Report",
U.K.A.E.A. Culham, England (1962). 9. F. J. McClung and R. W. Hellwarth, Proc. IEEE 51, 46
(1963). 10. D. J. Bradley, A. W. Desilva, D. E. Evans, and M. J.
Forrest, Nature 199, 1281 (1964). 11. J. D. McGee, Reports on Progress in Physics (The Physical
Society, London, 1961), Vol. 24, p. 167. 12. D. J. Bradley, Institute of Physics and The Physical Society
Spectroscopy Group, London meeting abstracts (1962). 13. D. J. Bradley, B. Bates, and C. 0. L. Juulman, Proc. of VI
Conf. Phenomenes d' Ionization dans les Gaz, Paris (1983), (Centre d'Etudes Nucleaires, Saclay, France, 1963), Vol. 4, p. 791.
14. G. M. Malyshev, G. T. Razdobarim, and L. V. Sokolova, Soviet Physics-Doklady 7, 701 (1963).
15. D. J. Bradley and S. Majumdar, to be published. 16. P. Jacquinot, Reports on Progress in Physics (The Physical
Society, London, 1960), Vol. 23, p. 267. 17. W. L. Wilcock, D. L. Emberson, and B. Weekley, Nature
185, 370 (1960). 18. J. D. McGee and C. E. Catchpole, British I.E.E. Conf.
Rept., Series 5, p. 182 (1962). 19. J. D. McGee and B. E. Wheeler, Advances in Electronics and
Electron Physics (Academic, London, 1962), Vol. 16, p. 47. 20. M. Born and E. Wolf, Principles of Optics (Pergamon,
London, 1959), pp. 340-346. 21. W. R. Hunter, Optica Acta 9, 255 (1962). 22. D. J. Bradley, B. Bates, C. 0. L. Juulman, and S. Majum-
dar, Nature 202, 579 (1964).
December 1964 / Vol. 3, No. 12 / APPLIED OPTICS 1465

Notes on Experimental Technique and Apparatus The measurements given in the table were made starting
with the highest voltage and then reducing it. The first exposure of an etched platinum foil to 8 or 9 kv usually resulted in a decrease of ion current with time to a steady value. When an etched foil was not first exposed to 8 or 9 kv it was effective in ionizing nitrogen with only 4 kv applied. An etched foil which had never been exposed to more than 4 kv gave at this voltage a current of 4 x 10⁻⁸ A when nitrogen was present at 0.35 mtorr pressure. 8 kv was then applied to the foil for a few minutes: on lowering the potential to 4 kv again, the total current was less than 4 x 10⁻¹° A. Possibly protrusions which intensify the electric field were torn off, or smoothed by field evaporation, at the higher voltage.
Attempts were made to improve the efficiency of razor blades by various etching procedures, grinding and stropping,. heating in vacuum and reduction in hydrogen, but no signi-ficant increase of ion current resulted.
The etched platinum foil was used in a mass spectrometer with the simpler of the two ion sources described by Robertson and Viney (1966). With oxygen present Ott was observed, and with nitrogen N2'I'. The resolved Ion beam of 02 4 was 2 x IV" A with an oxygen pressure in the ion source of 0.1 mtorr and a voltage of 6 kv between the foil and the adjacent plate containing a slit. A resolved N2+ beam of 1 x 10— '4 A was obtained with a nitrogen pressure of 0.2 mtorr and 9.5 kv. Only about one in 105 of the ions formed was transmitted through the mass spectrometer, so there is much
scope for improvement by the use of focusing systems in the ion source.
Since the chief requirement for field ionization is a high electric field, it seems likely that the etched foils owe their efficiency to a very sharp edge; however, the problem of the importance of the nature of the metal used in field ionization needs further investigation. The reason for the failure of etching procedures to improve razor blades is not clear: perhaps the blades owe their efficiency to surface roughness which is removed by etching. For a linear variation of field ion current with gas pressure (Robertson et al. 1963) the best results for nitrogen shown in the table correspond to an ion current of 10-14 A at a pressure of 0.1 ntorr. It seems that the development of a focusing system for ions in a field ionization mass spectrometer ion source would make possible gas analysis by this method in the ultra-high vacuum region.
Acknowledgments We thank the Gas Council, the Institute of Petroleum and
the Science Research Council for financial support.
References BECKEY, H. D., 1963, Z. InstrumKde, 71, 51-4. ROBERTSON, A. J. B., and VINEY, B. W., 1966, Advances in
Mass Spectrometry, Vol. 3, Ed. W. L. Mead (London: Institute of Petroleum), pp. 23-33.
ROBERTSON, A. J. B., VINEY, B. W., and WARRINGTON, M., 1963, Brit. .1. App!. Phys., 14, 278-83.
J. SCI. 1NSTRUM., 1966, vol.. 43
An optically contacted permanently adjusted high finesse Fabry—Perot interferometer
B. BATES,t D. J. BRADLEY,t T. KOHNOt and H. W. YATESt t Royal Holloway College, Department of Physics, Englefield Green, Surrey
Optical Surfaces Ltd., Stoats Nest Road, Coulsdon, Surrey MS. received 31st March 1966
Abstract. A Fabry—Perot interferometer constructed with three fused silica optically contacted spacers for a solar rocket spectrograph is described. A recorded fringe finesse of 30 was obtained with a 2 cm etalon aperture using a 198Hg source.
For space research applications (Bradley 1966 to be published) and for laser and plasma diagnostic interference spectroscopy (Bradley et al. 1964), a permanently adjusted Fabry—Perot interferometer would have many advantages in ease of use and the reproducibility of results. Solid interferometers (Lau 1931) have been employed in the past but it is exceedingly difficult optically to work the faces of a block of sufficient aperture to be both flat and parallel to the required accuracy. This is particularly true if the interferometer is to be used in the far ultra-violet (<3000 A) since the surface finish require-ments increase linearly with the decreasing wavelength and it would be necessary for many experiments to have the faces parallel and flat to better than /1/1 50 in the green; also any inhomogeneity of the material would result in a lower defects
476
finesse (Jacquinot 1960). In addition the reflectivity at the quartz-reflecting coatings interfaces would be less than for an air-gap instrument. Thus if aluminium—magnesium fluoride overcoatings were employed (Bradley et al. 1965) at, say, A 1850 the effective reflectivity would be reduced by about 2%. This would result in a reduction of the reflecting finesse (Jacquinot 1960) from 16 to 14 and of the interfero-meter transmission from 20 to 16%.
An optically contacted 10 cm air-gap etalon has been previously employed in the near infra-red (Jackson and Kuhn 1935) but the fringe finesse obtained was not recorded. For a 10 cm gap it would not have been possible to measure the instrumental profile with the light sources then available.
An interferometer spacing of 0.4 mm and a clear aperture
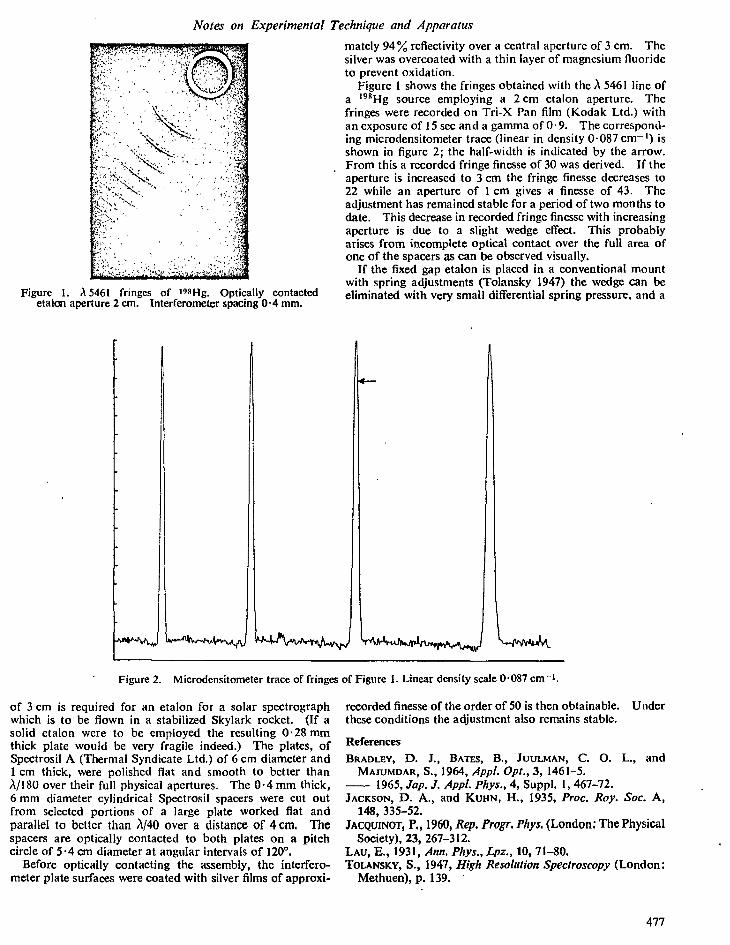
Notes on Experimental Technique and Apparatus mately 94 % reflectivity over a central aperture of 3 cm. The silver was overcoated with a thin layer of magnesium fluoride to prevent oxidation.
Figure 1 shows the fringes obtained with the A 5461 line of a I98Hg source employing a 2 cm etalon aperture. The fringes were recorded on Tri-X Pan film (Kodak Ltd.) with an exposure of 15 sec and a gamma of 0.9. The correspond-ing microdensitometer trace (linear in density 0.087 cm-1) is shown in figure 2; the half-width is indicated by the arrow. From this a recorded fringe finesse of 30 was derived. If the aperture is increased to 3 cm the fringe finesse decreases to 22 while an aperture of 1 cm gives a finesse of 43. The adjustment has remained stable for a period of two months to date. This decrease in recorded fringe finesse with increasing aperture is due to a slight wedge effect. This probably arises from incomplete optical contact over the full area of one of the spacers as can be observed visually.
If the fixed gap etalon is placed in a conventional mount with spring adjustments (Tolansky 1947) the wedge can be eliminated with very small differential spring pressure, and a Figure 1. A 5461 fringes of 19811g. Optically contacted
etalon aperture 2 cm. Interferometer spacing 0.4 mm.
L
Livveask
Figure 2. Microdensitometer trace of fringes of Figure 1. Linear density scale 0.087 cm -1.
of 3 cm is required for an etalon for a solar spectrograph which is to be flown in a stabilized Skylark rocket. (If a solid etalon were to be employed the resulting 0.28 mm thick plate would be very fragile indeed.) The plates, of Spectrosil A (Thermal Syndicate Ltd.) of 6 cm diameter and 1 cm thick, were polished flat and smooth to better than A/180 over their full physical apertures. The 0.4 mm thick, 6 mm diameter cylindrical Spectrosil spacers were cut out from selected portions of a large plate worked flat and parallel to better than A/40 over a distance of 4 cm. The spacers are optically contacted to both plates on a pitch circle of 5.4 cm diameter at angular intervals of 120°.
Before optically contacting the assembly, the interfero-meter plate surfaces were coated with silver films of approxi-
recorded finesse of the order of 50 is then obtainable. Under these conditions the adjustment also remains stable.
References BRADLEY, D. J., BATES, B., JUULMAN, C. 0. L., and
MAJUMDAR, S., 1964, Appl. Opt., 3, 1461-5. — 1965, Jap. J. Appl. Phys., 4, Suppl. 1, 467-72. JACKSON, D. A., and KUHN, H., 1935, Proc. Roy. Soc. A,
148, 335-52. JACQUINOT, P., 1960, Rep. Progr. Phys. (London; The Physical
Society), 23, 267-312. LAU, E., 1931, Ann. Phys., Lpz., 10, 71-80. TOLANSKY, S., 1947, High Resolution Spectroscopy (London:
Methuen), p. 139. '
477

interference Filters for the Far Ultraviolet (1700 A to 2400 A)
B. Bates and D. J. Bradley
The transmission characteristics of Fabry-Perot type aluminum-magnesium fluoride-aluminum inter-ference filters for the wavelength region 1700 A to 2400 A. are described. Typical peak transmissions of 0.25 with bandpasses <300 A are obtained with first-order filters on fused silica substrates. Second-order filters give narrower bandpasses. Methods of filter preparation are described briefly, and the effects of the optical properties of the aluminum reflecting layers on filter performance are discussed.
ntroduction For broadband stellar photometry and for auxiliary
pectral filtering of spectrometers, spectrographs, and pectroheliographs flown in rockets and satellites, the solation of bandwidths of a few hundreds of angstroms s required in the spectral region <3000 A. With heir high luminosity', compactness, and simplicity of ounting, Fabry-Perot type interference filters are articularly suitable for space spectroscopy. Also, he transmission characteristics of this type of filter an, within limits, be optimized during manufacture
suit the particular experimental requirements. For wavelengths <2400 A2, no high-index trans-itting material suitable for multilayer dielectric atings has been discovered so far. However, the cent extension of the effective spectral range of mul-ple-beam interferometry into the vacuum uv3 by iploying semitransparent aluminum films overcoated
ith magnesium fluoride indicated the possibility of anufacturing interference filters for this difficult ectral region <2400 A. This aluminum-dielectric-uminum type of filter is, of course, particularly at-active for space research since it becomes self-blocking longer wavelengths because the aluminum attenua-n increases with increasing wavelength. We have eady reported preliminary results' on the trans-'ssion characteristics of a first-order interference er with a peak transmission of 19% at 1825 A, and w we wish to describe the characteristics of first-d second-order filters with useful bandwidths and
loth authors were in the Physics Department, Imperial Col-London, when this work was done; they are now at the
,sits Department, Royal Holloway College (University of idon), Englefield Green, Surrey, England. ',eceived 7 November 1965. 'his paper was read at the Optics in Space Conference of the ,itute of Physics and the Physical Society, Southampton, ;land, September 1965.
adequate peak transmissions* at wavelengths down to 1725 A.
Interference Relations and Definitions Figure 1 shows a schematic diagram of the four-layer
type of interference filter described in the present work. The optical thickness (nd) of the magnesium fluoride spacer layer required for maximum trans-mission at wavelength Xo is given by
nd = ()to /27)[(m - 1)71- m = 1, 2, . . . , (1)
where m is the order of interference (m = 1 representing a filter of minimum spacer thickness, a so-called first-order filter), # is the absolute phase change' on reflec-tion at the magnesium fluoride-aluminum boundaries, and n. is the refractive index of the dielectric spacer layer. For an opaque aluminum layer coated with a dielectric, this phase shift is given by
tan$ = 2n14/(n2 - ni2 - k12), (2)
where n1 and k1 are the optical constants of the alu-minum, of complex refractive index n1 — ikl. The value of (3 varies with the thickness of the aluminum layer, but for the film thickness employed in our inter-ference filters (200 A to 300 A) the variation of phase change with thickness is smalls and the value of # given by Eq. (2) is satisfactory for determining the spacer layer thickness. Then the transmission properties of aluminum-magnesium fluoride-aluminum bandpass filters are given by the following relations:
* Schroeder, first discussed the feasibility of producing these aluminum-dielectric-aluminum filters for wavelengths down to 1500 A on the basis of an extrapolation of the optical constants of aluminum measured by Hass and Waylonis5 for wavelengths >2200 A. Howevei, the values of expected filter bandwidths computed by Schroeder were incorrect, because he did not take into account phase changes on reflection at the dielectric-metal interfaces [see Eq. (4) below].
June 1966 / Vol. 5, No. 6 / APPLIED OPTICS 971

30
C
I I I I I I I I I I I I 2000
X A
10
o 1500 2-500
TZ,
20
Fig. 1. Schematic dia-gram of the aluminium- magnesium fluoride- aluminum interference
filter. 72 ALUMINIUM
MAGNESIUM FLUORIDE
peak transmission r = 1/[1 (A/T)]'; (3)
bandwidth .6.X = (Xo/Ns)Iern — 1) + (V/,r)]-', (4)
where A is the absorption and T the transmission of a single semitransparent aluminum layer. NR is the reflection finesses which depends on the reflecting power R of the dielectric—metal interface according to the relation:
NR = grk 1 la R). (5)
It is the absorption of the semitransparent aluminum layers which has previously been the major obstacle in extending the spectral range of interference filters into the far uv since, as can be seen from Eq. (3), the peak transmission of a filter is dependent on film ab-sorption.
The final magnesium fluoride overcoating layer serves two functions. In addition to preventing oxidation of the second aluminum film, it also acts as an antire-fleeting layer and thus increases the filter peak trans-mission. This requires a final dielectric layer of optical thickness:
nd = Xthe1/47r. (6)
Method of Filter Manufacture
High-optical-quality aluminum films for the far uv require evaporation at high deposition rates and low pressures.' In the construction of the coating plant currently being employed for the production of inter-ferometer coatings and interference filters, special attention has been paid to the reduction of water vapor in the residual gas atmosphere of the coating chamber. Thus, the chamber and baseplate that are constructed of stainless steel and indium vacuum seals have been used for sealing throughout except for two V iton A demountable seals. A liquid-nitrogen-cooled Meissner coil acts as a fast trap, particularly for water vapor, inside the coating chamber, which is bakeable to 120°C and evacuated by a mercury diffusion pump. Typi-cally, a vacuum pressure in the range 5 X 10⁻⁸ torr to 10-7 torr is obtained prior to evaporation. There is an increase in pressure to 10—' torr during the alu-minum evaporation even though the aluminum has been thoroughly cleaned and previously outgassed. How-ever, the pressure quickly recovers to 10-7 torr when the aluminum evaporation is completed. The aluminum is deposited at a rate of 100 A see-1 to 150 A. and the film thickness is controlled by an automatic monitoring system. (This will be described in a later publication dealing with the reflectance and trans-mittance of aluminum in the far uv.) Deposition of the magnesium fluoride spacer layer begins within 20 sec of the completion of the aluminum evaporation to prevent oxidation of the aluminum film.9 The rate of deposition of the magnesium fluoride layer is 20 A sec—'; and, since this is a slow evaporation, manual control is adequate. A separate monitor plate is used for each of the four layers and a monitoring light source of wavelength ,--,4400 A is employed.
Fig. 2. Experimental transmission curves of first-order filters deposited on Spectrosil B
substrates.
972 APPLIED OPTICS / Vol. 5, No. 6 / June 1966
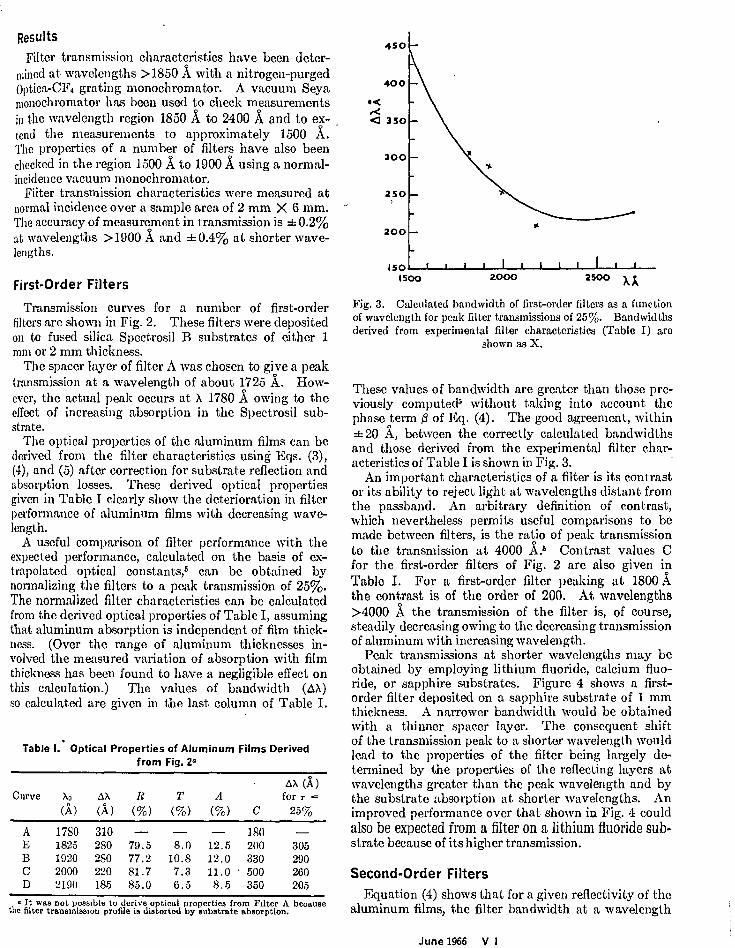
Results Filter transmission characteristics have been deter-
mined at wavelengths >1850 A with a nitrogen-purged Optica-CF4 grating monochromator. A vacuum Seya monochromator has been used to check measurements in the wavelength region 1850 A to 2400 A and to ex-tend the measurements to approximately 1500 A. The properties of a number of filters have also been checked in the region 1500 A. to 1900 A using a normal-incidence vacuum monochromator.
Filter transmission characteristics were measured at normal incidence over a sample area of 2 mm X 6 mm. The accuracy of measurement in transmission is ± 0.2% at wavelengths >1900 A and ± 0.4% at shorter wave-lengths.
450
400
e< 1< <1 350
300
2,50
200
150
First-Order Filters
Transmission curves for a number of first-order filters are shown in Fig. 2. These filters were deposited on to fused silica Spectrosil B substrates of either 1 mm or 2 mm thickness.
The spacer layer of filter A was chosen to give a peak transmission at a wavelength of about 1725 A. How-ever, the actual peak occurs at X 1780 A owing to the effect of increasing absorption in the Spectrosil sub-strate.
The optical properties of the aluminum films can be derived from the filter characteristics using Eqs. (3), (4), and (5) after correction for substrate reflection and absorption losses. These derived optical properties given in Table I clearly show the deterioration in filter performance of aluminum films with decreasing wave-length.
A useful comparison of filter performance with the expected performance, calculated on the basis of ex-trapolated optical constants,' can be obtained by normalizing the filters to a peak transmission of 25%. The normalized filter characteristics can be calculated from the derived optical properties of Table I, assuming that aluminum absorption is independent of film thick-ness. (Over the range of aluminum thicknesses in-volved the measured variation of absorption with film thickness has been found to have a negligible effect on this calculation.) The values of bandwidth (AX) so calculated are given in the last column of Table I.
Table I. Optical Properties of Aluminum Films Derived from Fig. 2.
AX (A) Curve Xo R T A for r =
(A) (A) (%) (%) (%) C 25%
A 1780 310 180 E 1825 280 79.5 8.0 12.5 200 305 B 1920 280 77.2 10.8 12.0 330 290 C 2000 220 81.7 7.3 11.0 ' 500 260 D 2190 185 85.0 6.5 8.5 350 205
s It was not possible to derive optical properties from Filter A because the filter transmission profile is distorted by substrate absorption.
1500 2000 2500 AA
Fig. 3. Calculated bandwidth of first-order filters as a function of wavelength for peak filter transmissions of 25%. Bandwidths derived from experimental filter characteristics (Table I) are
shown as X.
These values of bandwidth are greater than those pre-viously computed, without taking into account the phase term ,3 of Eq. (4). The good agreement, within ±20 A, between the correctly calculated bandwidths and those derived from the experimental filter char-acteristics of Table I is shown in Fig. 3.
An important characteristics of a filter is its contrast or its ability to reject light at wavelengths distant from the passband. An arbitrary definition of contrast, which nevertheless permits useful comparisons to be made between filters, is the ratio of peak transmission to the transmission at 4000 A.' Contrast values C for the first-order filters of Fig. 2 are also given in Table I. For a first-order filter peaking at 1800 A the contrast is of the order of 200. At wavelengths >4000 A the transmission of the filter is, of course, steadily decreasing owing to the decreasing transmission of aluminum with increasing wavelength.
Peak transmissions at shorter wavelengths may be obtained by employing lithium fluoride, calcium fluo-ride, or sapphire substrates. Figure 4 shows a first-order filter deposited on a sapphire substrate of 1 mm thickness. A narrower bandwidth would be obtained with a thinner spacer layer. The consequent shift of the transmission peak to a shorter wavelength would lead to the properties of the filter being largely de-termined by the properties of the reflecting layers at wavelengths greater than the peak wavelength and by the substrate absorption at shorter wavelengths. An improved performance over that shown in Fig. 4 could also be expected from a filter on a lithium fluoride sub-strate because of its higher transmission.
Second-Order Filters Equation (4) shows that for a given reflectivity of the
aluminum films, the filter bandwidth at a wavelength
June 1966 V I

30
TZ
20
c 1
I • \ 1 •
,‘,
0 •"-- • 1 - - 1600 2200 2 600
Fig. 5. Experimental transmission curves of second-order filters deposited
on Spectrosil B substrate.
I0
3600 4000
4400 X
Fig. 4. Experimental transmission characteristic of a first- order filter deposited on a sapphire substrate.
Table II. The Optical Properties of Aluminum Films Derived from Fig. 4
X0 AX R T (A ) (A) (%) (%)
1990 105 77.0 7.0 2130 80 82.5 6.2 2190 155 70.0 16.6
Ao can be reduced by increasing the spacer-layer thick-ness to give higher orders of interference. The prop-erties of several second-order filters having trans-mission peaks centered on wavelengths close to 2000 A are shown in Fig. 5.
The optical properties of the aluminum films have been derived as before from the filter transmission char-acteristics, and values are listed in Tablell. Comparison with properties derived from first-order filters shows that the aluminum films of the second-order filters have an apparently inferior performance characterized by higher absorption values. This greater absorp-tion may, in fact, be owing to increased scattering in the spacer layer since magnesium fluoride films be-come crystalline for thicknesses greater than approxi-mately 1000 A.1° For a first-order filter peaked at 20000A, the spacer-layer thickness (d) is approximately 420 A; but for a second-order filter peaked at, the same wavelength, the corresponding thickness is 1100 A. Although we have not attempted to make filters of higher than second order for wavelengths near 2000 A, the scattering within the space layer with increased thickness may well prove to be a serious limitation in the performance of such filters.
Change in Filter Characteristics with Time The stability of filter transmission characteristics
over long periods of time is a matter of extreme im-portance for space research applications. While no attempt has been made to make a detailed investigation of the change in properties with time, the following observations have been made.
All filters show a change in properties within the first few days after preparation and exposure to the atmosphere. The changes are characterized by a shift in the transmission peak to a longer wavelength and
Curve
B C A
.60% (A) A for r =
(%) 25%
16.0 155
11.3 110
13.4 130
974 APPLIED OPTICS / Vol. 5, No. 6 / June 1966

1
by a reduction in the peak transmission. This is illustrated in Fig. 6 which shows the transmission char-acteristics of a first-order filter measured one day and fourteen days, respectively, after preparation. During this period no special precautions were taken other than storing the filter in a dustfrec atmosphere. No changes in properties have been observed after the first week up to periods of three months after preparation.
These changes in properties of filters during the first few days after preparation may be the result of structural changes in the magnesium fluoride spacer layer, in-creasing absorption of the aluminum films because of continuing oxidation or strain relief at the aluminum-magnesium fluoride boundaries."
All the filter characteristics shown were obtained from leasuremants made at least one week after manufac-ure, after which the properties became stable.
onclusion and Discussion First- and second-order interference filters with char-
cteristics close to theoretical values at wavelengths 1800 A have been produced, and filters with 25% eak transmissions and bandwidths of 300 A or less to be made for the wavelength region 1800 A to 2400 not covered by multilayer dielectric filters. This is a
ttisfactory performance for broadband photometry. t wavelengths <1800 A performance deteriorates cause of the increasing absorption of aluminum oxide ith decreasing wavelength filter. Also, the demands
preparation technique become more stringent if the petted performance shown in Fig. 3 is to be achieved. ie effective contrast of first-order filters could be in-eased by employing them in combination with wave-igth-selective detectors" to eliminate response at iger wavelengths. Similarly, it would be necessary suppress the first-order peak transmission of second-er filters. Composite filters consisting of two or re first-order filters in series on the same substrate' uld also substantially improve contrast. Interfer-e fringes of X 1849 of Hg I have been recorded em-ying two first-order filters to isolate the line and so Tress the strong X 2537 line.
Ve are indebted to J. D. McGee for general labora-- support and encouragement, to W. R. S. Garton the use of a Seya monochromator, and to C. B. as of TJKAEA, Culhana Laboratory, who checked, normal-incidence monochromator the transmission
everal of our filters.
to
16
T7. 14
12
I0
6
4
2
I i I 1 a 1 i I 1 1 I 1800 2000
2200 2400
Fig. 6. The change in properties of a first-order filter with time. Transmission characteristics were measured one day (broken
curve) and fourteen days (full curve) after preparation.
References 1. P. Jacquinot, Rept. Progr. Phys. 23, 267 (1960). 2. G. Honica and K. Krebs, Z. Physik 156, 117 (1959). 3. D. J. Bradley, B. Bates, C. 0. L. Jttulman, and S. Majum-
dar, Nature 202, 579 (1964). 4. D. J. Bradley, B. Bates, C. 0. L. Juulman, and S. Majum-
dar in Proceedings of the Conference on Photographic and Spectroscopic Optics, Suppt. f1, Japan. J. Appl, Phys. 4, 6 (1965).
5. D. J. Schroeder, J. Opt. Soc. Am. 52, 1380 (1962). 6. G. Hass and J. E. Waylonis, J. Opt. Soc. Am. 51, 719 (1061). 7. J. M. Bennett, J. Opt. Soc. Am. 54, 612 (1964). 8. G. Hass and R. Tousey, J. Opt. Soc. Am. 49, 593 (1959). 9. R. P. Madden, L. R. Canfield and G. Hass, J. Opt. Soc.
Am. 53, 620 (1963). 10. L. G. Schulz, J. Chem. Phys. 17, 1153 (1949). 11. L. G. Schulz and F. R. Tangherlini, J. Opt. Soc. Am. 44, 357
(1954). 12. L. Dunkleman, W. B. Fowler, and J. Hennes, Appl. Opt. 1,
695 (1962).
0
June 1966 / Vol. 5, No. 6 / APPLIED OPTICS 975