STUDENT SUCCESS SCORECARD -...
20
California Community Colleges Chancellor’s Office Brice W. Harris, Chancellor 2013 STATE OF THE SYSTEM REPORT STUDENT SUCCESS SCORECARD
Transcript of STUDENT SUCCESS SCORECARD -...
California Community Colleges Chancellor’s OfficeBrice W. Harris, Chancellor
2013 STATE OF THE SYSTEM REPORT
STUDENT SUCCESS SCORECARD

cover image: san diego mesa college

from theCHANCELLOR
California community colleges, with their more than two million students, play a critical role in boosting our state’s economic recovery.
After years of rationing education forced by budget cuts, community colleges are focused on two goals: expanding access to our campuses and helping students succeed in greater numbers.
The California Community Colleges Board of Governors has charted a path to achieve these goals, and all 112 colleges in our system are working to improve edu-cational opportunities for Californians and meet the workforce needs of our changing economy. In addition to workforce training, our colleges provide certificate and degree programs, preparation for transfer to four-year institutions as well as basic skills courses in English and math.
In the coming years we expect to see more of the fruits of our Student Success Initiative, which aims to close achievement gaps, improve outcomes for all students and make the California Community Colleges the most accountable system of public higher education in the nation.
Sincerely,
Brice W. Harris, Chancellor
STUDENT SUCCESS SCORECARD 2013 STATE OF THE SYSTEM REPORT 1
circ
le: l
os an
gel
es pi
erce
col
leg
e; le
ft: s
an d
ieg
o m
iram
ar c
olle
ge
brice w. harris
2 STUDENT SUCCESS SCORECARD 2013 STATE OF THE SYSTEM REPORT
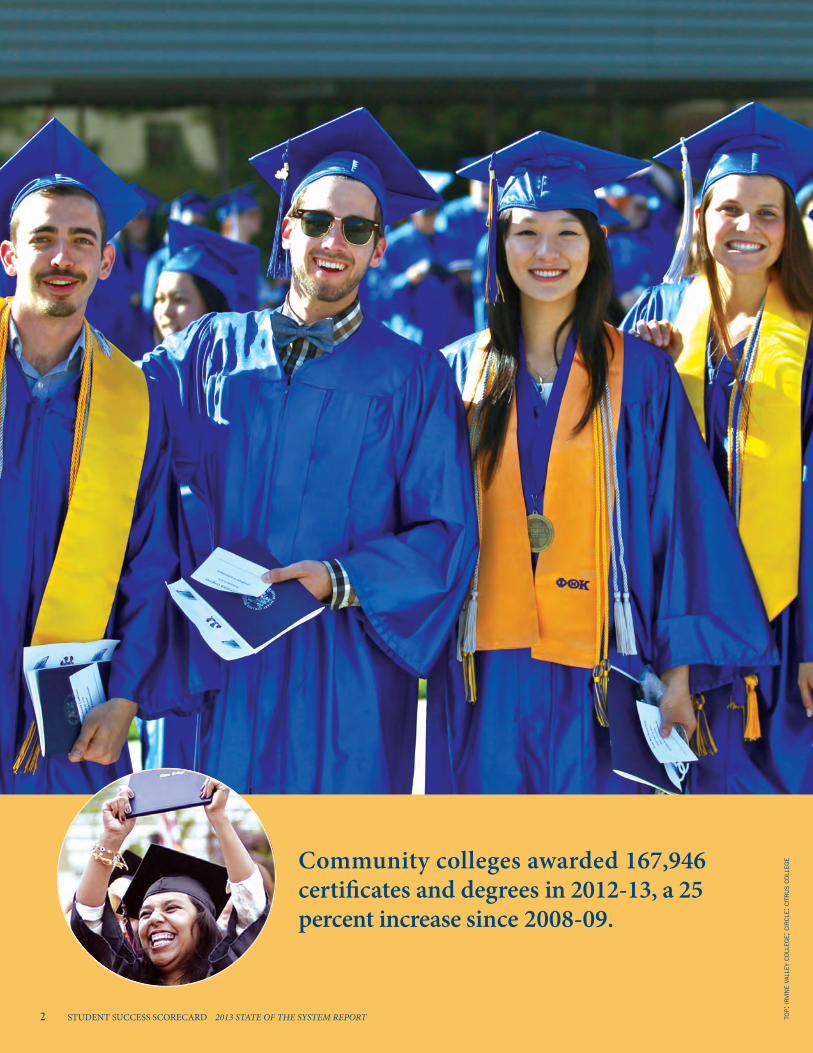
Community colleges awarded 167,946 certificates and degrees in 2012-13, a 25 percent increase since 2008-09.
top:
irvi
ne v
alle
y col
leg
e; ci
rcle
: cit
rus
coll
ege
STUDENT SUCCESS SCORECARD 2013 STATE OF THE SYSTEM REPORT 3...
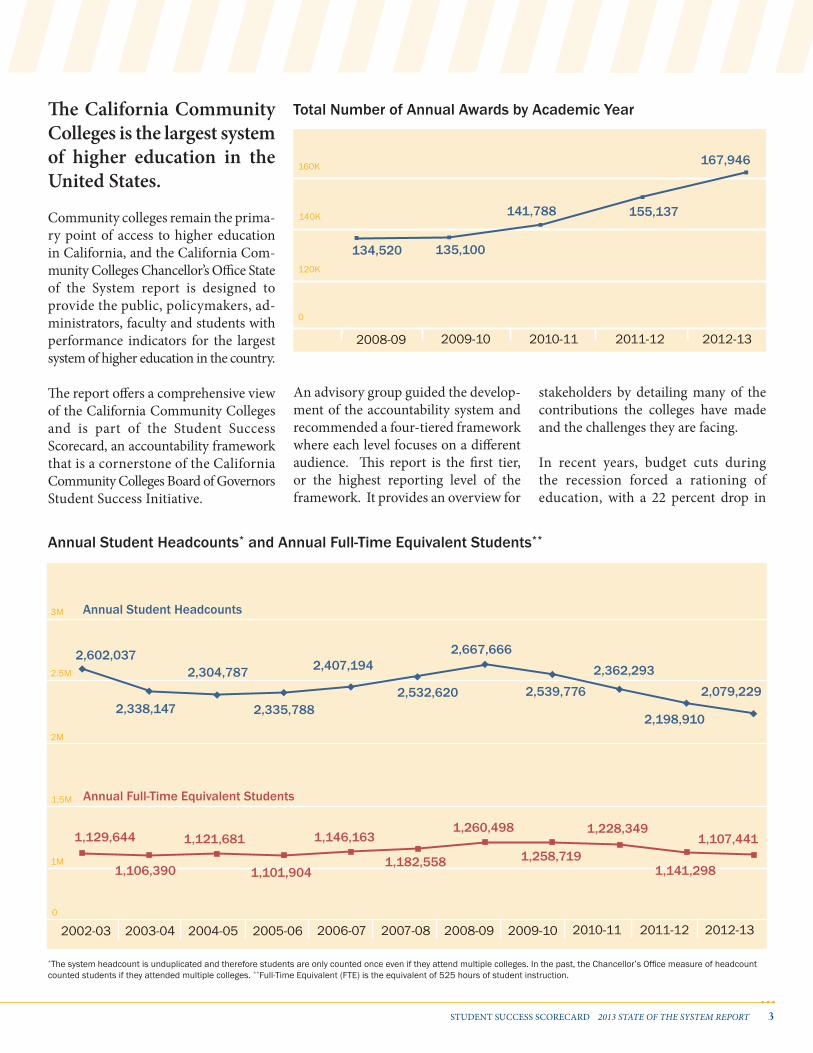
The California Community Colleges is the largest system of higher education in the United States.
Community colleges remain the prima-ry point of access to higher education in California, and the California Com-munity Colleges Chancellor’s Office State of the System report is designed to provide the public, policymakers, ad-ministrators, faculty and students with performance indicators for the largest system of higher education in the country.
The report offers a comprehensive view of the California Community Colleges and is part of the Student Success Scorecard, an accountability framework that is a cornerstone of the California Community Colleges Board of Governors Student Success Initiative.
An advisory group guided the develop-ment of the accountability system and recommended a four-tiered framework where each level focuses on a different audience. This report is the first tier, or the highest reporting level of the framework. It provides an overview for
stakeholders by detailing many of the contributions the colleges have made and the challenges they are facing.
In recent years, budget cuts during the recession forced a rationing of education, with a 22 percent drop in
Total Number of Annual Awards by Academic Year
Annual Student Headcounts* and Annual Full-Time Equivalent Students**
2.5M
3M
2008-09 2009-10 2010-11 2011-12 2012-13
2M
1.5M
1M
2007-082006-07
2,602,037
2004-052003-042002-03 2005-06
1,129,644
2,338,147
2,304,787
2,335,788
2,407,194
2,532,620
2,667,666
2,539,776
2,362,293
2,198,910
2,079,229
1,106,390
1,121,681
1,101,904
1,146,163
1,182,558
1,260,498
1,258,719
1,228,349
1,141,298
1,107,441
Annual Student Headcounts
Annual Full-Time Equivalent Students
*The system headcount is unduplicated and therefore students are only counted once even if they attend multiple colleges. In the past, the Chancellor’s Office measure of headcount counted students if they attended multiple colleges. **Full-Time Equivalent (FTE) is the equivalent of 525 hours of student instruction.
0
120K
140K
160K
2008-09 2009-10 2010-11 2011-12 2012-13
134,520 135,100
141,788 155,137
167,946
0

Some 5,301 Associate in Arts for Transfer and Associate in Science for Transfer degrees with guaranteed admission to California State University were granted in the first full year that they were available.
4 STUDENT SUCCESS SCORECARD 2013 STATE OF THE SYSTEM REPORT top:
city
coll
ege o
f san
fran
cisc
o; ci
rcle
: sou
thw
este
rn co
lleg
e
the number of students served between 2008-09 and 2012-13. Colleges are only beginning to restore some of the access to students who were turned away. This is in large part due to the improving economy and voter approval of Proposition 30.
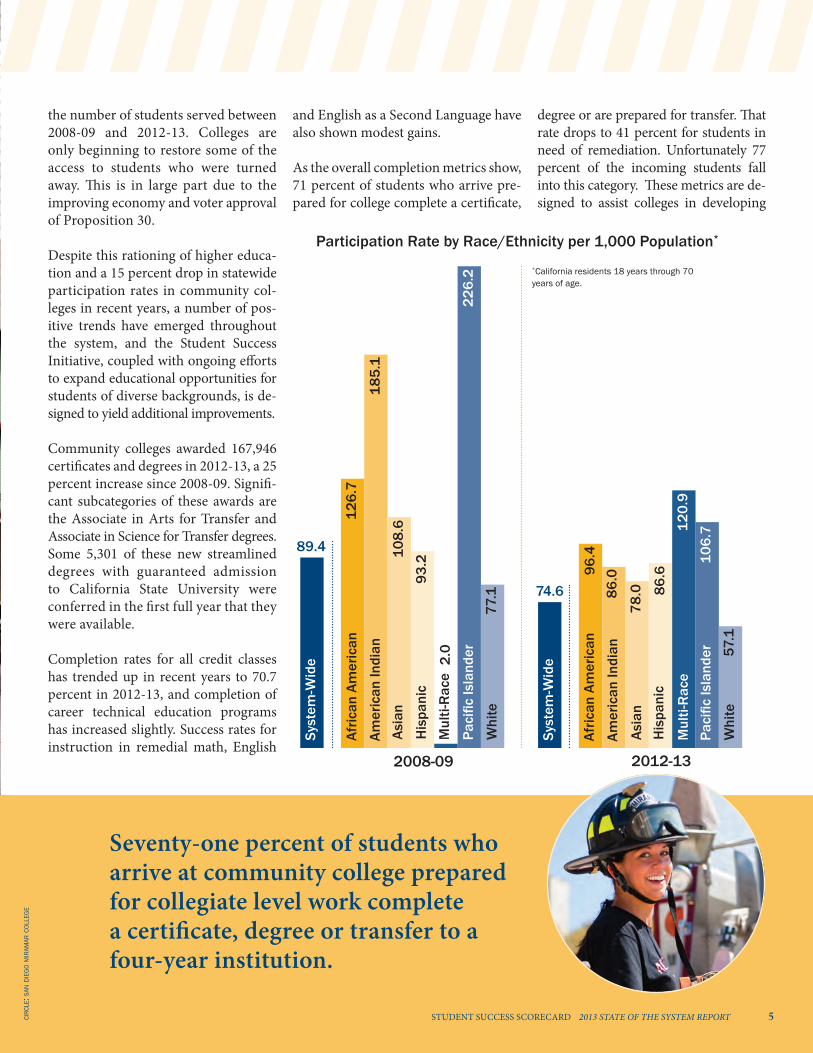
Despite this rationing of higher educa-tion and a 15 percent drop in statewide participation rates in community col-leges in recent years, a number of pos-itive trends have emerged throughout the system, and the Student Success Initiative, coupled with ongoing efforts to expand educational opportunities for students of diverse backgrounds, is de-signed to yield additional improvements.
Community colleges awarded 167,946 certificates and degrees in 2012-13, a 25 percent increase since 2008-09. Signifi-cant subcategories of these awards are the Associate in Arts for Transfer and Associate in Science for Transfer degrees. Some 5,301 of these new streamlined degrees with guaranteed admission to California State University were conferred in the first full year that they were available.
Completion rates for all credit classes has trended up in recent years to 70.7 percent in 2012-13, and completion of career technical education programs has increased slightly. Success rates for instruction in remedial math, English
and English as a Second Language have also shown modest gains.
As the overall completion metrics show, 71 percent of students who arrive pre-pared for college complete a certificate,
degree or are prepared for transfer. That rate drops to 41 percent for students in need of remediation. Unfortunately 77 percent of the incoming students fall into this category. These metrics are de-signed to assist colleges in developing
Seventy-one percent of students who arrive at community college prepared for collegiate level work complete a certificate, degree or transfer to a four-year institution.
STUDENT SUCCESS SCORECARD 2013 STATE OF THE SYSTEM REPORT 5
Participation Rate by Race/Ethnicity per 1,000 Population*
Afric
an A
mer
ican
126.
7
Amer
ican
Indi
anAs
ian
His
pani
c
Mul
ti-R
ace
Paci
fic Is
land
er
Whi
te
2008-09
185.
1
108.
693
.2
2.0
226.
277
.1
Syst
em-W
ide
89.4
Afric
an A
mer
ican
Amer
ican
Indi
an
Asia
nH
ispa
nic
Mul
ti-R
ace
Paci
fic Is
land
er
Whi
te
2012-13
96.4
86.0
78.0 86
.612
0.9
106.
7
57.1
*California residents 18 years through 70 years of age.
Syst
em-W
ide
74.6
circ
le: s
an d
ieg
o m
iram
ar c
olle
ge
6 STUDENT SUCCESS SCORECARD 2013 STATE OF THE SYSTEM REPORT
...
strategies, along with the system of-fice under the direction of the Board of Governors, to improve success rates and close unacceptable performance gaps among some historically under- represented students.
This new accountability system is just one of 22 recommendations by the Board of Governors Student Success Task Force that is being implemented throughout the 112-college system. These changes, along with improve-ments pioneered at the local level, are transforming community colleges throughout the state and making the system one of the most transparent and accountable systems of public higher education in the nation.
A system-wide priority enrollment policy adopted by the Board of Gov-ernors will create incentives for stu-dents to complete assessment for placement purposes, participate in a college orientation and develop an education plan – all of which have been shown by research to increase the odds of students achieving their academic goals. The Board of Governors affirmed its commitment to improve student success and expand access by award-ing $31 million in funding for online tools that will streamline assessment for entering students, help them devel-op education plans and expand access to online courses offered by colleges.
Throughout its drive to expand access for students and improve time to completion, the Board of Governors has made transparency a top priority.
The online Student Success Score-card released in April 2013, enables users to easily track a college’s cer-tificate and degree attainment and transfer rates, persistence rates and
0
60K
70K
2008-09 2009-10 2010-11 2011-12 2012-13
50K
40K
30K
20K
10K
2007-08
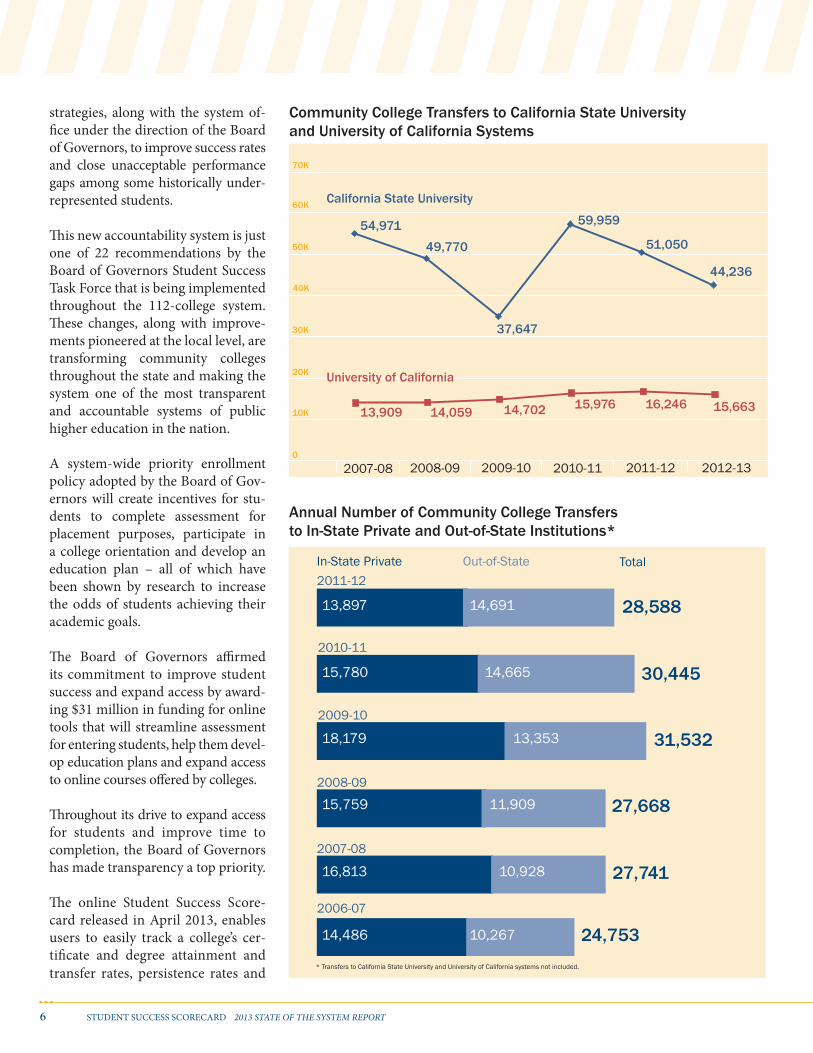
California State University
54,971
49,770
37,647
59,959
51,050
44,236
University of California
13,909 14,059 14,702 15,976 16,246 15,663
Community College Transfers to California State University and University of California Systems
Annual Number of Community College Transfers to In-State Private and Out-of-State Institutions*
* Transfers to California State University and University of California systems not included.
2006-07
In-State Private Out-of-State
2007-08
2008-09
2009-10
2010-11
2011-12
27,741
27,668
31,532
30,445
28,588
24,753
Total
13,897 14,691
15,780 14,665
18,179 13,353
15,759 11,909
16,813 10,928
10,26714,486
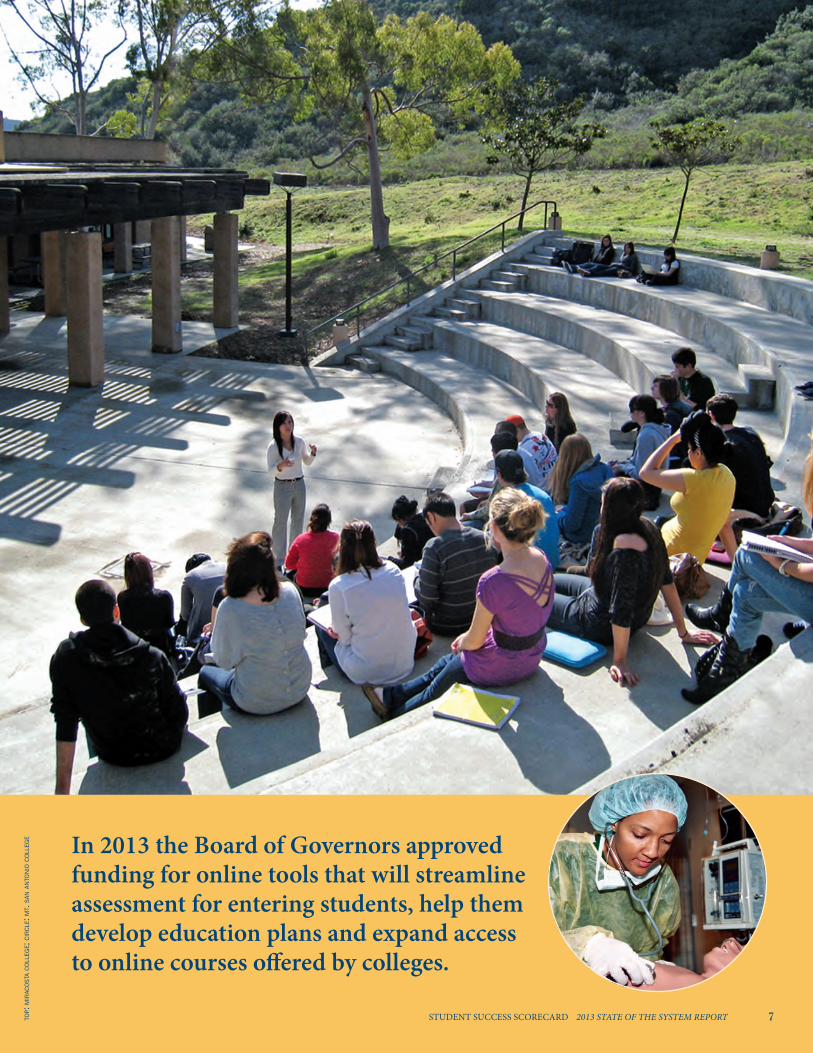
In 2013 the Board of Governors approved funding for online tools that will streamline assessment for entering students, help them develop education plans and expand access to online courses offered by colleges.
STUDENT SUCCESS SCORECARD 2013 STATE OF THE SYSTEM REPORT 7top:
mir
acos
ta c
olle
ge;
circ
le: m
t. sa
n an
ton
io c
olle
ge

8 STUDENT SUCCESS SCORECARD 2013 STATE OF THE SYSTEM REPORT
The California Community Colleges new Salary Surfer tool allows students to go online to see the actual earnings of those who complete a college program and enter the workforce.
top:
coll
ege o
f mar
in; c
ircl
e: co
lleg
e of t
he d
eser
t
Go to: salarysurfer.cccco.edu
Community colleges offer associate degrees and short-term job training certificates in more than 175 fields, and approximately 25,000 apprentices are educated each year to meet the demand for a skilled workforce.
STUDENT SUCCESS SCORECARD 2013 STATE OF THE SYSTEM REPORT 9
“momentum points,” such as the com-pletion of 30 units, which is typically considered to be the halfway mark to transferring to a four‐year institution completing an associate degree.
Another online tool called Salary Surfer released in 2013 allows students and the public to view aggregated median earnings of those who complete a certificate or degree in a specific community college discipline and then enter the workforce. Salary Surfer dis-plays median annual incomes for those who complete 179 of the most widely enrolled program areas and do not transfer to a four-year institution.
An analysis of the data contained on Sal-ary Surfer shows students who complete an associate degree more than double their annual pre-degree earnings after two years in the workforce and nearly triple their pre-degree earnings after five years in the workforce.
As the state’s largest provider of work-force training, the California Com-munity Colleges Chancellor’s Office in 2013 led a reorganization of career technical education resources that will improve the ability to supply in-de-mand skills for employers, create rel-evant career pathways and “stackable” credentials and get Californians into open jobs.
The initiative, called Doing What Matters for Jobs and the Economy, takes a regional approach in identifying
priority and emergent industries and leveraging job training funds to effec-tively meet employer needs.
circ
le: f
ooth
ill c
olle
ge
Go to: doingwhatmatters.cccco.edu
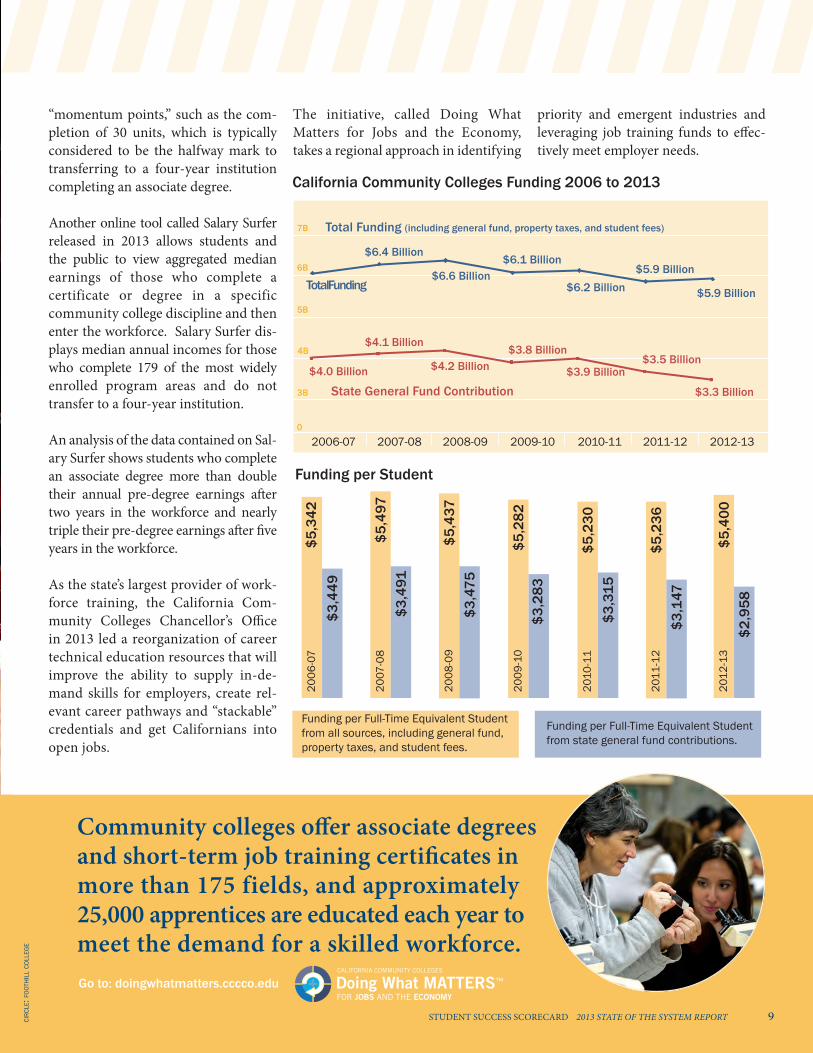
California Community Colleges Funding 2006 to 2013
Funding per Full-Time Equivalent Student from all sources, including general fund, property taxes, and student fees.
Funding per Full-Time Equivalent Student from state general fund contributions.
2006
-07
$5,3
42$3
,449
2007
-08
$3,4
91$5
,497
2008
-09
$3,4
75$5
,437
2009
-10
$3,2
83$5
,282
2010
-11
$3,3
15$5
,230
2011
-12
$3,1
47$5
,236
2012
-13
$2,9
58$5
,400
Funding per Student
6B
7B
2008-09 2009-10 2010-11 2011-12 2012-13
5B
4B
3B
2007-08
Total Funding (including general fund, property taxes, and student fees)
Total Funding
State General Fund Contribution
$6.4 Billion
$6.6 Billion$6.1 Billion
$6.2 Billion$5.9 Billion
$5.9 Billion
$4.0 Billion
$4.1 Billion
$4.2 Billion$3.8 Billion
$3.9 Billion$3.5 Billion
$3.3 Billion
2006-070
10 STUDENT SUCCESS SCORECARD 2013 STATE OF THE SYSTEM REPORT
...
The sections contained in this report focus on the system’s performance relative to access, progress and completion. The source for most of the information in this report is the Chancellor’s Office Man-agement Information System (COMIS). The system collects student and course information from the 112 colleges and 72 districts.
The system-level metrics for access and progress include:
System-wide Participation Rates – The participation rates provide an indica-tion of how many students are enrolled in the California Community Colleges system relative to California’s population. The rate is calculated by age groups, gender and race/ethnicity for the most recent five years using statewide pop-ulation data and community college system data.
Students and Sections – The community colleges serve a large number of students from diverse backgrounds with various interests. The volume of students, or the Annual Student Headcount, in the system is provided for the past eleven academic years.
Credit sections have increased slightly over the past decade, while noncredit section sizes have remained stable Data shows that in 2002-03 the medi-an size of credit sections was 25 and a decade later increased to 28. The low was 23 (2005-06, 2006-07) and the high, 29, came in 2010-11 and 2011-12. Non-credit section sizes averaged 30 students over the decade and never dipped to fewer than 29 students (2007-08) or rose to more than 31 students (2009-10, 2011-12).
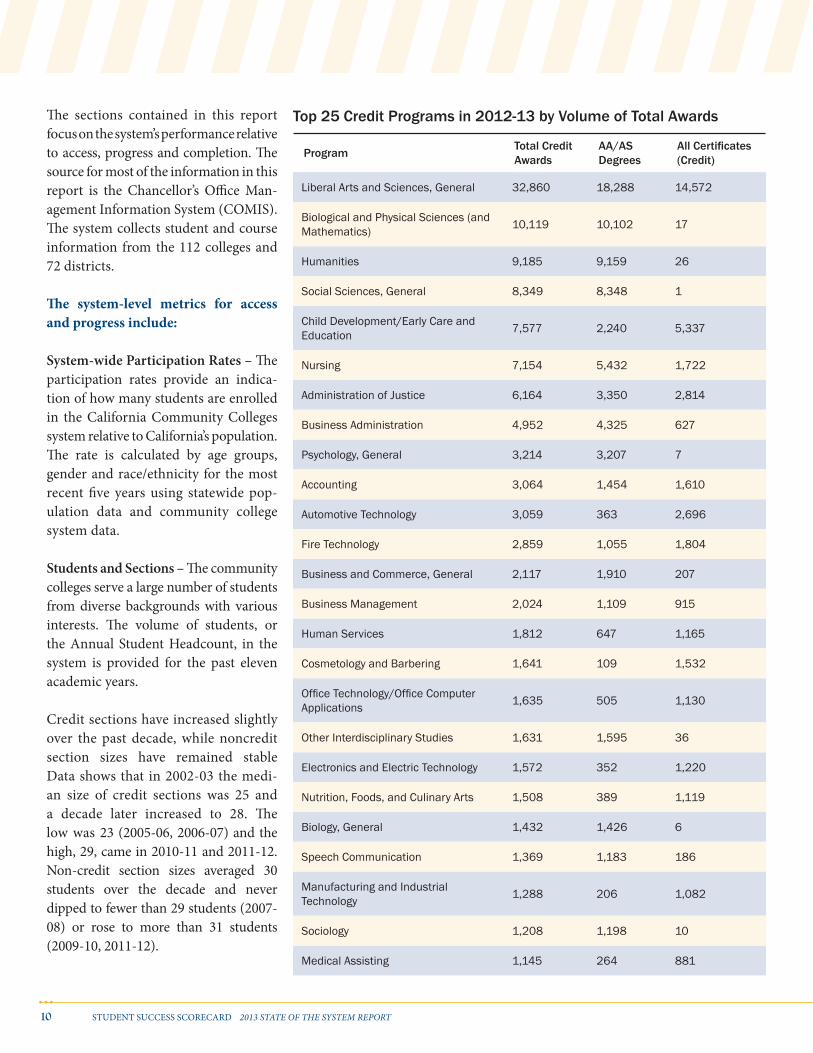
Program Total Credit Awards
AA/AS Degrees
All Certificates (Credit)
Liberal Arts and Sciences, General 32,860 18,288 14,572
Biological and Physical Sciences (and Mathematics) 10,119 10,102 17
Humanities 9,185 9,159 26
Social Sciences, General 8,349 8,348 1
Child Development/Early Care and Education 7,577 2,240 5,337
Nursing 7,154 5,432 1,722
Administration of Justice 6,164 3,350 2,814
Business Administration 4,952 4,325 627
Psychology, General 3,214 3,207 7
Accounting 3,064 1,454 1,610
Automotive Technology 3,059 363 2,696
Fire Technology 2,859 1,055 1,804
Business and Commerce, General 2,117 1,910 207
Business Management 2,024 1,109 915
Human Services 1,812 647 1,165
Cosmetology and Barbering 1,641 109 1,532
Office Technology/Office Computer Applications 1,635 505 1,130
Other Interdisciplinary Studies 1,631 1,595 36
Electronics and Electric Technology 1,572 352 1,220
Nutrition, Foods, and Culinary Arts 1,508 389 1,119
Biology, General 1,432 1,426 6
Speech Communication 1,369 1,183 186
Manufacturing and Industrial Technology 1,288 206 1,082
Sociology 1,208 1,198 10
Medical Assisting 1,145 264 881
Top 25 Credit Programs in 2012-13 by Volume of Total Awards
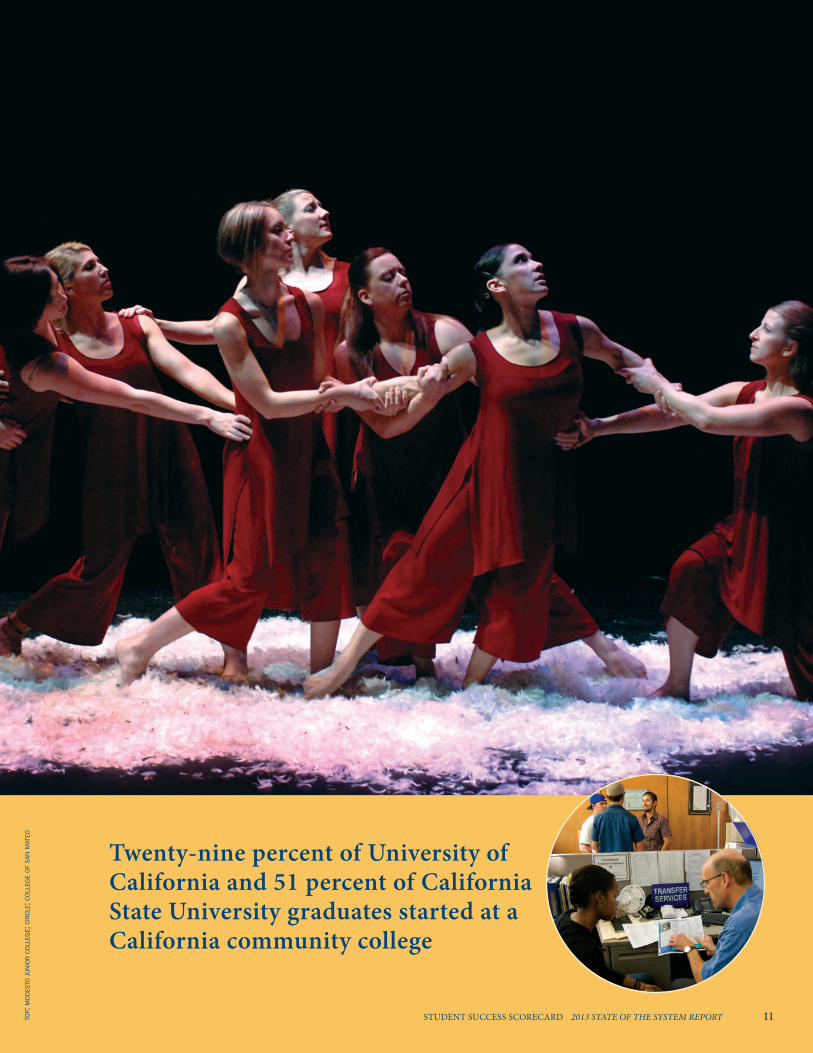
Twenty-nine percent of University of California and 51 percent of California State University graduates started at a California community college
STUDENT SUCCESS SCORECARD 2013 STATE OF THE SYSTEM REPORT 11top:
mod
esto
jun
ior
coll
ege;
circ
le: c
olle
ge o
f san
mat
eo
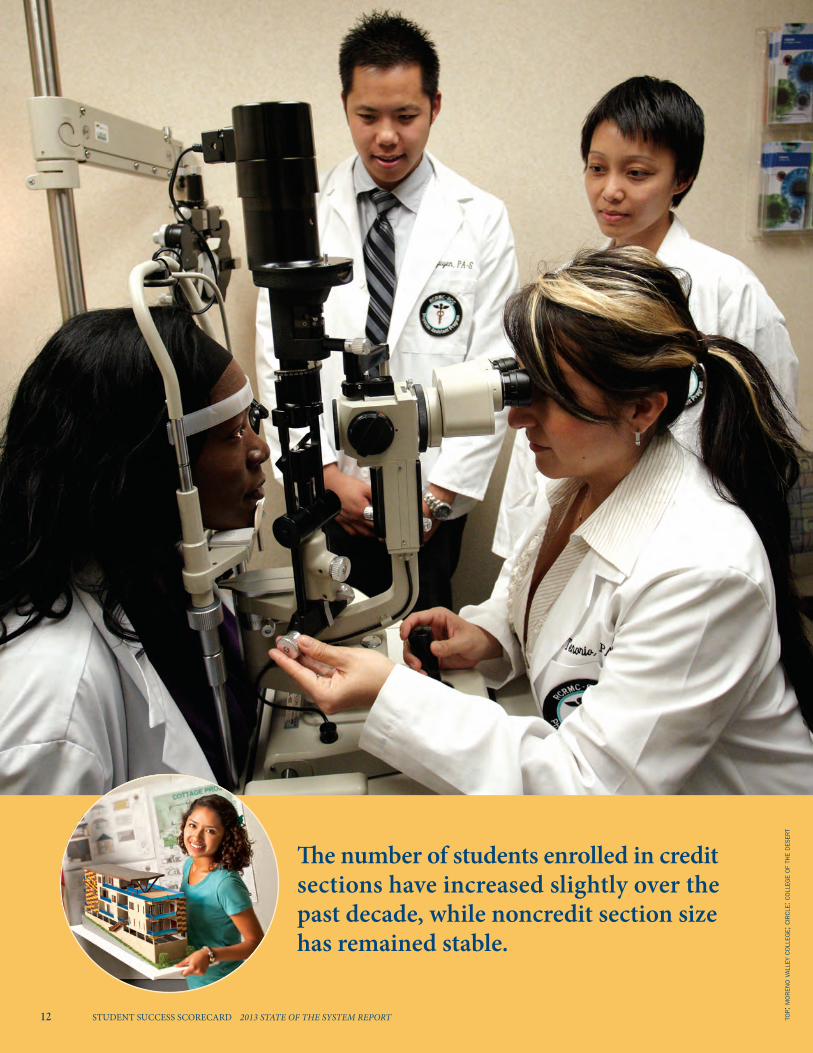
The number of students enrolled in credit sections have increased slightly over the past decade, while noncredit section size has remained stable.
12 STUDENT SUCCESS SCORECARD 2013 STATE OF THE SYSTEM REPORT top:
mor
eno
vall
ey c
olle
ge;
circ
le: c
olle
ge o
f the
des
ert
STUDENT SUCCESS SCORECARD 2013 STATE OF THE SYSTEM REPORT 13...
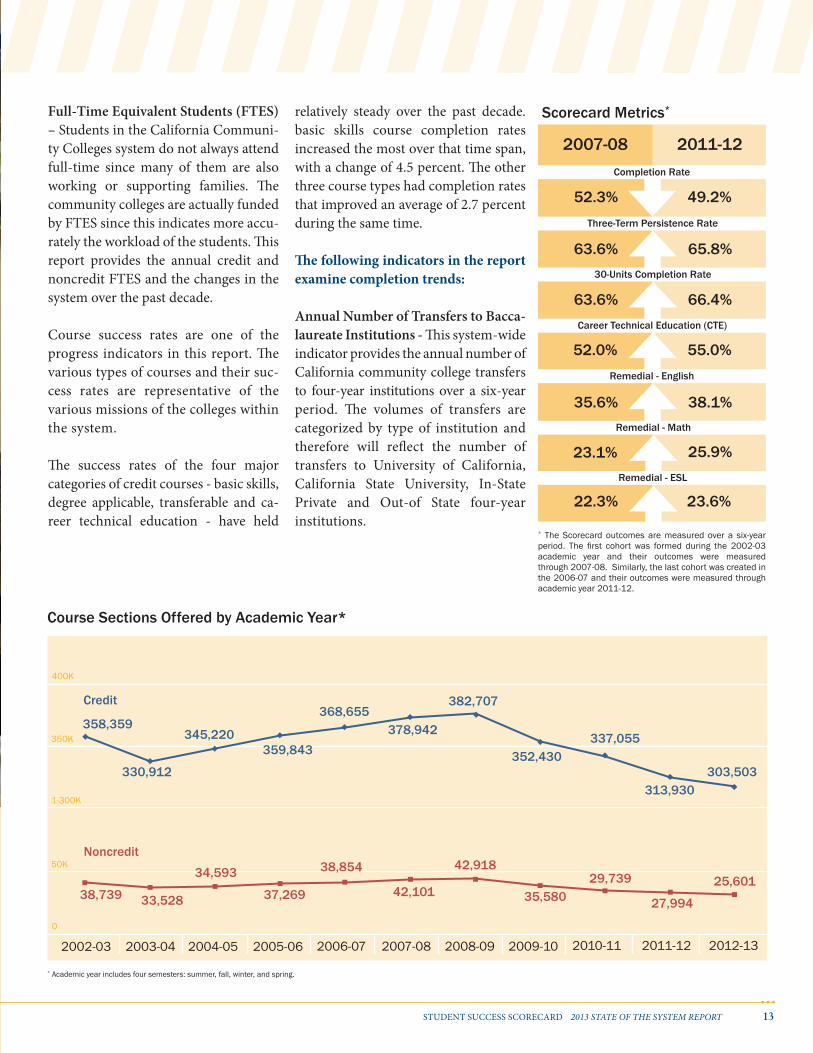
Full-Time Equivalent Students (FTES) – Students in the California Communi-ty Colleges system do not always attend full-time since many of them are also working or supporting families. The community colleges are actually funded by FTES since this indicates more accu-rately the workload of the students. This report provides the annual credit and noncredit FTES and the changes in the system over the past decade.
Course success rates are one of the progress indicators in this report. The various types of courses and their suc-cess rates are representative of the various missions of the colleges within the system.
The success rates of the four major categories of credit courses - basic skills, degree applicable, transferable and ca-reer technical education - have held
relatively steady over the past decade. basic skills course completion rates increased the most over that time span, with a change of 4.5 percent. The other three course types had completion rates that improved an average of 2.7 percent during the same time.
The following indicators in the report examine completion trends:
Annual Number of Transfers to Bacca-laureate Institutions - This system-wide indicator provides the annual number of California community college transfers to four-year institutions over a six-year period. The volumes of transfers are categorized by type of institution and therefore will reflect the number of transfers to University of California, California State University, In-State Private and Out-of State four-year institutions.
Course Sections Offered by Academic Year*
* Academic year includes four semesters: summer, fall, winter, and spring.
Scorecard Metrics*
* The Scorecard outcomes are measured over a six-year period. The first cohort was formed during the 2002-03 academic year and their outcomes were measured through 2007-08. Similarly, the last cohort was created in the 2006-07 and their outcomes were measured through academic year 2011-12.
1-300K
350K
50K
358,359
2008-09 2009-10 2010-11 2011-12 2012-132007-082006-072004-052003-042002-03 2005-06
330,912
345,220359,843
368,655378,942
382,707
352,430337,055
313,930303,503
Credit
38,739 33,528
34,593
37,269
38,854
42,101
42,918
35,58029,739
27,994
25,601
Noncredit
400K
0
2007-08 2011-12
52.3% 49.2%
63.6% 65.8%
63.6% 66.4%
52.0% 55.0%
35.6% 38.1%
23.1% 25.9%
22.3% 23.6%
Completion Rate
Three-Term Persistence Rate
30-Units Completion Rate
Career Technical Education (CTE)
Remedial - English
Remedial - Math
Remedial - ESL
The success rates of the four major categories of credit courses - basic skills, degree applicable, transferable and career technical education - have held relatively steady over the past decade.
top:
los
ang
eles
pier
ce c
olle
ge;
circ
le: f
ulle
rton
col
leg
e
14 STUDENT SUCCESS SCORECARD 2013 STATE OF THE SYSTEM REPORT
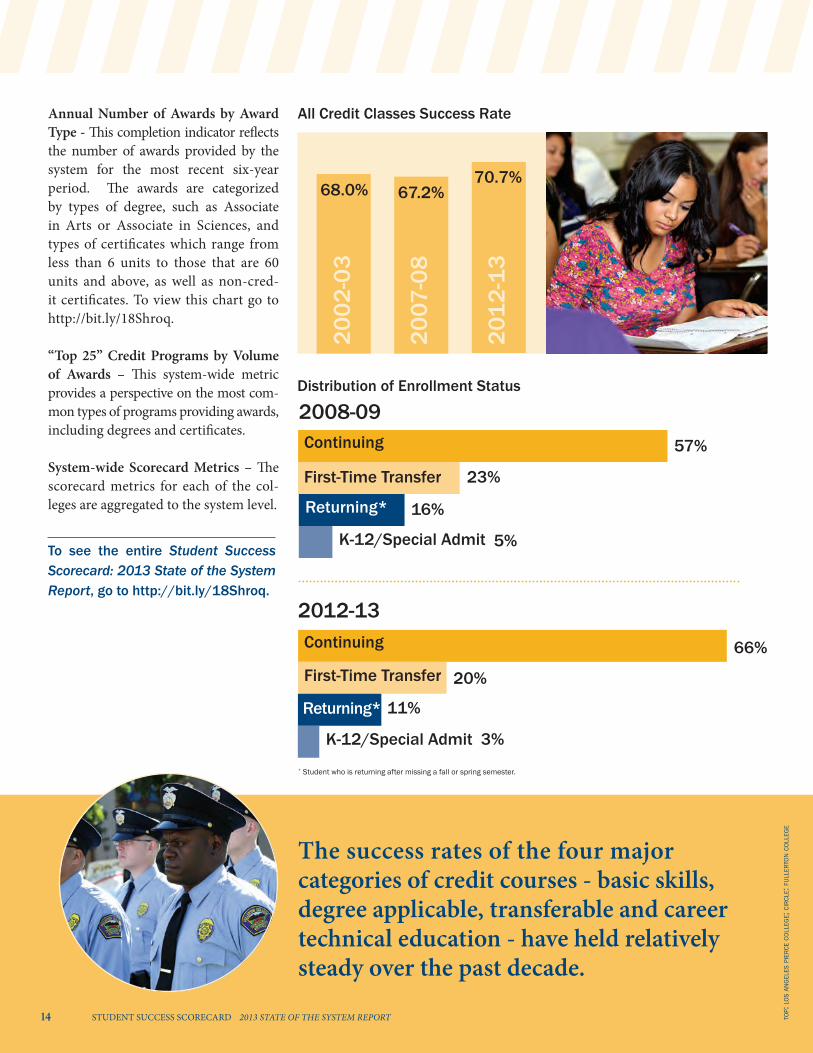
Annual Number of Awards by Award Type - This completion indicator reflects the number of awards provided by the system for the most recent six-year period. The awards are categorized by types of degree, such as Associate in Arts or Associate in Sciences, and types of certificates which range from less than 6 units to those that are 60 units and above, as well as non-cred-it certificates. To view this chart go to http://bit.ly/18Shroq.
“Top 25” Credit Programs by Volume of Awards – This system-wide metric provides a perspective on the most com-mon types of programs providing awards, including degrees and certificates.
System-wide Scorecard Metrics – The scorecard metrics for each of the col-leges are aggregated to the system level.
Distribution of Enrollment Status
2008-09Continuing 57%
First-Time Transfer
Returning*
K-12/Special Admit
23%
16%
5%
2012-13Continuing
First-Time Transfer
K-12/Special Admit
Returning*
66%
20%
11%
3%
All Credit Classes Success Rate
68.0%
2002
-03
2007
-08
67.2%
2012
-13
70.7%
To see the entire Student Success Scorecard: 2013 State of the System Report, go to http://bit.ly/18Shroq.
* Student who is returning after missing a fall or spring semester.
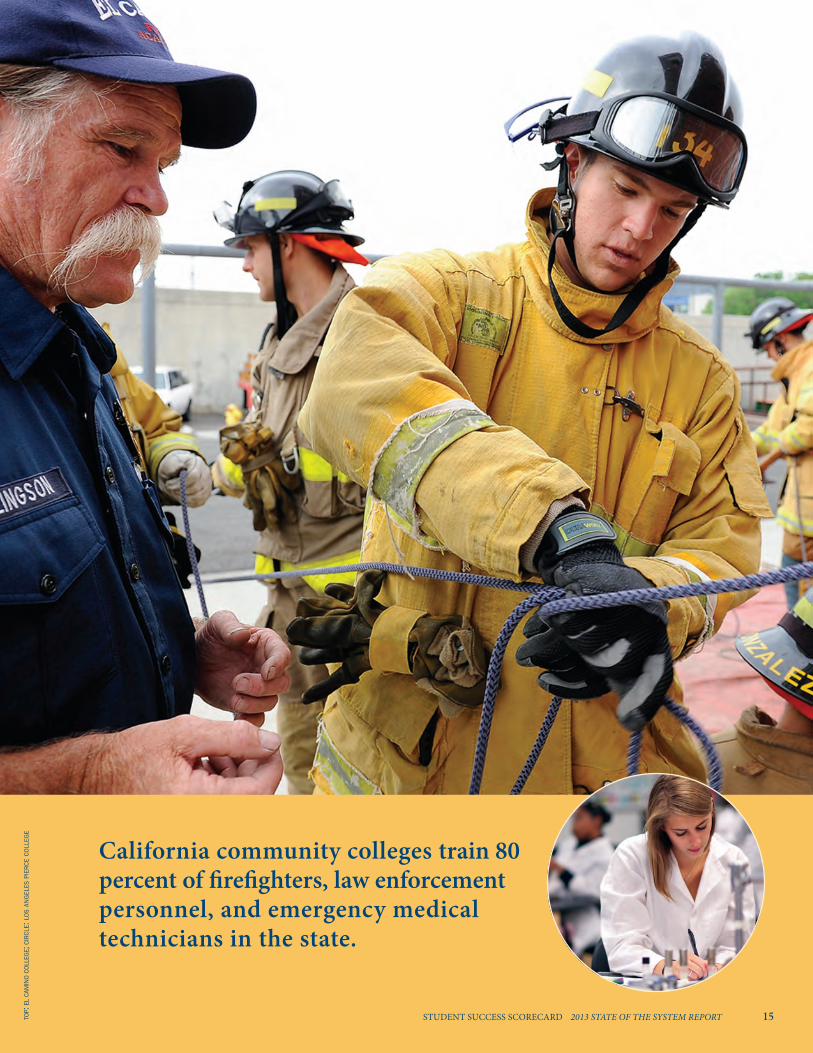
California community colleges train 80 percent of firefighters, law enforcement personnel, and emergency medical technicians in the state.
STUDENT SUCCESS SCORECARD 2013 STATE OF THE SYSTEM REPORT 15top:
el ca
min
o co
lleg
e; ci
rcle
: los
ang
eles
pier
ce c
olle
ge
16 STUDENT SUCCESS SCORECARD 2013 STATE OF THE SYSTEM REPORT
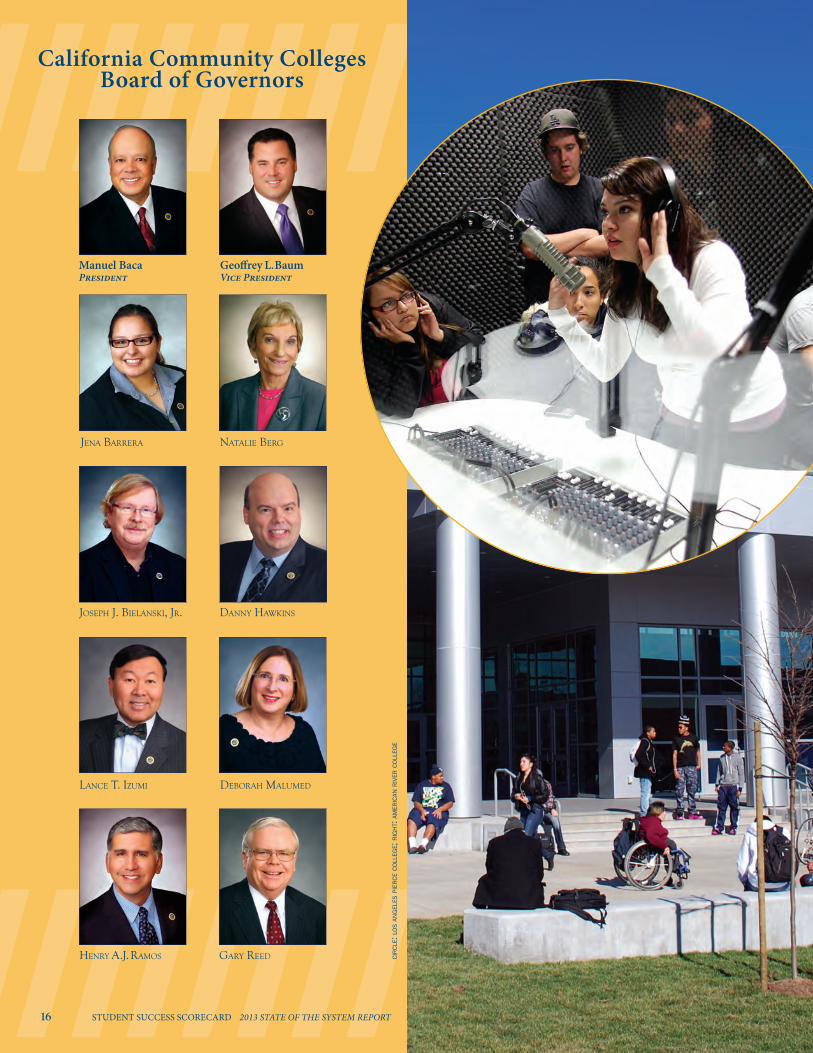
California Community Colleges Board of Governors
Jena Barrera natalie Berg
Joseph J. Bielanski, Jr. Danny hawkins
lance t. izumi DeBorah malumeD
henry a.J. ramos gary reeD
Manuel BacaPresident
Geoffrey L. BaumVice President
circ
le: l
os an
gel
es pi
erce
col
leg
e; ri
gh
t: am
eric
an r
iver
col
leg
e
http://twitter.com/CalCommCollegeshttp://twitter.com/DrBriceWHarrishttp://twitter.com/WorkforceVanhttp://twitter.com/ICANAFRDCOLLEGE
http://www.youtube.com/CACommunityColleges
http://www.facebook.com/CACommCollegeshttp://www.facebook.com/icanaffordcollege
CaliforniaCommunityColleges.cccco.edu
scorecard.cccco.edu
salarysurfer.cccco.edu
adegreewithaguarantee.com
doingwhatmatters.cccco.edu
icanaffordcollege.com

California Community Colleges Chancellor’s Office1102 Q Street, Suite 4554
Sacramento, CA 95811
californiacommunitycolleges.cccco.edu