STUDENT SERVICES AND STUDENT SUCCESS - University...
96
UNIVERSITY OF MANITOBA VICE-PROVOST (STUDENTS) & VICE-PROVOST (ACADEMIC AFFAIRS) WINNIPEG, MANITOBA FRIDAY, FEBRUARY 8, 2013 STUDENT SERVICES AND STUDENT SUCCESS: FINDINGS FROM RECENT RESEARCH AT ONTARIO COLLEGES & UNIVERSITIES Informing the Future of Higher Education Richard Dominic Wiggers Executive Director, Research and Programs
Transcript of STUDENT SERVICES AND STUDENT SUCCESS - University...

UNIVERSITY OF MANITOBA
VICE-PROVOST (STUDENTS) & VICE-PROVOST (ACADEMIC AFFAIRS)
WINNIPEG, MANITOBA
FRIDAY, FEBRUARY 8, 2013
STUDENT SERVICES AND STUDENT SUCCESS:
FINDINGS FROM RECENT RESEARCH AT ONTARIO COLLEGES & UNIVERSITIES
Informing the Future of Higher Education
Richard Dominic Wiggers Executive Director, Research and Programs

WHO OR WHAT IS HEQCO?

HEQCO is an independent agency that tries to influence policy with evidence
Research
Government
Develop more effective policies
Allocate funds more effectively
Enhance quality and global competitiveness
Informing the Future of Higher Education
3

HEQCO has three major research priorities
Accessibility & Participation (including retention, underrepresented groups, etc.)
Learning Quality (including student engagement, teaching and learning, etc.)
Accountability & System Design (including KPIs, multi-year agreements, system design, etc.)
4
Informing the Future of Higher Education

HEQCO has completed or launched nearly 200 research projects
5
Informing the Future of Higher Education
Published Completed Underway Total
Projects
Accessibility/Participation 30 9 14 53
Learning Quality 26 9 50 85
Accountability/System Design 13 2 1 16
Manuscripts/Edited Collections 2 1 0 3
Internal Research (various) 21 0 15 36
TOTAL 92 21 80 193

One of the first groups of research projects dealt with Student Services
First Year Transitions
Nipissing University Introductory University Course (UNIV1011) and Academic Retention & Success
Lakehead University First Year Experience Program for Under-Represented Students
Niagara College of Applied Arts Academic Advisement in the Partners' Program to Increase University Access
Targeted Populations
Ryerson University Access, Engagement, Retention and Success of Under-Represented Populations
Cambrian College Impact of Mental Health Problems within Community College Student Population
Brock University Statistical Variances in Student Financial Aid: Is Less More?
Ontario College of Art & Design Impact of 'Sheltered' English as a Second Language (ESL) Support Programming
Durham College & UOIT Student Support Associated with College-University Collaborative Outcomes
York University Student Services and Academic Engagement of Recent Adult Immigrant Students
Skills Enhancement Initiatives
Huron University College Writing Proficiency Assessment
Brock University An Evaluation of the Impact of Learning Skills Services on Student Academic Success
Georgian College of Applied Arts Information Literacy Competency Standards for Students
Course-Based Initiatives Carleton University Effectiveness of the Peer-Assisted Study Sessions (PASS) on Student Success
Queen's University Supported Learning Groups (SLG) in Residence
Brock University An Evaluation of the Online Writing Skills Workshop at Brock University
University of Guelph Skills Objectives of Peer Helper Program: Longitudinal Analysis
6
Informing the Future of Higher Education
Source: Richard Wiggers and Christine Arnold, Defining, Measuring and Achieving “Student
Success” in Ontario Colleges and Universities (HEQCO: 2011).

Another group of in-class interventions used NSSE as an assessment tool
7
Course Based
Queen's University 1st Year: Increasing Student/Faculty Interaction in Large Classes
University of Waterloo 1st & 4th Years: Redesign of Selected Courses to Enhance Engagement
University of Western Ontario 1st Year: Redesign of Selected Courses to Increase Science Literacy
Discipline/Faculty Based
University of Ottawa 1st Year: Course-Based Learning Community for Social Science
University of Windsor 1st Year: Intrusive Advising Intervention for 1st Year Business Students
Queen's University 4th Year: Enhanced Academic/Tutorial Support System for Electrical Engineering
General Support
Carleton University 1st Year: Teaching Assistant (TA) Mentorship Model
University of Guelph 1st Year: Supported Learning Groups for "high-risk" courses
Ryerson University 1st Year: Improvement of Writing Skills Competencies
Wilfrid Laurier University 1st Year: Peer Learning Program to Improve Information Literacy, Research & Writing
Source: C. Conway, Implementing Engagement Improvements through Targeted Interventions,
Final Report: Intervention Processes, Impacts and Implications (HEQCO: 2010).
Informing the Future of Higher Education

HEQCO has tried to provide an overview of the findings
• Richard Dominic Wiggers and Christine Arnold, @Issue Paper No. 10, Defining, Measuring and Achieving “Student Success” in Ontario Colleges and Universities (HEQCO: 2011).
• C. Conway, Implementing Engagement Improvements through Targeted Interventions, Final Report: Intervention Processes, Impacts and Implications (HEQCO: 2010).
• Tricia Seifert, Christine Arnold, Jeff Burrow and Angel Brown, Supporting Student Success: The Role of Student Services within Ontario’s Postsecondary Institutions (HEQCO: 2011).
8
Informing the Future of Higher Education

More recently HEQCO developed and released a national “how to” Guide
Informing the Future of Higher Education
9
• Based on a similar document developed by McMaster University
• Endorsed by the Society for Teaching and Learning in Higher Education (STLHE) and the Canadian Association of College and University Student Services (CACUSS)
• September 18, 2012 release
Researching Teaching and Student Outcomes in
Postsecondary Education:
A Guide
Susan Elgie
With:
Ruth Childs
Nancy E. Fenton
Betty Ann Levy
Valerie Lopes
Karen Szala-Meneok
Richard Dominic Wiggers

ACCESS

Ensuring broad access to PSE has been one of the longest standing goals
Informing the Future of Higher Education
ACCESS
Barriers
First Generation
Under-Represented
11 Source: Richard Dominic Wiggers and Christine Arnold, @Issue Paper No. 10, Defining,
Measuring and Achieving “Student Success” in Ontario Colleges and Universities
(HEQCO: 2011).

University and non-university attainment for main OECD countries, percentage of population aged 25-64, 2006
23 24
0
5
10
15
20
25
30
35
Tertiary-type B education (Non-university) Tertiary-type A education (University)
Canada already leads the OECD in PSE attainment
Informing the Future of Higher Education
12

Ontario has a broad and accessible PSE system
20 Universities (360,000 undergraduate
and 47,000 graduate)
24 Colleges (220,000 students)
447 Licensed Private Career
Colleges (27,000 students)
Apprenticeships (120,000 students)
1000+ Unlicensed
Private Career Colleges
Informing the Future of Higher Education
13
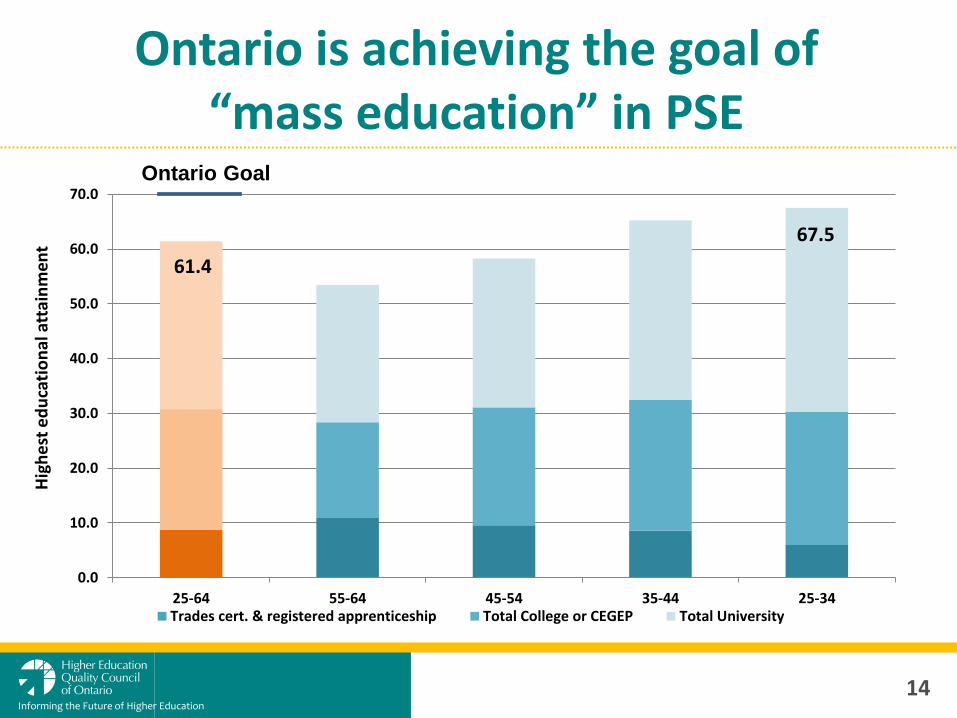
Ontario is achieving the goal of “mass education” in PSE
0.0
10.0
20.0
30.0
40.0
50.0
60.0
70.0
25-64 55-64 45-54 35-44 25-34
Hig
he
st e
du
cati
on
al a
ttai
nm
ent
Trades cert. & registered apprenticeship Total College or CEGEP Total University
67.5
61.4
Ontario Goal
Informing the Future of Higher Education
14

Source: K. Norrie and M.C. Lennon, Tuition Fee Policy Options for Ontario (February
2011). 15
Informing the Future of Higher Education
0.0%
5.0%
10.0%
15.0%
20.0%
25.0%
30.0%
$-
$1,000
$2,000
$3,000
$4,000
$5,000
$6,000
$7,000
$8,000
$9,000
$10,000
Par
tici
pat
ion
rat
e
Tuit
ion
University Participation (18-24) and Average Undergraduate University Tuition, Ontario
Average University Tuition in Ontario University participation rate, 18-24
Participation rates continue to increase despite rising tuition costs

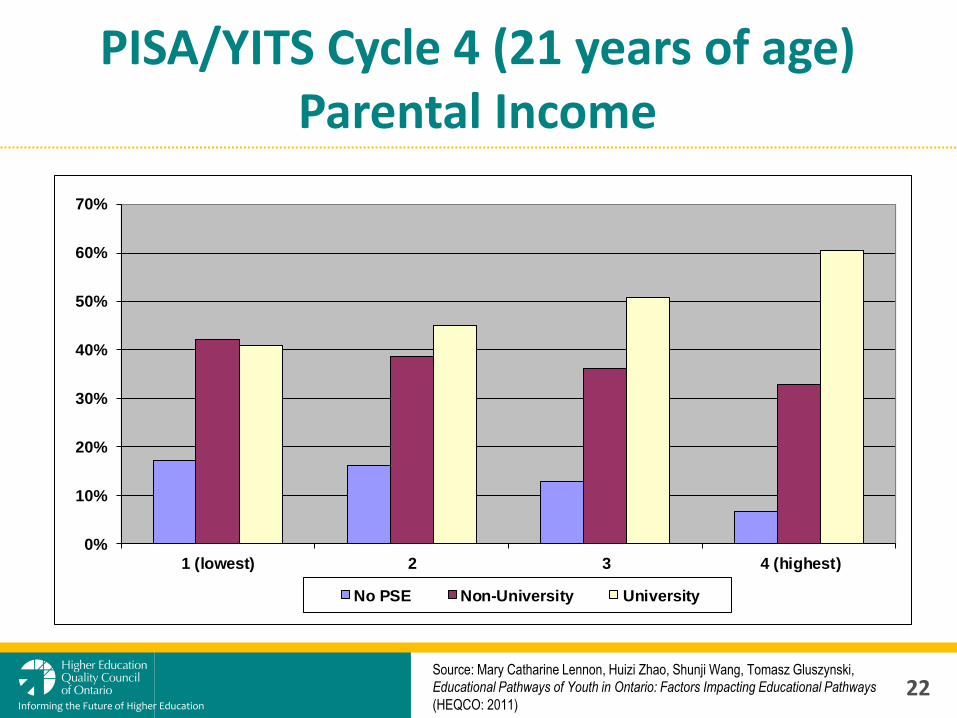
Family income does impact the choice of PSE pathways
0.0
10.0
20.0
30.0
40.0
50.0
60.0
70.0
10 9 8 7 6 5 4 3 2 1
Pe
rce
nta
ge
of S
tud
en
ts
Income Decile (10 is highest income and 1 is lowest income)
Confirmed University
Confirmed College
16
Informing the Future of Higher Education

Our financial assistance program isn’t necessarily working as intended
Source: J. Berger, A Motte and A. Parkin, The Price of Knowledge: Access and Student
Finance in Canada (Fourth Edition, 2009). 17
Informing the Future of Higher Education
Low Income (Less than $50,000 Family)
High Need (High Cost or Long Duration Program, Older Independent Students, Out-of-
Province Study, etc.)
Student Financial
Assistance

University participation rates vary by geographic region
Informing the Future of Higher Education
18
0%
2%
4%
6%
8%
10%
12%
14%
16%
18%
20%
Regional Entrance Rates: First-year, FT Students Aged 18 to 20 from Ontario
GTA excl. Toronto
Toronto
East
Central
Southwest
North
Note: includes First-time (at institution), Full-time Ontario university students only. Sources: MTCU (students); Ministry of Finance (population). CUPA (CESPA) 2009-05-31
Source: I. Calvert and D. Smith, University Entrance Rates of Ontario Residents:
Regional and Gender Analysis (Presentation for CUPA 2009).
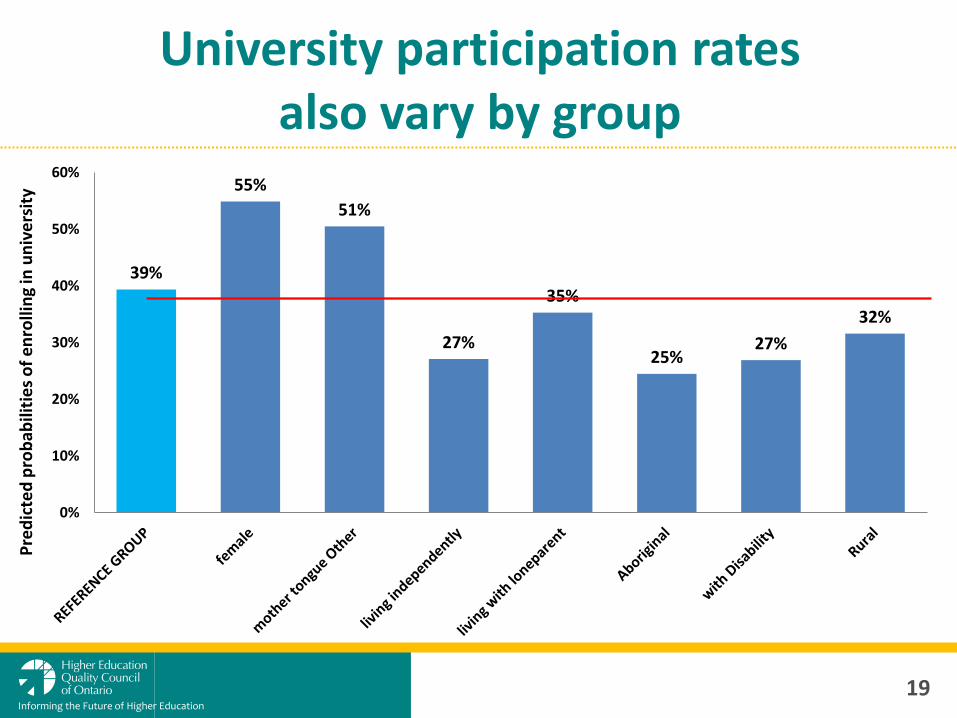
University participation rates also vary by group
39%
55%
51%
27%
35%
25% 27%
32%
0%
10%
20%
30%
40%
50%
60%
Pre
dic
ted
pro
bab
iliti
es
of
en
rolli
ng
in u
niv
ers
ity
Informing the Future of Higher Education
19

Two cohorts of Ontario students were tracked from 15 years of age
Age 2000 2001 2002 2003 2004 2005 2006 2007 2008 2009 2010
14 PISA OSSLT
15 5,557 16,935
16 YITS
17 4,290
18 YITS
19 3,859 15,560
20 YITS
21 3,253
22 YITS
23 2,697 Literacy
24 400 YITS
25 2,049
Informing the Future of Higher Education
20

PISA/YITS Cycle 4 (21 years of age) Gender
Source: Mary Catharine Lennon, Huizi Zhao, Shunji Wang, Tomasz Gluszynski,
Educational Pathways of Youth in Ontario: Factors Impacting Educational Pathways
(HEQCO: 2011)
0%
10%
20%
30%
40%
50%
60%
70%
Male Female
No PSE Non-University University
Informing the Future of Higher Education
21
Source: Mary Catharine Lennon, Huizi Zhao, Shunji Wang, Tomasz Gluszynski,
Educational Pathways of Youth in Ontario: Factors Impacting Educational Pathways
(HEQCO: 2011)
0%
10%
20%
30%
40%
50%
60%
70%
1 (lowest) 2 3 4 (highest)
No PSE Non-University University
PISA/YITS Cycle 4 (21 years of age) Parental Income
Informing the Future of Higher Education
22

Source: Mary Catharine Lennon, Huizi Zhao, Shunji Wang, Tomasz Gluszynski,
Educational Pathways of Youth in Ontario: Factors Impacting Educational Pathways
(HEQCO: 2011)
0%
10%
20%
30%
40%
50%
60%
70%
80%
90%
High school or less Non-university PSE Bachelors Post-Bachelors
No PSE Non-University University
PISA/YITS Cycle 4 (21 years of age) Parental Education
Informing the Future of Higher Education
23

24 Source: Mary Catharine Lennon, Huizi Zhao, Shunji Wang, Tomasz Gluszynski,
Educational Pathways of Youth in Ontario: Factors Impacting Educational Pathways
(HEQCO: 2011)
Informing the Future of Higher Education
PISA/YITS Cycle 4 (21 years of age) High School Grades

25 Source: Mary Catharine Lennon, Huizi Zhao, Shunji Wang, Tomasz Gluszynski,
Educational Pathways of Youth in Ontario: Factors Impacting Educational Pathways
(HEQCO: 2011)
Informing the Future of Higher Education
PISA/YITS Cycle 4 (21 years of age) PISA reading scores

Source: Mary Catharine Lennon, Huizi Zhao, Shunji Wang, Tomasz Gluszynski,
Educational Pathways of Youth in Ontario: Factors Impacting Educational Pathways
(HEQCO: 2011)
0%
10%
20%
30%
40%
50%
60%
70%
Both Canadian 1 Foreign 2 Foreign
No PSE Non-University University
PISA/YITS Cycle 4 (21 years of age) Immigrant Parents
Informing the Future of Higher Education
26

0.0
30.0
60.0
90.0
RecentArrivals(2002 to
2006)
ArrivalsBefore2002
Born inCanada
RecentArrivals(2002 to
2006)
ArrivalsBefore2002
Born inCanada
RecentArrivals(2002 to
2006)
ArrivalsBefore2002
Born inCanada
RecentArrivals(2002 to
2006)
ArrivalsBefore2002
Born inCanada
Confirmed University Confirmed College Applied/Did Not Confirm Did Not Apply
Successful Not Successful Absent/Deferred/Exempt
Year of Arrival: Recent Arrivals (less than 5 years in Canada) N= 2104 Arrivals before 2002 (longer than 5 years in Canada) N=3214, Born in Canada N=10242
TDSB Cohort (18-19 years of age) Immigrant Parents
Informing the Future of Higher Education
27

0.0
10.0
20.0
30.040.0
50.0
60.0
70.0
80.0
Perc
en
tag
e o
f S
tud
en
ts
Confirmed University Confirmed College Applied/Did Not Confirm Did Not Apply to PSE
Confirmed University 74.1 60.9 48.6 48.0 47.3 39.8 26.5 23.3
Confirmed College 8.5 16.0 18.3 16.1 14.2 14.5 21.9 21.7
Applied/Did Not Confirm 7.6 8.0 9.1 10.2 12.7 10.9 11.8 9.1
Did Not Apply to PSE 9.8 15.2 24.0 25.7 25.8 34.8 39.8 45.8
East Asian (2483)
South Asian (2520)
South East Asian (492)
Middle East (548)
White (4645)
Mixed (716)
Black (1457)
Latin (253)
TDSB Cohort (18-19 years of age) Immigrant Parents
Informing the Future of Higher Education
28

RETENTION

Some began to question what access was worth without retention
Informing the Future of Higher Education
ACCESS
Barriers
First Generation
Under-Represented
RETENTION
Persistence
Engagement
Credit Transfer
30 Source: Richard Dominic Wiggers and Christine Arnold, @Issue Paper No. 10, Defining,
Measuring and Achieving “Student Success” in Ontario Colleges and Universities
(HEQCO: 2011).

The terminology continues to evolve
• Institution/Program Centric
• Assumes Institutional Problem/Fix
“Retention”
“Attrition”
• Student Centric
• Assumes Individual Responsibility
“Persistence”
“Drop Out”
• No assumed responsibility
• Focus on what is best for student
“Student Success”
“Student Outcome”
Informing the Future of Higher Education
31 Source: Richard Dominic Wiggers and Christine Arnold, @Issue Paper No. 10, Defining,
Measuring and Achieving “Student Success” in Ontario Colleges and Universities
(HEQCO: 2011).

My own postsecondary journey is best described as a “zig zag”
Informing the Future of Higher Education
32
B.A.
Bachelor in Journalism (2 Years)
Europe (1 Year finding self)
Bachelor of Arts – History (2 years)
M.A.
Masters of International Relations (1 Year)
Work (3 Years becoming an adult)
Master of Arts – History (2 years)
PhD
Admission
Course Work (1 Year)
Course Work (2 Years)
Exams/Dissertation

When should we begin to track PSE students?
Informing the Future of Higher Education
33
Application (Nov-Mar)
Acceptance (Feb-Apr)
Registration (Jun-Sep)
Fall Enrolment (Oct-Nov)

And how long do we track them for?
BASELINE: Fall Enrolment
Completion of First Semester/Year
Registration into Second Year (Y1-Y2)
Registration into Third Year (Y2-Y3)
Graduation (3 Year/5 Year/7 Year)
34
Informing the Future of Higher Education

There can be huge variance in graduation rates among institutions
Source: May 2008 CSRDE Peer Institutional Reports
Informing the Future of Higher Education
35
G13 UNIVERSITIES: UNDERGRADUATE STUDENT GRADUATION RATES, 2001-02 ENTERING COHORT, SIX YEARS AFTER ENTRY
60.4
%
61.9
% 72.1
%
76.7
%
77.8
%
78.9
%
84.8
%
88.3
%
77.1
%
77.0
%
73.3
%
68.1
%
0%
20%
40%
60%
80%
100%
Dalhousie Calgary Alberta Ottawa Toronto Waterloo UBC Western Montreal McMaster McGill Queen's
G13 Avg = 74.9%
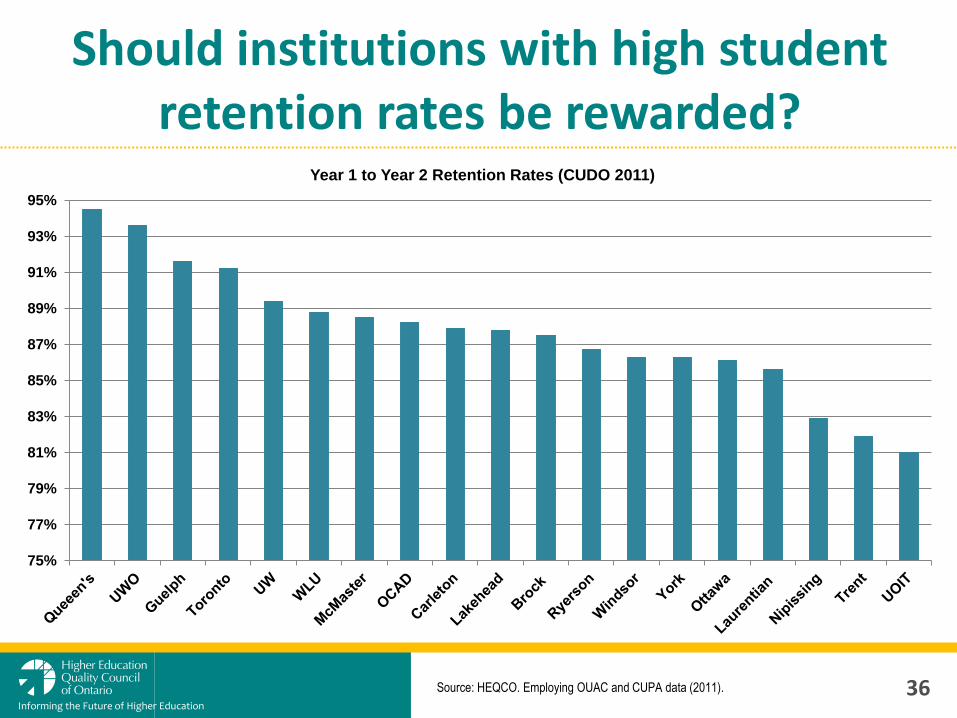
Should institutions with high student retention rates be rewarded?
Informing the Future of Higher Education
36 Source: HEQCO. Employing OUAC and CUPA data (2011).
75%
77%
79%
81%
83%
85%
87%
89%
91%
93%
95%
Year 1 to Year 2 Retention Rates (CUDO 2011)

It depends on the priority:
Informing the Future of Higher Education
Source: HEQCO. Employing OUAC and CUPA data (2011). 37
access or retention?
Brock Carleton
Guelph
Lakehead
Laurentian
McMaster
Nipissing
OCAD
UOIT
Ottawa
Queen's
Ryerson
Toronto
Trent
UW
UWO
WLU
Windsor York
80%
82%
84%
86%
88%
90%
92%
94%
96%
76% 78% 80% 82% 84% 86% 88% 90%
Yea
r 1
to
Yea
r 2
Rete
nti
on
Rate
High School Average
High School Average by Year 1 to Year 2 Retention Rate, by University (CUDO 2011)

Source: York University, Retention Risk Prevention Pilot Project (Office of
Institutional Research and Analysis: October 2009 Presentation).
Informing the Future of Higher Education
At individual institutions as many as 1/3 don’t continue to graduation
38
Stopping-out:
– 34% of those entering as full-time students (≥80% full course load)
– 60% of those entering as part-time students

Continuers
Returners
Switchers
Pause/Switch
Actual Leavers
Source: Ross Finnie, Moving Through, Moving on, Statistics Canada (2009)
Informing the Future of Higher Education
We are beginning to better understand student pathways
39
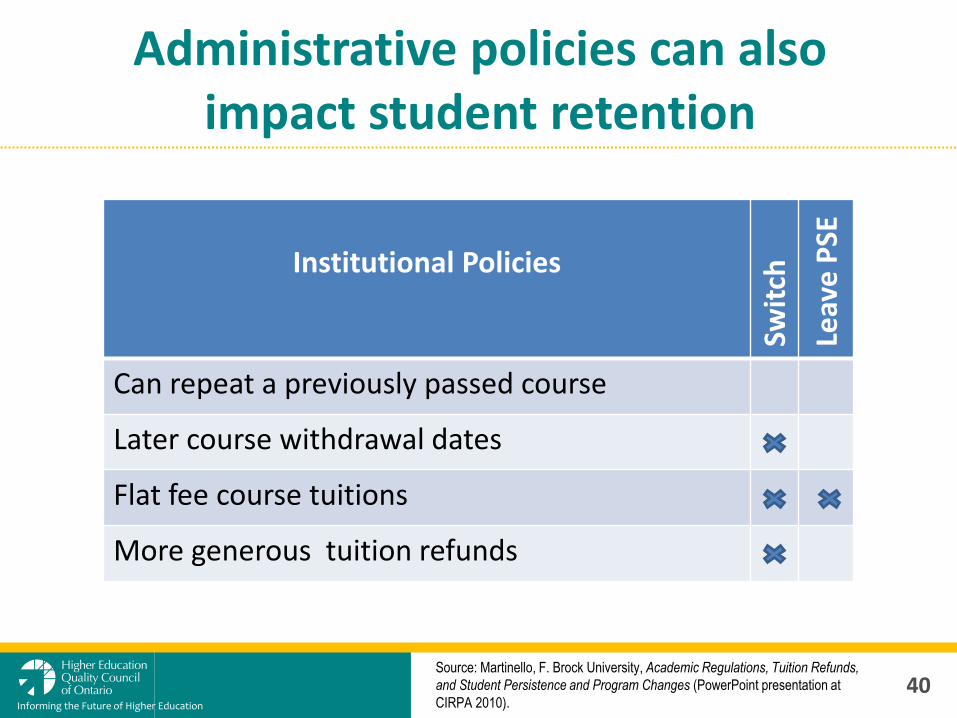
Administrative policies can also impact student retention
Institutional Policies
Sw
itch
Le
ave
PSE
Can repeat a previously passed course
Later course withdrawal dates
Flat fee course tuitions
More generous tuition refunds
Source: Martinello, F. Brock University, Academic Regulations, Tuition Refunds,
and Student Persistence and Program Changes (PowerPoint presentation at
CIRPA 2010).
Informing the Future of Higher Education
40

The double cohort also seemed to create a positive impact on retention
Informing the Future of Higher Education
41
82.2%
83.3%
84.4%
86.0%
83.3%
81.2% 81.1%
75%
76%
77%
78%
79%
80%
81%
82%
83%
84%
85%
86%
87%
2000 2001 2002 2003 2004 2005 2006
Cohort Entering in Year ...
Retention after Two Years
at Ontario Universities
Source : Consortium on Student Retention Data Exchange (CSRDE). Cohort includes full -time first-year entrantswithout previous postsec. experience. COU CESPA 2009-08-17

The labour market also impacts on postsecondary retention
Informing the Future of Higher Education
42
4
6
8
10
12
14
16
18
20
19
76
19
77
19
78
19
79
19
80
19
81
19
82
19
83
19
84
19
85
19
86
19
87
19
88
19
89
19
90
19
91
19
92
19
93
19
94
19
95
19
96
19
97
19
98
50%
55%
60%
65%
70%
75%
80%
Un
em
plo
yme
nt
Rat
e
1st
to
2n
d Y
ear
Ret
en
tio
n R
ate
Ontario - Retention 1st to 2ndOntario - Youth UnemplOntario - Unempl in Professional, Scientific and Technical Services

“AT RISK” STUDENT POPULATIONS

Student leaver rates vary among different subgroups
0.0
2.0
4.0
6.0
8.0
10.0
12.0
14.0First Generation PSE
Non First Generation PSE
Non Aboriginal
Disabled
Non Disabled
Rural High School
Non-Rural High School
Low Income Family
Non Low Income Family
Single Parent Family
Two Parent Family
First Generation
Second Generation
Non Immigrant
French outside Quebec
English outside Quebec
Male
Female
Ontario University Year 4 Leavers Rate by Student Group
actual
average
Informing the Future of Higher Education
44
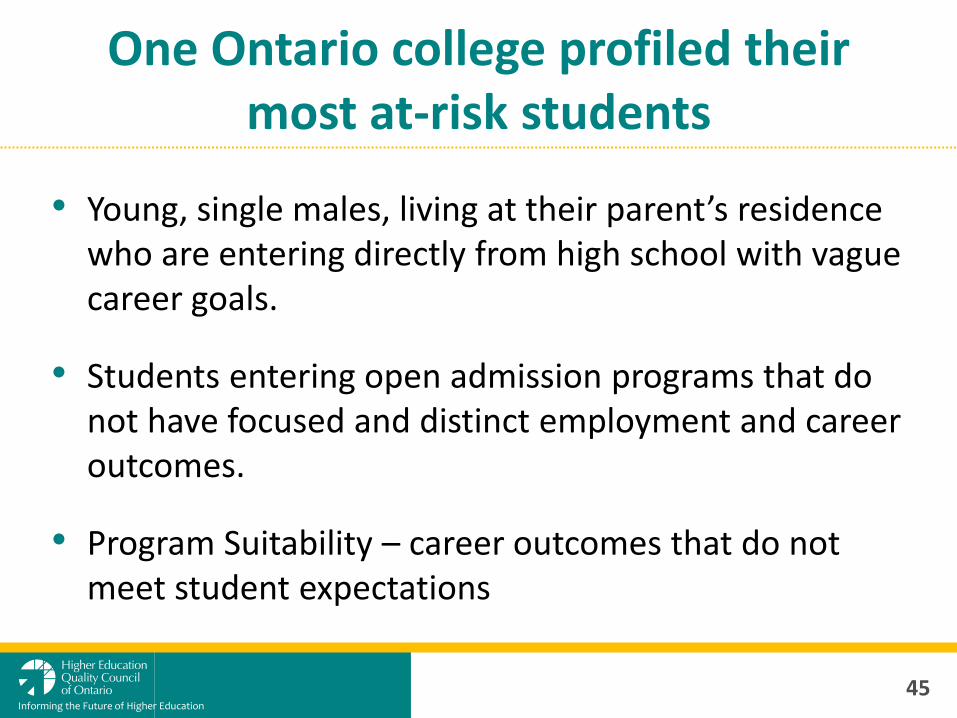
One Ontario college profiled their most at-risk students
• Young, single males, living at their parent’s residence who are entering directly from high school with vague career goals.
• Students entering open admission programs that do not have focused and distinct employment and career outcomes.
• Program Suitability – career outcomes that do not meet student expectations
45
Informing the Future of Higher Education

The disconnect between high school and college/university
Informing the Future of Higher Education
46
• “75% say that just about all kids can learn and succeed in school, given enough help and attention.”
• “Most people believe that success in higher education has more to do with the effort the student brings to the college experience and much less to do with the quality of the college.”
• “When we ask who is responsible for college dropouts, the public is prepared to blame almost anyone other than the colleges:” 47% blame the students
38% blame the high schools
10% blame the colleges
Source: John Immerwahr and Tony Foleno, Great Expectations: How the Public and Parents
– White, African American and Hispanic – View Higher Education (Public Agena: May 2000).
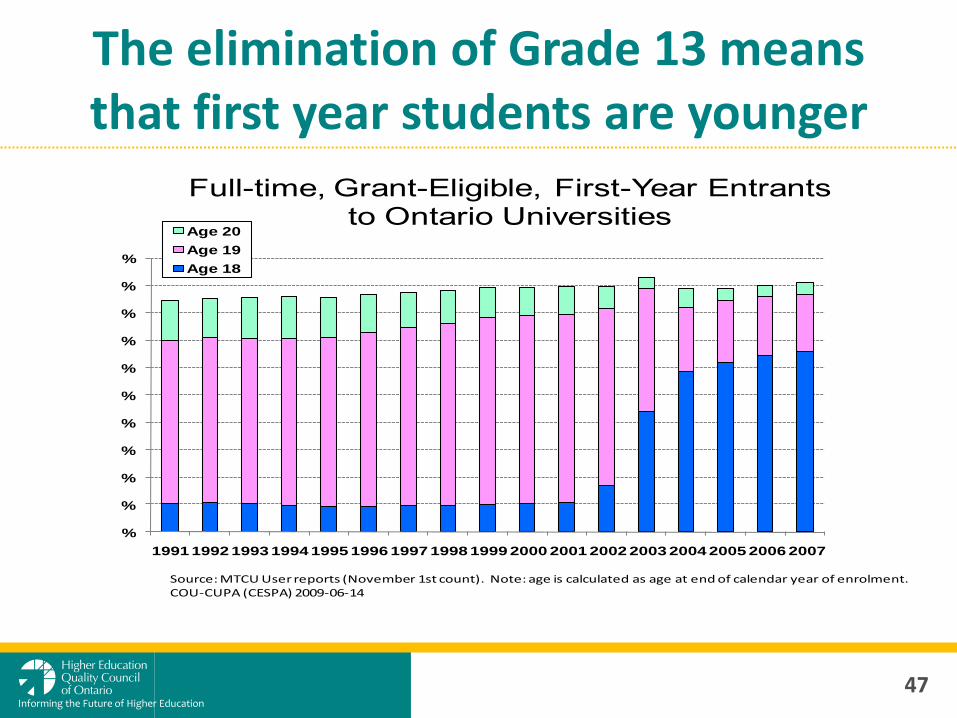
The elimination of Grade 13 means that first year students are younger
0%
10%
20%
30%
40%
50%
60%
70%
80%
90%
100%
1991 1992 1993 1994 1995 1996 1997 1998 1999 2000 2001 2002 2003 2004 2005 2006 2007
Full-time, Grant-Eligible, First-Year Entrantsto Ontario Universities
Age 20
Age 19
Age 18
Source: MTCU User reports (November 1st count). Note: age is calculated as age at end of calendar year of enrolment.COU-CUPA (CESPA) 2009-06-14
47
Informing the Future of Higher Education

48
Informing the Future of Higher Education
There are increasing numbers of “helicopter parents”

49
Informing the Future of Higher Education
In turn, they are raising more “bubble wrap kids”

This shift in parenting seems to be driven by many factors
50
Informing the Future of Higher Education
• Growing fears about lurking dangers
• Increased parental affluence combined with smaller families
• Social pressure and expectation on parents
• Technology (cell phones, Facebook, etc.)
• More parents with postsecondary credentials
• An amazing ability to forget the benefits of our own experiences and independence as young adults
Source: R. Finnie, S. Childs and T. Qiu, Patterns of Persistence in PSE (2011);
Academica, From Postsecondary Application to the Labour Market (2010);
Government of NB, High School Follow-Up Survey (2007). 51
Informing the Future of Higher Education
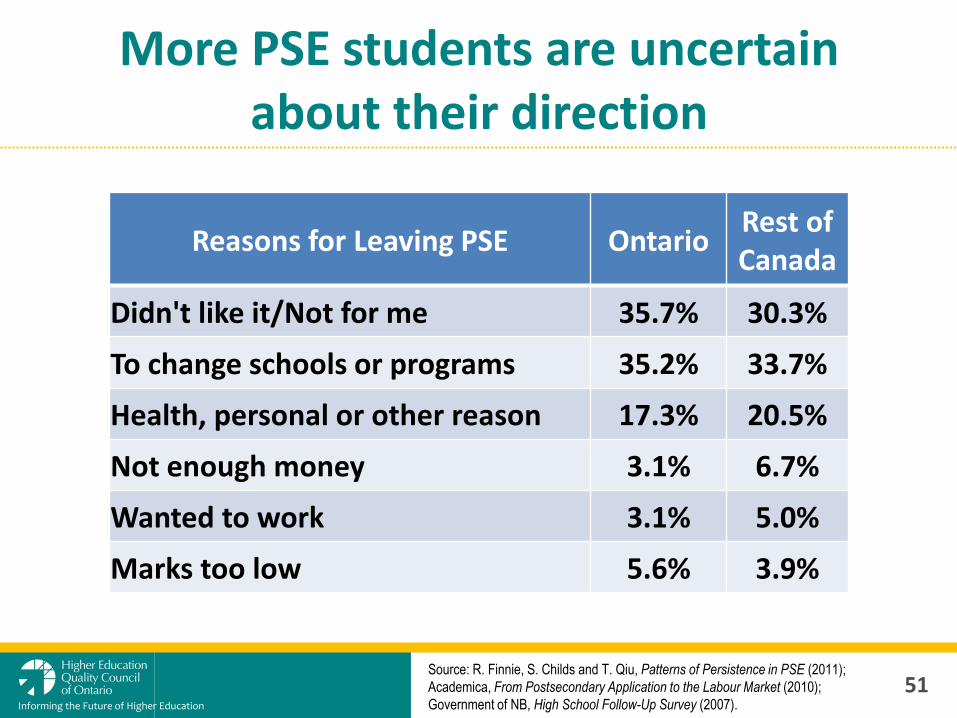
Reasons for Leaving PSE Ontario Rest of Canada
Didn't like it/Not for me 35.7% 30.3%
To change schools or programs 35.2% 33.7%
Health, personal or other reason 17.3% 20.5%
Not enough money 3.1% 6.7%
Wanted to work 3.1% 5.0%
Marks too low 5.6% 3.9%
More PSE students are uncertain about their direction
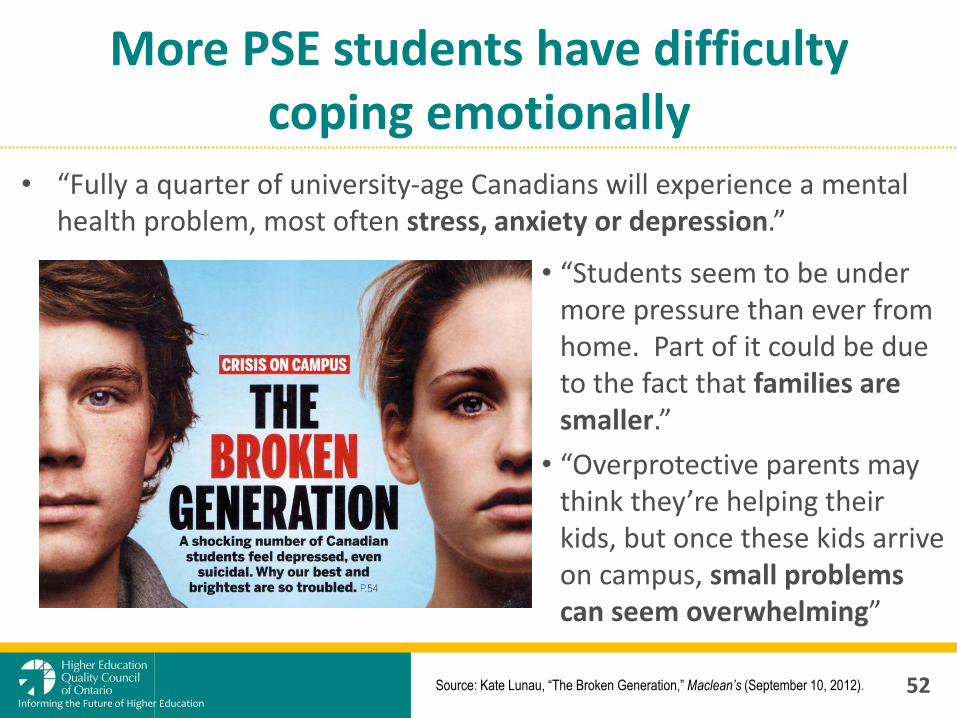
More PSE students have difficulty coping emotionally
Informing the Future of Higher Education
52 Source: Kate Lunau, “The Broken Generation,” Maclean’s (September 10, 2012).
• “Fully a quarter of university-age Canadians will experience a mental health problem, most often stress, anxiety or depression.”
• “Students seem to be under more pressure than ever from home. Part of it could be due to the fact that families are smaller.”
• “Overprotective parents may think they’re helping their kids, but once these kids arrive on campus, small problems can seem overwhelming”

PSE students need “grit”: passion and a determination to stick with it
Informing the Future of Higher Education
53
• “It’s not just smarts, it’s the ability to stick with a task that makes a difference.”
• “if you want to develop their character, you do almost the opposite: You let them fail and don’t hide their failures from them or from anybody else – not to make them feel lousy about themselves, but to give them the tools to succeed next time.”
• “IQ matters a lot in terms of what your freshman GPA is, but graduating from college has much more to do with character strengths like persistence, perseverance and grit.”
Source: Paul Tough, How Children Succeed: Grit, Curiosity and the Hidden Power of
Character (2012).

ENGAGEMENT/SATISFACTION

Students appear to be satisfied with their PSE experience
Informing the Future of Higher Education
55
Source: Arthur Levine, Diane R. Dean, Generation on a Tightrope: A Portrait of
Today’s College Student (2012).
1969 1976 1993 2009
I am satisfied overall 62 71 79 79
I would rather be going to university than anything else 69 69 75 83
I am satisfied with teaching at my institution 67 72 81 87

Satisfaction rates are high and don’t vary much over time
56
Informing the Future of Higher Education
70
75
80
85
90
95
2000-01 2001-02 2002-03 2003-04 2004-05 2005-06 2006-07 2007-08 2008-09
Student and Graduate Satisfaction Rates 2000-01 to 2008-09, percentage of very satisfied/satisfied
Graduate Satisfaction Student Satisfaction

NSSE has limitations as a means to measure student engagement
57
Informing the Future of Higher Education
• Too blunt for institutional comparisons, and too broad for course-based assessments
• It can be useful for program level and sub-group analyses.
• “most student subgroups are not universally engaged or disengaged, but rather show more or less engagement across items within and across benchmarks in a given program, and more or less engagement for particular items across programs”
Source: C. Conway, H. Zhao and S. Montgomery, The NSSE National Data Project
Report (HEQCO: 2011; C. Conway and H. Zhao, The NSSE National Data Project: Phase
Two Report (HEQCO: 2012).

The size of an institution or campus impacts on engagement
Source: McElroy. L. & Usher, A. HESA, Measuring Differences in Academic Challenges
and Grades at Canadian Universities (PowerPoint presentation for CIRPA 2010).
0% 20% 40% 60% 80% 100%
Independence
Neither
Supportive
Very Supportive
% of Universities
Large Medium Small Very Small
University Size
Informing the Future of Higher Education
58
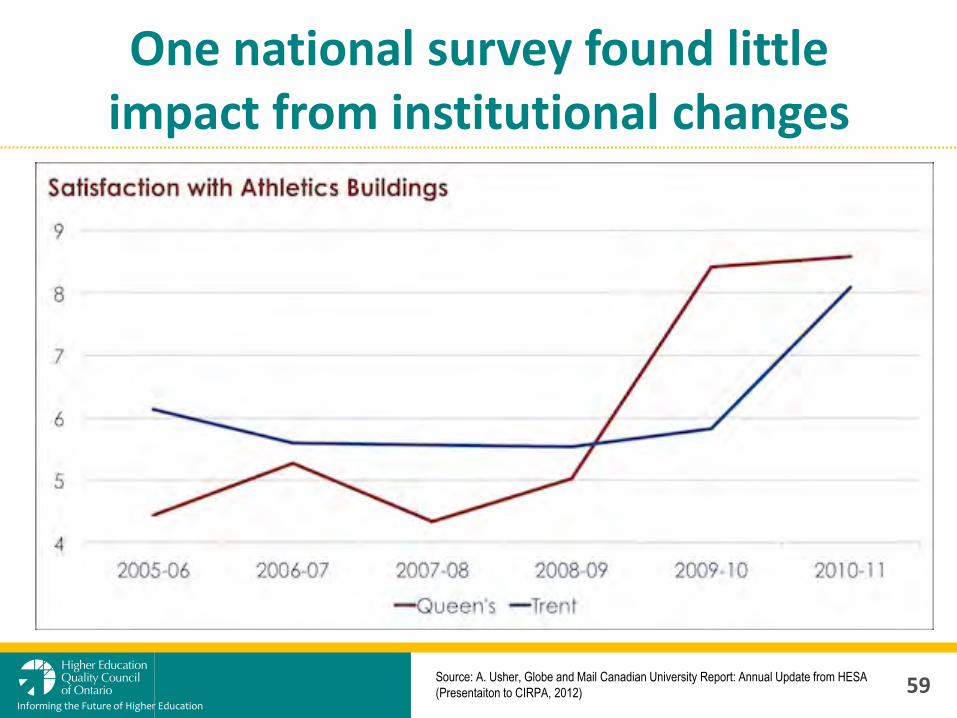
One national survey found little impact from institutional changes
59
Informing the Future of Higher Education
Source: A. Usher, Globe and Mail Canadian University Report: Annual Update from HESA
(Presentaiton to CIRPA, 2012)
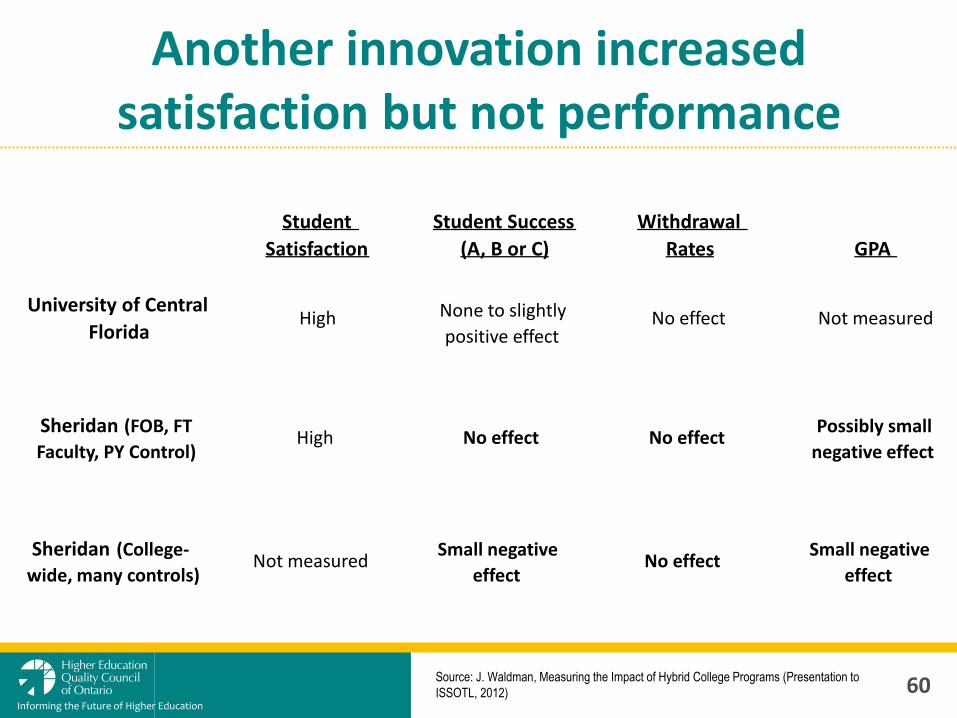
Another innovation increased satisfaction but not performance
60
Informing the Future of Higher Education
Source: J. Waldman, Measuring the Impact of Hybrid College Programs (Presentation to
ISSOTL, 2012)
Student Success (A, B or C) GPA
Student Satisfaction
Withdrawal Rates
University of Central Florida
High None to slightly positive effect
No effect Not measured
Sheridan (FOB, FT Faculty, PY Control)
High No effect No effect Possibly small
negative effect
Sheridan (College- wide, many controls)
Not measured Small negative
effect No effect
Small negative
effect

EMPLOYMENT

We need to define what we mean by “Student Success”
Informing the Future of Higher Education
ACCESS
Barriers
First Generation
Under-Represented
RETENTION
Persistence
Engagement
Credit Transfer
EMPLOYMENT
Relevant Skills
Satisfaction
Income
62 Source: Richard Dominic Wiggers and Christine Arnold, @Issue Paper No. 10, Defining,
Measuring and Achieving “Student Success” in Ontario Colleges and Universities
(HEQCO: 2011).

Millennials have a different view of the value of university education
Informing the Future of Higher Education
63
Source: Arthur Levine, Diane R. Dean, Generation on a Tightrope: A Portrait of
Today’s College Student (2012).
1969 1976 1993 2009
The chief benefit is that it increases one’s earning power --- 44 57 67
Essential goal: to get training and skills for an occupation 59 67 70 73
1969 1976 1993 2009
Essential goal: to formulate life values and goals for my life 71 62 52 50
Essential to learn to get along with people 76 66 47 38

Graduate and employer satisfaction rates are consistently high
64
Informing the Future of Higher Education
70
75
80
85
90
95
2000-01 2001-02 2002-03 2003-04 2004-05 2005-06 2006-07 2007-08 2008-09
Employer and Graduate Satisfaction Rates 2000-01 to 2008-09, percentage of very satisfied/satisfied
Employer Satisfaction Graduate Satisfaction

Is it truly a
“Generation Jobless”?
65
Informing the Future of Higher Education
There are growing concerns about how PSE connects with jobs
Source: Erin Anderson, “Can Canada’s schools pass the next great intelligence test?,
The Globe and Mail (October 5, 2012); Charlie Gillis and Chris Soresnen, “The new
underclass, Maclean’s (January 21, 2013).
66
Informing the Future of Higher Education
• G&M: “Encouraged all their lives by politicians, parents and guidance counsellors to go to university, many students are waking up to the fact that their costly years on campus may not open the right doors later.”
• G&M: “Being the most educated, it turns out, may not be the same as being the best educated.”
• Mclean’s: “The culprit, according to business leaders, is three decades of parents and teachers extolling the virtues of a university degree, encouraging youth to become doctors, lawyers or teachers.”

Source: SSRC, 2012 from Learning to Earning, 2012, presentation by Brent
Herbert-Copley, SSHRC.
Unemployment By Student Performance (Sample Of Recent US Bachelor’s Graduates)
0
2
4
6
8
10
12
CLA scores Academic Engagement/Growth
LowMediumHigh
Informing the Future of Higher Education
67
Students must be reminded that jobs require more than a credential

It is best to be frank with students about the outcomes of their decisions
68
Informing the Future of Higher Education
If universities were honest about the question of career opportunities and income, they would say this:
• “The top performing students, particularly those in high demand technical and professional fields, have very good employment prospects and will likely make impressive incomes.”
• “Students in more general areas of study and, particularly, those who fall short in skill level, motivation and work ethic, will likely struggle after graduation.”
• “Plan accordingly.”
Source: Ken Coates and Bill Morrison, “The Million-Dollar Promise,” Maclean’s
(January 21, 2013)..

LEARNING OUTCOMES

We need to define what we mean by “Student Success”
Informing the Future of Higher Education
ACCESS
Barriers
First Generation
Under-Represented
RETENTION
Persistence
Engagement
Credit Transfer
LEARNING OUTCOMES
Graduation
Skills Acquisition
Value-Added
EMPLOYMENT
Relevant Skills
Satisfaction
Income
70 Source: Richard Dominic Wiggers and Christine Arnold, @Issue Paper No. 10, Defining,
Measuring and Achieving “Student Success” in Ontario Colleges and Universities
(HEQCO: 2011).
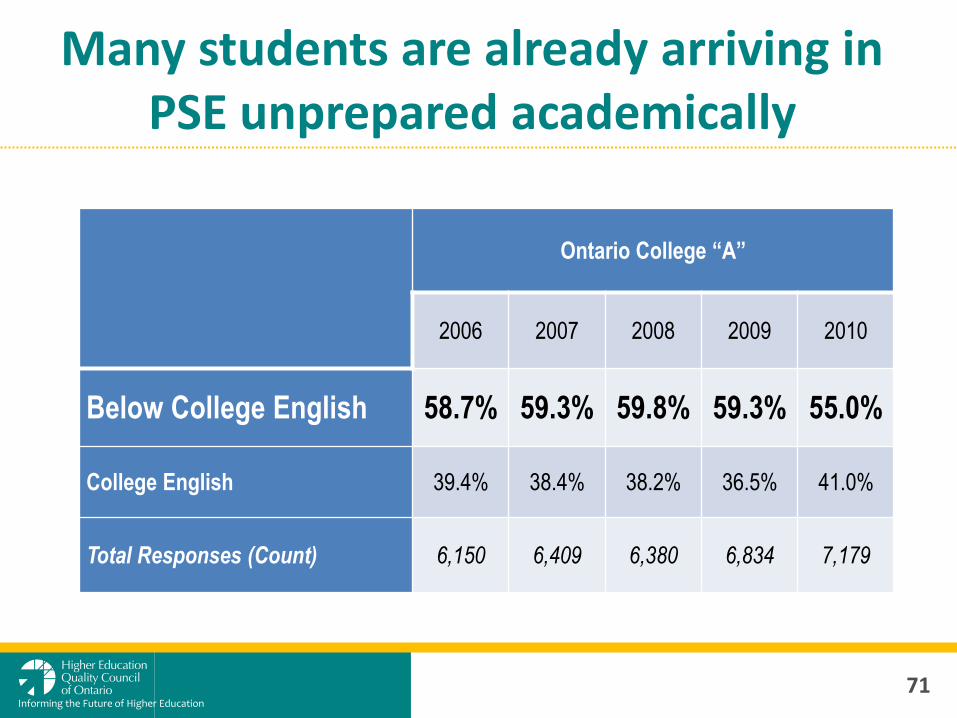
Many students are already arriving in PSE unprepared academically
Informing the Future of Higher Education
71
Ontario College “A”
2006 2007 2008 2009 2010
Below College English 58.7% 59.3% 59.8% 59.3% 55.0%
College English 39.4% 38.4% 38.2% 36.5% 41.0%
Total Responses (Count) 6,150 6,409 6,380 6,834 7,179

There has been grade inflation in postsecondary education
Informing the Future of Higher Education
72
Source: Arthur Levine, Diane R. Dean, Generation on a Tightrope: A Portrait of
Today’s College Student (2012).
1969 1976 1993 2009
My grade point average is A- or higher 7 19 26 41
My grade point average is C or less 25 13 9 5
I have taken a basic skills or remedial course --- 29 32 45
I work hard at my studies --- 86 89 93

Students are studying less, and learning less
Source: Richard Arum and Josipa Roksa, Academically Adrift: Limited Learning on College
Campuses (2011)).
Informing the Future of Higher Education
73
• 45% of students demonstrated no significant improvement in learning during the first two years of college
• 36% of students demonstrated no significant improvement over four years of college
• For students who show improvement, it is modest only
• Main culprit is lack of rigor in terms of reading requirements and study (12-13 hours/week)

PSE isn’t even the equivalent of full-time work for most students
14.0
15.2
15.9
17.0
27.3
28.4
29.3
31.7
0 10 20 30 40
below 70
70 to 79
80 to 89
90+
Hours per Week
Ove
rall
Un
ive
rsit
y G
rad
e
Total Time at School
work
Total Time Studying
Source: Lori McElroy and Alex Usher, HESA, Measuring Differences in Academic Challenges
and Grades at Canadian Universities (PowerPoint presentation for CIRPA 2010).
Informing the Future of Higher Education
74

The majority of full-time students are NOT working at part-time jobs
Informing the Future of Higher Education
75
0%
5%
10%
15%
20%
25%
30%
35%
40%
45%
50%
19
76
/19
77
19
77
/19
78
19
78
/19
79
19
79
/19
80
19
80
/19
81
19
81
/19
82
19
82
/19
83
19
83
/19
84
19
84
/19
85
19
85
/19
86
19
86
/19
87
19
87
/19
88
19
88
/19
89
19
89
/19
90
19
90
/19
91
19
91
/19
92
19
92
/19
93
19
93
/19
94
19
94
/19
95
19
95
/19
96
19
96
/19
97
19
97
/19
98
19
98
/19
99
19
99
/20
00
20
00
/20
01
20
01
/20
02
20
02
/20
03
20
03
/20
04
20
04
/20
05
20
05
/20
06
20
06
/20
07
20
07
/20
08
20
08
/20
09
20
09
/20
10
20
10
/20
11
Full Time Students Working Part-Time During Academic Year, Aged 18-24, Ontario
University MenUniversity Women

HEQCO is doing more research on learning outcomes
Informing the Future of Higher Education
76
• Collegiate Learning Assessment: standardized test to evaluate colleges and universities’ contribution to the development of students generic skills development in critical thinking, analytic reasoning, problem solving, and written communication skills gained from first to final year.
• Tuning: Groups of college and university faculty in social, physical, life and health sciences are establishing Learning Outcomes for these sectors and appropriate measures
• AHELO: Ontario has joined 16 other countries in this OECD study on the Civil Engineering discipline, which focuses on generic and discipline specific skills.

Among the most common types of interventions are the following…
First Year Targeted
Populations Academic Support
Financial General Support
x x x x x
Informing the Future of Higher Education
77

AWARENESS

Too few students are aware of the services available to them
0%
2%
4%
6%
8%
10%
12%
14%
First year Second year Third year Fourth year
Very familiar
Fairly familiar
Informing the Future of Higher Education
Source: Dunn, R. & Carfagnini, A. First Year Transitions: An Evaluation of Nipissing
University’s UNIV 1011 (2010). 79
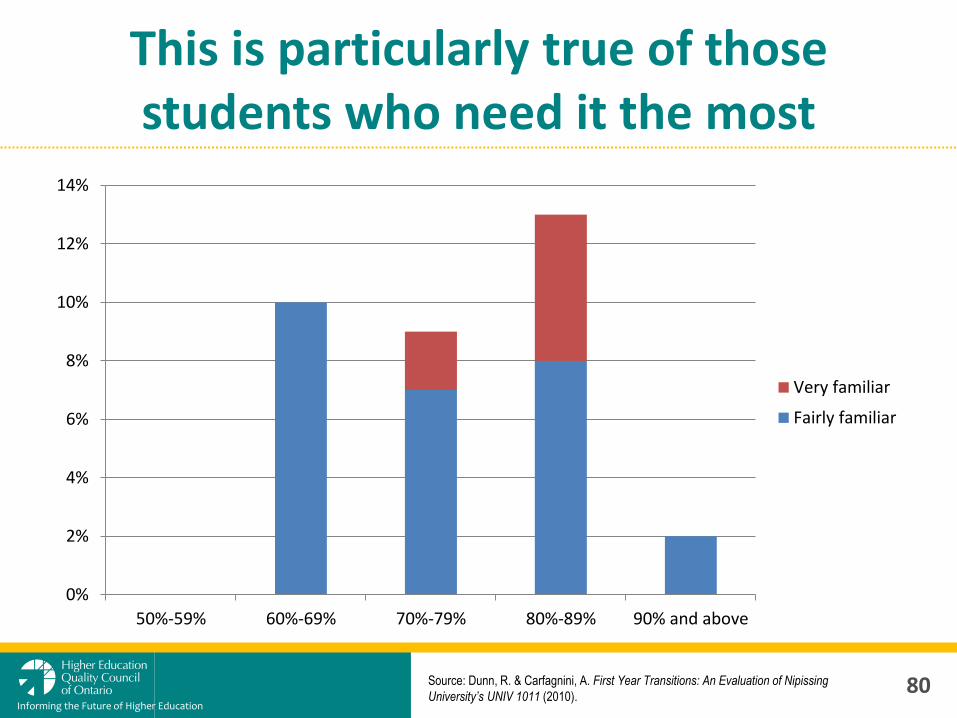
This is particularly true of those students who need it the most
Informing the Future of Higher Education
0%
2%
4%
6%
8%
10%
12%
14%
50%-59% 60%-69% 70%-79% 80%-89% 90% and above
Very familiar
Fairly familiar
Source: Dunn, R. & Carfagnini, A. First Year Transitions: An Evaluation of Nipissing
University’s UNIV 1011 (2010). 80

The source and timing of awareness also continues to be an issue
0% 10% 20% 30% 40%
Other
Student Services
Academic/FacultyAdvisor
Students/Friends/Family
Course Calendar/University Website
How did you hear about UNIV 1011?
0% 10% 20% 30% 40%
Before starting Nipissing& after choosing 1st-
year courses
Before applying toNipissing
After 1st year ofuniversity
After applying toNipissing &
before choosing 1st-…
During 1st year ofuniversity
When did you first learn about UNIV 1011?
81
Informing the Future of Higher Education
Source: Dunn, R. & Carfagnini, A. First Year Transitions: An Evaluation of Nipissing
University’s UNIV 1011 (2010).

UTILIZATION

Students often fail to utilize the supports available to them
Informing the Future of Higher Education
8.3% 8.4% 14.0%
0
500
1,000
1,500
2,000
2,500
3,000
3,500
4,000
4,500
5,000
2006/2007 2007/2008 2008/2009
Nu
mb
er
of
Fir
st-
ye
ar
Stu
de
nts
Cohort
Learning Skills Participants Non-Learning Skills Participants
Source: Brock University Learning Skills Services and HESA. An Evaluation of the Impact of
Learning Skills Workshops on Student Academic Success (2011). 83

They also tend to make minimal use of those services
78%
14%
8%
0%
10%
20%
30%
40%
50%
60%
70%
80%
90%
0 Hours 1-4 Hours 5+ Hours
Source: C.A. Miles et al., The Effectiveness of the Peer-Assisted Study Sessions (PASS)
Program in Enhancing Student Academic Success at Carleton University (2010).
Informing the Future of Higher Education
84

That minimal use is consistent across multiple studies done by HEQCO
Informing the Future of Higher Education
0
500
1000
1500
2000
2500
Pyschology 100 Biology 102 Biology 103
Nu
mb
er
of
Enro
lled
Stu
de
nts
Course
SLG Participants Non-SLG Participants
6.7% 8.8 % 6.7%
Source: Queen’s University, Assessment of Innovative Academic Initiatives: Queen’s
Supported Learning Groups Pilot Program (Forthcoming, 2011). 85

IMPACT

At times the impact may appear minimal or even negative
Informing the Future of Higher Education
0%
10%
20%
30%
40%
50%
60%
70%
80%
90%
100%
1998 1999 2000 2001 2002 2003 2004 2005 2006
Year
1-2
Ret
en
tio
n R
ate
s
Year
UNIV 1011 Non-UNIV 1001
Source: Dunn, R. & Carfagnini, A. First Year Transitions: An Evaluation of Nipissing University’s
UNIV 1011 (2010). 87

What does it mean if the impact appears to be negative?
Informing the Future of Higher Education
0%
10%
20%
30%
40%
50%
60%
70%
80%
90%
100%
1998 1999 2000 2001 2002 2003 2004
De
gre
es
Co
nfe
rre
d
Year UNIV1011 Non-UNIV1011
Source: Dunn, R. & Carfagnini, A. First Year Transitions: An Evaluation of Nipissing University’s
UNIV 1011 (2010). 88

Even substantial financial incentives don’t seem to make a difference
Opportunity Knocks Target:
First and second year university students receiving need-based financial aid (UofT-Scarborough campus)
Control Group
(400 students)
Treatment Group
(400 students)
$20 for each percentage point
above 70 %
Each one-semester course (full course load = 5
courses) students received $100 for obtaining a grade
average of 70%
Assistance and advice from peer
advisors
Source: J. Angrist, T. Chambers, P. Oreopoulos and T. Williams, The “Opportunity
Knocks” Supplemental Merit Scholarships Project (November 2010).
Informing the Future of Higher Education
89

Substantial financial incentives showed relatively small impacts
Source: J. Angrist, T. Chambers, P. Oreopoulos and T. Williams, The “Opportunity
Knocks” Supplemental Merit Scholarships Project (November 2010).
Treatment Control
Kernel Densities of Full-Year Average Grade (per cent) for Treatment and Control
Informing the Future of Higher Education
90

RECOMMENDATIONS

Lessons from HEQCO’s previous research
Informing the Future of Higher Education
92
• AWARENESS: Many students who most need to be aware of the assistance available to them are not adequately informed
• UTILIZATION: For voluntary interventions, those who seek out assistance are often not those most at-risk
• IMPACT: There are few “easy fixes” that clearly improve student success, and most impacts are marginal, indirect or delayed
• MEASUREMENT: While participants will generally applaud the value of the interventions when interviewed or surveyed, there is seldom an easy and credible method to measure the impact on student engagement, academic achievement or retention.

Recommendations
Informing the Future of Higher Education
93
Challenge Solutions
Awareness
Geographically centralize/co-locate support services
Centralize and simplify information (handbook, website, etc.)
Make information available early, possibly even pre-registration
Improve information dispersal via faculty, student associations, etc.
Utilization
More active efforts to target and remind students
Consider compulsory interventions for students on probation, etc.
Recognize that even students who are not “at risk” can and should benefit
Faculty buy-in to encourage students to participate
Source: Richard Wiggers and Christine Arnold, Defining, Measuring and Achieving “Student
Success” in Ontario Colleges and Universities (HEQCO: 2011).

Recommendations
Challenge Solutions
Impact
Most interventions are too limited in scope to expect impacts
Most assessments are too limited in scope to measure long term impacts
Clear and obvious impacts may simply not be measurable
Acknowledge that interventions often overlap
Measurement
Pilot surveys, and/or use existing and proven instruments
Develop a system to track individual student participation in interventions
Link participation and survey responses with student administrative data
Longitudinal tracking to graduation (5 years or longer)
Learning outcomes at the course, program and institutional level
Informing the Future of Higher Education
94 Source: Richard Wiggers and Christine Arnold, Defining, Measuring and Achieving “Student
Success” in Ontario Colleges and Universities (HEQCO: 2011).

Effective retention practices identified by U.S. institutions
Institution Type Solutions
4-year public
Honours programs for academically advanced students
Academic support program or services
Programs designed specifically for first-year students
Programs designed specifically for conditionally admitted students
Programs designed specifically for at-risk students
2-year public
Institution wide emphasis on the teaching and learning of undergraduates
Academic support program or services
Programs designed specifically for first-year students
Providing each continuing student with a written academic plan/roadmap
Using web-based course engagement tools such as Blackboard, WebCT, etc.
Informing the Future of Higher Education
95 Source: 2011 Student Retention Practices at Four-Year and Two-Year Institutions (Noel-
Levits, 2011).

Thank You!
Informing the Future of Higher Education
Richard Dominic Wiggers Executive Director, Research and Programs
HEQCO
(416) 212-3881