L’ÉCHO de CANTLEY est une corporation à but non The ECHO ...
Upload
liliana-mckinneyCategory
view
216download
0
Student Involvement In the IEP Process: What Do You Know?
James Martin, Penny Cantley, Karen Little, and Amber McConnellUniversity of OklahomaZarrow Center840 Asp Ave, Room 111Norman, OK [email protected]://education.ou.edu/zarrow/

Study of Educator-Directed IEP Meetings
3-year study of IEP meetings Almost 1,700 IEP team
members across 393 IEP meetings
389 IEP meetings over three years
Martin, J. E., Huber Marshall, L., & Sale, P. (2004). A 3-year study of middle, junior high, and high school IEP meetings. Exceptional Children, 70, 285-297.

Answer This Question
What two people did not know the reason for the IEP meeting?
I Knew the Reason for Meeting Students knew the reason for IEP meeting less than
all other participants. General educators knew the reasons for the meeting
less than everyone except the student
3.45
3.5
3.55
3.6
3.65
3.7
3.75
3.8
3.85
3.9
3.95
Student
Parent
Administrator
SPED teacher
Gen. Ed. teacher Related Service
Other1

Answer This Question
What two people did not report that they helped make decisions at the IEP meetings?

I Helped Make Decisions
Gen Education Teachers reported helping to make decisions less all other team members, followed by student.
2.5
2.6
2.7
2.8
2.9
3
3.1
3.2
3.3
3.4
3.5
3.6
Cell Mean
Student
Parent
Administrator
SPED teacher
Gen. Ed. teacher Related Service
Other1
Cell
Answer This Question
Who knew what to do at the IEP meeting less than anyone else?

I Knew What To Do At the IEP Meetings? Students – less than anyone else Parents General Ed Teachers

Answer This Question Who talked the most at the IEP
meetings?

Who Talked The Most?
Special Education Teachers

Answer This Question Who talked less than everyone else at
the IEP meeting?

Who Talked The Least?
Students

Answer This Question Who felt the most uncomfortable saying
what they thought? Who reported helping make decisions
less than anyone else? Who understood less than anyone else
what was said at the meeting? Who reported feeling the worst about the
meeting?
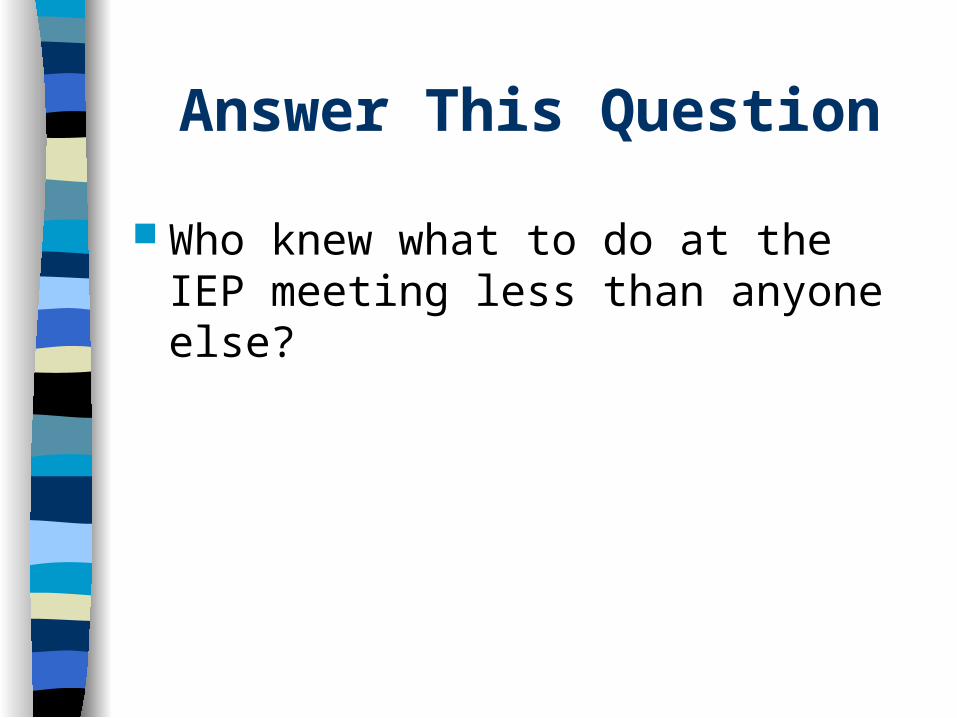
Answers Students felt uncomfortable in saying what they thought
more so than anyone else. Students reported that they helped make decisions less
than anyone else. Students understood less than anyone else in what was
said. Students reported feeling less good about the meeting
than anyone else.
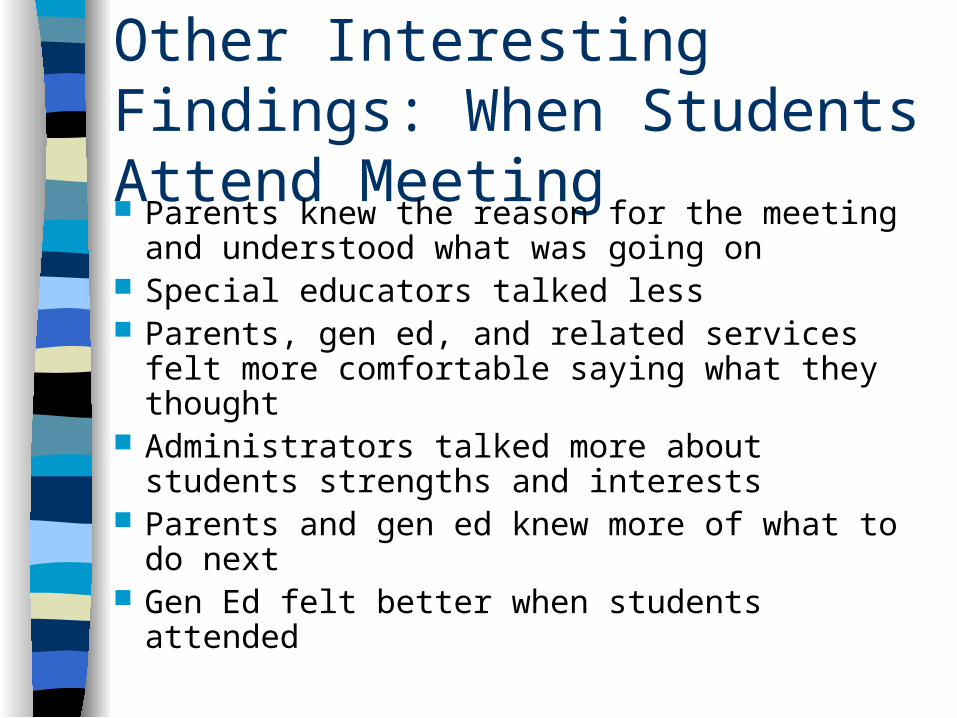
Other Interesting Findings: When Students Attend Meeting Parents knew the reason for the meeting and
understood what was going on Special educators talked less Parents, gen ed, and related services felt
more comfortable saying what they thought Administrators talked more about students
strengths and interests Parents and gen ed knew more of what to do
next Gen Ed felt better when students attended

Field Initiated Research Grant Year 1
– Observe meetings to determine who talks
– Survey after meetings with expanded survey
– Qualitative Study Year 2
– Self-Directed IEP Intervention Year 3
– Self-Directed IEP– Team Training to facilitate
student participation

Baseline Study Details 109 secondary IEP meetings
– 50 middle school meetings (9 schools)– 59 high school meetings (7 schools)
Students attended 84 of the 109 meetings (77% of the meetings)
50.4% of meetings stand alone– 49.6% back-to-back
68% boys (n=74) and 32% girls (n=35)

Answer This Question
What percent of time did the following people talk?– Sped teacher– General ed teacher– Administrator– Parent– Student

Who Talked At IEP Meetings
SPED51%
Gen Ed9%
Administrators9%
Multiple Conv5%
No Conv2%
Student3%
Support 6%
Family15%
Direct Observations of IEP Meetings
Martin, J. E., Van Dycke, J. L., Greene, B. A., Gardner, J. E., Christensen, W. R., Woods, L. L., & Lovett, D. L. (2006). Direct observation of teacher-directed IEP meetings: Establishing the need for student IEP meeting
instruction. Exceptional Children, 72, 187-200.

Answer This Question
What percent of IEP meetings did students do these behaviors?– Introduce everyone and self?– State purpose of meeting?– Review past goals?– Express interests?
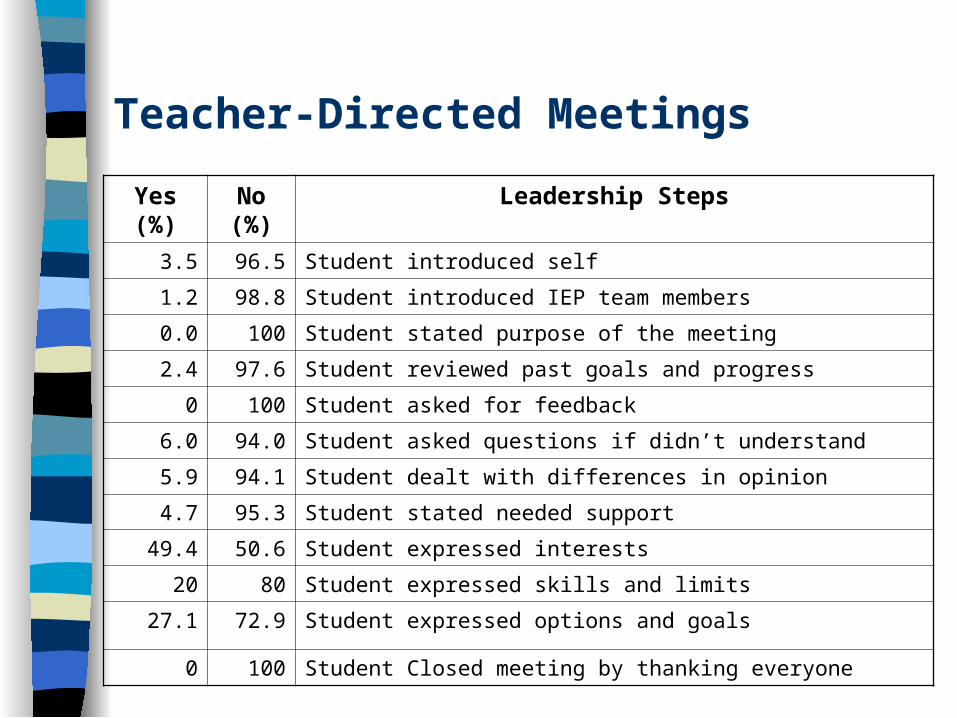
Teacher-Directed Meetings
Yes (%)
No (%)
Leadership Steps
3.5 96.5 Student introduced self
1.2 98.8 Student introduced IEP team members
0.0 100 Student stated purpose of the meeting
2.4 97.6 Student reviewed past goals and progress
0 100 Student asked for feedback
6.0 94.0 Student asked questions if didn’t understand
5.9 94.1 Student dealt with differences in opinion
4.7 95.3 Student stated needed support
49.4 50.6 Student expressed interests
20 80 Student expressed skills and limits
27.1 72.9 Student expressed options and goals
0 100 Student Closed meeting by thanking everyone

Oklahoma Self-Directed IEP Research
More Test Your Knowledge
Martin, J. E., Van Dycke, J. L., Christensen, W. R., Greene, B. A., Gardner, J. E., & Lovett, D. L. (2006) Increasing student participation in IEP meetings: Establishing the Self-Directed IEP as an evidenced-based practice. Exceptional Children, 72, 299-316.

Design Pre/post, control and intervention design with random
assignment by individual – 65 students in control group & 65 in intervention
Groups did not differ in IQ & GPA– GPA = t(45) = .27, p = .40– IQ = t(41) = 1.08, p = .79
84% Caucasian, 9% African America, 4% Hispanic, 3% multicultural (mostly Native American)
Intervention group was taught IEP participation skills using the Self-Directed IEP
Teachers completed the ChoiceMaker Self-Determination Assessment

Observation Methodology 10-second momentary time sampling
– At the end of each interval recorded who talked and if talked about transition or other issues
– Total of 20,210 10-second intervals– Percent agreement 3 checks mean 99%, with
range from 88 to 100%. Observed student engagement in IEP steps Collected length of meeting Who started meeting, who left & came in,
type of meeting

Student-Directed: What Percent Did Team Members Talk?
Role % of Time Talked
Special Ed Teacher
General Ed Teacher
Administrator
Family Members
Support Staff
Student
No Conversation
Multiple Conversations

Student-Directed: Percent Team Members Talked
Role % of Time Talked
Special Ed Teacher 53
General Ed Teacher 7
Administrator 6
Family Members 8
Support Staff 9
Student 13
No Conversation 3
Multiple Conversations 2

Impact of the SD-IEP on Students Talking Students and special education teachers who
used the SD-IEP talked significantly more than those in the control group.– Student control mean = 7.94– Student intervention mean = 21.73– SPED control mean = 71.66– SPED intervention mean = 88.94
Eta square of .15 indicates a large effect between the SD-IEP and students talking.

Student-Directed Meetings: What Percent of IEP Leadership Steps Did Students Complete?Percent Yes Leadership Steps
Student introduced self
Student introduced IEP team members
Student stated purpose of the meeting
Student reviewed past goals and progress
Student asked for feedback
Student asked questions if didn’t understand
Student dealt with differences in opinion
Student stated needed support
Student expressed interests
Student expressed skills and limits
Student expressed options and goals
Student closed meeting by thanking everyone

Percent Yes Leadership Steps
70 Student introduced self
77 Student introduced IEP team members
70 Student stated purpose of the meeting
53 Student reviewed past goals and progress
22 Student asked for feedback
35 Student asked questions if didn’t understand
17 Student dealt with differences in opinion
25 Student stated needed support
72 Student expressed interests
43 Student expressed skills and limits
53 Student expressed options and goals
14 Student closed meeting by thanking everyone
Student-Directed Meetings: Percent of IEP Leadership Steps Students Completed

Student-Directed IEP Meetings
Students started 28% of their own meetings.– χ2 (1, N = 221) = 70.94, p = .000– Phi = .57 suggests a large effect between SD-IEP and
starting meeting– 1 control student and 27 intervention students
Self-Directed IEP Students led 15% of their own meetings, control students did not lead any– χ2(1, N = 230) = 27.71, p = .0– Phi = .35 suggests a moderate effect between the SD-
IEP and leading the meeting
Answer This Question
How much longer do Self-Directed IEP meetings last than teacher-directed meetings?
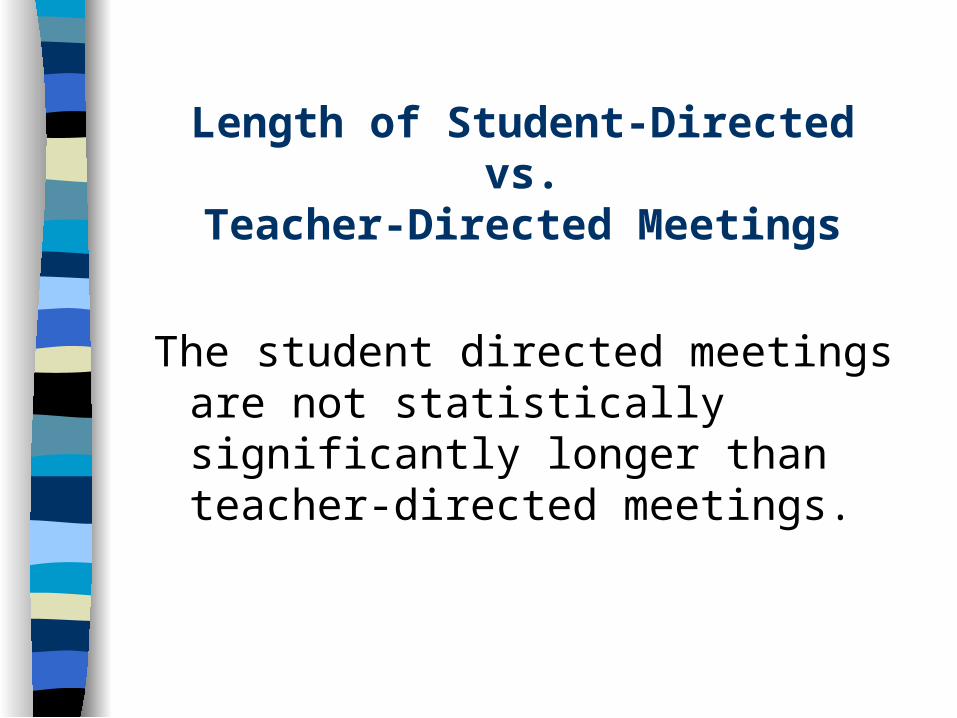
Length of Student-Directed vs.
Teacher-Directed Meetings
The student directed meetings are not statistically significantly longer than teacher-directed meetings.
Answer This Question
Who talked most about transition? What percent of time did students talk
about transition?

Percent of Intervals Discussed Transition
Special Ed50%
General Ed 4%
Admin8%
Family8%
Support Staff20%
Students10%
Teaching Students With Visual Impairments to Actively Participate in Their Secondary IEP Meetings
Pei-Fang Wu and Jim MartinUniversity of Oklahoma
Sharon IsbellOklahoma School for the Blind
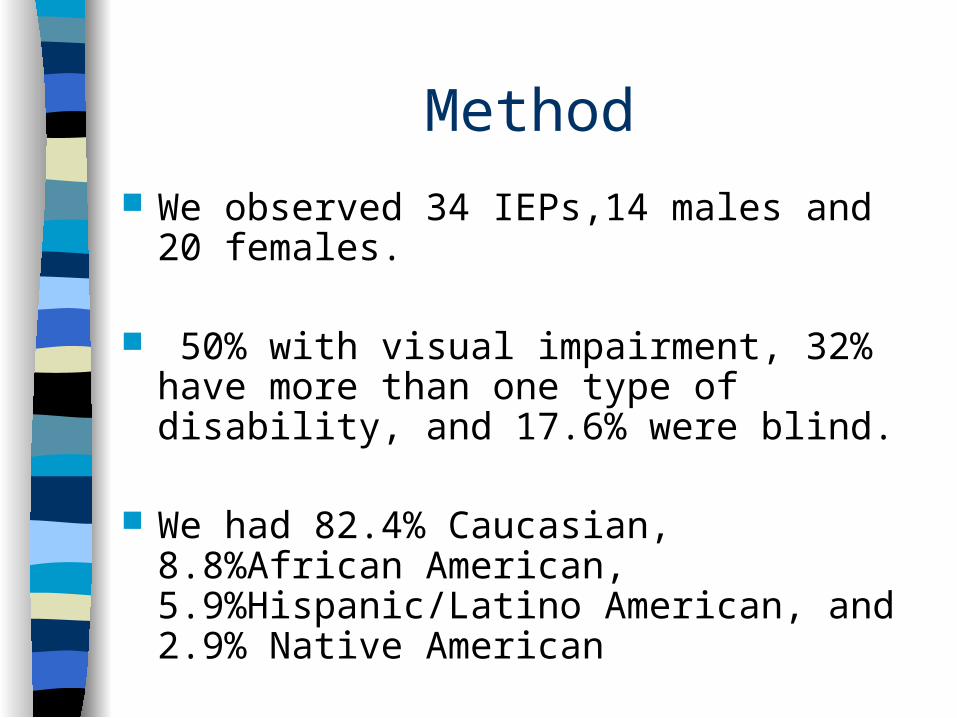
Method
We observed 34 IEPs,14 males and 20 females.
50% with visual impairment, 32% have more than one type of disability, and 17.6% were blind.
We had 82.4% Caucasian, 8.8%African American, 5.9%Hispanic/Latino American, and 2.9% Native American

Participants
Students’ age range from 13 to 20 years old. 52.9% student being 17 years or younger, and 47.1% student were being 18 years or older.
58% of the participating teachers were female with average of 10 years and 7 months teaching experience. 42% of the participated teachers were male with the average of 19 years and 7 month teaching experience.

Answer This Question
At the OK School for the Blind, what percent of time do students who received Self-Directed IEP instruction talk at their IEP meeting?


Team Training PowerPoint
Taught team members about their role in facilitating student engagement in their IEP meeting.

Answer This Question
At the OK School for the Blind, what percent of time do students who received Self-Directed IEP & Student-Directed Transition Planning instruction talk at their IEP meeting?

Percent of Time Students Who are Blind or Visually Impaired Talked at Their IEP
Meeting (Intervention Group)
Others18%
Parents5%
General Ed
Students18%
Adminis4%
Multiple coversation
10%
No Conversation
6%
Special Ed32%

James Martin
University of Oklahoma
Zarrow Center for Learning Enrichment
Carpenter Hall, Room 111
Norman, OK 73019
Phone: 405-325-8951
E-mail: [email protected],
For More Information Contact