Stuck in Traffic: Urban Transport in Africa
103
Stuck in Traffic: Urban Transport in Africa Africa Infrastructure Country Diagnostic Ajay Kumar & Fanny Barrett
-
Upload
nguyennguyet -
Category
Documents
-
view
219 -
download
0
Transcript of Stuck in Traffic: Urban Transport in Africa

Stuck in Traffic:Urban Transport in Africa
Africa Infrastructure Country Diagnostic
Ajay Kumar & Fanny Barrett
Stuck in Traffic: Urban Transport in Africa
Ajay Kumar and Fanny Barrett
January 2008
Draft Final Report
The views and conclusions expressed in this report are those of the authors and do not necessarily re-flect the opinions of the World Bank or any of their affiliated organizations.
Cover design and lay out by Monique Desthuis-Francis

QuickTime™ and aTIFF (Uncompressed) decompressor
are needed to see this picture.
About AICD
This study is part of the Africa Infrastructure Country Diagnostic (AICD), a project designed to expand the world’s knowledge of physical infrastructure in Africa. AICD will provide a baseline against which future improvements in infrastructure services can be measured, making it possible to monitor the results achieved from donor support. It should also provide a more solid empirical foundation for prioritizing investments and designing policy reforms in the infrastructure sectors in Africa.
AICD will produce a series of reports (such as this one) that provide an overview of the status of public expenditure, investment needs, and sector performance in each of the main infrastructure sectors, including energy, information and communication tech-nologies, irrigation, transport, and water and sanitation. The World Bank will publish a summary of AICD’s findings in spring 2008. The underlying data will be made available to the public through an interactive website allowing users to download customized data reports and perform simple simulation exercises.
The first phase of AICD focuses on 24 countries accounting for 85 percent of the gross domestic product, population, and infrastructure aid flows of Sub-Saharan Africa. The countries are: Benin, Burkina Faso, Cabo Verde, Cameroon, Chad, Congo (Democratic Republic of Congo), Côte d'Ivoire, Ethiopia, Ghana, Kenya, Madagascar, Malawi, Mali, Mozambique, Namibia, Niger, Nigeria, Rwanda, Senegal, South Africa, Sudan, Tanza-nia, Uganda, and Zambia. Under a second phase of the project, coverage will be ex-panded to include additional countries.
AICD is being implemented by the World Bank on behalf of a steering committee that represents the African Union, the New Partnership for Africa’s Development (NEPAD), Africa’s regional economic communities, the African Development Bank, and major infrastructure donors. Financing for AICD is provided by a multi-donor trust fund to which the main contributors are the Department for International Devel-opment (United Kingdom), the Public Private Infrastructure Advisory Facility, Agence Française de Développement, and the European Commission. A group of distinguished peer reviewers from policy making and academic circles in Africa and beyond reviews all of the major outputs of the AICD study, with a view to assuring the technical quality of the work.
This and other papers analyzing key infrastructure topics, as well as the underlying data sources described above, will be available for download from www.infrastructureafrica.org. Free-standing summaries are available in English and French.
Inquiries on availability of datasets can be directed to [email protected].


Contents
About AICD v Acknowledgments vii Acronyms and abbreviations viii Executive Summary ix 1. Introduction 1 2. Market structure—the minibus revolution 5 3. Institutional and regulatory framework—self-regulation by default 13 4. Infrastructure—roads and fleet 23 5. Service delivery—access, affordability, and quality 29 6. Conclusion 35 References 39 Annex: City profiles 41 Abidjan 41 Accra 45 Addis Ababa 49 Bamako 53 Conakry 57 Dakar 61 Dar es Salaam 65 Douala 69 Kampala 71 Kigali 73 Kinshasa 75 Lagos 77 Nairobi 81 Ouagadougou 85


vii
Acknowledgments
his report was prepared by a team led by Ajay Kumar and Vivien Foster, with support from Fanny Barrett and Ian Barrett. The team expresses its gratitude to the Africa Flagship Study, the Public-Private Infrastructure Advisory Facility (PPIAF), and the Sub-Saharan Africa Transport Policy Program (SSATP) for their support. The work was discussed and reviewed
within the World Bank; important contributors to the review process included Sanjivi Rajasingham, Tesfamichael Nahusenay, Samuel Zimmerman, Supee Teravaninthorn, Yitzhak Kamhi, Gael Rabal-land, Ibou Diouf, and Dieter Schelling. Special thanks are due to Jean-François Marteau (World Bank) and Tony Dufays (UITP – International Association of Public Transport) for their extensive comments on the draft reports. Logistic support was provided by Mark Njore.
Many others supported the research team’s efforts and provided background information. While it is difficult to list them all, key contributors include:
Abidjan, Côte d’Ivoire Dar es Salaam, Tanzania
Zoro Bi Nagone AGETU General Director Asteria Mlambo and Mo-
hamed Kuganda
Dar Rapid Transit (DART)
Godefroy Konan Director of Studies, AGETU Douala, Cameroon
Marius Pokou AGEROUTE Lydienne Ngalle Bibehe SOCATUR
Assafoua Joseph Aka General Secretary, UATP Kigali, Rwanda
Latifa Kamara World Bank country office Jean Kanyamuhanda SSATP Coordinator
Bamako, Mali Kinshasa, Democratic Republic of the Congo
Timemoko Yoro Kone Coordinator PST2 Charles Lututa Ilongosi President, Société des Trans-
ports Urbains au Congo
(STUC)
Malick Kassé Direction des Transports
Terrestres du Mali
Pierrot Kasanga SSATP Coordinator
Issa Hassimi Diallo SSATP Coordinator Hugues Zangabie STUC
Alassane Diawara,
Mahine Diop, and Aoua
Touré Sow
World Bank country office Ouagadougou, Burkina Faso
Conakry, Guinea Honorine Damiba SOTRACO-SA
Mamadou Bano Sow SSATP Coordinator
Aissatou Gallis Diallo Ministry of Transport
T

viii
Acronyms and abbreviations
ACCO Association des Chauffeurs du Congo
AGEROUTE Agence des Routes (Côte d’Ivoire)
AGEROUTE Agence d’Exécution d’Entretien des Travaux Routiers (Bamako)
AGETU Agence de Gestion des Transports Urbains (Abidjan)
ATRACO An association of minibus operators in Kigali
CETUD Conseil Exécutif des Transports Urbains de Dakar
DARCOBOA Dar Commuter Bus Owners Association
DARL Dar es Salaam Rapid Transit
DDD Dakar Dem Dik
DRCTU Direction de la Régulation et du Contrôle du Transport Urbain (Bamako)
GPRTU Ghana Private Road Transport Union
GRTCC Ghana Road Transport Coordinating Council
KBS Kenya Bus Services
KTB Kampala Transport Board
LAMATA Lagos Metropolitan Area Transport Agency
MBOA Matatu Vehicle Owners Association
MMT Metro Mas Transit, Ltd. (Accra)
NURTW National Union of Road Transport Workers
ONATRACOM Office National de Transport en Commun (Kigali)
PPIAF Public Private Infrastructure Advisory Facility
PROTOA Progressive Transport Owners Association
PTC Passenger Transport Corporation (Addis Ababa)
RURA Rwanda Utilities regulatory Agency
SNTMVCI Syndicat National des Transporteurs de Marchandises et de Voyageurs de Côte d’Ivoire
SOCATUR Société Camerounaise de Transport Urbain
SOTRA Société de Transports Abidjanais (Abidjan)
SOTRACO Société de Transport en Commun de Ouagadougou
SOTUC Société des Transports Urbains de Cameroun
SSATP Sub-Saharan African Transport Policy Program
STUC Société des Transports Urbains du Congo
SUMATRA Surface and Marine Transport Regulatory Authority (Dar es Salaam)
UDA Shirikia la Usafiri Dar es Salaam
UPETCA Union Patronale des Exploitants de Taxis-compteurs d’Abidjan
UTC Uganda Transport Company
UTODA Uganda Taxi Operators and Drivers Association

ix
Executive Summary
etting to work is increasingly difficult in Africa’s sprawling commercial capitals, in large part because of the tidal wave of
minibuses and motorcycles that have arrived to take the place of faltering public bus services. The reasons behind the dysfunctional state of urban transport are not difficult to discern. Weak, fragmented, and under funded authorities have been unable to maintain existing services or to plan for expansion. Buses fall apart after run-ning overloaded for years on rutted roads; re-placements are soon idled for lack of parts. Fares are too low, and subsidies too irregular, to per-mit sustainable operations. Commuters walk or resort to largely unregulated and informal ser-vices that are dirty, unsafe, uncomfortable, and unreliable. Everybody loses.
The way forward is as clear as the problem itself: Africa’s cities must move quickly toward the model of the metropolitan transport authority used in successful cities around the globe to co-ordinate planning, regulation, licensing, inspec-tions, monitoring, and enforcement. A way must be found to bring large buses back. Cities that cannot move people become choked by growth.
This note summarizes recent research on urban transport in 14 large African cities performed at the World Bank under aegis of the Africa Infra-structure Country Diagnostic project. The report is available at www.infrastructureafrica.org.
Choked by growth
In 2000, one in three Africans lived in a city; by 2030, one in two will do so. But in most cities, authorities have had difficulty meeting the ser-vice demands of new urban residents, particu-larly the poor. The absence of policies on land
use and economic development has led to urban sprawl. The declining density associated with sprawl has increased travel distances and pushed up the price of public transport. These develop-ments often affect the poor disproportionately, excluding them from work and social services. Meanwhile, the rising use of private cars has choked roads, endangering the safety of pedes-trians and the health of city residents who breathe in automobile emissions.
We collected a set of detailed qualitative and quantitative indicators on urban transport in 14 major African cities, each the principal commer-cial city (if not necessarily the political capital) of the country in which it is located. All the cities are growing rapidly, and, as populations have grown, so have city boundaries, which now ex-tend into contiguous areas, often managed by different local governments. The expansion of a metropolitan area over several jurisdictions greatly complicates the task of planning, regulat-ing, and operating urban transport services—in Africa as in the industrialized world.
All of the cities in our sample are in low-income countries. Some are medium-sized, with a popu-lation of around one million. Two are mega-cities of more than five million residents. The remainder are large cities, with a population of two to four million. Each accounts for 10–20 percent of the national population and more than 30 percent of the urban population. Each is the principal center of economic, commercial, and industrial activity in the country.
The 14 cities share some common characteris-tics: a growing urban population inadequately served by the transport system, declining stan-dards of public transport, overlaps and conflicts
G

Stuck in traffic: urban transport in Africa
x
among the agencies responsible for planning and implementing transport solutions, massive growth in the use of minibus services, growing dependence on private transport (cars and mo-torcycles), inadequate and deteriorating trans-port infrastructure, and poor facilities for non-motorized transport (walking and bicycling).
Road congestion is a problem in all cities. Its causes are poor management of traffic flow, in-adequate parking, and weak enforcement. Hav-ing evolved over the years without adequate planning, the cities are unable to cope with growing motorization. Less than half of all roads are paved, reducing accessibility for buses in densely populated neighborhoods and outlying areas. Paved roads are just one-third of the aver-age for cities in the developing world (table 1).
The road network in all cities is substandard. Capacity is limited, service lanes are absent, pavement is deteriorating, and street lighting is minimal. Bad conditions reduce vehicle speeds, sapping the productivity of the bus fleet and in-creasing the cost of vehicle maintenance. They also promote the use of minibuses, taxis, and motorcycles, which have greater maneuverability
than large buses but are not as efficient as a means of urban mass transit.
Most roads were laid when cities had a single center, and before the rapid growth in personal-ized forms of motorized transport. The primary road network radiates from the city center to surrounding areas; orbital or circumferential links are missing. The majority of the roads have one lane in each direction; where the roads are wider, one lane is often taken up by pedestrians and parked vehicles. Intersections are spaced closely together and are ill-designed for turning.
Beyond these general failings, little attention has been paid to other matters that facilitate the op-eration of public transport systems. Dedicated bus lanes are rare, or absent altogether. Bus stops, bus shelters, and other facilities for pas-sengers are scarce and in poor condition. Bus terminals are little more than overcrowded park-ing lots, with no facilities for passengers.
Most cities have ignored the needs of pedestri-ans. Sidewalks are missing on around 65 percent of the road network, so pedestrians and motor-ized vehicles must share the same space. Where they do exist, sidewalks are poorly maintained, contain open drains, and are taken over by the expansion of adjoining properties. Pedestrian crosswalks and bridges are not provided, except in city centers. Because traffic management is limited, accidents are frequent. Pedestrians ac-count for two-thirds of fatalities.
The incredible shrinking bus
Buses—large and small—are the most common mode of public transit in most cities (table 2). Minibuses are much more prevalent than large buses (except in Addis Ababa and Ouagadou-gou), reflecting the difficulty of operating large buses profitably. Overall, about twice as many trips are taken by minibus than by large bus.
Table 1 Paved roads in selected African cities, compared with developing-world average
City Paved roads (m per 1,000 pop.)
Abidjan 346
Conakry 174
Dakar 467
Dar es Salaam 150
Kampala 225
Kinshasa 63
Lagos 400
Average, sample 318
Average, developing world 1,000
Sources: City authorities; UN Millennium Cities Data-base. Note: — = not available.

Executive summary
xi
All 14 of our cities originally relied on a monop-oly supplier of large-bus service as the backbone of their urban transport system. In most cases the traditional bus companies were nationalized in the proc-ess of decolonization, ushering in a regulated regime of public transport in the immediate postcolonial era. Fares were regulated, and governments were reluctant to increase them.
Initially, the state-owned bus companies were able to operate without subsidy, but as opera-tional deficits grew and public subsidies did not grow com-mensurately, operators had difficulty maintaining and re-placing their fleet. The result was deterioration in service coverage and quality. Most of the public companies eventu-ally failed and went out of business. Some cities (Accra, Dar es Salaam, Kampala, Ki-gali, and Lagos) have aban-doned large-bus service altogether and now rely exclusively on private, largely informal, minibus services. Nairobi is the only city not to have passed through this cycle, having retained the private operation of its large-bus service since independence.
Minibuses, which carry roughly 8 to 25 passen-gers, tend to have colloquial names, such as tro-tro in Accra, danfo in Lagos, gbaka in Abidjan, sotrama in Bamako, and matatu in Nairobi. So-called midi-buses are a larger form of minibus, with a passenger capacity ranging from around 30 to about 50 (with standees). These vehicles, too, tend to have colloquial names, such as cars rapides in Dakar, and molue in Lagos. The term used in Dar es Salaam, dala-dala, is derived from
dollar-dollar. Large buses carry 50 to 100 pas-sengers.
In none of the cities studied did the shift to
minibuses result from a conscious decision to deregulate public transport. Rather, it was an indigenous response to growing demand and commercial opportunity. Today the minibus transport business generally operates in a regula-tory vacuum.1
Minibus services are almost invariably provided by the informal sector. Ownership is highly dis-persed, with most individual entrepreneurs own-ing no more than one or two vehicles, which
1 Of the cities studied, only Douala and Ouagadougou do
not offer some kind of minibus service. Cameroon’s gov-
ernment outlawed such services in an effort to develop a
new large-bus operator. In both cases, the vacuum created
by the absence of minibus services has been filled by shared
taxis that operate on a similar model.
Table 2 Shares of various modes of transport in use in 14 African cities
City Large bus
Mini-bus Taxi
Motor-cycle
Private car Walk Other
Abidjan 11 19 29 0 18 22 1
Accra 10 52 9 0 13 12 4
Addis Ababa
35 20 5 0 7 30 3
Bamako 1 10 5 56 19 — 9
Conakry 1 14 6 0 1 78 0
Dakar 3 73 6 6 11 — 1
Dar es Salaam
0 61 1 1 10 26 1
Douala 10 — 13 12 2 60 3
Kampala 0 41 — 20 35 — 4
Kigali 1 75 10 0 10 5 0
Kinshasa — — — — — High —
Lagos 10 75 5 5 5 High 0
Nairobi 7 29 15 2 — 47 0
Ouaga-dougou
8 0 — 58 14 — 20
Average 7 30 8 12 12 37 4
Sources: City authorities, published documents. Note: — = Not available. Rows may not total to 100 because of rounding. Note: The modal share shown for Bamako, Dakar, Kampala, Lagos, and Ouaga-dougou reflects motorized trips only.

Stuck in traffic: urban transport in Africa
xii
they generally rent out to drivers. Drivers keep the fares they collect but are responsible for pay-ing fuel costs, conductors’ wages, terminal fees, and other incidental expenses. Drivers face a strong incentive to carry full loads of passengers to maximize revenues while minimizing variable costs (notably fuel).
In a few cities, formal minibus operations on a larger scale coexist alongside the informal opera-tions just described. In Dakar, for example, of the estimated fleet of 3,000 cars rapides, 400 be-long to one formal operator and another 200 to a second.
Reinforcing the appeal of minibuses is the rela-tive ease of financing purchases of second-hand vehicles using interest-free loans from personal savings, family, and friends, as well as earnings from operations. Bank finance is rarely used, as the banks are reluctant to accept the vehicles as security for the loan, and revenue streams are not sufficiently reliable to assure the banks that loans will be repaid.
The sector is typified by short periods of owner involvement. With a vehicle in reasonable condi-tion, and with a reliable driver, it is possible to realize a healthy regular cash flow. However when major repairs are required, it is not un-common for owners not to reinvest.
Most of the cities have a minibus fleet several thousand strong, compared with only a few hundred larger buses (table 3). The minibus fleet tends to be somewhat older than the large buses, since typically it is composed of second-hand vehicles, whereas many large buses are or were supplied new by aid donors.
Small buses, big problems
Minibuses have proliferated by filling a void left by large-bus services. But they are far from an unalloyed good—in fact, they present clear dis-advantages from the perspective of the public interest:
Road congestion. Minibuses now account for almost 50 percent of all motorized traffic on some corridors. Their proliferation has pro-duced severe congestion, particularly during peak periods.
Safety and emissions. Most minibuses are old, inadequately maintained, and operated for long hours at low speed. In Accra in 2004 minibuses accounted for the majority of traffic violations and 22 percent of accidents. Weak enforcement of regulations on vehicle inspection, driver behavior, and traffic man-agement is common practice in all African cities.
Unpredictability of routes, schedules, and fares. Minibus operators increase fares as demand rises and change routes at will. In Dar es Salaam routes are allocated by the regulator (SUMATRA), and fares are regu-lated through negotiations with the bus op-erators’ association. Otherwise the dala-dala are as unpredictable as their equivalents in other cities. The flexibility to do so has con-tributed to their economic success, but at a cost to passengers. Vehicles wait at the ter-minal until they are fully loaded. This means that passengers wishing to board at other stops along the route often cannot do so. Many walk long distances to the terminal so as to be assured of a seat on the bus.

Executive summary
xiii
Access to bus services is very low in the cities surveyed, critically so in some cases. The low density of paved roads—coupled with un-planned growth, poor road surfaces, and narrow streets— suggests that the geographic reach of bus services is seriously circumscribed. Most of the 14 cities have 30–60 bus seats per thousand residents, mostly in minibuses. In Addis Ababa, Kinshasa, and Ouagadougou, the indicator falls to no more than 10 per thousand. The average number of large-bus seats in our sample is only 6 per thousand. As a point of comparison, the av-erage number of large-bus seats per thousand urban residents in the middle-income countries of Latin America, Asia, the Middle East, and Eastern Europe is 30 to 40.
Fares are also high in relation to the purchasing power of the typical family in the cities, and bus usage is correspondingly low. The average family is able to afford no more than one daily round
trip on the bus, while for the poorest households even this basic level of mobility is unattainable. But even this low rate of use translates into peak demand for around 200 seats per thousand residents, about five times higher than the supply available in any of the cities sampled.
Fare structures are not uniform across the cities, but elements of both flat and dis-tance-related tariffs can be identified in most cases. The most common practice is a set fare for a given route, with fares varying across the network according to route length. The average cost of a trip is around $0.30, with no systematic variation between the fares charged by large buses and the nominal fares of informal minibuses. In countries in South Asia and Latin America at similar income levels bus fares are typi-cally much lower—between $0.10 and $0.15.
Alternatives to bus transport
In Douala, Lagos, and Kampala, the use of mo-torcycles for commercial transport has grown very rapidly in recent years, as a consequence of the poor state of the roads and the inability of bus companies to meet growing demand. In Ouagadougou and Bamako, the use of privately owned motorcycles is now common. Initially, motorcycle services provided access from resi-dential areas to main roads, where passengers would take taxis or buses. However, motorcycle services are now found on main roads, and even in the city center. Motorcycle drivers are often young and inexperienced. Accidents are com-mon—and often fatal.
In comparison with Asian cities, the use of non-motorized vehicles (bicycles, rickshaws) is sur-prisingly low in African cities, as is the use of two-wheeled motorized vehicles.
Table 3 Average bus age and fleet size
Large bus Minibus
City Average
age Fleet size
Average age
Fleet size
Abidjan 7 650 15 5,000
Accra 1–2 600 15–20 6,000
Addis — 350 — 10,000
Bamako 17 168 15 1,800
Conakry 20 50 10–15 1,500
Dakar — 410 15–20 3,000
Dar es Salaam n/a 0 15 7,000
Douala 15 100 15–20 2,000
Kampala n/a 0 10–15 7,000
Kigali 4 20 15 2000
Kinshasa 2 a 180 a 15–20 b 1,200 b
Lagos — <100 >15 75–120,000
Nairobi — 250 >15 10,000
Ouagadougou 5 55 n/a 0
Average 9 218 14 11,400
Source: City authorities, published documents. Note: — = not available; n/a = not applicable. a. Publicly owned operator. b. Informal operators.

Stuck in traffic: urban transport in Africa
xiv
The extent of walking as a mode of commuting (for those cities that have attempted to measure it) also varies enormously. In some cities walking accounts for most urban trips. In others, many residents walk long distances to work. Facilities for pedestrians are very poor, however, and those for bicycles are nonexistent (except in Ouagadougou). The widespread recourse to walking indicates that many city residents may not be able to afford public transport.
Small-scale suburban rail networks exist in Da-kar, Kinshasa, Lagos, and Nairobi, but account for less than 2 percent of the market. While highly desirable, light rail systems are also expen-sive to build and maintain.
Weak regulation, lax enforcement
Effective urban public transportation requires coordinated attention to urban planning, to the construction and maintenance of infrastructure, and to the organization of transport services. In the 14 cities studied, these functions are seldom combined. Even where all three functions re-main at the central government level, several different ministries are usually involved. In most of the cities studied, many institutions at all lev-els of government—federal, state, and local—are involved in planning, regulating, licensing, and monitoring urban transport.
The net effect of the widespread role confusion in regulation and planning is poor accountabil-ity, lack of coordination, and diffusion of com-mitment at all levels toward the implementation of transport strategies that serve people’s needs. In short—ineffective regulation and an almost universal absence of integrated planning.
Only a handful of African cities have established agencies with overarching responsibility for ur-ban transport. Those in our sample are Abidjan (AGETU), Bamako (DRCTU), Dakar (CETUD), Dar es Salaam (SUMATRA), and Lagos
(LAMATA), but even these lack the necessary executive powers to implement their vision and must work through other agencies of govern-ment. In Addis Ababa, a city-wide transport au-thority does exist, but it is not autonomous.
In Accra, Dakar, Bamako, Kampala, Dar es Sa-laam and Nairobi, the government makes no attempt to control the supply of minibuses—that function has been left to route associations or syndicates. The general practice is for the syn-dicates to collect dues from their members, in return for the right to use the terminal facilities it manages. The syndicates also charge daily fees based on terminal use. Some play a role in regu-lating routes and setting fares. By effectively self-regulating the sector, an orderly market has been created in which the worst consequences of competition on transport routes have been avoided.
Union control has some adverse consequences, however. Chief among them is the rigidity of the route network. Routes run between designated terminals under the unions’ control, which fails to match transport supply to passenger demand. To enforce an “equitable” distribution of reve-nue among members, the unions impose operat-ing practices that work against passenger inter-ests. The most egregious of these is waiting for the assembly of a full load before setting out on the route, which often forces passengers to sit in the vehicle under the sun in order to retain their place. Waiting times at terminals can exceed an hour off peak, extending waiting times along the route and making it difficult for intending pas-sengers to access the service.
By loading vehicles in strict rotation, the unions also prevent intending passengers from rejecting vehicles that fail to meet expected standards of cleanliness or physical condition. This, in turn, lowers the incentive for vehicle owners to im-prove their performance. Investment in a pre-

Executive summary
xv
mium-quality vehicle also becomes impractical under these circumstances.
All of the cities studied have difficulty enforcing regulations pertaining to vehicle inspections (safety and emissions). In Lagos, we found that 37 percent of vehicles were operating without a valid certificate of roadworthiness, and 47 per-cent without a valid test certificate. One driver in five acknowledged that he did not hold a valid driver’s license. In Nairobi it was reported to be easier to obtain a forged certificate of roadwor-thiness for an unsafe vehicle than to submit for official inspection a vehicle in good condition. Overcrowding is routine. In Kinshasa and Dar es Salaam, the average load factor on large buses at the morning peak reaches 200 percent, with pas-sengers hanging out of the bus or even sitting on the roof.
In every city we studied the licensing regime em-phasizes the vehicle, rather than its operator. Weak or nonexistent operator-licensing regimes make it difficult to influence the behavior of transport operators and to raise their standards in the public interest. A stronger regime would require operators to maintain their vehicles in roadworthy condition and to enforce the re-quirement through inspections, tests, and sanc-tions.
Wanted: metropolitan transport au-thorities
Improving urban public transport in African cities will depend on a strategy of coordinated measures to improve infrastructure, traffic man-agement, service quality, and network reach. Short-term steps include increasing road fund-ing, enforcing existing regulations, controlling overcrowding, and strengthening vehicle inspec-tions. Medium-term measures include rehabili-tating roads, improving traffic management, set-ting and enforcing service standards (fares, schedules), developing a new route structure,
and rationalizing service through controlled competition. The long-term goal is to consoli-date gains in all these areas through the creation of a metropolitan transport authority with juris-diction over roadways and vehicles.
A capable authority must coordinate transport planning, infrastructure development, and regu-lation of services. Its budget must be sufficient to attract and retain qualified staff and must not be subject to arbitrary changes when the sponsoring department comes under pressure. User charges—principally operating permits or fran-chise fees levied on operators—are the preferred funding option. These need not be onerous or have a significant effect on fares.
Large buses provide greater comfort, safety, and speed than minibuses, particularly on high-density corridors, if they can be managed effi-ciently and sustainably. They also hold out the promise of relieving the growing congestion of African cities. To exploit their potential, how-ever, African cities must repair their roadways, improve traffic-management practices, and en-sure the economic viability of large-vehicle ser-vices through cost recovery, either through the fare box or through predictable subsidies. If these goals were achieved, minibuses would con-tinue to have an important role as feeder services in outlying areas.
Reintroduction of large buses also will depend not only on physical and institutional improve-ments, but also on a staunch political commit-ment to sustainable operations. Few private op-erators are able to raise the capital needed to ac-quire larger buses. Under current conditions, it is doubtful that even those few would elect to do so. Overcoming the investment barrier will re-quire controlled competition in the form of allo-cated rights to operate exclusive bus services along dedicated routes. Controlled competition can be introduced by consolidating the informal sector into larger units or associations, thereby
Stuck in traffic: urban transport in Africa
xvi
enabling them to participate in the competition for exclusive route contracts. The avoidance of wasteful competition should serve to reduce congestion and raise speeds of operation, mak-ing larger buses commercially attractive. This approach is premised on a contract duration that is commensurate with the investment payback period, and on a system of tariff regulation that ensures recovery of reasonable costs over time and insulates operators and regulators from transient political pressures. For example, in Dar
es Salaam, the government, having made a commitment to improve the quality of urban transport, is implementing a bus rapid transit system. Dar Rapid Transit, or DART, will be in-troduced in phases with a planned opening of 20 kilometers of busways in 2010. The busways eventually will cover a route of 130 kilometers, with connections to feeder services and bicycle routes. The system will have 18 terminals and some 228 stations.

1
1. Introduction
frica’s cities are growing rapidly. In 2000, one in three Africans lived in a city; by 2030, it is expected that one in two will
do so. Some say the growth is premature, in the sense that it is driven not by burgeoning wealth in urban areas but by anemic economic condi-tions in rural areas (United Nations 2005). In other words, failing crops, natural disasters, and conflicts—not attractive new jobs—are forcing people to relocate to towns and cities.
In most cities, authorities have had difficulty meeting the service demands of the new urban residents, particularly the poor, who are most dependent on public provision of water, electric-ity, transport, and other services. But the effects of rapid growth affect all segments of society. The absence of policies on land use and eco-nomic development has led to urban sprawl, which multiplies the challenge posed by rapid growth. The declining population density associ-ated with sprawl has increased travel distances and pushed up the price of public transport. Again, these developments affect the poor dis-proportionately, often effectively excluding them from work and social services. Meanwhile, the rising use of private cars has choked roads, en-dangering the safety of pedestrians and the health of city residents who breathe in automo-bile emissions.
The 14 cities studied here share some common characteristics: a growing urban population in-adequately served by the transport system, de-clining standards of public transport, overlaps and conflicts among the agencies responsible for planning and implementing transport solutions, massive growth in the use of minibus services, growing dependence on private transport (cars and motorcycles), inadequate and deteriorating
transport infrastructure, and poor facilities for non-motorized transport (walking and bicy-cling). One effect of these problems has been to further marginalize the most vulnerable seg-ments of society who depend the most on public transport and cannot afford private alternatives.
But with similarities among cities come differ-ences as well—in size, geography, cultural set-ting, administrative structure, and national mac-roeconomic framework. Different countries have approached the challenge or urban transport in different ways, ranging from completely regu-lated markets and monopolistic supply to un-regulated, competitive supply. How those strate-gies have worked in different cities is the subject of this study. We examine the question from the perspective of (a) the central governments that provide the infrastructure, financial support, and regulatory framework; (b) the local governments that typically bear responsibility for providing urban passenger transport services; (c) the pro-viders of bus services (owners and drivers); and (d) the passengers.
We designed the study to fill gaps in existing data and so provide city governments with access to comparative mobility statistics as they address their growing urban transport problems. Good data are necessary both for policy formulation and for measuring the success of policy imple-mentation. The lack of the necessary data has held back the development of effective urban transport policies in Sub-Saharan Africa. By of-fering a snapshot of urban transport in 14 cities, we hope to make it possible to better track policy performance over time.
The objective of this study is to provide a com-prehensive overview of the state of urban trans-
A

Stuck in traffic: urban transport in Africa
2
port in Africa, with a view to drawing out the main challenges facing the sector and illustrating the different ways in which these have been ad-dressed. Our focus is on public transport, which is understood to include all forms of transport used for commercial (that is, not strictly private) purposes, including large buses, minibuses, taxis and motorcycles, irrespective of ownership structure or regulatory basis.
We collected a set of detailed qualitative and quantitative performance indicators of the urban transport sector in 14 major cities on the conti-nent, each the principal commercial city (if not necessarily the political capital) of the country in which it is located. The methodological frame-work for the performance indicators was ex-plained and developed in some detail in an ear-lier publication (Kumar and Barrett 2006). Data were collected between June 2004 and December 2006. Given the volume and diversity of data,
and because our purpose was to provide a gen-eral assessment that would enable broad cross-country comparisons, we have not systematically cited the source of each piece of data.
The availability of a consistent set of perform-ance indicators for a substantial sample of Afri-can cities makes it possible to draw out the ma-jor trends unfolding on the continent and to put
the performance of each city in a wider context.
Two methods were used to collect performance indicators.
For a first set of cities, extensive fieldwork had already been done by the Public Private Infra-structure Advisory Facility (PPIAF), the Sub-Saharan African Transport Policy Program (SSATP), and the World Bank, often in the con-text of investment operations. The large volume of information available on these cities meant
Table 1.1 Size and other characteristics of the 14 cities of the study
City Population (millions)
Growth rate (percent)
City population as share of na-tional popula-
tion
City population as share of ur-
ban population
Density (1,000 inhabitants per
sq km)
Private cars per 1,000 inhabi-
tants
Abidjan 3.5 3.7 20 46 6.2 52
Accra 2.8 4.0 13 28 8.1 65
Addis Ababa
3.1 < 4.0 5 28 5.7 32
Bamako 1.2 4.8 9 32 4.5 108
Conakry 1.5 4.1 16 65 13.3 61
Dakar 2.8 4.4 30 49 5.1 39
Dar es Salaam
3.7 6.4 10 29 2.1 13
Douala 2.5 6.5 17 34 13.2 40
Kampala 2.0 5 7 59 2.1 —
Kigali 0.7 3.1 8 100 1.0 40
Kinshasa 8.0 4.1 13 32 0.8 —
Lagos 15.0 6.0 12 25 4.2 80
Nairobi 4.0 > 4.0 12 29 5.7 —
Ouaga-dougou
1.1 4.4 8 52 2.0 78
Average n/a 4.7 13 43 5.2 55
Source: Africa Infrastructure Country Diagnostic, 2007. n/a = not applicable; — = not available.

Introduction
3
that it was feasible to extract the indicators di-rectly from a desk review of existing informa-tion. The cities in this group are Accra (Ghana), Addis Ababa (Ethiopia), Dakar (Senegal), Douala (Cameroon), Kampala (Uganda), Lagos (Nigeria), and Nairobi (Kenya).
Data on a second set of cities were collected through week-long field visits in the second half of 2006, using a methodology developed as part of the study. The visits entailed face-to-face in-terviews with the public authorities having juris-diction over urban transport, and with providers of transport services, both formal and informal. We also carried out semi-structured focus groups with customers. A brief questionnaire was administered to riders at bus stops during peak hours over a two-day period. While the resulting sample cannot be considered statisti-cally representative, it does provide some insight into users’ perceptions of service quality. Con-tacts for the fieldwork were made through the SSATP network. The seven cities in this second group are Abidjan (Côte d’Ivoire), Bamako (Mali), Conakry (Guinea), Dar es Salaam (Tan-zania), Kigali (Rwanda), Kinshasa (Democratic Republic of Congo), and Ouagadougou (Burk-ina Faso).
The sample provides a broad cross-section of African cities, anglophone and francophone, in East, West, and Central Africa (table 1.1). All of the cities are in low-income countries. One sub-set of the cities may be considered medium-sized, with a population of around one million. Two are mega-cities of over five million. The remainder are large cities, with a population of around two to four million.
Regardless of their absolute size, the cities ac-count for 10–20 percent of the national popula-tion and more than 30 percent of the urban population. Each is the principal center of eco-nomic, commercial, and industrial activity in the country. Typically, they house the headquarters
of at least 70 percent of the country’s commer-cial banks, insurance companies, and industries; more than 50 percent of the country’s manufac-turing activities; and a commensurate share of its skilled manpower.
All the cities are growing rapidly—in the range of 3–5 percent annually. Douala and Lagos—expanding by at least 6 percent per year—exceed the norm. These growth rates may be compared with the annual rates of 3.1 percent in East Asia and 2.6 percent in South Asia. As populations have grown over the past few decades so have city boundaries, which now extend into contigu-ous areas, often managed by different local gov-ernments. The expansion of a metropolitan area over several jurisdictions greatly complicates the task of planning, regulating, and operating ur-ban transport services—in Africa as in the indus-trialized world.
No less than population, density varies across our sample, from under 1,000 inhabitants per square kilometer (in Kigali and Kinshasa) to more than 13,000 (in Conakry and Douala). In the industrialized world, most cities of compara-ble size have greater densities. New York City, for example, has a density of about 10,000 in-habitants per square kilometer. Greater density makes urban transport more economical and easier to manage. In the cities of our sample, by contrast, city boundaries are expanding faster than the population growth rate, resulting in a decline in density. As noted, the resulting sprawl has increased travel distances and pushed up the price of public transport.
This report highlights the trends emerging from our study and presents summary tables of per-formance indicators gathered for each city. Fol-lowing this introduction, section 2 describes the overall market for urban transport services, fo-cusing on the large buses and minibuses. Section 3 treats the main aspects of the institutional and regulatory framework for urban transport, con

Stuck in traffic: urban transport in Africa
4
sidering the organization of the sector, the allo-cation of routes, licensing of vehicles and drivers, and the regulation of fares. Section 4 examines the infrastructure endowment (in terms of roads and bus fleets) in each city. Section 5 looks at
service delivery issues, including access, afforda-bility, and quality of service. Our conclusions are presented in the last section. The annex provides short profiles of each city in the sample.

5
2. Market structure—the minibus revolution
The market for urban transportation services in the 14 cities studied can be broken down by mode, as shown in table 2.1. Not all of the cities and in others the analysis is limited to motorized forms of transport, without taking pedestrians
into account. Notwithstanding these limitations, a fairly clear and consistent picture emerges of transportation patterns in the various cities.
Buses—both large buses and minibuses—are the most common mode of public transit in most cities, from a high of more than 70 percent of all trips in Dakar and Kigali to little more than 10 percent in Bamako and Ouagadougou. Except in Addis Ababa and Ouagadougou, minibuses are much more prevalent than large buses. Overall, about twice as many trips are taken by minibus than by large bus.
In Douala, Lagos, and Kampala, the use of mo-torcycles for commercial transport has grown very rapidly in recent years, mainly as a conse-quence of the poor state of the roads and the
inability of bus companies to meet growing de-mand. In Ouagadougou, and to a lesser extent in Bamako, the use of privately owned motorcycles has become extensive. Motorcycles are better able than larger vehicles to negotiate potholed
and broken surfaces. Initially, motorcycle ser-vices provided access from residential areas to main roads, where passengers would take a taxi or a bus. However, motorcycle services are now found on main roads, even in the city center.
Most of the motorcycles used for urban public transport have small engines (less than 100cc), and the drivers are not required to have a driver’s license. The drivers are often young and inexperienced. Accidents are common—and often fatal. Most operators of motorcycle taxis own their machines or buy them on hire pur-chase, which can normally be completed within a year. Motorcycle taxis have not taken over eve-rywhere, however. They are rare in Nairobi, for example, and almost unknown in Dakar.
Table 2.1 Shares of various modes of transport in use in 14 African cities
City Large bus Minibus Taxi Motorcycle Private car Walk Other
Abidjan 11 19 29 0 18 22 1
Accra 10 52 9 0 13 12 4
Addis Ababa 35 20 5 0 7 30 3
Bamako 1 10 5 56 19 — 9
Conakry 1 14 6 0 1 78 0
Dakar 3 73 6 6 11 — 1
Dar es Salaam 0 61 1 1 10 26 1
Douala 10 — 13 12 2 60 3
Kampala 0 41 — 20 35 — 4
Kigali 1 75 10 0 10 5 0
Kinshasa — — — — — High —
Lagos 10 75 5 5 5 High 0
Nairobi 7 29 15 2 — 47 0
Ouagadougou 8 0 — 58 14 — 20
Average 7 30 8 12 12 37 4
Sources: City authorities, published documents, various. Note: — = Not available. Rows may not total to 100 because of rounding

Stuck in traffic: urban transport in Africa
6
In comparison with Asian cities, the use of non-motorized vehicles (bicycles, rickshaws) is sur-prisingly low in African cities, as is the use of two-wheeled motorized vehicles, although the latter are increasingly common in the cities of West Africa.
The extent of walking as a mode of commuting (for those cities that have attempted to measure it) also varies enormously. In cities such as Conakry, Douala, and (anecdotally) Kinshasa, walking accounts for most urban trips (60–80 percent). By contrast, in Addis Ababa, Accra, and Abidjan, walking is estimated to account for only 10–30 percent of all urban trips.
Although small-scale suburban rail networks exist in Dakar, Kinshasa, Lagos, and Nairobi, none is believed to account for more than 2 per-cent of the market.
The remainder of this section focuses in greater detail on the two most common forms of urban transport in most cities: large buses and mini-buses. Minibuses can carry roughly 8 to 25 pas-sengers, although the same vehicle may have a different capacity in different jurisdictions, de-pending on the permitted load. These vehicles tend to have colloquial names, such as tro-tro in Accra, danfo in Lagos, gbaka in Abidjan, sotrama in Bamako, and matatu in Nairobi. Dala-dala, the term used in Dar es Salaam, is derived from dollar-dollar. In Addis Ababa, Kigali and Kam-pala, minibuses are referred to as taxis.
So-called midi-buses are a larger form of mini-bus, with a passenger capacity ranging from around 30 to about 50 (with standees), again depending on the load limits and seating rules in each jurisdiction. These vehicles, too, tend to have colloquial names, such as cars rapides in Dakar, and molue in Lagos.
Large buses carry 50 to 100 passengers, with many standees at the upper limits. Nearly all such buses have a single deck and two axles, al-though some double-decker buses are used in
Accra. Articulated (three-axle) buses are not found in any of the cities under review except for Abidjan. Semi-articulated trailer buses have been used in Kinshasa.
The decline of large buses
All 14 of our cities originally relied on a monop-oly supplier of large-bus service as the backbone of their urban transport system. In most cases the traditional bus companies were nationalized in the process of decolonization, ushering in a regulated regime of public transport in the im-mediate postcolonial era. Fares were regulated, and governments were often reluctant to in-crease them. Initially, the state-owned bus com-panies were able to operate without subsidy, but as deficits grew and public subsidies did not grow commensurately operators had difficulty maintaining and replacing their fleet. The result was deterioration in service coverage and quality. Most of the public companies eventually failed and went out of business. Many of the bankrupt-cies occurred during the 1990s, when structural-adjustment policies severely limited the avail-ability of public funds for subsidy.
Since the crisis of the 1990s, several approaches to large-bus service have been taken in the cities studied (table 2.2). Some cities (Accra, Dar Es Salaam, Kampala, Kigali, and Lagos) abandoned large-bus service altogether, and now rely exclu-sively on private, largely informal, minibus ser-vices. Accra, Kampala, and Lagos have attempted to revive large-bus operations, so far without success. In Kampala, the attempt failed due to competition and harassment from the minibus sector.
At the other extreme, Addis Ababa has managed to sustain its public large-bus company (An-bessa), owing to the continued willingness of the city government to subsidize the services pro-vided by this federal company in an atmosphere where fares have long been frozen. However, in

Market structure — The minibus revolution
7
recent years, even Anbessa has faced a financial squeeze, and smaller buses have taken over a
large share of the market.
In between, a wide range of private and public–private solutions have been adopted, primarily in the francophone countries of West Africa. Several variations are in evidence within this group, and some of the experiments are quite recent, making it too early to judge how success-ful they will be. Abidjan, Accra, and Ouagadou-gou have established mixed public–private en-terprises to operate large-bus services and con-tinue to finance deficits from fiscal resources. Dakar and Douala have moved to fully private
operations provided under concession agree-ments, with some degree of state support
(through subsidy in one case and exclusivity in the other). Bamako, Conakry, and Kinshasa have fully privatized large-bus service and have no subsidy obligations toward the operators.
Nairobi is the only city not to have passed through this cycle, having retained the private operation of its large-bus service since inde-pendence. However, the company has changed hands several times. After being sold to the Brit-ish operator Stagecoach in the early 1990s, it re-turned to local hands later in the decade and a second company was authorized.
Table 2.2 Large-bus operations in African 14 cities
City Large-bus operator Ownership Public support
Abidjan SOTRA 60 percent public, 40 percent private
Government covers deficits (subsidy per passenger for some categories)
Accra MMT Ltd 45 percent public, 55 percent private (including state-owned enterprises)
Government provides vehicle financing and operating loss
Addis Ababa Anbessa 100 percent public (federal) City government provides subsidy per passenger
Bamako 8 different operators All private None
Conakry Futur Transport a 100 percent private None
Dakar DDD Private concessionaire Government provides operating sub-sidy, donors help finance vehicles
Dar es Salaam None n/a n/a
Douala SOCATUR Private concessionaire Service exclusivity for five years
Kampala None n/a n/a
Kigali ONATRACOM b 100 percent public. n/a
Kinshasa STUC 100 percent private None, but India helps finance vehicles
Lagos None n/a n/a
Nairobi KBS City Hoppa
100 percent private None
Ouagadougou SOTRACO 15 percent public (Ouaga-dougou commune), 85 per-cent private
Government provides subsidy in the form of exemptions from taxes and duties
Sources: City authorities, published documents, various. Note: For details on each city, see annex. For full names of the large-bus operators, see the list of acronyms and abbreviations. n/a = not applicable. a. Very few buses b. Buses used mainly for inter-city transportation.

Stuck in traffic: urban transport in Africa
8
Although minibus fares are subsidized in none of the cities, large buses benefit from some form of public support in all cities that have large-bus service, with the exception of Nairobi. Generally this support takes the form of payments to cover operating losses or subsidized fares for specific classes of passengers, but public procurement of buses and restructuring of enterprise balance sheets are also widespread. In Accra, subsidy has not yet been formally authorized, but the minis-try of transportation advised parliament in July 2006 that it would be needed.
The emergence of minibuses
Beginning in the early 1990s, the urban transport market underwent a major transformation, with the private sector assuming a much greater role as operators of minibuses. The use of second-hand, imported minibuses has burgeoned in the last decade, expanding by 11 percent per year in some cities. In none of the cities studied in this report did this change result from a conscious decision to deregulate public transport. Rather, it was an indigenous response to growing de-mand and commercial opportunity. The mini-bus transport business operates in a regulatory vacuum.
Of the cities studied, only Douala and Ouaga-dougou do not offer some kind of minibus ser-vice. Cameroon’s government outlawed such services so as to favor the development of a new large-bus operator. In both cases, the vacuum created by the absence of minibus services is filled by shared taxis that operate on a similar model.
The name and other characteristics of minibus services vary by locality (table 2.3). The vehicles accommodate between 15 and 30 passengers. Services are almost invariably provided by the
informal sector characterized by highly dispersed ownership, with most individual entrepreneurs owning no more than one or two vehicles, which they generally rent out to drivers. Drivers keep the fares they collect but are responsible for pay-ing fuel costs, conductors’ wages, terminal fees, and other incidental expenses. Drivers face a strong incentive to carry full loads of passengers, as full loads maximize revenues while minimiz-ing variable costs (notably fuel).
Most vehicle owners are government officials, businessmen, or professionals for whom in-volvement in public transport provides a way to supplement income without incurring much, if any, tax liability. Some owners can exploit their position to protect their transport activities. This is true, for example, of police and army officers and officials of transport unions or associations. The latter also can ensure preferential route ac-cess for their vehicles.
With a vehicle in reasonable condition, and with a reliable driver, it is possible to realize a healthy regular cash flow. However when major repairs are required, it is not uncommon for owners not to reinvest. The sector is typified by short peri-ods of owner involvement, with few barriers to market entry or exit and high levels of turnover.
In a few cities, formal minibus operations on a larger scale coexist alongside the informal opera-tions just described. In Dakar, for example, of the estimated fleet of 3,000 cars rapides, 400 be-long to one formal operator and another 200 to a second. In Dar es Salaam, a public bus opera-tor operates a fleet of some 30 minibuses—a tiny share of the estimated 10,000 vehicles that ply the city’s streets. In Kinshasa, the private large-bus operator also maintains a fleet of some 30 minibuses, although once again this is a negligi-ble share of the 1,200 minibuses estimated to be in circulation in the city.
Market structure — The minibus revolution
9
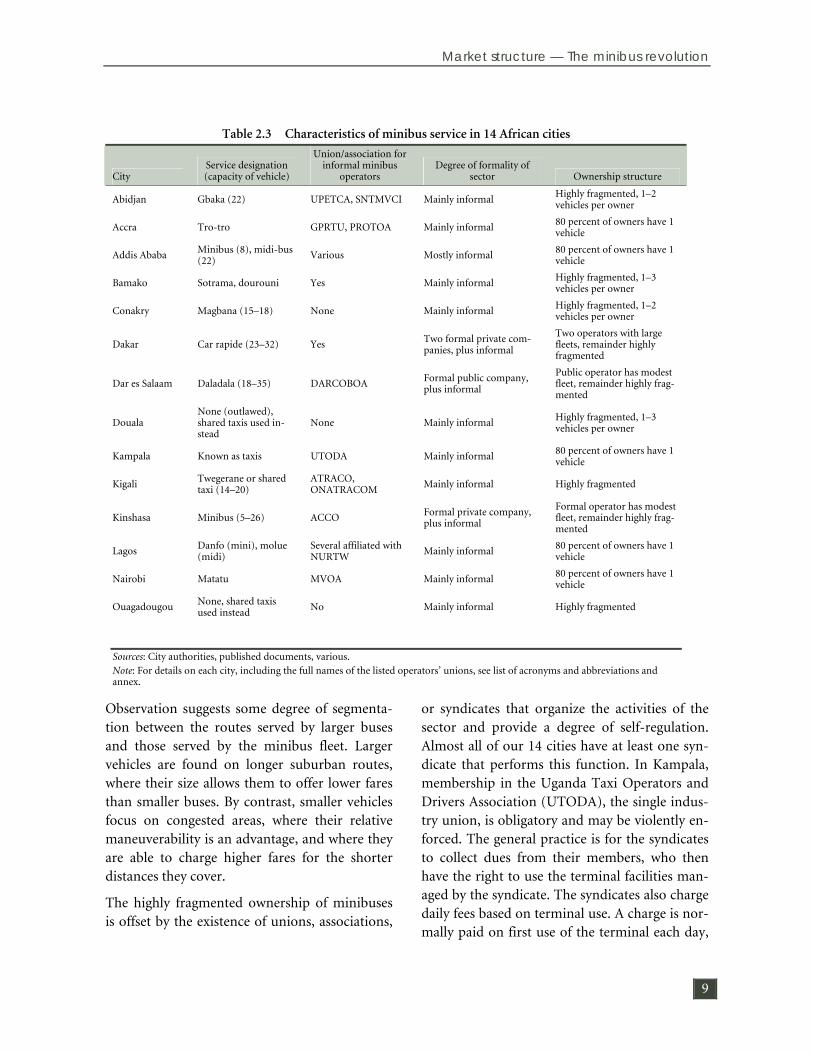
Observation suggests some degree of segmenta-tion between the routes served by larger buses and those served by the minibus fleet. Larger vehicles are found on longer suburban routes, where their size allows them to offer lower fares than smaller buses. By contrast, smaller vehicles focus on congested areas, where their relative maneuverability is an advantage, and where they are able to charge higher fares for the shorter distances they cover.
The highly fragmented ownership of minibuses is offset by the existence of unions, associations,
or syndicates that organize the activities of the sector and provide a degree of self-regulation. Almost all of our 14 cities have at least one syn-dicate that performs this function. In Kampala, membership in the Uganda Taxi Operators and Drivers Association (UTODA), the single indus-try union, is obligatory and may be violently en-forced. The general practice is for the syndicates to collect dues from their members, who then have the right to use the terminal facilities man-aged by the syndicate. The syndicates also charge daily fees based on terminal use. A charge is nor-mally paid on first use of the terminal each day,
Table 2.3 Characteristics of minibus service in 14 African cities
City Service designation (capacity of vehicle)
Union/association for informal minibus
operators Degree of formality of
sector Ownership structure
Abidjan Gbaka (22) UPETCA, SNTMVCI Mainly informal Highly fragmented, 1–2 vehicles per owner
Accra Tro-tro GPRTU, PROTOA Mainly informal 80 percent of owners have 1 vehicle
Addis Ababa Minibus (8), midi-bus (22)
Various Mostly informal 80 percent of owners have 1 vehicle
Bamako Sotrama, dourouni Yes Mainly informal Highly fragmented, 1–3 vehicles per owner
Conakry Magbana (15–18) None Mainly informal Highly fragmented, 1–2 vehicles per owner
Dakar Car rapide (23–32) Yes Two formal private com-panies, plus informal
Two operators with large fleets, remainder highly fragmented
Dar es Salaam Daladala (18–35) DARCOBOA Formal public company, plus informal
Public operator has modest fleet, remainder highly frag-mented
Douala None (outlawed), shared taxis used in-stead
None Mainly informal Highly fragmented, 1–3 vehicles per owner
Kampala Known as taxis UTODA Mainly informal 80 percent of owners have 1 vehicle
Kigali Twegerane or shared taxi (14–20)
ATRACO, ONATRACOM
Mainly informal Highly fragmented
Kinshasa Minibus (5–26) ACCO Formal private company, plus informal
Formal operator has modest fleet, remainder highly frag-mented
Lagos Danfo (mini), molue (midi)
Several affiliated with NURTW
Mainly informal 80 percent of owners have 1 vehicle
Nairobi Matatu MVOA Mainly informal 80 percent of owners have 1 vehicle
Ouagadougou None, shared taxis used instead
No Mainly informal Highly fragmented
Sources: City authorities, published documents, various. Note: For details on each city, including the full names of the listed operators’ unions, see list of acronyms and abbreviations and annex.

Stuck in traffic: urban transport in Africa
10
and this may then be supplemented by individ-ual departure charges, sometimes based on the number of passengers carried, and also by fur-ther charges at the destination terminal and at major stops along the line of route. Some syndi-cates play a role in regulating routes and setting fares.
In all of the cities, minibus operators also face indirect charges that affect their commercial vi-ability. Some of these charges represent petty extortion from enforcement agencies and local gangs preying on the sector.
The scale of all these charges is difficult to assess accurately, and the claims of the operators are often strongly challenged by the associations themselves. However typical daily charges per minibus appear to range from about $1.5 (in Accra) to $10 (in Kampala). Official association charges in Lagos are about $2 per day, but unof-ficial additional charges may double this. The associations do not declare to the tax authorities the revenues raised through these charges, which reportedly enrich association officials and sup-port grass-roots political processes.
The fragmented minibus operating industry, dominated as it is by individuals who do not own the vehicle they use, is difficult to tax. The problem has been tackled in both Accra and Ad-dis Ababa, however, where authorities have es-timated the gross revenues that might be earned from operating various types of vehicle, as well as the likely profit margin. Income tax is assessed on that margin. For example, in Addis Ababa the owner of a minibus taxi that is less than 15 years old is presumed to earn annual revenues of 25,000 birr ($2,628), of which 6,620 birr ($695) is estimated as profit. The owner is taxed 482 birr ($56) on that profit.
Corporate large-bus undertakings are subject to the normal range of business taxation but usu-ally receive some relief through investment in-centives such as accelerated depreciation allow-
ances. Indirect taxes, such as duties on fuel and imported spare parts, can be very significant. The large-bus operator in Nairobi once calcu-lated that 24 percent of its costs were payments to government in one form or another. Unfor-tunately any relief from such indirect taxes tends to leak into the wider economy, and so ends up being poorly targeted. For example, lower duties on spare parts for agricultural equipment in Kenya resulted in tractor distributors marketing common components to the wider transport sector.
The competitive advantages—and public disadvantages—of minibuses
Minibuses have become the dominant mode of public transport in many African cities for a va-riety of reasons, some of which were touched on above. But they are far from an unalloyed good—in fact, they present clear disadvantages from the perspective of the public interest. Be-low we explore in greater detail why minibuses have caught on—and why their ubiquity may not always be entirely salutary.
Advantages
The advantages of minibuses are their agility, ease of acquisition, viability without subsidies, and flexibility of fares and schedules.
Agility. Many African cities are both congested and far-flung, with many residents living long distances from where they work. Streets are nar-row and in poor repair. The key advantage of small vehicles is their speed, their operability on narrow and congested streets, and their ability to make a profit serving outlying areas with low passenger density.
Ease of acquisition. Most minibuses used for public transport are purchased second-hand us-ing personal savings, interest-free loans from family and friends, and earnings from opera-

Market structure — The minibus revolution
11
tions. Bank finance is rarely used, as banks are reluctant to accept used vehicles and uncertain revenue streams as security.
Viability without subsidies. Large buses have not been able to realize their potential economies of scale in African cities because fares have been held down as a matter of policy to keep transit affordable for low-income residents, because of poor road conditions, and, in some cities, be-cause of restrictions on standing passengers. Mini- and midi-bus fares, by contrast, are less closely regulated, allowing the smaller buses to operate without reliance on unpredictable gov-ernment support. The low cost of labor in Afri-can cities further attenuates the cost advantage of large vehicles.
Changeable fares, routes, and schedules. In an un-regulated environment, small-bus operators maximize revenue by adjusting fares to reflect what the market will bear, while also adjusting their routes and schedules to serve high-demand corridors and operate with full loads at all times of day. Although frequent route changes can be disorienting for transit users, and unscheduled stops can pose traffic hazards, the ability of the informal sector to rapidly respond to changes in demand has contributed to the economic viabil-ity of small-bus service.
Disadvantages
Minibuses also have disadvantages, many of which are related to their advantages. Some of the most serious disadvantages are non-economic, making them candidates for regula-tion, as they are unlikely to be cured by the op-eration of market forces alone.
Road congestion. Minibuses now account for al-most 50 percent of all motorized traffic on some corridors. Their proliferation has produced se-vere congestion, particularly during peak peri-ods.
Safety and emissions. In Accra in 2004 minibuses accounted for the majority of traffic violations and 22 percent of accidents. Because small buses form a high proportion of total road traffic, their environmental performance is important. But fragmented ownership of small vehicles in an unregulated environment makes it difficult to enforce standards. Vehicles are old, inadequately maintained, and operated for long hours at low speed.
Unpredictability concerning routes, schedules, and fares. Minibus operators increase fares as de-mand rises and change routes at will. The flexi-bility to do so has contributed to their economic success, but at a cost to passengers in terms of affordability and predictability. Operators’ syn-dicates enforce a form of discipline related to the assignment of routes and the regulation of fares and schedules. Because the syndicates represent owners, their regulatory efforts tend to be skewed in favor of operators rather than the pas-sengers.
Poor maintenance practices. Spotty enforcement of regulations on vehicle inspection, driver be-havior, and traffic management affects all public transport services. Because small vehicles are so numerous, failures of enforcement have particu-larly great impact. Some small private operators appear to practice the rudiments of planned pre-ventive maintenance, but the common practice in all African cities is unplanned corrective re-pair only to address problems that keep the vehi-cle from plying its routes. The result is low levels of safety, reliability, and availability.
Perverse incentives. Because drivers must pay a fee each time they leave the terminal, and be-cause they have an incentive to avoid operating with less than a full load, vehicles wait at the terminal until they are fully loaded. This means that passengers wishing to board at other stops along the route often cannot do so. Many walk

Stuck in traffic: urban transport in Africa
12
long distances to the terminal so as to be assured of a seat on the bus.
Comfort. The small size of minibuses makes pas-senger access and internal movement difficult. Seating is cramped.
The bottom line
The opportunity to offer minibus services has brought private operators into the urban trans-port sector and compensated for the failure of governments to meet demand. Those are good things. But ultimately minibuses are not the most suitable means of urban mass transit, par-
ticularly on main corridors or for long distance trips. Large buses (and light rail, where feasible) offer the potential for greater comfort, safety, predictability, and speed, provided they can be managed efficiently and sustainably. They also hold out the promise of relieving the growing congestion of African cities. To exploit their po-tential, however, African cities must ameliorate the condition of their streets and roads, greatly improve traffic-management practices, and en-sure the economic viability of large-vehicle ser-vices through cost recovery, either through the fare box or through predictable subsidies.

13
3. Institutional and regulatory framework—self-regulation by default
n most of our 14 cities, many institutions—federal, state, and local—have a hand in the urban transport sector. Some plan, others regulate, and still others issue licenses, allo-
cate resources, or monitor and enforce compli-ance. Some perform several functions, and often their jurisdiction overlaps with that of other in-stitutions. Institutional weakness—and confu-sion—lies at the heart of the growing transport problems in Africa’s cities. According to the World Bank (2002):
Institutional weaknesses are the source of many observed failures in urban transport in developing countries. At the municipal level, institutional structures for transport are weak and inadequately staffed. The need to integrate policies both within the transport sector and between transport and other as-pects of urban development calls for the de-velopment of institutions that minimize ju-risdictional and functional impediments to policy integration and allow for extension of the role of the private sector within an inte-grated strategy.
The same report goes on to say that “cities that have failed to find acceptable institutional mechanisms have also frequently failed to ad-dress the problems of increasing road conges-tion, environmental deterioration, and the de-cline of public transport.”
Institutional overlap
What can be said of the transport-related institu-tions in the cities under study? Several factors stand out. First, jurisdiction over urban trans-portation issues extends over multiple tiers of
government, creating the sort of jurisdictional impediments to integration flagged earlier by the World Bank. Many functions are carried out at the national level. Others have been devolved to local government, although the institutional and financial capacity required to execute those func-tions is often lacking, sometimes simply because agencies are inadequately staffed. The institu-tional mapping presented in table 3.1 reveals that central governments still dominate urban transport, although in some cities a patchwork of central and local government agencies share responsibility for some functions. When overlapping responsibilities lie with mul-tiple institutions the result is duplication of ef-fort, poor accountability, lack of coordination, and diffusion of commitment at all levels toward the implementation of transport strategies that serve people’s needs.
The matter of urban roads is particularly com-plex. Typically legislation pertaining to roads is separate from that governing transport services, and several national and local bodies often share jurisdiction. In Conakry, for example, several institutions have responsibility for segments of the road network. In Accra, responsibility for urban transport has been devolved from central to local government—at least in principle. How-ever, local governments have neither the re-sources nor the technical know-how to carry out the functions assigned to them. This means that the Ministry of Transportation (through the De
I

Stuck in traffic: urban transport in Africa
14
Table 3.1 Institutions with responsibility for public transport in 14 African cities
City Entity responsible for urban
planning
Entity responsible for transport planning
(if different)
Entity responsible for building and maintain-
ing urban roads (if different)
Independent transport authority
Abidjan Central government Agence de Gestion des Transports Urbains (central)
Agence des Routes (cen-tral) and municipalities (feeders)
Agence de Gestion des Transports Urbains
Accra
Town and Country Planning Department, Ministry of Local Government, Rural Develop-ment and Environment
Ministry of Transpor-tation (central)
Ibid. None
Addis Ababa Ministry of Works and Urban Development (central)
Ministry of Transport and Communications (central)
Addis Ababa City Roads Authority None
Bamako Direction de la régulation et du contrôle du transport ur-bain (municipal)
Direction nationale des transports terres-tres et fluviaux (na-tional)
Direction nationale des routes (District of Ba-mako)
None
Conakry National Land Transport Directorate
Ministry of Transpor-tation
Central government (trunk); city govern-ment (feeders)
None
Dakar n/a Conseil Exécutif des Transports Urbains de Dakar (central)
Ibid. Conseil Exécutif des Transports Urbains de Dakar
Dar es Salaam Ministry of Land, Housing and Settlement Development (central)
Ministry of Infra-structure Develop-ment, urban councils, Surface and Marine Transport Regulatory Authority, Dar es Salaam Rapid Transit
Ministry of Infrastruc-ture Development, Tan-zania Roads, munici-palities
Surface and Marine Transport Regulatory Authority
Douala Urban Community of Douala Ministry of Transpor-tation
Ministry of Works, Ur-ban Community of Douala, city govern-ments
None
Kampala n/a n/a Uganda Taxi Operators and Drivers Association
None
Kigali
Ministry of Infrastructure (city of Kigali), Office Na-tional de transport en com-mun (district)
Ibid. Ministry of Infrastruc-ture
None
Kinshasa Ministry of Planning Ministry of Transpor-tation
Ministry of Public Works and Infrastruc-ture (municipal)
None
Lagos Ministry of Local Government Lagos Metropolitan Area Transport Agency
Ministry of Public Works
Lagos Metropolitan Area Transport Agency
Nairobi Local government Ministry of Transport Ministry of Public Works and local gov-ernments
None
Ouagadougou Ministry of Transportation (central); commune of Oua-gadougou
Ministry of Infra-structure Ibid. None
Sources: City authorities, published documents, various. Note: For details on each city, see annex. n/a = not applicable.

Institutional and regulatory framework
15
partment of Urban Roads) is effectively respon-sible for road maintenance and development.
The second salient characteristic of transport-related institutions in the cities under study is the institutional separation, in most of the cities under study, between urban planning, construc-tion and maintenance of infrastructure, and the organization of transport services.
Effective urban public transportation requires simultaneous and integrated management of all three matters. Why? Because urbanization pat-terns and land use drive demand for transport services while also shaping the context within which roads are built and passenger services cre-ated to meet that demands.
The institutional mapping in table 3.1 reveals that these three primary functions are seldom housed in the same institution. Even where all remain at the central government level, several different ministries are usually involved.
One consequence of this institutional arrange-ment has been the development of road infra-structure for the purpose of improving the flow of (mostly private) vehicles rather than of people. Insofar as the vehicles used for public transport represent a significant share of traffic, passengers have benefited from road development. How-ever little emphasis has been placed, within the road network on public transport priorities. Lit-tle effort has been made, for example, to create dedicated infrastructure for bus transit that would favor collective over private transport. Where measures favoring bus travel have been introduced, they have not been properly en-forced.
The third issue is the rarity of autonomous agen-cies having overarching responsibility for urban transport. Only a handful of African cities have
established agencies of this kind. Those in our sample are Abidjan (AGETU), Bamako (DRCTU), Dakar (CETUD), and Lagos (LAMATA), but even these lack the necessary executive powers to implement their vision and must work through other agencies of govern-ment and only LAMATA covers road infrastruc-ture above initial planning. In Addis Ababa, a city-wide transport authority does exist, but it is not autonomous with respect to the city gov-ernment. In Dar es Salaam a multisectoral regu-latory agency, the Surface and Marine Transport Regulatory Authority (SUMATRA), was estab-lished in 2001 to regulate rail, road, and mari-time transport services.
A regulatory vacuum
The regulatory framework for urban transport typically comprises several elements, in addition to planning. The first is controlling entry into the market by new operators, and allocating routes to market participants. The second is li-censing vehicles and drivers and establishing procedures for vehicle inspection. The third is-sue relates to passenger fares and tariff struc-tures, and to the subsidies needed to cover fi-nancial shortfalls.
The 14 cities surveyed generally have very light-handed regulatory frameworks (table 3.2). Syn-dicates of transport operators enjoy a large de-gree of autonomy and a wide ambit for self-regulation. Even where regulations do exist, their application and enforcement are seldom very strict. The main dimensions of the regulatory framework are reviewed in the paragraphs that follow.

Stuck in traffic: urban transport in Africa
16
Route allocation and market entry
A permit is required to operate commercial buses in all 14 cities. The precondition for the permit is a roadworthy vehicle and a qualified driver. In each of the cities, the license makes provision for the allocation of the vehicle to a specified route, but this is rarely applied or en-forced (except in Nairobi following sectoral re-
forms). In practice, operating permits are valid throughout the jurisdiction of the issuing au-thority and are recognized by adjoining jurisdic-tions within metropolitan areas. Operating per-mits are routinely issued on request, without consideration of the demand-supply balance in the locality or of their impact on other operators.
Table 3.2 Regulatory framework
City System for allocating routes to operators
Legal restrictions on entry of buses to the
market Entity responsible for
licensing vehicles Entity responsible for
vehicle inspection
Abidjan Existing concessions for large bus opera-tions
Yes for large buses Agence de Gestion des Transports Ur-bains
SICTA (private con-cessions)
Accra None None Local authority None
Addis Ababa Transport authority None Department of Trade and Industry
Federal Transit Au-thority
Bamako District and munici-pality
None Direction Nationale des Transports Ter-restres et Fluviaux
Yes
Conakry None None Ministry of Trans-portation
None
Dakar Ministry of Trans-portation None
Ministry of Trans-portation
Conseil Exécutif des Transports Urbains de Dakar
Dar es Salaam Surface and Marine Transport Regulatory Authority
None Surface and Marine Transport Regulatory Authority
Ministry of Public Safety and Security (traffic police)
Douala
Comité d’Organisation et de Suivi des Transports Urbains
Yes n/a None
Kampala None None Licensing board None
Kigali None None Rwanda Utilities Regulatory Agency (regulator)
Office National des Transports en Com-mun
Kinshasa None None n/a None
Lagos None None Motor Vehicle Ad-ministration
Lagos Metropolitan Area Transport Au-thority
Nairobi Transport Licensing Board
None Transport Licensing Board
None
Ouagadougou None None Direction Générale des Transports Ter-restres et Maritimes
None
Sources: City authorities, published documents, various. Note: For details on each city, see annex. n/a = not applicable

Institutional and regulatory framework
17
Allocating routes during the permitting process makes sense only if the issuing authority has a good understanding of the shape of the transport network as it is currently operating and of the changes needed to make the network more re-sponsive to passenger demand. The necessary understanding is lacking in the cities under study. Unfortunately, though, the lack of a route licensing system makes it very difficult to confer exclusive operating rights on specified routes through a tender process, and hence to develop such a network.
In practice, operators’ associations control the urban transport market through self-regulation. The system has evolved as an industry response to the vacuum left by the failure of government to regulate the sector. Self-regulation has created an orderly market that avoids the worst conse-quences of unbridled competition on the routes. Route terminals are well managed, within the constraints of their infrastructure, and overload-ing and fare gouging are largely avoided. Disci-plinary action is taken against members who flout the rules.
But union control of the sector comes at a cost. The chief drawback is the rigidity of the route network, which, being operated between termi-nals controlled by the unions, generally fails to match transport supply to passenger demand. The “terminal constraint” means that too many passenger trips involve one or more bus changes, thus causing delays and raising the cost of travel. Moreover, the point at which passengers alight is often some distance from the desired destina-tion, particularly in the central business district.
The position in the francophone cities of West Africa is complex. The large-bus services in Abidjan, Dakar and Douala are, in principle, tightly regulated, with the Ministry of Transport allocating routes to a monopoly supplier that collects specified fares. However, most public transport is provided not by the large-bus com-panies but by the informal sector, which is much
more difficult to regulate. In Douala, a transport monitoring commission (Comité d’organisation et de suivi des transports urbains) operates in each municipality, with members representing each of the relevant ministries and the operators. But decisions on the route structure, licensing, and fares are made by the ministries of transport and finance in Yaoundé. In Dakar, in principle, the Ministry of Transport controls route licensing, partly to protect the new bus company, Dakar Dem Dik (DDD), from competition from cars rapides. In practice, however, government-granted route monopolies have not protected DDD. Effective allocation of routes to operators appears, in effect, to be controlled by the opera-tors’ syndicate. In Abidjan, SOTRA operates un-der the technical supervision of the Ministry of Transport and the financial supervision of the Ministry of Economy and Finance. It has a mo-nopoly to operate public transport service in a defined territory within the city of Abidjan.
On the eastern side of the continent are the two cities that apply the most extensive regulatory controls to market entry in our sample. In Nai-robi, every private operator must apply to the Transport Licensing Board. A short-term license is granted immediately, while the operator’s ap-plication for a longer-term license is pending. The board’s licensing decisions are published. In Addis Ababa, the Transport Authority already has the power to issue route licenses, but it in-tends to develop a devolved licensing process that passes some responsibility down to the op-erators’ associations. In Dar es Salaam, a branch of the government determines the dala-dala routes.
Licensing of vehicles and operators
Commercial vehicles that will carry passengers must be registered and licensed for the purpose in all of the cities reviewed. Vehicles are in-spected for roadworthiness at the time of regis-tration. Inspections are repeated annually or

Stuck in traffic: urban transport in Africa
18
semi-annually thereafter. They must comply with technical conditions laid down in relevant legislative instruments, but the specifications are often outdated and fail to cover environmental issues in any meaningful manner.
The enforcement regime in all 14 cities lacks the institutional capacity and integrity needed for effective control of vehicle condition. In Lagos, our survey revealed that 37 percent of vehicles were operating without a valid certificate of roadworthiness, and 47 percent without a valid test certificate. In Addis Ababa and Accra, be-tween 30 and 50 percent were being operated by an unlicensed driver. However, in both Abidjan (SOTRA) and Kinshasa (STUC) buses undergo regular technical check-ups by professional me-chanics in dedicated garages. Bus drivers and conductors are professionally trained. In the case of STUC, Tata buses benefit from technical assis-tance from Tata Motors Ltd.
Until recently, Accra had only four vehicle in-spectors (whose duties also covered accident in-vestigation); even now there are just 14, still not enough. In Nairobi it was reported to be easier to obtain a forged certificate of roadworthiness for an unsafe vehicle than to submit for official inspection a vehicle in good condition. In each of the cities we surveyed, passengers had nick-names for unsafe vehicles, such as “a DMC” (for dangerous mechanical condition).
Lagos has attempted to circumvent the failure of the traditional inspection regime by introducing a new test for vehicles that are more than five years old. The tests are carried out at private test-ing stations licensed for the purpose, but the scheme has failed to raise standards of integrity. Both Addis Ababa and Kampala are now seeking to privatize their vehicle inspection regimes.
In Accra, all vehicles intended for commercial passenger transport must be registered as such, either when first imported, when converted for passenger carriage, or when resold by an existing operator. At that time the vehicle must be tested
for roadworthiness by the Driver and Vehicle Licensing Authority and then retested every six months thereafter, twice the frequency required for private vehicles. The effectiveness of the test-ing regime is limited, however, by the institu-tional and technical capacity of the test centers. Driver testing is another responsibility of the Driver and Vehicle Licensing Authority, but doubts about the quality of the test regime are widespread. The law makes no requirements of the owners of commercial passenger vehicles—only the driver and the vehicle itself.
In fact, the licensing regime in every city we studied emphasizes the vehicle, rather than its operator. The vehicle owner has some obliga-tions in some cities. Licensing of operators is strongest in the large-bus sector, where the mechanism most commonly used is a franchise covering the entire metropolitan area.
Weak or nonexistent operator-licensing regimes make it difficult to influence the behavior of transport operators and to raise their standards in the public interest. A stronger regime would require operators to maintain their vehicles in roadworthy condition and to enforce the re-quirement through inspections, tests, and sanc-tions. No such system is in place in any of the cities studied.
All the cities have formal requirements for regu-lar semi-annual or annual checks of public transport vehicles. However, even casual obser-vation reveals that many vehicles are in very poor, and possibly dangerous, condition. Part of the problem appears to be insufficient capacity to carry out the required inspections, abetted by a casual attitude toward the inspection process. Formal maintenance is practiced on the large-bus fleets, but even here the balance between maintenance and repair tends to be suboptimal, resulting in low levels of availability even in rela-tively young fleets, such as the 83 percent figure reported for the core fleet in Addis Ababa. There is also a low level of availability in Accra, but this

Institutional and regulatory framework
19
is affected by a lack of technical support and spare-parts availability for the new Chinese buses.
Some small private operators in all 14 cities ap-pear to practice the rudiments of preventive maintenance, but we found wide variation in the intervals at which engine oil and filters were changed. The more common practice is un-planned, corrective repair only when absolutely necessary to keep the vehicle on the road. The results of this practice are low levels of availabil-ity and poor technical condition. Most repairs are on the side of the road or in basic workshops using hand tools and no specialized equipment.
Such careless maintenance practices are sustain-able only because of the low levels of capital in-vested in the vehicles, and because of the laxity and corruption found in vehicle inspection re-gimes. In some cities, as noted earlier, it is re-portedly easier and cheaper to obtain a forged certificate of roadworthiness than to pass a test with a vehicle in good condition. This weakness is gradually being recognized, with reforms initi-ated in Addis Ababa and planned in Kampala, where vehicle inspections are being privatized.
Licensing of drivers
All cities require that drivers of commercial pas-senger vehicles pass a test and obtain a special license. In most cities the drivers of large vehicles must be more mature and demonstrate higher qualifications, whereas the drivers of minibuses need be no more qualified than drivers of private cars.
As with vehicle inspections, the regimes for driver training and testing are relatively weak. Most driving schools and testing stations lack a full-size bus for use in training and testing. Some of the 14 cities now recognize that their driver licensing systems are not secure and that it is possible to obtain fraudulent documents or alter
those legitimately issued. Addis Ababa is now introducing a secure system. It will be interesting to see whether it proves robust.
Enforcement problems are widespread in most cities. A survey in Lagos showed that 21 percent of drivers interviewed acknowledged that they did not hold a valid driver’s license. It would appear that such drivers regard the lack of a li-cense as just one of the multiple transgressions they commit each day, for which they pay petty bribes to police officers.
Poor driving standards are prevalent in all cities in this study. Almost 50 percent of the operators we interviewed identified poor discipline among drivers as a serious business problem. Bad be-havior, especially in the vicinity of passenger pick-up points and around interchanges, lowers service standards while also adding to traffic congestion. Competition between vehicles oper-ating on common routes provides incentives for drivers to block stops and to drive aggressively to be the first to reach a stop. Vehicles often stop in the roadway to allow passengers to board. It is quite common for such behavior to block several lanes of traffic.
Interviews with the police indicate a general lack of concern about drivers’ hours in urban opera-tion, in that the excess of supply in off-peak pe-riods provides long breaks for drivers. However, spread over a very long working day, drivers’ total driving time can still be excessive from a safety perspective. In Kenya and Uganda, drivers work very long hours, with shifts averaging more than 12 hours a day, usually for six or seven days a week, although driving hours are normally nearer 7 or 8 hours. In West Africa it appears that crew conditions are less stressful. The cars rapides normally have two drivers, both working eight-hour shifts, as well as a conductor and a route assistant.

Stuck in traffic: urban transport in Africa
20
Fare control
Few commonalities in fare structures can be identified across the 14 cities, although elements of both flat fares and distance-related tariffs are found in most cases. A set fare typically applies to each route, with fares higher on longer routes. The West and East African cities have adopted rather different approaches to the control of fares. In East Africa, minibus operators are per-mitted to determine their own fares. In West Africa, fares for buses, minibuses, and shared taxis (in Cameroon) are, in principle, controlled by the government. In Dar es Salaam routes are allocated by the regulator (SUMATRA) and fares regulated through negotiations with the bus op-erators’ association. In Ouagadougou, however, bus fares are determined by the Société de Trans-port en Commun (SOTRACO).
On both sides of the continent, fares for large buses operated by public companies are, as a matter of policy, kept lower than those for mini-buses. Even private large-bus operators are pres-sured to keep fares low. The policy-influenced fares charged by the large-bus services are often too low to permit long-term maintenance and replacement of the fleet. As a result the quality and coverage of these services has fallen catas-trophically—in no case have public subsidies been large enough, or regular enough, even to cover operating deficits, let alone to provide for capital improvements.
The nominal justification for a subsidy is to keep public transport affordable for low-income pas-sengers. This is a very expensive undertaking, however, both because the opportunity cost of the funds is very high in a developing country and because the support is poorly targeted, de-priving the system of a great deal of revenue that would have been willingly paid. The cost of the subsidy tends to become unsustainable over time, leading governments to reduce, delay, or eliminate it, with predictable disruptive effects
on the company. The deterioration in frequency and quality of service, meanwhile, hurts low-income passengers the most, as they tend to have fewer alternatives. This cycle matured recently in both Dakar and Douala, as it had earlier in Ac-cra, Addis Ababa, Kampala, and Lagos. In all these cases subsidies were paid from the public purse and were not a resource transfer from within the transport sector or a cross-subsidy from other transport users.
The combination of fares and subsidies should generate enough revenue to finance, from one year to the next, the desired quantity and quality of bus service. In this respect, transport opera-tions must be viewed as a commercial enterprise, with the state reimbursing the enterprise for dis-counts offered to specific sets of customers. The failure of governments to provide promised sub-sidies has led, time after time, to deterioration in services—first in quantity (inability to finance fleet renewal) and soon thereafter in quality (re-duced maintenance) (Gwilliam 2000).
The use of subsidies as a budget-balancing mechanism can also lead to inefficiency in the organization that receives the subsidy, as well as graft in the process of procuring buses. The large-bus operator in Addis Ababa can achieve only 83 percent fleet availability with buses aver-aging five years in age and of demonstrated qual-ity. The short-lived publicly owned operator in Nairobi was unable to compete commercially despite its access to duty-free inputs and donated rolling stock. The operator in Accra reports a 40 percent “leakage” of revenues, indicating that the main beneficiaries of subsidies in this case are the operator’s employees. At the same time, Ac-cra’s buses have not been subjected to any for-mal specification or a transparent procurement process, without which they are unlikely to offer the lowest possible cost of operation over their life cycle. The latest public procurement in Lagos is reported to have increased the cost of the cho-sen vehicle by 60 percent over the price that pri-

Institutional and regulatory framework
21
vate operators would expect to pay. In Addis Ababa (and before in francophone Africa), bilat-eral concessional aid has financed the importa-tion of buses built in Europe, such that the main beneficiary is actually the European builder and not the local bus system.
Where fare controls have been retained, they are often set at wholly unrealistic levels. In Addis Ababa, for example, fares for large buses are still officially set at 1992 levels; in Abidjan they have not been adjusted since 1994. In practice, despite the availability of subsidies, the operator has had no choice but to stretch the rules and introduce new, unregulated routes.
In Accra large-bus fares are below the level needed for full recovery of operating costs over the life cycle of the buses. The operator, MMT, is now under severe cash flow constraints and will soon require subsidies. In Addis Ababa, the sub-
sidy is paid by the city government, even though Anbessa is federally owned. The government of Senegal has accepted that the large-bus services provided by DDD in Dakar can operate at the regulated fare only if the company is subsidized. In Douala, there is a tradition of subsidizing fares on large buses, or restructuring operators when they can no longer sustain losses. In Abid-jan, SOTRA receives an annual subsidy that al-lows it to offer reduced fares to civil servants, the military, and students. In Ouagadougou, the government subsidizes SOTRACO by exempting it from tax and duty on fuel, tires, and other im-ports.
In addition to direct operating subsidies, support sometimes comes in the form of concessional terms or soft loans to finance the acquisition of buses (Accra, Addis Ababa, Dakar, Douala, La-gos).
Table 3.3 Fare-setting procedures
City
Fares regulated for large buses and
minibuses? Entity responsible for regulating fares
Year of most recent fare adjustment
Operating subsidy for
large-bus op-erators
Abidjan Yes Agence de Gestion des Transports Urbains 1994 Yes
Accra Yes Ministry of Transportation 2004 Yes
Addis Ababa Large buses only City government 1992 Yes
Bamako Large buses only Operators/government 2006 No
Conakry Yes Direction Nationale des Transports Terres-tres, operators’ syndicates
2006 No
Dakar Yes Ministry of Finance 2000 Yes
Dar es Salaam Yes
Dar Commuter Bus Owners Association, Surface and Marine Transport Regulatory Authority, operators
2006 n/a
Douala n/a Ministry of Finance n/a Yes
Kampala Yes Uganda Taxi Operators and Drivers Asso-ciation
n/a n/a
Kigali Yes Rwanda Utilities Regulatory Agency 2004 n/a
Kinshasa Publicly owned buses only
Operators/government. 2006 No
Lagos Yes (informally) Bus association 2005 n/a
Nairobi Yes Private bus association n/a
Ouagadougou Yes Direction Générale des Transports Terres-tres et Maritimes
2006 Yes
Sources: City authorities, published documents, various. Note: For details on each city, see annex. n/a = not applicable, because no large-bus operator exists. n/a = not applicable.

Stuck in traffic: urban transport in Africa
22
No subsidies are paid in Nairobi, where KBS is now free to set its own fares.
It has proved more difficult to control fares in the informal sector, where fares fluctuate with demand. Economic reforms in many of the cities have led to official deregulation of minibus fares, but in practice some degree of administrative control has been retained in places. Earlier at-tempts to impose price controls on the informal sector had the unintended consequence of lead-ing to route proliferation in the minibus sector. When unrealistically low limits have been set on fares, operators respond by breaking up routes into shorter segments so that they can still earn a return. This practice is particularly prevalent at peak hours, when the minibuses are price setters, though it is less common off peak, when they are price takers.
In all cities in this study, the length of some fare stages, especially for private sector operations, has been shortened as operators break down longer routes so as to charge multiple fares. This practice not only increases the cost of travel but also adds to travel time. For instance, the official fare for a typical trip from Dakar to Pikine is 110 CFA francs ($0.26) but travelers often pay more than 200 CFA francs ($0.48) because the trip is divided into three segments, requiring the pas-senger to pay three fares and to change vehicles twice. In Addis Ababa, similarly, although 1 birr is the stipulated fare for a trip of 5 km, passen-gers routinely end up paying 1.5 birr ($ 0.17) or more.
In all cities except Addis Ababa and Nairobi, de-spite there being a nominal fare for each route, passengers complain that fares tend to rise whenever circumstances, such as bad weather or congestion, cause temporary spikes in the ratio of demand over supply. While this might appear
to be opportunistic behavior by operators, it must be recognized that drivers are simply re-sponding to incentives. A failure to raise fares at such times would affect drivers’ earnings, par-ticularly given that most drivers pay a fixed daily charge to rent the vehicle.
In Nairobi, fares escalated steeply after reforms that had the effect of significantly reducing sys-tem capacity. Among the reforms were a ban on standing passengers on large buses and tighter control of overloading of smaller vehicles. The resulting fare escalation nearly resulted in the reimposition of fare controls, but enough new vehicles were drawn to the market by the higher fares that the increases became self-limiting.
In Kampala and Nairobi, transport operators are permitted to determine their own fares. How-ever, there is some evidence that the operators’ associations have significant influence on the fares charged, particularly in Kampala, where UTODA has drawn up indicative fares for all routes. Despite this, the operators have consider-able latitude in what they charge, and fares vary by time of day and season of the year. In Accra the dominant operators’ association negotiates fare increases with the Ministry of Transporta-tion in response to hikes in input costs (notably fuel). It has taken unilateral action when nego-tiations failed to produce a satisfactory outcome.
In Douala, Bamako, Kigali, Conakry, Dar es Sa-laam and Dakar, fares for minibuses and shared taxis (in Cameroon) are, in principle, controlled by the government. The set fare is charged for boarding at the departure terminal and for much of the route length, but a lower fare may apply when boarding close to the arrival terminal. Pas-sengers alighting before the arrival terminal are unlikely to receive a rebate on the fare paid, though this is reported in some cases.

23
4. Infrastructure—roads and fleet
any African cities—and all those in our sample—have expanded faster than the capacity of governments to cope with the growing need for infra-
structure, resulting in incomplete and uncon-nected road networks. Housing has been erected in a largely unplanned and ad hoc manner, without adequate provision for transport and other infrastructure; low density makes it diffi-cult for public transport services to serve result-ing demand. In low-income areas, dirt roads are still the norm, and poor drainage contributes to serious flooding during the rainy season. The poor state of roads has limited urban transport options and taken its toll on transit fleets.
Urban roads
In African cities, the condition of roads, both paved and unpaved, contributes to congestion, reducing the speed, profitability, and useful life of public transport vehicles. The coverage of the paved network, in particular, limits the reach of bus services. In the cities studied in this report, as elsewhere in Africa, many outlying neighbor-hoods can be reached only by two-wheeled vehi-cles.
On average, only a third of the roads in the sam-ple cities are paved (table 4.1). The range is wide: from barely 10 percent in Kinshasa and Kigali to more than 70 percent in Kampala. Paved road density is typically on the order of 300 meters per thousand inhabitants (or close to two kilo-meters per square kilometer). According to the UN Millennium Cities Database, these values are at the extreme lower end of developing cities worldwide, for which the average is close to 1,000 meters per thousand inhabitants. Again,
the range is wide. Dakar has 467 meters of paved road per thousand inhabitants; at the other ex-treme, Kinshasa has just 63 meters, barely half that of the next-worst city (Dar es Salaam). Overall, the road network constitutes less than 7 percent of the land area in most of our cities, compared with 25–30 percent in developed cit-ies.
The road network in all cities is substandard. The capacity is limited, service lanes are absent, pavement is deteriorating, and street lighting is minimal. Because traffic management is limited in scope and extent, accidents are frequent. Pe-destrians account for two-thirds of fatalities. The majority of the roads have one lane in each di-rection; where the roads are wider, one lane is often taken up by pedestrians and parked vehi-cles. Intersections are spaced closely together and are ill-designed for turning.
Most roads were laid when the cities had but a single center, and before the rapid growth in per-sonalized forms of motorized transport. The primary road network radiates from the center city to surrounding areas; orbital or circumfer-ential links are missing. Most passengers making an orbital journey must change vehicles, thereby adding to travel time and expense.
Beyond these general failures, little attention has been paid to other matters that facilitate the op-eration of public transport systems. Dedicated bus lanes, to speed the flow of public transport, are rare, or absent altogether. Bus stops, bus shelters, and other facilities for passengers are scarce and in poor condition. Bus bays along the roads are narrow and cannot accommodate mul-tiple buses, so that one lane of the road is often obstructed by waiting buses. Bus terminals, often
M

Stuck in traffic: urban transport in Africa
24
in the heart if the city, are little more than over-crowded parking lots, with no facilities for pas-sengers. In the few cases where measures to favor bus travel have been introduced, they have not been properly enforced. Nowhere have such measures been effective.
Short of resources and preoccupied with motor-ized vehicles, most cities have ignored the needs of pedestrians. Sidewalks are missing from around 65 percent of the road network, so that pedestrians and motorized vehicles must share the same space. Where they do exist, sidewalks are poorly maintained, contain open drains, and tend to be taken over by expansion of adjoining properties. Pedestrian crosswalks and bridges are not provided, except in the city center. The only facilities afforded to pedestrians are crosswalks without signals; these are rarely respected by motorists or enforced by the police. Where me-dian strips and barriers or dividers in high-traffic areas, it is not uncommon to find pedestrians jumping over the road dividers to cross the road, a source of frequent, and serious, accidents. Fa-
cilities for bicycles and other forms of non-motorized transport are equally scarce, if not absent altogether. The few bicycles in Kampala and Nairobi compete for space along with mo-torized vehicles, making them very unsafe.
Public transport fleet
Most of the cities considered have a minibus fleet several thousand strong, compared with only a few hundred larger buses (table 4.2). The minibus fleet tends to be somewhat older than the large buses, since typically it is composed of second-hand vehicles, whereas many large buses are supplied new by donors.
Minibuses in all the cities under review are based on light commercial vehicles, most of the locally converted to passenger carriage. Some started life as crew buses. Almost all are integral vehi-cles, although a few pick-up conversions can still be found in Addis Ababa, where imports of inte-gral small commercial passenger vehicles had been suppressed.
Table 4.1 Characteristics of the road network in 14 African cities
Paved road density
City Length of road network (km)
Length of paved road network
(km)
Paved roads as share of all
roads (percent) m per 1,000 pop. kms per km2
Abidjan 2,042 1,205 59 346 2.1
Accra 1,899 950 50 339 2.8
Addis Ababa — 400 — 129 0.7
Bamako 836 201 24 167 0.8
Conakry 815 261 32 174 2.3
Dakar — — — — —
Dar es Salaam 1,140 445 39 122 0.2
Douala 1,800 450 25 237 2.4
Kampala 610 451 74 225 0.5
Kigali 984 118 12 170 0.2
Kinshasa 5,000 500 10 63 0.1
Lagos — 6,000 — 400 1.7
Nairobi — — — — —
Ouagadougou 1,827 201 11 185 0.4
Average — — 33 318 1.7
Sources: City authorities, published documents, various. Note: — = not available

Infrastructure — roads and fleet
25
In East Africa, the most popular models are Japanese, imported second-hand through traders in the Gulf. In Nairobi and Kampala most are now diesel powered because of their relative economy of operation, but altitude and terrain mean that gasoline engines are preferred in Ad-dis Ababa. Vehicle age varies widely, but 10 to 15 years is typical. Body corrosion is the main de-terminant for scrapping.
In West Africa, by contrast, the prevailing mod-els are of European origin, although significant numbers of Japanese vehicles also can be found especially in Abidjan. In Lagos the market came to be dominated by Volkswagen, partly because the flat area over the rear-mounted engine pro-vided space for market goods; fuel subsidies (and preferential pricing of gasoline over diesel) have supported their continuing viability. Mercedes models are popular for the larger minibuses in Accra, whereas French vehicles are most com-mon in Dakar. Vehicle age tends to be somewhat
higher in West Africa, with some larger mini-buses being 20 years old; partly this reflects a generally lower standard of technical enforce-ment.
Most midi-buses consist of a locally made body mounted on a light or medium truck chassis, although some Mercedes vans can be found in Accra, and similar Renault and Peugeot models are common in Dakar. In Lagos the Mercedes 911 model came to dominate the market, while Isuzu is the major supplier in Nairobi; in both cases, the strength of the local assembly opera-tion and the dealer network were significant in market success. In Nairobi a market niche has been developed for luxury models operating from the more affluent suburbs.
Vehicle ages can be even higher than for mini-buses, with some of the vans in Accra approach-ing 30 years and molue in Lagos reaching 40 years. In Nairobi midi-buses do not get as old, but productivity tends to be much higher and
Table 4.2 Average bus age and fleet size
Large bus Minibus City
Average age Fleet size Average age Fleet size
Abidjan 7 650 15 5,000
Accra 1–2 600 15–20 6,000
Addis — 350 — 10,000
Bamako 17 168 15 1,800
Conakry 20 50 10–15 1,500
Dakar — 410 15–20 3,000
Dar es Salaam Na 0 15 10,000
Douala 15 100 15–20 2,000
Kampala Na 0 10–15 7,000
Kigali 4 20 15 2000
Kinshasa 2 (STUC)
180 2 (STUC) 15–20 (informal)
54 (STUC)1,200 (informal)
Lagos — <100 >15 75–120,000
Nairobi — 250 >15 10,000
Ouagadougou 5 55 n/a 0
Average 9 218 14 11,400
Sources: City authorities, published documents, various. Note: — = not available; n/a = not applicable. STUC = Société des Transports Urbains du Congo.

Stuck in traffic: urban transport in Africa
26
early replacement more economic. In Dakar, the age of cars rapides can exceed 25 years, but their replacement is now being encouraged by the government.
The pattern for large buses is different in each of the cities where these still form a significant part of the vehicle park, with the influence of public ownership and access to subsidies being appar-ent.
Only in Nairobi are large buses operated by the private sector in significant numbers. Here, lo-cally made bodies are mounted a truck-based passenger chassis. The viability of these large buses was eroded in recent years when standing passengers were banned following a flawed analysis of accident data. Most of the remaining fleet is now at least 12 years old.
By contrast, the city fleet in Addis Ababa has received regular investment over the past ten years, mostly supported by bilateral assistance from the Netherlands and Belgium. Again truck-based passenger chassis (made by DAF) are em-ployed, but with imported European bodywork, despite the presence of local manufacturing ca-pability. In Kinshasa, the private Société des Transports Urbains du Congo benefited from a $33.5 million grant from the government of In-dia to purchase new buses.
In Accra, the current government has established a quasi-private operator to revive large-bus ser-vice. Reportedly it will procure several hundred new buses, either single- and double-decker buses from China (Yaxing) or DAF chassis bod-ied in Ghana. In Douala, too, the urban fleet re-
ceived a major enhancement in recent years. However, in this case, second-hand buses were imported from France; a significant proportion of these are already out of service because of technical problems and difficulty obtaining spare parts. In Lagos, the state government has set up a bus company (Lagbus Asset Management Ltd) to procure buses using bilateral aid.
Across all the cities considered, the private sector has proved incapable of raising capital except to purchase the most basic second-hand minibuses, which offer relatively short payback periods. Ac-cess to capital is limited to small amounts of family savings and often takes the form of inter-est free loans from family and friends. Bank fi-nance is rarely used, as the banks are reluctant to accept the vehicles as security for the loan, and revenue streams in the informal sector are insuf-ficiently reliable to assure the banks of repay-ment. Without an exclusive, and enforceable, license to operate a given route, one cannot be sure of earning enough to repay a loan.
Private financing for new minibuses and larger vehicles is virtually nonexistent, partly because of risk aversion (the possibility of losing large capital investments to accident or theft) and partly because the payback periods for new vehi-cles are longer than for second-hand vehicles. See the example for Nairobi provided in box 4.1. In Dakar an innovative bus finance scheme has been supported by the World Bank, whereby groupings of operators commit to collective ve-hicle finance, but the scheme has proved slow to take off. Projections indicate that higher fares will be required for full cost recovery.

Infrastructure — roads and fleet
27
The largest single recurrent cost of bus operation in African cities is fuel—not labor, as in the in-dustrialized countries. With low wages and high unemployment, the cost of labor in bus opera-tions in Africa can be less than 25 percent of the total running costs. For minibus operations, fuel is by far the costliest input, and that cost has risen with international oil prices in recent years. Fuel costs for diesel fuel and premium gasoline are typically in the range $0.80 to $1.00 per liter but may be considerably higher in some cases (table 4.3). Accra and Lagos stand out for their relatively low fuel costs—only about half as much as the reported average.
The environmental performance of the minibus fleet has emerged as an important issue in some cities. Government agencies in several cities were aware of the problems of vehicle emissions, but only in Accra, and to a lesser extent Dakar, has a formal program begun to quantify the impact so as to inform future policy making. The contin-ued use of lead-based octane improvers in gaso-line-powered vehicles, made necessary by lack of investment in refinery technology, appears to be the main problem, although oil leakage from poor engine condition is also significant. In the case of diesel engines, high sulfur levels in the
fuel—again resulting from lack of investment in refinery technology—increase particulates, an effect compounded by poor maintenance of fuel-injection equipment. Most engines in use today predate the introduction of the first Euro-pean norms in the early 1990s. Meeting today’s even higher standards would require not only new equipment but also improved fuels.
Table 4.3 Fuel price ($/liter), July 2007
City Premium gasoline Diesel fuel
Abidjan 1.25 1.09
Accra 0.49 0.43
Addis 0.60 0.42
Bamako 1.17 0.90
Conakry 1.50 0.69
Dakar 1.10 0.90
Dar es Salaam 0.93 0.87
Douala 0.95 0.83
Kampala 1.02 0.88
Kigali 1.15 0.99
Kinshasa 0.92 0.81
Lagos 0.71 0.83
Nairobi 0.92 0.76
Ouagadougou 1.18 0.94
Average 0.97 0.78
Sources: City authorities; World Development Indicators.
Box 4.1 Financing large versus small buses in Nairobi
The average price of a second-hand 14-seat matatu (5–7 years old) is approximately KSh 900,000
($11,800). The net return to the owner is about KSh 1,580 ($21) per day after deductions for insur-
ance, license and vehicle inspection, the cost of tires, and regular maintenance that total about KSh
474,000 ($6,200) per year. This would suggest that the capital cost could be recouped in about two
years, considerably shorter than the average working life of the vehicle.
In contrast the cost of a new, locally bodied, 35-seat matatu built on a light truck chassis is about
KSh 3.5 million ($46,000). The purchaser normally would have to borrow from a commercial in-
vestor, who would insist on comprehensive insurance at a cost of about KSh 700,000 ($9,200) a
year, much more than the insurance normally taken out on smaller vehicles. The cost of insurance
alone makes large new vehicles unprofitable. The Matatu Owners Association estimates that many of those who had bought bigger matatus in the last two years are likely to go bankrupt.

Stuck in traffic: urban transport in Africa
28
Data on vehicle productivity are hard to come by, as most buses lack working odometers and drivers count the number of paying trips per day rather than the distance traveled. The limited evidence available indicates that average dis-tances of around 190 kilometers per day are typical for large buses and minibuses alike (table 4.4). In some cities, however, the average dis-tances covered by large buses and minibus differ widely. In Abidjan, Addis Ababa and Nairobi, for example, minibuses cover substantially longer daily distances, whereas in Accra and Ba-mako the opposite is true.
Table 4.4 Average distance traveled per day (kilo-meters)
City Large bus Minibus
Abidjan 161 250
Accra 160 140
Addis Ababa 138 180
Bamako 225 180
Conakry 180 180
Dakar 192 —
Dar es Salaam n/a 180
Douala 180 Na
Kampala n/a 100
Kigali 210 210
Kinshasa 200 200
Lagos 180 100
Nairobi 200 240
Ouagadougou 250 n/a
Average 191 186
Source: City authorities.
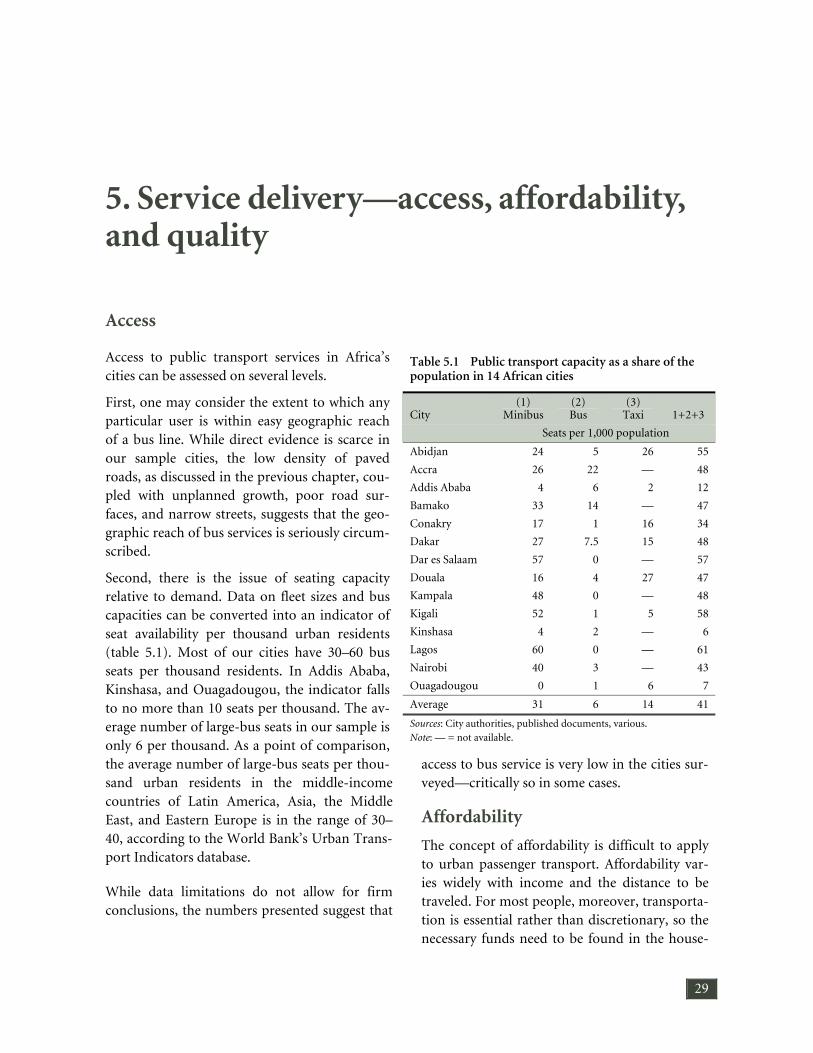
29
5. Service delivery—access, affordability, and quality
Access
Access to public transport services in Africa’s cities can be assessed on several levels.
First, one may consider the extent to which any particular user is within easy geographic reach of a bus line. While direct evidence is scarce in our sample cities, the low density of paved roads, as discussed in the previous chapter, cou-pled with unplanned growth, poor road sur-faces, and narrow streets, suggests that the geo-graphic reach of bus services is seriously circum-scribed.
Second, there is the issue of seating capacity relative to demand. Data on fleet sizes and bus capacities can be converted into an indicator of seat availability per thousand urban residents (table 5.1). Most of our cities have 30–60 bus seats per thousand residents. In Addis Ababa, Kinshasa, and Ouagadougou, the indicator falls to no more than 10 seats per thousand. The av-erage number of large-bus seats in our sample is only 6 per thousand. As a point of comparison, the average number of large-bus seats per thou-sand urban residents in the middle-income countries of Latin America, Asia, the Middle East, and Eastern Europe is in the range of 30–40, according to the World Bank’s Urban Trans-port Indicators database.
While data limitations do not allow for firm conclusions, the numbers presented suggest that
access to bus service is very low in the cities sur-veyed—critically so in some cases.
Affordability
The concept of affordability is difficult to apply to urban passenger transport. Affordability var-ies widely with income and the distance to be traveled. For most people, moreover, transporta-tion is essential rather than discretionary, so the necessary funds need to be found in the house-
Table 5.1 Public transport capacity as a share of the population in 14 African cities
City (1)
Minibus (2) Bus
(3) Taxi 1+2+3
Seats per 1,000 population
Abidjan 24 5 26 55
Accra 26 22 — 48
Addis Ababa 4 6 2 12
Bamako 33 14 — 47
Conakry 17 1 16 34
Dakar 27 7.5 15 48
Dar es Salaam 57 0 — 57
Douala 16 4 27 47
Kampala 48 0 — 48
Kigali 52 1 5 58
Kinshasa 4 2 — 6
Lagos 60 0 — 61
Nairobi 40 3 — 43
Ouagadougou 0 1 6 7
Average 31 6 14 41
Sources: City authorities, published documents, various. Note: — = not available.

Stuck in traffic: urban transport in Africa
30
hold budget. Anecdotal evidence from limited surveys demonstrates that rising transport fares can isolate some people from employment op-portunities, but this effect does not appear to be widespread. However, the fact that budgets are tightly balanced is illustrated by the sharp drop in ridership following fare increases, although ridership often rebounds after a few months.
Most low-income households live on the out-skirts of developing cities, often in shanty town-ships, and make an implicit trade-off between the costs of housing and travel. However, in sev-eral of the cities under review, including Accra and Nairobi, low-income pockets can be found far closer to the center, so that walking to work becomes a viable choice. Conversely, new mid-dle-class suburbs are emerging on the outskirts of some cities, making personal mobility increas-ingly dependent on the private car, (or motorcy-cles, as in Ouagadougou) with predictable effects on congestion in the city center.
Comparing bus fares across cities is rendered difficult by the wide variation in fare structures and by the tendency of private sector operators
to effectively raise fares by shortening route seg-ments, thus requiring customers to pay multiple fares to reach a given destination. The example from Dakar cited in chapter 3 illustrates this point.
Having noted these caveats, the average cost of a trip emerges at around $0.30, with no systematic variation between the fares charged by large buses and the nominal fares of informal mini-buses (table 5.2). In some cities (Addis Ababa, Bamako, Dakar) large buses are more expensive than minibuses; in others (Abidjan, Conakry) minibuses are more expensive; in still others (Ki-gali) fares are broadly similar. It should be re-membered, however, that minibus fares in many cities fluctuate with demand, as discussed in chapter 3 and below.
The affordability of these fares needs to be gauged in relation to household income (table 5.3). We collected data from the most recent budget surveys available for each country and analyzed them at the city level wherever possible. The first point to note is that although most households report some degree of positive trans-port expenditure, a significant minority do not spend anything on transport, meaning that they meet all their transport needs by walking. The share of household budgets spent on transport averages 6.5 percent across the cities of our sam-ple—but with considerable variation. The share is just 3 percent in Addis Ababa; 14 percent in Lagos. When expressed in absolute terms, the amount that households spend on transport is much more consistent across cities, at about $12–16 per month. The exceptions are Addis Ababa and Kinshasa (where spending is about a third of that level) and Abidjan and Nairobi (where it is about twice as much).
In order to permit international comparisons based on this data, a standardized affordability index is calculated. This is based on the cost of 60 public transport trips, which represents the
Table 5.2 Average bus fare ($ per trip)
City Large bus Minibus
Abidjan 0.40 0.40–0.70
Accra — —
Addis Ababa 0.25 0.12
Bamako 0.25–0.30 0.20–0.25
Conakry 0.18 0.21
Dakar 0.30 0.18
Dar es Salaam n/a 0.16–0.24
Douala 0.30 n/a
Kampala n/a 0.20–0.25
Kigali 0.28 0.28
Kinshasa 0.33 —
Lagos 0.40–0.56 0.38–0.39—
Nairobi 0.25–0.40 —
Ouagadougou 0.30 n/a
Average 0.31 0.25
Sources: City authorities, published documents, various. Note: — = not available; n/a = not applicable.

Service delivery—access, affordability and quality
31
minimum level of mobility needed to allow one family member to commute to and from work for a month. The cost of these trips is expressed as a percentage of the monthly budget of the av-erage household and the first quintile household (table 5.3). The results indicate that 60 trips would typically absorb 8 percent of the monthly budget of an average household.
In some cities (Abidjan, Dakar, Dar es Salaam, Kampala, Kigali), there is a close correspondence between the actual budget share and the budget share needed to purchase the 60 trips. Elsewhere the difference is quite large and can run in either direction, with households spending substan-tially more (Nairobi) or less (Addis Ababa,
Douala, Kinshasa, Lagos) than what is needed to purchase the 60 trips.
In all cases, however, first quintile households are at a disadvantage. They would typically need to spend 33 percent of their budget to purchase the 60 trips and in many cases a lot more, indi-cating that this level of mobility is completely unaffordable for the poorest households. Calcu-
lations of the same index for a number of Indian cities indicate broadly comparable results, with the average household needing to spend 5–10 percent of its monthly budget on the 60 trips, with that share rising to 15–25 percent for the poorest households.
Table 5.3 Spending on urban transport as a share of household income
Percentage of
households re-
porting positive
expenditure on
transport
Percentage of
household budget
spent on transport
for households
with positive ex-
penditures (%)
Absolute monthly
expenditure on
transport for
households with
positive expendi-
ture (US$)
Percentage of
average household
budget needed to
pay for 60 one-
way trips per
month (%)
Percentage of first
quintile house-
hold budget
needed to pay for
60 one-way trips
per month
(%)
Abidjan 77 10.1 31.47 10.5 42.9
Accra 95 6.0 16.36 — —
Addis Ababa 87 3.3 3.83 6.3 18.6
Bamako — — — — —
Conakry — — — — —
Dakar 92 4.3 15.08 3.1 11.3
Dar es Salaam 92 11.6 12.04 11.6 53.2
Douala 77 4.0 6.94 10.4 23.5
Kampala 81 7.4 13.08 7.8 41.0
Kigali 80 4.4 14.55 5.1 46.0
Kinshasa 49 2.8 5.43 10.1 31.0
Lagos 58 13.8 14.44 27.5 105.2
Nairobi 61 10.1 25.97 7.5 33.6
Ouagadougou 3 5.5 0.30 8.9 35.8
Average 90 6.5 13.29 8.0 32.7
Sources: Analysis of recent household budget surveys, Africa Infrastructure Country Diagnostic, 2007. Note: All data is for capital city, except for Douala and Ouagadougou, where spending at the urban level nationwide is taken as a proxy for spending in the capital city. — = data unavailable.

Stuck in traffic: urban transport in Africa
32
Furthermore, in most of the cities (other than Addis Ababa and Nairobi), passengers confirm that the actual fares charged vary somewhat arbi-trarily depending on circumstances such as bad weather and congestion. In Lagos, for example, a nominal N40 (US$ 0.30) fare may be hiked to N70 (US$ 0.53), or even N90 (US$ 0.70) on oc-casions. In Nairobi, by contrast, the fare is nor-mally displayed inside the vehicle’s windscreen; gouging is reportedly much less common.
Uncertainty about fares is a serious concern of many passengers, as revealed in various surveys. Poor passengers making the journey home after work often do not know whether they will be able to afford the ride. Passengers also report other operating practices that increase uncer-tainty, such as curtailing a trip to take advantage of a better commercial opportunity in the other direction. So-called short-turning leaves passen-gers stranded along the road, and full compensa-tion is rarely paid.
Once again, firm conclusions cannot be reached, but the results presented here suggest that the price of urban bus fares remains high in relation to the purchasing power of the typical family, so that usage of buses is correspondingly low. The average family is barely able to afford one round trip each day, while for the poorest households even this basic level of mobility is unattainable.
Nevertheless, even this low level of expenditure translates into peak demand for around 200 seats per thousand residents, about five times higher than the supply available in any of the cities sam-pled.
Quality of service
No formal quality-of-service statistics are avail-able for urban transport in Africa, but formal and informal surveys of users undertaken in our 14 cities suggest widespread customer dissatis-faction with bus services. Frequent complaints
include poor quality of roads, overcrowding of buses, unpredictable and irregular service, and inadequate terminal facilities. On average, pas-sengers report walking for around 10 minutes to reach a bus, and typically waiting around 30 minutes at the bus stop before being able to start their trip. Trip times are in the 30–45 minute range.
Some of these problems can be traced to the in-stitutional regime governing minibus operations. As discussed in chapter 3, minibus service is self-regulated by operators’ unions. Drivers pay fixed daily rental fees for the vehicles they operate and have strong incentives to maximize fare collec-tions. This incentive structure has adverse con-sequences for the quality of service.
One consequence is the rigidity of the route net-work. Routes run between terminals controlled by the operators’ unions, which limits the degree to which they can be adjusted to meet passenger demand. The result is that a high proportion of passengers must change buses at least once to reach their destination, increasing the duration and cost of their trip. Even with several changes, the point at which passengers alight is often some distance from the desired destination, par-ticularly in the central business district.
Quality suffers from other union-imposed oper-ating practices that work against passenger inter-ests. Chief among these is the practice of waiting for the assembly of a full load before setting out, which often forces passengers to sit in the vehicle under the sun in order to retain their place. Waiting times at terminals can exceed an hour off peak, extending waiting times along the route and making it difficult for intending passengers to access the service, particularly at early stages on the route. To secure a seat, many passengers walk to the terminal.
By loading vehicles in strict rotation, the unions also prevent intending passengers from rejecting vehicles that fail to meet expected standards of
Service delivery—access, affordability and quality
33
cleanliness or physical condition. This, in turn, lowers the incentive for vehicle owners to im-prove their performance. (Remember that offi-cial standards in this domain are lax at best and generally not enforced.) Investment in a pre-mium-quality vehicle also becomes impractical under these circumstances.
Operators have a clear commercial interest in squeezing as many passengers as possible into their vehicles, as long as fares can still be col-lected under such circumstances. Overloading in minibuses is somewhat controlled in most cities, through the terminal management practices de-scribed in chapter 3, although standards in some cities fall away once the vehicles leave the termi-nal, especially after dark.
Overcrowding on large buses is even worse—and routine. Performance data from Anbessa in Ad-dis Ababa suggests peak load factors as high as 150 percent of rated capacity. Three in four pas-sengers interviewed rated overloading as their primary concern. In Kinshasa and Dar es Sa-laam, the average load factor at the morning peak reaches 200 percent, with passengers hang-ing out of the bus or even sitting on the roof. Nairobi attempted to tackle the problem of over-crowding by outlawing standing passengers on Kenya Bus Service routes and restricting the number of passengers on matatu minibuses. This measure improved the comfort and safety of passengers, but drove up fares, as operators had to cover the same operating costs from a smaller customer base.

34

35
6. Conclusion
ur survey of urban transport in 14 Afri-can cities reveals a relatively consistent set of problems and challenges, as well
as some significant variations in institutions and practices. The main messages that emerge from the survey are as follows.
First, in none of the cities under review was a clear articulation of urban passenger transport policy available in the public domain. The gen-eral impression gained is of policy decisions made ad hoc in response to political pressures as they arise. International experience suggests that successful reform will depend on steady com-mitment to an urban passenger transport policy based on clear guiding principles.
Second, the need to coordinate land-use and transport planning is widely recognized but rarely achieved. The authorities in most of the cities under review lack institutional capacity in both of these areas; even where capacity exists, there is no effective forum for communication between those responsible for the two functions. Land use generally develops in an ad hoc man-ner, driven by developers’ interests and informal settlements, and the transport system is expected to respond accordingly. Funding to address the capacity constraints that have arisen as the cities have grown has rarely been available when needed, so that nearly everywhere growth has brought high levels of congestion.
Clearly urban transport planning should be un-dertaken in a holistic manner; the potential benefits of success in this domain far exceed the costs involved. Planning the transport network cannot be left to operators’ associations, which lack both the incentives and the capacity to match transport supply to passenger demand
throughout a metropolitan area. Most of the cities studied drifted from the regulated provi-sion of public transport by one operator (typi-cally publicly owned) to an unregulated system in which the informal sector, initially only toler-ated, is now dominant. The change usually did not reflect a conscious decision to deregulate the sector but was a pragmatic response to the fail-ure of the formal operator to satisfy growing demand.
The outcome has been an urban transport sector strongly skewed toward small-scale minibus op-erators who band together through associations and unions of various kinds. While these syndi-cates have effective systems of self-regulation that serve to avoid the worst excesses of unbri-dled competition along transport routes, their operating practices are designed mainly to maximize operator revenues and only secondar-ily to serve the interests of their customers. At the same time, the proliferation of smaller vehi-cles has worsened congestion and raised concern about safety and environmental standards.
This critical and complex task of planning urban transport must be brought under a centralized framework, as in successful cities throughout the world. The potential benefits of planning, both to service providers and to riders, are great enough to justify a levy on transport for the pur-pose of funding improvements. These need not be onerous or have a significant effect on fares.
Third, most of the cities reviewed lack an effec-tive coordinating institution capable of leading the implementation of urban transport reforms. A capable transport authority is a necessary pre-condition for reform. Combining democratic accountability with professional competence, the
O

Stuck in traffic: urban transport in Africa
36
authority must coordinate transport planning, infrastructure development, and regulation of services. Funding can be a challenge. The budg-ets allocated to such authorities often are insuffi-cient to attract and retain qualified staff and can be subject to arbitrary changes when the spon-soring department comes under pressure. The preferred option is again to rely on user charges, principally operating permits or franchise fees levied on operators.
Fourth, large buses—which fell into decline be-cause fares were kept low for political reasons, while compensating subsidies were insufficient to cover the difference—continue to offer some operational advantages in terms of scale econo-mies and passenger comfort. They also tend to be better suited to providing services along the main urban corridors. Reintroduction of large buses will depend on a staunch political com-mitment to sustainable operations, and on loos-ening traffic congestion and rebuilding rutted roads, which have slowed large buses to a crawl.
Fifth, to a greater or lesser extent in each of the cities, the networks of paved roads and associ-ated traffic control facilities (such as signals, well-designed intersections, dedicated bus lanes, and parking enforcement) are deficient. In all cases, funding appears to be the major con-straint. The poor condition of the road network reduces vehicle speeds, sapping the productivity of the bus fleet and increasing the cost of vehicle maintenance, owing to additional wear and tear. The condition of many roads is so poor that it would be impossible to reintroduce conven-tional bus service until the roads have been made serviceable once again. Although private cars are inefficient users of scarce road space, none of the cities studied has tried to promote public trans-port over the use of private cars by creating dedi-cated bus lanes or tightening controls on park-ing.
Sixth, in all the cities under review, traffic behav-ior and vehicle condition are largely unregulated. Commercial activities (such as street vendors) and vehicle parking force pedestrians off the sidewalks into the roadway, reducing the capac-ity of the roadway and posing safety hazards. Competition at bus stops causes localized con-gestion that can spill over into adjoining traffic lanes.
Economic reality in Africa means that old vehi-cles have to be tolerated to keep the transport system functioning. But old vehicles need not be dilapidated. In African cities today, widespread dilapidation is apparent, as basic safety standards with regard to lighting, tires, and brakes are openly flouted. Systems and procedures for rou-tine vehicle inspections are clearly failing, while petty corruption among police officers means that no action is taken on the road. Overloading of vehicles also has safety implications, although recent improvements in vehicle construction have allowed for increases in the permitted levels in some cases.
Many of the countries surveyed have moved to-ward a policy of funding road maintenance through various kinds of road-user charges. But although most road use occurs in urban areas, the allocation of the resulting fiscal resources often fails to reflect this reality. A restructuring of road-fund allocations to more closely reflect observed traffic patterns could help to alleviate this problem. In addition, urban road funds could be supplemented by charges on parking for private cars or on urban developments that impose a measurable transport burden.
Government attempts to promote the use of lar-ger buses, often with bilateral assistance from supplier countries, have run into numerous problems—among them noncompetitive pro-curement of overpriced or inappropriate vehicles and insufficient local technical support. At the same time, artificial suppression of fares on large

Conclusion
37
public buses has led operators to defer mainte-nance and the replacement of aging buses. Few private operators are able to raise the capital needed to acquire larger buses. Under current conditions, it is doubtful that even those who could raise the required sums would choose to do so.
Controlled competition in the form of govern-ment concessions for the right to operate bus services along specified routes may provide a way to address the investment barrier. Con-trolled competition can be introduced by con-solidating the informal sector into larger units or associations, thereby enabling them to partici-pate in the competition for concessions. The ex-clusion from the corridor of wasteful competi-tion should serve to reduce congestion and raise speeds of operation, so that larger buses become commercially attractive. This approach is prem-ised on a franchise duration that is commensu-rate with the investment payback period, and on a system of tariff regulation that ensures recov-ery of reasonable costs over time and provides some insulation from political pressures.
Finally, it must be said that the current system is quite deficient in terms of customer service. Ac-cess to public transport—both in terms of geo-
graphic reach and seating capacity—remains very low by global standards. At the same time, fares are too high as a share of typical household incomes to permit more than very limited mo-torized mobility. Even those who can pay have trouble boarding buses along the route and must wait long periods for buses to leave their termi-nals. Once on board, riders must tolerate severe overcrowding during peak periods.
We propose a strategy for improving urban pub-lic transport in African cities. The strategy con-sists of stepped measures to improve infrastruc-ture, traffic management, service quality, and network reach. Short-term steps include increas-ing road funding, enforcing existing regulations, controlling overcrowding, and strengthening vehicle inspections. Medium-term measures in-clude rehabilitating roads, improving traffic management, setting and enforcing service stan-dards (fares, schedules), developing a new route structure, and rationalizing service along those routes through controlled competition, as dis-cussed above. The long-term goal is to consoli-date gains in all these areas through the creation of a metropolitan transport authority with juris-diction over roadways and vehicles. The pro-posed strategy is illustrated in figure 6.1.
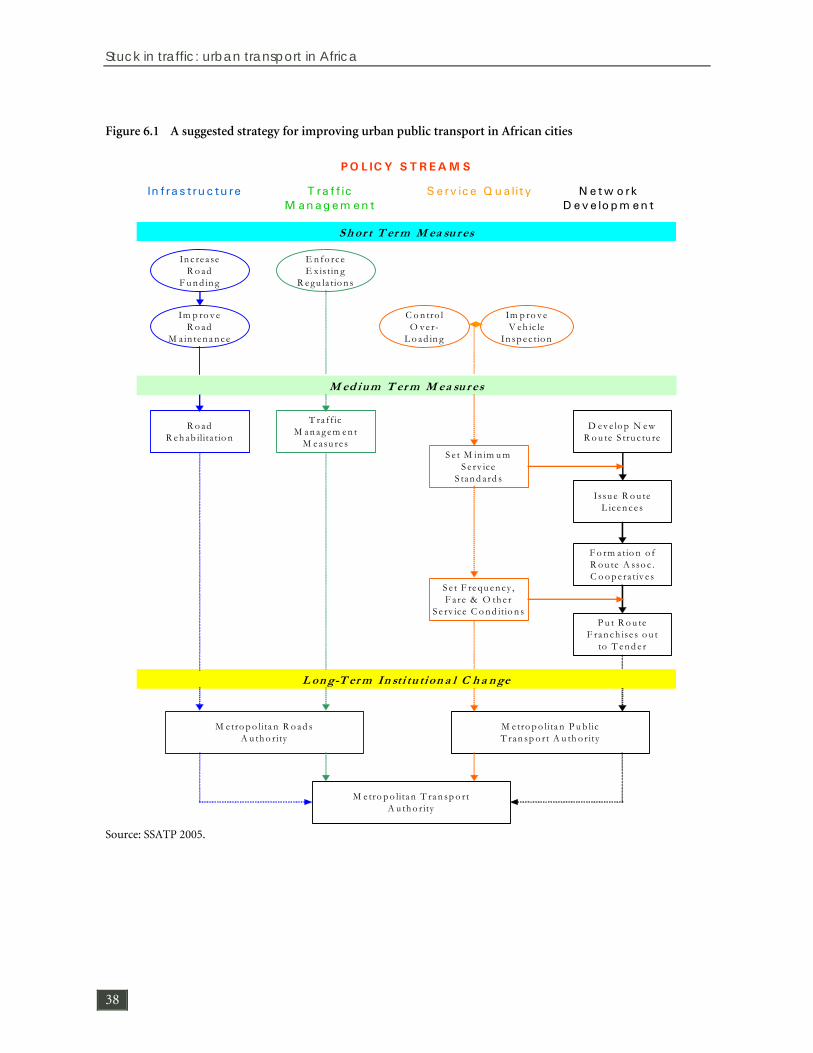
Stuck in traffic: urban transport in Africa
38
Figure 6.1 A suggested strategy for improving urban public transport in African cities
Source: SSATP 2005.
PO L IC Y S T R EA M S
In fra s tru c tu re T ra ff ic M anag em en t
S e rv ice Q ua lity N e tw o rk D eve lo pm en t
S h or t T er m M ea su r es
In c re a se R o ad
F u n d in g
Im p ro v e R o ad
M a in te n a n c e
E n fo rc e E x is tin g
R e gu la tio n s
C o n tro l O v e r-
L o ad in g
Im p ro v e V eh ic le
In sp e c tio n
M ed iu m T er m M ea su r es
R o ad R e h ab ilita t io n
T ra ff ic M a n a g e m e n t
M e asu re s
D ev e lo p N e w R o u te S tru c tu re
S e t M in im u m S e rv ice
S tan d a rd s
Issu e R o u te L ice n c e s
F o rm a tio n o f R o u te A sso c . C o o p e ra tiv e s
P u t R o u te F ran ch ise s o u t
to T e n d e r
S e t F re q u e n cy , F a re & O th e r
S e rv ice C o n d itio n s
L on g-T er m In sti tu tion a l C h a n ge
M e tro p o lita n R o ad s A u th o r ity
M e tro p o lita n P u b lic T ran sp o rt A u th o r ity
M e tro p o lita n T ra n sp o rt A u th o r ity

39
References
Gwilliam, Kenneth. 2000. “Public Transport in the Developing World—Quo Vadis?” TWU Series. World Bank Discussion Paper TWU-39. Washington, D.C. April.
Kumar, Ajay, and Fanny Barrett. 2006. “Urban Transport Sector Performance Indicators: Descriptive Manual.” Staff paper prepared as part of the Africa Infrastructure Country Diagnostic, Africa Region, World Bank, Washington, D.C.
SSATP (Sub-Saharan Transport Policy Program). 2005. “A Study of Institutional, Financial and Regu-latory Frameworks of Urban Transport.” SSATP Working Paper 82. Washington, D.C. July.
United Nations. 2005. Financing Urban Shelter: Global Report on Human Settlements 2005. New York.
World Bank. 2002. “Cities on the Move: World Bank Urban Transport Strategy Review.” Washington, D.C.


41
Annex: City profiles
Abidjan
Administrative and commercial capital of Côte d’Ivoire | Population 3.5 million
The metropolitan area of Abidjan is located in southern Côte d’Ivoire on the Ébrié Lagoon. The city covers several converging peninsulas and islands that are connected by bridges. The busi-ness center of the city is known as the Plateau. Accounting for 46 percent of the country’s urban population, Abidjan is the destination for rural migrants looking for employment. The city’s population has doubled every seven years since 1945. Since 1990 growth has slowed to 4.5 per-cent per year.
The district of Abidjan is made up of 10 autonomous communes. Each is governed by its own municipal council, headed by a mayor. Ex-ecutive power is however, in the hands of a dis-trict governor appointed to a five-year term by the president of Côte d’Ivoire. The governor is the de facto mayor of Abidjan. Legislative power lies with the District Council, whose 78 members serve five-year terms. The District of Abidjan is part of the Lagunes region, which contains five départements in addition to the District.
Regulation of urban transport
A coordinating body for urban transport, the Agence de Gestion des Transports Urbains (AGETU), is a major element in the govern-ment’s urban transport sector reform. Created in
2000, AGETU is a state-owned enterprise under the technical supervision of the Ministry of Transport. Its board consists of 12 representa-tives of main stakeholder groups so as to ensure a comprehensive view of the sector. AGETU’s mandate embraces the coordination and over-sight of public urban transport services, as well as policy making and infrastructure planning related to public urban transport. AGETU is re-sponsible for licensing vehicles, regulating fares, setting tariffs, defining the operating network of urban transport, preparing bid documents for concessions, and contributing to the fight against air pollution generated by motorized transport.
The central government remains responsible for urban planning in Abidjan. The national Agence des Routes (AGEROUTE), the District of Abid-jan, and adjoining local governments (com-munes) share responsibility for building and maintaining urban roads. AGEROUTE is re-sponsible for national roads, the District of Abidjan for the major urban roads, and the local governments for district roads. Funding for the roads maintained by AGEROUTE is made avail-able but at inadequate levels. No major infra-structure has been built in Abidjan for the last 15 years. Maintenance and improvement of city and commune roads are even bigger issues, because

Stuck in traffic: urban transport in Africa
42
of insufficient or absent funding and capacity constraints. If it persists, the deferral of road works may soon hobble private and public urban transport, but the prospects for improvement are not bright. Competing national needs and the current security situation in the country are not conducive to an ambitious urban transport infrastructure program.
Vehicle importation and initial inspection are handled in a structured manner by a branch of the Ministry of Transport, the Service Autonome du Guichet Unique Automobile, or one-stop shop, while regular inspections are carried out by a private concessionaire, Société Ivvoirienne de contrôle technique automobile (SICTA, a subsidiary of SGS). The government sets bus fares. The operators of buses and minibuses are organized into several associations and unions. The Syndicat National des Transporteurs de Marchandises et de Voyageurs de Côte d’Ivoire (SNTMVCI) is one of the national associations of operators. Unions perform self-regulatory functions.
Transport services
Abidjan’s main modes of public transport are large buses and ferries, minibuses, metered taxis, and informally operated commercial taxis.
Buses
A fleet of some 650 large buses seating 100 pas-sengers is operated by SOTRA (Société de Transports Abidjanais). The fleet includes 37 articulated buses and 19 ferries known as ba-teaux-bus. Together they fulfill 11 percent of Abidjan’s transport needs.
SOTRA’s fleet serves all 10 communes of the District of Abidjan, carrying some 665,000 pas-sengers each day along 83 routes that form a network that is 1,077 km in length. Each vehicle covers about 161 km per day. The fare, set by the
government, is $0.40. Service standards are higher on 12 express routes. Of the 1,168 stops in the network, 288 are equipped with shelters.
SOTRA also owns 19 boat buses, of which 13 are currently operational, that link nine communi-ties bordering the Abidjan lagoon. The boat buses are fairly new—the average age of the fleet is just seven years. They seat 90 passengers.
SOTRA was established in 1960 to provide pub-lic transport on land and water. The government holds 60 percent of its shares, with most of the remainder held by a private investor, Groupe IRIS BUS. The District of Abidjan is the third owner, with less than a tenth of 1 percent of the shares. Since 1998 SOTRA has been operating under a 15-year concession from the govern-ment of Côte d’Ivoire. Under the technical su-pervision of the Ministry of Transport and the financial supervision of the Ministry of Economy and Finance, the company has a monopoly to operate public transport service in a defined ter-
A fleet of “boat buses”connects par of Abidjan
separated by a lagoon
Minibuses provide about 19 percent of the city’s
urban transport

City profiles—Abidjan
43
ritory within the city of Abidjan. SOTRA re- ceives an annual subsidy that allows it to offer
reduced fares to civil servants, the military, and students.
SOTRA has a fairly good safety record. Buses undergo regular technical check-ups by profes-sionals. The company maintains a central repair shop that rehabilitates buses and also builds new boat buses. (A separate shop maintains the boat buses.) However, the fleet is not large enough to avoid overcrowding, especially during peak hours. Poor road condition and heavy traffic exacerbate the situation.
Minibuses
Some 5,000 22-seat minibuses known as gbakas are privately owned and operated. Few operators own more than two or three buses. Diesel-powered and averaging 15 years of age, gbakas carry approximately 1,160,000 passengers each day, providing 19 percent of Abidjan’s urban transport. Most are badly maintained, even though they average some 250 km per day. Gbakas serve fixed routes between the city center and the towns on Abidjan’s periphery, as well as recent settlements in Abidjan that are not ser-viced by SOTRA. The minibuses stop anywhere along their route to pick up or drop off passen-gers, raising the risk of accidents. Security is poor, particularly for women. Assaults on driv-ers and vandalism are common. Fares are nego-tiated between the government and operators. The average fare is between $0.40 and $0.70, de-pending on the distance traveled.
Taxis
Abidjan’s taxi fleet consists of some 11,000 in-formally operated commercial taxis (called woro-woro) and another 11,000 metered taxis; together these account for 30 percent of the city’s urban transport. The woro-woro operate
in 8 of the 10 communes, using a different color in each commune. The average age of the 5-seater taxis is about 20 years. Woro-woro trans-port about 1,100,000 passengers each day; each vehicle covers 300 km or more. The fare is $0.52 for a trip of about 7 km. Many vehicles fail to comply with inspections; some are not licensed. Drivers are not required to establish their quali-fications. Safety and security are problems.
The city’s fleet of 11,000 metered taxis. has an average age of about 17 years. Most are in very poor condition. They transport approximately 675,000 passengers per day, with each vehicle covering some 350 km. Drivers are not trained and do not need a permit. Many are represented by the Union Patronale des Exploitants de Taxis-compteurs d’Abidjan and by the Syndicat Na-tional des Chauffeurs de Taxis de Côte d’Ivoire, a well organized association which looks after the interests of taxis drivers and makes recommen-dations for improvements to AGETU, the Dis-trict of Abidjan, taxis owners etc.
Other modes of transport
Private cars and walking are the other two prin-cipal modes of urban transport in Abidjan, ac-counting for 18 percent and 22 percent of traffic.
Plans to create an urban light-rail service in Abidjan were abandoned after the 1999 coup, as the environment was no longer conducive to private investment.
The use of motorcycles and bicycles is less exten-sive in Abidjan than in many other African cities. Among the reasons are (1) most of the city’s in-frastructure is designed for cars and buses and (2) Abidjan’s suburban road network has re-mained in fairly good condition and therefore has not yet occasioned a shift to motorcycles, as in Cameroon and Benin.


45
Accra
Administrative and commercial capital of Ghana | Home to 14 percent of Ghanaians | Population 3 million
Growing at a rate of 4 percent per year, Ac-cra’s population has doubled in 15 years. In the process, its area has expanded almost three-fold, reaching 344 square kilometers in 2005—a se-vere challenge to the urban transport network. During the same period, the city’s population density dropped from 14,000 to 8,000 persons per square kilometer.
Regulation of urban transport
Rush hour traffic
Several national ministries have direct or indi-rect responsibilities for the urban transport sec-tor.
The Ministry of Transportation has overall re-sponsibility for road transport. Within the min-istry, responsibility for road infrastructure is shared by the Department of Urban Roads and the Ghana Highways Authority. Most roads are in poor condition. Vehicle ownership and use regulations fall within the authority of the Driver and Vehicle Licensing Authority. Road safety is the concern of the National Road Safety Com-mission.
The Ministry of Local Government, Rural De-velopment, and Environment is responsible for
implementing the government’s decentralization program and empowering metropolitan, mu-nicipal, and district assemblies to regulate public transport services. The ministry’s Town and Country Planning Department is responsible for terminal management and land use planning.
The Motor Traffic and Transport Unit of the national police, within the Ministry of Interior, is responsible for enforcement of road traffic regulations.
Under the Local Government Act, urban passen-ger transport is a devolved responsibility falling to the local assembly covering the area in ques-tion. Assemblies come in three types: (1) metro-politan assemblies, for cities with a population of 250,000 or more; (2) municipal assemblies, for towns with a population of at least 95,000; and district assemblies, covering rural and urban communities over wider geographical areas.
Despite their clear mandate for the provision of urban passenger transport services, the local au-thorities have taken little direct action within the sector. Local assemblies are responsible for issu-ing operating permits, passing bylaws, regulating bus operations, and setting fares. The latter power is not currently exercised, and the issu-ance of operating permits is regarded solely as a revenue generating exercise, rather than as a means of protecting public safety.
Government control over public transport in Accra is virtually nonexistent, and planning is insufficient. The Town and Country Planning Department of the Ministry of Local Govern-ment, Rural Development, and Environment provides a planning overview, but otherwise

Stuck in traffic: urban transport in Africa
46
there is no consideration of network planning or the adequacy of service supply. The national in-come taxes generated from public transport op-erations are not used for sector development.
Transport services
The transport sector in Accra consists of shared conveyances, known as tro-tros, signifying vehi-cles larger than cars but smaller than buses; shared taxis; and large buses. About 90 percent of public transport services in Accra are cur-rently provided by the informal sector. The only formal bus operation is the newly established Metro Mass Transit, Ltd., which meets 10 per-cent of transport demand. 2 MMT is a quasi-private company owned by a set of government-linked financial institutions and one privately owned bank. It receives financial support from the government to purchase buses. It expects to receive subsidies to cover its anticipated operat-ing losses.
Transport fares range from Cedi 500 to 3,500 ($0.055–$0.39), with the median value being between Cedi 1,400 ($0.15) and 1,500 ($0.16). Along three routes covered by a study on im-proving urban transport, reported fares were Cedi 1,500, 1,500, and 1,200 ($0.13) for trips of 11.6, 6.8, and 5.2 kilometers respectively. Differ-ences in fares may reflect differential vehicle productivity (speed). If shorter routes are taken as being more typical of the network as a whole, the average fare is about $0.25 per kilometer. The median fare of $0.165 would then indicate a route length of about 6.5 kilometers.
2 Although MMT was established as a private com-pany, it is under government control. The Ministry of Transportation and the Ministry of Local Govern-ment, Rural Development, and Environment together hold 45 percent of the equity. The Social Security and National Insurance Trust, the National Investment Bank, the State Insurance Company, and the Pruden-tial Bank hold the balance of equity. Only the last of these can truly be regarded as a private firm.
Private operations are controlled by trade unions and associations. Most private operators are rep-resented by one of three groups.
The members of the Ghana Private Road Transport Union (GPRTU), a national un-ion, are reported to have control of about 90 percent of the tro-tro business. Locals operate the individual routes. Branches are clusters of locals based at a single terminal. GPRTU represents the interests of both owners and drivers, but the latter pre-dominate.
The Progressive Transport Owners Asso-ciation (PROTOA) is a national associa-tion whose members operate both tro-tro and shared taxi businesses, with an em-phasis on intercity travel. PROTOA mainly represents the interests of owners.
The Ghana Co-operative Transport Asso-ciation is a national association, primarily focused on the shared taxi sector, organ-ized along the lines of GPRTU. It repre-sents the interests of both owners and drivers.
The terminals between which buses operate de-fine the network of public transport routes in Accra. GPRTU controls the network through its control of the majority of these terminals, even though the larger and city-center terminals are owned by the Accra Metropolitan Assembly. Operation of each route is normally shared be-tween members of the branches based at both terminals on a negotiated (but not necessarily equal) basis.
Other private companies, such as Agate, King-dom Transport, and Pergah Transport, operate several buses and offer a range of services includ-ing contract carriage and intercity transport.

City profiles—Accra
47
Their overall contribution to urban transport is minimal.
The Ghana Road Transport Coordinating Coun-cil (GRTCC) is an umbrella body of all transport operators in Ghana, including the unions and associations, and other operators (both passen-ger carriers and freight haulers). GRTCC was established by the government to neutralize the power of GPRTU. It represents the interests of road transport operators, especially in negotiat-ing with the government over transport tariffs.
Spillover at a bus stop blocks an arterial highway
Each of the local assemblies issues its own per-mits for the operation of commercial passenger transport services in its area, and their validity is accepted in the territory of the neighboring as-semblies.
Permit fees are very low (as little as $4 per year). Assemblies are reluctant to impose unilateral increases for fear of losing income to a neighbor-ing assembly. Permits are issued on demand to
any qualified driver whose vehicle(s) meet the basic requirements of roadworthiness. No con-sideration is given as to whether there is a mar-ket need for the additional permit, or to the po-tential consequences of oversupply in the sector. The permit is not confined to a specific route within the licensing area, although powers to impose such a condition exist in the legislation.
In practice, the operator associations, particu-larly the GPRTU, effectively control market en-try through their management of the terminals from which public transport services are pro-vided. Aspiring operators must identify an asso-ciation willing to add them to its roster, and pay the appropriate dues. This arrangement does serve to control oversupply, as the admission of superfluous operators would erode the earnings of existing members. It is likely that this consid-eration outweighs the desire to maximize branch membership fees, which in any case are payable on a daily basis and so are sensitive to the with-drawal from the branch of disgruntled members.
On behalf of the metropolitan and district as-semblies, which own many of the terminals, the unions also collect user charges. Unions require that a vehicle be full before it can depart, which is not always in the interest of waiting passengers or of those further along the route who may en-counter a succession of full vehicles.

49
Addis Ababa
Capital and primary city of Ethiopia | Population 3.1 million (2004)
Addis Ababa extends over 540 square kilometers at an altitude of 2,500 meters above the level of the Mediterranean Sea. Because the city is one of the 11 regional states of Ethiopia, its government holds greater power than do most other cities in Africa.
Regulation of urban transport
The market for passenger transport services in Addis Ababa was deregulated by the Transitional Government in 1992 through the Proclamation to Provide for the Regulation of Road Transport. Before that date, minibus taxi services in the city were regulated on a zone (ketena) basis. A license had to be obtained to operate in one of five des-ignated areas, and the number of such licenses was determined by administrative control. Only Anbessa, a federal enterprise, had the right to operate large buses. Since deregulation, entry conditions have been limited to the roadworthi-ness of the vehicle and the qualification of the driver. An intending operator must secure a business permit from the city—a formality as long as the other conditions are met. For admin-istrative convenience the Bureau for Trade and Industry Development has delegated responsibil-ity for issuing business permits to the Transport Authority. The current cost of a permit is 110 birr ($11) for initial documentation, plus an an-nual renewal fee of 60 birr ($6). The permit is
valid throughout the city, with no restrictions with regard to routes or areas of operation.
The proclamation encourages but does not re-quire the taxi sector to organize itself by area. However, a limit has been set on the number of vehicles (originally 500, now 750) that can be-long to any one taxi association so as to prevent the emergence of monopolies, as in some other jurisdictions (Ghana, Uganda). Three associa-tions are registered with the Transport Author-ity, but their total membership represents only a relatively small proportion of the industry. Nev-ertheless, it is with these bodies that the Author-ity negotiates all regulatory matters, particularly the fare structure.
In theory, the proclamation that liberalized the urban passenger transport market also applied to conventional bus services as well. Thus the gov-ernment-owned Anbessa can no longer be con-sidered to hold an exclusive franchise in the city, but no competitor has emerged to challenge it. The company’s preferential access to public in-vestment and subsidies acts as a barrier to new market entry. However, liberalization has al-lowed long-distance bus companies to provide supplementary services when their vehicles are between scheduled departures; these provide useful additional capacity at peak times. This increment of supply is purely opportunistic, however, and cannot be considered as part of the formal network.

Stuck in traffic: urban transport in Africa
50
Transport services
Buses
With its fleet of about 350 buses, Anbessa City Bus Service Enterprise dominates conventional bus service in Addis Ababa. Although the federal government owns the company, its operations are supported by the city administration, which pays a subsidy for each passenger carried. The level of these subsidies is gradually being re-duced. Originally a private enterprise that held an exclusive franchise for passenger transport services in the city, Anbessa was nationalized in 1974 and made a part of the Passenger Transport Corporation (PTC). Two other PTC divisions were responsible for long-distance bus services and bus materials (spare parts and bodies). In 1996 PTC was broken into its three component parts, restoring Anbessa to its previous status as a freestanding commercial enterprise. Since then the workshop component of Abay Technical Services (the bus materials supply division of PTC) has merged with Anbessa, with which it shares a depot in Yeka.
Anbessa is legally bound to operate in a com-mercial manner, but it lacks the freedom to set fares. These have effectively been frozen since 1992 in the interests of keeping transit affordable for citizens, a priority of the city government. As a consequence of the fare freeze, the municipal and national governments have provided finan-cial support for operations and expansion.
In 2000 the Ethiopian Privatization Agency ear-marked Anbessa for divestiture, but the only likely buyer of the business as it is presently con-figured is the city. In preparation for the divesti-ture, financial due diligence was carried by ex-ternal auditors, who made several; recommenda-tions. These have been carried out only partially, with the result that the enterprise remains en-cumbered by debts that no prospective pur-chaser would be prepared to accept.
Minibus taxis
In addition to Anbessa’s bus fleet, Addis Ababa is served by more than 10,000 minibus taxis that provide service of far higher quality. Minibus taxis are not restricted in terms of the routes or areas in which they may operate. Indeed, opera-tors are free to choose their routes. The fares are controlled by the city government but are two to three times those of city buses. The absence of restrictions on entry has led over the past decade to sharp increases (11 percent per year) in the number of minibuses. Operators have converted Toyota pickups into minibuses or obtained sec-ond-hand buses from Europe and the Middle East. Discipline in the terminals is maintained by self-styled regulators known as “marshals” who collect, on average, 3 to 4 birr per trip from each vehicle.
Fares
The fares for minibus taxis range from 0.60 birr ($0.06) for up to 2.5 km to 3.00 birr ($0.3) for 25 km. Fares on Anbessa buses range from 0.25 Birr ($0.026) for up to 9 km to 2.25 birr ($0.24) for 32–47 km. Almost 95 percent of passengers pay between 0.25 birr and 0.50 birr. Some exceptions apply to recently introduced routes. For exam-ple, one new 40 km route has a fare of 3.00 birr. The fares charged for express services are nor-mally 0.10 birr more than the standard fare. Schoolchildren and students are charged a flat fare of 0.15 birr.
As noted, Anbessa fares are subsidized by the city government, although the level of subsidy has dropped in recent years. The subsidy is presently 0.10 birr ($0.01) per trip; the total amount paid is based on records of numbers of tickets sold. Fares on Anbessa buses are collected by conduc-tors. Paper tickets are used, with different colors for inward and outward journeys. Ten-trip tick-ets are also issued. Because tickets are not sold to passengers before the bus’s arrival, at busy times

51
buses may wait several minutes as passengers board and buy their tickets. And because many passengers must stand it is common practice for conductors to collect fares from passengers through the bus window before they board the
bus. The company estimates that between 5 per-cent and 10 percent of revenue is lost through fare evasion and conductor malpractice, despite the presence of ticket inspectors.


53
Bamako
Mali’s capital and largest city | Population 1.2 million (2006)
Bamako is situated in the southwestern part of Mali on the Niger River, near the rapids that di-vide the river’s upper and middle valleys. As the nation’s administrative center, as well as a river port and a major regional trade center, its popu-lation has grown rapidly from its 1960 level of approximately 160,000. Manufactures include textiles, processed meat, and metal products. The city’s location on the Niger, with its tribu-taries, has shaped its development. Bamako is relatively flat, except to the immediate north, where an escarpment marks the remains of an extinct volcano.
Most traffic in landlocked Mali occurs over land, and most of the north–south trade passes through Bamako, which is divided from east to west by the Niger river. With more than 1.2 mil-lion inhabitants, the city faces manifold prob-lems of urban transport and congestion.
Regulation of urban transport
Bamako has no independent transport authority. The national transportation agency, the Direc-tion Nationale des Transports Terrestres et Fluvi-aux, licenses vehicles for public transport and conducts transport planning. The traffic agency for Bamako District, the Direction de la Régula-tion et du Contrôle du Transport Urbain (DRCTU), is responsible for (i) managing and regulating parking and traffic; (ii) organizing urban public transportation; and (iii) collecting and analyzing road accidents statistics. The na-tional highway agency, the Direction Nationale des Routes (DNR) and Bamako District are re-
sponsible for building and maintaining urban roads.
A Sotrama in traffic
To manage and finance road maintenance, the Autorité Routière (road authority) was created in August 2000. The Road Authority provides maintenance funds, which are administered in cooperation with transport operators and DNR. Insufficient resources for road maintenance and inefficiency on the part of the public implement-ing agencies have led to substantial maintenance backlogs and accelerated the deterioration of the existing network. To address these inefficiencies, the Agence d’Exécution d’Entretien des Travaux Routiers (AGEROUTE) was set up in September 2004 to manage road works. AGEROUTE was established within the framework of the World Bank’s first Transport Sector Project (PST1).
Mali’s government has resolved to improve transportation in the country and to relieve con-gestion in Bamako. To that end, the Ministry of Equipment and Transport commissioned several studies, one aimed at improving traffic condi-tions in downtown Bamako and improving the safety of public transport services. DRCTU is supervising the study.

Stuck in traffic: urban transport in Africa
54
Transport services
Public transport in Bamako has both a struc-tured and a non structured side. On the struc-tured side are private companies that run fleets of large buses that seat 100 passengers. Alongside the large-capacity buses, many informal enter-prises operate minibuses that seat approximately between 25 and 50 passengers. The number of minibuses is about 1,800.
Buses
All of Bamako’s eight bus companies are pri-vately owned. The largest are Diarra Transport, with 25 buses and 2 extended buses; Bani Trans-port, with 54 buses; and Banimonotie, with 10 buses. Each company serves specific routes un-der agreements with the district of Bamako. Fares, too, are negotiated between the owners and the government. The average fare is cur-rently $0.25-$0.30, depending on distance.
The average age of the 168 large buses now in operation is 17 years. Each covers about 225 km per day. According to passenger surveys, buses are irregular, overcrowded, and generally unreli-able.
Minibuses
An overcrowded Dourouni minibus
Minibuses, known as Sotramas, are the most common form of road-based public transport in
the city. Numbering close to 2,000 in 2005, these privately owned vehicles provide dense coverage at low cost ($0.20–$0.25, depending on dis-tance). But service is poor and disorderly, ac-cording to user surveys. The fleet consists almost entirely of old and dilapidated commercial vans imported second-hand. Their average age is about 15 years. The top complaint emerging from passenger surveys is overcrowding during peak hours. Passengers also complain that the Sotramas are dirty and badly driven. Drivers are considered rude. Minibuses of another form, known as Dourouni, operate on one very spe-cific route and are in even worse shape.
Most Sotrama operators own between one and three vehicles. Drivers are paid a lump sum. So-tramas have set stops but will stop for passengers at other points, often causing accidents. Like the buses, most bus stops are in very poor shape.
Despite regulations governing public transport routes, an analysis of service in the city indicates that the large-capacity buses and Sotrama often use the same routes.
Traffic volume is particularly heavy on certain roads (such as the Boulevard du Peuple), at cer-tain intersections (Lumumba and Liberté), and at certain times. At peak periods, 720 Sotrama travel the Boulevard du Peuple every hour. Any solution to traffic congestion in downtown Ba-mako will have to include the rearrangement of congested intersections.
The municipality of Bamako intends to create bus lanes to speed bus traffic during peak hours and a circular road for minibuses around the center of Bamako. Only large buses would be allowed to enter the city center. The World Bank’s Second Transport Sector Project (PST2) is currently being implemented. The project’s
main objective is to provide better access and transport services to rural and urban communi-
ties by improving key rural infrastructure in Mali and urban transport infrastructure in Ba-

City profiles—Bamako
55
mako. The project will facilitate minibus traffic by creating a bus-only lane on Bamako’s Boule-vard du Peuple and reconstructing a dedicated circular road in downtown Bamako. The gov-ernment also recently decided to begin using unleaded gasoline.
Other important forms of transit are taxis—the substantial fleet is all imported second-hand—and motorcycles.


57
Conakry
Administrative and commercial capital of Guinea | Home to one in four Guineans | Population 1.5–2 million
Located on a peninsula that juts out into the At-lantic Ocean, Conakry is the site of most of Guinea’s economic activity. It also houses some 90 percent of the vehicles in use in the country. The old city center on the Kaloum peninsula was built in the colonial period, beginning in 1889. Over the years, the city expanded in a linear fashion. The peninsula remains the center of the city and the site of government offices, the port, corporate headquarters, and markets. The city consists of 5 communes and 99 districts. The communes are decentralized administrative divi-sions that manage their own budgets. They are run by elected mayors.
Regulation of urban transport
A department of the city of Conakry deals with transport, roads, and housing. The mayors of the communes have their own technical depart-ments with the same responsibilities as the city department, but at a lower level. Responsibility for road building and maintenance seems to be clearly divided, with the central government re-sponsible for trunk roads and local governments for secondary and local roads. Responsibility for planning and regulating public transport also seems clearly divided. Nevertheless, the human and financial resources devoted to the tasks are inadequate, and insufficient consultation and coordination between institutions can some-times lead to major problems. One consequence of the institutional weaknesses and lack of re-
sources is the absence of reliable statistics on ur-ban transport.
Vehicles to be used for public transport must obtain an annual license from the National Land Transport Directorate. In fact, however, trans-port operators rarely bother to renew their li-cense. Files are not computerized.
Unions of transport operators are active in each commune. Originally drivers’ unions, the groups have many members who have become owners; indeed, the unions themselves may own some vehicles. Affiliated with the FSNP-TMG (Trans-port and General Mechanical Engineering Fed-eration), the unions manage road transit centers in each commune. Union agents (three to six per transit route) supervise traffic and deal with ac-cidents. In other respects, the unions differ from one commune to another. In one commune, for example, the union provides loans to drivers to acquire a vehicle.
An overloaded Peugeot 505 at a taxi stand
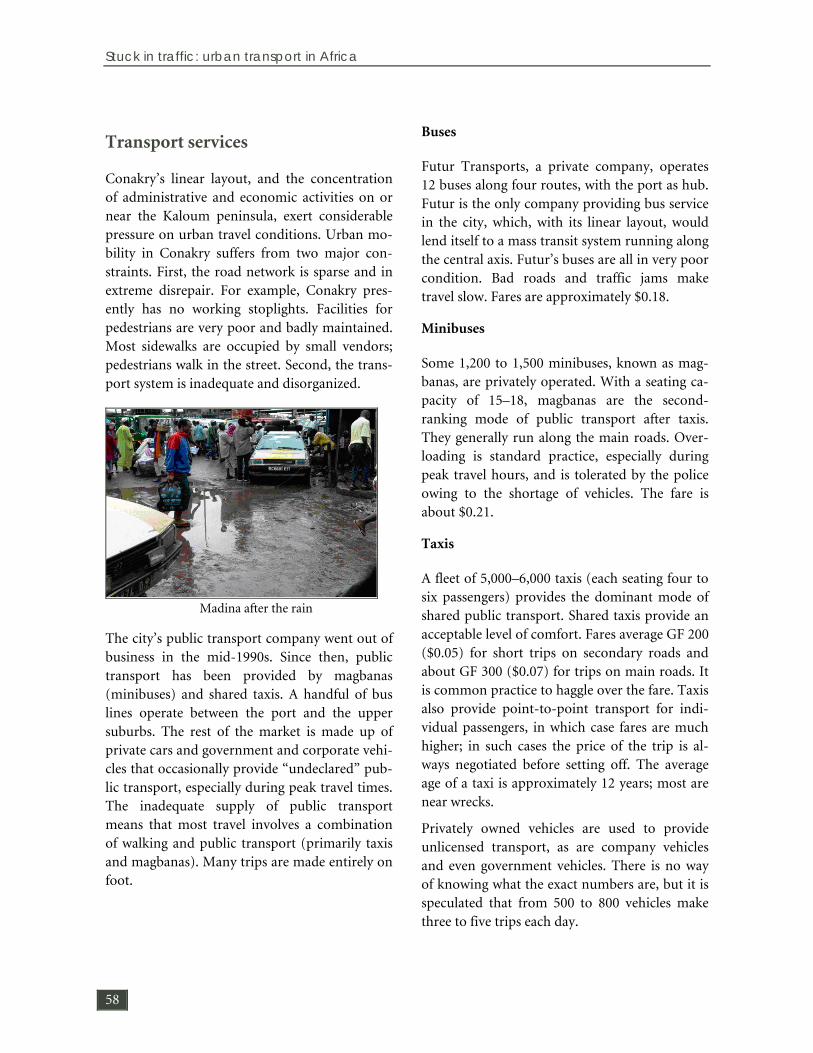
Stuck in traffic: urban transport in Africa
58
Transport services
Conakry’s linear layout, and the concentration of administrative and economic activities on or near the Kaloum peninsula, exert considerable pressure on urban travel conditions. Urban mo-bility in Conakry suffers from two major con-straints. First, the road network is sparse and in extreme disrepair. For example, Conakry pres-ently has no working stoplights. Facilities for pedestrians are very poor and badly maintained. Most sidewalks are occupied by small vendors; pedestrians walk in the street. Second, the trans-port system is inadequate and disorganized.
Madina after the rain
The city’s public transport company went out of business in the mid-1990s. Since then, public transport has been provided by magbanas (minibuses) and shared taxis. A handful of bus lines operate between the port and the upper suburbs. The rest of the market is made up of private cars and government and corporate vehi-cles that occasionally provide “undeclared” pub-lic transport, especially during peak travel times. The inadequate supply of public transport means that most travel involves a combination of walking and public transport (primarily taxis and magbanas). Many trips are made entirely on foot.
Buses
Futur Transports, a private company, operates 12 buses along four routes, with the port as hub. Futur is the only company providing bus service in the city, which, with its linear layout, would lend itself to a mass transit system running along the central axis. Futur’s buses are all in very poor condition. Bad roads and traffic jams make travel slow. Fares are approximately $0.18.
Minibuses
Some 1,200 to 1,500 minibuses, known as mag-banas, are privately operated. With a seating ca-pacity of 15–18, magbanas are the second-ranking mode of public transport after taxis. They generally run along the main roads. Over-loading is standard practice, especially during peak travel hours, and is tolerated by the police owing to the shortage of vehicles. The fare is about $0.21.
Taxis
A fleet of 5,000–6,000 taxis (each seating four to six passengers) provides the dominant mode of shared public transport. Shared taxis provide an acceptable level of comfort. Fares average GF 200 ($0.05) for short trips on secondary roads and about GF 300 ($0.07) for trips on main roads. It is common practice to haggle over the fare. Taxis also provide point-to-point transport for indi-vidual passengers, in which case fares are much higher; in such cases the price of the trip is al-ways negotiated before setting off. The average age of a taxi is approximately 12 years; most are near wrecks.
Privately owned vehicles are used to provide unlicensed transport, as are company vehicles and even government vehicles. There is no way of knowing what the exact numbers are, but it is speculated that from 500 to 800 vehicles make three to five trips each day.

City profiles—Conakry
59
Conakry’s poor must walk a quarter of an hour or more to reach public transport, but difficult access to transport affects all segments of the city’s population as well. Residents of isolated areas cite the poor condition of roads, the lack of
public toilets, and the lack of lighting as top problems. Residents of accessible areas are more likely to cite obstructed sidewalks and the risks incurred by pedestrians.


61
Dakar
Administrative and commercial capital of Senegal | Home to nearly one in three Senegalese | Popu-lation 2.8 million
The population of the Dakar metropolitan re-gion has been growing at around 4.4 percent per year, significantly higher than the national aver-age of 2.2 percent, owing to migration from ru-ral areas. Founded on a peninsula, Dakar has expanded outward in a funnel shape. Many of the newer satellites and suburbs are 30 kilome-ters from the center of the city. Trips to the cen-ter are therefore longer than in many cities of comparable size. The central business district, known as the Plateau, lies at the end of the pen-insula; it has a population of about 900,000. Two major satellite towns are located well to the east. Pikine-Guediawaye has a population of about 1.1 million. Rufisque is a rapidly growing suburb with an estimated population of about 250,000; it lies some 30 kilometers east of Dakar proper. Although the Plateau houses only a third of the region’s population two out of three jobs are located there, so many commuters travel long distances.
Regulation of urban transport
A coordinating body for urban transport, the Conseil Exécutif des Transports Urbains de Da-kar (CETUD), was set up in 1997 to impose or-der on a public transport system characterized by confusion among multiple central and local government institutions. An autonomous body that answers to the Ministry of Transport, CETUD is run by representatives of the principal stakeholders in the public transport sector. It is managed by a 19-member plenary assembly rep-resenting urban transport professionals, repre-
sentatives of state and local authorities, private firms, operators, and consumer associations. The assembly is supported by an executive secretary and 23 staff members, including 10 technical professionals.
CETUD’s operations are financed through the Fonds de Développement des Transports Ur-bains. The state provides an annual sum of 400 million CFA francs ($800,000), and local au-thorities and transport operators are supposed to match that contribution. In principle, CETUD can allocate routes, set fares, and impose service conditions—though some payments require the agreement of the Ministry of Finance. CETUD is currently developing a system of route franchises linked to proposals to renew the minibus fleet. To improve service quality, CETUD has offered training to both owners and drivers. It also acts as the point of contact between the government of Senegal and international donors interested in urban transport.
Transport services
Buses
A state-owned bus company, CSTC, was created in the late 1940s to provide public transit ser-vices between the Plateau and the Medina area. This service was complemented by informal minibuses, or cars rapides, operating initially in suburban areas not covered by the formal ser-vices. In the early 1970s, CSTC was restructured and renamed SOTRAC. Fares were regulated,

Stuck in traffic: urban transport in Africa
62
and the company offered discounts to certain groups of favored travelers (school children, pensioners, etc.). The government was unwilling to raise fares to keep up with inflation. During the Structural Readjustment Programs of the mid-1990s, the financing problems were com-pounded by the withdrawal of the tax conces-sions (on import duties and value-added tax) that the company had enjoyed. SOTRAC’s fi-nancial position deteriorated, preventing the company from replacing old vehicles. The fleet declined from 505 vehicles in 1987 to 200 in 1996. By this time SOTRAC was technically bankrupt.
With encouragement from the government, a new private company, Dakar Dem Dik (DDD), took over the assets of SOTRAC and com-menced operation in 2001. The company’s capi-tal stock is shared between the Senegalese gov-ernment (76.6 percent) and private Senegalese investors. DDD began with 60 buses, but by 2004 the number had fallen to fewer than 40, resulting in spotty service, long intervals between buses, and frequent breakdowns. Over the past two years, additional buses have been procured with bilateral assistance, bringing their total number to about 400 minibuses. The terms of the financial arrangements between DDD and the government are not publicly available, but the basis of DDD’s concession is that it will con-tinue to charge the same fares as its predecessor company, SOTRAC. A regular subsidy is cur-rently being paid, although the amount is not known.
Minibuses
In the past, efforts to provide route monopolies to DDD have not protected it from competi-tion—indeed, the private sector has long met most transport demand. The cars rapides are by
far the most common form of road-based public transport in the Dakar area. The fleet consists almost entirely of imported second-hand com-mercial vans, mainly Mercedes or Renaults, which are converted to passenger use on arrival. The reason for converting vans, rather than buy-ing specially made minibuses are partly eco-nomic—import duties on commercial vehicles are significantly lower than on passenger vehi-cles. But they are also partly practical, as spare parts are readily available, and local mechanics are familiar with the commercial vehicles. The cars rapides seat between 23 and 32 passengers, depending on model type. Access is through doors at the back.
Cars Rapides awaiting passengers
Illegal taxis
Illegal taxi services, known as clandos, are private cars used to provide a taxi service when not re-quired for the owner’s personal use. Often the driver takes the owner to work and then is en-couraged to use the vehicle in a remunerative fashion until the owner needs it again.
In Dakar, travel by illegal clandos taxis was popu-lar, although fares were more expensive, typically about 150–200 CFA francs ($0.36-$0.48) per passenger trip, as against 100 CFA francs ($ 0.24) for a legal taxi ride.

City profiles—Dakar
63
Fares
Except on DDD buses, fares are negotiable, with lower fares in the middle of the day—and also in the middle of the month, when passengers have less funds available. In addition, fares vary ac-cording to the distance of the trip; rates are ne-gotiated before entering the vehicle. Hiring a taxi for sole occupancy can easily cost 1,500–2,500 CFA francs ($3.57–$5.95). Sometimes regular
daily commuters hire the same driver and taxi every weekday morning to make a specific trip, with each passenger paying a share—in the eve-ning, each passenger makes his or her own way back home. Baggage charges are negotiable. As a general rule, if a bag takes up a passenger seat, it is charged as a passenger. In the same way, very small children may be accommodated on laps without charge, but when they occupy a seat, they are charged as an adult.


65
Dar es Salaam
Administrative and commercial capital of Tanzania | Population 3.0 million
One of Africa’s busiest ports and an important transportation hub, Dar es Salaam lies at a natu-ral harbor on the Indian Ocean. The population is estimated to be increasing at a rate of 4.3 per-cent annually.
Regulation of urban transport
Several government agencies are involved in the regulation and control of urban transport activi-ties.
The Surface and Marine Transport Regulatory Authority (SUMATRA) was established by an act of parliament in 2001 to regulate rail, road, and maritime transport. SUMATRA came into being in 2004. Its mission is to promote, facilitate, and ensure the availability of efficient, safe, fair, reli-able, and environmentally friendly surface and marine transport services through competition, fair trade, and provision of information to con-sumers and stakeholders. In Dar es Salaam, SUMATRA is responsible for transport plan-ning; issuing, renewing, and cancelling licenses; regulating rates and charges; monitoring per-formance of the regulated sectors; facilitating the resolution of complaints and disputes; and dis-seminating information. Within the framework of its Road Transport Regulation function, routes, schedules, and bus/mini-bus fares are subject to SUMATRA’s approval.
Responsibility for building, maintaining, and improving roads is shared. The Tanzania Na-tional Roads Agency (TANROADS), an execu-tive agency of the Ministry of Infrastructure and
Development (MOID), is responsible for the maintenance of key arterial roads, especially those that form part of the trunk road network. The three municipalities within the Dar es Sa-laam region are responsible for the maintenance of all other roads within their boundaries. Main-tenance funds are made available to Tanroads and the city council from the national road fund.
The Ministry of Land, Housing, and Settlement Development and the Dar es Salaam City Coun-cil (DCC) are responsible for urban planning. MOID, DCC, the municipalities SUMATRA, and a new agency, the Dar es Salaam Rapid Transit agency (DART) are responsible for transport planning.
The Dar es Salaam City Council owns 51 percent of the parastatal bus operator, UDA. The DCC oversees urban transport policy and planning, including infrastructure development, through its transport committee.
The Ministry of Public Safety and Security, act-ing through the national traffic police, is respon-sible for enforcing traffic laws, traffic and park-ing regulations and vehicle safety and licensing.
Transport services
The demand for public transport in Dar es Sa-laam has been growing faster than the resources available to satisfy it. Fueling this growth is the expansion of the city’s population and area, due to uncontrolled development. The average mo-bility of most city residents is low. Many cannot afford public transport (where it is available),

Stuck in traffic: urban transport in Africa
66
and cycling lanes and pedestrian paths are gen-erally not available. Along most roadways, the space reserved for non motorized transport has been encroached by various roadside businesses.
The availability of funds from the national road fund has made it possible to keep the recently rehabilitated network of arterial roads in rea-sonably good condition. The recent sharp in-crease of funding to the municipalities should enable them to improve the network under their responsibility, which is generally in poor condi-tion.
Dala-dala minibus at a market entrance
The system operates with minimum regulation as regards to market entry, level of service, and safety. For many years, only the state-owned bus operator, Shirikia la Usafiri Dar es Salaam (UDA), was allowed to operate transport ser-vices, but the company could not keep up with demand, and many private operators co-existed with the state company. In 1983, the market was deregulated. UDA quickly lost market share to private operators of minibuses known as dala-dalas, as the operators were freed of remaining restrictions. Entry into the market is not re-stricted by law, although it is very difficult for new operators to raise capital.
Many private companies, schools, parastatals companies, and government departments pro-vide dedicated bus transport for their personnel.
Having made a commitment to improve the quality of urban transport, the Tanzanian gov-ernment is implementing a bus rapid transit sys-tem in Dar es Salaam. Dar Rapid Transit, or DART, will be introduced in phases with a planned opening of 20 kilometers of busways in 2010. Eventually the network will comprise 130 kilometers of busways, with connections to feeder services and bicycle routes. The system will have 18 terminals and some 228 stations.
The publicly owned bus company
After it was nationalized in 1970, UDA was held jointly by the Dar es Salaam City Council (51 percent) and the National Transport Corpora-tion (49 percent). As a parastatal, UDA received subsidies to purchase buses, spare parts, and tools, and to support management and training. The assistance came directly from the central government and several bilateral donors. How-ever, UDA’s services remained inadequate owing to an aging fleet, shortages of foreign exchange to purchase spare parts, lack of qualified person-nel, failure to adhere to schedules because of growing congestion, and unrealistically low fares.
As noted, UDA’s tenure as the sole operator of public transport in Dar es Salaam came to an end in 1983. As UDA ceded a growing share of the market to private providers, its staffing levels shrank more slowly than its fleet. The ratio of staff to operating buses swelled from 11:1 in 1984 to 18:1 in 1990. UDA now operates ap-proximately 36 26-seat minibuses and plays only a negligible role in providing public transport.

City profiles—Dar es Salaam
67
Since legal operations began in 1983, the dala-dala (the word comes from dollar-dollar) fleet has been quite diverse. Most vehicles are im-ported second-hand from Japan and the Middle East. Popular makes and marks are the Toyota Hiace, Toyota Coaster, Isuzu Deluxe, and Mazda. Capacity ranges from 18 to 35 passen-gers. The Toyota Hiace, with a capacity of 18 passengers, is the most popular. Altogether, ap-proximately 7,000 dala-dala vehicles owned by some 3,000 operators ply 190 routes in the city.
Routes range from 3 km to approximately 30 km in length, the latter being peri-urban routes. The fare ranges from $0.16 to $0.26. Services are not scheduled, and vehicles depart only when full. Drivers are paid on commission based on the revenue they collect. Some operators stipulate revenue targets to be met by their drivers. Both methods encourage speeding, excessive passing (or overtaking), poor parking practices, and fre-quent stops to pick up or drop off passengers.
Most dala-dala operators lack proper mainte-nance facilities and programs. Even minor re-pairs are made only after the driver insists. Ma-jor repairs are generally done at garages belong-ing to friends of the operator.
Surveys reveal that users are dissatisfied with data-dala service. Vehicles are uncomfortable and badly maintained, terminals are in poor condition, and emissions are increasing.
The Dar Commuter Bus Owners Association (DARCOBOA) looks after operators’ interests.
Private operators (dala-dala)


69
Douala
Commercial capital of Cameroon | Home to 17 percent of the country’s people | Population 2.5–3 million
Douala is a relatively compact city, with devel-opment extending only 15 km from the city cen-ter. The city grew up around the port on its south side, but there are substantial industrial and residential areas in Bonabéri, north of the River Wouri. The road system is based on radial routes, with poor orbital connections.
Regulation of urban transport
Road Failure at major junction
In 1995, bus services in Douala—and in Yaoundé, the capital—were provided by the So-ciété des Transports Urbains du Cameroun (SOTUC), owned partly by the central govern-ment and partly by the municipalities. In that same year, some 9,000 unlicensed minibuses (capacity: 14–18) also operated in Douala, carry-ing far more traffic than SOTUC. Over the years, SOTUC’s financial position and operating capa-bilities had steadily worsened. Accumulated debts exceeded 4 billion CFA francs ($8 million),
and the company was carrying just 5 percent of the city’s passenger traffic.
The government closed SOTUC in order to pur-sue a long-term policy of liberalization of urban transport. Its intention was that operators should be allowed to compete on price, service, and route structure. Competition among opera-tors, it was hoped, would make subsidies unnec-essary and reduce the need for regulation.
It was recognized, however, that a transition phase would be necessary. The first contracts for bus services in Douala provided for a five-year monopoly on fixed routes at fixed fares. It was hoped that, after this period of protecting the “infant industry,” the operating companies would be sufficiently well established to permit the introduction of a competitive regime. Bid-ding for rights to operate 15 routes in Douala began in January 2000.
Transport services
Buses
In January 2001, the Société Camerounaise des Transports Urbains (SOCATUR), a new private company owned by 35 Camerounian investors, commenced bus service in Douala. The contract between SOCATUR and the national govern-ment specified the routes that SOCATUR would operate and gave SOCATUR a monopoly on those routes for an initial period of five years. The government also suppressed minibus opera-tions in an attempt to protect SOCATUR’s inter

Stuck in traffic: urban transport in Africa
70
ests. Fares were initially set at 125 CFA francs ($0.25) per journey.
SOCATUR receives no subsidies. Unlike SOTUC, it does not benefit from concessions on import duties or value-added taxes. SOCATUR purchased 109 second-hand vehicles to begin operations, partly from SOTUC and partly from RATP, Paris’s rapid-transit authority. By 2005, the bus fleet had shrunk to 70 vehicles, resulting in reduced coverage, particularly in low-income areas.
SOCATUR bus in heavy traffic
SOCATUR’s failure to provide an effective bus service, combined with the suppression of mini-bus services, has meant that shared taxis now form the basis of the city’s public transport sys-tem.
Shared taxis and motorcycle taxis
Douala’s taxi companies play the role of mini-buses in other African cities—with much the same industry structure. All of Douala’s fleet of 9,000 to 10,000 taxis are imported second-hand, usually from Europe. Most are in poor condi-tion. Vehicles are rented out to drivers on a daily basis at a fixed price that depends on the condi-tion of the vehicle. The drivers retain all fares. The owners are responsible for vehicle mainte-nance, while the drivers buy fuel. There are per-haps 3,000 owners, of whom 1,000 are owner-
drivers. There are no formal taxi companies, and few individuals own more than 10 vehicles.
Eight taxi syndicates represent operators’ in-terests to the government. By law, taxi operators must be members of a recognized syndicate, al-though a substantial number of unregistered taxis, known as clandos, are in operation. There is little evidence that the syndicates exercise any significant market power.
The taxis operate throughout the city, though some tend to follow set routes. The poor state of the minor roads makes drivers reluctant to oper-ate in certain residential and industrial areas. There is visible excess capacity in the off-peak period, but at peak hours, it can be difficult to find a taxi.
The use of moto-taxis (also known as motorcy-cle taxis or “bendskins”) has grown spectacularly in recent years. Discussions with drivers and the Ministry of Transport suggest that they now number more than 10,000.3 The moto-taxis are much more maneuverable than 4-wheel vehicles and more suitable for travel on poor roads. Most of the motorcycles have small engines (less than 100 cc), but the use of more powerful vehicles is growing.
3 “Pauvreté et Mobilité Urbaine à Douala” (Urban Mobility Study) gave an estimate of 22,000 to 30,000, but the basis of the estimate is not clear.

71
Kampala
Administrative and commercial capital of Uganda | Population 2 million
Lying near the north shore of Lake Victoria, Kampala is built on hills that surround the city center. The density of housing and population is relatively low. The population is concentrated around the historic radial routes leading from the city center. About 7 percent Ugandans al-ready live in Kampala, and the city is growing rapidly. The population increased by 56 percent between the two censuses of 1991 and 2002—an average annual growth of 5 percent. The trend is expected to continue owing to natural popula-tion growth and migration from other parts of the country.
Regulation of urban transport
Traffic congestion in Kampala
Until its nationalization in 1972, the privately owned Uganda Transport Company (UTC) held an exclusive franchise to provide bus service in Kampala. Its only competition came from shared taxis based on station wagons (saloon or estate cars).
Following UTC’s nationalization, and during the period of national chaos that preceded the for-mation of the present government in 1986, UTC contracted and focused more closely on long-distance services, creating an opportunity for other private operators to provide urban trans-port services in Kampala.
Most of the new operators used small minibuses (though a few “midi-buses” from Kenya were deployed). Early entrants earned high returns, which then attracted additional investment—until the market saturated. At that stage, the Uganda Taxi Operators and Drivers Association (UTODA) emerged to bring order to the market through self-regulation and control of the ter-minals. UTODA benefits from strong political patronage; some senior officials are major fleet owners. Individual vehicle owners were margin-alized in the process, and their association (the former Taxi Owners Association) ceased activity in Kampala.
UTODA pays an important role in the de facto regulation of the minibus industry in Kampala. All operators and drivers are expected to be members, and this can be violently enforced. UTODA charges minibus drivers a fixed daily fee on their first entry into the main taxi terminals and an exit fee on each departure. The income from drivers’ fees is theoretically shared with the city council, according to the number of taxis using the facility, but large payment arrears are reported.
The power to set the routes served by different operators and the quality of service provided is

Stuck in traffic: urban transport in Africa
72
held by the Kampala Transport Board (KTB). Thus licenses to operate minibuses in Kampala do not specify particular routes or times of op-eration. Nor does the license specify whether the minibus will serve urban or rural routes. In prac-tice operators switch between town and country routes depending on demand.
UTODA, not the Ugandan government, sets standard fares for each route.
Transport services
Public transport is provided mostly by mini-buses. In addition, both bicycles and motorcy-cles can be hired transport passengers and goods.
Kampala central taxi terminal
Known as taxis, the minibuses operate on the main radial roads without fixed stops or timeta-bles. Drivers pay a daily fee to the owner and are responsible for fuel and terminal charges. Taxis wait for passengers in “taxi parks,” large open areas serving as a kind of terminal. Under a fee-
based franchise contract with the Kampala city council, UTODA manages the two main termi-nals. The franchise contract must be renewed periodically and is theoretically subject to a pub-lic competitive tendering process, though UTODA has maintained control of the terminals since 1986.
Specimen minibus fares quoted to researchers were USh 300–500 ($0.15–25) to Nateete (6 kms); USh 700 to Mukono (22 kms); and USh 1,200–1,300 to Entebbe (40 kms). However, the fares that passengers actually pay are determined by individual operators depending on the state of the market. Fares increase in peak periods (when overloading is widespread) and at times of high demand, such as just before Christmas (when supply also goes down, as some urban drivers find it more profitable to switch to inter-urban routes). At quiet periods, passengers can negotiate fares down by bargaining before boarding.
Motorcycle taxis charge USh 500–1000 shillings ($0.25–50) per trip. Most trips are relatively short jaunts, either in the city center or in con-necting areas not well served by minibuses.
Large buses are not used for public transport in the greater Kampala metropolitan area. In 1994 a distributor of commercial vehicles established City Link, a private large-bus operation with some 40 vehicles in service and financing for a further 80 buses. UTODA opposed the initiative, and City Link soon collapsed.

73
Kigali
Capital and largest city of Rwanda | Population 850,000 (2005)
Kigali, situated in the center of Rwanda, has been the economic, cultural, and logistical hub of the country since its independence in 1962. The city’s eight communes (districts) are built on interlocking, oval-shaped hills, which pro-gressively converge and are separated from each other by large valleys.
After growing slowly for four decades, Kigali underwent a growth spurt after the 1994 war and genocide, as Rwandans returned from other parts of the world and settled in the capital, where they felt safe. The city’s population is in-creasing at an annual rate of 3.1 percent.
Most of the city’s roads are in very poor shape. Paved roads are old and in need of rehabilita-tion. Rainwater coursing over the roads—for lack of storm drains and sewers—has taken its toll. At some locations in the city, road links have deteriorated beyond repair and must be rebuilt. Some of the most serious urban trans-portation problems can be traced to the shortage of skilled managers and professionals in the city and in the transport industry as a whole. Fiscal problems, springing from low local tax revenues, are another major factor affecting the perform-ance of urban transport institutions. Visual ob-servations show that the most serious problems in the city’s transportation network are inade-quate facilities and the lack of space for pedestri-ans and motorcyclists. As a result of road safety problems, an average of 150 persons per month are reported to be involved in accidents, many fatal. Many cases go unreported.
Regulation of urban transport
There is no independent transport authority in Kigali. The road fund, the Ministry of Infrastruc-ture, the city of Kigali, and the districts are re-sponsible for building and maintaining urban roads. Responsibility for urban and transport planning is shared by the Ministry of Infrastruc-ture with the city, the districts, and the Office National de Transport en Commun (ONATRACOM), a parastatal company that provides transport services. ONATRACOM is also responsible for vehicle inspection. The Rwanda Utilities Regulatory Agency is responsi-ble for fares and licenses.
Public and private transport operators are or-ganized into four bodies that manage transport in Rwanda. The four are ATRACO, ONATRACOM, Rwanda Taxi Operators, and the Drivers Association. They play an important role in representing the interests of bus operators and taxi operators before regulators.
Transport services
The public transport services that serve the ma-jority of Kigali’s residents are a fleet of approxi-mately 2,000 privately owned minibuses, seating 14–20 passengers and known as twegerane or shared taxis; approximately 120 conventional buses seating 30 to 60 people; approximately 900 four-seat taxis voitures; and some 3,000 motor-cycle taxis.

Stuck in traffic: urban transport in Africa
74
Motorcyclists are a means of transport for many residents. Their number has increased greatly in recent years, but the growth has yet to be re-flected in traffic planning. Walking or bicycling is the chief form of urban transport for many in the city, but many roads lack sidewalks for pe-destrians or lanes for cyclists. Many intersections lack crosswalks; bicyclists are forced to squeeze onto the road with vehicles, often causing fatal accidents..
Shared taxis
Shared taxis awaiting passengers
Shared taxis, typically Toyota minibuses, are the main form of public transport in Kigali. The typical operator is an enterprising individual who has another job and owns several vehicles. The drivers are offered a salary basis or a share of profits. Assisting the driver is a conductor (con-voyeur). Taxis run between two terminals (known as taxi parks) but stop frequently en route to pick up and drop off passengers. Most
wait until they are full before departing and may also wait along the route if not enough people are on board.
Vehicles carry up to 18 passengers, in addition to the driver and the conductor. The conductor is responsible for opening and closing the main sliding door and collecting money from passen-gers. No tickets are issued. The average fare is about $0.28. Buses are generally unsafe because of overcrowding, worn tires, poor maintenance, and poor training of drivers. A yellow stripe running around the vehicle indicates the start and end points of the vehicle’s route. Most ser-vices start or finish either in the city center or at the city’s main national bus station.
Buses, taxis voitures, and motorcycle taxis
ONATRACOM, government-owned but oper-ated by National Board for Public Transport, provides urban and intercity bus service using approximately 120 conventional buses that seat from 30 to 60 passengers and follow fixed routes.
Approximately 900 taxis voitures seating four passengers are available for individual travel. Most are white with an orange stripe down the sides. Fares vary from $1.75 to $4.50 for a trip across the city.
Some 3,000 motorcycle taxis, or “taxis motos,” offer a service similar to a taxi but for lower prices, typically $0.35–1.85.

75
Kinshasa
Capital and largest city of the Democratic Republic of Congo | Population 8 million
Once the site of fishing villages on the Congo River, Kinshasa is now a megacity of approxi-mately eight million residents and growing at the rate of 4.1 percent per year. Tied with Johannes-burg as the second-largest city in Sub-Saharan Africa after Lagos, Kinshasa is a city of sharp contrasts, with affluent residential and commer-cial areas alongside sprawling slums. It is located on the south bank of the river, directly opposite Brazzaville, the capital of the Republic of Congo.
After the Nile, the Congo River is the second-longest river in Africa and an important source of hydroelectric power. Downstream of Kin-shasa, it has the potential to generate enough power for the whole continent. Kinshasa is both a city and a province, one 11 provinces in the DRC. Its status is thus similar to that of London and Paris. The city-province of Kinshasa is di-vided into 24 municipalities (communes).
Regulation of urban transport
Kinshasa has no independent transport author-ity. The national road safety commission (Com-mission Nationale de Prévention Routière) is a branch of the Ministry of Transport established to regulate road transport.
The national government, through the Ministry of Economy, and the Kinshasa city government, set the fares and determine the routes, with in-put from operators. The current bus fare of $0.33 is based on the purchasing power of the population and on operating costs, which take
into account variables such as gasoline prices and the exchange rate.
Buses must be insured by the Société Nationale d’Assurances, a national insurance company, and registered with the Direction Générale des Impôts, the tax authorities. Informal operators routinely disregard these requirements.
The Ministry of Public Works and Infrastructure is responsible for building the country’s roads and for maintaining the main arteries in the city. The Kinshasa city government is responsible for maintaining other city roads. Generally speak-ing, planning is the responsibility of the Ministry of Planning, but the Ministry of Transport is responsible for transport planning through its transport study group, the Groupe d’Etudes de Transport.
Transport services
Public transport in Kinshasa is provided by an urban transport company, the Société des Transports Urbain du Congo (STUC); informal operators who are not organized; and the rail-road company, the Office National de Transport (ONATRA).
Informal services
Approximately 1,200 minibuses, imported sec-ond-hand, specialize in short-distance trips. Lacking in comfort and safety, they respond to incentives to transport as many passengers as possible, providing more than two-thirds of all transport services in Kinshasa. Seating capacity

Stuck in traffic: urban transport in Africa
76
ranges from 5 to 26, but minibuses may carry up to 50 passengers. Vehicles are poorly main-tained; there are no requirements or facilities for regular maintenance. Service is unscheduled and chaotic; passengers may wait for hours for an overcrowded bus. The poor condition of the roads and congested traffic exacerbate the situa-tion. The union of informal bus operators is the Association des Chauffeurs du Congo.
Formal bus service
STUC, a limited company, became operational in 2006. Its creation, made possible by a grant of $33.5 million from the government of India, marks a renewal of public transport in the coun-try. The objective is to create an organized public transport system in Kinshasa.
STUC’s fleet consists of 180 large buses and 36 minibuses—together the fleet provides 31 per-cent of Kinshasa’s urban transport. The buses, made by India’s Tata company, are two years old and seat 44; they may carry 100 passengers dur-ing peak hours. Minibuses, also made by Tata, have a seating capacity of 26 but usually carry 50 passengers. Due to the poor condition of the roads less than two-thirds of the fleet are opera-tional. On average the buses cover a 16 km route in 48 minutes, which represents an operating speed of 20km/h.
Although not subsidized by the government, and despite the fact that more than 30 percent of its passengers are nonpaying customers, STUC is making a profit. The company is well organized. Buses are new and technically sound; bus drivers and conductors are professionally trained; and buses are regularly maintained in STUC installa-tions. Tata buses have a long lifespan and benefit from technical assistance from Tata Motors, Ltd, to train technicians to maintain the vehicles.
Despite STUC’s excellent organization, however, buses are scarce and irregular, often owing to poor road conditions and traffic congestion. Pas-sengers complain of overcrowding, discomfort, and extremely long waiting periods.
Railroad
ONATRA, a publicly owned company based in Kinshasa, operates railways, ports, and river transport in the north and west of the country. The urban component of its network carries no more than about 8,000 passengers per day due to the deteriorated condition of its fleet.
A full bus takes on more passengers in Kinshasa
Would-be passengers vie for space on an old VW minibus

77
Lagos
Commercial capital of Nigeria and largest city in West Africa | Population [X] million
The megacity of Lagos has grown beyond the physical boundaries of the state of Lagos, spilling over into the adjoining state of Ogun. The city was already large by the time of Nigeria’s inde-pendence. For the last 20 years of the last cen-tury, however, its population grew at a rate of about 3.5 percent per year. Since 2000, the rate has been about 6 percent. Although the smallest state in Nigeria, Lagos is by far the most densely populated. By 2015, the population of the megacity is projected to be about 25 million, making it the third-largest in the world. Lagos’s seaport and international airport handle more than 70 percent of the nation’s cargo.
Regulation of urban transport
Almost 100 agencies at the federal, state, and local levels have a part in the organization and regulation of urban transport in Nigeria. At the federal level, the Ministry of Transport makes national transport policy, but urban transport is one of the functions devolved to the states by the 1999 Constitution. The states make their own laws on traffic and transport, but Lagos state has not yet updated its primary legislation (dating from 1949) to incorporate relevant federal stan-dards.
The Nigeria Police and Lagos State Traffic Divi-sion, which includes traffic wardens, and the Federal Road Safety Commission, which is re-sponsible for traffic control and enforcement, primarily on federal roads, are examples of fed-eral agencies with divisions in the states. Some-what confusingly, the state directors of motor
vehicle administration are federal appointments; the directors are responsible for regulating transport in each state.
At the state level, the state ministries of transport are the lead agencies for transport planning and regulation. The motor vehicle administration in each state regulates public transport. The Lagos State Traffic Management Authority is responsi-ble for traffic management on all state roads. The state ministry of works bears chief responsi-bility for the state road network. Local govern-ment councils are responsible for local traffic management schemes, parking control, and management of public transport terminals.
Lack of adequate road space for vehicles
Despite, or perhaps because of, the diffusion of authority, Lagos’s transportation infrastructure has not kept pace with the city’s growth. To ad-dress the neglected transport needs of the me-tropolis and to coordinate the activities of mul-tiple agencies responsible for making and im-plementing transport policy, the Lagos Metro-

Stuck in traffic: urban transport in Africa
78
politan Area Transport Authority (LAMATA) was created in 2002.
LAMATA is a corporate body with an independ-ent board responsible for formulating, coordi-nating, and implementing urban transport poli-cies and programs in the metropolitan area. Its specific functions are, with reference to metro-politan Lagos:
To ensure the serviceability of the roads network
To ensure efficient and effective movement of traffic
To coordinate the supply of public transport
To make policy recommendations to the governor, with suggestions for their imple-mentation.
The law grants LAMATA powers to accomplish its statutory functions, including the power to levy and collect user charges in connection with its services and to collect other tariffs, fees, and road taxes as may be authorized by the governor.
LAMATA’s 13-member board of directors is fairly representative of the agency’s stakeholders, comprising representatives of transport opera-tors, transport unions, organized private provid-ers of transport services, the general public, local governments, and state agencies with a hand in transport policy, regulation, or provision. The only full-time member of the board is its manag-ing director.
Five directorates and four units report to the managing director. The directorates are corpo-rate and investment planning; finance; public transport; traffic management; and roads main-tenance. The units are corporate and legal ser-vices; environmental and social safeguards; in-ternal audit; and procurement. These director-ates and units are equipped with up-to-date in-formation technology resources, including GIS.
The status of the traffic laws and regulations is very uncertain, in part because two different sets
of rules remain on the books. Both sets of regu-lations are based on the principle of regulating individual vehicles, and thus are difficult to square with fleet operations or the franchising of services. In an effort to introduce a consistent set of provisions for awarding a franchise (a collec-tive license covering all buses in one owner’s fleet, or all the buses on one route or in one zone), LAMATA’s powers were expanded in March 2007 from the planning and coordination of transport operations to their actual regula-tion. The power to regulate franchises enables LAMATA to award concessions for exclusive operating rights on defined routes or in specific geographical areas. A pilot scheme is to be im-plemented in late 2007.
The legal framework for the regulation of bus services is set forth in three laws: the Central Li-censing Authority Law of 1980; the National Road Traffic Regulations of 1997 (adopted un-der the Federal Road Safety Commission Decree of 1988); and the Lagos State Road Traffic Law and subsidiary legislation dating from 1949. These laws and regulations contain inconsistent provisions. The 1997 regulations refer to the state director of the Motor Vehicle Administra-tion (a federal appointee) as the authority for the regulation of public transport services, including setting fares, schedules, and stops, whereas sec-tion 46 of the 1949 Road Traffic Law empowers the state transport commissioner to make regu-lations on a wide range of matters related to public transport services, including fares, time-tables, operating days and hours, mechanical requirements, and drivers’ hours. Section 11 of the same law permits local government councils to adopt by-laws specifying bus routes and stops, among other things.
Transport services
Urban transport in Lagos is almost entirely owned and managed by the private sector—
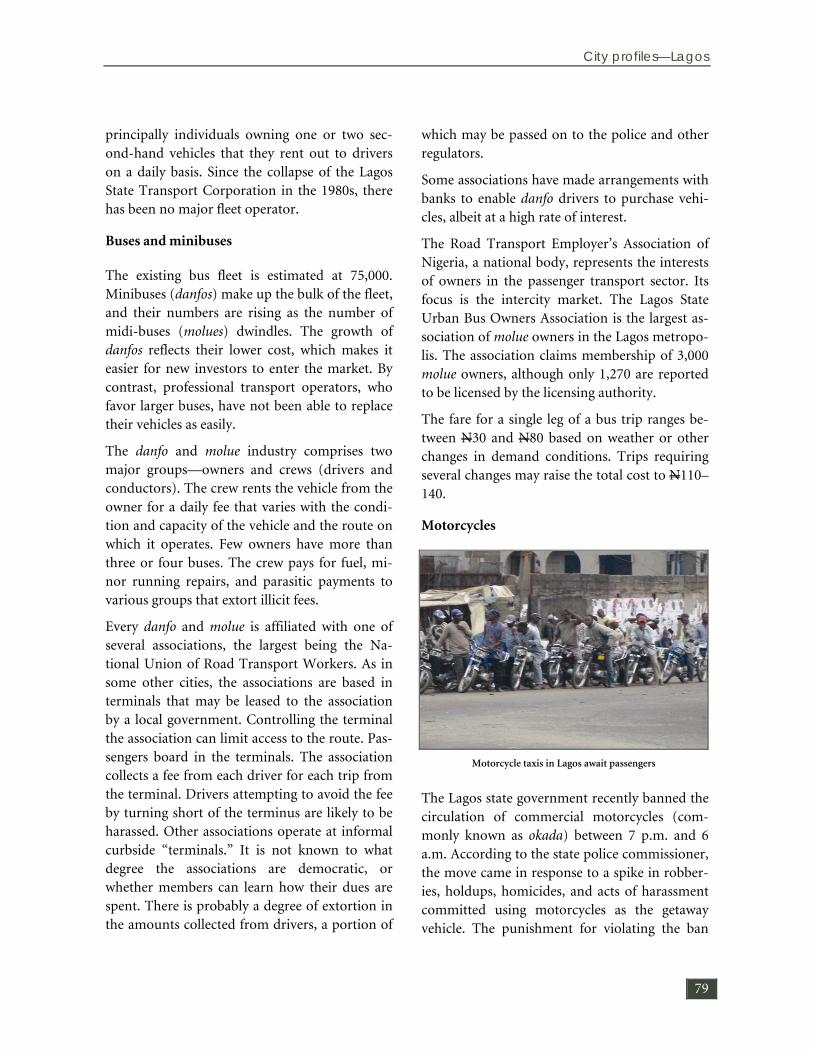
City profiles—Lagos
79
principally individuals owning one or two sec-ond-hand vehicles that they rent out to drivers on a daily basis. Since the collapse of the Lagos State Transport Corporation in the 1980s, there has been no major fleet operator.
Buses and minibuses
The existing bus fleet is estimated at 75,000. Minibuses (danfos) make up the bulk of the fleet, and their numbers are rising as the number of midi-buses (molues) dwindles. The growth of danfos reflects their lower cost, which makes it easier for new investors to enter the market. By contrast, professional transport operators, who favor larger buses, have not been able to replace their vehicles as easily.
The danfo and molue industry comprises two major groups—owners and crews (drivers and conductors). The crew rents the vehicle from the owner for a daily fee that varies with the condi-tion and capacity of the vehicle and the route on which it operates. Few owners have more than three or four buses. The crew pays for fuel, mi-nor running repairs, and parasitic payments to various groups that extort illicit fees.
Every danfo and molue is affiliated with one of several associations, the largest being the Na-tional Union of Road Transport Workers. As in some other cities, the associations are based in terminals that may be leased to the association by a local government. Controlling the terminal the association can limit access to the route. Pas-sengers board in the terminals. The association collects a fee from each driver for each trip from the terminal. Drivers attempting to avoid the fee by turning short of the terminus are likely to be harassed. Other associations operate at informal curbside “terminals.” It is not known to what degree the associations are democratic, or whether members can learn how their dues are spent. There is probably a degree of extortion in the amounts collected from drivers, a portion of
which may be passed on to the police and other regulators.
Some associations have made arrangements with banks to enable danfo drivers to purchase vehi-cles, albeit at a high rate of interest.
The Road Transport Employer’s Association of Nigeria, a national body, represents the interests of owners in the passenger transport sector. Its focus is the intercity market. The Lagos State Urban Bus Owners Association is the largest as-sociation of molue owners in the Lagos metropo-lis. The association claims membership of 3,000 molue owners, although only 1,270 are reported to be licensed by the licensing authority.
The fare for a single leg of a bus trip ranges be-tween N30 and N80 based on weather or other changes in demand conditions. Trips requiring several changes may raise the total cost to N110–140.
Motorcycles
The Lagos state government recently banned the circulation of commercial motorcycles (com-monly known as okada) between 7 p.m. and 6 a.m. According to the state police commissioner, the move came in response to a spike in robber-ies, holdups, homicides, and acts of harassment committed using motorcycles as the getaway vehicle. The punishment for violating the ban
Motorcycle taxis in Lagos await passengers

Stuck in traffic: urban transport in Africa
80
includes seizure of the motorcycle and a fine of N 50,000 ($400). The ban has led to the disap-pearance of motorcycles from many parts of the city, leaving many commuters with no way to and from work. Transport fares have tripled with the contraction in supply.
The Motorcycle Operators Association of Nige-ria is contesting the ban. Because no alternative to motorcycle transport has emerged, commut-ers, too, want the government to find a way to differentiate between commercial vehicles and
those being used for personal (possibly illicit) purposes.
Before the 1990s, commercial motorcycle opera-tors were unknown in the country. However, economic depression, factory closings, and mass retrenchments of workers, coupled with declin-ing public transport services, proved fertile soil for the growth of this informal commercial business. The number of motorcycles on the roads is unknown; many are unregistered.

81
Nairobi
Capital and largest city of Kenya | Population 4 million
Although it is by far the largest city in Kenya, Nairobi and its immediate environs hold only about 10 percent of the country’s population. That share is expected to grow rapidly over the next 10 years, however, in good part owing to migration. The city has no major rivers, moun-tain ranges, or other geographical impediments to expansion.
Regulation of urban transport
Failure of Traffic management in Nairobi
The national Ministry of Transport licenses ve-hicles and regulates transport services through its Transport Licensing Board. The ministry also makes national transport policy. License fees are remitted directly to the treasury, rather than to local authorities, which must rely on govern-ment allocations.
The institutional framework for traffic safety is flawed. Policy making related to traffic safety and management is not reflected in transport
planning, traffic engineering, operations man-agement, and vehicle inspection.
Responsibility for urban transport—including roads and transport services—is shared by sev-eral bodies, public and private. At the local level, the Nairobi City Council (NCC) is charged with planning and managing the urban road infra-structure system, but its jurisdiction is restricted to a boundary that no longer covers the whole urban area. Responsibility for the road network in Nairobi is shared between the Ministry of Roads and Public Works (because many of the main radial routes into the city are national roads), the NCC, and other district councils.
Transport services
Public transport in Nairobi has evolved consid-erably over the past few decades. Today’s system consists of private road-based services and lim-ited commuter rail operations, which are not discussed here. The system operates in a largely deregulated environment, with little government control of route structures, operating practices, schedules, or fares. The chief components of the system are the large-bus Kenya Bus Services (KBS) and minibus matatus, which often com-pete along the same routes. Since 2002, other privately owned large buses have entered the market. In addition, taxis, tuk tuks (three-wheeled taxis), and motorcycle taxis operate in the metropolitan area.

Stuck in traffic: urban transport in Africa
82
Buses and minibuses
The city’s 175 bus routes (50 large-bus routes and 125 matatu routes) are served by 12,300 buses. Of these, all but 300 are matatus. Most matatus seat 14–18 passengers; one in five seats 25–35. KBS’s 300 large buses seat 61 passengers and operate on fixed routes and schedules.
Fares in Nairobi are determined by drivers in response to the state of the market. KBS’s larg-bus service exerts a damping effect, and fares are higher on routes that KBS does not serve. Off-peak discounts were introduced by KBS and have now been widely copied by the matatus. The applicable fare is shown inside the vehicle windscreen.
The fares charged by matatus vary with demand on the route at any particular time. As noted, off-peak reductions are common. On the other hand, fares may be hiked during bad weather or at times of congestion. A typical fare for the 12.5 km trip from Kangemi to the city center is KSh 30 ($0.40) at peak hours, but only KSh 20 ($0.26) off-peak.
KBS’s large-bus fares tend not to change in re-sponse to short-term demand pressures such as those brought on by adverse weather conditions. The minimum fare, even in off-peak hours, is KSh 20.
The matatu system was legalized in 1973 to en-courage small operators to operate alongside dominant big bus company that had failed to invest adequately to meet the burgeoning trans-port demand. However, over time syndicates emerged, and today most routes are controlled by loosely composed associations that act as self-imposed owners of the route. The buses are owned by individual investors and operated by drivers. Matatus often ply the same routes as KBS, but without predetermined timetables or stops; they also provide a supplementary net-
work of services in areas of lower demand areas or on minor roads.
The term matatu refers to a system that has ex-isted in Nairobi for at least 35 years. The system embraces a set of practices regarding ownership, route structure, operations, and control. Matatus emerged during the 1950s, when they were mainly used in transporting residents of African neighborhoods of colonial Nairobi to nearby rural villages. The word matatu is derived from the local term “mang otore matatu” meaning thirty cents, the standard fare charged at the time.
The official cost for starting a matatu operation is Ksh 4,300 (consisting of a parking fee of Ksh 2,500 payable to NCC, a registration fee of Ksh 800, and a payment of Ksh 1,000 to a coopera-tive. Unofficial payments by matatu owners may be as high as Ksh 100,000.
Even after the legalization of matatu services, KBS, owned jointly by United Transport Inter-national (75 percent) and the NCC (25 percent), retained its franchise for the operation of con-ventional (large) bus services. Its monopoly was broken in the early 1980s with the formation of the publicly owned Nyayo Bus Services, which subsequently failed despite receiving preferential tax treatment (lower duties on procurement of vehicles). KBS’s fares were controlled, but at a level that enabled the company to continue to operate profitably, although not so profitably as to justify expansion. As a consequence, growing demand was met by the matatu operators, and, by the late 1980s, KBS’s market share had slipped to around 50 percent. The company re-sponded by focusing on high-volume routes, where it was able to compete effectively with the matatus.
In the early 1990s, KBS was taken over by Stage-coach Holdings, a major British transport opera-tor. The company attempted to take advantage of the recently liberalized market regulations by

City profiles—Nairobi
83
raising fares, believing that passengers would pay a premium for better service. That strategy was not commercially successful, and Stagecoach sold out to a consortium of local investors in 1998.
KBS now provides two kinds of service in Nai-robi, operated by separate divisions of the com-pany. The Bus Track division provides conven-tional large-bus service, with a fleet of 270 sin-gle-deck vehicles. Operation of the routes has been contracted out to 22 independent groups, to take advantage of the flexible labor and oper-ating practices of small enterprises. Until re-cently, the services were profitable, but recent rule changes that prohibit standing passengers have destroyed the division’s long-term financial viability.
A new KBS division, Metro Shuttle, provides a premium midi-bus service, with higher quality and comfort, designed to appeal to car commut-
ers and higher-income passengers. A higher fare is charged, but the service has proved successful and is being imitated by other operators, the main one being City Hoppa. However, the com-bined market share of the premium services is so far very small—approximately 2.5 percent.
Taxis
Taxis are an important element in Nairobi’s transport picture, more so than in most other African cities. Taxis are unmetered taxis; the minimum fare is about Ksh 200. About 40 tuk tuks, a three-wheel taxi, operate from one city terminal, charging fares of about Ksh 100. Al-though less expensive than taxis, the tuk tuks are slow, relatively unsafe, and hold only two per-sons. Motorcycle taxis operate in small suburban towns. The minimum fare of Ksh 10 does not provide a living wage but does offer some oppor-tunities to unemployed youth.


85
Ouagadougou
Capital of Burkina Faso and the nation’s economic and cultural center | Population 1.1 million
The metropolitan area of Ouagadougou is di-vided into five communes subdivided into 30 sectors and then into districts. The communes of Ouagadougou have made an important decision to invest in large projects—chiefly because the city has become an international cultural center. It hosts the International Arts and Crafts Fair and the Panafrican Film and Television Festival. The growing affluence of the villages allows for such investments—and the population, growing at an annual rate of 4.4 percent, needs them.
Regulation of urban transport
There is no independent transport authority in Ouagadougou. The Direction Générale des Transports Terrestres et Maritimes is responsible for licensing vehicles and boats, and ensuring road safety. The Ministry of Transport is in charge of transport planning and regulating ur-ban transport. Bus fares are set by the Ouaga-dougou bus company, Société de Transport en Commun de Ouagadougou (SOTRACO).
Transport services
Ouagadougou’s principal modes of public trans-port are large buses and taxis. But many citizens of Ouagadougou prefer their own motorcycles and bicycles (more recently, cars) to public transportation.
Buses
A fleet of 50 large buses (of which only about 33, and sometimes as few as 16, are operable) is op-erated by SOTRACO, a limited liability company
created in 2003 to succeed the defunct Société de Transports Alpha Oméga, which wound up its operations in 2000 after encountering serious financial difficulties. SOTRACO began opera-tions in November 2003. Its objectives were to develop a public–private partnership involving experienced private operators in the transport sector in Ouagadougou, and to delegate man-agement responsibilities to private shareholders.
The commune of Ouagadougou owns 15 percent of SOTRACO, and the private operator 85 per-cent. The government subsidizes SOTRACO through tax exemptions on fuel and tires and exemptions from duty on imports.
All but 10 of the company’s fleet are four-year-old Volvo buses that seat 80 passengers; the re-mainder are 20-year-old Renault buses that seat 100. SOTRACO operates nine routes. Safety and security are good, but the number of routes is insufficient, and service is available only on paved roads. Buses are uncomfortable, and waits at stops are often long and painful. The fare is approximately $0.30.
Motorcycles have caught on among urban Burkinabé

Stuck in traffic: urban transport in Africa
86
There are no minibuses in the city. SOTRACO provides only large-bus service. There are no informal operators in the city.
Taxis
Approximately 1,500 readily available green taxis (capacity: four passengers) operate in Ouaga-dougou. Passengers can travel anywhere in town for 200 to 400 CFA francs. After 10 p.m. the fare can reach 1,000 CFA francs. Taxis tend to be slow and crowded, since drivers prefer to carry groups rather than individuals.
Other modes of transport
The use of personal motorcycles and bicycles is extensive. Almost 60 percent of the city’s work-ing population use motorcycles; 20 percent use bicycles. Because the coverage of the bus net-work is limited (with too few routes and none at all on unpaved roads), many residents prefer to use motorcycles, which enable them to get to their destinations much more quickly. As a re-sult, environmental pollution is a very serious problem in Ouagadougou.
Most automobiles used in the city are small and inexpensively made, using a small two-stroke engine.