
Structures and tectonics of Son-Mahanadi rift basin, India ... Uppal Road, Hyderabad,500007,...
6
CSIR-NGRI, Uppal Road, Hyderabad,500007, [email protected] 10 th Biennial International Conference & Exposition P 409 Structures and tectonics of Son-Mahanadi rift basin, India derived from joint interpretation of gravity and magnetic data incorporating constraints from borehole and seismic informations Bijendra Singh*, Ch. Swarnapriya and B. Nageswara Rao Summary Son-Mahanadi Gondwana rift basin located in the eastern part of Indian peninsular shield shows numerous mafic dykes and sills intruding the sediments posing a serious problrm in seismic data acquisition and interpretation.This paper presents the results of joint analysis of gravity and magnetic (G-M) data using constraints from borehole to delineate the shallow and deep crustal structures to understand the tectonics and evolution of the basin. The Bouguer gravity anomaly map of the region depicts short wavelength gravity lows and highs due to undulations in the basement superposed on a long wavelength regional gravity low centred over the basin. The detailed magnetic map of the northern part of the basin shows linear bipolar anomalies associated with dykes. Interestingly, the regional gravity low bears an inverse correlation with the regional topography which suggests that the excess topographic load is compensated at depth and the required buoyancy might be the consequence of deep seated low density heterogeneities due to thinning of the lithosphere. Presence of high heat flow and occurrence of large number of volcanic dykes and sills of Deccan origin and its proximity to the Deccan volcanic terrain suggests impact of Deccan plume as the preferred mechanism for the uplift of Gondwana sediments. Keywords: Joint modelling, Deccan basalt, lithosphere, palaeomagnetic, rift basin Introduction The NW-SE trending Son-Mahanadi basin is one of the Gondwana basins of the Peninsular India (Fig.1).These basins have large economic value due to presence of huge coal reserves. However, their hydrocarbon potential is yet to be established. This intra-cratonic basin consists of ENEWSW trending South Rewa basin (SRB) in the north and NW-SE trending Son-Mahanadi graben in the south (Chakraborty et. al., 2003). The detailed geological map of the region is shown in Fig. 2. The basin is delimited by Deccan trap in the west, Proterozoic Chattishgarh group of rocks in the southwest, Precambrian basement rocks in the southeast and east and Palaeoproterozoic Mahakosal metavolcanics in the north. Basin contains as large as 5.0km thick Gondwana sediments ranging in age from Early Permian to Early Cretaceous. The Lower Gondwana sedimentation was initiated with Fluvio-glacial and marine deposition followed by fluvio lacustrine deposition of Carboniferous to Middle Cretaceous age. Stratigraphically, the Lower Gondwana rocks are subdivided into Talchir, Figure 1: Location of Son-Mahanadi basin along with other Gondwana basins in the Peninsular India
Transcript of Structures and tectonics of Son-Mahanadi rift basin, India ... Uppal Road, Hyderabad,500007,...

CSIR-NGRI, Uppal Road, Hyderabad,500007,
10th Biennial International Conference & Exposition
P 409
Structures and tectonics of Son-Mahanadi rift basin, India derived from
joint interpretation of gravity and magnetic data incorporating constraints
from borehole and seismic informations
Bijendra Singh*, Ch. Swarnapriya and B. Nageswara Rao
Summary
Son-Mahanadi Gondwana rift basin located in the eastern part of Indian peninsular shield shows numerous mafic dykes and
sills intruding the sediments posing a serious problrm in seismic data acquisition and interpretation.This paper presents the
results of joint analysis of gravity and magnetic (G-M) data using constraints from borehole to delineate the shallow and deep
crustal structures to understand the tectonics and evolution of the basin. The Bouguer gravity anomaly map of the region
depicts short wavelength gravity lows and highs due to undulations in the basement superposed on a long wavelength regional
gravity low centred over the basin. The detailed magnetic map of the northern part of the basin shows linear bipolar anomalies
associated with dykes. Interestingly, the regional gravity low bears an inverse correlation with the regional topography which
suggests that the excess topographic load is compensated at depth and the required buoyancy might be the consequence of
deep seated low density heterogeneities due to thinning of the lithosphere. Presence of high heat flow and occurrence of large
number of volcanic dykes and sills of Deccan origin and its proximity to the Deccan volcanic terrain suggests impact of Deccan
plume as the preferred mechanism for the uplift of Gondwana sediments.
Keywords: Joint modelling, Deccan basalt, lithosphere, palaeomagnetic, rift basin
Introduction
The NW-SE trending Son-Mahanadi basin is one of the
Gondwana basins of the Peninsular India (Fig.1).These
basins have large economic value due to presence of huge
coal reserves. However, their hydrocarbon potential is yet
to be established. This intra-cratonic basin consists of
ENEWSW trending South Rewa basin (SRB) in the north
and NW-SE trending Son-Mahanadi graben in the south
(Chakraborty et. al., 2003). The detailed geological map
of the region is shown in Fig. 2. The basin is delimited by
Deccan trap in the west, Proterozoic Chattishgarh group of
rocks in the southwest, Precambrian basement rocks in the
southeast and east and Palaeoproterozoic Mahakosal
metavolcanics in the north. Basin contains as large as
5.0km thick Gondwana sediments ranging in age from
Early Permian to Early Cretaceous. The Lower Gondwana
sedimentation was initiated with Fluvio-glacial and marine
deposition followed by fluvio lacustrine deposition of
Carboniferous to Middle Cretaceous age.
Stratigraphically, the Lower Gondwana rocks are
subdivided into Talchir,
Figure 1: Location of Son-Mahanadi basin along with other
Gondwana basins in the Peninsular India

2
Figure 2: Geological map of the Mahanadi basin and
surrounding area
Barakar, Barren measures and Raniganj formations.The
lithology of these formations is normally shale, sandstone
and Coal Seams. The Upper Gondwana rocks (Lower
Triassic to Lower Cretaceous) are divided into Pali-Tikhi,
and Parsora formations. This basin is infected by large
number of mafic dykes and sills. It is suggested that during
Deccan eruption, existing faults provided easy path for
magma to be intruded as sills and dykes. An exploratory
well drilled at Tikhi also shows mafic rocks within the
Raniganj and at the top of Barakar sequence. The granite-
gneiss basement is encountered at a depth of 3915m.
Sediments were deposited within the framework of a rift
graben. The basin is dissected and traversed by a number
of faults (Fig.2). However, the causative factor for the rift
development is not well understood due to lack of well
constrained geophysical information. This paper presents
the results of integrated interpretation of G-M data to
delineate the shallow and deep crustal structures to
understand the tectonics and evolution of the basin.
Analysis of gravity and magnetic anomaly maps
Scintrex CG-5 gravimeter and Geometric proton
precession magnetometer were used for the acquisition of
G-M data respectively. A total of 2500 gravity and 5000
magnetic observations were recorded at a spacing of about
1.0 km and 0.5 km respectively along available roads and
tracks in the detailed study block of SRB. After applying
the necessary corrections to the gravity observations, it is
merged with regional gravity data base (gravity map series
of India-2006) and a composite Bouguer anomaly (BA)
map of the Mahanadi and surrounding region is prepared
while residual total intensity magnetic anomaly (RTIMA)
map of the detailed study block is prepared after removing
the international geomagnetic reference field (IGRF)
values.
Fig.3 presents the BA map of the region. It depicts two
prominent gravity lows, one to the north of Shahdol near
Tikhi and other to the south. These lows are separated by
EW trending gravity high due to presence of intra-basinal
transverse ridges. The E-W trending gravity high in the
north adjacent to the basin coincides with the exposed high
density Mahakosal group of rocks while high in the south
is caused due to high density rocks of Eastern Ghat
Terrain. The gravity high near Mandla indicates volcanic
intrusive. The RTIMA map (Fig.4) depicts E-W trending
linear bipolar anomalies which are the characteristic
feature of E-W trending mafic dykes at this geomagnetic
latitude. However,
Figure 3: BA map of the Mahanadi basin and surrounding area.
White contour shows low pass filtered regional anomalies with
cutoff wavelength of 200 km. The N-S line is used for modeling
of regional anomalies.
N-S trending dykes do not produce recognizable anomalies
at this latitude hence not revealed. The most significant
feature of the RTIMA map is the presence of large
amplitude bipolar linear anomalies near Shahdol with a
prominent high towards the south suggesting basic
intrusive having remanant direction different than other
dykes.
3
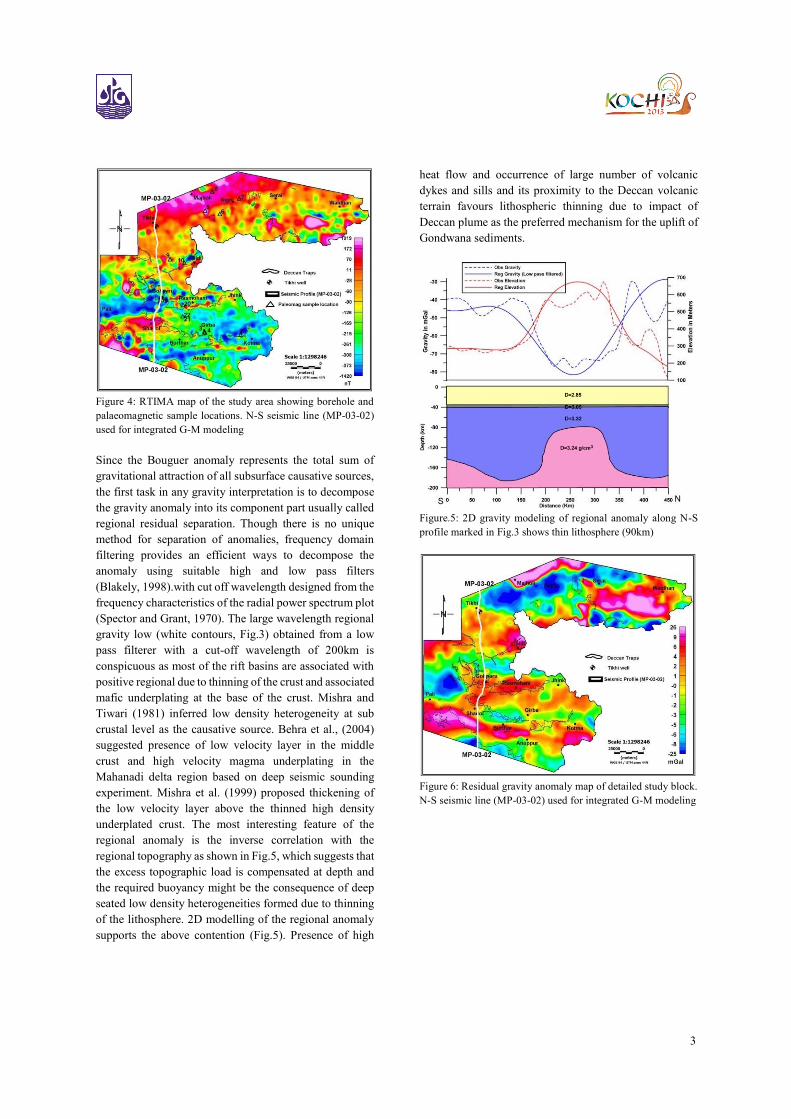
Figure 4: RTIMA map of the study area showing borehole and
palaeomagnetic sample locations. N-S seismic line (MP-03-02)
used for integrated G-M modeling
Since the Bouguer anomaly represents the total sum of
gravitational attraction of all subsurface causative sources,
the first task in any gravity interpretation is to decompose
the gravity anomaly into its component part usually called
regional residual separation. Though there is no unique
method for separation of anomalies, frequency domain
filtering provides an efficient ways to decompose the
anomaly using suitable high and low pass filters
(Blakely, 1998).with cut off wavelength designed from the
frequency characteristics of the radial power spectrum plot
(Spector and Grant, 1970). The large wavelength regional
gravity low (white contours, Fig.3) obtained from a low
pass filterer with a cut-off wavelength of 200km is
conspicuous as most of the rift basins are associated with
positive regional due to thinning of the crust and associated
mafic underplating at the base of the crust. Mishra and
Tiwari (1981) inferred low density heterogeneity at sub
crustal level as the causative source. Behra et al., (2004)
suggested presence of low velocity layer in the middle
crust and high velocity magma underplating in the
Mahanadi delta region based on deep seismic sounding
experiment. Mishra et al. (1999) proposed thickening of
the low velocity layer above the thinned high density
underplated crust. The most interesting feature of the
regional anomaly is the inverse correlation with the
regional topography as shown in Fig.5, which suggests that
the excess topographic load is compensated at depth and
the required buoyancy might be the consequence of deep
seated low density heterogeneities formed due to thinning
of the lithosphere. 2D modelling of the regional anomaly
supports the above contention (Fig.5). Presence of high
heat flow and occurrence of large number of volcanic
dykes and sills and its proximity to the Deccan volcanic
terrain favours lithospheric thinning due to impact of
Deccan plume as the preferred mechanism for the uplift of
Gondwana sediments.
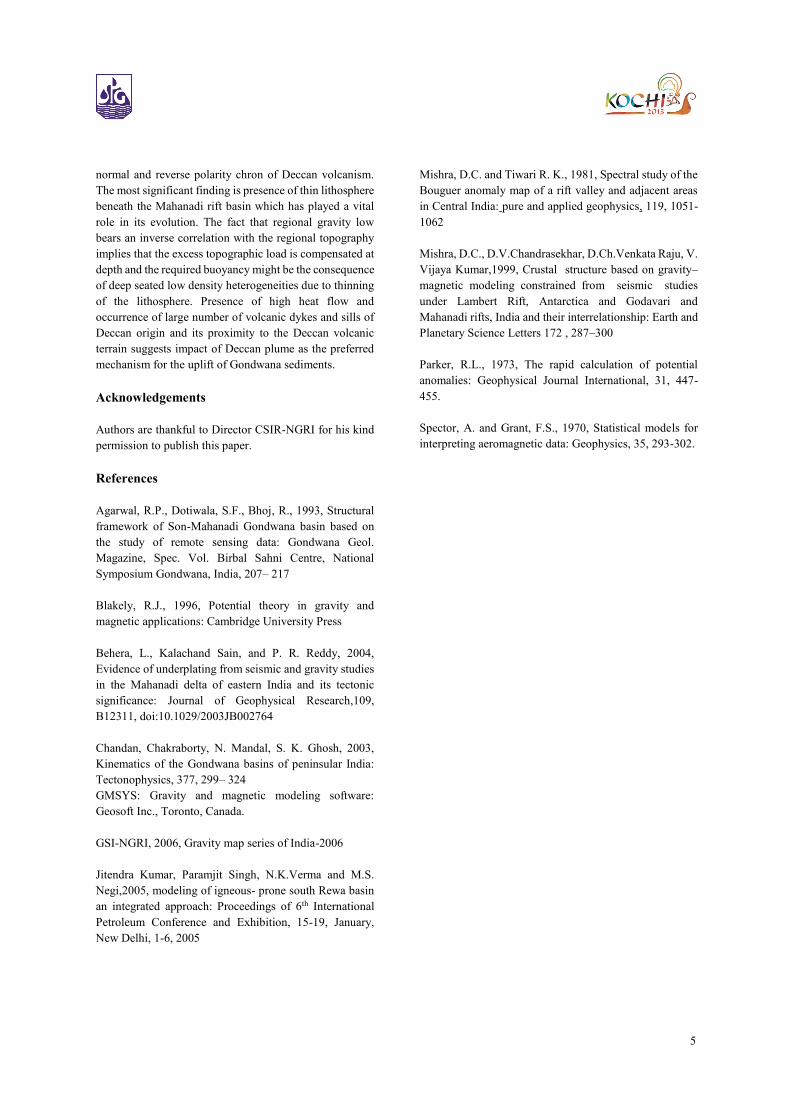
Figure.5: 2D gravity modeling of regional anomaly along N-S
profile marked in Fig.3 shows thin lithosphere (90km)
Figure 6: Residual gravity anomaly map of detailed study block.
N-S seismic line (MP-03-02) used for integrated G-M modeling

4
Figure 7: Basement depth derived from 3D inversions The of
residual gravity anomalies based on algorithms of Parkaer (1973)
The residual anomaly map (Fig.6) reflects short
wavelength highs and lows caused due to the shallow
density heterogeneities resulting from basement
undulations. The Large amplitudes gravity high with sharp
gradient in the north suggests steep basement up warp. The
most conspicuous feature of the map is the presence of
gravity low below the Deccan traps in the south indicating
presence of thick subtrappean Gondwana sediments. 3D
inversion of residual anomalies in terms of single density
basement interface based on algorithm of Parkar (1973)
using a density contrast of 0.25g/cm3 between the
basement and sediments reveals number of sub-basins
dissected by shallow transverse ridges. Basement depth
derived from this study is in agreement with the depth of
the basement depth in Tikhi well. The maximum depth to
the basement is 5.5 km towards the northeast of Tikhi
Well. The map depicts number of fault and lineament
which has been inferred from this study. These faults are
aligned mostly in Satpura trend in the north and Mahanadi
trend in the south. The faults transverse to these major
trends have divided the major basins into sub-basins.
Integrated G-M modelling
Since the subsurface model derived from independent
gravity and magnetic modeling is not unique, integrated
modeling is performed incorporating the results from
seismic, Euler’s depth and borehole to arrive at a more
plausible geological section. Constraints from seismic
sections are utilized for the definition of the sedimentary
layers and average density values are ascribed to the
different layers on the basis of density log of the Tikhi well
(Jitendra Kumar et. al. 2005). Since residual gravity
anomalies usually reflect the basement features hence
emphasis was put to gravity anomalies while changing the
basement geometry. Sediments are assumed to non
magnetic; hence the source depths derived from Euler’s
solutions of magnetic data provide constraints on position
of the intrusive dykes linked to short wavelength magnetic
anomalies. Thus, the model is expected to reveal the major
trends of the basement from the residual gravity data and
delineate the basic intrusive dykes on the basis of the
magnetic data. While modelling the magnetic anomalies,
magnetic properties of dykes and sills were assigned based
on palaeomagnetic measurements of the 41 rock samples
collected from 11 sites in the field (Fig.4). Palaeomagnetic
measurements indicate that the exposed dykes belong to
Deccan origin having direction of remnant magnetization
ranging from Incl= -200 to -400 and decl= 3100 -3500 and
intensity of magnetization as 1.0 to 7.0 A/m which belongs
to normal polarity of Deccan magnetostratigrahy
suggesting that dykes have intruded during the last phase
of volcanism.
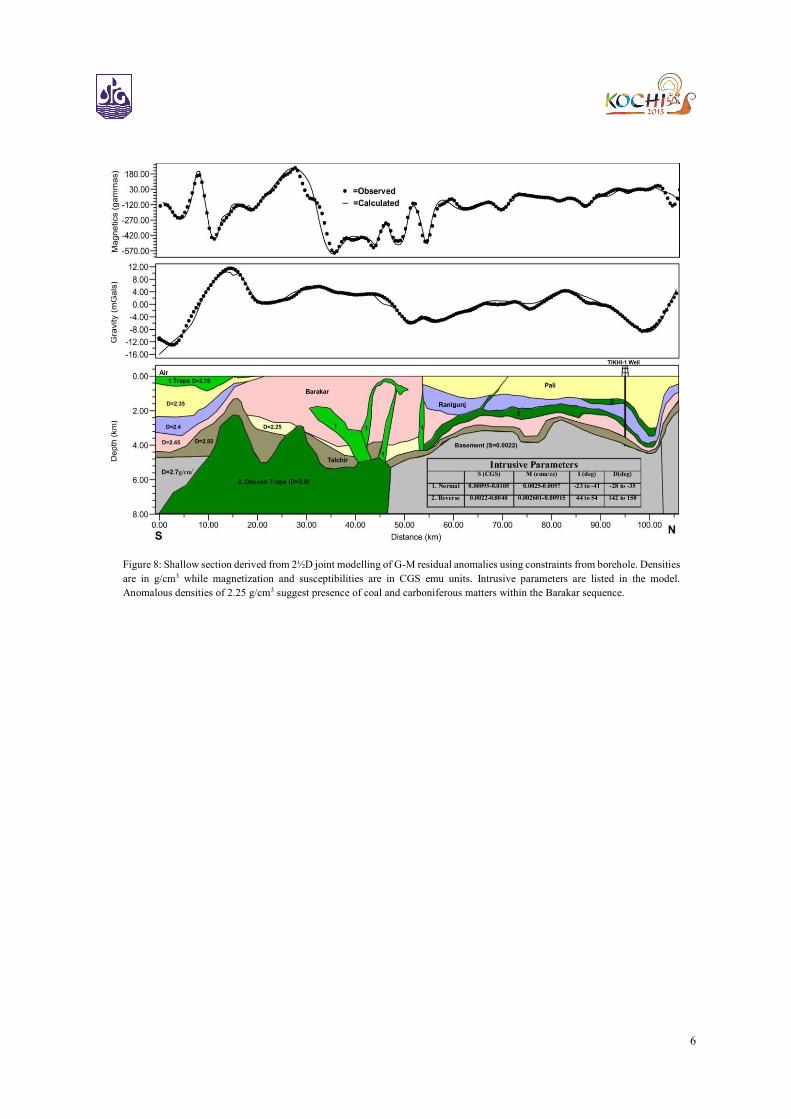
Fig.8 shows the interpreted section along the N-S seismic
profile derived from 2½D modeling of residual G-M
anomalies. Interpreted section shows number of dykes
belonging to Deccan normal polarity in the central part of
the profile where as other dykes and sills belongs to reverse
polarity chron corresponding to main phase of Deccan
volcanism. The section reveals a high density mafic body
of reverse polarity in the south to match the observed
gravity and magnetic high. It is noteworthy that shot
wavelength magnetic lows in the centre require normal
magnezization where as gravity and magnetic high are
associated with reverse polarity mafic dykes. Thus it is
inferred that dykes and sills intruding the sediments
belongs to main and late phase of Deccan volcanism. It is
conjectured that large mafic body could act as source for
late phase dyke emplacement. Interpreted section also
reveals the presence of Gondwana sediments below the
Deccan trap of normal polarity exposed on the surface.
Conclusions
Integrated modeling of residual gravity and magnetic
anomalies reveals large up warps and down warps in the
basement which are fault controlled. It has brought out
transverse ridges separating the basin into number of
subbasins. Dykes intruding the sediments belongs to
5
normal and reverse polarity chron of Deccan volcanism.
The most significant finding is presence of thin lithosphere
beneath the Mahanadi rift basin which has played a vital
role in its evolution. The fact that regional gravity low
bears an inverse correlation with the regional topography
implies that the excess topographic load is compensated at
depth and the required buoyancy might be the consequence
of deep seated low density heterogeneities due to thinning
of the lithosphere. Presence of high heat flow and
occurrence of large number of volcanic dykes and sills of
Deccan origin and its proximity to the Deccan volcanic
terrain suggests impact of Deccan plume as the preferred
mechanism for the uplift of Gondwana sediments.
Acknowledgements
Authors are thankful to Director CSIR-NGRI for his kind
permission to publish this paper.
References
Agarwal, R.P., Dotiwala, S.F., Bhoj, R., 1993, Structural
framework of Son-Mahanadi Gondwana basin based on
the study of remote sensing data: Gondwana Geol.
Magazine, Spec. Vol. Birbal Sahni Centre, National
Symposium Gondwana, India, 207– 217
Blakely, R.J., 1996, Potential theory in gravity and
magnetic applications: Cambridge University Press
Behera, L., Kalachand Sain, and P. R. Reddy, 2004,
Evidence of underplating from seismic and gravity studies
in the Mahanadi delta of eastern India and its tectonic
significance: Journal of Geophysical Research,109,
B12311, doi:10.1029/2003JB002764
Chandan, Chakraborty, N. Mandal, S. K. Ghosh, 2003,
Kinematics of the Gondwana basins of peninsular India:
Tectonophysics, 377, 299– 324
GMSYS: Gravity and magnetic modeling software:
Geosoft Inc., Toronto, Canada.
GSI-NGRI, 2006, Gravity map series of India-2006
Jitendra Kumar, Paramjit Singh, N.K.Verma and M.S.
Negi,2005, modeling of igneous- prone south Rewa basin
an integrated approach: Proceedings of 6th International
Petroleum Conference and Exhibition, 15-19, January,
New Delhi, 1-6, 2005
Mishra, D.C. and Tiwari R. K., 1981, Spectral study of the
Bouguer anomaly map of a rift valley and adjacent areas
in Central India: pure and applied geophysics, 119, 1051-
1062
Mishra, D.C., D.V.Chandrasekhar, D.Ch.Venkata Raju, V.
Vijaya Kumar,1999, Crustal structure based on gravity–
magnetic modeling constrained from seismic studies
under Lambert Rift, Antarctica and Godavari and
Mahanadi rifts, India and their interrelationship: Earth and
Planetary Science Letters 172 , 287–300
Parker, R.L., 1973, The rapid calculation of potential
anomalies: Geophysical Journal International, 31, 447-
455.
Spector, A. and Grant, F.S., 1970, Statistical models for
interpreting aeromagnetic data: Geophysics, 35, 293-302.
6
Figure 8: Shallow section derived from 2½D joint modelling of G-M residual anomalies using constraints from borehole. Densities
are in g/cm3 while magnetization and susceptibilities are in CGS emu units. Intrusive parameters are listed in the model.
Anomalous densities of 2.25 g/cm3 suggest presence of coal and carboniferous matters within the Barakar sequence.


![The English and Foreign Languages University Hyderabad ... · The English and Foreign Languages University Hyderabad – 500007, INDIA Model Paper 2016 ... *[féjms] famous 19. ...](https://static.fdocuments.in/doc/165x107/5add2ec97f8b9a8b6d8c8d06/the-english-and-foreign-languages-university-hyderabad-english-and-foreign-languages.jpg)
