Jesse Totoro. Anatomical Mechanisms Biomechanical Mechanisms.
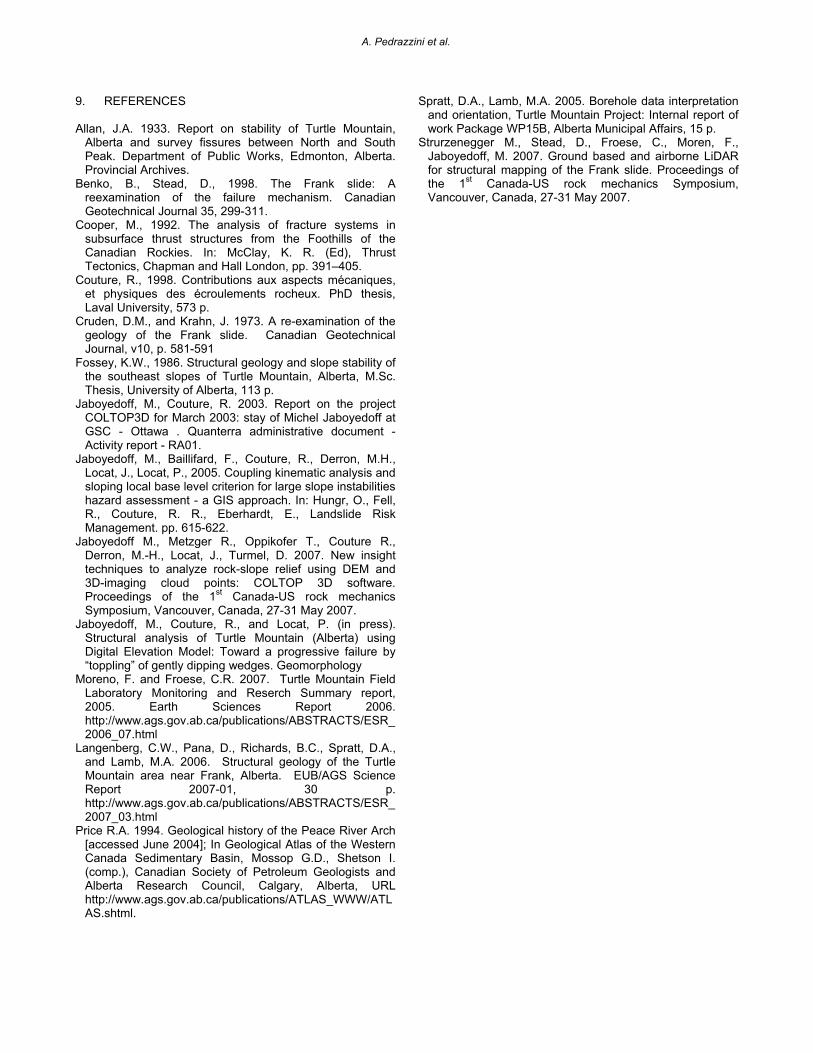
STRUCTURES AND FAILURE MECHANISMS ANALYSIS OF TURTLE MOUNTAIN Andrea Pedrazzini & Michel Jaboyedoff Institute of Geomatics and Risk Analysis, University of Lausanne, Switzerland, [email protected] Corey Froese, Willem Langenberg and Francisco Moreno Alberta Geological Survey, Edmonton, Alberta, Canada RÉSUMÉ Le glissement rocheux de Frank survenu en 1903 sur le flanc Ouest de « Turtle Mountain » en Alberta, est un des glissements de terrain les plus étudiés au monde. Dans cet article, l’agencement structural de la partie sud de la montagne est investigué selon deux approches complémentaires. Une analyse morpho-structurale visant à détecter les grands traits structuraux a été menée à l’aide du modèle numérique de terrain à haute résolution. En même temps, une analyse détaillée de terrain a permis de valider et compléter les résultats obtenus. Une attention particulière a été portée à l’influence des structures détectées dans la zone étudiée et sur le développement des instabilités. Les résultats obtenus permettent d’identifier 6 familles de discontinuités majeures influençant la morphologie du massif rocheux. Cet agencement structural a été ensuite utilisé pour analyser les mécanismes de rupture des instabilités présentes dans la partie sud de Turtle Mountain. ABSTRACT The 30 M m3 rockslide that occurred on the east face of Turtle Mountain in the Crowsnest Pass area (Alberta) in 1903 is one of the most famous landslides in the world. In this paper, the structural features of the South part of Turtle Mountain are investigated in order to understand the present-day scar morphology and to identify the most important failure mechanisms. The structural features were mapped using a high resolution digital elevation model (DEM) in order to have a large overview of the relevant structural features. At the same time, a field survey was carried out and small scale fractures were analyzed in different parts of southern Turtle Mountain in order to confirm the DEM analysis. Results allow to identify six main discontinuity sets that influence the Turtle Mountain morphology. These discontinuity sets were then used to identify the potential failure mechanisms affecting Third Peak and South Peak area. 1. INTRODUCTION Turtle Mountain in Alberta, Canada has become an important field laboratory to test different techniques related to the characterization and the monitoring of large slope mass movement (Moreno and Froese, 2006). In order to better quantify the potential unstable volumes and to assess failure mechanisms that are the most-likely to happen, a structural study is a necessary step. Many studies have been performed on the Turtle Mountain in terms of structural mapping, in the South Peak area (Allen, 1931; Fossey, 1986; Langenberg et al., 2007). Only few structural studies (Sturzenegger et al, 2007; Jaboyedoff et al., in press) are based on remote sensing dataset like airborne laser scanning or terrestrial laser scanner (TLS). This paper shows the results of a structural analysis based on aerial light detection and ranging (LiDAR) DEM and performed with the homemade software COLTOP 3D (Jaboyedoff et al., 2007). Besides, a comparison with recent field surveys on the southern portion of Turtle Mountain is presented. These results provide the basis to discuss about the possible influences of structures on old and future instabilities. 2. GEOLOGICAL AND STRUCTURAL SETTING The structural and the geological settings in South Peak area were first studied in detail by Allan (1933) with the accepted modern interpretation of the structure on the Frank
Slide and south Peak areas provided in 1973 by Cruden and Krahn. Langenberg et al., (2007) carried out a new revision of the structural and the geological mapping.
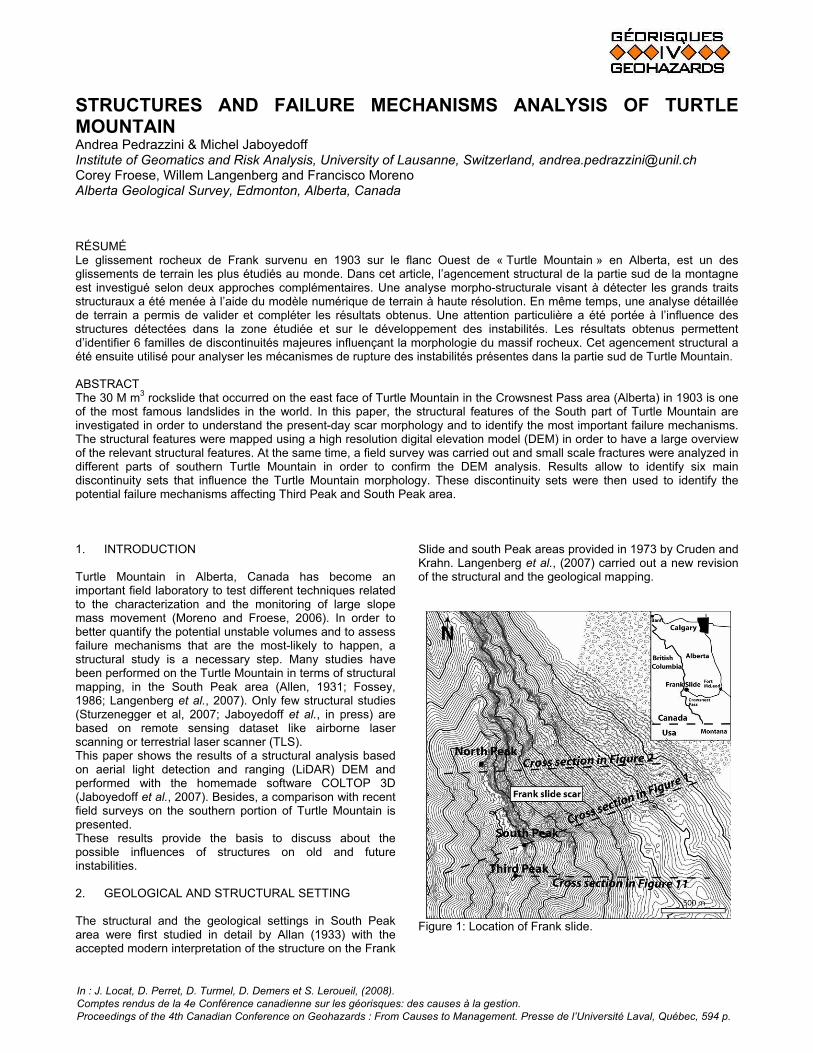
Figure 1: Location of Frank slide.
In : J. Locat, D. Perret, D. Turmel, D. Demers et S. Leroueil, (2008). Comptes rendus de la 4e Conférence canadienne sur les géorisques: des causes à la gestion. Proceedings of the 4th Canadian Conference on Geohazards : From Causes to Management. Presse de l’Université Laval, Québec, 594 p.
Others researchers undertook a more specific analyses of the joint sets based on field survey (Couture, 1998; Fossey, 1986), as well as on borehole logging analysis and ground penetrating radar (GPR) (Spratt and Lamb, 2005). Most of them focused on the crown area, in particular near South Peak. Those works provide a very large amount of data but they are inhomogeneously distributed in space. Turtle Mountain bedrock ranges in age from Devonian to Cretaceous. The most important lithological unit is the Livingstone Formation (Visean), which forms the upper part of Turtle Mountain and forms the main part of the 1903s Frank Slide deposit. It consists mainly of a massive limestone. The central part of the mountain is made by the Banff formation and consists basically of black mudstone, siltstone and sandstone (Figure 2 and 3).The most evident structure in the area is the Turtle mountain anticline. The anticline has an asymmetrical shape and plunges to the west essentially. This fold can be described as a modified fault-propagation fold involved in a break-thrust fold (Langenberg, et al 2007). Under South Peak, the fold interlimb angle is larger than it is in the others sectors and the anticline forms a sort of box fold with both limbs preserved over the Turtle thrust. In the North Peak area the fold is cut by the thrust and only the western limb of the anticline remains. The fold axis orientation is also changes near South Peak, where plunges 2° toward 024°. In the Third Peak area, however, the fold axis evolves and plunges at the opposite side 4° toward 194°. It is also interesting to note that the Turtle thrust is folded by the Hillcrest syncline, indicating that folding had taken place both prior and after the thrust movements (Langenberg et al, 2007).
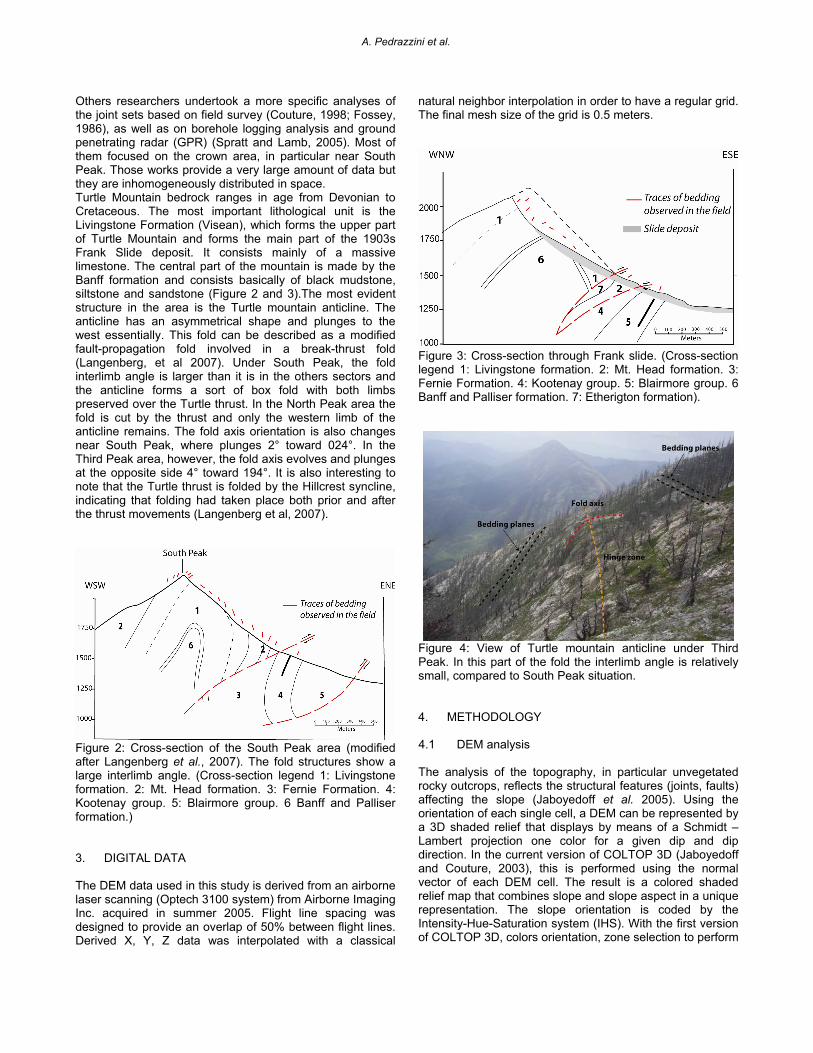
Figure 2: Cross-section of the South Peak area (modified after Langenberg et al., 2007). The fold structures show a large interlimb angle. (Cross-section legend 1: Livingstone formation. 2: Mt. Head formation. 3: Fernie Formation. 4: Kootenay group. 5: Blairmore group. 6 Banff and Palliser formation.) 3. DIGITAL DATA The DEM data used in this study is derived from an airborne laser scanning (Optech 3100 system) from Airborne Imaging Inc. acquired in summer 2005. Flight line spacing was designed to provide an overlap of 50% between flight lines. Derived X, Y, Z data was interpolated with a classical
natural neighbor interpolation in order to have a regular grid. The final mesh size of the grid is 0.5 meters.
Figure 3: Cross-section through Frank slide. (Cross-section legend 1: Livingstone formation. 2: Mt. Head formation. 3: Fernie Formation. 4: Kootenay group. 5: Blairmore group. 6 Banff and Palliser formation. 7: Etherigton formation).
Figure 4: View of Turtle mountain anticline under Third Peak. In this part of the fold the interlimb angle is relatively small, compared to South Peak situation. 4. METHODOLOGY 4.1 DEM analysis The analysis of the topography, in particular unvegetated rocky outcrops, reflects the structural features (joints, faults) affecting the slope (Jaboyedoff et al. 2005). Using the orientation of each single cell, a DEM can be represented by a 3D shaded relief that displays by means of a Schmidt – Lambert projection one color for a given dip and dip direction. In the current version of COLTOP 3D (Jaboyedoff and Couture, 2003), this is performed using the normal vector of each DEM cell. The result is a colored shaded relief map that combines slope and slope aspect in a unique representation. The slope orientation is coded by the Intensity-Hue-Saturation system (IHS). With the first version of COLTOP 3D, colors orientation, zone selection to perform
A. Pedrazzini et al.
statistics and fault drawing can be performed but only in a 2D view (shaded relief view).
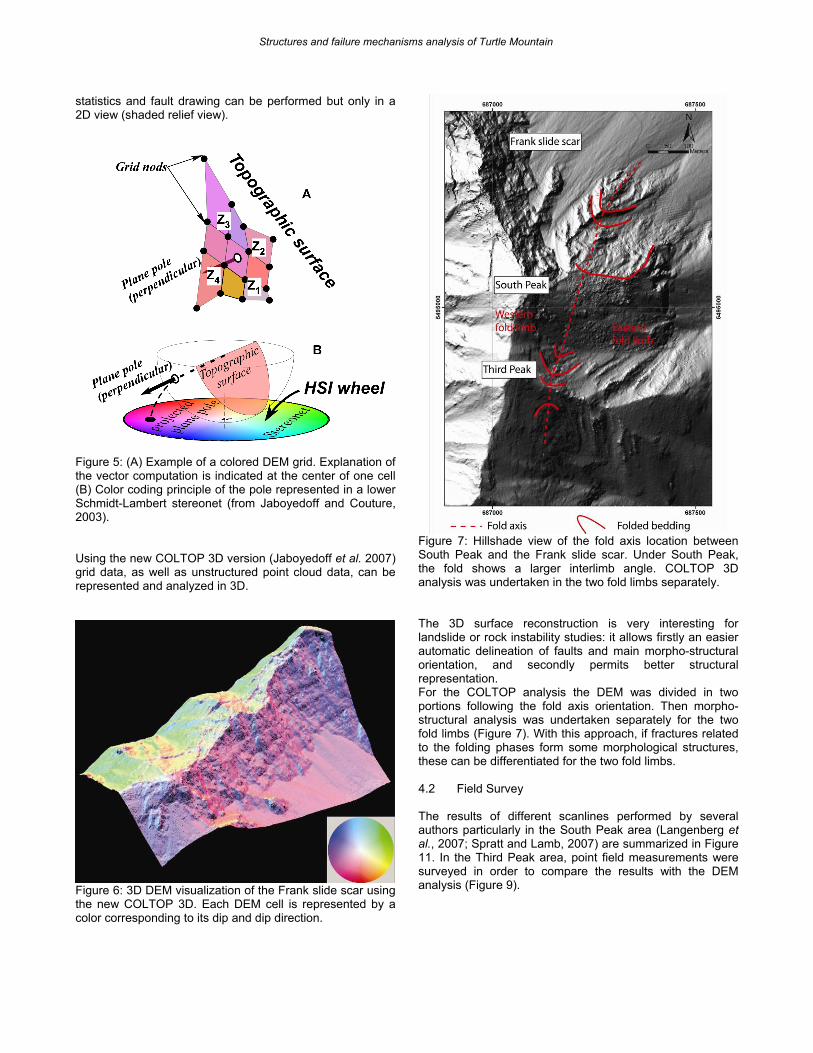
Figure 5: (A) Example of a colored DEM grid. Explanation of the vector computation is indicated at the center of one cell (B) Color coding principle of the pole represented in a lower Schmidt-Lambert stereonet (from Jaboyedoff and Couture, 2003). Using the new COLTOP 3D version (Jaboyedoff et al. 2007) grid data, as well as unstructured point cloud data, can be represented and analyzed in 3D.
Figure 6: 3D DEM visualization of the Frank slide scar using the new COLTOP 3D. Each DEM cell is represented by a color corresponding to its dip and dip direction.
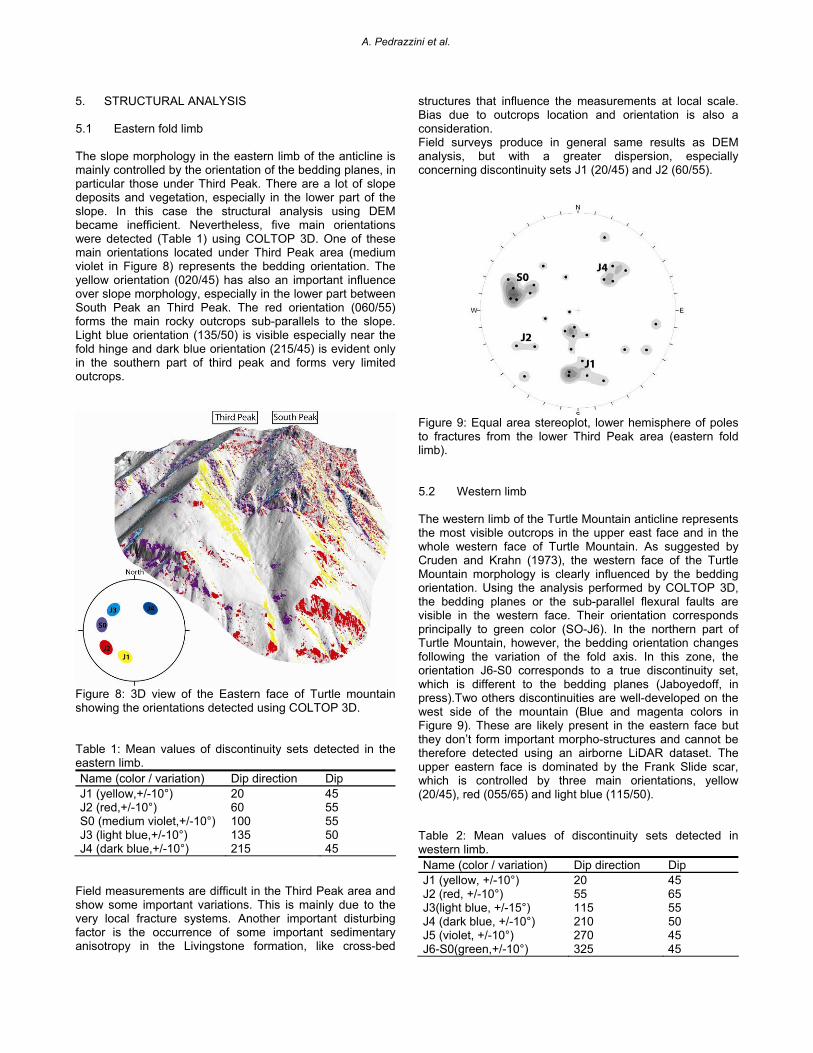
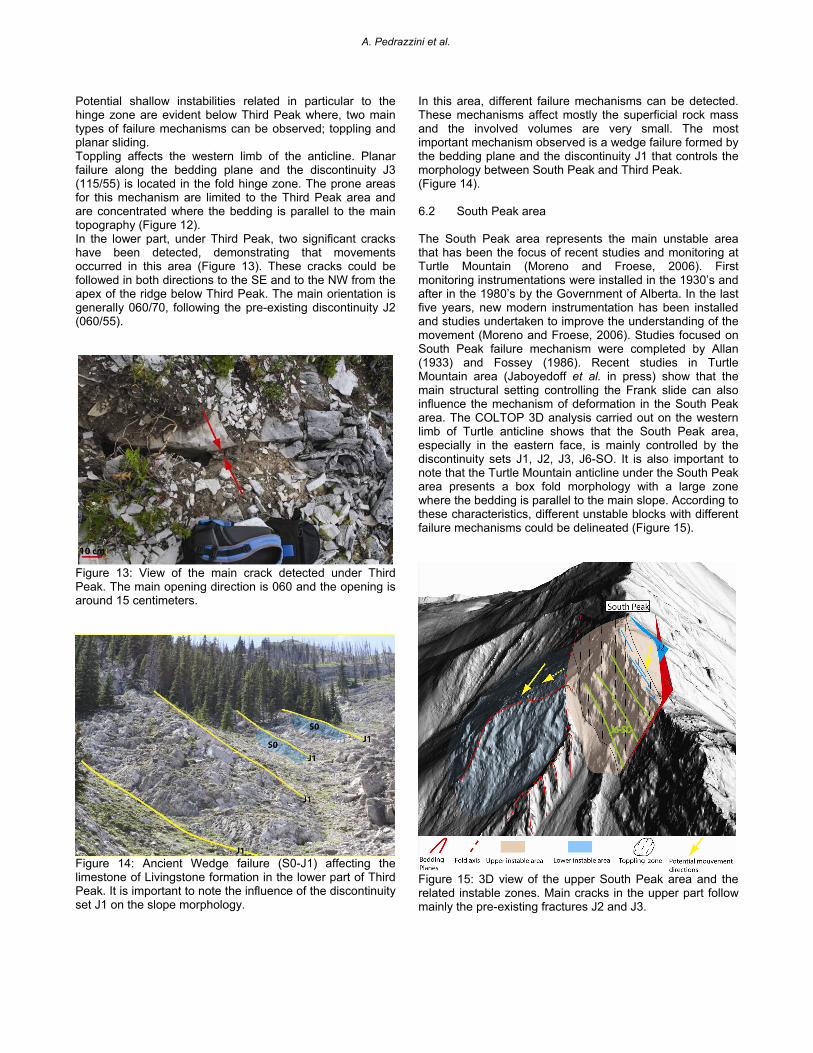
Figure 7: Hillshade view of the fold axis location between South Peak and the Frank slide scar. Under South Peak, the fold shows a larger interlimb angle. COLTOP 3D analysis was undertaken in the two fold limbs separately. The 3D surface reconstruction is very interesting for landslide or rock instability studies: it allows firstly an easier automatic delineation of faults and main morpho-structural orientation, and secondly permits better structural representation. For the COLTOP analysis the DEM was divided in two portions following the fold axis orientation. Then morpho-structural analysis was undertaken separately for the two fold limbs (Figure 7). With this approach, if fractures related to the folding phases form some morphological structures, these can be differentiated for the two fold limbs. 4.2 Field Survey The results of different scanlines performed by several authors particularly in the South Peak area (Langenberg et al., 2007; Spratt and Lamb, 2007) are summarized in Figure 11. In the Third Peak area, point field measurements were surveyed in order to compare the results with the DEM analysis (Figure 9).
Structures and failure mechanisms analysis of Turtle Mountain
5. STRUCTURAL ANALYSIS 5.1 Eastern fold limb The slope morphology in the eastern limb of the anticline is mainly controlled by the orientation of the bedding planes, in particular those under Third Peak. There are a lot of slope deposits and vegetation, especially in the lower part of the slope. In this case the structural analysis using DEM became inefficient. Nevertheless, five main orientations were detected (Table 1) using COLTOP 3D. One of these main orientations located under Third Peak area (medium violet in Figure 8) represents the bedding orientation. The yellow orientation (020/45) has also an important influence over slope morphology, especially in the lower part between South Peak an Third Peak. The red orientation (060/55) forms the main rocky outcrops sub-parallels to the slope. Light blue orientation (135/50) is visible especially near the fold hinge and dark blue orientation (215/45) is evident only in the southern part of third peak and forms very limited outcrops.
Figure 8: 3D view of the Eastern face of Turtle mountain showing the orientations detected using COLTOP 3D. Table 1: Mean values of discontinuity sets detected in the eastern limb. Name (color / variation) Dip direction Dip J1 (yellow,+/-10°) 20 45 J2 (red,+/-10°) 60 55 S0 (medium violet,+/-10°) 100 55 J3 (light blue,+/-10°) 135 50 J4 (dark blue,+/-10°) 215 45
Field measurements are difficult in the Third Peak area and show some important variations. This is mainly due to the very local fracture systems. Another important disturbing factor is the occurrence of some important sedimentary anisotropy in the Livingstone formation, like cross-bed
structures that influence the measurements at local scale. Bias due to outcrops location and orientation is also a consideration. Field surveys produce in general same results as DEM analysis, but with a greater dispersion, especially concerning discontinuity sets J1 (20/45) and J2 (60/55).
Figure 9: Equal area stereoplot, lower hemisphere of poles to fractures from the lower Third Peak area (eastern fold limb). 5.2 Western limb The western limb of the Turtle Mountain anticline represents the most visible outcrops in the upper east face and in the whole western face of Turtle Mountain. As suggested by Cruden and Krahn (1973), the western face of the Turtle Mountain morphology is clearly influenced by the bedding orientation. Using the analysis performed by COLTOP 3D, the bedding planes or the sub-parallel flexural faults are visible in the western face. Their orientation corresponds principally to green color (SO-J6). In the northern part of Turtle Mountain, however, the bedding orientation changes following the variation of the fold axis. In this zone, the orientation J6-S0 corresponds to a true discontinuity set, which is different to the bedding planes (Jaboyedoff, in press).Two others discontinuities are well-developed on the west side of the mountain (Blue and magenta colors in Figure 9). These are likely present in the eastern face but they don’t form important morpho-structures and cannot be therefore detected using an airborne LiDAR dataset. The upper eastern face is dominated by the Frank Slide scar, which is controlled by three main orientations, yellow (20/45), red (055/65) and light blue (115/50). Table 2: Mean values of discontinuity sets detected in western limb. Name (color / variation) Dip direction Dip J1 (yellow, +/-10°) 20 45 J2 (red, +/-10°) 55 65 J3(light blue, +/-15°) 115 55 J4 (dark blue, +/-10°) 210 50 J5 (violet, +/-10°) 270 45 J6-S0(green,+/-10°) 325 45
A. Pedrazzini et al.
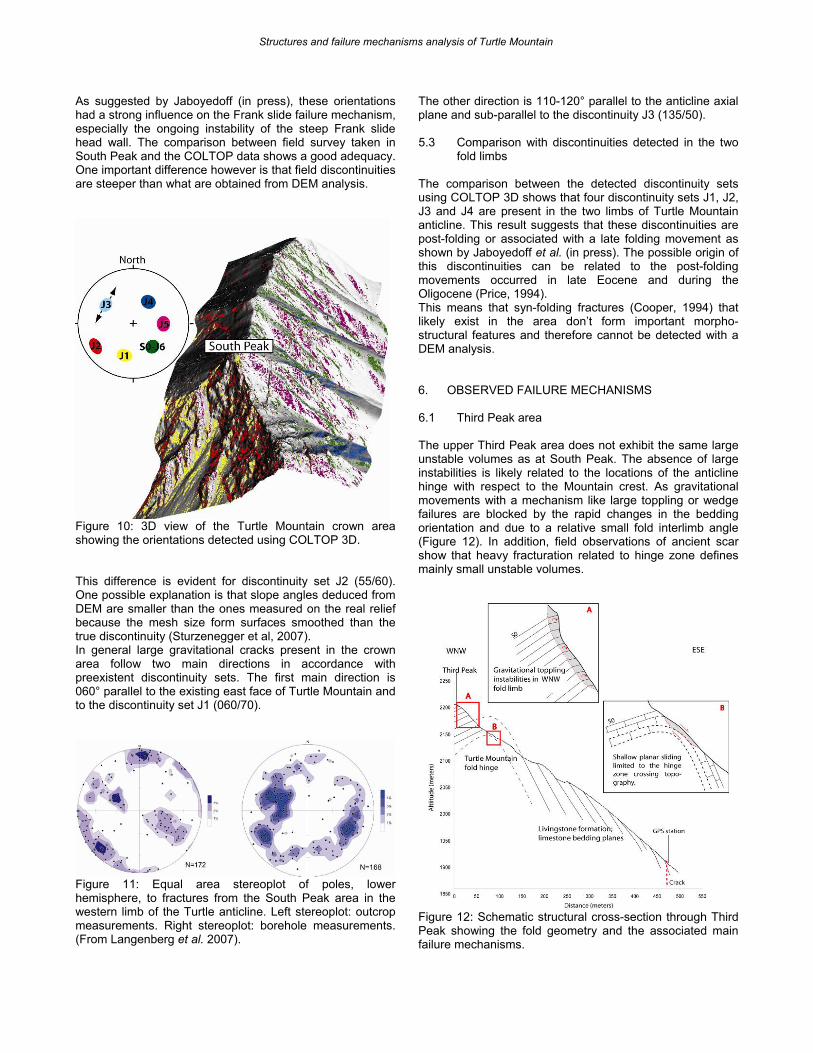
As suggested by Jaboyedoff (in press), these orientations had a strong influence on the Frank slide failure mechanism, especially the ongoing instability of the steep Frank slide head wall. The comparison between field survey taken in South Peak and the COLTOP data shows a good adequacy. One important difference however is that field discontinuities are steeper than what are obtained from DEM analysis.
Figure 10: 3D view of the Turtle Mountain crown area showing the orientations detected using COLTOP 3D. This difference is evident for discontinuity set J2 (55/60). One possible explanation is that slope angles deduced from DEM are smaller than the ones measured on the real relief because the mesh size form surfaces smoothed than the true discontinuity (Sturzenegger et al, 2007). In general large gravitational cracks present in the crown area follow two main directions in accordance with preexistent discontinuity sets. The first main direction is 060° parallel to the existing east face of Turtle Mountain and to the discontinuity set J1 (060/70).
Figure 11: Equal area stereoplot of poles, lower hemisphere, to fractures from the South Peak area in the western limb of the Turtle anticline. Left stereoplot: outcrop measurements. Right stereoplot: borehole measurements. (From Langenberg et al. 2007).
The other direction is 110-120° parallel to the anticline axial plane and sub-parallel to the discontinuity J3 (135/50). 5.3 Comparison with discontinuities detected in the two
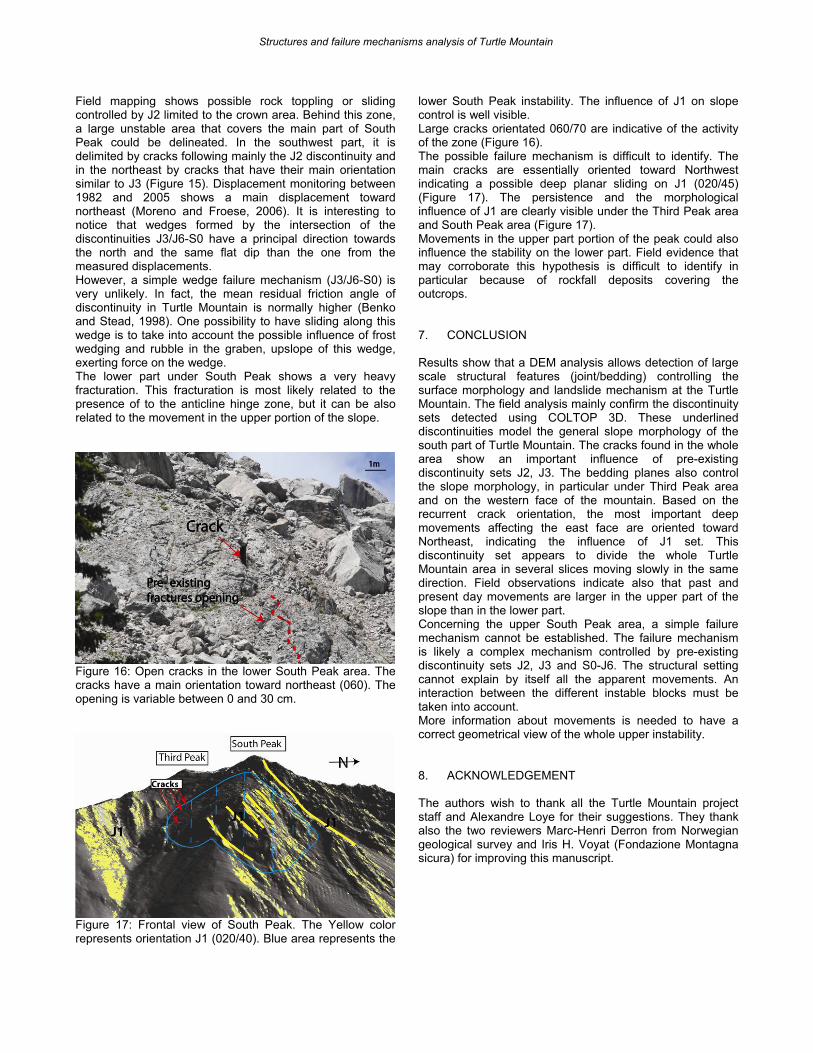
fold limbs The comparison between the detected discontinuity sets using COLTOP 3D shows that four discontinuity sets J1, J2, J3 and J4 are present in the two limbs of Turtle Mountain anticline. This result suggests that these discontinuities are post-folding or associated with a late folding movement as shown by Jaboyedoff et al. (in press). The possible origin of this discontinuities can be related to the post-folding movements occurred in late Eocene and during the Oligocene (Price, 1994). This means that syn-folding fractures (Cooper, 1994) that likely exist in the area don’t form important morpho-structural features and therefore cannot be detected with a DEM analysis. 6. OBSERVED FAILURE MECHANISMS 6.1 Third Peak area The upper Third Peak area does not exhibit the same large unstable volumes as at South Peak. The absence of large instabilities is likely related to the locations of the anticline hinge with respect to the Mountain crest. As gravitational movements with a mechanism like large toppling or wedge failures are blocked by the rapid changes in the bedding orientation and due to a relative small fold interlimb angle (Figure 12). In addition, field observations of ancient scar show that heavy fracturation related to hinge zone defines mainly small unstable volumes.
Figure 12: Schematic structural cross-section through Third Peak showing the fold geometry and the associated main failure mechanisms.
Structures and failure mechanisms analysis of Turtle Mountain
Potential shallow instabilities related in particular to the hinge zone are evident below Third Peak where, two main types of failure mechanisms can be observed; toppling and planar sliding. Toppling affects the western limb of the anticline. Planar failure along the bedding plane and the discontinuity J3 (115/55) is located in the fold hinge zone. The prone areas for this mechanism are limited to the Third Peak area and are concentrated where the bedding is parallel to the main topography (Figure 12). In the lower part, under Third Peak, two significant cracks have been detected, demonstrating that movements occurred in this area (Figure 13). These cracks could be followed in both directions to the SE and to the NW from the apex of the ridge below Third Peak. The main orientation is generally 060/70, following the pre-existing discontinuity J2 (060/55).
Figure 13: View of the main crack detected under Third Peak. The main opening direction is 060 and the opening is around 15 centimeters.
Figure 14: Ancient Wedge failure (S0-J1) affecting the limestone of Livingstone formation in the lower part of Third Peak. It is important to note the influence of the discontinuity set J1 on the slope morphology.
In this area, different failure mechanisms can be detected. These mechanisms affect mostly the superficial rock mass and the involved volumes are very small. The most important mechanism observed is a wedge failure formed by the bedding plane and the discontinuity J1 that controls the morphology between South Peak and Third Peak. (Figure 14). 6.2 South Peak area The South Peak area represents the main unstable area that has been the focus of recent studies and monitoring at Turtle Mountain (Moreno and Froese, 2006). First monitoring instrumentations were installed in the 1930’s and after in the 1980’s by the Government of Alberta. In the last five years, new modern instrumentation has been installed and studies undertaken to improve the understanding of the movement (Moreno and Froese, 2006). Studies focused on South Peak failure mechanism were completed by Allan (1933) and Fossey (1986). Recent studies in Turtle Mountain area (Jaboyedoff et al. in press) show that the main structural setting controlling the Frank slide can also influence the mechanism of deformation in the South Peak area. The COLTOP 3D analysis carried out on the western limb of Turtle anticline shows that the South Peak area, especially in the eastern face, is mainly controlled by the discontinuity sets J1, J2, J3, J6-SO. It is also important to note that the Turtle Mountain anticline under the South Peak area presents a box fold morphology with a large zone where the bedding is parallel to the main slope. According to these characteristics, different unstable blocks with different failure mechanisms could be delineated (Figure 15).
Figure 15: 3D view of the upper South Peak area and the related instable zones. Main cracks in the upper part follow mainly the pre-existing fractures J2 and J3.
A. Pedrazzini et al.
Field mapping shows possible rock toppling or sliding controlled by J2 limited to the crown area. Behind this zone, a large unstable area that covers the main part of South Peak could be delineated. In the southwest part, it is delimited by cracks following mainly the J2 discontinuity and in the northeast by cracks that have their main orientation similar to J3 (Figure 15). Displacement monitoring between 1982 and 2005 shows a main displacement toward northeast (Moreno and Froese, 2006). It is interesting to notice that wedges formed by the intersection of the discontinuities J3/J6-S0 have a principal direction towards the north and the same flat dip than the one from the measured displacements. However, a simple wedge failure mechanism (J3/J6-S0) is very unlikely. In fact, the mean residual friction angle of discontinuity in Turtle Mountain is normally higher (Benko and Stead, 1998). One possibility to have sliding along this wedge is to take into account the possible influence of frost wedging and rubble in the graben, upslope of this wedge, exerting force on the wedge. The lower part under South Peak shows a very heavy fracturation. This fracturation is most likely related to the presence of to the anticline hinge zone, but it can be also related to the movement in the upper portion of the slope.
Figure 16: Open cracks in the lower South Peak area. The cracks have a main orientation toward northeast (060). The opening is variable between 0 and 30 cm.
Figure 17: Frontal view of South Peak. The Yellow color represents orientation J1 (020/40). Blue area represents the
lower South Peak instability. The influence of J1 on slope control is well visible. Large cracks orientated 060/70 are indicative of the activity of the zone (Figure 16). The possible failure mechanism is difficult to identify. The main cracks are essentially oriented toward Northwest indicating a possible deep planar sliding on J1 (020/45) (Figure 17). The persistence and the morphological influence of J1 are clearly visible under the Third Peak area and South Peak area (Figure 17). Movements in the upper part portion of the peak could also influence the stability on the lower part. Field evidence that may corroborate this hypothesis is difficult to identify in particular because of rockfall deposits covering the outcrops. 7. CONCLUSION Results show that a DEM analysis allows detection of large scale structural features (joint/bedding) controlling the surface morphology and landslide mechanism at the Turtle Mountain. The field analysis mainly confirm the discontinuity sets detected using COLTOP 3D. These underlined discontinuities model the general slope morphology of the south part of Turtle Mountain. The cracks found in the whole area show an important influence of pre-existing discontinuity sets J2, J3. The bedding planes also control the slope morphology, in particular under Third Peak area and on the western face of the mountain. Based on the recurrent crack orientation, the most important deep movements affecting the east face are oriented toward Northeast, indicating the influence of J1 set. This discontinuity set appears to divide the whole Turtle Mountain area in several slices moving slowly in the same direction. Field observations indicate also that past and present day movements are larger in the upper part of the slope than in the lower part. Concerning the upper South Peak area, a simple failure mechanism cannot be established. The failure mechanism is likely a complex mechanism controlled by pre-existing discontinuity sets J2, J3 and S0-J6. The structural setting cannot explain by itself all the apparent movements. An interaction between the different instable blocks must be taken into account. More information about movements is needed to have a correct geometrical view of the whole upper instability. 8. ACKNOWLEDGEMENT The authors wish to thank all the Turtle Mountain project staff and Alexandre Loye for their suggestions. They thank also the two reviewers Marc-Henri Derron from Norwegian geological survey and Iris H. Voyat (Fondazione Montagna sicura) for improving this manuscript.
Structures and failure mechanisms analysis of Turtle Mountain
9. REFERENCES Allan, J.A. 1933. Report on stability of Turtle Mountain,
Alberta and survey fissures between North and South Peak. Department of Public Works, Edmonton, Alberta. Provincial Archives.
Benko, B., Stead, D., 1998. The Frank slide: A reexamination of the failure mechanism. Canadian Geotechnical Journal 35, 299-311.
Cooper, M., 1992. The analysis of fracture systems in subsurface thrust structures from the Foothills of the Canadian Rockies. In: McClay, K. R. (Ed), Thrust Tectonics, Chapman and Hall London, pp. 391–405.
Couture, R., 1998. Contributions aux aspects mécaniques, et physiques des écroulements rocheux. PhD thesis, Laval University, 573 p.
Cruden, D.M., and Krahn, J. 1973. A re-examination of the geology of the Frank slide. Canadian Geotechnical Journal, v10, p. 581-591
Fossey, K.W., 1986. Structural geology and slope stability of the southeast slopes of Turtle Mountain, Alberta, M.Sc. Thesis, University of Alberta, 113 p.
Jaboyedoff, M., Couture, R. 2003. Report on the project COLTOP3D for March 2003: stay of Michel Jaboyedoff at GSC - Ottawa . Quanterra administrative document - Activity report - RA01.
Jaboyedoff, M., Baillifard, F., Couture, R., Derron, M.H., Locat, J., Locat, P., 2005. Coupling kinematic analysis and sloping local base level criterion for large slope instabilities hazard assessment - a GIS approach. In: Hungr, O., Fell, R., Couture, R. R., Eberhardt, E., Landslide Risk Management. pp. 615-622.
Jaboyedoff M., Metzger R., Oppikofer T., Couture R., Derron, M.-H., Locat, J., Turmel, D. 2007. New insight techniques to analyze rock-slope relief using DEM and 3D-imaging cloud points: COLTOP 3D software. Proceedings of the 1st Canada-US rock mechanics Symposium, Vancouver, Canada, 27-31 May 2007.
Jaboyedoff, M., Couture, R., and Locat, P. (in press). Structural analysis of Turtle Mountain (Alberta) using Digital Elevation Model: Toward a progressive failure by “toppling” of gently dipping wedges. Geomorphology
Moreno, F. and Froese, C.R. 2007. Turtle Mountain Field Laboratory Monitoring and Reserch Summary report, 2005. Earth Sciences Report 2006. http://www.ags.gov.ab.ca/publications/ABSTRACTS/ESR_2006_07.html
Langenberg, C.W., Pana, D., Richards, B.C., Spratt, D.A., and Lamb, M.A. 2006. Structural geology of the Turtle Mountain area near Frank, Alberta. EUB/AGS Science Report 2007-01, 30 p. http://www.ags.gov.ab.ca/publications/ABSTRACTS/ESR_2007_03.html
Price R.A. 1994. Geological history of the Peace River Arch [accessed June 2004]; In Geological Atlas of the Western Canada Sedimentary Basin, Mossop G.D., Shetson I. (comp.), Canadian Society of Petroleum Geologists and Alberta Research Council, Calgary, Alberta, URL http://www.ags.gov.ab.ca/publications/ATLAS_WWW/ATLAS.shtml.
Spratt, D.A., Lamb, M.A. 2005. Borehole data interpretation and orientation, Turtle Mountain Project: Internal report of work Package WP15B, Alberta Municipal Affairs, 15 p.
Strurzenegger M., Stead, D., Froese, C., Moren, F., Jaboyedoff, M. 2007. Ground based and airborne LiDAR for structural mapping of the Frank slide. Proceedings of the 1st Canada-US rock mechanics Symposium, Vancouver, Canada, 27-31 May 2007.
A. Pedrazzini et al.