Structured Vs. Object Oriented Analysis and Design SAD · PDF fileStructured Analysis Vs....
27
Structured Vs. Object Oriented Analysis and Design SAD Vs. OOAD 1
Transcript of Structured Vs. Object Oriented Analysis and Design SAD · PDF fileStructured Analysis Vs....
Structured Vs. Object Oriented Analysis and Design
SAD Vs. OOAD
1
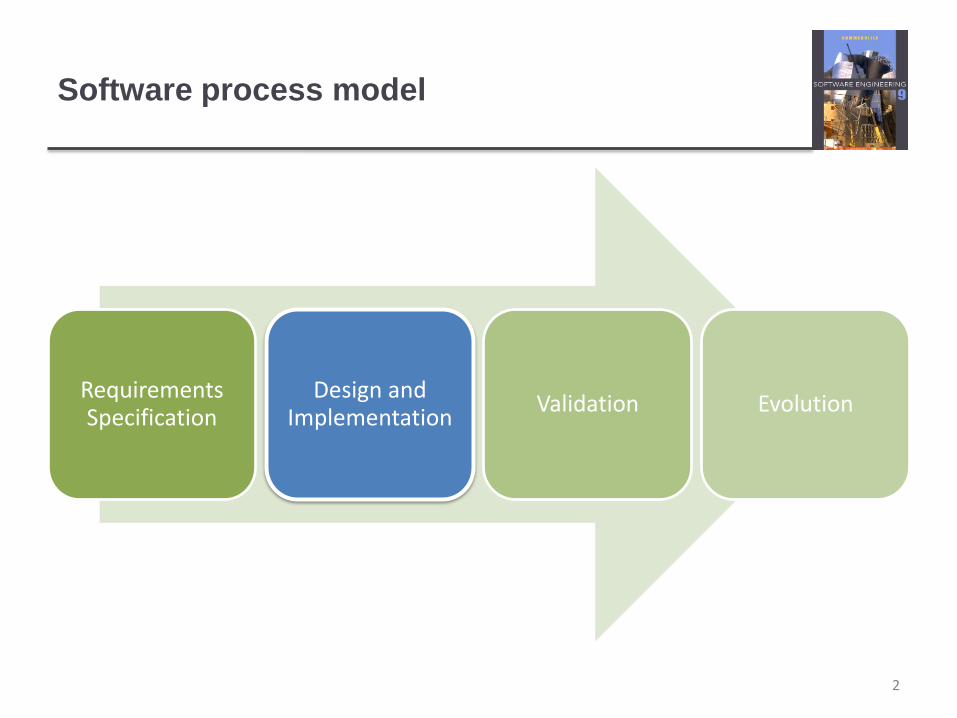
Software process model
2
Requirements Specification
Design and Implementation
Validation Evolution
Modeling
A model is an abstract view of a system
We create a model to gain better understanding
of an entity, for example a model of a plane is a
small plane.
When the entity is software, the model takes a
different form.
3
A software Model
A software model must be capable of
representing :
the information that the software transforms,
the functions that enable the transformation to occur,
and
the behavior of the system as the transformation
takes place.
Two types of software modeling (requirements):
Structured model
Object oriented model
4
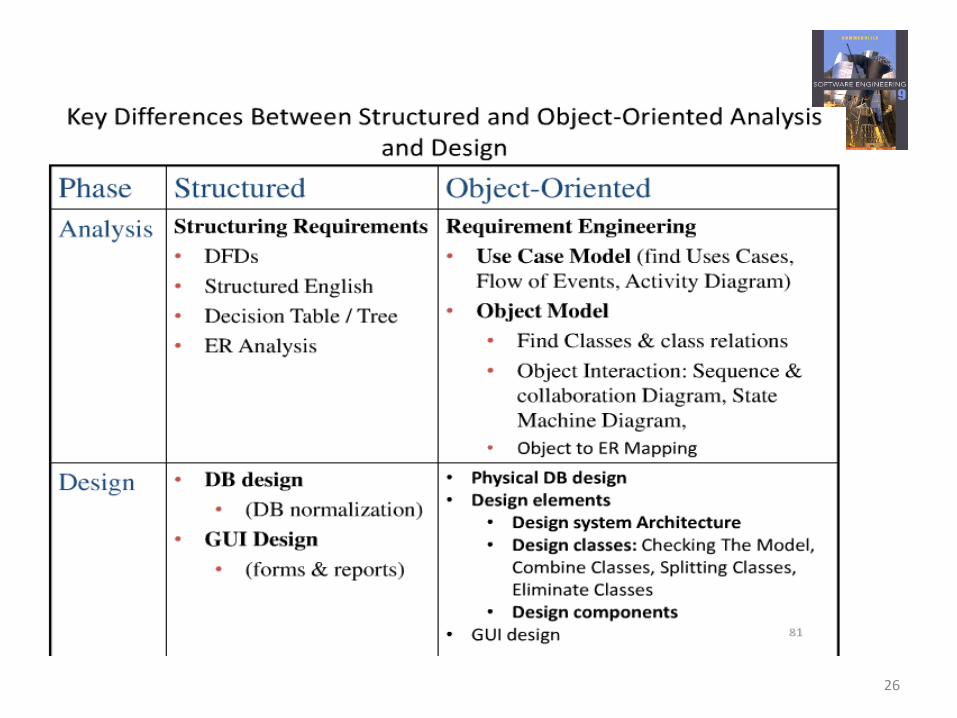
Structured Analysis Vs. Object Oriented
Modeling
Structured Analysis and Object Oriented Analysis are different techniques
of developing a computer system.
Structured analysis: the focus is only on process and procedures.
Modeling techniques used in it are DFD(Data Flow Diagram), Flowcharts
etc.
Object oriented analysis: the focus is more on capturing the real world
objects in the current scenario that are of importance to the system. It
stresses more on data structure and less on procedural structure.
Modeling techniques used in it are UML(Unified modeling Language),
that can present both structural and behavioral/procedural aspect of the
system. UML includes Class Diagram, State Diagram, Use case diagram,
Sequence Diagram, etc.
Chapter 5 System modeling 5
Structures Analysis and Design
SAD
6
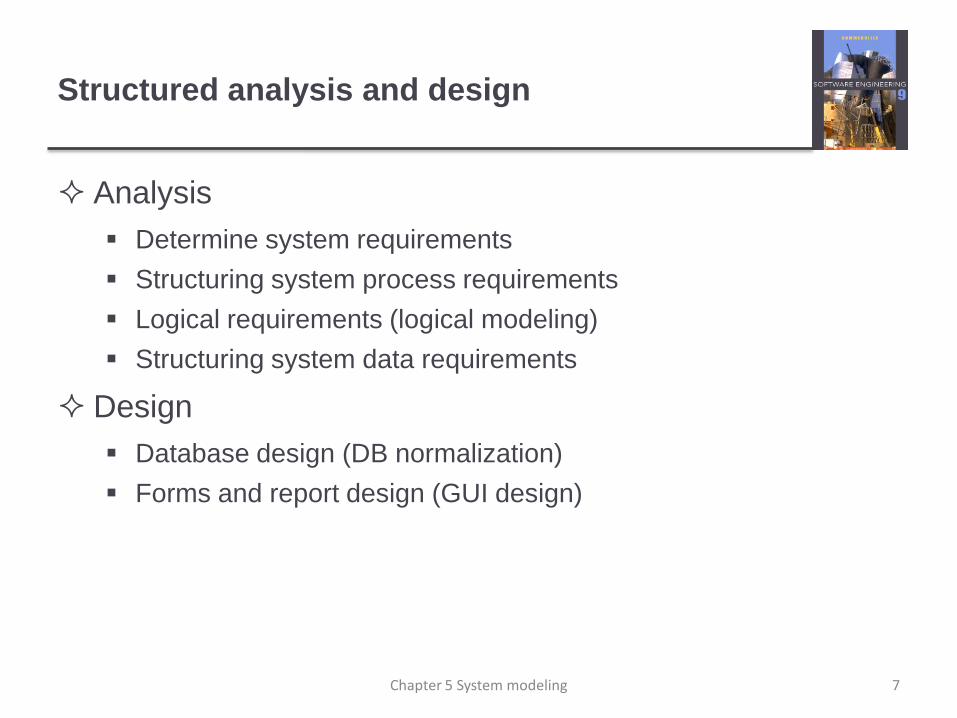
Structured analysis and design
Analysis
Determine system requirements
Structuring system process requirements
Logical requirements (logical modeling)
Structuring system data requirements
Design
Database design (DB normalization)
Forms and report design (GUI design)
Chapter 5 System modeling 7
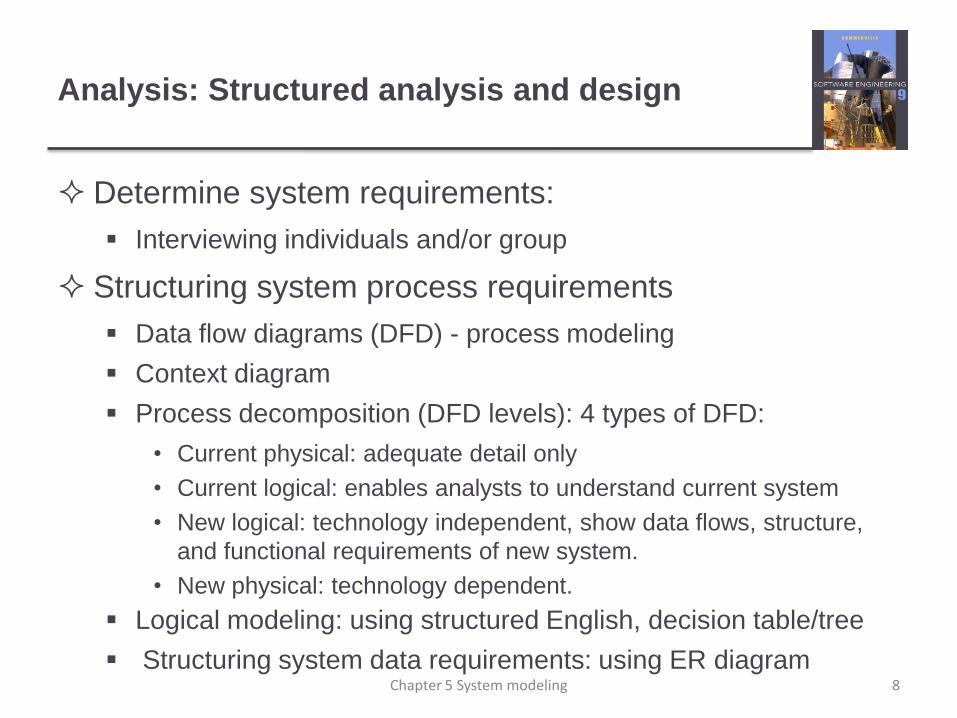
Analysis: Structured analysis and design
Determine system requirements:
Interviewing individuals and/or group
Structuring system process requirements
Data flow diagrams (DFD) - process modeling
Context diagram
Process decomposition (DFD levels): 4 types of DFD:
• Current physical: adequate detail only
• Current logical: enables analysts to understand current system
• New logical: technology independent, show data flows, structure,
and functional requirements of new system.
• New physical: technology dependent.
Logical modeling: using structured English, decision table/tree
Structuring system data requirements: using ER diagramChapter 5 System modeling 8
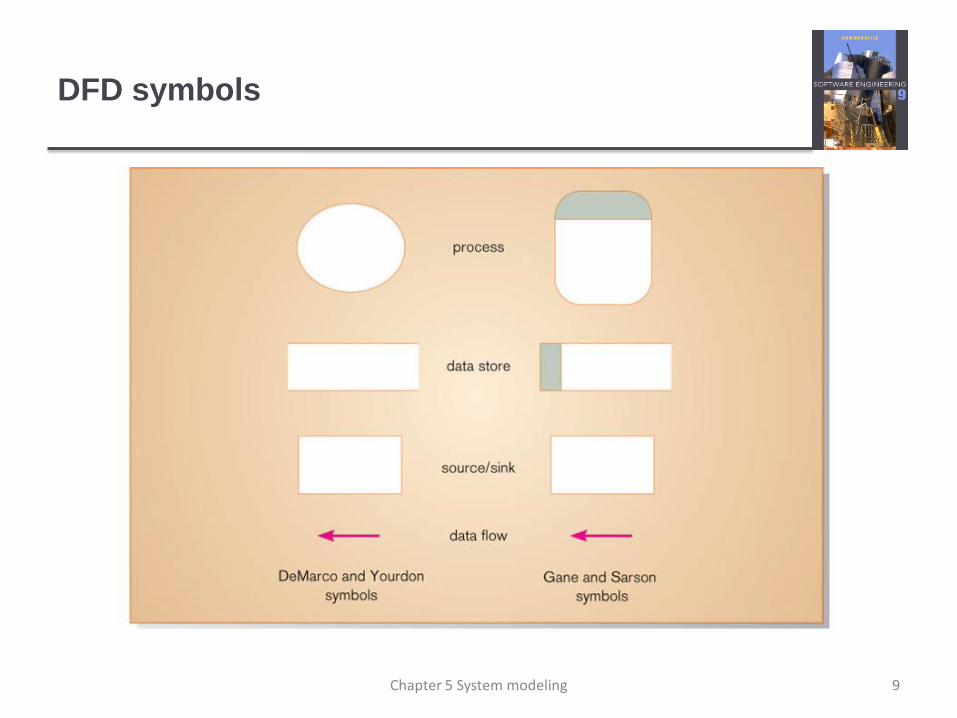
DFD symbols
Chapter 5 System modeling 9
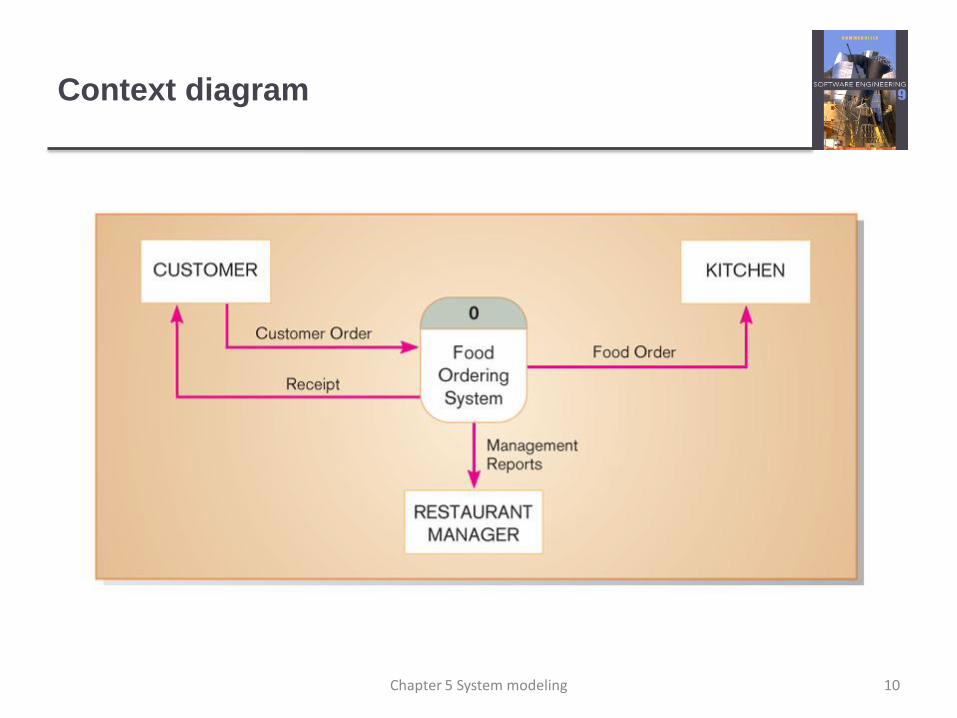
Context diagram
Chapter 5 System modeling 10
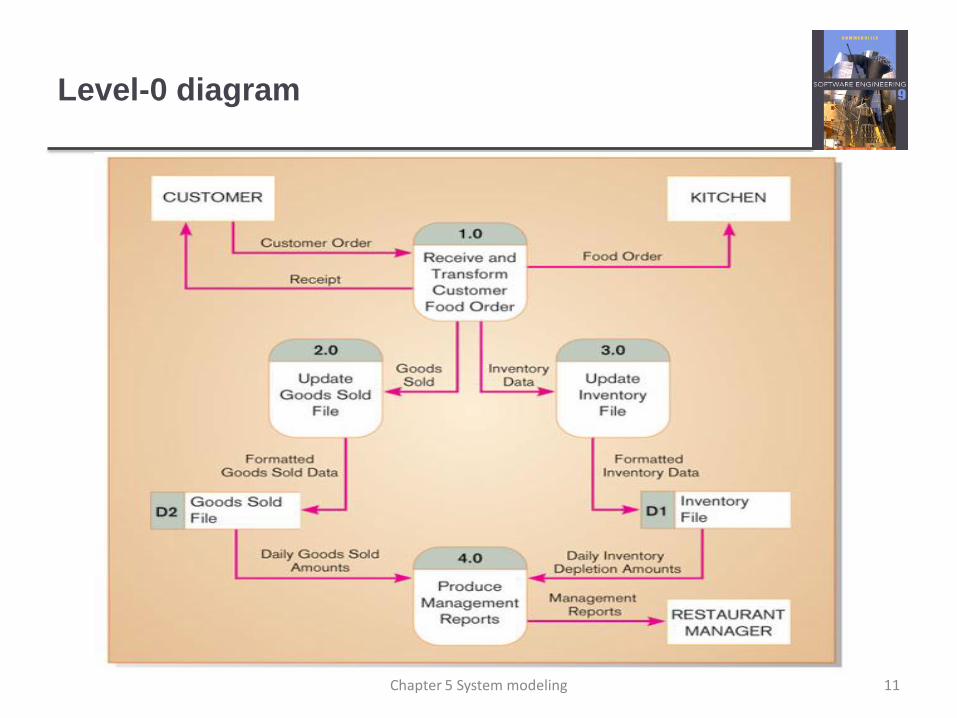
Level-0 diagram
Chapter 5 System modeling 11
Design: Structured analysis and design
Database design (DB normalization):
Converting complex data structures into simple, stable data
structures.
The result of normalization is that every non-primary key attribute
depends upon the whole primary key.
Forms and report design (GUI design)
Chapter 5 System modeling 12
Object Oriented Analysis and Design
OOAD
13
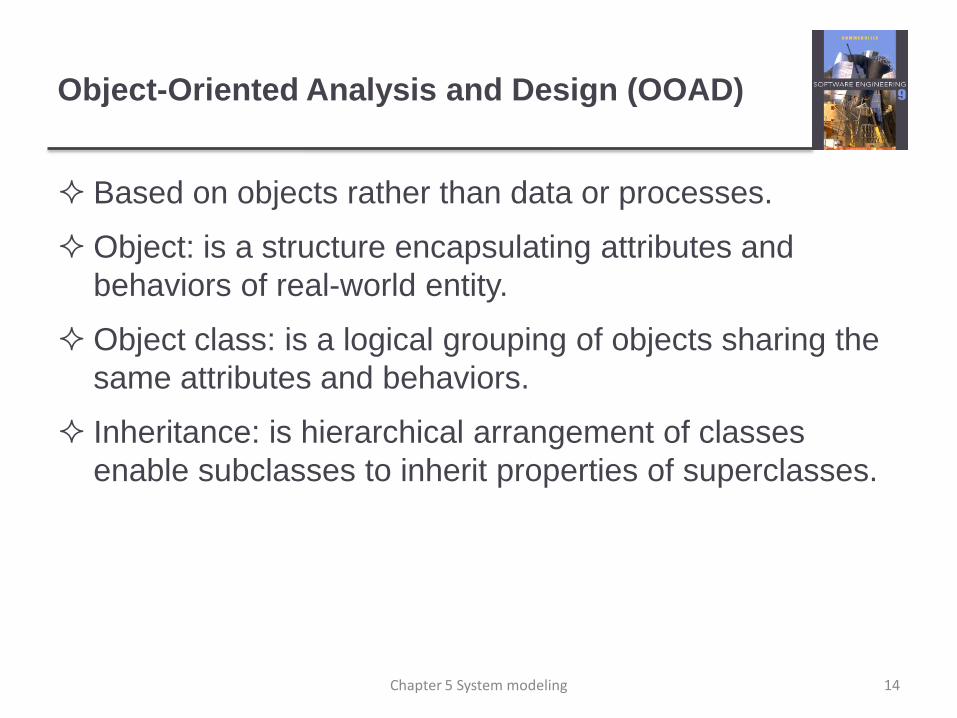
Object-Oriented Analysis and Design (OOAD)
Based on objects rather than data or processes.
Object: is a structure encapsulating attributes and
behaviors of real-world entity.
Object class: is a logical grouping of objects sharing the
same attributes and behaviors.
Inheritance: is hierarchical arrangement of classes
enable subclasses to inherit properties of superclasses.
Chapter 5 System modeling 14
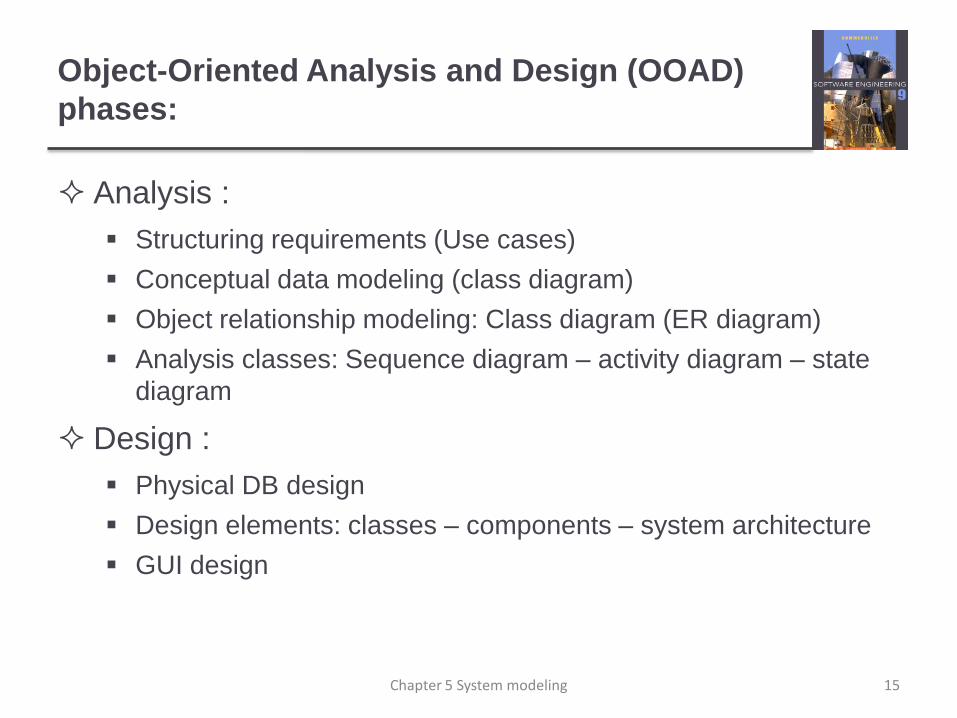
Object-Oriented Analysis and Design (OOAD)
phases:
Analysis :
Structuring requirements (Use cases)
Conceptual data modeling (class diagram)
Object relationship modeling: Class diagram (ER diagram)
Analysis classes: Sequence diagram – activity diagram – state
diagram
Design :
Physical DB design
Design elements: classes – components – system architecture
GUI design
Chapter 5 System modeling 15
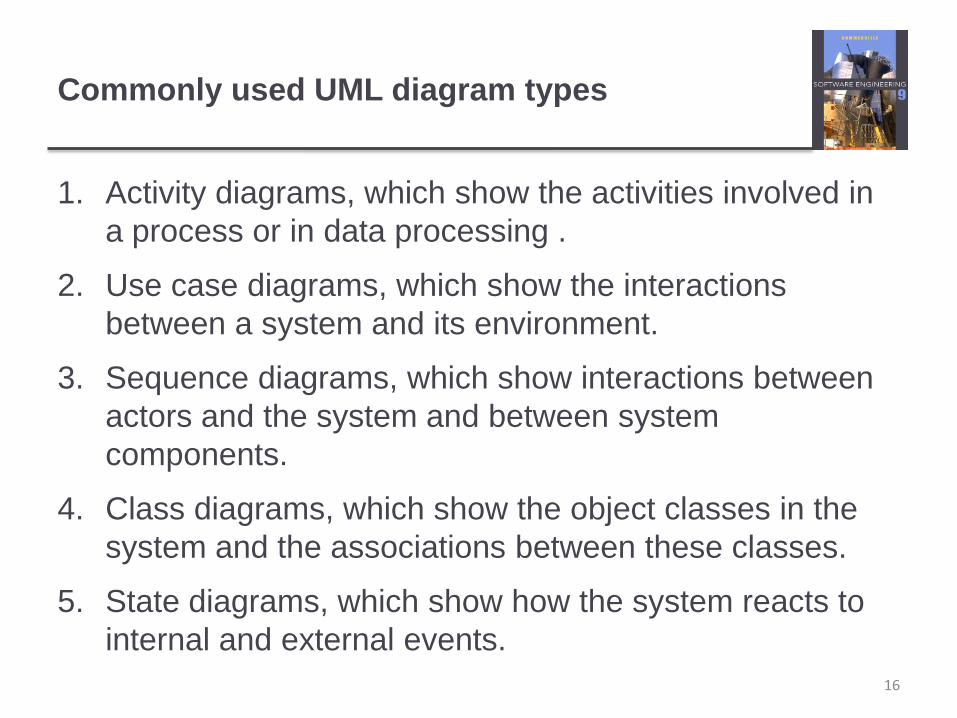
Commonly used UML diagram types
1. Activity diagrams, which show the activities involved in
a process or in data processing .
2. Use case diagrams, which show the interactions
between a system and its environment.
3. Sequence diagrams, which show interactions between
actors and the system and between system
components.
4. Class diagrams, which show the object classes in the
system and the associations between these classes.
5. State diagrams, which show how the system reacts to
internal and external events.
16
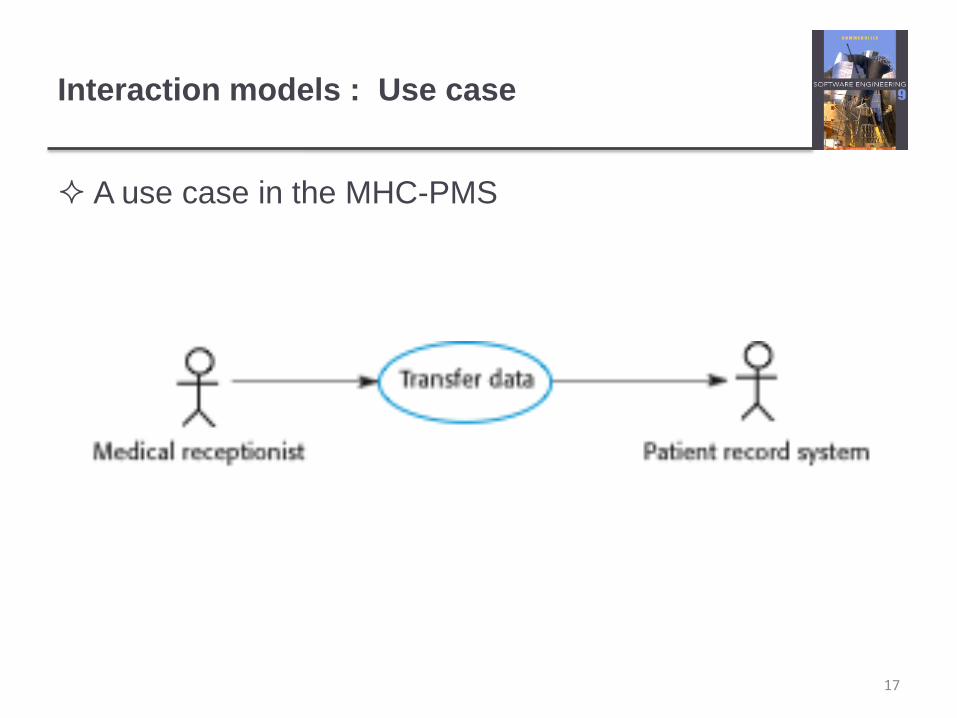
Interaction models : Use case
A use case in the MHC-PMS
17
Structural models : Class diagrams
An association is a link between classes that indicates
that there is some relationship between these classes.
When you are developing models during the early stages
of the software engineering process, think of objects
represent something in the real world, such as a patient,
a prescription, doctor, etc.
18
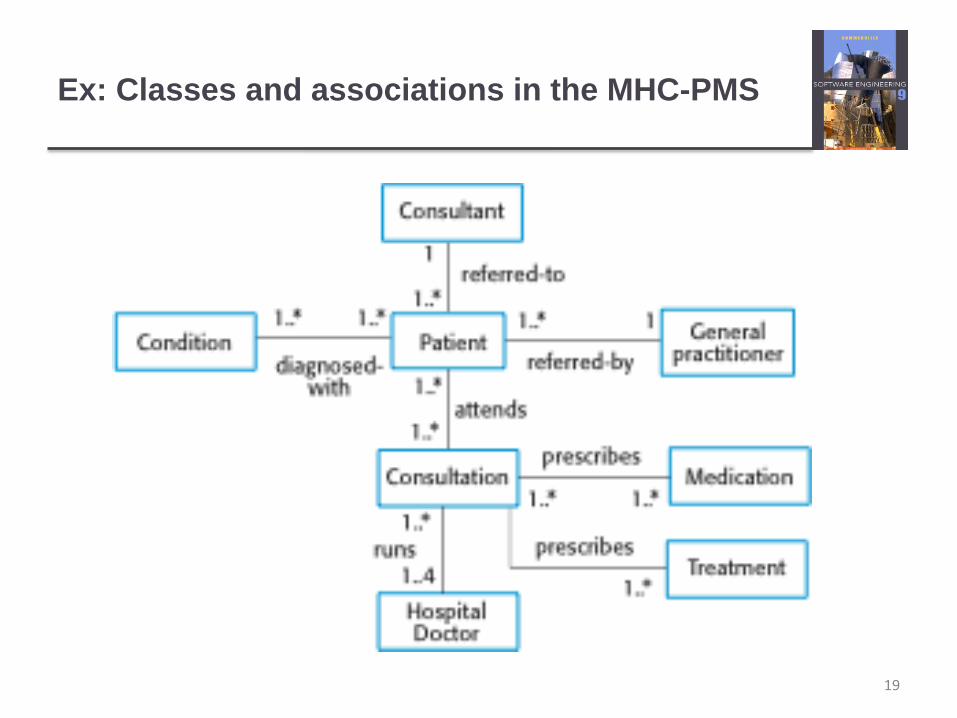
Ex: Classes and associations in the MHC-PMS
19
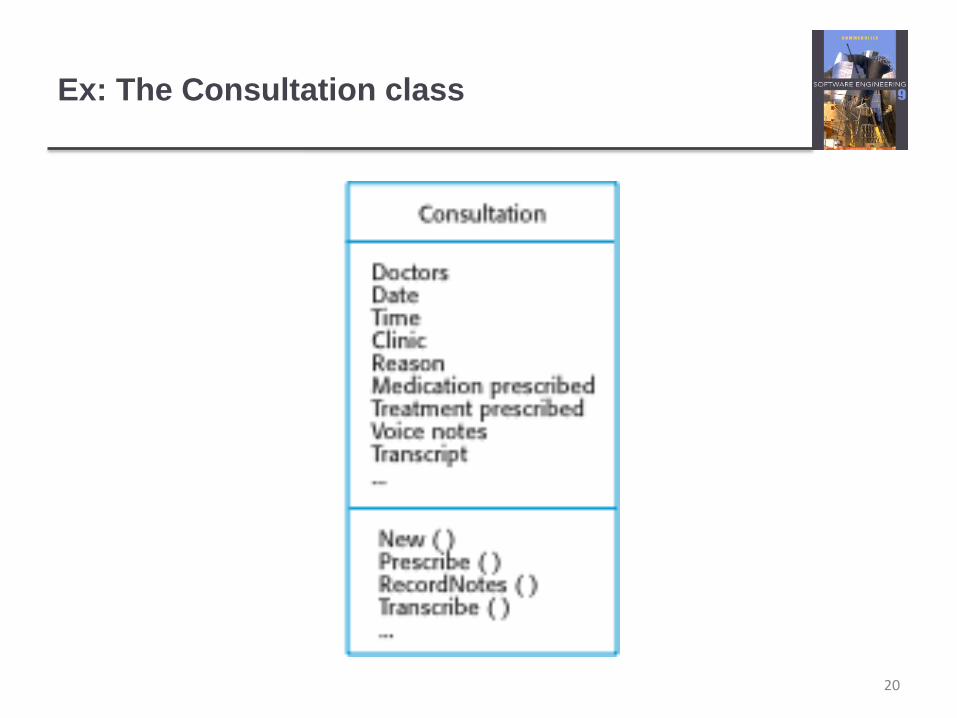
Ex: The Consultation class
20
Behavioral models
A- Data-driven modeling – Activity diagram
Behavioral models are models of the dynamic behavior of a system
as it is executing. They show what happens or what is supposed to
happen when a system responds to a stimulus from its environment.
Many business systems are data-processing systems that are
primarily driven by data. They are controlled by the data input to the
system, with relatively little external event processing.
Data-driven models show the sequence of actions involved in
processing input data and generating an associated output.
They are particularly useful during the analysis of requirements as
they can be used to show end-to-end processing in a system.
21
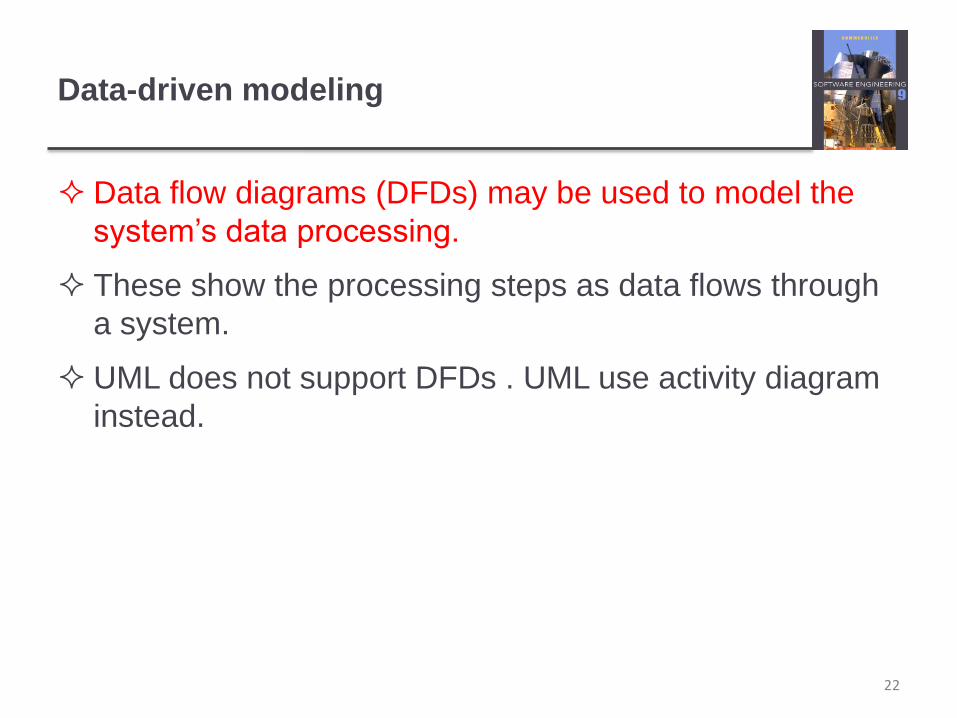
Data-driven modeling
Data flow diagrams (DFDs) may be used to model the
system’s data processing.
These show the processing steps as data flows through
a system.
UML does not support DFDs . UML use activity diagram
instead.
22
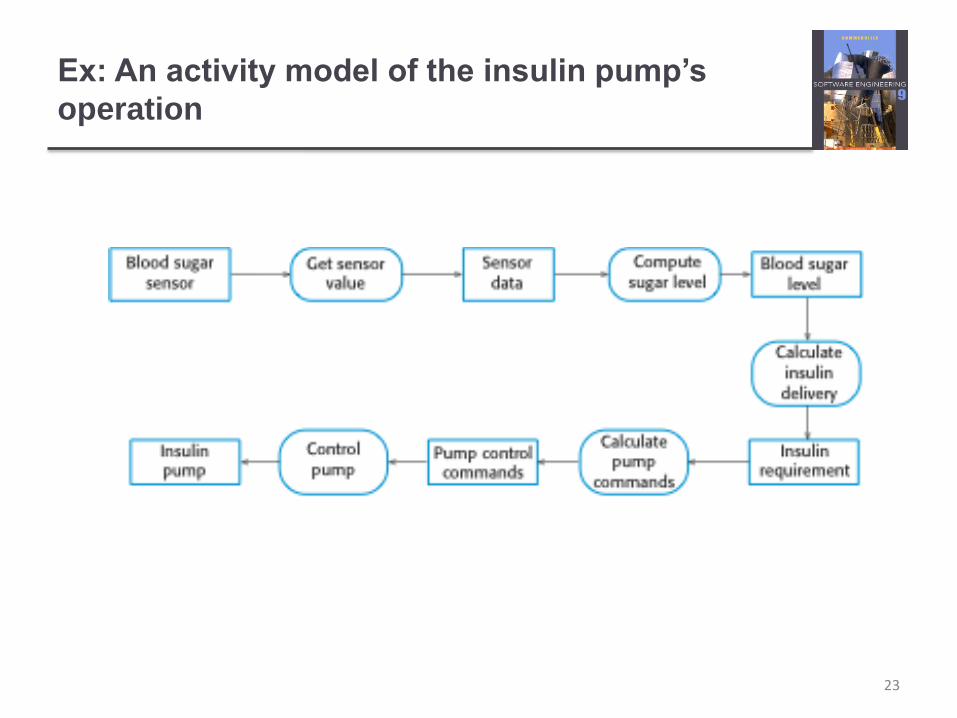
Ex: An activity model of the insulin pump’s
operation
23
Behavioral models
B- Event-driven modeling - State diagram
Event-driven modeling shows how a system responds to
external and internal events.
24
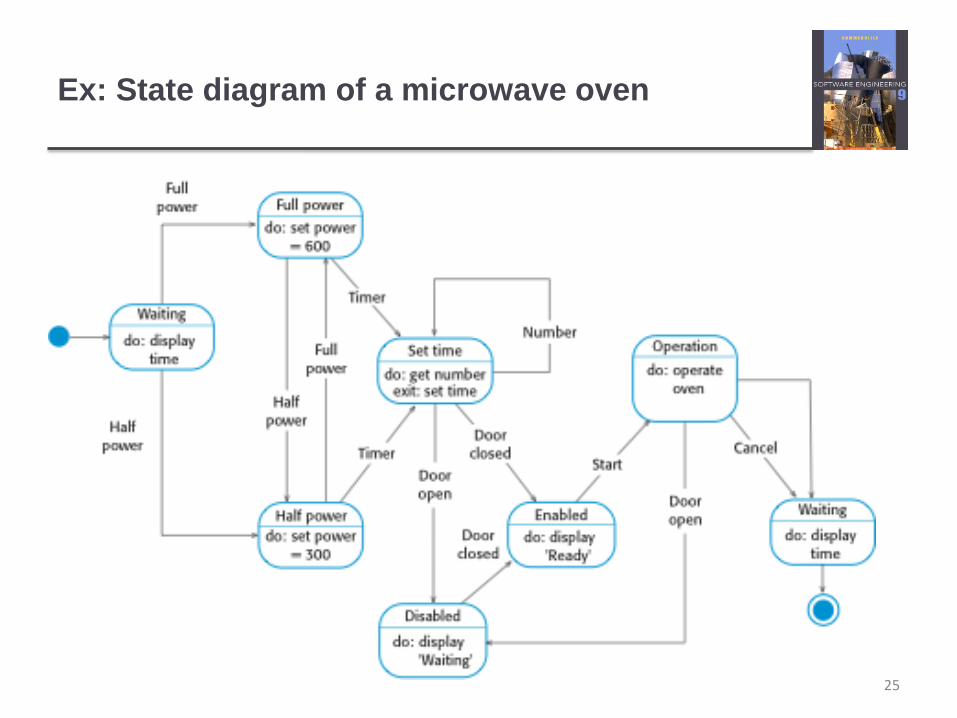
Ex: State diagram of a microwave oven
25
26
References
http://www.slideshare.net/mksaad/structure-vs-object-
oriented-analysis-and-design
Sommerville, Ian ,“Software Engineering”, 9th edition,
PEARSON
27