Structure of the food System - Pennsylvania State...
64
Distribution And the Structure of the Food System
Transcript of Structure of the food System - Pennsylvania State...

Distribution And the Structure of the Food System

Marketing Mix
1. Product
2. Price
3.Distribution 4. Promotion
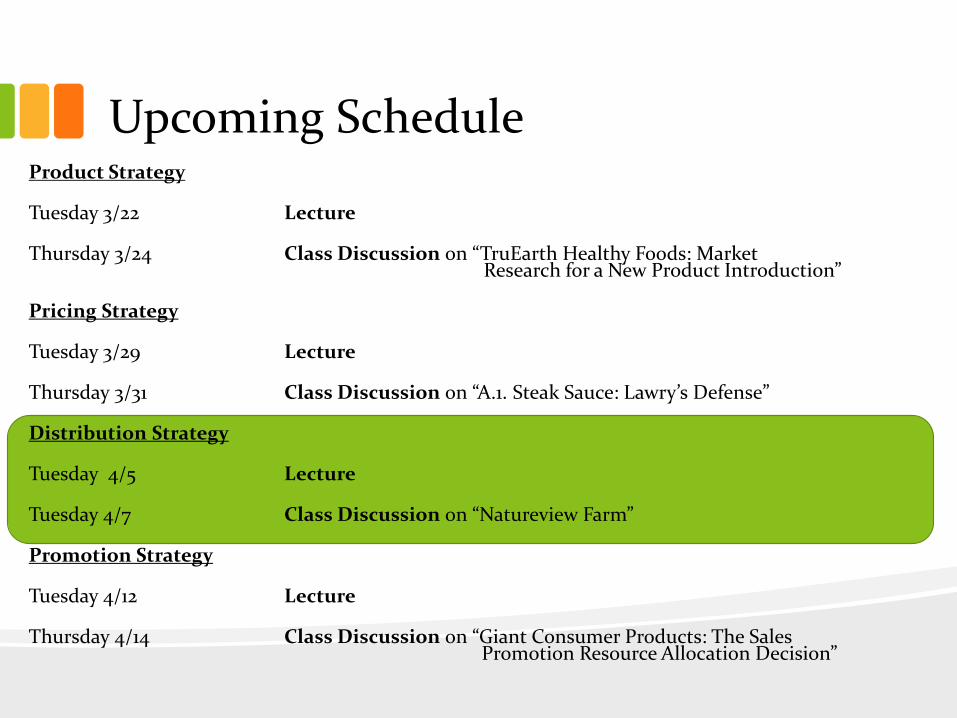
Upcoming Schedule Product Strategy
Tuesday 3/22 Lecture
Thursday 3/24 Class Discussion on “TruEarth Healthy Foods: Market Research for a New Product Introduction”
Pricing Strategy
Tuesday 3/29 Lecture
Thursday 3/31 Class Discussion on “A.1. Steak Sauce: Lawry’s Defense”
Distribution Strategy
Tuesday 4/5 Lecture
Tuesday 4/7 Class Discussion on “Natureview Farm”
Promotion Strategy
Tuesday 4/12 Lecture
Thursday 4/14 Class Discussion on “Giant Consumer Products: The Sales Promotion Resource Allocation Decision”

Overview
1. The Food Value-Added Chain
2. Control in Channels
3. Pricing Through Channels
4. The Various Players
– Wholesalers
– Retailers
5. Food Away From Home
6. Logistic Mix

Food Value-Added Chain
The sequence of institutions that delivers the final food product to the consumer.
Functions of a Distribution Channel
1. Physical changes and movements
– Ex: Producers change inputs to products, wholesalers move products to retailers,…
2. Flow of information
– Downstream info is transmitted back to the producers
• demand, costs, inventory levels, etc.
3. Change of ownership
– as products move down a channel, they are bought
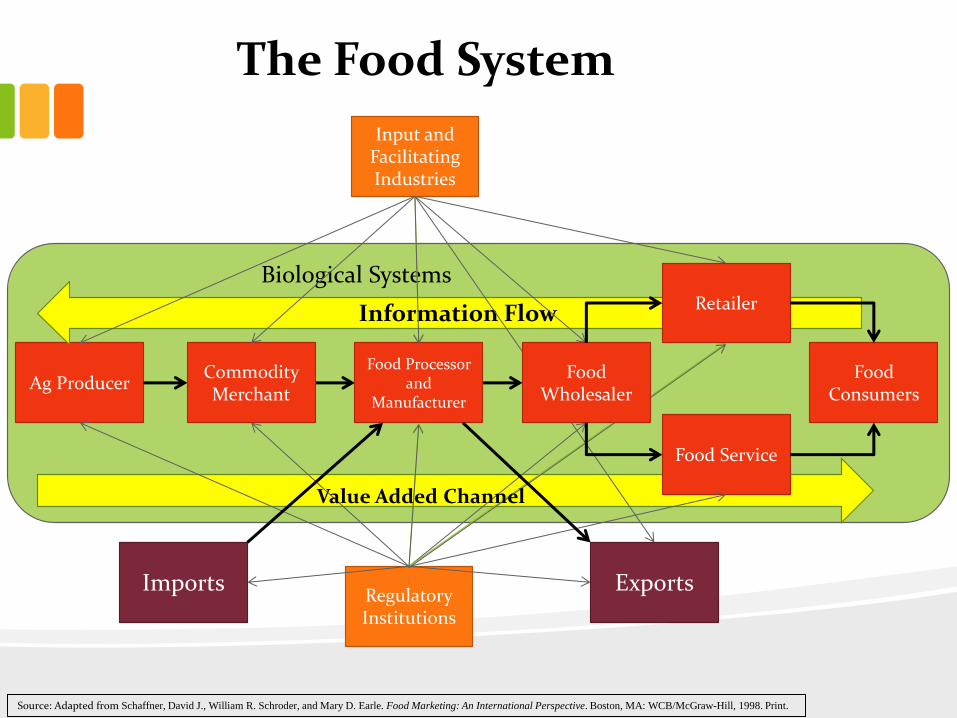
The Food System
Source: Adapted from Schaffner, David J., William R. Schroder, and Mary D. Earle. Food Marketing: An International Perspective. Boston, MA: WCB/McGraw-Hill, 1998. Print.
Ag Producer
Food Service
Food Consumers
Imports Exports
Commodity Merchant
Food Processor and
Manufacturer
Biological Systems
Input and Facilitating Industries
Regulatory Institutions
Information Flow
Value Added Channel
Retailer
Food Wholesaler

Biological Nature of Food and Time
The biological nature of food products introduces special features to food systems
Ex: Beef Industry
• Beef production cannot be accelerated like shoe production can by increasing variable inputs
• If the market signals for more beef through high prices, it will take 32 months for increased production to reach the consumer
• More beef in the short-term may mean less long-term beef as breeding cows are sold for meat

Biological Nature of Food and Time
The biological nature of food products introduces special features to food systems
Ex: Fruits and Vegetables
• Must be delivered to market rapidly before they rot
• Refrigerated handling requires energy and expensive equipment making transport and storage costly
• For these reasons highly perishable foods tend to have shorter food chains
• very inelastic short-term supply

Adding Value
• Each link in the food chain adds value to the product
– This allows the firms at those stages to markup the product to cover operating expenses and (potentially) make a profit
– If they do not add value, they would not exist (in principle)
– Each link buys inputs from
1. upstream links
2. other firms
– and sells more valuable outputs downstream
– When selling, all downstream links must be considered
• Ex: A manufacturer may develop new cost effective packaging that ships better and stacks better making it easier on the wholesaler, but if the retailer does not like it, it will fail.


Efficiency in the Food System: Technology
Technical Efficiency – a measure of how low costs are relative to output
• Ex: average cost of production a unit of output
• Scale economies in food production and processing is driving market concentration
– This is particularly the case in capital intensive industries
Who benefits from more technical efficiency?
Both industry and consumers

Efficiency in the Food System: Pricing
• Pricing Efficiency – a measure of how close retail prices are to those that would be observed under perfect competition at all levels in the food chain
• Monopolistic behavior creates deadweight loss in the form of lost consumer surplus
• Ag markets come closest to the economists’ ideal of a competitive market, but it is unclear whether intermediaries are competitive
– If not, then technical efficiencies will not be passed onto consumers

Marketing Margins Retail price minus farm gate price divided by retail prices
• Are NOT a measure of pricing efficiency
• MKTG margins ignore the value added by marketing intermediaries and producers
• Examples
– Farmers receive 13% of the retail price of frozen French fries, but 22% of fresh potatoes
– Farmers receive 60% of the retail price of eggs, but only 7% of bread
– Lettuce has high marketing margins because of a lot of what is bought by intermediaries will not be sold due to spoilage
• Transport of low-value, bulky goods, such as wheat, results in high margins because the quasi-fixed transportation cost is a large % of its retail price
• Marketing margins have been decreasing over the last century because our food is more processed and more widely distributed

Increases in Added Value Has Been Greater Downstream From Wholesalers

Where Your Food Dollar Goes 1993 2011
From the ERS/USDA “Food Dollar Series” web app
More “Value Added”
More Processing
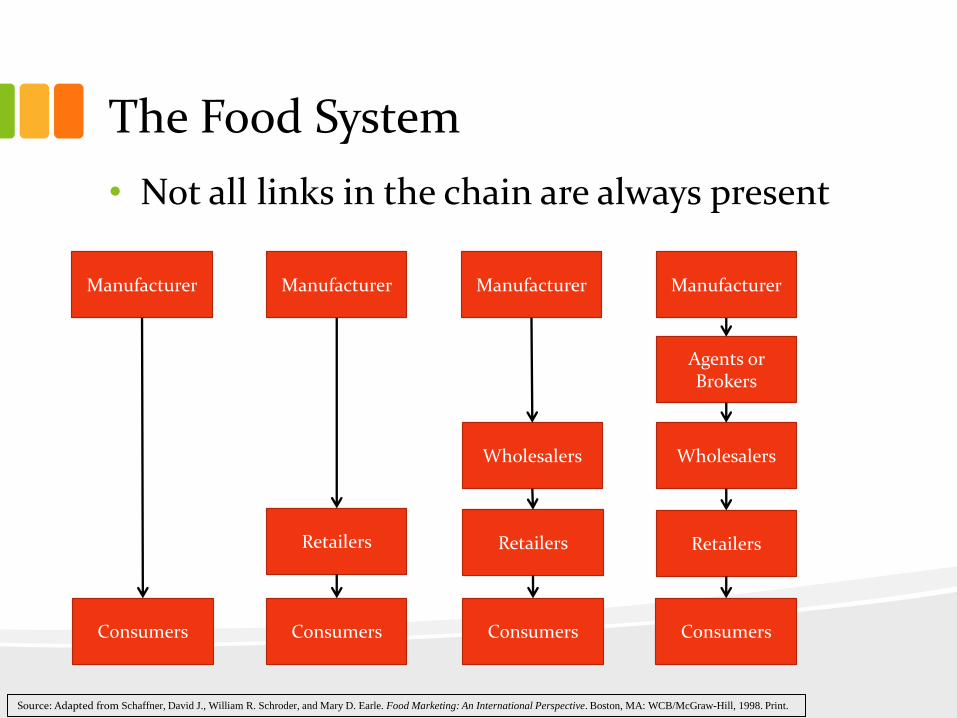
The Food System
• Not all links in the chain are always present
Manufacturer
Agents or Brokers
Consumers
Retailers
Wholesalers
Consumers Consumers Consumers
Retailers Retailers
Wholesalers
Manufacturer Manufacturer Manufacturer
Source: Adapted from Schaffner, David J., William R. Schroder, and Mary D. Earle. Food Marketing: An International Perspective. Boston, MA: WCB/McGraw-Hill, 1998. Print.
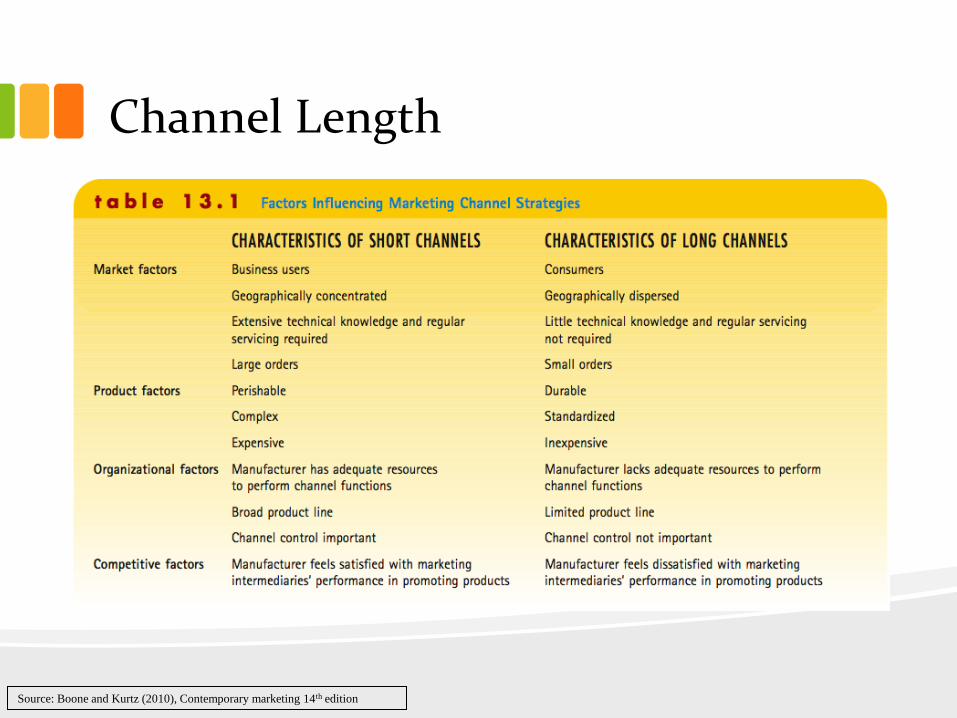
Channel Length
Source: Boone and Kurtz (2010), Contemporary marketing 14th edition

Baker in the Food Chain
Wheat Producer
Wheat Merchant
Flour Miller Baker
Restaurant
Convenience Store
Food Service Distributor
Supermarket
Consumers
Wholesaler
Yeast, Packaging,
etc.

Baker in the Food Chain
Wheat Producer
Wheat Merchant
Flour Miller Baker
Restaurant
Convenience Store
Food Service Distributor
Supermarket 2
Consumers
Wholesaler
Yeast, Packaging,
etc.
Supermarket 1 • Channel Conflict can occur when you do business with competitors
– ex: if supermarket 1 price < supermarket 2 price, SM 2 will be unhappy

Control in Channels

Control in Channels • Open Market Channel – activities are carried out by independent
companies.
• Administered Channel – sequential activities are under the control of one organization.
• Administered channels can come to be in 3 ways
1. Vertical Integration
• Involves ownership of multiple nodes in the food chain
• Ex: A supermarket that owns its own bakery
• What about a stand at a Farmers’ Market?
2. Contractual Agreements
• Binding agreements between independent nodes in the food chain.
• Ex: Frozen peas must be processed immediately after picking. Processors make contractual agreements with farmers that allow them to tell them exactly when to start picking.
3. Influence
• Nonbinding control of one independent node over another.
• Ex: Walmart is so powerful it dictates prices and production processes of producers
Baker
Supermarket

Coordination in the Food Chain
• Administered channel coordination has been increasing for the last several decades for reasons of
1. risk management
2. quality assurance
3. raw-product availability
4. efficient plant utilization
5. ensuring retail assortments

Producer-Processor Coordination • Contracts may be production (forward) or marketing (sales) agreements
– Are a means of a high degree of coordination without full vertically integration
– Are increasingly popular (as opposed to open spot markets)
– Marketing Contract – Processor agrees to a price before the commodity is ready for planting. • Producer assumes all production risks, but price risk is shared
• Allows the processor to be part of the planting and harvesting timing decisions
• Ensures processor a steady flow of desired ag products
• 40% of fruits and veggie production are under market contract
– Production Contract – agreements for ag product purchases entered into prior to planting at a set price, with production factors determined by the producer to ensure the desired quality and quantity • Reduces the risk to producers
• Gives processors more power over quality and timing of throughput
• Processor may make harvesting decisions multiple times per day to ensure quality and throughput continuity
• Ensures standardization and allows processors the ability to adjust to changing consumer preferences
• Common in meat industries: 70% of poultry, 33% of hogs, and 14% of cattle
• Ex: Birds Eye

Pricing in Channels

Pricing in a Channel
• Because downstream firms take ownership of your product, you cannot set the retail price
• Retailers typically use Cost Plus pricing strategy.
• You may want to set your price based on what the consumer pays.
• To do this you will have to back out the price you charge retailers.
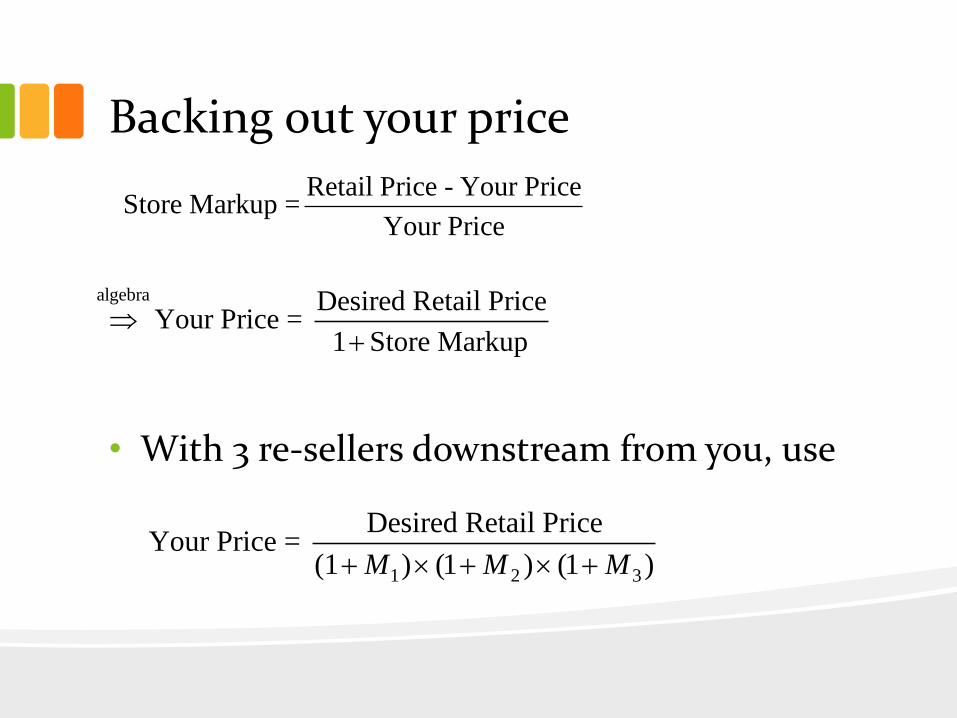
Backing out your price
• With 3 re-sellers downstream from you, use
Retail Price - Your PriceStore Markup =
Your Price
1 2 3
Desired Retail PriceYour Price =
(1 ) (1 ) (1 )M M M
algebra Desired Retail PriceYour Price =
1 Store Markup

Caution: Markup ≠ Margin
Store Price Your PriceStore Margin =
Store Price
Store Price - Your PriceStore Markup =
Your Price
algebra Retail PriceYour Price =
1 Store Markup
algebra
Your Price = Retail Price (1- Store Margin)

Channel Pricing Law
• Robinson-Patman Act (1936) – Cannot have different prices for different buyers that are at the same level of the food chain for the purpose of harming competition. – limits third degree price discrimination (different prices for
different commercial segments)
– designed to protect small businesses from volume discounts
– product must cross state lines to be enforced
– increasing burden of proof is making RPA lawsuits less successful recently*
• Ex: If Hershey sells candy bars to 7-Elevens and a mom-and-pop gas station in NY at the same time, they must be at the same price
* Toth, R.J., “A Powerful Law Has Been Losing a Lot of Its Punch.” Wall Street Journal May 21, 2012. online.wsj.com. 10/16/2013.

The Various Players

Wholesalers
• Wholesalers take title of goods from manufacturers and distributes them to retailers
• Wholesalers eliminate redundancy in the system by making it unnecessary for every retailer-manufacturer pair to find and contact each other, and negotiate with each other
– Directly provides economies of scale
Wholesaler

Wholesalers
• Instead of contacts, only contacts are needed with a wholesaler.
# # manufacturers retailers
# # manufacturers retailers
Wholesaler

Wholesaler Create Value By…
1. increasing technical efficiency by – reducing costs both upstream and downstream
– reducing loss from deterioration
– increasing production by allowing specialization in production (How?) • all products don’t need to be manufactured in each region; each
region produces only what they’re good at and distributed to all regions
2. creating consumer utility by allowing for – a greater variety of goods
– distributed over a wide geographic area
– in a timely manner (by carrying market-ready inventories)
Wholesaler
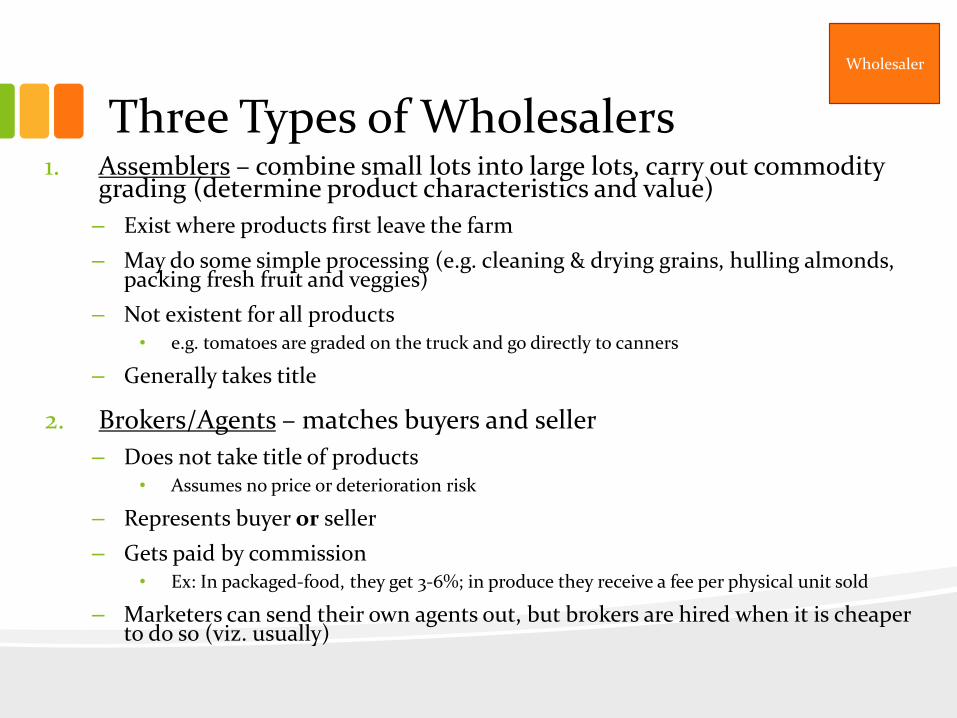
Three Types of Wholesalers 1. Assemblers – combine small lots into large lots, carry out commodity
grading (determine product characteristics and value)
– Exist where products first leave the farm
– May do some simple processing (e.g. cleaning & drying grains, hulling almonds, packing fresh fruit and veggies)
– Not existent for all products • e.g. tomatoes are graded on the truck and go directly to canners
– Generally takes title
2. Brokers/Agents – matches buyers and seller
– Does not take title of products • Assumes no price or deterioration risk
– Represents buyer or seller
– Gets paid by commission • Ex: In packaged-food, they get 3-6%; in produce they receive a fee per physical unit sold
– Marketers can send their own agents out, but brokers are hired when it is cheaper to do so (viz. usually)
Wholesaler

Three Types of Wholesalers 3. Merchant Wholesalers – store an assortment of market-
ready goods that can be bought from retailers
– For instance, in warehouses
– They take title and assume all associated risks • Ex: In 1989 produce merchants lost $300 million due to suspected cyanide
poisoning of Chilean grapes
• Many supermarket, club, and supercenter chains have vertically integrated to perform wholesaling functions
• Many wholesalers develop their own private labels
– Ex: C&S Wholesale Grocers owns the Piggly Wiggly and Best Yet private label
• Economies of scale are driving concentration in wholesaling industries
– some gross > $30 billion (B)
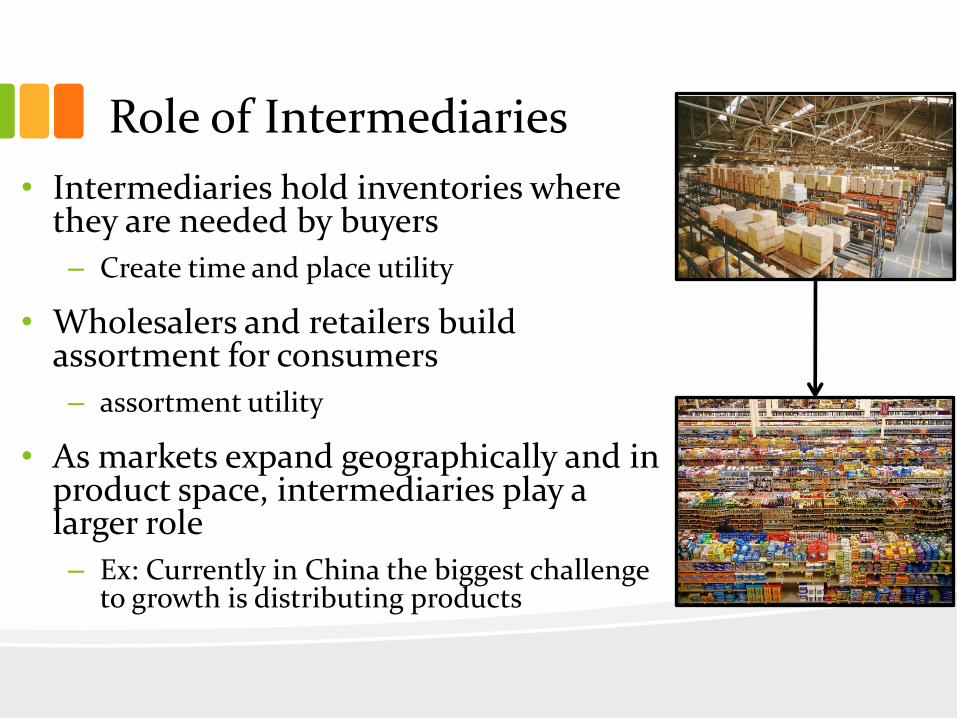
Role of Intermediaries
• Intermediaries hold inventories where they are needed by buyers
– Create time and place utility
• Wholesalers and retailers build assortment for consumers
– assortment utility
• As markets expand geographically and in product space, intermediaries play a larger role
– Ex: Currently in China the biggest challenge to growth is distributing products

Direct Selling
• When goods are carried directly from producer to consumer
When is this the best distribution strategy?
• Does not eliminate the functions of intermediaries, rather producers perform them themselves
– This is a good strategy only if the producer can perform those functions better (e.g. lower cost, greater customer satisfaction) Examples?
• Ex: farmers’ markets, online selling, highly customized products, high-end specialty products (low volume)
Baker Consumer

Myth of the Middle Men
“Cut out the middle men and you make more profit.”
FALSE (unless it’s true)
• “Middle men” exist because they create value
– If they didn’t they wouldn’t exist
• Cut them out and you still have to do their job
– Can you do it cheaper than them + their markup?

Channel Structures
• Reverse Channels: Channels designed to return goods to their producers
– recalls, unsold items

Channel Structures
• Dual Distribution - when a producer /manufacturer distributes their goods through multiple channels
– Ex: Direct selling and concurrent use of a supermarket
– this often leads to…
Baker
Supermarket
Consumer

Channel Conflict Conflicts that arise from selling products through multiple channels.
• Strains relations with intermediaries and possibly loses business
• Ex: Baked goods sold through wholesaler and directly to supermarket.
– Your wholesaler price = $3.00/12.
• They markup to $3.50/12
– Your supermarket price = $3.75/12
– When the supermarket finds out they can buy from the wholesaler for cheaper
• they will buy from the wholesaler instead
• they will not be happy with you for selling to wholesalers for cheaper
• Especially prevalent when manufacturers sell to retailers and directly to consumers
– Creates direct competition between the manufacturer and retailer
– Makes it difficult to have a trusting relationship
Baker
Supermarket
Wholesaler

Retailers - Traditional • Conventional Supermarket – a format offering a full line of groceries, meat, and produce with at
least $2 million in annual sales. Typically carries approximately 15,000 items and frequently offers a service deli and a bakery.
• Superstore – a larger supermarket (at least 40,000 square feet in total selling area and 25,000 items) offering an expanded selection of nonfood items.
– Ex: Fred Meyer, Food 4 Less & Foods Co.
• Combination Food/Drug Store – a combination of a superstore and drug store, but with 85 percent of sales still from food products.
– Ex: Jewel-Osco
• Warehouse Store – a low-margin grocery store offering reduced variety, lower service levels, and a streamlined merchandising presentation, and lower prices.
– Ex: WinCo Foods, Super Saver Foods
• Super Warehouse – a high-volume, hybrid format of a superstore and a warehouse store. Offer a full range of service departments, quality perishables, and reduced prices.
• Limited-Assortment Foodstore – a low-priced grocery store providing limited services and carrying fewer than 2,000 items with limited perishable products.
– Ex: Aldi’s
• Specialty/Gourmet Retailers – Specializes in a specific food category, such as organic, locally grown or produced, ethnic/international, or health focused.
– Ex: Whole Foods, Trader Joe’s
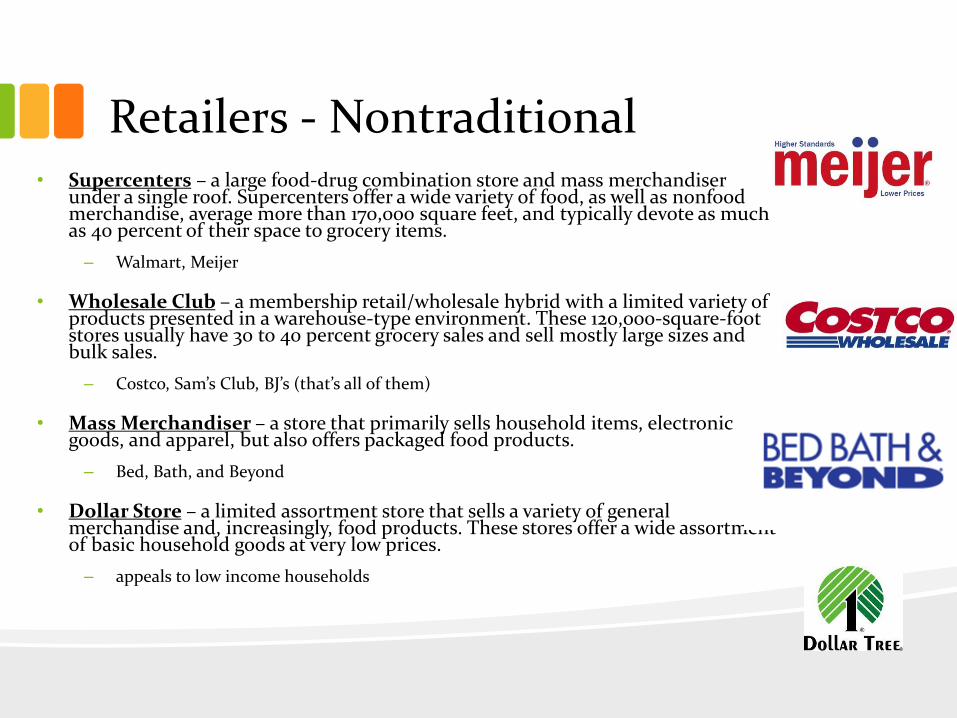
Retailers - Nontraditional • Supercenters – a large food-drug combination store and mass merchandiser
under a single roof. Supercenters offer a wide variety of food, as well as nonfood merchandise, average more than 170,000 square feet, and typically devote as much as 40 percent of their space to grocery items.
– Walmart, Meijer
• Wholesale Club – a membership retail/wholesale hybrid with a limited variety of products presented in a warehouse-type environment. These 120,000-square-foot stores usually have 30 to 40 percent grocery sales and sell mostly large sizes and bulk sales.
– Costco, Sam’s Club, BJ’s (that’s all of them)
• Mass Merchandiser – a store that primarily sells household items, electronic goods, and apparel, but also offers packaged food products.
– Bed, Bath, and Beyond
• Dollar Store – a limited assortment store that sells a variety of general merchandise and, increasingly, food products. These stores offer a wide assortment of basic household goods at very low prices.
– appeals to low income households

Supercenters and Club Stores are Taking Over
0.5
0.6
0.7
0.8
0.9
Share of US Food Market By Channel (Household Expenditures)
Grocery
0
0.02
0.04
0.06
0.08
0.1
0.12
0.14
1998 1999 2000 2001 2002 2003 2004 2005 2006
Drug
MassMerchandiser
Supercenters
Club
Convenience
Source: Colby, S. “A Neoclassical Model of Household Inventory.” Data originally from ACNielsen HomeScan
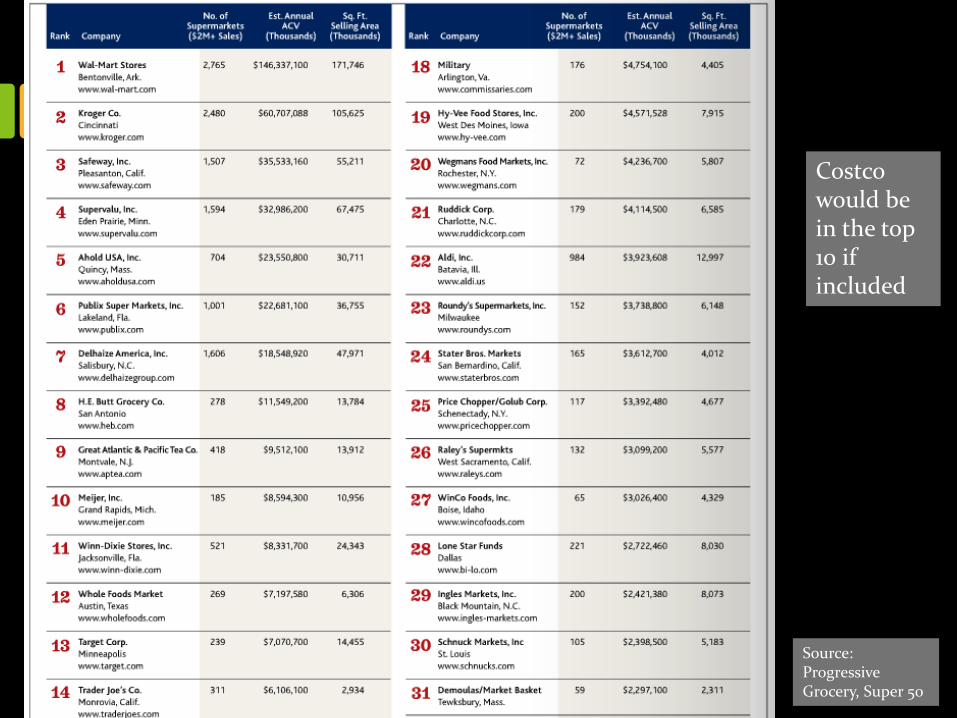
Costco would be in the top 10 if included
Source: Progressive Grocery, Super 50

Why Supercenters? • Provides a one-shop-stop for consumers
• Walmart is the biggest food retailer in the US
– Provides Walmart with a tremendous amount of monopsonistic market power
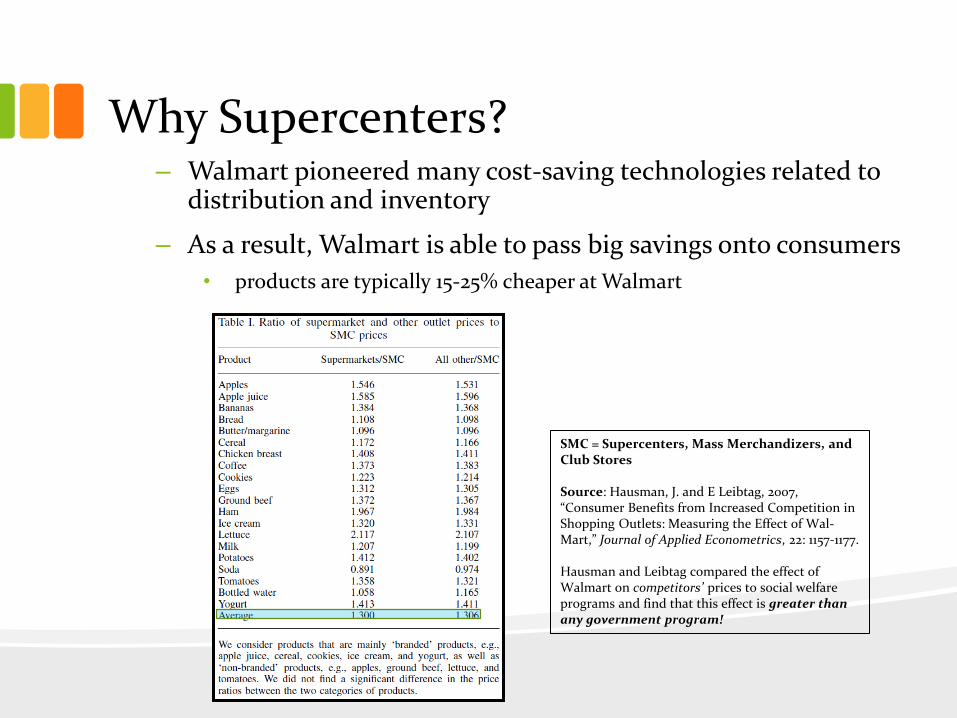
Why Supercenters? – Walmart pioneered many cost-saving technologies related to
distribution and inventory
– As a result, Walmart is able to pass big savings onto consumers
• products are typically 15-25% cheaper at Walmart
SMC = Supercenters, Mass Merchandizers, and Club Stores Source: Hausman, J. and E Leibtag, 2007, “Consumer Benefits from Increased Competition in Shopping Outlets: Measuring the Effect of Wal-Mart,” Journal of Applied Econometrics, 22: 1157-1177. Hausman and Leibtag compared the effect of Walmart on competitors’ prices to social welfare programs and find that this effect is greater than any government program!

Why Club Stores?
• Lower operating costs allow for lower retail prices – Costco saves money by combining warehouse functions with
retail outlet
– Transfers inventory to households • Gives quantity discounts
– Does not spend money on ambiance
– Costco has a limited itself to a 15% markup
• High quality – Many of Costco’s products are top ranked by Consumer
Reports
– This includes their private label, Kirkland
– Costco carries only about 5,000 products but makes up for it by searching out high quality for the customer

Food Away From Home

Food-At-Home (FAH) vs. Food-Away-From-Home (FAFH)
• Drivers
– Increased disposable income
• service is a luxury “good”
– Maturity of the food service industry • restaurants are ubiquitous
– Increased transportation tolerance
– Suburbanization
– Increased value of time
• higher wages
• greater parental involvement
• longer commutes
• greater entertainment opportunities
Source: Colby, S., 2012, “A Neoclassical Model of Household Food Inventory.”

Chain Restaurants Industry Stats:
• # of businesses = 756
• Revenue = $87 B
• Profit = $5.7 B (6.6% of revenue)
• Annual Growth 2008-2013 = 1.5%
• Annual Growth 2013-2018 = 2.5%
Characteristics
• Highly standardized
– same recipes, prices, atmospherics
– scale economies allow for extensive research that results in chain-wide policies
• ex: side substitutions, plate arrangements, portion sizes
• Typically medium price and medium quality
• Some do not require flair
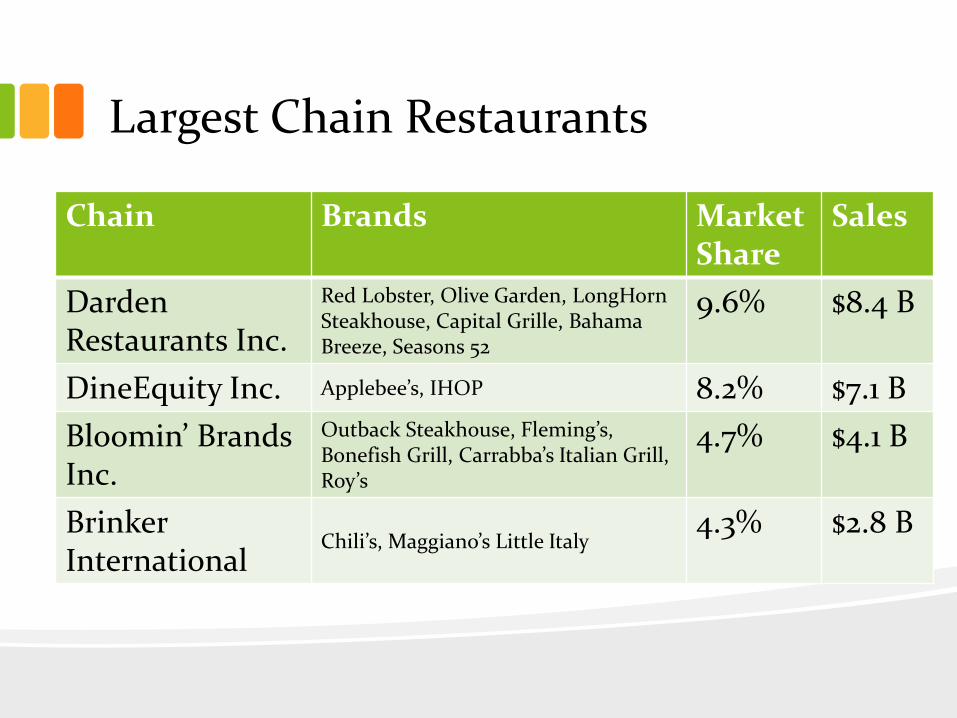
Largest Chain Restaurants
Chain Brands Market Share
Sales
Darden Restaurants Inc.
Red Lobster, Olive Garden, LongHorn Steakhouse, Capital Grille, Bahama Breeze, Seasons 52
9.6% $8.4 B
DineEquity Inc. Applebee’s, IHOP 8.2% $7.1 B
Bloomin’ Brands Inc.
Outback Steakhouse, Fleming’s, Bonefish Grill, Carrabba’s Italian Grill, Roy’s
4.7% $4.1 B
Brinker International
Chili’s, Maggiano’s Little Italy 4.3% $2.8 B

Fast Food Restaurants Industry Stats
• # of businesses = 150,000
• Revenue $191 B
• $6.9 B (3.6% if revenue)
• Annual Growth 2008-2013 = 1.0%
• Annual Growth 2013-2018 = 1.9%
Characteristics
• High volume/low price
• Transitioning to healthier/higher quality options
• Convenience/low involvement option
• Economies of scale from franchising
• Medium level of concentration
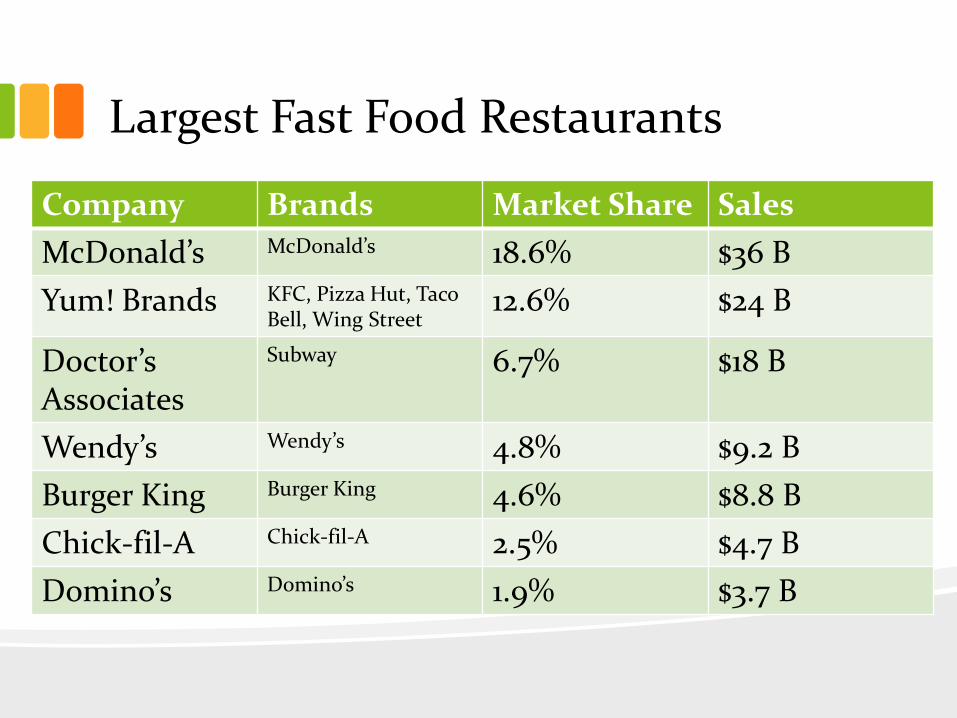
Largest Fast Food Restaurants
Company Brands Market Share Sales
McDonald’s McDonald’s 18.6% $36 B
Yum! Brands KFC, Pizza Hut, Taco Bell, Wing Street
12.6% $24 B
Doctor’s Associates
Subway 6.7% $18 B
Wendy’s Wendy’s 4.8% $9.2 B
Burger King Burger King 4.6% $8.8 B
Chick-fil-A Chick-fil-A 2.5% $4.7 B
Domino’s Domino’s 1.9% $3.7 B
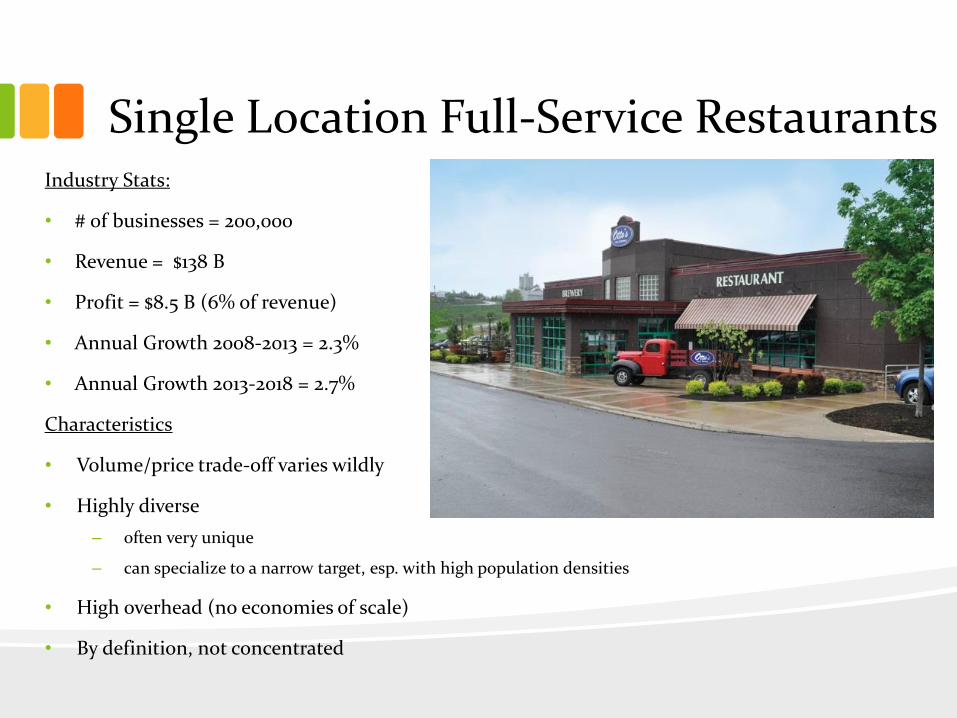
Single Location Full-Service Restaurants Industry Stats:
• # of businesses = 200,000
• Revenue = $138 B
• Profit = $8.5 B (6% of revenue)
• Annual Growth 2008-2013 = 2.3%
• Annual Growth 2013-2018 = 2.7%
Characteristics
• Volume/price trade-off varies wildly
• Highly diverse
– often very unique
– can specialize to a narrow target, esp. with high population densities
• High overhead (no economies of scale)
• By definition, not concentrated

Food Service Contractors • Provide food services at institutional, governmental, commercial or industrial locations.
• Ex: airports, food courts, university cafeterias, prisons, recreation and sports venues…
Industry Stats
• # of businesses = 2,600
• Revenue = $40 B
• Profit = $2.2 B (5.5% of revenue)
• Annual Growth 2008-2013 = 1.6%
• Annual Growth 2013-2018 = 2.6%
Characteristics
• Very concentrated
• Highly customized to needs of institution
• Quality highly variable to suit situation
– Ex: super high end for corporate events, to low end food court fare

Largest Food Service Contractors
Company Brands Market Share
Revenue
Compass Group
Bon Appétit Management Company, Eurest Dining Services, FLIK International, Food Works , Restaurant Associates, Chartwells, Best Vendors, Morrison Management Specialists, Crothall Healthcare, Inc., Levy Restaurants
27.1% $10.9 B
Aramark Corp Aramark Innovative Dining Solutions 21.5% $8.7 B
Sodexo Sodexho Alliance 20.9% $8.4 B
Delaware North Companies
5.9% $2.4 B

Logistic Mix
The Logistics Mix
(Mostly from a food retailer’s point of view)
1. Storage Facilities
2. Inventory
3. Transportation
4. Utilization and Packaging
5. Communications

1. Storage Facilities • Warehouses, distribution centers or stock rooms.
• Firms (especially retailers) manage these facilities to keep stock in anticipation of, or to react to, demand for products
• Some centers are run “stock-less” and act as sorting hubs (just-in-time logistics)
– reduces warehousing costs but requires sophisticated inventory management
• Automated warehouse/distribution center technology can cut distribution costs and improve customer service.
• Storage warehouse – holds goods for moderate to long periods in an attempt to balance supply and demand for producers and purchasers.
• Distribution centers – assembles and redistributes goods, keeping them moving as much as possible (retailers)
• Warehouse/Distribution Center locations are influenced by warehouse and materials handling costs and delivery costs from warehouses to customers.
– Hub-and-spoke distribution center system was pioneered by Walmart and helped lead to national domination
Hub-and-Spoke Network

2. Inventory • Depending on the characteristics of your products, you may want to keep large or limited stocks.
– The question is not whether to carry inventories or not, but how much to stock (of both products to sell and materials) and the location of this stock to meet demand changes.
• Companies must balance demand with costs of carrying excess inventory.
– holding costs – cost per unit per day of holding inventory
– stock-out costs – cost of losing business because you do not have a wanted product
• includes loss of goodwill and loss of repeat purchases
– fixed order cost – the cost of making an order that is independent of the quantity ordered
• ex: cost of a truck being sent to a facility
• Large inventories may be very expensive to maintain especially for perishable goods
– see FDA Food Codes
• Inventory Control Systems are complex software that is used to optimally make orders
• Firms use just-in-time delivery systems, RFID technology or vendor-managed inventory to help manage costs.
• Radio Frequency Identification RFID - Technology that uses a tiny chip with identification information that can be read by a scanner using radio waves from a distance.
– Walmart found RFID reduced stock-out by 30 percent for products selling between 0.1 and 15 units/day!
RFID chip

FDA Food Codes • The FDA Food Code identify the temperature danger
zone as 41 °F – 135 °F.
• Food outlets – cold foods: must be kept at 41 °F or below
– hot foods must be kept at 135 °F or above (at time of sale)
– It is important to limit the amount of time that foods served cold or hot are in this temperature range. • avoid the Goldilock zone for bacterial growth
• Maintain temperatures at each operational step in the flow of food from receiving to storing.
• Receiving – Receive refrigerated foods at 41 °F or below; frozen foods at 32 °F or below.
• Storing – Store refrigerated foods at 41 °F or below and store frozen foods at 0 °F or below.
See “Food Safety Fact Sheet” handout

FDA Food Code - continued • Preparing – Limit the time that food is in the temperature danger zone during
preparation. Batch cooking is the best way to limit time.
• Cooking – Cook food to the appropriate temperature for that item.
• Holding – Hold cold foods at 41 °F or below and hot foods at 135 °F or above.
• Serving – Keep cold food below 41 °F and hot food above 135 °F.
• Cooling – Cool foods as quickly as possible. Food must be cooled from 135 °F to 70 °F within 2 hours and from 70 °F to 41 °F within an additional 4 hours. If food is not cooled from 135 °F–70 °F within 2 hours, the food must be reheated to 165 °F for 15 seconds and the cooling process started over.
• Reheating – Reheat all leftover foods to 165 °F for 15 seconds within 2 hours.
• Transporting – Transport cold foods at 41 °F or below and hot foods at 135 °F or above.
• All this can be very logistically very difficult and costly
– typically more cost effective to utilize professionals
See “Food Safety Fact Sheet” handout
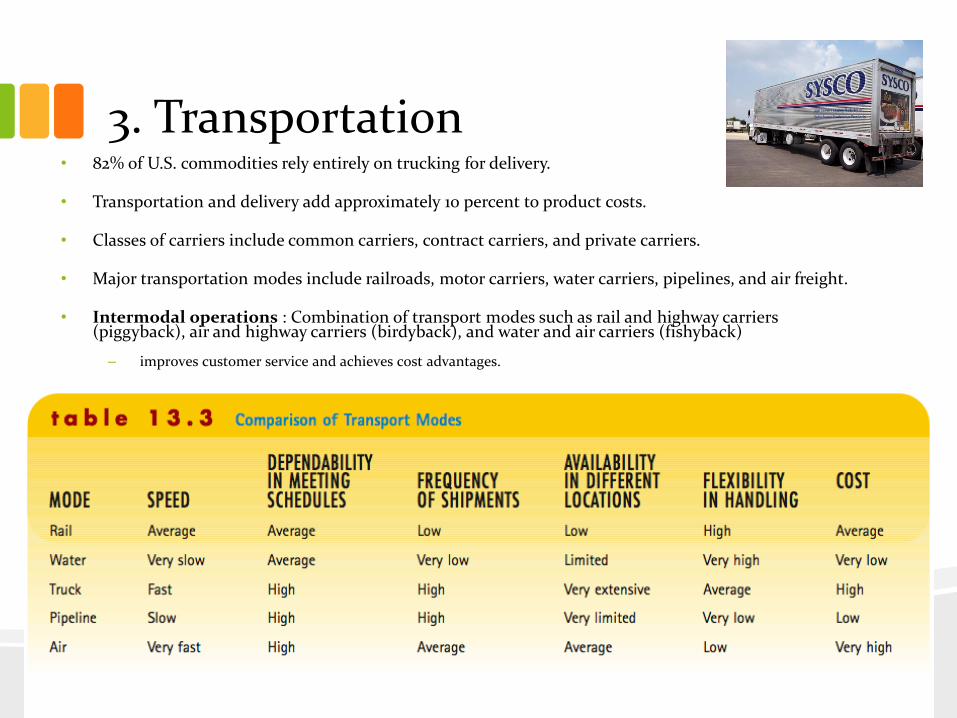
3. Transportation • 82% of U.S. commodities rely entirely on trucking for delivery.
• Transportation and delivery add approximately 10 percent to product costs.
• Classes of carriers include common carriers, contract carriers, and private carriers.
• Major transportation modes include railroads, motor carriers, water carriers, pipelines, and air freight.
• Intermodal operations : Combination of transport modes such as rail and highway carriers (piggyback), air and highway carriers (birdyback), and water and air carriers (fishyback)
– improves customer service and achieves cost advantages.

4. Utilization and Packaging 5. Communications
4. Utilization and Packaging: consumers buy products in small quantities. Packaging and “look” may influence their decisions.
– Packaging must be such that products are easy to handle and yet appealing to consumers.
– Secondary and transit packaging is costly
– Unitization and standardization should ease handling of products.
– Ex: Square milk jugs are used by Costco allowing delivery trucks to hold 9% more milk by eliminating the need for metal racks.
5. Communications: information about demand, supply, volumes, stock, price and movements is needed for goods to be delivered to consumers when they want them.
– Data at appropriate points of the supply chain is used to understand demand and to develop an efficient logistic system.