Structure of duekoué and scio protected forests under...
15
Global Advanced Research Journal of Plant Scienc Available online http://www.garj.org/garjps/index.ht Copyright © 2015 Global Advanced Research Jour Full Length Research Paper Structure of duekou anthropogenic activ François N’guessan Kouamé 1* , E Ed 1 Laboratoire de 2 So 3 Laboratoire de This manuscript analyses the effects DBH, density and basal area in two p have been under timber harvesting si plantations of indigenous timber speci Additionally, they host many plantatio most important. To understand how th and lianas with DBH ≥10 cm were anal 20 m x 50 m size and a total of 10 per v vegetation types were found in the nat values of these parameters. Yet densit plantations was influenced by the site and basal area were influenced only by Keywords: Forest protection, cash crops INTRODUCTION In the Upper Guinea sub-region (White, 197 d’Ivoire has the second largest West Africa forest area after Liberia (Poorter et al., 2004 and is known to be among the countries t highest tropical deforestation rate (Sayer Chatelain et al., 2004; FAO, 2011) due to hum *Corresponding Author‘s Email: fnkouame3 Tel: (+225) 07009566; 03007139; 44263046. ce (GARJPS) Vol. 1(1) pp. 001-015, February, 2015 tm rnals ué and scio protected for vities in southwestern cô Emmanuel Yapi Amonkou 2 , Maxime N’tak douard Kouakou N’guessan 3 e Botanique, Université Félix Houphouët-Boigny ociété de Développement des forêts e Botanique, Université Félix Houphouët-Boigny Accepted 27 January, 2015 s of anthropogenic disturbance on trees, shrub protected rain forests in Southwestern Côte d’Iv ince their protection in 1929. The Forestry Serv ies and Teak since 1996 to increase their produc ons of cash crop among which Coffee, Cocoa a hese plantations affect the local vegetation struc lyzed through the mean DBH, density and basal vegetation type. Highest mean DBH and basal are tural forests and the undergrowth cleared forest ty showed both lowest and highest values in pla e location of the plantation and the nature of cro y the nature of crop. s, agroforestry, vegetation structure, South-West Côt 79, 1983) Côte an humid rain 4; FAO, 2011) that have the et al., 1992; man activities [email protected]; despite a century policy of forest main categories of protected are are the national parks banned except management and rese (protected) forests whose purp sustainable logging (Kouamé, 1 delimitation of these protected their static conservation (de Kon After the Ivorian freedom in 19 been created together with a na rests under ôte d’ivoire kpé Kama Boraud 3 , bs and lianas mean voire. These forests vice had developed ctivities for timbers. and Rubber are the cture, trees, shrubs l area. Plots were of ea in both plots and ts which had similar antations. Density in op while mean DBH te d’Ivoire t protection. There are two eas in Côte d’Ivoire which d of any human activities earch, and the classified pose is management for 1998). The definition and forests began in 1924 by ning, 1983; Ahimin, 2006). 960, their legal status has ational Forest Research
Transcript of Structure of duekoué and scio protected forests under...
Global Advanced Research Journal of Plant ScienceAvailable online http://www.garj.org/garjps/index.htm Copyright © 2015 Global Advanced Research Journals
Full Length Research Paper
Structure of duekoué and scio protected forests under anthropogenic activities in southwestern côte d’ivoire
François N’guessan Kouamé1*, Emmanuel Yapi AmonkouEdouard Kouakou N’guessan
1Laboratoire de Botanique, Univer
2Société de Développement des forêts3Laboratoire de Botanique, Université Félix Houphouët
This manuscript analyses the effects of anthropogenic disturbance on trees, shrubs and lianas mean DBH, density and basal area in two protected rain forests in Southwestern Côte d’Ivoire. These forests have been under timber harvesting since their protection in 1929. The Forestplantations of indigenous timber species and Teak since 1996 to increase their productivities for timbers. Additionally, they host many plantations of cash crop most important. To understand how these plantations affect the local vegetation structure, trees, shrubs and lianas with DBH ≥10 cm were analyzed through the mean DBH, density and basal area. Plots were of 20 m x 50 m size and a total of 10 per vegetation type. Highest mean DBH anvegetation types were found in the natural forests and the undergrowth cleared forests which had similar values of these parameters. Yet density showed both lowest and highest values in plantations. Density in plantations was influenced by the site location of the plantation and the nature of crop while mean DBH and basal area were influenced only by the nature of crop. Keywords: Forest protection, cash crops, agroforestry, vegetation structure, South
INTRODUCTION In the Upper Guinea sub-region (White, 1979, 1983) Côte d’Ivoire has the second largest West African humid rain forest area after Liberia (Poorter et al., 2004; FAO, 2011) and is known to be among the countries that have the highest tropical deforestation rate (Sayer Chatelain et al., 2004; FAO, 2011) due to human *Corresponding Author‘s Email: [email protected];Tel: (+225) 07009566; 03007139; 44263046.
Global Advanced Research Journal of Plant Science (GARJPS) Vol. 1(1) pp. 001-015, February, 2015 /index.htm
Global Advanced Research Journals
tructure of duekoué and scio protected forests under anthropogenic activities in southwestern côte d’ivoire
, Emmanuel Yapi Amonkou2, Maxime N’takpé Kama BoraudEdouard Kouakou N’guessan3
aboratoire de Botanique, Université Félix Houphouët-Boigny Société de Développement des forêts
aboratoire de Botanique, Université Félix Houphouët-Boigny
Accepted 27 January, 2015
es the effects of anthropogenic disturbance on trees, shrubs and lianas mean DBH, density and basal area in two protected rain forests in Southwestern Côte d’Ivoire. These forests have been under timber harvesting since their protection in 1929. The Forestry Service had developed plantations of indigenous timber species and Teak since 1996 to increase their productivities for timbers. Additionally, they host many plantations of cash crop among which Coffee, Cocoa and Rubber are the
tand how these plantations affect the local vegetation structure, trees, shrubs 10 cm were analyzed through the mean DBH, density and basal area. Plots were of
20 m x 50 m size and a total of 10 per vegetation type. Highest mean DBH and basal area in both plots and vegetation types were found in the natural forests and the undergrowth cleared forests which had similar values of these parameters. Yet density showed both lowest and highest values in plantations. Density in
influenced by the site location of the plantation and the nature of crop while mean DBH and basal area were influenced only by the nature of crop.
Forest protection, cash crops, agroforestry, vegetation structure, South-West Côte d’Ivoire
region (White, 1979, 1983) Côte d’Ivoire has the second largest West African humid rain
., 2004; FAO, 2011) and is known to be among the countries that have the
al deforestation rate (Sayer et al., 1992; human activities
despite a century policy of forestmain categories of protected areas in Côte d’Ivoire which are the national parks banned of any human activities except management and research, and the classified (protected) forests whose purpose is management for sustainable logging (Kouamé, 1998). The definition and delimitation of these protected forests began in 1924 by their static conservation (de Koning, 1983; Ahimin, 2006). After the Ivorian freedom in 1960, their legal status has been created together with a national
tructure of duekoué and scio protected forests under anthropogenic activities in southwestern côte d’ivoire
, Maxime N’takpé Kama Boraud3,
es the effects of anthropogenic disturbance on trees, shrubs and lianas mean DBH, density and basal area in two protected rain forests in Southwestern Côte d’Ivoire. These forests
ry Service had developed plantations of indigenous timber species and Teak since 1996 to increase their productivities for timbers.
among which Coffee, Cocoa and Rubber are the tand how these plantations affect the local vegetation structure, trees, shrubs
10 cm were analyzed through the mean DBH, density and basal area. Plots were of d basal area in both plots and
vegetation types were found in the natural forests and the undergrowth cleared forests which had similar values of these parameters. Yet density showed both lowest and highest values in plantations. Density in
influenced by the site location of the plantation and the nature of crop while mean DBH
West Côte d’Ivoire
despite a century policy of forest protection. There are two main categories of protected areas in Côte d’Ivoire which are the national parks banned of any human activities except management and research, and the classified (protected) forests whose purpose is management for
gging (Kouamé, 1998). The definition and delimitation of these protected forests began in 1924 by their static conservation (de Koning, 1983; Ahimin, 2006). After the Ivorian freedom in 1960, their legal status has
national Forest Research

002. Glo. Adv. Res. J. plant. Sci. Institute (IDEFOR) and a national Forest Service (SODEFOR). Forty years later, these proceedings couldn’t stop the fast degradation of Ivorian forests (Dao, 1999; Chatelain et al., 2004; Ahimin, 2006) that remain nowadays in some classified forests, national parks, biological reserves and in forest-fallow mosaics. Due to rarefaction of wastelands in the rain forest area, the farmers crossed the limits of protected forests within which they establish their crops and live. The politico-military crisis in Côte d’Ivoire since 2002 led to increasing the illegal occupation of its South-Western protected areas mainly the classified forests like Duekoué and Scio.
To understand the effects of the Forest Service’s management and the farmers’ activities on the structure trees, shrubs and lianas, eighty 20 m x 50 m plots were investigated in the classified forests of Duekoué and Scio. Woody plant individuals that had 10 cm DBH and above were sampled for their DBH in plots. The aim of this manuscript was to analyze woody plant structure in eight biotopes generated by human activities in two protected areas. Hypothesis As both Forest Service and farmers remove local vegetation during their activities in the study area, we hypothesized to find higher structural parameters in natural vegetation than in plantations. MATERIAL AND METHODS Research site and data collection Research was carried out in the classified forests of Duekoué (6° 30’- 6° 45’ N, 7° 00’- 7° 15’ W) and Scio (6° 30’-7° 00’ N, 7° 30’- 8° 05’W) South-West of Côte d’Ivoire (Figure 1). Climate in both areas is sub-equatorial with one long wet season from February to November and one short dry season from November to January. Annual rainfall varies from 1600-1700 mm in Duekoué forest to 1700-1800 mm in Scio forest. The average monthly temperature is 25 ºC while monthly and annual potential evapotranspiration of both areas show respectively 123.5 mm and 148.2 mm (Eldin, 1971). The soils belong to the remould ferrallitic group (Perraud and De La Souchère, 1970). The natural vegetation of Duekoué forest consists of a moist semi-deciduous forest (Kouamé, 2010; Kouamé and Zoro, 2010) defined as a tropical rain forest type in which part of the higher trees shed their leaves during the 3-4 months dry season in a region of 1350-1600 mm annual rainfall (Trochain, 1957; ORSTOM and UNESCO, 1983) interrupted by savannas areas and inselbergs (Monnier, 1983). Original vegetation of Scio forest belongs to Ivorian South-Western evergreen forest type (Kouamé, 2010;
Kouamé and Zoro, 2010) that spreads in the wettest forest area.
Field data collection was carried out in eighty 1000 m² (20 m x 50 m) plots established per 10 in 4 biotopes for each forest (Table 1). Homogeneity, local area, repetition, presence of plant individuals with DBH≥10 cm and availability were the criteria of these biotopes selection. Thus, the biotopes plotted are the natural forest patches, the undergrowth cleared forest, the Coffee plantations, the Cocoa plantations, the Rubber plantations and the Teak Plantations (Table 1). Each plot was sub-divided into ten 100 m² sub-plots where all plants with diameter at 1.3 m (DBH) at least 10 cm were assessed for their DBH. Data analysis The mean DBH that is the average of all individual DBH assessed in a plot was calculated and analyzed per plot and per biotope following Bonou et al. (2009) and Houéto et al. (2013). It expresses the wideness of trees, shrubs and lianas in the milieu. Additionally, distribution of individuals inside DBH classes was analyzed to improve the explanation the mean DBH values in plots.
The density which is the individuals’ number in an area and the simple expression of the vegetation structure parameter (Fowler et al., 1999) was also calculated and compared per plot and vegetation type. The density is indicator of spacial occupation of an area by individuals.
The basal area that is the area covered by horizontal sections of plants at a level by individuals living in that area (CTFT, 1989) has several formulas among which one of the latest from Hédl et al. (2009) has been used in this paper. Basal area = 0.00007854 x DBH2 Such as data in plots showed normal distribution, their statistical analyses had been performed with parametric tests as recommended Fowler et al. (1999) and Glèlè Kakai et al. (2006). Plot vegetation structural parameters were compared using paired samples t test of Student and their prospective correlations were analyzed throughout Pearson correlation with SPSS 18.0 software. Basal area and density in plots were analyzed using factorial analysis with with Statistica 7.1 software to clarify the relationships between plots by means of their spatial distribution. Structural parameters of Coffee plantations and Cocoa plantations that have been assessed in both research sites (Table 1) were analyzed with an ANOVA using Statistica 7.1 software for checking prospective impacts of site and/or crop nature on plot vegetation structure. Bonferroni’s Post Hoc test with Statistica 7.1 software led to segregate impacts of site and crop nature as the ANOVA showed their effects on plot vegetation.

Kouamé et al. 003
Figure 1. Localization with MapInfo 7.8 software of research sites on the map of protected areas and main floristic features distribution in Ivorian rain forest zone according to Kouamé and Zoro Bi (2010)
Table 1. Structure parameters in biotopes Duekoué forest biotopes: PCAFD (Coffee plantations), PCAOD (Cocoa plantations), PHEVD (Rubber plantations), PTECD (Teak plantations). Scio forest biotopes: FNBAS (natural forest), FDEFS (undergrowth cleared forest), PCAFS (Coffee plantations), PCAOS (Cocoa plantations).
Parameters FNBAS FDEFS PCAFD PCAFS PCAOD PCAOS PHEVD PTECD
Mea
n D
BH
Minimum 17.19 17.88 11.60 11.03 12.35 13.13 12.34 12.95 Maximum 26.70 23.57 27.17 25.57 15.31 13.65 17.89 22.23 Total 212.32 204.80 168.57 155.35 138.55 134.95 153.80 175.23 Mean 21.23 20.48 16.86 15.54 13.85 13.49 15.38 17.52 Stand. Dev. 2.57 1.94 4.52 4.54 1.06 0.15 2.16 3.29
Den
sity
Minimum 50 43 6 7 61 85 25 45 Maximum 69 56 28 19 91 102 51 96 Total 580 489 138 117 743 916 398 613 Mean 58.00 48.90 13.80 11.70 74.30 91.60 39.80 61.30 Stand. Dev. 7.09 4.70 6.76 4.69 9.21 5.64 8.39 15.01
Bas
al a
rea
Minimum 2.05 1.72 0.11 0.08 0.79 1.24 0.35 0.75 Maximum 5.72 3.21 0.89 0.65 2.04 1.49 1.31 2.31 Total 33.31 22.76 4.24 2.95 14.28 13.45 8.04 15.90 Mean 3.33 2.28 0.42 0.30 1.43 1.34 0.80 1.59 Stand. Dev. 1.30 0.53 0.24 0.21 0.41 0.09 0.35 0.55
The total area of each biotope is a hectare (10 x 1000 m²). Thus for all parameters in table 1, total values correspond to hectare data while the others are research plot area (20m x 50 m) data.

004. Glo. Adv. Res. J. plant. Sci.
Figure 2. Variation of the vegetation structural parameters in plots Table 2. Comparison matrix of mean DBH in biotopes
FNBAS FDEFS PCAFD PCAFS PCAOD PCAOS PHEVD PTECD FNBAS 0.63 2.49 3.41 7.30 9.32 6.35 2.26 FDEFS ns 2.18 3.00 10.54 11.15 4.85 2.46 PCAFD * ns 1.40 2.03 2.38 1.09 0.34 PCAFS ** * ns 1.07 1.44 0.11 0.90 PCAOD *** *** ns ns 1.06 2.01 4.35 PCAOS *** *** * ns ns 2.82 3.88 PHEVD *** ** ns ns ns * 1.58 PTECD ns * ns ns ** ** ns
Student t test values are above while significances are below. ns : test non significant (P≥0.05); * : test significant (P<0.05); ** : test very significant (P<0.01); *** : test very highly significant (P<0.001). Degree of freedom of the test is 9.
RESULTS Mean DBH and basal area showed highest (Figure 2, Table 1) and similar (Tables 2, 3) values in the natural forest patches (FNBAS) and the undergrowth cleared forest (FDEFS) at Scio site. Among plantations, the Teak (PTECD) showed higher values of these parameters while the lowest values were found in Scio Cocoa plantations
(PCAOS) for the mean DBH and Scio Coffee plantations (PCAFS) for basal area (Figure 2, Table 1). But density showed highest values in the Cocoa plantations of both sites while its lowest values were found in Coffee plantations of both sites (Figure 2, Tables 1, 4). Density in Scio Cocoa plantations was almost twice higher than density in the natural forest patches and in the undergrowth cleared forest of the same forest area but
10
15
20
25
30
0 5 10
Mea
n D
BH
(cm
)
Plot number
Mean DBHFNBAS
FDEFS
PCAFD
PCAFS
PCAOD
PCAOS
PHEVD
PTECD 0
30
60
90
120
0 5 10
Den
sity
(in
d./1
000m
²)
Plot number
Density FNBAS
FDEFS
PCAFD
PCAFS
PCAOD
PCAOS
PHEVD
PTECD
0.0
1.5
3.0
4.5
6.0
0 5 10
Bas
al a
rea
(m²/
1000
m²)
Plot number
Basal areaFNBAS
FDEFS
PCAFD
PCAFS
PCAOD
PCAOS
PHEVD
PTECD

Kouamé et al. 005
Table 3. Comparison matrix of basal area in biotopes
FNBAS FDEFS PCAFD PCAFS PCAOD PCAOS PHEVD PTECD FNBAS 2.09 6.83 7.27 4.07 4.75 6.36 3.48 FDEFS ns 8.31 9.43 3.98 6.01 6.37 2.74 PCAFD *** *** 3.06 7.10 10.30 2.81 7.77 PCAFS *** *** * 7.58 14.04 4.05 7.56 PCAOD ** ** *** *** 0.65 3.51 1.29 PCAOS ** *** ** *** ns 4.92 1.36 PHEVD *** *** * ** * ** 3.17 PTECD ** * *** *** ns ns *
Student t test values are above while significances are below. ns : test non significant (P≥0.05); * : test significant (P<0.05); ** : test very significant (P<0.01); *** : test very highly significant (P<0.001). Degree of freedom of the test is 9.
Table 4. Comparison matrix of density in biotopes
FNBAS FDEFS PCAFD PCAFS PCAOD PCAOS PHEVD PTECD FNBAS 6.09 20.72 21.43 5.52 12.78 6.14 0.66 FDEFS *** 14.51 18.77 7.91 25.12 2.91 2.33 PCAFD *** *** 2.02 36.71 23.37 7.18 13.16 PCAFS *** *** ns 30.94 29.40 8.50 11.72 PCAOD *** *** *** *** 3.90 7.69 3.85 PCAOS *** *** *** *** ** 16.08 5.08 PHEVD *** * *** *** *** *** 3.71 PTECD ns * *** *** ** ** **
Student t test values are above while significances are below. ns : test non significant (P≥0.05); * : test significant (P<0.05); ** : test very significant (P<0.01); *** : test very highly significant (P<0.001). Degree of freedom of the test is 9.
belong to the [10-20 cm[ DBH class exclusively (Figure 3). Among plantations, only Coffee and Rubber expressed lower density in comparison with the natural forest (Tables 1, 3). Individuals in Rubber and Teak plantations belong to the [10-30 cm[ and the [10-40 cm[ DBH classes, respectively while in the other plantations they could reach the [80-90 cm[ DBH class (Figure 3). The natural forest patches expressed 90% of the BDH classes especially with some individuals of DBH ≥100 cm (Figure 3). Density in plots showed higher variability in Cocoa and Teak plantations when plot basal area expressed higher variability in both natural forest and Teak plantations (Figure 4).
A very highly significant and positive Pearson’s correlation was found between plot density and plot basal area in both Scio Cocoa plantations and Duekoué Rubber plantations (Figure 5a) but no correlation was expressed between these two parameters in the other biotopes studies in this paper. Except the Duekoué Coffee plantations and the Scio Cocoa plantations, there was a positive and significant Pearson’s correlation between plot
mean DBH and plot basal area in all other biotopes. This correlation was significant in the Scio Coffee plantations (Figure 5b), highly significant in the Scio natural forest patches, in the Scio undergrowth cleared forest, and in the Duekoué Cocoa and Teak plantations and very highly significant in the Duekoué Rubber plantations (Figure 5b). A positive and significant Pearson’s correlation was expressed between plot mean DBH and plot density in the Duekoué Rubber plantations (Figure 5c); in all other biotopes, this correlation wasn’t significant and almost zero in the natural forest, the undergrowth cleared forest and the Cocoa plantations of Scio site but slightly negative in the remnant plantations (Figure 5c).
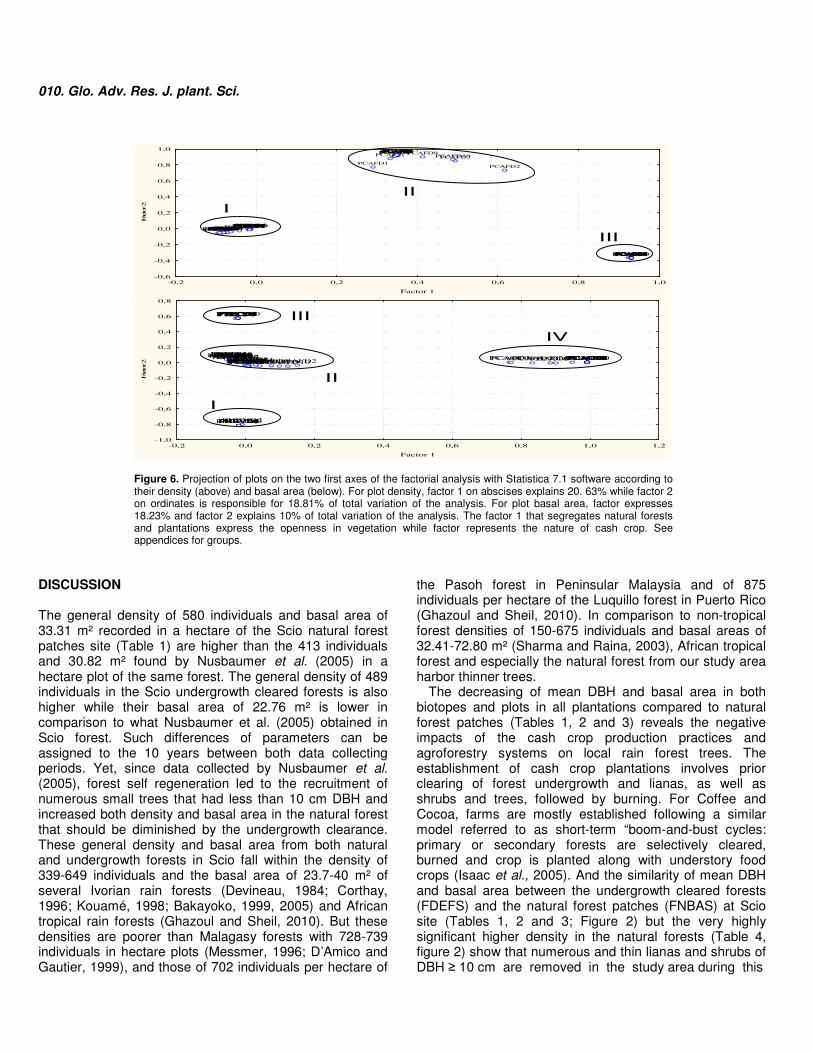
Distribution of trees in plantations was determined prior to the openness in vegetation and later by the nature of the target species (Figure 6). Thus, according to plot density plots were separated into three groups amongst which the biggest (group I Figure 6) gathered natural forest patches and undergrowth cleared forest from Scio site, and Teak plantations and Rubber plantations (Figure 6, Appendix 1) from Duekoué site. This group that was represented by

006. Glo. Adv. Res. J. plant. Sci.
Figure 3. DBH classes distribution in plots
Figure 4. Boxplots of plot density (above) and basal area (below) using factorial analysis with Statistica 7.1 software. Mean values are in small central squares, error types are in small framing rectangles and standard deviation types are in vertical lines.
0 200 400 600 800 1000
[10 - 20[
[30 - 40[
[50 - 60[
[70 - 80[
[90 - 100[
Stems (ind./ha)
DB
Hcl
asse
s (c
m)
FNBAS
0 200 400 600 800 1000
[10 - 20[
[30 - 40[
[50 - 60[
[70 - 80[
[90 - 100[
Stems (ind./ha)
DB
Hcl
asse
s (c
m)
FDEFS
0 200 400 600 800 1000
[10 - 20[
[30 - 40[
[50 - 60[
[70 - 80[
[90 - 100[
Stems (ind./ha)
DB
Hcl
asse
s (c
m)
PCAFD
0 200 400 600 800 1000
[10 - 20[
[30 - 40[
[50 - 60[
[70 - 80[
[90 - 100[
Effectif s des tiges (ind./ha)Cla
sses
de
DB
H (
cm)
PCAFS
0 200 400 600 800 1000
[10 - 20[
[30 - 40[
[50 - 60[
[70 - 80[
[90 - 100[
Stems (ind./ha)
DB
Hcl
asse
s (c
m)
PCAOD
0 200 400 600 800 1000
[10 - 20[
[30 - 40[
[50 - 60[
[70 - 80[
[90 - 100[
Effectif s des tiges (ind./ha) Cla
sses
de
DB
H (
cm)
PCAOS
0 200 400 600 800 1000
[10 - 20[
[30 - 40[
[50 - 60[
[70 - 80[
[90 - 100[
Stems (ind./ha)
DB
H c
lass
es (
cm)
PHEVD
0 200 400 600 800 1000
[10 - 20[
[30 - 40[
[50 - 60[
[70 - 80[
[90 - 100[
Stems (ind./ha)
DB
Hcl
asse
s (c
m)
PTECD
FNBAS1FNBAS7
FDEFS3FDEFS9
PCAFD5PCAFS1
PCAFS7PCAOD3
PCAOD9PCAOS5
PHEVD1PHEVD7
PTECD3PTECD9
-10
-8
-6
-4
-2
0
2
4
6
8
10
12
FNBAS1FNBAS7
FDEFS3FDEFS9
PCAFD5PCAFS1
PCAFS7PCAOD3
PCAOD9PCAOS5
PHEVD1PHEVD7
PTECD3PTECD9
-0,3
-0,2
-0,1
0,0
0,1
0,2
0,3
0,4

Kouamé et al. 007
Figure 5a. Pearson correlation values between plot basal area and plot density ns: test non significant (P≥0.05); ***: test very highly significant (P<0.001). Plots’ number (N) is 10 per biotope.
50% of plots appeared in low vegetation openness conditions. The two other groups were the Coffee plantations (group II Figure 6) from both sites in medium vegetation openness conditions and the Cocoa plantations (group III Figure 6) from both sites in higher vegetation openness conditions (Figure 6, Appendix 1). According to plot basal area, plots were separated into four groups of which three had similar coordinates on factor 1 expressing the vegetation openness (Figure 6, Appendix 2). Thus, the Rubber plantations were gathered into group I, the natural forest patches, and the undergrowth cleared forests and the Teak plantations belong to the same group II while the Coffee plantations of both sites constituted the group III in low vegetation openness conditions (Figure 6, Appendix 2). The fourth group was formed by Cocoa plantations of both sites.
A significant impact of the cash crop nature was found on mean DBH in Coffee and Cocoa plantations but no impact was found neither with the site of plantation location nor
with the combination with cash crop nature and site location (Table 5). No impact was found with Bonferroni’s Post Hoc test. Highly significant impacts of the site and very highly significant impacts of both the nature of the crop and the combination site and crop nature were found on the density in Coffee and Cocoa plantations (Table 5). Base on density, Bonferroni’s test showed a very highly significant difference between Duekoué Coffee plantations and Scio Cocoa plantations, and between Cocoa plantations of both sites while Coffee plantations from both sites were similar (Table 6). A very highly significant impact of crop nature was found on basal area in Coffee and Cocoa plantations but no impact was found neither with the site of plantation location nor with the combination with cash crop nature and site location (Table 5). Base on basal area, Bonferroni’s test showed no difference between Cocoa plantations of both sites, and between Coffee and Cocoa plantations from Scio forest area; but a very highly difference was between other pairs of biotopes (Table 6).
nsR² = 0.215
0
2
4
6
8
50 55 60 65 70
Basa
l area
(m²/1
000m
²)
Density (ind./1000m²)
FNBAS
nsR² = 0.266
0
1
2
3
4
42 45.5 49 52.5 56Basa
l area
(m²/1
000m
²)
Density (ind./1000m²)
FDEFS
nsR² = 0.356
0
0.2
0.4
0.6
0.8
1
6 12 18 24 30
Basa
l area
(m²/1
000m
²)
Density (ind./1000m²)
PCAFD
nsR² = 0.321
0
0.2
0.4
0.6
0.8
7 10.5 14 17.5 21Basa
l area
(m²/1
000m
²)
Densiy (ind./1000m²)
PCAFS
nsR² = 0.029
0
0.5
1
1.5
2
2.5
60 72.5 85 97.5Basa
l area
(m²/1
000m
²)
Density (ind./1000m²)
PCAOD
***R² = 0.872
1
2
2
85 90 95 100 105
Basa
l area
(m²/1
0000
m²)
Density (ind./1000m²)
PCAOS
***R² = 0.828
0
0.5
1
1.5
25 35 45 55
Basa
l area
(m²/1
000m
²)
Density (ind./1000m²)
PHEVD
nsR² = 0.115
0
0.5
1
1.5
2
2.5
45 60 75 90
Basa
l area
(m²/1
000m
²)
Density (ind./1000m²)
PTECD

008. Glo. Adv. Res. J. plant. Sci.
Figure 5b. Pearson correlation values between plot basal area and plot mean DBH ns: test non significant (P≥0,05); *: test significant (P<0.05); **: test highly significant (P<0.01); ***: test very highly significant (P<0.001). Plots’ number (N) is 10 per biotope.
Table 5. Effects of the site and the cash crop nature on structure parameters in Coffee and Cocoa plantations from ANOVA with Statistica 7.1 software
Effect SC df MF F P
Mea
n D
BH
Ord origin 8922.52 1 8922.52 846.00 *** Site 7.07 1 7.07 0.67 ns Crop 63.58 1 63.58 6.03 * Site*Crop 2.31 1 2.31 0.22 ns Error 379.68 36 10.55
Den
sity
Ord origin 91584.90 1 91584.90 1985.94 *** Site 577.60 1 577.60 12.53 ** Crop 49280.40 1 49280.40 1068.60 *** Site*Crop 940.90 1 940.90 20.40 *** Error 1660.20 36 46.12
Bas
al a
rea
Ord origin 30.50 1 30.50 432.15 *** Site 0.11 1 0.11 1.605 ns Crop 10.54 1 10.54 149.35 *** Site*Crop 0.01 1 0.01 0.07 ns Error 2.54 36 0.07
ns: test non significant (P≥0.05); * : test significant (P<0.05); ** : test highly significant (P<0.01); *** : test very highly significant (P<0.001).
**R² = 0.647
0
2
4
6
8
17 20 22 25 27
Basa
l area
(m²/1
000m
²)
Mean DBH (cm)
FNBAS
**R² = 0.768
0
1
2
3
4
17 19 21 23
Basa
l area
(m²/1
000m
²)
Mean DBH (cm)
FDEFS
nsR² = 0.338
0
0.2
0.4
0.6
0.8
1
12 16 20 24 28
Basa
l area
(m²/1
000m
²)
Mean DBH (cm)
PCAFD *R² = 0.401
0
0.2
0.4
0.6
0.8
11 16 21 26Basa
l area
(m²/1
000m
²)
Mean DBH (cm)
PCAFS
**R² = 0.681
0
0.5
1
1.5
2
2.5
12.4 13.4 14.4 15.4Basa
l area
(m²/1
000m
²)
Mean DBH (cm)
PCAOD
nsR² = 0.186
1.2
1.3
1.4
1.5
13.1 13.3 13.5 13.7Basa
l area
(m²/1
000m
²)
Mean DBH (cm)
PCAOS
***R² = 0.893
0
0.4
0.8
1.2
1.6
12 14 16 18
Basa
l area
(m²/1
000m
²)
Mean DBH (cm)
PHEVD
**R² = 0.653
0
0.5
1
1.5
2
2.5
12 15 18 21 24
Basa
l area
(m²/1
000m
²)
Mean DBH (cm)
PTECD

Kouamé et al. 009
Figure 5c. Pearson correlation values between plot mean DBH and plot density ns: test non significant (P≥0.05); *: test significant (P<0.05). Plots’ number (N) is 10 per biotope
Table 6. Bonferroni’s Post Hoc test of effects of the site and the cash crop nature on structure parameters in Coffee and Cocoa plantations with Statistica 7.1 software
Den
sity
Duekoué Cocoa Duekoué Coffee Scio Cocoa Scio Coffee Duekoué Cocoa *** *** *** Duekoué Coffee *** *** ns Scio Cocoa *** *** *** Scio Coffee *** ns ***
Bas
al a
rea
Duekoué Cocoa Duekoué Coffee Scio Cocoa Scio Coffee Duekoué Cocoa *** ns *** Duekoué Coffee *** *** ns Scio Cocoa ns *** *** Scio Coffee *** ns ***
This test is no significant for the mean DBH. df = 36. Error: MC Inter is 10.547 for mean DBH, 46.117 for density and 0.071 for basal area. ns: test non significant (P≥0.05); *** : test very highly significant (P<0.001).
ggggggggggggggg
nsR² = 0.008
0
7
14
21
28
50 55 60 65 70
Mean
DBH
(cm)
Density (ind./1000m²)
FNBAS
nsR² = 0.006
0
5
10
15
20
25
42 45.5 49 52.5 56
Mean
DBH
(cm)
Density (ind./1000m²)
FDEFS
nsR² = 0.064
0
7
14
21
28
5 10 15 20 25 30
Mean
DBH
(cm)
Density (ind./1000m²)
PCAFD
nsR² = 0.016
0
6
12
18
24
30
7 10 13 16 19
Mean
DBH
(cm)
Density (ind./1000m²)
PCAFS
nsR² = 0.032
0
5
9
14
18
60 67 74 81 88 95
Mean
DBH
(cm)
Density (ind./1000m²)
PCAOD
nsR² = 0.006
0
4
7
11
14
85 90 95 100 105
Mean
DBH
(cm)
Density (ind./1000m²)
PCAOS
*R² = 0.550
0
5
9
14
18
25 31 37 43 49 55
Mean
DBH
(cm)
Density (ind./1000m²)
PHEVD
nsR² = 0.072
0
5
10
15
20
25
40 60 80 100
Mean
DBH
(cm)
Density (ind./1000m²)
PTECD
010. Glo. Adv. Res. J. plant. Sci.
Figure 6. Projection of plots on the two first axes of the factorial analysis with Statistica 7.1 software according to their density (above) and basal area (below). For plot density, factor 1 on abscises explains 20. 63% while factor 2 on ordinates is responsible for 18.81% of total variation of the analysis. For plot basal area, factor expresses 18.23% and factor 2 explains 10% of total variation of the analysis. The factor 1 that segregates natural forests and plantations express the openness in vegetation while factor represents the nature of cash crop. See appendices for groups.
DISCUSSION The general density of 580 individuals and basal area of 33.31 m² recorded in a hectare of the Scio natural forest patches site (Table 1) are higher than the 413 individuals and 30.82 m² found by Nusbaumer et al. (2005) in a hectare plot of the same forest. The general density of 489 individuals in the Scio undergrowth cleared forests is also higher while their basal area of 22.76 m² is lower in comparison to what Nusbaumer et al. (2005) obtained in Scio forest. Such differences of parameters can be assigned to the 10 years between both data collecting periods. Yet, since data collected by Nusbaumer et al. (2005), forest self regeneration led to the recruitment of numerous small trees that had less than 10 cm DBH and increased both density and basal area in the natural forest that should be diminished by the undergrowth clearance. These general density and basal area from both natural and undergrowth forests in Scio fall within the density of 339-649 individuals and the basal area of 23.7-40 m² of several Ivorian rain forests (Devineau, 1984; Corthay, 1996; Kouamé, 1998; Bakayoko, 1999, 2005) and African tropical rain forests (Ghazoul and Sheil, 2010). But these densities are poorer than Malagasy forests with 728-739 individuals in hectare plots (Messmer, 1996; D’Amico and Gautier, 1999), and those of 702 individuals per hectare of
the Pasoh forest in Peninsular Malaysia and of 875 individuals per hectare of the Luquillo forest in Puerto Rico (Ghazoul and Sheil, 2010). In comparison to non-tropical forest densities of 150-675 individuals and basal areas of 32.41-72.80 m² (Sharma and Raina, 2003), African tropical forest and especially the natural forest from our study area harbor thinner trees.
The decreasing of mean DBH and basal area in both biotopes and plots in all plantations compared to natural forest patches (Tables 1, 2 and 3) reveals the negative impacts of the cash crop production practices and agroforestry systems on local rain forest trees. The establishment of cash crop plantations involves prior clearing of forest undergrowth and lianas, as well as shrubs and trees, followed by burning. For Coffee and Cocoa, farms are mostly established following a similar model referred to as short-term “boom-and-bust cycles: primary or secondary forests are selectively cleared, burned and crop is planted along with understory food crops (Isaac et al., 2005). And the similarity of mean DBH and basal area between the undergrowth cleared forests (FDEFS) and the natural forest patches (FNBAS) at Scio site (Tables 1, 2 and 3; Figure 2) but the very highly significant higher density in the natural forests (Table 4, figure 2) show that numerous and thin lianas and shrubs of DBH ≥ 10 cm are removed in the study area during this
FDEFS1FDEFS2FDEFS3FDEFS4FDEFS5FDEFS6FDEFS7FDEFS8FDEFS9FDEFS10FNBAS1FNBAS2FNBAS3FNBAS4FNBAS5FNBAS6FNBAS7FNBAS8FNBAS9FNBAS10
PCAFD1PCAFD2
PCAFD3PCAFD4PCAFD5PCAFD6PCAFD7PCAFD8PCAFD9
PCAFD10PCAFS1PCAFS2PCAFS3PCAFS4PCAFS5PCAFS6PCAFS7PCAFS8PCAFS9PCAFS10
PCAOD1PCAOD2PCAOD3PCAOD4PCAOD5PCAOD6PCAOD7PCAOD8PCAOD9PCAOD10PCAOS1PCAOS2PCAOS3PCAOS4PCAOS5PCAOS6PCAOS7PCAOS8PCAOS9PCAOS10
PHEVD1PHEVD2PHEVD3PHEVD4PHEVD5PHEVD6PHEVD7PHEVD8PHEVD9PHEVD10PTECD1PTECD2PTECD3PTECD4PTECD5PTECD6PTECD7PTECD8PTECD9PTECD10
-0,2 0,0 0,2 0,4 0,6 0,8 1,0
Factor 1
-0,6
-0,4
-0,2
0,0
0,2
0,4
0,6
0,8
1,0Factor 2
FDEFS1FDEFS2FDEFS3
FDEFS4FDEFS5FDEFS6FDEFS7FDEFS8FDEFS9FDEFS10FNBAS1FNBAS2FNBAS3FNBAS4FNBAS5FNBAS6FNBAS7FNBAS8FNBAS9FNBAS10PCAFD1 PCAFD2PCAFD3PCAFD4PCAFD5PCAFD6PCAFD7PCAFD8PCAFD9PCAFD10PCAFS1PCAFS2PCAFS3PCAFS4PCAFS5PCAFS6PCAFS7PCAFS8PCAFS9PCAFS10
PCAOD1PCAOD2PCAOD3 PCAOD4PCAOD5PCAOD6PCAOD7PCAOD8PCAOD9PCAOD10PCAOS1PCAOS2PCAOS3PCAOS4PCAOS5PCAOS6PCAOS7PCAOS8PCAOS9PCAOS10
PHEVD1PHEVD2PHEVD3PHEVD4PHEVD5PHEVD6PHEVD7PHEVD8PHEVD9PHEVD10
PTECD1PTECD2PTECD3PTECD4PTECD5PTECD6PTECD7PTECD8PTECD9PTECD10
-0,2 0,0 0,2 0,4 0,6 0,8 1,0 1,2
Factor 1
-1,0
-0,8
-0,6
-0,4
-0,2
0,0
0,2
0,4
0,6
0,8
Factor 2
I II
III
I
II
III
IV

first step of plantations establishment. Later, when crops are established, tall trees are removed from plantations where mean DBH and basal area that are closely linked to high DBH values (Figure 5b) fall sharply. But our results relative to the distribution of individuals inside DBH classes (Figure 3) show that some big native trees survive in all plantations except the Rubber’s. Bisseleua et al. (2008) found an average of 62.25-135.85 cm mean DBH, 100-215 individuals and 10-45 m² of native trees in hectare plots of Cocoa plantations and confirmed the results of Zapfack et al. (2002) in Cameroon. Rolim and Chiarello (2004) obtained lower data in Brazil where Sambuichi and Haridasan (2007) found densities of 47-355 individuals and basal areas of 11.8-28.2 m² in hectare plots. According to Rice and Greenberg (2000), Cocoa production in West Africa follows both the Rustic system and the planted shade polyculture system but Steffan-Dewenter et al. (2007) advocated planting of Cocoa at low tree density and thinning for economical viability. Therefore higher density values in Cocoa plantations of both sites and Teak plantations (Table 1, Figure 2) are mainly due to Cocoa trees and Teak trees respectively. Density in Rubber and Coffee plantations should have also higher values in comparison to natural forest because farmers use similar density of crops during the establishment of their plantations. But Duekoué Rubber plantations are young and part of the crop trees still being thinner than 10 cm DBH; then they were not assessed yet during this study. And the Coffee tree is naturally thin and rarely reaches 10 cm DBH even in old plantations. Consequently in Coffee plantations, a part of Coffee trees that are the most abundant were not assessed too during this study due to their DBH< 10 cm and large DBH classes (Figure 3) belong to native trees. Méndez (2004) sheared these native trees in Coffee plantations into firewood group (77-96%), fruit group (40-100%), timber group (20-70%) and organic matter group (0-10%) in Western El Savador. In our study area, some exotic fruit trees like Mango (Mangifera indica L.) and Avocado (Persea americana Mill.) are introduced in Coffee plantations in addition to native non-Coffee trees. Thus, the Coffee plantations in our study area corresponds to the traditional polyculture system of Moguel and Toledo (1999) who distinguished 5 main systems of Coffee production in Mexico according to management level, and vegetational and structural complexity. The zero-shade Cocoa cultivation system (Rice and Greenberg, 2000) that corresponds to the unshaded monoculture Coffee cultivation system (Moguel and Toledo, 1999) is similar to the Rubber and Teak cultivation systems in our study area. All vegetation is removed before the planting of crops. Therefore, DBH classes, density and basal area obtained in these biotopes (Table 1, Figures 2, 3) belong mainly to the crop trees.
The membership of the Rubber plantations and the Teak plantations to the same group with the natural forest
Kouamé et al. 011
patches and the undergrowth cleared forests according to both density and basal area (Figure 6) shows that all these biotopes are similar for these parameters. Due to the presence of some big tree native or exotic non-crop trees in Coffee plantations, this biotope integrates the forest’s group according to basal area whatever different according to density of which it has the lowest value (Figure 6). The higher variability of density in the Cocoa, Rubber and Teak plantations (Figure 4) can be explained by the differences in their ages and the cultivation systems. As these plantations were established in forbidden clearance area, we couldn’t get real plantations’ ages because farmers feared to be met. But plantations showed differences in the crop height and diameters that are generated by ages, the cultivation systems (Moguel and Toledo, 1999; Rice and Greenberg, 2000). The higher variability of basal area in the natural forest patches can be generated by the variation in logging intensity which is linked to local density of timber trees that can be logged (Kouamé, 1998). Thus, in the Scio natural forests and undergrowth cleared forests, basal area is more dependant (P<0.01) to mean DBH than to density while both mean DBH (P<0.05) and density (P<0.001) are important for basal area (Figure 5) in plantations.
The crop effect raised up by the ANOVA (Tables 5 and 6) was due to this difference in intensity of tree removed during the creation of Coffee and Cocoa plantations. In Coffee plots (PCAFD and PCAFS), Coffee trees always coexist with other native and/or exotic trees unlike Cocoa plantations where the Cocoa trees were found almost alone. The site effect (Table 3) could be explained by the difference in original vegetation types as both protected areas belong to two types of Ivorian rain forest (Kouamé, 2010; Kouamé and Zoro Bi, 2010). CONCLUSION Human activities in both Duekoué and Scio classified forests led to the decreasing of mean DBH and basal area of individuals with DBH ≥ 10 cm in accordance with the hypothesis of this paper. But Cocoa and Teak cultivation led to increase density for low and medium basal areas. When the forest undergrowth is just cleared for shrubs and lianas, mean DBH and basal area of individuals with DBH≥10 cm of African tropical forest still being similar to natural forest and its turnover should be faster if abandoned. In Duekoué and Scio forest areas, Coffee plantations where some natural trees survive and other exotic trees are introduced had similar importance with the natural forest and the undergrowth group despite their lower density.
Due to these results, we suggest to the Forestry Service to remove all the cash crop plantations from Ivorian classified forests and to circumscribe Teak and other

012. Glo. Adv. Res. J. plant. Sci.
wood plantations into some areas of these classified forests. ACKNOWLEDGEMENTS We are grateful to the Headquarter of the Forestry Service in Côte d’Ivoire (SODEFOR) for authorization to collect data in its patrimony. We thank cmd Yeboua, Cnl Fètè, B. Méda and Z. Dabiré for their help in the field. The anonymous referees are thanked for their constructive comments that will help to improve this manuscript. REFERENCES Ahimin AO (2006). Détermination des aires abritant les formations
végétales à haute valeur de conservation identifiées dans le Domaine guinéen de la Côte d’Ivoire. Mém. DEA, UFR Biosciences, Université de Cocody-Abidjan, 71 pp.
Bakayoko A (1999). Comparaison de la composition floristique et de la structure forestière de parcelles de la Forêt Classée de Bossématié, dans l’Est de la Côte d’Ivoire. Mém. DEA, UFR Biosciences, Univ. Cocody-Abidjan, 72 pp.
Bakayoko A (2005). Influence de la fragmentation forestière sur la composition floristique et la structure végétale dans le Sud-Ouest de la Côte d’Ivoire. Thèse Doct., Labo. Bot., UFR Biosciences, Univ. Cocody-Abidjan, 229 pp.
Bisseleua D, Herve B, Vidal S (2008). Plant biodiversity and vegetation structure in traditional cocoa forest gardens in southern Cameroon under different management. Biodivers. Conserv. 17: 1821-1835.
Bonou W, Glèlè Kakaï R, Assogbadjo AE, Fonton HN, Sinsin B (2009). Character-isation of Afzelia africana Sm. habitat in the Lama forest reserve of Benin. Forest Ecology and Management 258:1084-1092.
Chatelain C, Dao H, Gautier L, Spichiger R (2004). Forest cover changes in Côte d’Ivoire and Upper Guinea. In: Poorter L, Bongers F, Kouamé FN, Hawthorne WD (eds) Biodiversity of West African forests. An ecological Atlas of woody plant species. CABI, UK, pp 15-32.
Corthay R (1996). Analyse floristique de la forêt sempervirente de Yapo (Côte d’Ivoire). Mém. Diplôme, Univ. Genève, 152 pp.
CTFT (1989). Memento du forestier. Minist. Coopérat. Dével., Paris, 1266 pp.
D’Amico C, Gautier L (2000). Inventory of a 1-ha lowland rainforest plot in Manon-garivo (NW Madagascar). Candollea 55: 319-340.
Dao H (1999). Connaissance de l’environnement et systèmes d’information géogra-phiques : le cas de la déforestation en Côte d’Ivoire. Thèse Doct. ès-Sc., Fac. Sc., Université Genève, 370 pp.
De Koning J (1983). La forêt du Banco. I. La forêt. II. La flore. Wageningen Agr. Univ. tome I, 156 pp., tome II, 921 pp.
Devineau J-L (1984). Structure et dynamique de quelques forêts tropophiles de 'Ouest africain (Côte d'Ivoire). Thèse Doct. État, Univ. Paris VI, 294 pp.
Elidn M (1971). Le climat. In: Avenard JM, Eldin E, Girard G, Sircoulon J, Touche-beuf P, Guillaumet J-L, Adjanohoun E, Perraud A (eds) Le milieu naturel de la Côte d’Ivoire. ORSTOM, Paris, pp 73-108.
FAO (2011) Global forest resources assessment 2011. FAO. Rome, 176 pp.
Fowler J, Cohen L, Jarvis P (1999). Practical statistics for field biology. Wiley, 2e ed., 259 pp.
Ghazoul J, Sheil D (2010). Tropical forest ecology, diversity and conservation. OXFORD Press, 516 pp.
Glèlè Kakaï R, Sodjinou E, Fonton N (2006). Conditions d’application des
méthodes statistiques paramétriques. Applications sur ordinateur. Cotonou, 94 pp.
Hédl R, Svátek M, Dancak M, Rodzay AWM, Salleh AB, Kamariah AS (2009). A new technique for inventory of permanent plots in tropical forests: a case study from lowland Dipterocarp forest in Kuala Belalong, Brunei Darussalam. Blumea 54:124–130.
Houéto G, Fandohan B, Ouédraogo A, Ago EE, Salako VK, Assogbadjo, AE, Glèlè Kakaï R, Sinsin B (2013). Floristic and dendrometric analysis of woodlands in the Sudano-Guinean zone: a case study of Belléfoungou forest reserve in Benin. Acta Botanica Gallica 159(4):387-394.
Isaac ME, Gordon AM, Thevathasan N, Oppong SK, Quashie-Sam J (2005). Temporal changes in soil carbon and nitrogen in West Africa multistrata agroforestry systems: a chronosequence of pools and fluxes. Agroforest. Syst. 65 : 23-31.
Kouamé FN (1998). Influence de l’exploitation forestière sur la végétation et la flore de la Forêt Classée du Haut-Sassandra (Centre-Ouest de la Côte d’Ivoire). Thèse Doct. 3e Cycle, UFR Biosciences, Université Cocody-Abidjan, 227 pp.
Kouamé FN (2010). Main environmental factors of Côte d’Ivoire. Phytogeographic territories. In: Konaté S, Kampmann D (eds) Atlas de la biodiversité de l’Afrique de l’Ouest. Vol. III. Côte d’Ivoire. Biota, Abidjan and Frankfurt/Main, pp 132-138.
Kouamé FN, Zoro Bi IA (2010). Nouveau découpage de la zone de forêt dense humide de la Côte d’Ivoire. Sciences et Nature vol. 7 (2) : 177-194.
Méndez VE (2004). Traditional Shade, Rural Livelihoods, and Conservation in Small Coffee Farms and Cooperatives of Western El Salvador. Ph.D. thesis, University of California, Santa Cruz.
Messmer N (1996). Etude d’une parcelle d’un hectare de forêt dense humide de basse altitude à Madagascar. Diplôme, Univ. Genève, 96 pp.
Moguel P, Toledo VM (1999). Review: Biodiversity conservation in traditional Coffee systems of Mexico. Conservation Biology 13(1): 11-21.
Monnier Y (1983). Carte de la végétation de la Côte d'Ivoire. In: Vennetier P, Laclavère G (eds) Atlas de Côte-d'Ivoire. 2e éd., Jeune Afrique, Paris, 72 pp.
Nusbaumer L, Gautier L, Chatelain C, Spichiger R (2005). Structure et composition floristique de la Forêt Classée du Scio (Côte d’Ivoire). Etude descriptive et comparative. Candollea 60 (2) : 393-443.
ORSTOM, UNESCO (1983). Ecosystèmes forestiers tropicaux d’Afrique. Coll. Recherches sur les ressources naturelles, n° 19, Paris, 473 pp.
Perraud A, de la Souchère P (1970). Esquisse pédologique de la Côte d’Ivoire. Ech. 1/500 000e. Feuille Sud-Ouest, ORSTOM, Adiopodoumé, Abidjan.
Poorter L, Bongers F, Kouamé FN, Hawthorne WD (2004). Biodiversity of West African forests. An ecological Atlas of woody plant species. CABI, UK, 521 pp.
Rice RA, Greenberg R (2000). Cocoa cultivation and the conservation of biological diversity. Ambio vol. 29(3):167-173.
Rolim GS, Chiarello GA (2004). Slow-death of Atlantic forest trees in cocoa agroforest in southern Brazil. Biodivers. conserv. 13:2679–2694.
Sambuichi RHR, Haridasan M (2007). Recovery of species richness and conservation of native Atlantic forest trees in the Cocoa plantations of southern Bahia in Brazil. Biodivers. conserv. 16:3681-3701.
Sayer JA, Harcourt CS, Collins NM (1992). The conservation Atlas of Tropical forests. Africa. IUCN, Singapore, 288 pp.
Sharma N, Raina AK (2003). Composition, structure and diversity of tree species along an altitudinal gradient in Jammu province of north-western Himalayas, Jammu and Kashmir, India. Journal of Biodiversity and Ecological Sciences 3(1): 6-14.

Steffan-Dewenter I, Kessler M, Barkmann J, Bos M, Buchori D, Erasmi S,
Faust H, Gerold G, Glenk K, Gradstein RS, Guhardja E, Harteveld M, Hertel D, Hohn P, Kappas M, Kohler S, Leuschner C, Maertens M, Marggraf R, Migge-Kleian S, Mogea J, Pitopang R, Schaefer M, Schwarze S, Sporn GS, Steingrebe A, Tjitrosoedirdjo SS, Tjitrosoemito S, Twele A, Weber R, Woltmann L, Zeller M, Tscharntke T (2007). Tradeoffs between income, biodiversity, and ecosystem functioning during tropical rainforest conversion and agroforestry intensification. PNAS 104:4973–4978.
Trochain J-L (1957) Accord interafricain sur la définition des types de végétation de l’Afrique Tropicale. Bulletin Institut Études Centrafricaines. Nouv. Sér. 13/14 : 55-93.
Kouamé et al. 013 White F (1979). The Guineo-Congolian Region and its relationships to
other phytochoria. Bull. Jard. Bot. Nat. Belg. 49: 11-55. White F (1983). The vegetation of Africa, a descriptive memoir to
accompany the UNESCO/AETFAT/UNSO vegetation map of Africa. Natural resources research XX, UNESCO, Paris, 384 pp.
Zapfack L, Engwald S, Sonke B, Achoundong G, Birang M (2002). The impact of land conversion on plant biodiversity in the forest zone of Cameroon. Biodivers. conserv. 11: 2047–2061.

014. Glo. Adv. Res. J. plant. Sci.
Appendix 1. Plots coordinates on the two first axes of the factorial analysis of plot density with Statistica 7.1 software
Plots Factor 1 Factor 2 Plots Factor 1 Factor 2
Gro
upe
I
FNBAS1 -0,083 -0,043
Gro
upe
II
PCAFD1 0,290 0,775 FNBAS2 -0,090 -0,053 PCAFD2 0,616 0,734 FNBAS3 -0,071 -0,039 PCAFD3 0,494 0,852 FNBAS4 -0,071 -0,042 PCAFD4 0,342 0,909 FNBAS5 -0,063 -0,037 PCAFD5 0,350 0,927 FNBAS6 -0,042 -0,024 PCAFD6 0,350 0,926 FNBAS7 -0,095 -0,052 PCAFD7 0,352 0,929 FNBAS8 -0,082 -0,046 PCAFD8 0,343 0,911 FNBAS9 -0,081 -0,047 PCAFD9 0,412 0,903 FNBAS10 -0,090 -0,049 PCAFD10 0,488 0,867 FDEFS1 -0,068 -0,035 PCAFS1 0,332 0,880 FDEFS2 -0,076 -0,045 PCAFS2 0,351 0,928 FDEFS3 -0,077 -0,045 PCAFS3 0,348 0,922 FDEFS4 -0,082 -0,043 PCAFS4 0,351 0,927 FDEFS5 -0,083 -0,049 PCAFS5 0,350 0,924 FDEFS6 -0,072 -0,041 PCAFS6 0,352 0,928 FDEFS7 -0,081 -0,043 PCAFS7 0,350 0,924 FDEFS8 -0,085 -0,050 PCAFS8 0,345 0,913 FDEFS9 -0,094 -0,055 PCAFS9 0,350 0,925 FDEFS10 -0,075 -0,040 PCAFS10 0,349 0,927 PHEVD1 -0,016 -0,009 PCAOD1 0,931 -0,363 PHEVD2 -0,014 -0,001
Gro
upe
III
PCAOD2 0,931 -0,364 PHEVD3 -0,016 -0,009 PCAOD3 0,929 -0,364 PHEVD4 -0,016 -0,009 PCAOD4 0,931 -0,362 PHEVD5 -0,016 -0,009 PCAOD5 0,931 -0,363 PHEVD6 -0,016 -0,009 PCAOD6 0,931 -0,364 PHEVD7 -0,017 -0,010 PCAOD7 0,931 -0,363 PHEVD8 -0,016 -0,009 PCAOD8 0,923 -0,361 PHEVD9 -0,016 -0,009 PCAOD9 0,931 -0,363 PHEVD10 -0,016 -0,009 PCAOD10 0,930 -0,364 PTECD1 -0,017 -0,010 PCAOS1 0,931 -0,364 PTECD2 -0,017 -0,010 PCAOS2 0,931 -0,364 PTECD3 -0,019 -0,010 PCAOS3 0,930 -0,364 PTECD4 -0,017 -0,010 PCAOS4 0,931 -0,364 PTECD5 -0,017 -0,010 PCAOS5 0,931 -0,364 PTECD6 -0,017 -0,010 PCAOS6 0,930 -0,364 PTECD7 -0,017 -0,010 PCAOS7 0,931 -0,364 PTECD8 -0,017 -0,011 PCAOS8 0,931 -0,364 PTECD9 -0,017 -0,010 PCAOS9 0,930 -0,364 PTECD10 -0,017 -0,010 PCAOS10 0,931 -0,364

Kouamé et al. 015
Appendix 2. Plots coordinates on the two first axes of the factorial analysis of plot basal area with Statistica 7.1 software
Plots Factor 1 Factor 2 Plots Factor 1 Factor 2
Gro
upe
I
PHEVD1 -0,019 -0,819
Gro
upe
III
PCAFD1 0,008 -0,012 PHEVD3 -0,019 -0,819 PCAFD2 0,150 -0,037 PHEVD2 -0,010 -0,802 PCAFD3 0,099 -0,048 PHEVD4 -0,019 -0,819 PCAFD4 0,009 -0,017 PHEVD5 -0,019 -0,819 PCAFD5 0,005 -0,046 PHEVD6 -0,019 -0,819 PCAFD6 0,001 -0,041 PHEVD7 -0,020 -0,817 PCAFD7 0,010 -0,047 PHEVD8 -0,019 -0,819 PCAFD8 -0,001 -0,028 PHEVD9 -0,019 -0,819 PCAFD9 0,075 -0,041 PHEVD10 -0,019 -0,819 PCAFD10 0,123 -0,050 FNBAS1 -0,038 0,031 PCAFS1 0,029 -0,019
Gro
upe
II
FNBAS2 -0,038 0,046 PCAFS2 0,006 -0,033 FNBAS3 -0,041 0,015 PCAFS3 0,004 -0,044 FNBAS4 -0,044 0,037 PCAFS4 0,041 -0,045 FNBAS5 -0,020 0,011 PCAFS5 0,004 -0,046 FNBAS6 -0,028 0,011 PCAFS6 0,008 -0,048 FNBAS7 -0,038 0,043 PCAFS7 0,002 -0,041 FNBAS8 -0,037 0,035 PCAFS8 0,009 -0,039 FNBAS9 -0,055 0,038 PCAFS9 0,030 -0,032 FNBAS10 -0,042 0,030 PCAFS10 0,007 -0,048 FDEFS1 -0,034 0,016
Gro
upe
IV
PCAOD1 0,992 0,003 FDEFS2 -0,013 0,018 PCAOD2 0,992 0,003 FDEFS3 -0,047 0,056 PCAOD3 0,766 0,004 FDEFS4 -0,013 0,017 PCAOD4 0,901 -0,008 FDEFS5 -0,032 0,018 PCAOD5 0,992 0,003 FDEFS6 -0,049 0,047 PCAOD6 0,992 0,003 FDEFS7 -0,041 0,038 PCAOD7 0,833 -0,005 FDEFS8 -0,034 0,049 PCAOD8 0,771 0,001 FDEFS9 -0,037 0,036 PCAOD9 0,885 -0,004 FDEFS10 -0,041 0,053 PCAOD10 0,949 0,002 PTECD1 -0,022 0,574 PCAOS1 0,992 0,003 PTECD2 -0,025 0,576 PCAOS2 0,992 0,003 PTECD3 -0,025 0,569 PCAOS3 0,992 0,003 PTECD4 -0,022 0,574 PCAOS4 0,992 0,003
PTECD5 -0,022 0,574 PCAOS5 0,992 0,003 PTECD6 -0,023 0,572 PCAOS6 0,991 0,003 PTECD7 -0,022 0,574 PCAOS7 0,992 0,003 PTECD8 -0,028 0,566 PCAOS8 0,992 0,003
PTECD9 -0,023 0,573 PCAOS9 0,991 0,003 PTECD10 -0,022 0,574 PCAOS10 0,992 0,003