Structure of ArboNET and summary of West Nile Virus Activity The Arbonet Team Division of...
26
Structure of ArboNET and summary of West Nile Virus Activity The Arbonet Team Division of Vector-Borne Infectious Diseases Centers for Disease Control & Prevention Fort Collins, Colorado Chet Moore Colorado State University Fort Collins, CO
-
Upload
clifton-ramsey -
Category
Documents
-
view
215 -
download
0
Transcript of Structure of ArboNET and summary of West Nile Virus Activity The Arbonet Team Division of...
Structure of ArboNET and summary of West Nile Virus Activity
The Arbonet Team
Division of Vector-Borne Infectious Diseases Centers for Disease Control & Prevention
Fort Collins, Colorado
Chet Moore
Colorado State University
Fort Collins, CO

ArboNET Database
“Users don’t know what they really want, but they know for certain what they don’t want."Manubay’s Laws for Programmers
• Keep it simple – avoid complex and multi-layered data entry screens whenever possible
• Build data entry screens to work the way data entry clerks actually enter the data
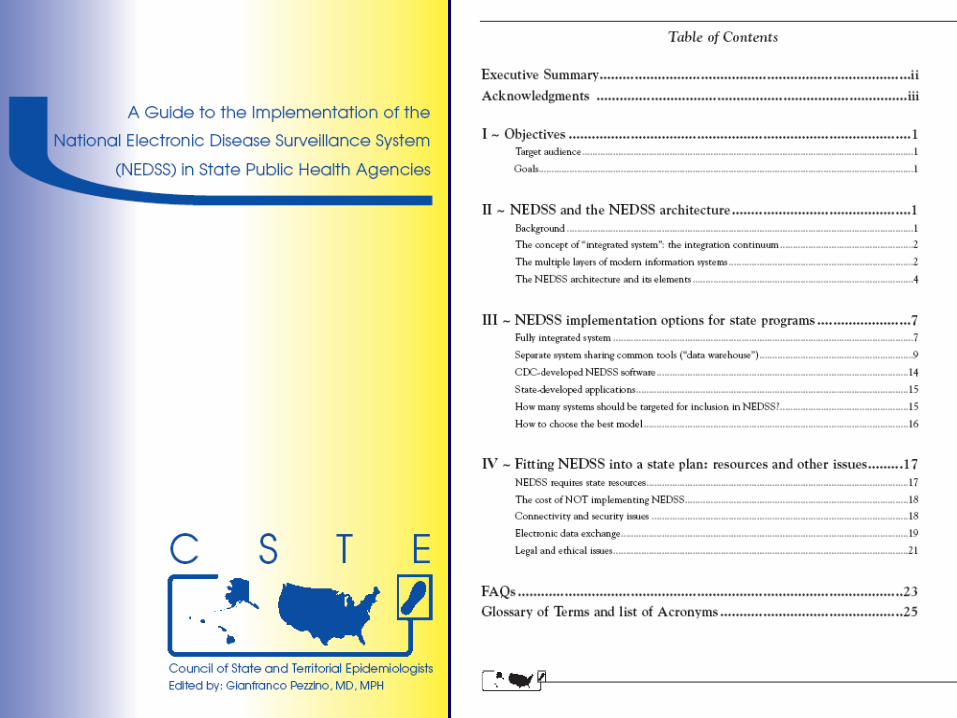
• Where possible, build compatibility with other data collection systems (e.g., NEDSS, etc.)

• Use drop-down lists, auto-fill and other time savers whenever possible (automatically calculate totals, statistics, etc.)
• Build error checking routines into the software
• Use lists to prevent spelling errors and similar problems
"Never attribute to malice that which is adequately explained by incompetence ."Hanlon's Razor
Historical Perspective
Progression of West Nile Virus Activity in the United States, 1999-2005

1999
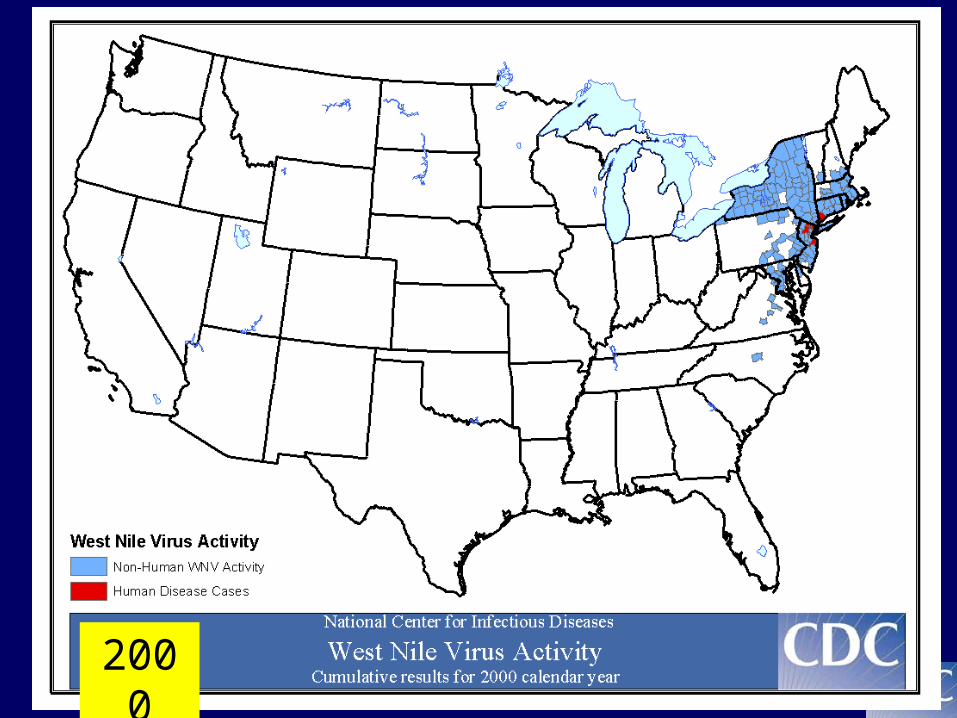
2000
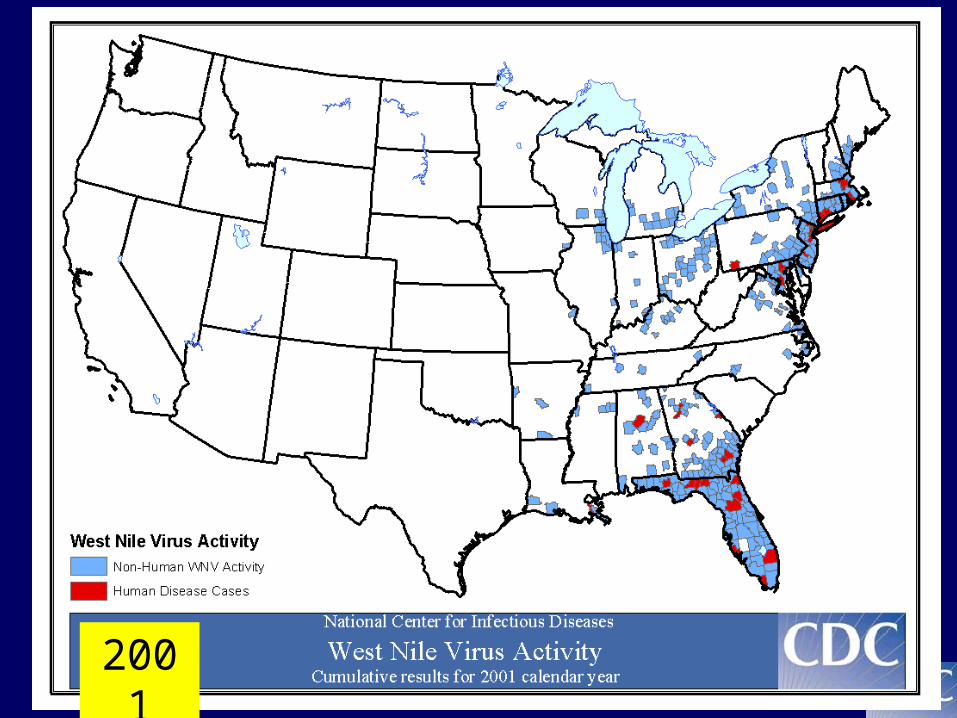
2001

2002

2003
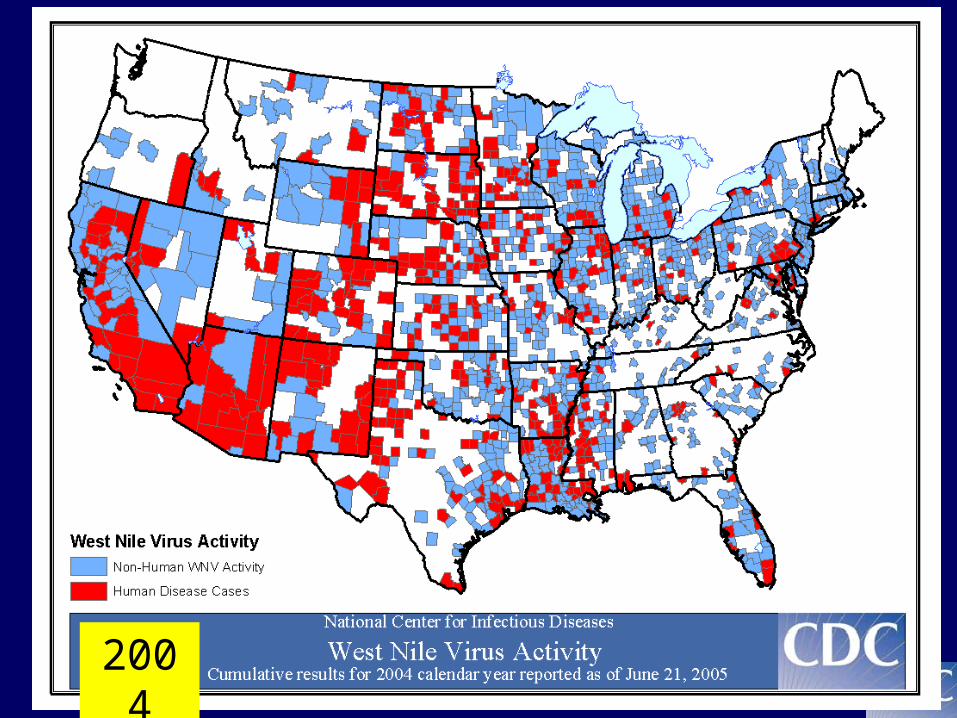
2004
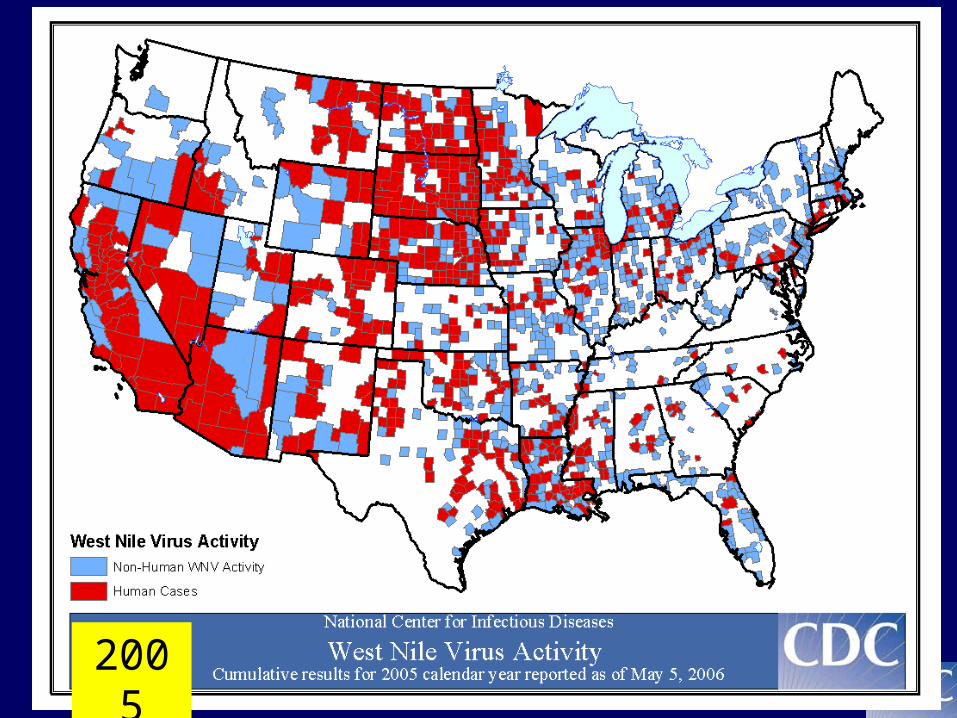
2005

Category No. Tested** No. Positive No. States
Mosquito 12.8 million 36,288 48†
Dead bird 128,486 53,381 48†
Veterinary Unavailable 23,447 47‡
Human Unavailable 19,706 46 †
Sentinel chicken/ horse
Unavailable 7,154 30‡
WNV Surveillance Totals, US, 1999-2005*
* Reported as of 5/5/2006
** Excludes 1999
† Plus DC
‡ Plus Puerto Rico
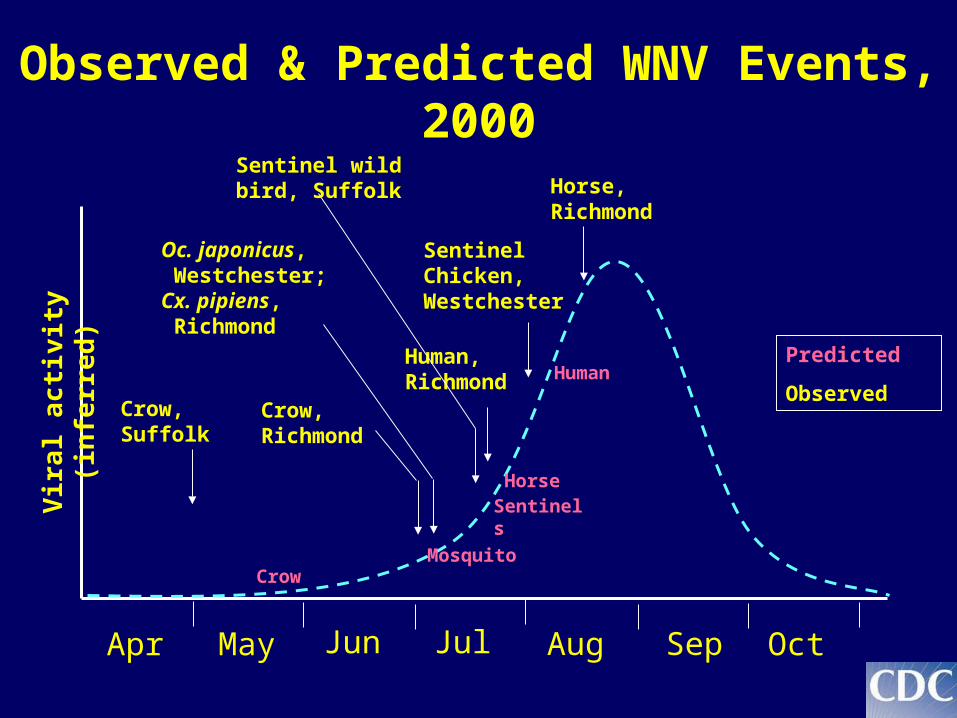
Observed & Predicted WNV Events, 2000
Aug Sep OctJulJunApr May
Vir
al a
ctiv
ity
(in
f er r
ed
)
Crow,Suffolk
Oc. japonicus, Westchester;Cx. pipiens, Richmond
Horse,Richmond
Human,Richmond
Sentinel Chicken,Westchester
Crow,Richmond
Sentinel wild bird, Suffolk
Human
Horse
MosquitoCrow
Sentinels
Predicted
Observed

Innovative Vector Control Consortium (IVCC)
Dengue Decision Support System
Liverpool School of Tropical MedicineColorado State University
University of California, DavisSouth African Medical Research Council
Funded by Bill and Melinda Gates Foundation
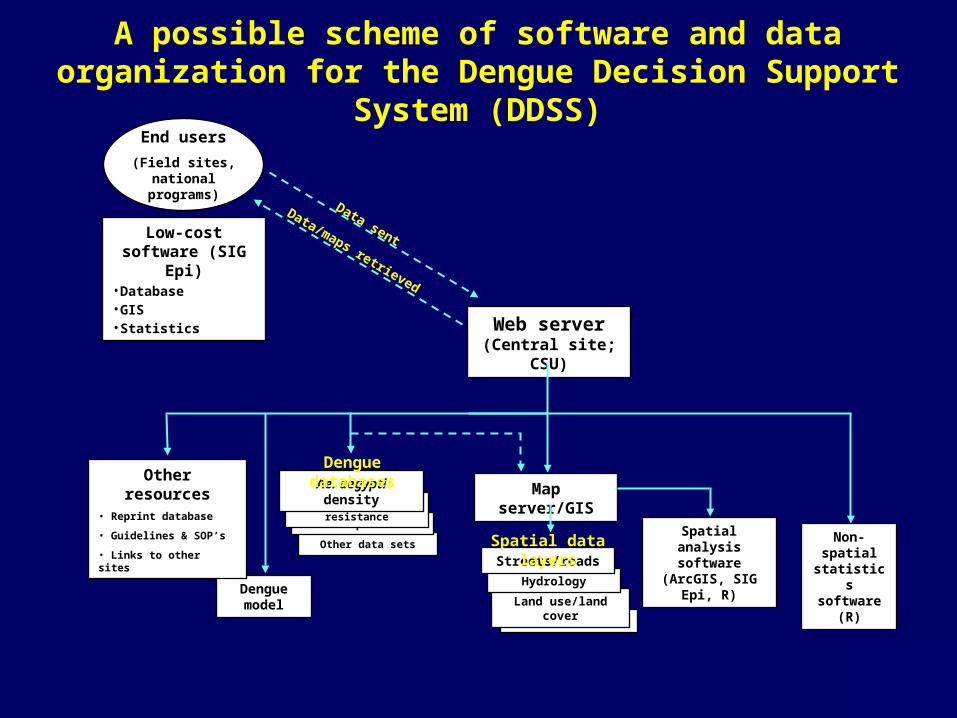
A possible scheme of software and data organization for the Dengue Decision Support System (DDSS)
Data sent
Data/maps retrieved
Map server/GIS
Web server (Central site; CSU)
Non-spatial statistics software
(R)
Spatial analysis software (ArcGIS,
SIG Epi, R)
Dengue model
Other resources• Reprint database
• Guidelines & SOP’s
• Links to other sitesOther data sets
DEN seroprevalence
Insecticide resistance
Ae. aegypti density
Dengue databases
Other data layers
Land use/land cover
Hydrology
Streets/roads
Spatial data layers
End users
(Field sites, national
programs)
Low-cost software (SIG Epi)
•Database•GIS•Statistics


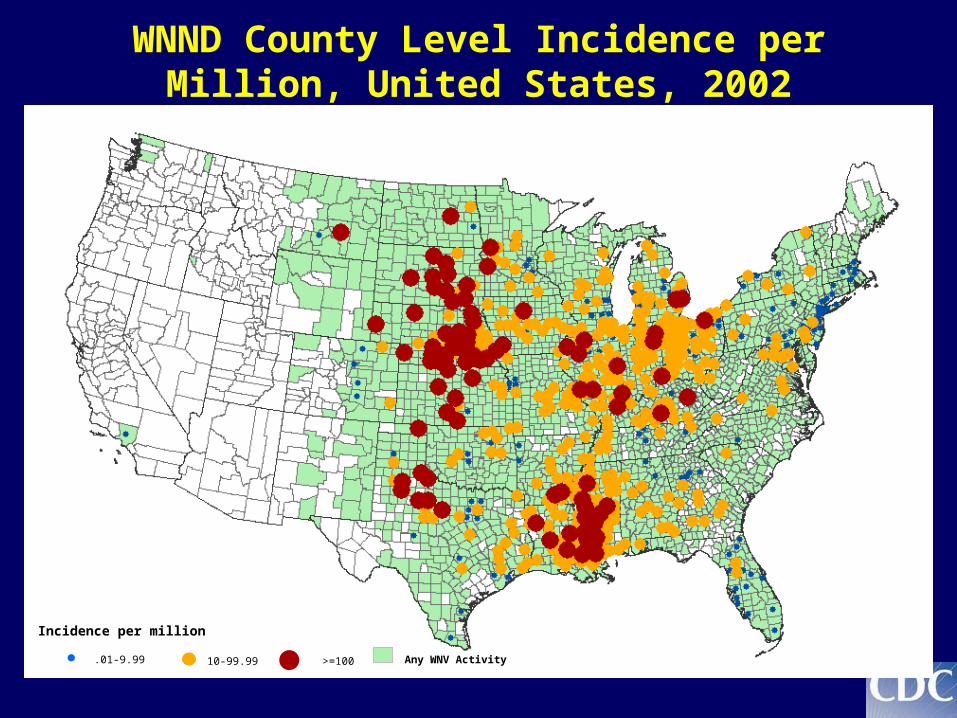
WNND County Level Incidence per Million, United States, 2002
Incidence per million
.01-9.99 10-99.99 >=100 Any WNV Activity
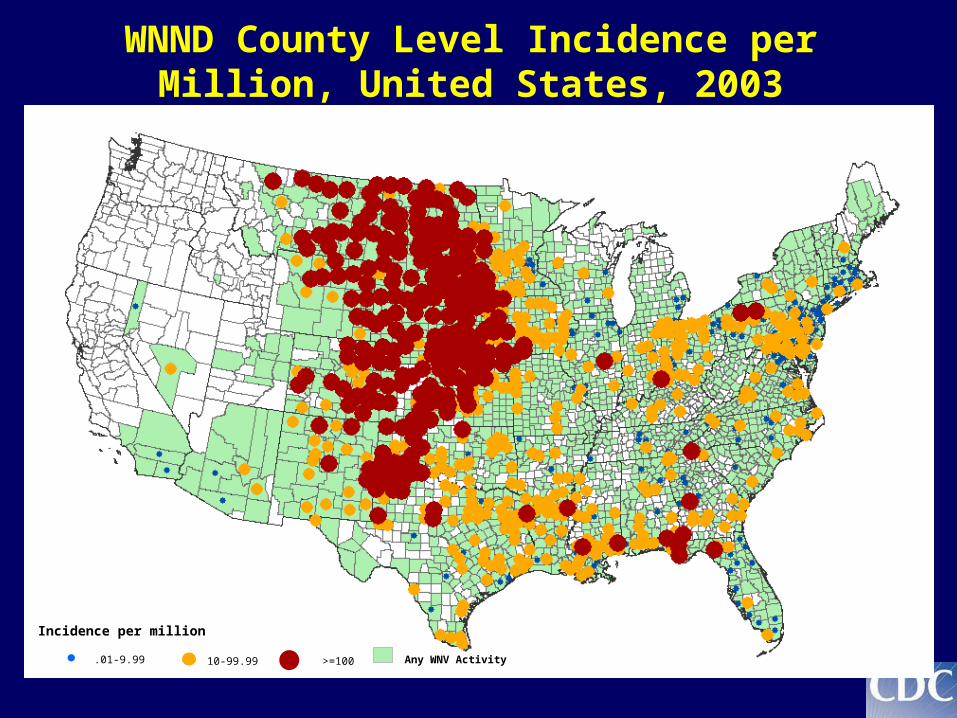
WNND County Level Incidence per Million, United States, 2003
Incidence per million
.01-9.99 10-99.99 >=100 Any WNV Activity

WNND County Level Incidence per Million, United States, 2004
Incidence per million
.01-9.99 10-99.99 >=100 Any WNV Activity
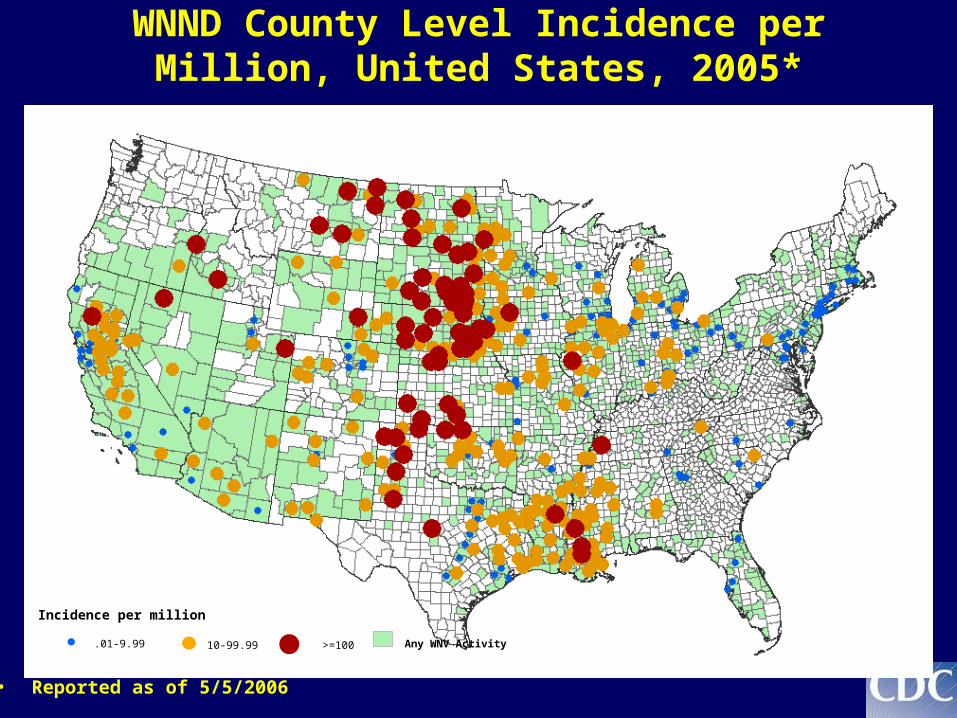
WNND County Level Incidence per Million, United States, 2005*
• Reported as of 5/5/2006
Incidence per million
.01-9.99 10-99.99 >=100 Any WNV Activity
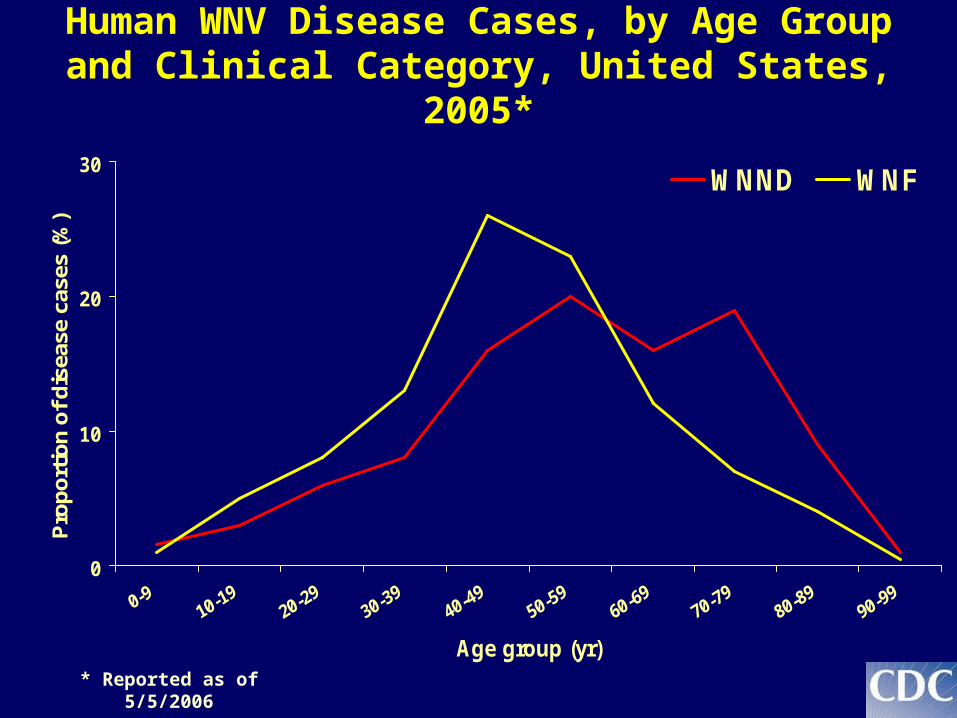
0
10
20
30
Age group (yr)
Pro
po
rtio
n o
f d
isea
se c
ases
(%
)
WNND WNF
Human WNV Disease Cases, by Age Group and Clinical Category, United States, 2005*
* Reported as of 5/5/2006
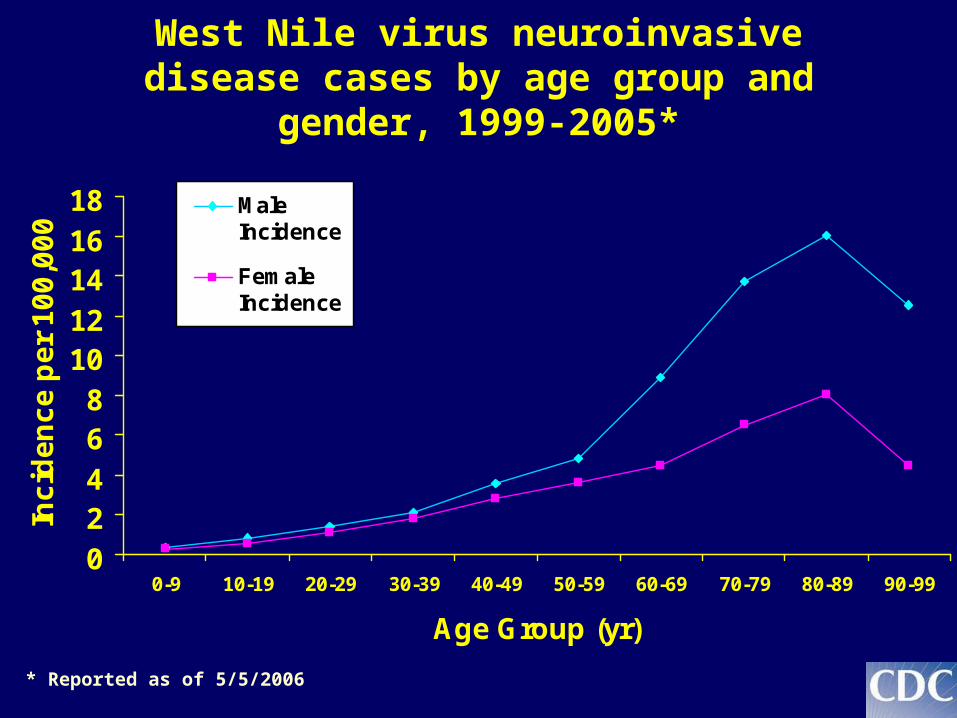
West Nile virus neuroinvasive disease cases by age group and gender, 1999-2005*
* Reported as of 5/5/2006
02468
1012141618
0-9 10-19 20-29 30-39 40-49 50-59 60-69 70-79 80-89 90-99
Age Group (yr)
Inc
ide
nc
e p
er
10
0,0
00
MaleIncidence
FemaleIncidence
* Reported as of 5/5/2006
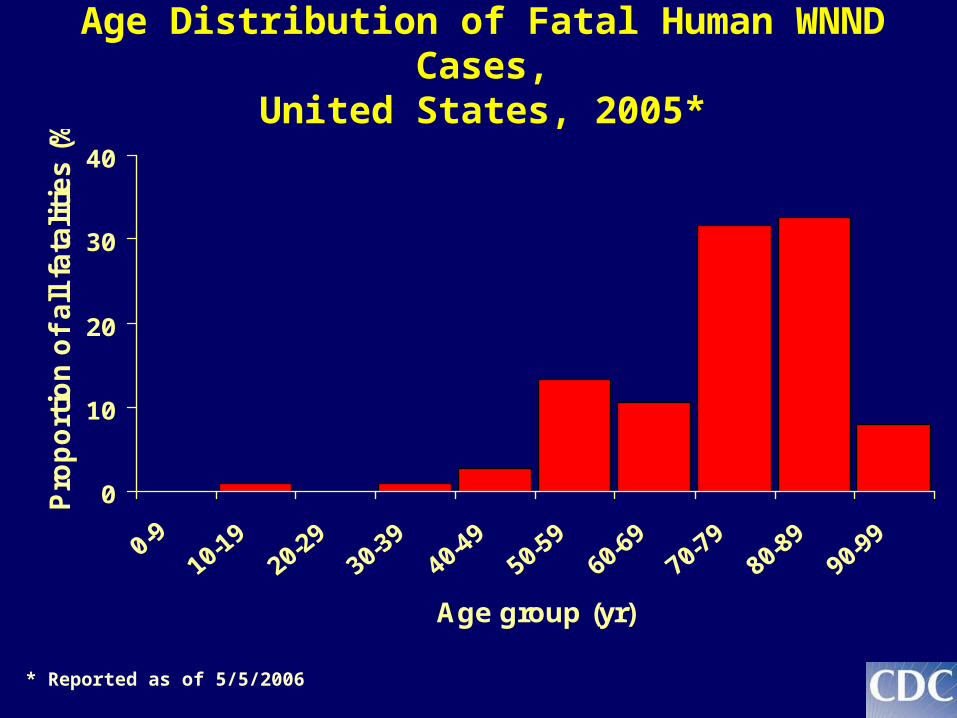
Age Distribution of Fatal Human WNND Cases,United States, 2005*
0
10
20
30
40
Age group (yr)
Pro
po
rtio
n o
f a
ll f
ata
liti
es
(%
)
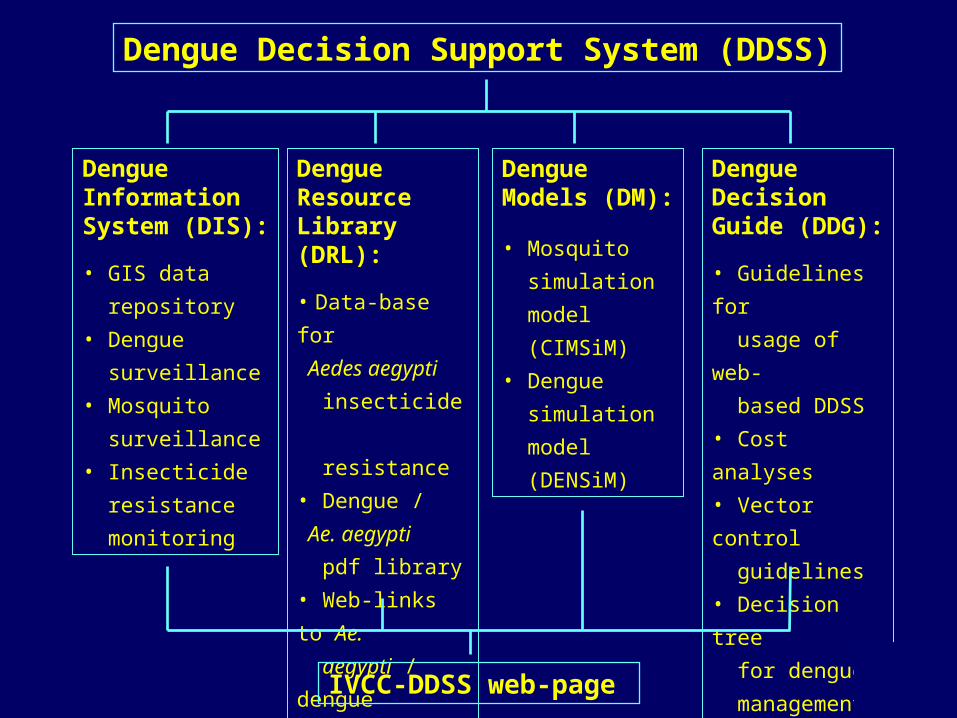
Dengue Decision Support System (DDSS)
Dengue Information System (DIS):
• GIS data
repository
• Dengue
surveillance
• Mosquito
surveillance
• Insecticide
resistance
monitoring
Dengue ResourceLibrary (DRL):
• Data-base for
Aedes aegypti
insecticide
resistance
• Dengue /
Ae. aegypti
pdf library
• Web-links to Ae.
aegypti / dengue
data-bases
Dengue Models (DM):
• Mosquito
simulation
model
(CIMSiM)
• Dengue
simulation
model
(DENSiM)
Dengue Decision Guide (DDG):
• Guidelines for
usage of web-
based DDSS
• Cost analyses
• Vector control
guidelines
• Decision tree
for dengue
management
IVCC-DDSS web-page