STRUCTURE OF A PORT OPERATIONS …docs.trb.org/prp/14-2743.pdf1 STRUCTURE OF A PORT OPERATIONS...
17
D. Tsamboulas, I. Karousos 1 STRUCTURE OF A PORT OPERATIONS OBSERVATORY: APPLICATION 1 IN THE MEDITERRANEAN SEA 2 3 Re-Submission Date: 15/11/2013 4 Word Count: 7255 (including 2 Tables and 6 Figures) 5 6 Dr. Dimitrios Tsamboulas, Professor* 7 8 National Technical University of Athens, School of Civil Engineering, Department of 9 Transportation Planning and Engineering 10 5, Iroon Polytechniou Str., Zografou Campus, Zografou, Athens, GR-15773, Greece 11 Tel.: +30-210-7721367, Fax: +30-210-7722404, E-mail: [email protected] 12 13 Iosif Karousos, Researcher 14 15 National Technical University of Athens, School of Civil Engineering, Department of 16 Transportation Planning and Engineering 17 5, Iroon Polytechniou Str., Zografou Campus, Zografou, Athens, GR-15773, Greece 18 Tel.: +30-210-7721155, Fax: +30-210-7722404, E-mail: [email protected] 19 20 * Corresponding author 21 22 TRB 2014 Annual Meeting Paper revised from original submittal.
Transcript of STRUCTURE OF A PORT OPERATIONS …docs.trb.org/prp/14-2743.pdf1 STRUCTURE OF A PORT OPERATIONS...
D. Tsamboulas, I. Karousos 1
STRUCTURE OF A PORT OPERATIONS OBSERVATORY: APPLICATION 1 IN THE MEDITERRANEAN SEA 2 3 Re-Submission Date: 15/11/2013 4 Word Count: 7255 (including 2 Tables and 6 Figures) 5 6 Dr. Dimitrios Tsamboulas, Professor* 7 8 National Technical University of Athens, School of Civil Engineering, Department of 9 Transportation Planning and Engineering 10 5, Iroon Polytechniou Str., Zografou Campus, Zografou, Athens, GR-15773, Greece 11 Tel.: +30-210-7721367, Fax: +30-210-7722404, E-mail: [email protected] 12 13 Iosif Karousos, Researcher 14 15 National Technical University of Athens, School of Civil Engineering, Department of 16 Transportation Planning and Engineering 17 5, Iroon Polytechniou Str., Zografou Campus, Zografou, Athens, GR-15773, Greece 18 Tel.: +30-210-7721155, Fax: +30-210-7722404, E-mail: [email protected] 19 20 * Corresponding author 21
22
TRB 2014 Annual Meeting Paper revised from original submittal.

D. Tsamboulas, I. Karousos 2
STRUCTURE OF A PORT OPERATIONS OBSERVATORY: APPLICATION 23 IN THE MEDITERRANEAN SEA 24 25 26 ABSTRACT 27 The main objectives of the monitoring strategy of transportation services and 28 infrastructure at national, regional and international level are to learn from past 29 experiences, develop alternative management approaches and modify policy 30 regulations in order to optimize the level of service and utilization of existing 31 infrastructure. The transportation infrastructure observatories are public or private 32 entities devoted not only to generate statistics, but mostly to collect and harmonize 33 transportation data in standardized information systems in order to support 34 performance-based management of transportation services planning and delivery. An 35 observatory can be a web-portal for strategic information and up-to-date reports on 36 relevant enquiries, examining one or more transportation modes in a specific 37 geographical area. The scope of this paper is to provide guidelines for developing the 38 basic structure with the static and dynamic contents of an observatory of port 39 operations, as well as its web based architecture and functioning. This includes the 40 definition and classification of its key features and users, and the technological 41 requirements of the website architecture. For demonstration purposes, an application 42 is presented for the “Port Operations Observatory in the Mediterranean Sea”. 43 44 Keywords: observatory, port operations, customs procedures, Mediterranean 45
46
TRB 2014 Annual Meeting Paper revised from original submittal.
D. Tsamboulas, I. Karousos 3
INTRODUCTION 47 The development of transportation services and infrastructure has reached an 48 advanced level in the majority of the developed countries, the need for constant 49 monitoring, re-evaluation and updating of the offered facilities and services is a 50 common policy objective. The scope of the performance monitoring strategy at 51 national, regional and international level is to learn from past experiences, develop 52 alternative management approaches and modify policy regulations, in order to 53 optimize the level of service, safety and utilization of existing infrastructures. 54 Moreover, the knowledge of resulting impacts is essential for improving forecast 55 models in relation to the growing complexity of transportation systems worldwide. 56 The transportation infrastructure Monitoring Centers or Observatories are public or 57 private entities with permanent constituency, which are devoted to generate statistics, 58 but mostly to collect and harmonize transportation metadata in standardized 59 information technology (IT) systems. An observatory can be developed as a “web-60 portal” for strategic information and up-to-date reports on any relevant enquiries, 61 analyzing one or more transportation modes. Furthermore, it could focus on a specific 62 geographical area and on various cases of transportation infrastructure development, 63 as well as support decision-making processes and impact assessments (1). 64
The scope of this paper is to develop the basic structure and contents of a Port 65 Operations Observatory. The development includes the identification and 66 classification of the observatory’s key features and user types, but also the 67 technological development of the website structure. For demonstration purposes, an 68 application is presented for the Mediterranean seaports, based on work carried out by 69 the MEDNET project (2). Finally the main conclusions of the approach are outlined. 70 71 STATE-OF-THE-ART REVIEW 72 The main goal of monitoring tools is to periodically produce updated overviews of 73 performance outcomes and indicators regarding a specific activity or sector. Research 74 on the effectiveness and efficiency of port performance provides policy makers with 75 essential feedback for assessing port governance structures in alignment with national 76 and regional strategic goals. Any new strategies to serve unmet needs and to allow for 77 business development are also based on identifying and understanding the port users’ 78 requirements (3). Several projects focus on the development of monitoring tools 79 related to road, rail and maritime transportation with emphasis in the use of 80 performance indicators. 81
Regarding Europe, the South East Europe Transport Observatory is a regional 82 center for monitoring the development of a transportation network by the European 83 Commission and seven West Balkan countries in SE Europe (4). Its objectives are to 84 enhance local capacity for the implementation of investment programs, to collect and 85 analyze network data, and to promote cooperation on development of the regional 86 multimodal network. These are achieved by improving and harmonizing 87 transportation policies, technical standards and effective communication interfaces, 88 and by integrating the system in the wider trans-European context. Another related 89 project in the area is the Mediterranean Electronic Marine Highway Observatory, a 90 transnational initiative to mitigate maritime, safety and environmental risks and 91 promote sustainable development of marine and coastal resources (5). Its aim is to 92 improve performance and introduce new capabilities, innovative applications and 93 eventually integrate intelligent systems that monitor the realization of measures 94 adopted by the maritime traffic surveillance system and compile statistics on shipping 95 and cargo volumes in the area. The establishment of a European Port Observatory is a 96
TRB 2014 Annual Meeting Paper revised from original submittal.
D. Tsamboulas, I. Karousos 4
similar effort to monitor the regional port system and to regularly update pre-defined 97 performance indicators by collecting data to present the outputs online and in events 98 or publications (6). The re-evaluation of the indicators enables the relevant decision 99 makers and port actors to continually monitor their operations and the entire 100 intermodal logistic chain. The ASSEMBLING project was an earlier effort to provide 101 specialized information and support transportation policy makers by examining the 102 impacts of existing and alternative future policies (7). To accomplish these objectives, 103 the five proposed observatories are assembled into a “monitoring hub”, which covers 104 a specific region and consists of a web service collecting data about current policies 105 and providing forecast models. For example, the Transport East Mediterranean 106 Observatory aims at supporting policy goals of a cross-border transportation corridor 107 and a national grid of freight villages, such as sustaining the observatory and the data 108 collection from two national sources, and utilizing transportation, socioeconomic and 109 environmental forecasts (1). 110
Beyond Europe, there are transportation observatories also focusing on the 111 multimodal supply chain, such as the Freight Transport and Logistics Regional 112 Observatory of Latin America and the Caribbean (8). This is a network of monitoring 113 centers defining methodologies to analyze and monitor the regional logistic agenda 114 issues and supporting the creation of public policies. A recent addition, the Meso-115 american Observatory on Freight Transport and Logistics, aims at measuring and 116 comparing logistics performance, harmonizing information and statistics, developing 117 regional databases and offering training to improve competitiveness and decision 118 making across Central America. The Northern Corridor in East and Central Africa 119 comprises of transportation infrastructures and services linking the Kenyan Port of 120 Mombasa with five neighboring countries, and intends to become an economic 121 growth corridor of internationally competitive services and regional integration (9). 122 The respective Transport Observatory Project monitors the corridor performance, 123 supports decision makers through reliable evidence (e.g. network delays, volume, 124 capacity, rates, costs and efficiency) from multiple actors and data sources, and 125 publishes the results online and in periodic reports. Another effort focusing on safety 126 and environmental issues is the Integrated Ocean Observing System in U.S.A. that 127 coordinates a group of 11 regional coastal observing systems to meet national and 128 regional needs for local observations, data management and modeling (10). From the 129 wide range of monitored data, the maritime transportation benefits from real-time and 130 forecast information on surface currents and waves, improved tools for port pilots and 131 ships entering harbors, thorough coastal mapping and oil spill trajectory tracking. 132
The growing importance of the world maritime transportation augments the 133 necessity of homogeneous performance-based data and strategic analyses of port 134 management issues. However, the gap of well-organized data sources hinders the 135 diffusion of common terminology, reliable statistics and best practices that allow for 136 ports comparison and support decision-making by private actors seeking to improve 137 their trade strategies and public authorities creating the relevant policies. With the aim 138 to bridge this gap in the Mediterranean area, the Observatory of Port Operations is 139 developed based on the underlying features described in the next sections. 140
141 OBSERVATORY ELEMENTS AND FUNCTIONS 142 The basic principle for the development of an observatory of port operations is to 143 provide port authorities and stakeholders with a sophisticated web-based platform to 144 circulate knowledge, views and best practices, and to record port operations, activities 145
TRB 2014 Annual Meeting Paper revised from original submittal.

D. Tsamboulas, I. Karousos 5
and procedures, allowing for short-term and long-term planning and management of 146 the port system. 147 148 Identification 149 The primary phases of the development process include surveys of ports through 150 questionnaires and interviews. These create a comprehensive picture of existing port 151 and customs procedures, any bottlenecks in performance of port operations and 152 hinterland connections, as well as any obstacles or best practices and chances to 153 simplify and standardize processes (2). The preliminary steps towards implementing 154 the observatory also include the identification and organization of user and data 155 requirements, as well as the outline of the IT system configuration (database software 156 and hardware, security / access rules, etc.) and of the functional web interface design. 157 These can be combined with the development of a rigorous business plan on 158 commercialization opportunities within the observatory context, along with a 159 recognition program for ports willing to offer data (e.g. rewards for contributing ports 160 or incentives to continue annual reporting) (11). The next paragraphs present the basic 161 structural elements upon which the observatory is developed. 162
163 Database 164 The information system of an observatory is founded on the collection, organization, 165 storage and analysis of data coming from various sources. Data and information are 166 collected through questionnaire surveys to the participating ports, which are the initial 167 sources of the observatory’s dataset. Alternatively, the database can be enriched with 168 import of relevant data by designated users, statistics, documents and real-time 169 information from external sources. The organization and storage process for all 170 collected data may also include their classification, conversion and annotation with 171 metadata to prepare them for the subsequent analyses (12). A persistent database is 172 thus created to store and manage the received information for all involved ports, 173 which is then available for analysis and publication in other parts of the platform (e.g. 174 reference library and knowledge center). Table 1 summarizes the basic contents of the 175 observatory’s database. 176 177 TABLE 1 Basic Contents of the Observatory’s Database 178 Content Description Definitions of port operations, services and procedures
Applicable to the examined ports, classified in the following categories according to operational characteristics, and publishable in the observatory’s library:
a. Maritime and vessel related procedures b. Passenger services c. Cargo handling procedures d. Administrative and logistics procedures e. Environmental protection related procedures f. Port infrastructure related procedures g. Vessel inspection and maintenance operations
Legislation associated to port and customs procedures
Relevant regulations, directives, papers and communications classified per type and area (regional, national or international level) and presented with the date of issue, their main objective and their relevance to the observatory aims
TRB 2014 Annual Meeting Paper revised from original submittal.
D. Tsamboulas, I. Karousos 6
Relevant studies and projects
Database of all available information about project duration, budget, source of funding, involved partners, overall aim and specific goals, major results, relevance to the observatory aims and prospects for potential synergies with other projects or organizations
Freight and passenger flows
Database of stored flows for passengers and freight according to the type, services and connections of each port; serving as baseline data for the forecasting tool, historical and forecasted flows
Operating shipping lines and routes
Directory of the existing lines and routes operating from, to and through each port
Structure and flows of hinterland network
Information about existing or planned links, modes and traffic flows based on the extent of the intermodal transportation system connecting each port with hinterland network
Qualifications and best practices
Record of ports’ achievements in terms of qualifications, best practices, special services or awards, etc.
Status of plans and projects
Information about ongoing or future plans regarding port expansion, new investments and projects, business development strategies, etc.; (if available) duration, budget, source of funding, main objectives and expected benefits for each plan or project
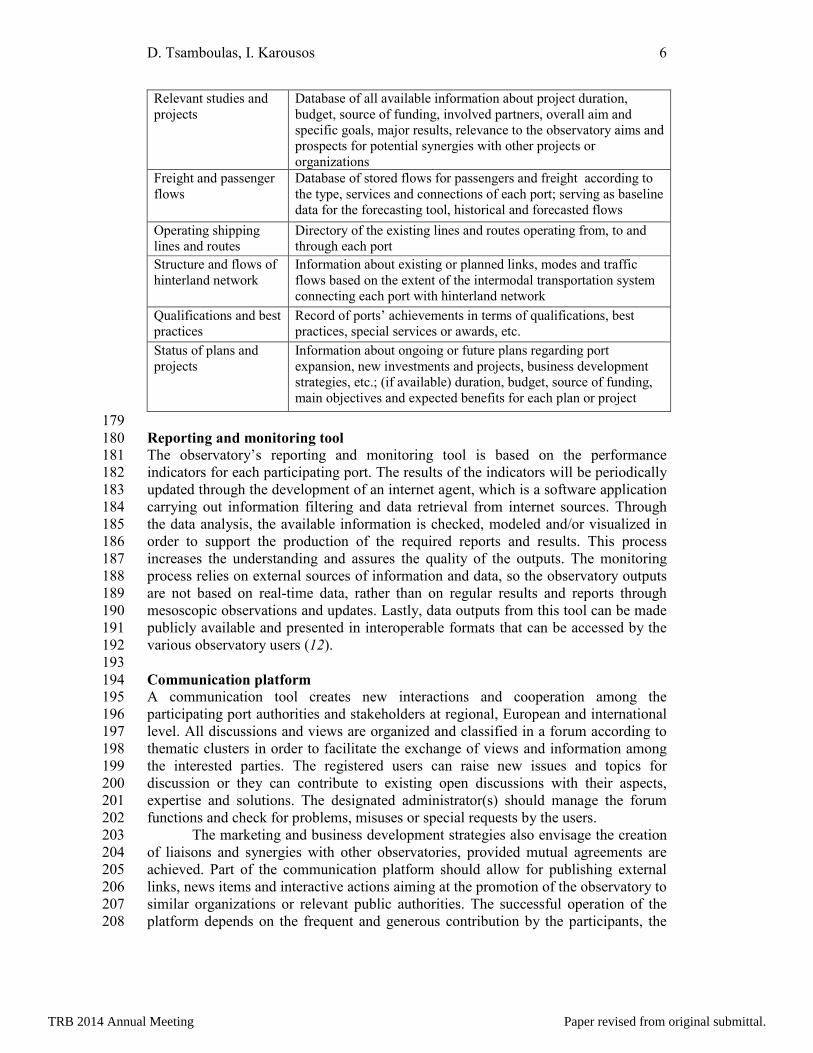
179 Reporting and monitoring tool 180 The observatory’s reporting and monitoring tool is based on the performance 181 indicators for each participating port. The results of the indicators will be periodically 182 updated through the development of an internet agent, which is a software application 183 carrying out information filtering and data retrieval from internet sources. Through 184 the data analysis, the available information is checked, modeled and/or visualized in 185 order to support the production of the required reports and results. This process 186 increases the understanding and assures the quality of the outputs. The monitoring 187 process relies on external sources of information and data, so the observatory outputs 188 are not based on real-time data, rather than on regular results and reports through 189 mesoscopic observations and updates. Lastly, data outputs from this tool can be made 190 publicly available and presented in interoperable formats that can be accessed by the 191 various observatory users (12). 192 193 Communication platform 194 A communication tool creates new interactions and cooperation among the 195 participating port authorities and stakeholders at regional, European and international 196 level. All discussions and views are organized and classified in a forum according to 197 thematic clusters in order to facilitate the exchange of views and information among 198 the interested parties. The registered users can raise new issues and topics for 199 discussion or they can contribute to existing open discussions with their aspects, 200 expertise and solutions. The designated administrator(s) should manage the forum 201 functions and check for problems, misuses or special requests by the users. 202
The marketing and business development strategies also envisage the creation 203 of liaisons and synergies with other observatories, provided mutual agreements are 204 achieved. Part of the communication platform should allow for publishing external 205 links, news items and interactive actions aiming at the promotion of the observatory to 206 similar organizations or relevant public authorities. The successful operation of the 207 platform depends on the frequent and generous contribution by the participants, the 208
TRB 2014 Annual Meeting Paper revised from original submittal.

D. Tsamboulas, I. Karousos 7
clear classification and management of the forum groups and topics, and the 209 achievement of official endorsement by relevant projects or actors. 210 211 Reference library and knowledge center 212 This is a comprehensive information and knowledge application which retrieves, 213 analyzes and presents the database contents as meaningful outputs to the 214 observatory’s diverse users. All bibliographic data or other documents created and 215 collected by participants can be registered in the digital library as a place to share 216 information. Each document can be described by its properties (e.g. creation date, 217 author, etc.), so that administrative and IT work is reduced, but proper library 218 standards are met and information retrieval is user-friendly. The catalog can be 219 searched by specific topic (i.e. author, title, subject, etc.) and each query returns 220 certain data fields for the document (13). The library contains the following elements: 221
a. Directory of legislation, guidelines, projects and studies associated to port 222 operations and formalities, customs procedures, safety and security issues etc. 223
b. Catalog of recommendations and best practices from maritime sector. 224 c. Trade and transportation statistics from external links and data providers. 225 d. A software application forecasting cargo flows for the region’s ports. 226 This knowledge base acts as a decision support system (DSS), namely a 227
software system supporting and expediting business decision-making through the 228 compilation and analysis of data in a fast and user-friendly manner and the application 229 of models to identify and solve problems. By the use of DSS port information is well-230 organized in the form of charts or graphs, helping thus the port or other stakeholders’ 231 managing bodies take well-educated strategic decisions (14). 232 233 OBSERVATORY WEB PLATFORM ARCHITECTURE 234 Regarding the architecture of the web-based platform, the web services are a common 235 solution for building observatory systems. The World Wide Web Consortium, an 236 international community that develops open standards to ensure the long-term growth 237 of WWW, defines a web service as a software system designed to support machine-238 to-machine interaction over the internet (15). It has an interface described in a 239 computer-readable format, while other systems interact with the web service via 240 messages typically transmitted based on a universal markup language (e.g. eXtensible 241 Markup Language/XML) and other web-related standards. Web Service-Oriented 242 Architecture (SOA) relies on a collection of web services that communicate with each 243 other through the internet, supporting interoperability through common interfaces and 244 conveying data in a language commonly agreed by the community of data collectors 245 and users (12). The Web-SOA technology allows for the integration and 246 harmonization of all individual data sources and users of the observatory, addressing 247 thus one of the key challenges during its development and operation. 248
The basic user types of the observatory are defined as (13): 249 1) Internal User (observatory team or intranet user): full access rights for 250
developing GIS system; creating network’s graphic representation; mapping; building 251 reports and analyses; visiting library’s private area. 252
TRB 2014 Annual Meeting Paper revised from original submittal.

D. Tsamboulas, I. Karousos 8
2) Designated User (associated network users, port actors & public 253 authorities): partial access rights for updating database’s textual information; 254 requesting dynamic reports and analyses; viewing geo-data and maps; visiting 255 library’s private area. 256
3) Public User (web user): restricted access rights for viewing static reports 257 and analyses; viewing dynamic maps; visiting library’s public area. 258
An internal user is member of the core management team of the observatory, 259 so a public user cannot become internal, only a designated one. The criteria and 260 corresponding subscription charges for a public user are not defined yet. It is 261 envisaged that most of the basic information will be free of charge. 262
Regarding the typical access rights of users, the part labeled as public area is 263 where every website user is able to visit, but only view and download shared 264 documents and reports through the offered tools. On the other hand, the designated 265 users need to log in with a user name and password to visit the private area, where 266 they can enter or update data and explore additional information from the library. 267 Access to the library also depends on network security rules, so intranet users could 268 be treated as internal users with access to every document or dataset and extended 269 privileges to create, delete or modify library contents (see Figure 1). 270
271 272 273 274
275 276 277 278 279 280 281 282
FIGURE 1 Information flow diagram for reference library. 283 [Adapted from: “SEETO Technical Note 2: Information System” (13)] 284
285 The ability of the observatory users to discover and understand the offered 286
data will determine its user-friendliness and frequency of usage, and hence the degree 287 of its effectiveness. A data mining application helping users to find available raw 288 datasets, or a screening and filtering tool to determine which data will be useful for 289 analysis, can be used to facilitate users who download data to process them with their 290 own applications. Alternatively, there are stand-alone applications (i.e. widgets) that 291 can be embedded in a website (16), such as: search engines for metadata or keyword 292 searches, data navigator applications for queries and retrieval of formatted data, or 293 map-based tools with spatial context for users to choose and interpret the desired data. 294 Some users however prefer to visualize datasets before downloading them or they 295 lack technical skills or software. They should be allowed to preselect, filter or produce 296 specific features and analyses from the observatory’s datasets (12). Two software 297 tools that allow for data analysis and presentation are described below as part of the 298 observatory knowledge center. 299 300
Private Area
Public Area Web
Interface
TRB 2014 Annual Meeting Paper revised from original submittal.

D. Tsamboulas, I. Karousos 9
Geographic Information System 301 As far as the observatory interface and presentation abilities are concerned, one of its 302 basic parts is the GIS feature. The Geographic Information System refers to a 303 geodatabase, the main storage of graphical and textual geographical information. 304 Specific software products can be used to manage spatial information, to present this 305 information on the internet, and to provide and display proper query tools. The first 306 development phase involves the creation of the reference geodatabase based on the 307 collected information from the involved ports. A dedicated server is used for this task, 308 dimensioned to provide the resources required for the graphical and textual 309 information of the examined port and maritime system. After developing the GIS 310 software and identifying the analysis and reporting requirements, the basic steps are to 311 gather the initial textual data describing the ports, enter that information into the 312 system and create the geographic representation of the maritime network. The second 313 phase aims at sharing the information, so the system becomes accessible online and 314 mutual communication procedure is developed. . After establishing the website, it is 315 necessary to provide access to the GIS database for viewing information in interactive 316 maps and also a module allowing authorized users to update textual information and 317 produce reports and analyses according to their access privileges (13). 318 319 Forecast software 320 For the observatory’s volume forecasting feature, a software modeling tool that 321 supports transportation planning and modeling can be used. This module of the 322 Observatory is based on the typical “four step” model for transportation systems, 323 performed through a commercial software (like CUBE). The specific approach 324 followed includes the steps: i) trip generation, ii) trip distribution and modal split, iii) 325 trip estimation through transport logistics nodes, and iv) assignment of trips on the 326 network. The output of the model application is the traffic forecasting of unitized 327 cargo and the modal split, mainly maritime (e.g. container, RO-RO, RO-PAX). The 328 application can be done for any time horizon, provided a robust forecasting of the 329 economic variables (e.g. GDP). 330
For the purposes of the observatory, a module for freight modeling is included, 331 which will forecast cargo flows in tons by commodity type, by mode, per link and 332 direction, as well as by direct transportation links or supply chains, in cases where trip 333 chaining occurs. The application utilizes advanced modeling and GIS techniques, 334 statistics and comparisons, reports and high quality graphics. The forecasts for the 335 involved ports can be used to analyze and assess the impacts of infrastructure or 336 performance improvements and policy changes, and hence support the related 337 decision-makers (17). 338 339 Data characteristics 340 For the port operations observatory, two basic categories of data features are included 341 in the website: a) static features with unvarying or rarely updated data; and b) 342 dynamic features with interactive content often updated and actively customized by 343 authorized users. 344 345 APPLICATION 346 The above theoretical analysis of observatory contents and features is applied for 347 developing the “Observatory of Port Operations in the Mediterranean”. This is an all-348 inclusive information and knowledge center about the port operations and 349 administrative requirements, logistics procedures and customs formalities in the 350
TRB 2014 Annual Meeting Paper revised from original submittal.
D. Tsamboulas, I. Karousos 10
Mediterranean port system. A key objective is the recording and transparent sharing 351 of best practice solutions among all stakeholders, in order to extend the knowledge 352 dissemination in the wider port community. By the use of a specialized database and a 353 communication forum, the Observatory allows for the understanding of the technical 354 parameters related to port operations’ performance, while highlighting at the same 355 time strengths and weaknesses of the involved ports (2). The initial phase of setting 356 up and populating the observatory is under way. During the next operation phase, its 357 database will be updated appropriately depending on its specific contents (e.g. 358 periodic reports on indicators results, ad-hoc addition of data by new member-ports or 359 organizations, etc.) and on the periods that primary data is collected from other 360 sources (e.g. annually from EUROSTAT). 361
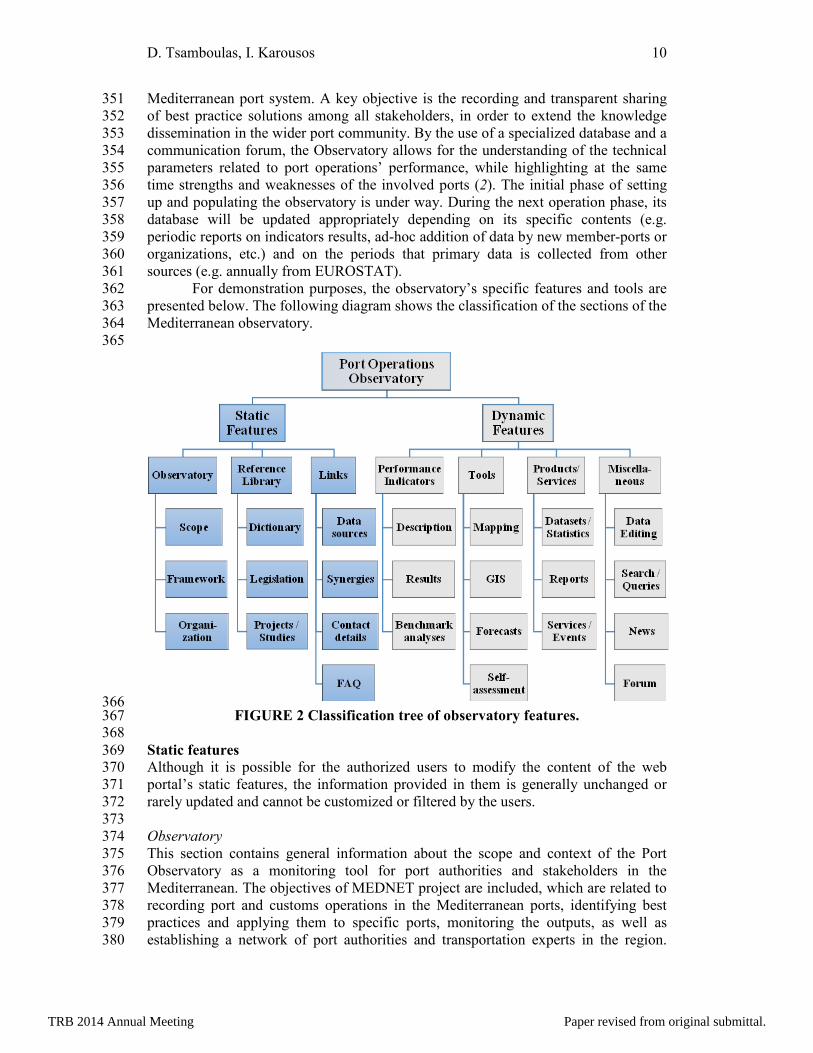
For demonstration purposes, the observatory’s specific features and tools are 362 presented below. The following diagram shows the classification of the sections of the 363 Mediterranean observatory. 364 365
366 FIGURE 2 Classification tree of observatory features. 367
368 Static features 369 Although it is possible for the authorized users to modify the content of the web 370 portal’s static features, the information provided in them is generally unchanged or 371 rarely updated and cannot be customized or filtered by the users. 372 373 Observatory 374 This section contains general information about the scope and context of the Port 375 Observatory as a monitoring tool for port authorities and stakeholders in the 376 Mediterranean. The objectives of MEDNET project are included, which are related to 377 recording port and customs operations in the Mediterranean ports, identifying best 378 practices and applying them to specific ports, monitoring the outputs, as well as 379 establishing a network of port authorities and transportation experts in the region. 380
TRB 2014 Annual Meeting Paper revised from original submittal.
D. Tsamboulas, I. Karousos 11
This section also contains the human and material resources (i.e. basic infrastructure 381 and equipment) used for developing the Observatory. 382 383 Reference library 384 This section offers data mining tools for utilization of the datasets stored in the 385 Observatory. It includes an online dictionary of port operations and processes with 386 definitions, descriptions and examples of all relevant terms used in the website (see 387 Table 2). There is also a catalog of European and national laws, regulations, 388 directives, papers etc. and a database of on-going or finished, European and national 389 projects, studies, observatories, etc., which are relevant to port operations and 390 maritime transportation sector. 391 392 TABLE 2 Classification of Port Operations and Processes in the Mediterranean 393 Category Operations &Processes Maritime and vessel related procedures (all vessels)
Pre-announcement of ship arrival Shipping traffic management Lock planning (if applicable) Berth allocation (request, selection, approval) Pilotage / Tug services Mooring Ship’s waste collection Ship supplies (victuals, bunkers, lubricants, deck stores etc.) Notification of ship departure
Passenger services (passenger and RO-PAX vessels)
Passenger disembarkation Security measures (ISPS implementation); immigration checks; Customs checks Internal transportation to rail/road connections Ticketing Emergency procedures Visual/dynamic passenger information systems; Wi-Fi and Website
Cargo handling procedures (freight vessels)
Containers (LO-LO): yard planning; quay crane allocation; cargo handling processes (loading/unloading); quay to storage area transfer and storage; container freight station operations; empty container handling and storage; organization and handling of multimodal transshipment, rail and IWW connections Containers (RO-RO) and trucks of RO-PAX vessels: yard planning; roll-on/roll-off operations; temporary parking of unaccompanied cargo; organization and handling of combined rail transportation Handling of hazardous goods Dry bulk handling and storage Liquid bulk terminal operations Chemical storage and handling
Administrative and logistics procedures (Customs and communication among port actors)
Customs procedures Gate-in/gate-out processes and inspections Administration processes (database operations, system statistics, back-up, etc.) Port authority processes (information of assessment charges, vessel positions, inspection reports, etc.); declaration of berthing dues per type and amount of cargo Communication and data exchange with shipping lines/shipbrokers, stevedores and clients Port safety and security; Coastguard obligations
TRB 2014 Annual Meeting Paper revised from original submittal.

D. Tsamboulas, I. Karousos 12
Category Operations &Processes Cargo related processes: booking notification; accounting/financial management (container invoicing, custom clearance, container release); information concerning container status Pre-planning of cargo stowage (incl. container bay list); exchange of stowage plans between shipping companies and terminal operator Data exchange with other ports (SafeSeaNet)
Environmental protection related procedures
Ballast water management Bilge waste management Greenfields Scrap recycling Solid waste management Waste/pollution notification about vessels
Port infrastructure related procedures
Management and maintenance of port property Construction activities Fencing and security installations and equipment Fumigation practices Dredging
Vessel inspection and maintenance operations
Underwater inspection and cleaning of vessels
Vessel repairs
394 Links 395 This section provides external web links to programs and studies that are relevant to 396 the Observatory (e.g. Eurostat, Commodity Trade Statistics Database, ETISplus 397 system, World Port Source, the World Port Index, etc.). Currently the ships locations 398 are presented through a link with the MarineTraffic.com. At this stage it is not 399 envisaged to provide real-time ship traffic data, disruptions or alternative routes, but 400 in the future several tools could be added, such as the Port Mapper developed by MIT 401 (18). A dedicated section presents the synergies that are identified and developed with 402 other observatories and projects. Other parts contain the contact details of the 403 Observatory support team, as well as Frequently Asked Questions providing 404 instructions on the full utilization of the Observatory. 405
406 Dynamic features 407 These components of the Observatory contain dynamic features, which are often or 408 periodically updated and enriched by authorized users, as well as interactive tools, 409 which allow users to search, customize or filter the information they seek. 410 411 Performance Indicators 412 This section presents the basic definitions and classification of the port-related 413 performance indicators, which are selected to determine and monitor the level of 414 service offered via the port operations. There is also a directory of periodic reports 415 and factsheets with the results achieved for each performance indicator, as well as a 416 database of best practices, comparative studies and benchmark analyses against 417 averages of European port sector or other geographical areas. 418 419 Tools 420 The mapping tools of the Observatory provide an extensive geodatabase including the 421 geographic representation of the Mediterranean maritime and intermodal network, 422
TRB 2014 Annual Meeting Paper revised from original submittal.

D. Tsamboulas, I. Karousos 13
current and forecasted cargo flows, ship routes between ports, vessel movements etc. 423 An interactive map of ports displays popup info-boxes about ports, their operations, 424 infrastructure, traffic volumes, etc. The forecast application is a modeling tool using 425 the Cube software, and in particular the Cube Cargo module, for cargo demand 426 studies through a commodity-based approach, namely estimates of goods flows by 427 commodity type and by mode, per link and direction. The Cube Cargo module for 428 transportation logistic nodes is applied after the modal choice step in order to further 429 partition the long-haul goods by direct transportation links and supply chains, in cases 430 of trip chaining (17). Another tool is the self-assessment feature of the observatory, 431 where port authorities and other stakeholders can perform comparative analyses with 432 other ports or sector averages based on their operations and other indicators. 433 Depending on their activity, a reward program can be set for ports contributing data to 434 the Observatory. 435 436 Products & Services 437 A directory is created with raw datasets, data analyses and metadata related to port 438 operations and performance indicators, as well as external links and data providers for 439 other sources of information. This part also includes another knowledge tool which is 440 an index of periodic or special reports and studies based on data collection, indicators 441 results, impact assessments, specific fields of performance, etc. A subsection lists the 442 relevant events and services offered to port professionals, decision makers, 443 universities, etc., such as industry workshops, training and dissemination activities, as 444 well as documentation and support for relevant planning and development projects. 445 446 Miscellaneous 447 The data editing section offers appropriate tools for importing, exporting and editing 448 data by authorized users. These tools are also interconnected with the reward program 449 for ports contributing information to the website. A search engine for the database is 450 also required to allow for specific queries and filtering of datasets, keywords, 451 metadata, results etc. Processing of real-time data is not currently within the scope, 452 but could be included in the future. There is also a regularly updated section with 453 news and announcements about the Port Observatory itself, any relevant initiatives, 454 new products, events or dissemination activities, etc. Another basic tool is the theme-455 classified discussion platform for communication among ports and other actors, 456 exchange of issues, opinions and knowledge. This tool may also be utilized by a 457 supervisory body consisting of sector’s experts (e.g. a “Mediterranean Ports Task 458 Force”), who can interact with the regional port community and assess new 459 developments, investment and funding options. 460 461 Observatory layout 462 For purposes of demonstrating the implementation of the Port Operations 463 Observatory, this section provides a few sample snapshots of the preliminary user 464 interface and contents of the observatory’s web-based platform. As the work is 465 currently under way, the presented structure of the features may change in the future. 466
The webpage of the online dictionary presents the basic categories of the port 467 operations (Figure 3), where the user is able to select one of them, view the contents 468 of each category and open the detailed definition of each item in a new webpage. 469
470
TRB 2014 Annual Meeting Paper revised from original submittal.

D. Tsamboulas, I. Karousos 14
471 FIGURE 3 Classification of port operations. 472
473 The Legislation section (Fig. 4) has a similar interface with a tabular structure of the 474 respective databases, where each line item can be selected in order to open its detailed 475 contents in a new page. 476 477
478 FIGURE 4 Legislation directory of port operations observatory. 479
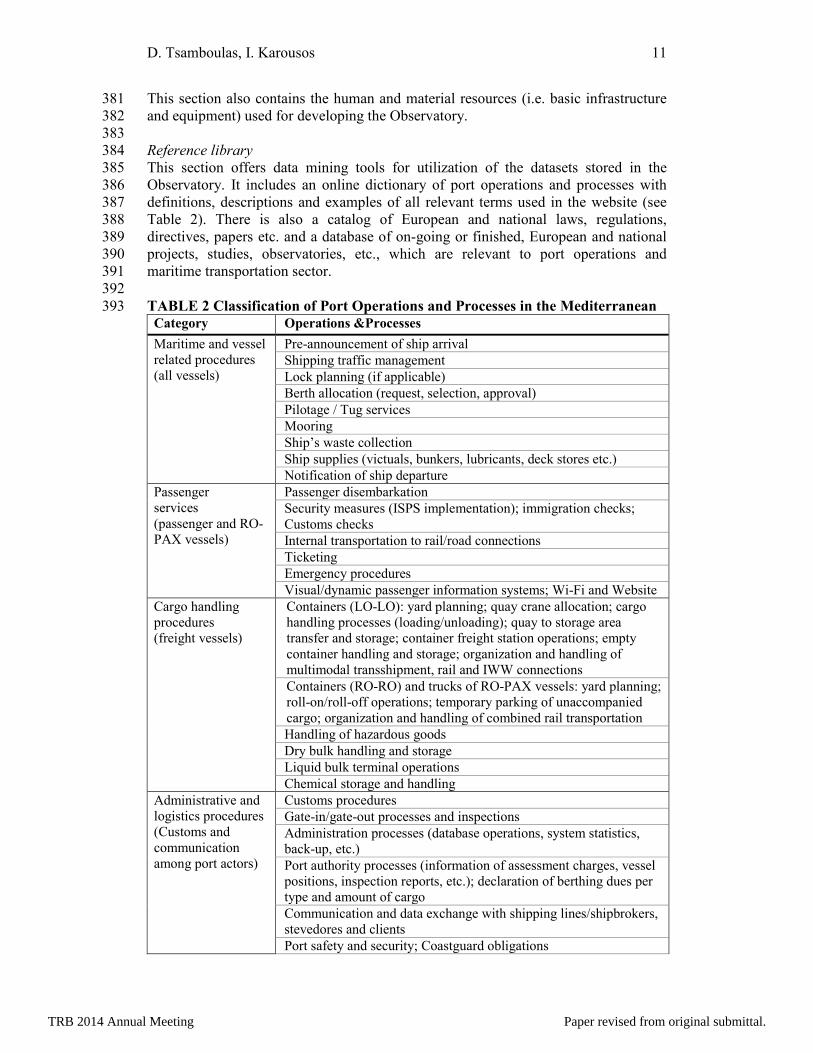
480 Figure 5 shows the mapping tool of the Mediterranean ports, where an information 481 box pops up when a port is selected to display basic details of the Port Authority, as 482 well as a link to open a new page with more detailed description of the port, its 483 operations and facilities. 484 485
TRB 2014 Annual Meeting Paper revised from original submittal.
D. Tsamboulas, I. Karousos 15
486 FIGURE 5 Mapping tool wit pop-up info-box. 487
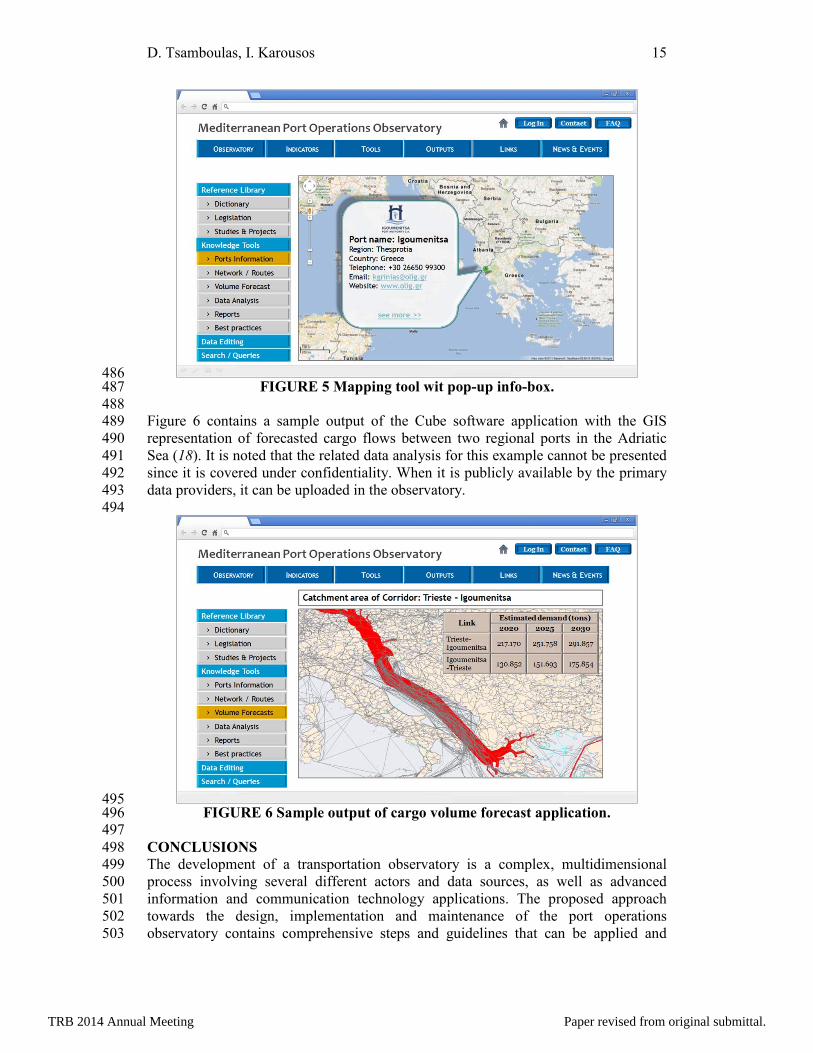
488 Figure 6 contains a sample output of the Cube software application with the GIS 489 representation of forecasted cargo flows between two regional ports in the Adriatic 490 Sea (18). It is noted that the related data analysis for this example cannot be presented 491 since it is covered under confidentiality. When it is publicly available by the primary 492 data providers, it can be uploaded in the observatory. 493 494
495 FIGURE 6 Sample output of cargo volume forecast application. 496
497 CONCLUSIONS 498 The development of a transportation observatory is a complex, multidimensional 499 process involving several different actors and data sources, as well as advanced 500 information and communication technology applications. The proposed approach 501 towards the design, implementation and maintenance of the port operations 502 observatory contains comprehensive steps and guidelines that can be applied and 503
TRB 2014 Annual Meeting Paper revised from original submittal.
D. Tsamboulas, I. Karousos 16
increase the usefulness and effectiveness of its features. Due to the effort’s 504 complexity, the sequence of the implementation actions is not unambiguous and 505 depends on the desirable objectives and requirements. For instance, the sustainability 506 and promotion steps may start earlier in the process, so that the synergies with 507 possible data sources, port actors and other observatories are ensured before the 508 definition of the data and user requirements. The ultimate vision is to create an all-509 inclusive platform for the observatory which will function as an online one-stop shop 510 for decision makers to find most of the desired information in one place. Such a 511 facility can complement or even replace research studies, site visits and surveys as an 512 alternative, more efficient source of performance-based statistics, current or forecast 513 traffic flows, information on port and customs’ regulatory framework, plans for 514 business and marketing development, infrastructure expansion or new services, etc. 515
A significant advantage of the proposed guide for the Observatory 516 development is its transferability to other comparable sea regions (e.g. Mexican Gulf, 517 Caribbean Sea, etc.) thanks to the interregional and modular character of the 518 observatory. For example, it might support the U.S. Maritime Administration in its 519 current project to develop an automated system that calculates regional and national 520 container port and terminal productivity indices on an on-going basis. Performance 521 information is used to monitor the transportation system and demonstrate that 522 decisions based on measures lead to identifying, funding and efficiently delivering the 523 most effective projects (20). The proposed observatory structure moreover allows for 524 port stakeholders and public authorities to be added to the observatory scheme at a 525 later stage and start monitoring the performance of their operations and procedures. 526
527 ACKNOWLEDGEMENT 528 The contents of this paper are partly based on the implementation of the project: 529 “Mediterranean Network for Custom Procedures and Simplification of Clearance in 530 Ports (MEDNET)”, which is co-funded by Program MED of the European 531 Commission. 532 533 REFERENCES 534 1. Tsamboulas D. and D. Korizis. "Transport infrastructure Monitoring Centers for 535
South Eastern Europe", presented at the 31st ASECAP Study and Information 536 Days, PortRoz, Slovenia, May 2003. 537
2. Mediterranean Network for Custom Procedures and Simplification of Clearance 538 in Ports (MEDNET) Project Website: http://www.mednetproject.eu/. Accessed 539 May 10, 2013. 540
3. Brooks, M. R., T. Schellinck and A. A. Pallis (2011). A systematic approach for 541 evaluating port effectiveness. Maritime Policy & Management: The flagship 542 journal of international shipping and port research, 38:3, 315-334. 543
4. Strategic Work Programme 2012-2014, Final Report, November 2011. SEETO 544 Project. http://www.seetoint.org/library/strategic-documents/. Accessed May 9, 545 2013. 546
5. MEMO Project Assessment of the technical functionalities, Final Report 5.1. 547 March 2012. http://www.memo-med.net/index.php?option=com_content&view 548 =article&id=75&Itemid=94&dir=JSROOT%2Fdownloads/MEMO+STUDIES. 549 Accessed May 10, 2013. 550
6. PPRISM Project Deliverable Report of Work Package 1: Pre-Selection of an 551 initial set of indicators, Oct. 2010. http://pprism.espo.be/ProjectResults.aspx 552 Accessed May 10, 2013. 553
TRB 2014 Annual Meeting Paper revised from original submittal.

D. Tsamboulas, I. Karousos 17
7. ASSEMBLING. Project. Summary Report, May 1, 2001. 554 ftp://ftp.cordis.europa.eu/pub/transport/docs/summaries/strategic_assembling_rep555 ort.pdf. Accessed May 10, 2013. 556
8. Freight Transport and Logistics Regional Observatory in Latin America and the 557 Caribbean website: http://kmpfl.devgateway.org/node/1925?language=en. 558 Accessed May 9, 2013. 559
9. Transport Observatory Project (TOP). Report on: Scaling up Corridor Monitoring 560 for Informed Decisions, April 2013. Transit Transport Coordination Authority of 561 the Northern Corridor (TTCA-NC). http://top.ttcanc.org/ncttca/downloads.php. 562 Accessed on May 30, 2013. 563
10. Willis Zdenka, Integrated Ocean Observing System: Our Eyes on the Oceans 564 Coasts and Great Lakes. Transportation Research Board (http://ioos.noaa.gov). 565
11. PPRISM Project. Report with general recommendations for the set-up of a future 566 European Port Observatory. March 2012. 567 http://pprism.espo.be/ProjectResults.aspx. Accessed May 10, 2013. 568
12. Horsburgh, J. S., D. G. Tarboton, D. R. Maidment and I. Zaslavsky (2011). 569 Components of an environmental observatory information system. Computers & 570 Geosciences, Volume 37, Issue 2, February 2011, pp. 207-218. 571
13. SEETO Project. Technical Note 2: Information System, September 2005. 572 http://www.seetoint.org/library/reports-technical-notes/. Accessed May 9, 2013. 573
14. Tsamboulas, D.A. and G.K. Mikroudis (2006). TRANS-POL: A mediator 574 between transportation models and decision makers’ policies. Decision Support 575 Systems, vol. 42, issue 2, November 2006, pp. 879–897, ISSN 0167-9236. 576
15. Web Services Glossary, W3C Working Group Note 11. Editors: H. Haas, A. 577 Brown. February 2004. http://www.w3.org/TR/ws-gloss/. Accessed June 12, 578 2013. 579
16. Packaged Web Apps (Widgets) - Packaging and XML Configuration (2nd 580 Edition), Editor: M. Cáceres, November 2012. http://www.w3.org/TR/widgets/. 581 Accessed June 12, 2013. 582
17. Cube | Citilabs website: http://www.citilabs.com/products/cube. Accessed June 583 27, 2013. 584
18. Rice, J., K. Trepte, M. Mattingley. CSR Port Resilience Report - The National 585 Center for Secure and Resilient Maritime Commerce. MIT Center for 586 Transportation and Logistics. http://ctl.mit.edu/sites/default/files/ 587 Port_Resilience_Review_Meeting%20v8.pdf. Accessed October 10, 2013. 588
19. Tsamboulas, D., A. M. Lekka, A. Rentziou (2013). Development of a Motorways 589 of the Sea Multicountry Transportation Network. Transportation Research 590 Record: Journal of the Transportation Research Board. Vol. 2330, Issue 1, 2013-591 12-01, pp. 9-15. 592
20. Infrastructure Development and Congestion Mitigation, Maritime Administration, 593 U.S. Department of Transportation webpage: http://www.marad.dot.gov/ 594 ports_landing_page/infra_dev_congestion_mitigation/system_data_information/S595 ys_Data_Info.htm. Accessed July 5, 2013. 596
TRB 2014 Annual Meeting Paper revised from original submittal.