Structure and Property Development of Poly(3- …€¦ · · 2012-07-13hexylthiophene) Organogels...
13
Structure and Property Development of Poly(3- hexylthiophene) Organogels Probed with Combined Rheology, Conductivity and Small Angle Neutron Scattering Gregory M. Newbloom ‡ , Katie M. Weigandt ‡ Department of Chemical Engineering, University of Washington, Box 351750, Seattle, Washington 98195-1750, United States and Danilo C. Pozzo* * E-mail: [email protected]. ‡These authors contributed equally. SUPPORTING INFORMATION Scattering Length Density. The scattering length density can be easily calculated when both the molecular formula and density of a material are precisely known: 1 i n c SLD i Solvent m b v ρ = = ∑ (S1) where SLD Solvent ρ is the scattering length density, i c b is the bound coherent scattering length of each atom in the molecule and m v is the molecular volume. The mass density ( m Solvent ρ ) is directly related to molecular volume and therefore the temperature dependence of mass density will play Electronic Supplementary Material (ESI) for Soft Matter This journal is © The Royal Society of Chemistry 2012
Transcript of Structure and Property Development of Poly(3- …€¦ · · 2012-07-13hexylthiophene) Organogels...

Structure and Property Development of Poly(3-
hexylthiophene) Organogels Probed with Combined
Rheology, Conductivity and Small Angle Neutron
Scattering
Gregory M. Newbloom‡, Katie M. Weigandt‡
Department of Chemical Engineering, University of Washington, Box 351750, Seattle,
Washington 98195-1750, United States
and Danilo C. Pozzo*
* E-mail: [email protected]. ‡These authors contributed equally.
SUPPORTING INFORMATION
Scatter ing Length Density. The scattering length density can be easily calculated when both
the molecular formula and density of a material are precisely known:
1i
n
cSLD iSolvent
m
b
vρ ==
∑
(S1)
where SLDSolventρ is the scattering length density,
icb is the bound coherent scattering length of each
atom in the molecule and mv is the molecular volume. The mass density ( mSolventρ ) is directly
related to molecular volume and therefore the temperature dependence of mass density will play
Electronic Supplementary Material (ESI) for Soft MatterThis journal is © The Royal Society of Chemistry 2012

a role in the scattering length density. The mass density of d10-pxylene, d8-toluene and d6-
benzene was measured as a function of temperature using an Anton Paar DMA 5000 Density
Meter and then converted to scattering length density, seen in Figure S2. This temperature
dependence was accounted for during SANS data fitting to ensure the accuracy of other fitting
parameters.
Specific Surface Area Analysis. The Porod analysis can be applied to the scattering of any
two-phase system with a sharp interface that leads to an 4( )I q q−∝ dependence at high-q. The
evolving P3HT gel is effectively a three-component system containing solvent, P3HT fibers and
dissolved P3HT chains. In order to find the specific surface area (Sv
The mass balance presented in Equation 1 of the paper can then be utilized to determine the
fraction of polymer in fiber form (
) of the P3HT fiber, the
scattering due to the dissolved polymer must first be subtracted. The scattering of the fully
dissolved polymer, at elevated temperatures (40 ºC to 80 ºC), was fit with a model for polymers
with excluded volume interactions to determine the molecular weight and conformation in
solution.
fΨ ):
2 2( ) ( ) ( ) (1 )( ) ( )v f PP PP v f PExV PExVI q P q P qφ ρ φ ρ= Ψ ∆ + −Ψ ∆ (1)
which means that the pre-factor (1 )f−Ψ can also be utilized to determine the fraction of P3HT
in dissolved form. The model for polymers with excluded volume interactions can be scaled by
this factor and subtracted from the combined SANS profile to yield the scattering corresponding
only to P3HT fibers.
Figure S3a shows the SANS profile for 30 mg/mL P3HT in toluene at a specific temperature
(10.6 ºC) during the gelation of P3HT. The fraction of P3HT in fiber from ( fΨ ) was determined
Electronic Supplementary Material (ESI) for Soft MatterThis journal is © The Royal Society of Chemistry 2012

to be 0.419 by fitting Equation 1 to the SANS profile. This leads to a dissolved fraction (1 )f−Ψ
of 0.581 at the same temperature. The total scattering as a function of q due to the dissolved
polymer alone can be determined by scaling the model for polymers with excluded volume
interactions (Equation 3) by the dissolved fraction. The result can be seen in Figure S3a.
1 2 22 2
0
( , , , ) 2 (1 )exp6PExV
q aP q n a d xx n xν νν
= − −
∫ (3)
The 1D SANS profile is a linear combination of the dissolved polymer phase and the fiber
phase, so we can directly subtract the scaled dissolved polymer model from the “fiber +
dissolved” polymer scattering to generate the scattering due to P3HT fibers alone. This
subtraction is shown to generate the expected 4( )I q q−∝ dependence for P3HT fibers, as seen in
Figure S3a. We find this same result to be true at earlier stages in gelation, to fΨ as low as
0.03. This behavior is shown as a function of gelation progress (i.e. temperature) in Figure S3b
which highlights the 4( )I q q−∝ dependence.
After the dissolved polymer is subtracted, the scattering invariant (Q) can be utilized to
directly calculate the fiber volume fraction ( fiberφ ).
( )( )22 2
0( ) 2 1fiber fiber PPQ I q q dq π φ φ ρ
∞= ⋅ = − ∆∫
1, 2
(S2)
The invariant can be utilized with minimal assumptions and regardless of the shape of the
scattering object. At low-q, the slope associated with the network structure of P3HT gels (seen in
Figure S3a) has to be extrapolated to q = 0 but the extrapolation only accounts for < 0.5% of the
total scattering invariant (Q). At high-q, the I ∝ q-4 dependence associated with the Porod slope
(seen in Figure S2) is also extrapolated to q → ∞ and this accounts for ~ 7% of the total
invariant. This means that ~ 93% of the scattering invariant (Q) is directly accounted for in the
Electronic Supplementary Material (ESI) for Soft MatterThis journal is © The Royal Society of Chemistry 2012

SANS profile, leading to low error in the calculation of the volume fraction of fibers ( fiberφ ).
There is also, on average, a less than 10% difference between fiberφ calculated from the
scattering invariant (Q) and fiberφ calculated from the form factor fitting ( fiber v fφ φ= ⋅Ψ ). The
small differences between these independent determinations of fiberφ support the accuracy of the
Sv
SANS Molecular Weight Determination. The weight-averaged molecular weight (M
calculations.
w) can
be directly calculated from SANS of dissolved polymer chains (Equation S3):
( )2
32
(0)( )
mA P HT
wPExV
N IM
cρ
ρ
⋅ ⋅=
⋅ ∆
3
(S3)
where NA 3mP HTρ is Avogadro’s number, c is the concentration of dissolved P3HT in solution, is
the mass density of P3HT chains (1.1 g/cm3
PExVρ∆
), I(0) is the absolute-scaled scattering intensity at q
= 0 and is the scattering contrast between solvent and dissolved polymer chains.
Impedance Spectroscopy Fitting. A frequency sweep, from 20 – 2,000,000 Hz, of the fully
developed gel phase was performed between the stainless steel parallel plate electrodes of the
dielectric-rheology experimental setup. The linearized impedance spectroscopy is presented in
Figure 7b of the main text. These data sets are fit with a simple equivalent circuit: a resistor (Rs)
in series with a parallel resistor (Rp
) and constant phase element capacitor (CPE). This
equivalent circuit leads to the following equation:
( )p
s
RZ R
j ατ ω= +
⋅ ⋅ (S4)
where τ is a constant in units 2 1F cm sα− − and α is the constant phase element.4, 5 The resistance
(Rp) can be converted to dc conductivity (σ) using Equation S5, where d is the distance between
Electronic Supplementary Material (ESI) for Soft MatterThis journal is © The Royal Society of Chemistry 2012

electrodes and A is the surface area of the electrode. The fitting results are summarized in Table
S1.
1
p
dR A
σ = ⋅ (S5)
REFERENCES
1. G. M. Newbloom, K. M. Weigandt and D. C. Pozzo, Macromolecules, 2012, 45, 3452-
3462.
2. J. J. Richards, K. M. Weigandt and D. C. Pozzo, J. Colloid Interface Sci,. 2011, 364, 341-
350.
3. J. Plestil, H. Pospisil, Y. M. Ostanevich and G. Degovics, J. of Appl. Crystallogr., 1991,
24, 659-664.
4. J.-B. Jorcin, M. E. Orazem, N. Pébère and B. Tribollet, Electrochim. Acta, 2006, 51,
1473-1479.
5. A. Lasia, Impedance of Porous Electrodes. In Modern Aspects of Electrochemistry; R. E.
White, B. E. Conway and J. O. Bockris (Eds.); Kluwer Academic/Plenum Publishers:
New York, 1999, pp 143.
Electronic Supplementary Material (ESI) for Soft MatterThis journal is © The Royal Society of Chemistry 2012

SUPPORTING FIGURES
Figure S1. AC voltage sweep at 2 kHz of 30 mg/mL P3HT organogels formed in different
organic solvents. Dashed lines represent the VAC
utilized for dielectric-SANS (0.2 V) and
dielectric-rheology (0.6 V) experiments.
Electronic Supplementary Material (ESI) for Soft MatterThis journal is © The Royal Society of Chemistry 2012
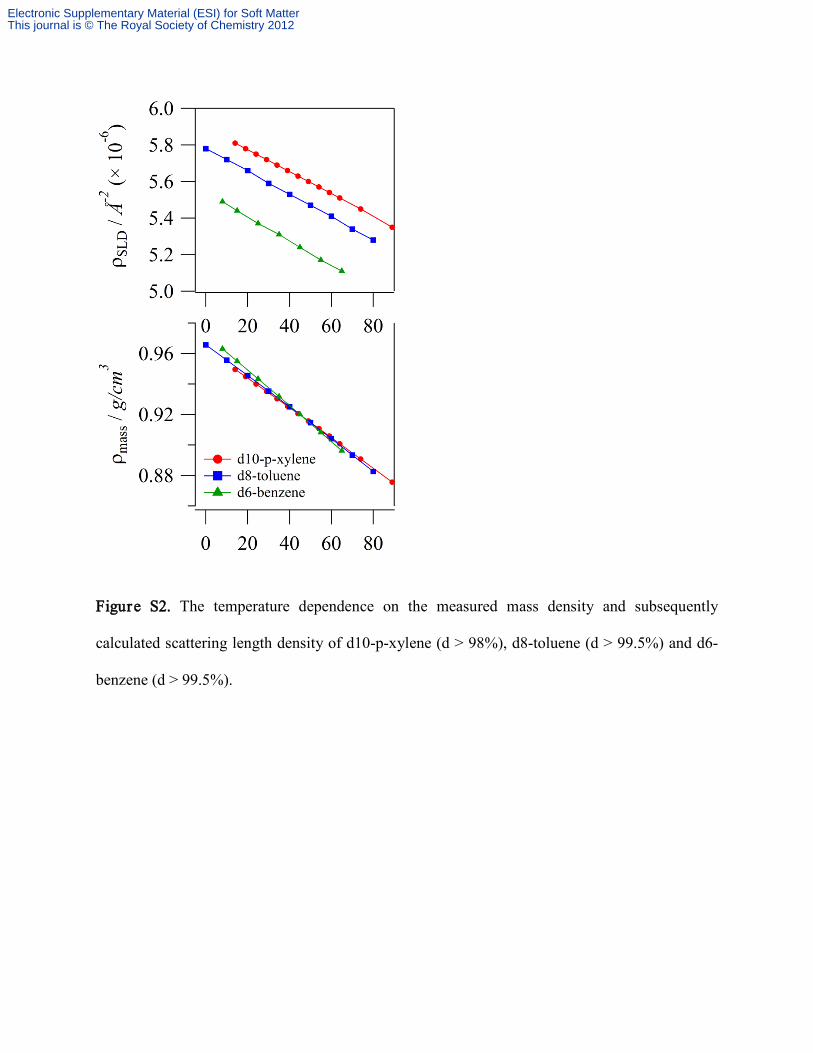
Figure S2. The temperature dependence on the measured mass density and subsequently
calculated scattering length density of d10-p-xylene (d > 98%), d8-toluene (d > 99.5%) and d6-
benzene (d > 99.5%).
Electronic Supplementary Material (ESI) for Soft MatterThis journal is © The Royal Society of Chemistry 2012
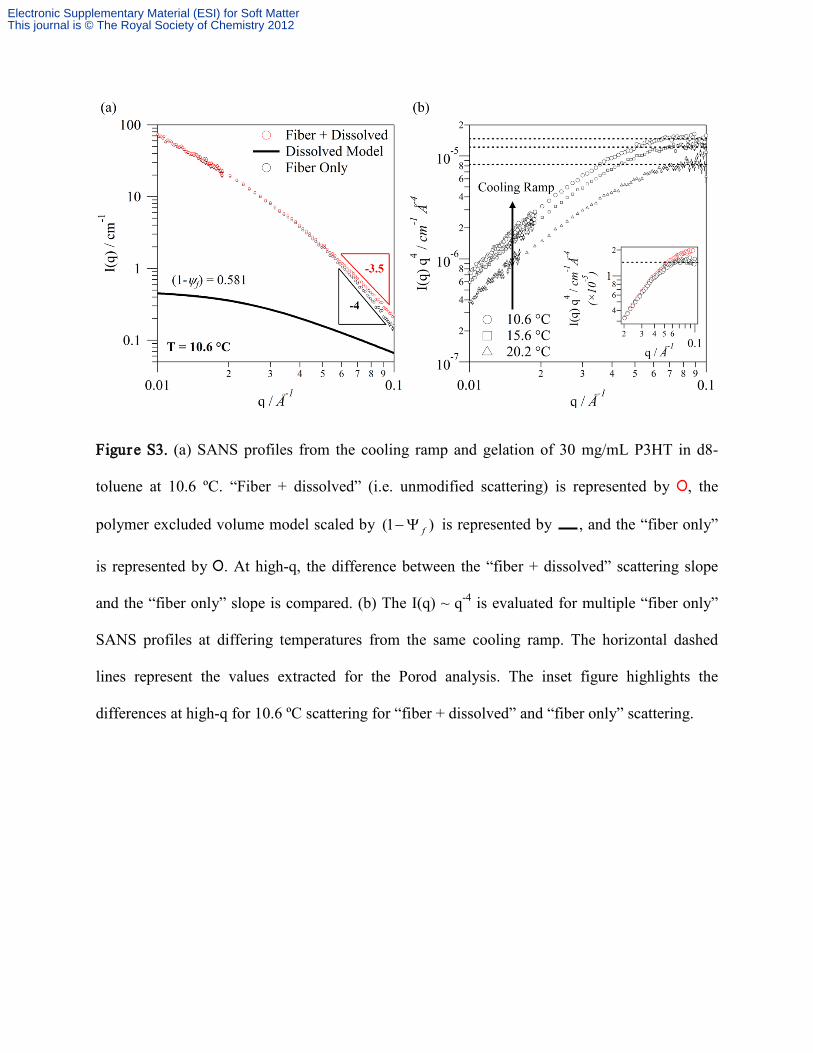
Figure S3. (a) SANS profiles from the cooling ramp and gelation of 30 mg/mL P3HT in d8-
toluene at 10.6 ºC. “Fiber + dissolved” (i.e. unmodified scattering) is represented by , the
polymer excluded volume model scaled by (1 )f−Ψ is represented by , and the “fiber only”
is represented by . At high-q, the difference between the “fiber + dissolved” scattering slope
and the “fiber only” slope is compared. (b) The I(q) ~ q-4
is evaluated for multiple “fiber only”
SANS profiles at differing temperatures from the same cooling ramp. The horizontal dashed
lines represent the values extracted for the Porod analysis. The inset figure highlights the
differences at high-q for 10.6 ºC scattering for “fiber + dissolved” and “fiber only” scattering.
Electronic Supplementary Material (ESI) for Soft MatterThis journal is © The Royal Society of Chemistry 2012
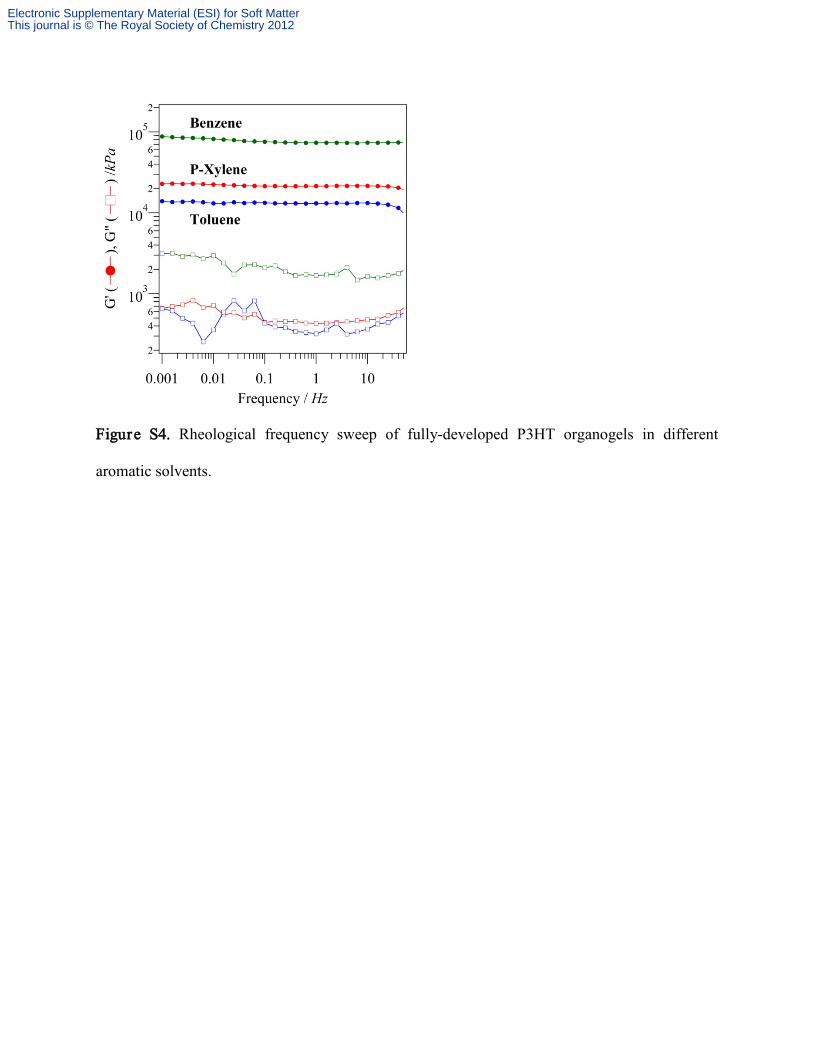
Figure S4. Rheological frequency sweep of fully-developed P3HT organogels in different
aromatic solvents.
Electronic Supplementary Material (ESI) for Soft MatterThis journal is © The Royal Society of Chemistry 2012
.
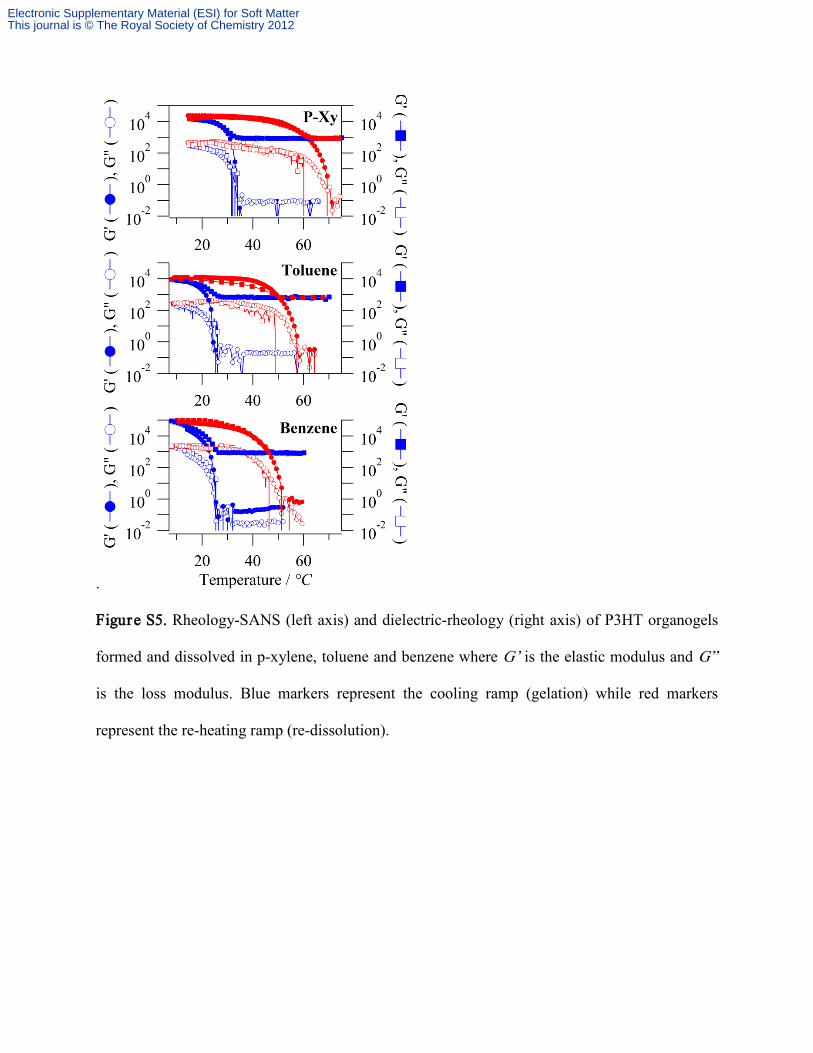
Figure S5. Rheology-SANS (left axis) and dielectric-rheology (right axis) of P3HT organogels
formed and dissolved in p-xylene, toluene and benzene where G’ is the elastic modulus and G”
is the loss modulus. Blue markers represent the cooling ramp (gelation) while red markers
represent the re-heating ramp (re-dissolution).
Electronic Supplementary Material (ESI) for Soft MatterThis journal is © The Royal Society of Chemistry 2012
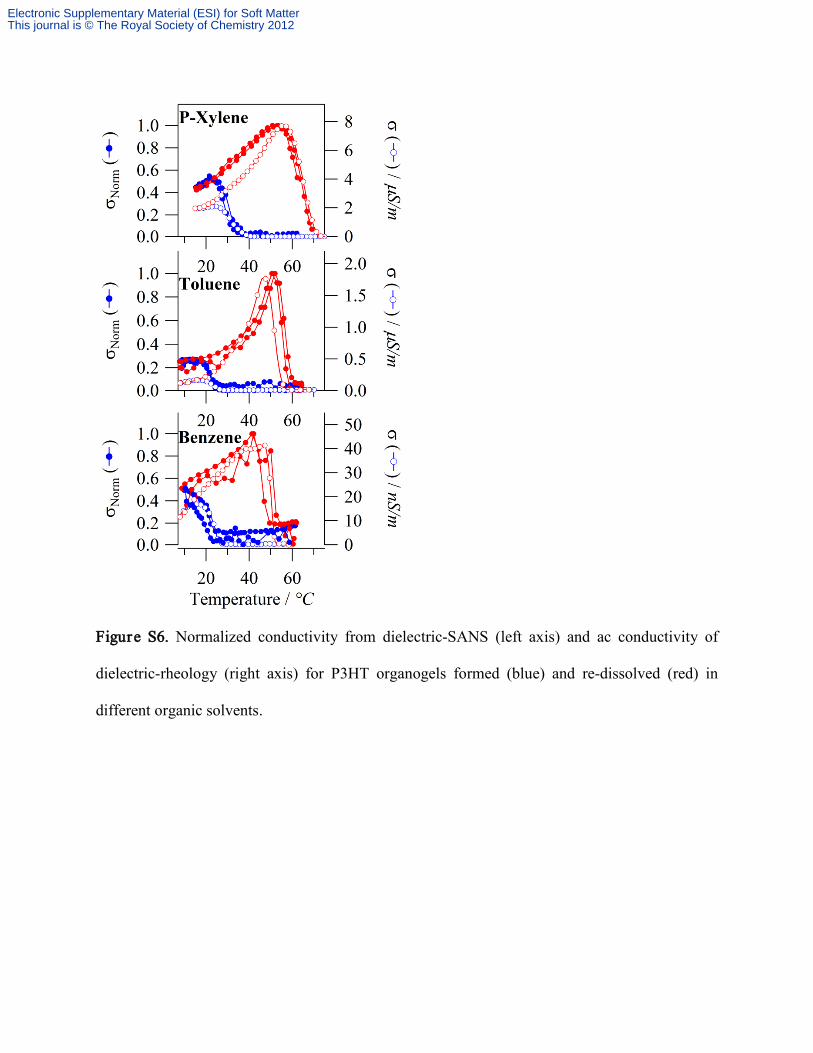
Figure S6. Normalized conductivity from dielectric-SANS (left axis) and ac conductivity of
dielectric-rheology (right axis) for P3HT organogels formed (blue) and re-dissolved (red) in
different organic solvents.
Electronic Supplementary Material (ESI) for Soft MatterThis journal is © The Royal Society of Chemistry 2012

Figure S7. Temperature dependent rheology of a 30 mg/mL gel in toluene run under three
separate measurement conditions. The γ = 0.25%, f = 1 Hz oscillation data corresponds to the
measurements reported in the main text. The transition temperatures and curve shapes are largely
independent of the measurement conditions. When using the higher frequency (5 Hz) the
apparent modulus in the dissolved state is also higher due to instrument inertia.
Electronic Supplementary Material (ESI) for Soft MatterThis journal is © The Royal Society of Chemistry 2012

Table S1. Equivalent circuit fitting results of electrochemical impedance spectroscopy from fully
developed 30 mg/mL P3HT organogels formed in different organic solvents. This linearized
impedance data is fit with Equation S4.
P-Xylene Toluene Benzene
Rs (Ω) 1110 762 47
Rp 0.160 (MΩ) 1.155 58.89
τ ( 2 1F cm sα− − ) 1.00 × 10⁻¹⁰ 3.42 × 10⁻¹¹ 2.30 × 10
α
-11
0.862 0.944 0.991
Electronic Supplementary Material (ESI) for Soft MatterThis journal is © The Royal Society of Chemistry 2012