
Structure and Properties of Neat Liquids Using Nonadditive ... · PDF fileStructure and...
12
6208 J. Phys. Chem. 1995, 99, 6208-6219 Structure and Properties of Neat Liquids Using Nonadditive Molecular Dynamics: Water, Methanol, and N-Methylacetamide James W. Caldwell and Peter A. Kollman” Department of Pharmaceutical Chemistry, University of Califomia, San Francisco, Califomia 94143-0446 Received: October 4, 1994; In Final Form: February 2, 1995@ We present the first nonadditive molecular dynamics simulation of organic liquids, studying the structure and energetics of methanol and N-methylacetamide. Beginning with an additive potential that reproduces the structure and energetics of these liquids quite well, we have shown that one can simply reduce the atomic charges by a scale factor in the range of 0.88-0.90 and add isotropic atomic polarizabilities to create nonadditive models that also quite accurately reproduce the structures and energies of these liquids. Thus, we have a clear pathway for the general inclusion of nonadditive effects for organic and biological molecules. Introduction Force fieldmolecular mechanics methods are proving to be very useful and powerful in the study of condensed phase systems. They can complement and often go beyond experiment in the molecular detail and insight that they offer. However, given their approximate nature and general application within the context of classical rather than quantum mechanics, it is essential that the results emerging from them be checked against experiment as often as possible. The philosophy of the OPLS model’ illustrates this, in that it has been carefully calibrated to reproduce the density and enthalpy of vaporization of organic liquids, and then these parameters have been successfully used in studies of heterogeneous systems. The OPLS model for intermolecular interactions has also been combined with the intramolecular parameters of Weiner et aL2 to derive a force field for peptides and proteinsla that has proven useful in studying such systems. We have been developing a “second-generation’’force field3 to follow up the efforts of Weiner et aL2 and agree with the OPLS approach on the usefulness of studying organic liquids to help in devising and assessing force field parameters. For example, we have canied out Monte Carlo simulations on liquid hydrocarbons to derive all atom van der Waals parameters for aliphatic carbons and hydrogens bonded to carbon4 and used molecular dynamics on CF4 and CHF3 to derive van der Waals parameters for fluorine and hydrogens in various bonding environment^.^ Many of our differences with the OPLS method are only in the small details, but the major one is our conviction that the atomic partial charges for the model should come from quantum mechanical calculations6rather than experiment. This conviction is based both on the view that such a model is more general and generalizable than a purely empirical approach to deriving charges7 and on the luckylfortuitous properties of the 6-31G* basis set. Empirical charge models of polar liquids automatically include inherent polarization of the molecules relative to their gas phase charge distribution in an average way. Thus, they lead to charge distributions for molecules with dipole moments enhanced over gas phase values. The 6-31G* basis set enhances polarity by about the same magnitude relative to gas phase moments as does the OPLS’ model. Hence, charges derived by fitting to the electrostatic potential using a 6-31G* basis set @Abstractpublished in Advance ACS Abstracts, March 15, 1995. 0022-365419512099-6208$09.00/0 should lead to reasonable models for partial charges for molecules. Some support of this comes from the very good representation of the relative free energies of benzene, anisole, and trimethoxybenzene8 calculated using such a model. The development of RESP (restrained electrostatic potential) model has been an important improvement over the standard approach to the derivation of charges using electrostatic potentials, in that it offers improvement in the treatment of intramolecular properties while retaining the good description of intermolecular interaction^.^.'^ A key guidepost in the development of the RESP model was the reproduction of the aqueous free energy of solvation of methanol (MEOH) and N-methylacetamide (NMA) in TIP3P water. This involved extensive testing of which van der Waals parameters were appropriate to use with these charges. The detailed description of these are given below. However, calculating AGsolvauon in good agreement with experiment is only a single test of a model; the calculation of the density and enthalpy of the molecular liquids is a more challenging test. Thus, a first goal of this paper is to present the results of liquid simulations on methanol and N-methyl- acetamide using the same effective two-body additive potential used in the solvation free energy calculations and to compare to experiment. It is, however, clear that effective two-body potentials have limitations. These limitations would be expected to be most severe for molecules of high chargelpolarity at interfaces, since in these cases, the assumption of a single “average polarized” charge distribution for the molecule would be least accurate. We have developed a nonadditive model for waterlla that reduces the partial charges of the atoms and adds isotropic atomic polarizabilities resulting in a similarly accurate descrip- tion of the liquid compared to two-body additive models. A study of ion-water clusters with such a model led to new and interesting insights into their structure and energetics.’ lb How- ever, to prove the utility and generality of such nonadditive models, they must be extended to more complex molecules. Thus, the second goal of this study is to apply the same approach to deriving the nonadditive model for water to the more complex molecules methanol and N-methylacetamide. Encouragingly, both the additive and nonadditive models, with very similar electrostatic scale factors for all three molecules (to derive charges for the nonadditive models), lead to good agreement with experimental densities and enthalpies of vaporization. 1995 American Chemical Society
Transcript of Structure and Properties of Neat Liquids Using Nonadditive ... · PDF fileStructure and...

6208 J. Phys. Chem. 1995, 99, 6208-6219
Structure and Properties of Neat Liquids Using Nonadditive Molecular Dynamics: Water, Methanol, and N-Methylacetamide
James W. Caldwell and Peter A. Kollman” Department of Pharmaceutical Chemistry, University of Califomia, San Francisco, Califomia 94143-0446
Received: October 4, 1994; In Final Form: February 2, 1995@
We present the first nonadditive molecular dynamics simulation of organic liquids, studying the structure and energetics of methanol and N-methylacetamide. Beginning with an additive potential that reproduces the structure and energetics of these liquids quite well, we have shown that one can simply reduce the atomic charges by a scale factor in the range of 0.88-0.90 and add isotropic atomic polarizabilities to create nonadditive models that also quite accurately reproduce the structures and energies of these liquids. Thus, we have a clear pathway for the general inclusion of nonadditive effects for organic and biological molecules.
Introduction
Force fieldmolecular mechanics methods are proving to be very useful and powerful in the study of condensed phase systems. They can complement and often go beyond experiment in the molecular detail and insight that they offer. However, given their approximate nature and general application within the context of classical rather than quantum mechanics, it is essential that the results emerging from them be checked against experiment as often as possible. The philosophy of the OPLS model’ illustrates this, in that it has been carefully calibrated to reproduce the density and enthalpy of vaporization of organic liquids, and then these parameters have been successfully used in studies of heterogeneous systems. The OPLS model for intermolecular interactions has also been combined with the intramolecular parameters of Weiner et aL2 to derive a force field for peptides and proteinsla that has proven useful in studying such systems.
We have been developing a “second-generation’’ force field3 to follow up the efforts of Weiner et aL2 and agree with the OPLS approach on the usefulness of studying organic liquids to help in devising and assessing force field parameters. For example, we have canied out Monte Carlo simulations on liquid hydrocarbons to derive all atom van der Waals parameters for aliphatic carbons and hydrogens bonded to carbon4 and used molecular dynamics on CF4 and CHF3 to derive van der Waals parameters for fluorine and hydrogens in various bonding environment^.^ Many of our differences with the OPLS method are only in the small details, but the major one is our conviction that the atomic partial charges for the model should come from quantum mechanical calculations6 rather than experiment. This conviction is based both on the view that such a model is more general and generalizable than a purely empirical approach to deriving charges7 and on the luckylfortuitous properties of the 6-31G* basis set.
Empirical charge models of polar liquids automatically include inherent polarization of the molecules relative to their gas phase charge distribution in an average way. Thus, they lead to charge distributions for molecules with dipole moments enhanced over gas phase values. The 6-31G* basis set enhances polarity by about the same magnitude relative to gas phase moments as does the OPLS’ model. Hence, charges derived by fitting to the electrostatic potential using a 6-31G* basis set
@Abstract published in Advance ACS Abstracts, March 15, 1995.
0022-365419512099-6208$09.00/0
should lead to reasonable models for partial charges for molecules. Some support of this comes from the very good representation of the relative free energies of benzene, anisole, and trimethoxybenzene8 calculated using such a model. The development of RESP (restrained electrostatic potential) model has been an important improvement over the standard approach to the derivation of charges using electrostatic potentials, in that it offers improvement in the treatment of intramolecular properties while retaining the good description of intermolecular interaction^.^.'^ A key guidepost in the development of the RESP model was the reproduction of the aqueous free energy of solvation of methanol (MEOH) and N-methylacetamide (NMA) in TIP3P water. This involved extensive testing of which van der Waals parameters were appropriate to use with these charges. The detailed description of these are given below.
However, calculating AGsolvauon in good agreement with experiment is only a single test of a model; the calculation of the density and enthalpy of the molecular liquids is a more challenging test. Thus, a first goal of this paper is to present the results of liquid simulations on methanol and N-methyl- acetamide using the same effective two-body additive potential used in the solvation free energy calculations and to compare to experiment.
It is, however, clear that effective two-body potentials have limitations. These limitations would be expected to be most severe for molecules of high chargelpolarity at interfaces, since in these cases, the assumption of a single “average polarized” charge distribution for the molecule would be least accurate. We have developed a nonadditive model for waterlla that reduces the partial charges of the atoms and adds isotropic atomic polarizabilities resulting in a similarly accurate descrip- tion of the liquid compared to two-body additive models. A study of ion-water clusters with such a model led to new and interesting insights into their structure and energetics.’ lb How- ever, to prove the utility and generality of such nonadditive models, they must be extended to more complex molecules. Thus, the second goal of this study is to apply the same approach to deriving the nonadditive model for water to the more complex molecules methanol and N-methylacetamide.
Encouragingly, both the additive and nonadditive models, with very similar electrostatic scale factors for all three molecules (to derive charges for the nonadditive models), lead to good agreement with experimental densities and enthalpies of vaporization.
1995 American Chemical Society

Structure and Properties of Neat Liquids
There have been a number of different approaches to treat nonadditivity in liquid water including the one we have developed,lla the (polarizable SPC) model of Ahlstom et the (“anisotropic” water) model of Levy and co-workers,12b the model of DanglZC (which is a modification of the model in ref l la) , the microcharge model of Sprik and Klein,lZd and the “flowing charge” model of Rick et ~ 1 . l ~ ~ Models in refs l l a and 12a-c have common parentage and are straightforward to generalize to complex systems. The approaches of Sprik and KleinlZd and Rick et ~ 1 . ’ ~ ~ are computationally more efficient, but it is not clear how to generalize them beyond simple liquids.
J. Phys. Chem., Vol. 99, No. 16, 1995 6209
hydrogens leads to too large Na+* .OH2 interactions.lla Using the Applequist atomic polarizabilities on the oxygen and hydrogen directly and varying the atomic partial charges on water leads to excellent representations of both water liquid and ion-water clusters. We thus have proceeded to develop this model.
The OPLS results of Jorgensen include a long-range correc- tion to approximately include the average van der Waals effect of the molecules that are outside the spherical cutoff. This term should make only a small difference in the total energy and density. This was bome out by the calculations discussed below.
Water. The hydrogen was assigned a van der Waals term of 0 and all the other interactions were of the 6-12 form, following the approach of Jorgensen’s OPLS1$15 models for liquids. The polarizabilities are those proposed by DanglZc to correctly reproduce the molecular polarizability (we feel that water’s unique role in nature merits special attention to detail). The charges were those of the previous POL1 model. We performed a series of molecular dynamics runs varying r* and E on a system of 216 molecules of water in a cubic box. Constant temperature (300 K) and pressure (1 bar) were maintained by coupling the system to temperature and pressure baths16 with coupling parameters t~ = 0.4 ps and ZP = 0.4 ps. The SHAKE” algorithm was used to maintain constant bond lengths. The total time was 100+ ps, although the properties of water tend to converge very quickly (-10 ps). The goal here was to derive optimal liquid properties for this model (POL3); final values of r* and E are given in Table 1. They are very similar to those used previous,” including the use of the SPC/E geometry.18
Methanol and N-Methylacetamide. The force field param- eters for the additive modello are presented in Table 1. The basis of the calculation was the new Come11 et al. force field,3 wherein the 1-4 electrostatic scale term is now 1.2 as opposed the value of 2.0 used previously.2 The additive model atomic partial charges were the RESP9 charges determined using the 6-31G* basis set in Gaussian 92.19 The atomic (isotropic) polarizabilities are those developed by Applequist. l2
A comparison of the experimental, quantum mechanical, and molecular mechanical dipole moments appears in Table 2. It is apparent that the nonadditive part of the molecular mechanical Hamiltonian is crucial in providing good liquid dipole moments for water and N-methylacetamide.
The simulation scheme was the same as for water: periodic boundary conditions, constant temperature (300 K for MEOH and 373 K for NMA), and constant pressure (1 bar). A time step of 1 fs (2 fs for additive models) and a pair list update every 5-10 molecular dynamics steps were used. The nonbond cutoff was set at 8.0 A for methanol and 10.0 A for NMA. NMA is the largest of the systems; it takes a considerable amount of computer time: 4 cpu-hours/ps on a DEC 3000/500 or HP 9000/735-99.
The AHvapo~zat ion was determined via the scheme
Emonomer(n = Eminhized + Evibrational(n
Computational Methods
following energy equations: The molecular mechanical energy2 was calculated using the
with the nonadditive’ contribution included via
1 atoms
where
i=lj+i
(4)
( 5 )
The meaning of the parameters is described in refs 2 and 11. In the original approach of Applequist, all atom-atom
interactions (i.e. charge and inducible dipoles) were ~0nsidered.I~ This approach is also taken by Th01e.l~ We have chosen to follow the algorithm of the standard molecular mechanics approah to through-space interactions2 and only include interac- tions of nonbonded and 1 -X bonded interactions, where X > 3 (the 1-2 and 1-3 charge-charge and vdw-vdw interactions are folded into the bond and angle force constants). While this will make calculation of the total molecular polarizability inaccurate using existing parameters (e.g. Applequist’s values13), that quantity is only peripheral to our work. We are mainly interested in the energetics of molecular interactions. The approach taken will also allow efficient computation of the nonadditive interactions using the standard nonbond pair list from additive molecular mechanics; it also has the advantage that the potential for a polarization catastrophe (polarization energy becoming unrealistically large) is reduced.
Also, given all the other approximations used to represent the noncovalent interactions between molecules with eq 1, using the Applequist data within the context of this equation is certainly reasonable. We also found that with such an approach centering the entire molecular polarizability of water (a = 1.44 A3) on the oxygen or distributing it to the oxygens and
where
Evibrational = RT(3N - 6 - (shaken bonds))/2
with all bonds shaken16 for both MEOH and NMA. And
- AE = ‘potential-system NmonomersEmonomer
AH = AE + AnRT
In order to calculate quadrupole moments, we represented the

6210 J. Phys. Chem., Vol. 99, No. 16, 1995
TABLE 1: Force Field Parameters for Methanol and N-Methylacetamide
Van der Waals Parameters atom type r*" E" a"
Water Hw 0.0 0.0 0.170 ow 1.7980 0.156 0.528
MeOH CT 1.9080 0.1094 0.878 HO 0.0 0.0 0.135 HC 1.3870 0.0157 0.135 OH 1.7210 0.2104 0.465
NMA C 1.9080 0.0860 0.616 CT 1.9080 0.1094 0.878 HN 0.6OoO 0.0150 0.161 H1 1.4870 0.0150 0.135 H2 1.3870 0.0150 0.135 N 1.8240 0.1700 0.530 0 1.7683 0.1520 0.434
Caldwell and Kollman
atom atom type chargeb Water
H Hw 0.3650 0 ow -0.7300
MeOH HC HC 0.0372 C CT 0.1166 OH OH -0.6497 HO HO 0.4215
NMA H1 H1 0.0173 H2 H1 0.0173 H3 H1 0.0173 c 1 CT -0.0411 C C 0.5869 0 0 -0.591 1 N N -0.4192 HN H 0.2823 c 2 CT -0.2078 H4 H2 0.1127 H5 H2 0.1127 H6 H2 0.1127
bonds' K Rea bonds' K RUl C-CT 317.0 1.522 C-N 490.0 1.335 c-0 570.0 1.229 CT-HC 340.0 1.098 CT-HI 340.0 1.098
CT-H2 340.0 CT-N 337.0 CT-OH 320.0 N-HN 434.0
1.098 1.449 1.41 1.01
angled C-N-HH C-N-CT CT-C-N CT-C-0 CT-OH-HO HC-CT-HC HC -CT-OH
Ke 8, 35.0 119.8 50.0 121.9 70.0 116.6 80.0 120.4 55.0 108.0 35.0 109.5 35.0 109.5
angled Ke H1-CT-HI 35.0 H2-CT-H2 35.0 H1-CT-C 50.0 H2-CT-N 50.0 H-N-CT 50.0 N-C-0 80.0
*e4
109.5 109.5 109.5 109.5 120.0 122.9
dihedralC redundancy' VJ2' Y e ne
X-CT-N-X 6 0.0 0.0 3 X-C-N-X 4 10.0 180.0 2 X-CT-OH-X 3 0.5 0.0 3 H-N-C-0 1 2.5 180.0 2 H-N-C-0 1 2.0 0.0 1 H1-CT-C-0 1 0.067 180.0 3
improper dihedralC VJ2' Y e ne
X-X-N-H 1 .o 180.0 2 x-x-c-0 10.5 180.0 2
r* in A, E in kcal/mol, a in A3. Atomic units. KR in kcal/(mol AZ). Re, in A. KO in kcal/(mol radians2). Oeq in degrees. e VJ2 in kcal/mol, y is the phase offset in degrees, n is the periodicity of the Fourier term. 'The redundancy is determined for X-A-B-X as the product of the number of X-A bonds with the number of B-X bonds.
TABLE 2: Dipole Moments for Isolated Molecules (D) exptl qmaSb mm (addb) mm (nonaddb)
water 1.8Sb(2.6') 2.20 2.35 2.02/-/2.02d methanol 1.69 1.89 2.16 1.90/0.10/1 .93d NMA 3.7' 3.91 4.45 3.88/0.621/3.35d
6-31G* optimized geometries. Gas phase. Liquid, ref 21. Per- manent momenthduced momenthector sum. < Average of 3.71 (gas phase), 3.82 (in benzene), and 3.6 (in CCh), ref 30.
TABLE 3: Water Energetics (T = 300 K, P = 1 bar) Liquid density" A E b
exptl' SPCE POL3
0.995 9.92 0.997 9.90 0.998 9.83
Dimers SPCE POL3
Emidmizedb.d -7.13 -5.45 RH-O' 1.79 1.86 Ro-o' 2.78 2.85
" gm/cm3. kcdmol. See ref 14. Total molecular mechanical energy, which is also the dimerization energy since the monomer energy is 0.0 for rigid water models. e A.
quadrupole moment contributions due to the induced dipoles by microdipoles. These were determined by treating the induced dipoles as comprised of pseudocharges separated by a sufficient distance to produce a dipole moment the same as the induced one. (We found that charges of f 1 6 e mimicked the infinitesi- mal induced moments (we tested values from 0.5e to 64e).)
Results
Scale Factors. The charges originally used for POL1 water" were used in this work since they had been shown to give a reasonable value of the gas phase monomer dipole moment and also to yield a good bulk dipole moment. The value which best covered these two disparate environments is 0.86 of the additive (SPCE) value.18
The criterion used in the MEOH and NMA simulations was rather different: find a scale factor which would give the same bulk properties with polarization switched on as the additive model. The consensus value is found to be 0.88.
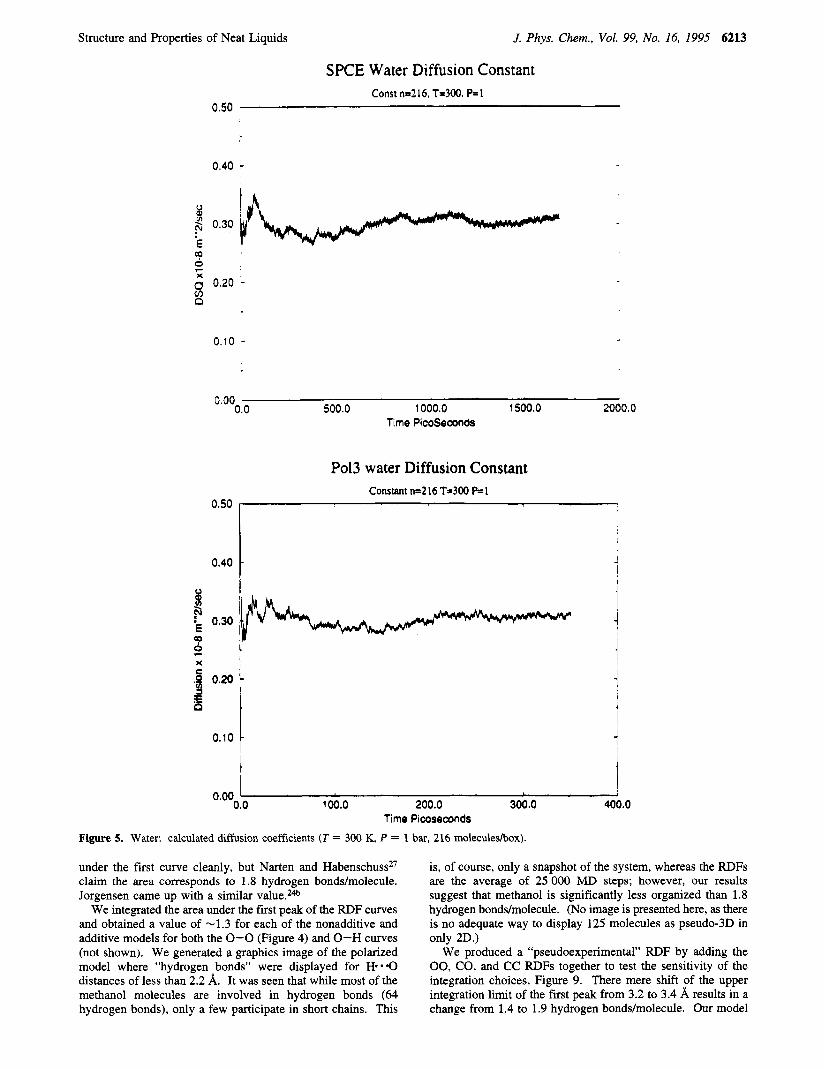
Water. For our simulations, we were aiming at experimental values of AHvapohtion = 10.51 kcal/mol and density = 0.995 g d ~ m . ~ The "best" values were found to be r* = 1.798 and c = 0.156, which yield a AH 10.42 kcal/mol and 0.998 g d ~ m . ~ The calculated dipole moment is 2.61 D, nearly the presumed experimental value (-2.6 D)20 (Tables 2 and 3). The radial distribution functions are compared to experiment2' in Figures 1-3, where it is seen that agreement is good, although the first 0-0 peak is somewhat at too short a distance (which is typical of models proposed thus far14). The agreement with SPCE is very good (Figure 4). However, we cannot obtain the previously published value (0.25 x lo-* m2/s) of the diffusion constant for SPCE, even extending our calculation to 1.5 ns (the published work only determined the diffusion constant for 20 ps). Both POL3 and SPCIE yield values of 0.3 1 x m2/s, which is somewhat high compared with the experimental value2* of 0.23 x lo-* m2/s (Figure 5). The calculated quadrupole moment (Table 4) is smaller than the quantum mechanical value,23 reflecting the inherent inability of three-point models to reproduce both the dipole and quad- rupole moments.

Structure and Properties of Neat Liquids J. Phys. Chem., Vol. 99, No. 16, 1995 6211
3.0 C 0 0 C 3 U c 0
.- c
.- c 2 2.0 .- L c
Water Neutron Diffraction
-
-
El ........... I HHJ n
II
0.0 I
distance (Angstroms)
Figure 1. Water neutron diffraction radial distribution functions from data in ref 18.
Water Po13
4.0
3.0 c 0 0 t 3 U c 0
.- c
.- I 2 2.0 1-
L c v)
6 - m '0 .-
2 1 .o
r;3 ............ ...........
n
0.0
distance (Angstroms)
Figure 2. Water: POL3 radial distribution functions (T = 300 K, P = 1 bar, 216 moleculesbox, '20 000 step average).
Methanol. The energy components of monomeric and 3 5 0 f ps (the nonadditive model model runs about 4 x slower dimeric methanol for both polarizable and additive models are presented in Table 5 . The dimerization energy is seen to be -5.6 kcal/mol for the additive model and -5.4 kcaVmol for the nonadditive model. Earlier work of Jorgensen found an average dimerization energy of -4.4 kcal/mol for his rigid
The liquid simulations were run for very long trajectories, the additive simulation was run for 2+ ns (including testing simulation protocols as well), and the nonadditive was run for
than the additive). The energetics of the current calculation are shown in Table 5 and the radial distribution functions (RDFs) in Figures 6 and 7. The calculated AHvapoization is 8.45 kcaV mol for the additive model and 9.05 kcal/mol for the nonadditive model using a scaling factor of 0.88 for the partial charges; the experimental AHvapofization is -9.0 kcal/mol.20 The densities are 0.775 and 0.820 gm/cm3, respectively, as compared to an experimental value25 of 0.787 gm/cm3. While the nonadditive AHvapo"zation is quite good, the system is somewhat too dense.

6212 J. Phys. Chem., Vol. 99, No. 16, 1995 Caldwell and Kollman
Water 0-0 rdfs
4.0
3.0
2.0
1 .o
0.0 0.0 2.0 4.0 6.0 8.0
Figure 3. Water: comparison of the experimental and calculated oxygen-oxygen radial distribution functions (T = 300 K, P = 1 bar, 216 moleculeshox, ’20 OOO step average).
Wuter 0-0 comparison
3.0 I
2.0
U
a: n
1 .o
Figure 4. Water: comparison of SPC/E and POL3 0-0 radial distribution functions.
(The OPLS values24 are AHvapo-tion = 9.05 kcal/mol and density = 0.759 gm/cm3.) The contributions to the molecular dipole moment are presented in Table 6; the induced moments are essentially along the molecular axis, giving rise to the higher total average moment. The variation of the magnitude of the induced moments is striking; liquid methanol obviously corre- sponds to a very “heterogeneous environment”. The diffusion constant (Figure 8) for the additive model is too high, whereas the polarizable model gives a reasonable value of 0.265 x lo-* m2/s vs 0.22 x lo-* m2/s found experimentally.20
The number of hydrogen bonds formed by each monomer can vary from one (as in a gas phase dimer) to two in a perfect crystal.26 The values deduced from experiment range from 2 to ~ 1 . 5 ~ ’ on the basis of the RDF of the 0-0 distance. The difficulty in determining a value from the experimental RDFs is the onset of the C-0 curve at about 2.8 A. The published experimental RDP8 is only available in analog form, so we merely note that the f i s t peak is at 2.8 A with a height of -1.2 followed by broader peaks at 3.8 and 4.5 A. Since the first two peaks overlap strongly, it is difficult to integrate the area
Structure and Properties of Neat Liquids J. Phys. Chem., Vol. 99, No. 16, 1995 6213
SPCE Water Diffusion Constant Const n=2 16. T-300. P= 1
0.50
0.40
s p 0.30
? i
x
8 o.20 0
0.10
500.0 1000.0 1500.0 2000.0 0.00 0.0
Time PicoSeconds
Po13 water Diffusion Constant Constant n=216 T-300 e l
“..I”
0.40 .
0.10 c I I
100.0 200.0 300.0 400.0 0.00 ‘ 0.0
Time Picoseconds
Figure 5. Water: calculated diffusion coefficients (T = 300 K, P = 1 bar, 216 moleculeshx).
under the first curve cleanly, but Narten and Habenschuss*’ claim the area corresponds to 1.8 hydrogen bonds/molecule. Jorgensen came up with a similar value.24b
We integrated the area under the first peak of the RDF curves and obtained a value of -1.3 for each of the nonadditive and additive models for both the 0-0 (Figure 4) and 0-H curves (not shown). We generated a graphics image of the polarized model where “hydrogen bonds” were displayed for H- .O distances of less than 2.2 A. It was seen that while most of the methanol molecules are involved in hydrogen bonds (64 hydrogen bonds), only a few participate in short chains. This
is, of course, only a snapshot of the system, whereas the RDFs are the average of 25 000 MD steps; however, our results suggest that methanol is significantly less organized than 1.8 hydrogen bonds/molecule. (No image is presented here, as there is no adequate way to display 125 molecules as pseudo-3D in only 2D.)
We produced a “pseudoexperimental” RDF by adding the 00, CO, and CC RDFs together to test the sensitivity of the integration choices, Figure 9. There mere shift of the upper integration limit of the first peak from 3.2 to 3.4 A results in a change from 1.4 to 1.9 hydrogen bonds/molecule. Our model

6214 J. Phys. Chem., Vol. 99, No. 16, 1995
TABLE 4: Average Quadrupole Moment.& - 0, O Y Y 42
Caldwell and Kollman
Water SPCE -1.40 -0.22 1.63 POL3
permanent charges -1.21 -0.19 1.40 total - 1.05 -0.29 1.34
q.m.c -1.80 -0.08 1.88
MEOH additive model - 1.64 -1.15 2.79 polarizable model
permanent charges -1.41 -0.93 2.33 total -1.26 -0.79 2.05
q.m.d - 1.99 -0.89 2.86
NMA additive model -3.84 -0.54 4.37 polarizable model
permanent charges -3.37 -0.37 3.74
q.m.d -3.41 -0.59 3.99 total -3.35 -0.31 3.66
Atomic units. All molecules aligned by principal axis transforma- tion to the same axes. Reference 21. 6-31G*//6-31G* using Gauss- ian92.19
suggests that the actual number of hydrogen bonds/molecules is in the 1.3-1.4 range.
The quadrupole moment for the additive model actually comes much closer to the quantum mechanical value (Table 4) than the value from the nonadditive calculation. The origin of the net reduction of the quadrupole moment due to the induced dipoles is not clear.
N-Methylacetamide. Jorgensen has also studied dimeric and liquid NMA.28 That work found the preferred orientation for dimers parallel or antiparallel with respect to the C-N bond. The current models (both additive and nonadditive) have the C-C bonds "orthogonal" to each other apparently to avoid steric interaction between the methyl groups (Figure 10).
The energetics for liquid and dimeric NMA are shown in Table 7. NMA is treated as consisting of 100% tram molecules,
4.0
3.0 C 0 0 C 3 LL C 0
.- c
.- - 2 2.0
a
a
.- L c v)
l3 U m
- .-
1 .o
TABLE 5: Methanol Properties (T = 300 K, P = 1 bar) densitva A H b A E b
Liquid exptl 0.79 8.94 OPLS 0.76 9.05 Add 0.78 8.6 8.1 q88 0.81 8.5 8.0 q90 0.82 9.1 8.7
Add-lr' 0.82 9.0 8.6 q88-lr' 0.835 8.8 8.4
model
Add q88 s90
Monomer+ Em1"db.d 5.3 3.8 4.0 E"lbrat1O"b.e 1.99 1.99 1.99
Dimer
M 6.4 5.7 6.0 geometryg
&"mlzedb.d 3.9 1.9 2.0
Ro-o 2.78 2.79 2.76 Ro-H 1.82 1.83 1.80
gm/cm3. kcal/mol. Long-range correction for effect of molecules outside the spherical cutoff (ref 27) included in the Hamiltonian. Static molecular mechanical energy in kcal/mol. e Thermal energy of a monomer in kcal/mol. f Dimerization energy. z A. TABLE 6: Magnitude of Induced Moments on Atoms of MEOH" for q88 (D)
atom ave max min
c 1 0.10 0.30 0.02 HC 1 0.09 0.31 0.03 HC2 0.10 0.32 0.01 HC3 0.10 0.32 0.01 01 0.10 0.30 0.01 HO 1 0.10 0.26 0.03
methylb 0.25 0-Hb 0.18
The average angle between permanent and induced moments -20'. Vector sum over the induced moments.
Methanol Additive
........ .... El
0.0 0.0 2.0 4.0 6.0 8.0
distance (Angstroms)
Figure 6. Methanol: additive potential radial distribution functions (T = 300 K, P = 1 bar, 125 molecules/box, >20 OOO step average).

Structure and Properties of Neat Liquids J. Phys. Chem., Vol. 99, No. 16, 1995 6215
4.0
3.0
2.0
1 .o
0.0 (
Methanol Polarized RDF
1
. . ..., . I ...... 2.0 4.0 6.0 8.0 10.0
Angstroms
Figure 7. Methanol: nonadditive potential radial distribution functions (T = 300 K, P = 1 bar, 125 moleculeslbox, > 10 000 step average).
Methanol diffusion coefficient
0.40
8
i *$
z r
0.30
-1 ...........
0.20
Pic0 Seconds Figure 8. Methanol: calculated diffusion coefficients (T = 300 K, P = 1 bar, 125 moleculeslbox).
experimentally in the gas phase.2g The experimental density, enthalpy of vaporization, and diffusion constant of the liquid are from Lemire and Sears.30 After simulations of '200 ps each, the differences in calculated density and enthalpy of vaporization are very similar for the 0.90 and 0.88 (Table 7) scale factors. We choose to use 0.88 because that yields marginally better values than 0.90 and, more importantly, is the same as the preferred value for methanol. The agreement with the experimental values is good. Two things are interesting
the induced moment reduces the total moment and ( 2 ) the net dipole moment of polarizable liquid NMA is enhanced compared to the gas phase due to the induced moment no longer opposing the fixed moment. This comes about due to the average orientation of the induced moment (0.46 D) being nearly perpendicular (90.3') to the permanent moment in the liquid (the induced moment is nearly parallel to the permanent moment in both water (-19') and methanol (-20')). The induced moments presented in Table 8 provide an insight as to why

6216 J. Phys. Chem., Vol. 99, No. 16, 1995 Caldwell and Kollman
1.5
1 .o
0.5
Methanol Polarizable Summed
I
0.0 I
Angstroms Figure 9. Methanol: summation of radial distribution functions with nonadditive potential.
parallel dimer
$HN(6 NN(6
\
NMA
anti dimer Figure 10. Stereoviews of N-methylacetamide: dimer structures (Atoms C, 0, N, HN of residue 1 of the pairs [1/2, 3/4, 5/61 were superimposed. Residues 1.2 are the model-built structure based on Figure 2 in ref 25; residues 3,4 are minimized; residues 5,6 are the result of minimization, dynamics for 10 ps at 300 K, and reminimization).
this is the case, in that the largest contributions come from the methyl groups oriented perpendicular to the molecular axis.
A notable difference between MEOH and NMA is the magnitude of the induced moments on the atoms (although the range is similar). For MEOH, all of the atoms have nearly the same induced moments, whereas for NMA the hydrogens of the methyl groups are only half as polarized as the other atoms. This is evidently the origin of the difference in orientation of the induced moments to the permanent moments.
The quadrupole moment (Table 4) is in good agreement with the quantum mechanical value. Interestingly, the induced moments charge the value very little (compared to water and MEOH).
There are no experimental RDFs for NMA, but Jorgensen has calculated them for the OPLS parameter The current RDFs are shown in Figures 11 and 12; they closely follow the ones obtained by Jorgensen.
The diffusion constant, however, is rather too high for both

Structure and Properties of Neat Liquids
TABLE 7: N-Methylacetamide Properties (T = 373 K, P = 1 bar)
2.0
1.0
0.0
J. Phys. Chem., Vol. 99, No. 16, 1995 6217
-
-
-'
densitya A H b A E b Liquid
exptl 0.89 13.3 OPLS 0.87 13.2 12.4 Add 0.87 13.8 13.0 q88 0.87 12.5 11.7 q90 0.87 12.7 11.9 Add-lr' 0.90 14.4 13.6 q88-lr' 0.89 12.5 11.7
~
Add q88 q90 Monomer'
Enlln1Wd 1.23 -0.37 -0.45 E v i b r a m " 6.73 6.73 6.73
Dimef EnlllIllNXd -7.19 -9.03 -9.41 AEg 9.65 8.29 8.5 1 geometry"
Ro-N 2.86 2.86 2.87 Ro-HN 1.89 1.88 1.90
gm/cm3. kcdmol. Long-range correction for effect of molecules outside the spherical cutoff (ref 27) included in the Hamiltonian. Static molecular mechanical energy in kcdmol. e Thermal energy of mono- mer. f Static molecular mechanical energy in kcal/mol. 8 Dimerization energy. h A.
the additive (0.18 x m2/s) and polarizable models (0.27 x mz/s) (Figure 13). The experimental valuez6 would be -0.12 x m2/s by extrapolating from data determined at 308 K and 333-373 K.
"Tuming on" the OPLS type long-range correction (ref 3 1, eqs 2.136, 2.137, and 2.138) produced only a small effect for the MEOH and NMA systems, as shown in Tables 5 and 7 (water was run as a control, and the results were, as expected, identical with the standard approach). In MEOH, there was a 2-4% increase in the density and a 3-4% change in the
TABLE 8: Induced Moments on Atoms and Groups of N-Methylacetamide q88 (D)"
Atoms
ave max min c 1 0.14 0.28 0.03 H1 0.05 0.07 0.02 H2 0.05 0.08 0.02 H3 0.09 0.19 0.03 C 0.12 0.23 0.02 0 0.07 0.17 0.01 N 0.09 0.17 0.01 HN 0.12 0.33 0.02 c 2 0.20 0.34 0.04 H4 0.03 0.06 0.01 H5 0.03 0.05 0.01 H6 0.09 0.28 0.02
Groupsb Me 1 0.16 c-0 0.13 N-H 0.14 Me2 0.21 peptide unit 0.19
The average angle between permanent and induced moments -90". Vector sum over the induced moments.
enthalpy of vaporization; in NMA the density increased by 2-3% and the enthalpy of vaporization increased for the additive model by -4%. For MEOH, the long-range correction improved the agreement with experiment for the enthalpy of vaporization and worsened it for the density; in NMA, the density with the long-range correction was improved for both models, but the enthalpy was unaffected (nonadditive) or the agreement was worsened (additive).
Discussion and Conclusions
The calculations presented here show encouraging agreement with both experiment and the OPLS method. It is gratifying
NMA q88 Polarizable
3.0
2.0 4.0 6.0 8.0 10.0 Angstroms
Figure 11. N-Methylacetamide: nonadditive radial distribution functions for CC, 00.0-CHsN (C20). and O-CHsC (ClO) ( T = 373 K, P = 1 bar, 125 moleculeshox, > 10 OOO step average).

6218 J. Phys. Chem., Vol. 99, No. 16, I995
0.0
Caldwell and Kollman
-- 0.0 2.0
3.0
2.0
1 .o
NMA q88 Polarizable
4.0 6.0 8.0 10.0 Angstroms
Figure 12. N-Methylacetamide: nonadditive radial distribution functions for NN, NO, N-CH3N (C20), and N-CH3C (C10) (T = 373 K, P = 1 bar, 125 moleculesibox, > 10 000 step average).
N-Methyl Acetamide Diffusion Constants
0.50 I I
O.’O t 500.0
0.00 I 0.0 100.0 200.0 300.0 400.0
Time (picoseconds)
Figure 13. N-Methylacetamide: calculated diffusion coefficients (T = 373 K, P = 1 bar, 125 moleculeshox).
that the additive models of methanol and NMA liquid have been taken without change from previous studies of aqueous solvation free energies on these molecules. Thus, it is particularly encouraging that the densities of the liquids are within 3% (MEOH) and 1 % (NMA) and the vaporization enthalpies within 1% (MEOH) and 8% (NMA) of experiment. For the nonad- ditive model, we found that a single scale factor for the permanent charge of 0.88 and the inclusion of induction energies
allow a comparably accurate representation of the enthalpy and density of the vaporization of the liquids.
This scale factor of 0.88 is also encouragingly close to the 0.86 found by us to be appropriate to “transform” SPCE water into POL water (refs l l a , 12c, and this work). It is of note that even with this scaling of the charges, the intrinsic gas phase monomer dipole moments are 6-12% larger than experiment (Table 2). This is not unreasonable, give the underestimate of

Structure and Properties of Neat Liquids
the quadrupole moment of HzO inherent in atom-centered charge models, that the dipole moment should be slightly overestimated to provide an appropriately balanced charge model.
The calculated diffusion constants all are higher than experi- mental values, though generally not by a large amount, with the exception of the methanol additive value. There is no obvious correlation between the diffusion constants and devia- tions of enthalpy of vaporization and density vs experiment.
It is very difficult to unambiguously analyze the experimental radial distributions (our simple attempts to do such brought clearly home the delicacy of such attempts). In this case, it is especially noteworthy that the combined calculated RDF for methanol showed such nice agreement with experiment, even though our interpretation was sharply different from the previous ones. It is likely that, although there are transient “macrostruc- tures” in liquid methanol, the average structure is less organized than previously suggested.
A particular benefit of the nonadditive method is the insight it gives into the nature of induced moments in liquids via the range and average magnitudes of the induced moments. It is quite unexpected that the induced moment of NMA is nearly perpendicular to the “permanent” moment, whereas that of methanol reinforces the permanent moment. Thus, a simple additive model of NMA may not adequately describe the orientations of interacting molecules.
This work shows that the simple approach of adding induced polarizabilities to a reliable additive molecular mechanical force field can provide valuable insight and a clearly understandable improvement of the microscopic electric properties which will be necessary to understand interesting highly charged enzyme reaction systems such as proteins.
Acknowledgment. We would like to thank Digital Equip- ment Corporation for the Grant of the Alpha 3000/500. P.A.K. also thanks the NIH and NSF for support (GM-29072 and CHE 91-13472). We would also like to thank a referee for pointing out the best value of the water self-diffusion constant.
J. Phys. Chem., Vol. 99, No. 16, 1995 6219
(7) Cieplak, P.; Kollman, P. A. J. Comput. Chem. 1991, 12, 1232- 1236.
(8) Kuyper, L. F.; Hunter, R. N.; Ashton, D.; Merz, K. M.; Kollman, P. A. J. Phys. Chem. 1991, 95, 6661-6666.
(9) Bayly, C. I.; Cieplak, P.; Comell, W. D.; Kollman, P. A. J . Phys. Chem. 1993, 97, 10269-10280.
(10) Comell, W. D.; Cieplak, P.; Bayly, C. I.; Kollman, P. A. J . Am. Chem. SOC. 1993, 115, 9620-9631.
(11) (a) Caldwell, J. W.; Dang, L. X.; Kollman, P. A. J. Am. Chem. SOC. 1991, 112, 9144-9147. (b) Dang, L. X.; Rice, J. E.; Caldwell, J. W.; Kollman, P. A. J . Am. Chem. SOC. 1991, 113, 2481-2486.
(12) (a) Ahlstrom, P.; Wallquist, A,; Engstrom, S.; Jonsson, B. Mol. Phys. 1989, 68, 563-581. (b) Bemardo, D. N.; Ding, Y. B.; Krough- Jespersen, K.; Levy, R. M. J . Phys. Chem. 1994,98,4180-4187. (c) Dang, L. X. J . Chem. Phys. 1992,97,2659-2660. (d) Sprik, M.; Klein, M. L. J . Chem. Phys. 1988,89,7556-7560. (e) Rick, S. E.; Stuart, S. J.; Beme, B. J. J. Chem. Phys. 1994, 101, 6141-6156.
(13) Applequist, J. B.; Carl, J. R.; Fung, K.-K. J. Am. Chem. SOC. 1972, 94, 2952-2960.
(14) Thole, B. T. Chem. Phys. 1981, 59, 341-350. (15) Jorgensen, W. L.; Chandrasekhar, J.; Madura, J. D.; Impey, R. W.;
Klein, M. L. J . Chem. Phys. 1983, 79, 926-935. (16) Berendsen, H. J. C.; Postma, J. P. M.; van Gunsteren, W. F., Daola,
A.; Haak, J. R. J . Chem. Phys. 1984, 81, 3684-3690. (17) Ryckaert, J.; Cioccotti, G.; Berendsen, H. J. C. J. Comput. Phys.
1977, 23, 327-341. (18) Berendsen, H. J. C.; Grigera, J. R.; Straatsma, T. P. J . Phys. Chem.
1987, 91, 6269-6271. (19) Frisch, M. J.; Trucks, G. W.; Head-Gordon, M.; Gill, P. M. W.;
Wong, M. W.; Foresman, J. B.; Johnson, B. G.; Schlegel, H. B.; Robb, M. A.; Replogle, E. S.; Gomperts, R.; Andres, J. L.; Raghavachari, K.; Binkley, J. S.; Gonzalez, C.; Martin, R. L.; Fox, D. J.; Defrees, D. J.; Baker, J.; Stewart, J. J. P.; Pople, J. A. Gaussian 92, Revision C.4; Gaussian, Inc.: Pittsburgh, PA, 1992.
(20) Krynicki, K.; Green, C. D.; Sawyer, D. W. Faraday Discuss. Chem.
(21) Coulson, C.; Eisenberg, D. Proc. R. SOC. London, A 1966, 291,
(22) Soper, A. K.; Phillips, M. G. Chem. Phys. 1986, 107, 47-60. (23) Neumann, D.; Moscowitz, J. W. J. Chem. Phys. 1%8,49,2056-
2070. (24) (a) Jorgensen, W. L.; Tirado-Rives, J. J . Am. Chem. SOC. 1988,
110, 1657-1661. (b) Jorgensen, W. L. J . Phys. Chem. 1986, 90, 1276- 1284.
(25) (a) Wilholt, R. C.; Zwolinski, B. J. J . Phys. Chem. Re5 Data 1973, 2, Suppl. 1. (b) Lee, Y. E.; Li, S. F. M. J . Chem. Eng. Data 1991, 36, 240-243.
SUC. 1978, 66, 199-209.
445.
(26) Tauer, K. J.; Lipscomb, W. N. Acta Crystallogr. 1952, 6, 606. (27) (a) Narten, A. H.; Habenschuss, A. J . Chem. Phys. 1984,80,3387-
3391. (b) Magini, M.; Paschina, G.; Piccaluga, G. J . Chem. Phys. 1982, 77, 2051-2056. (c) Sarkar, S.; Joarder, S. N. J . Chem. Phys. 1993, 99, 2033-2039.
(28) Jorgensen, W. L.; Swenson, C. J. J . Am. Chem. SOC. 1985, 107, 569-578.
(29) (a) Drakenberg, T.; Forsen, S . J . Chem. SOC., Chem. Commun. 1977, 1404. (b) Neuman, R. C.; Jonas, V.; Anderson, K.; Barry, R. Biochem. Biophys. Res. Commun. 1971, 44, 1156. (c) Drakenberg, T.; Dahlqvist, K.4.; Forsen, S. J. Chem. Phys. 1972, 76, 2178.
(30) Lemire, R. J.; Sears, P. G. Top. Curr. Chem. 1978, 74, 45-91. (31) Allen, M. P.; Tildesley, D. J. Computer Simulations of Liquids;
Oxford University Ress: Oxford, Great Britain, 1987; pp 64-65.
JP942675S
References and Notes (1) (a) Jorgensen, W. L.; Tirado-Rives, J. J . Am. Chem. SOC. 1988,
110, 1657. (b) Jorgensen, W. L.; Briggs, J. M. J . Am. Chem. SOC. 1989, 111. 4190. (cl Joreensen. W. L.: Briees. J. M.: Contreras. M. L. J . Phvs. . -- . Chem. 1990,‘ 94, 1&3.
(2) (a) Weiner. S. J.; Kollman, P. A.; Case, D. A.; Sinrrh, U. C.; Ghio, C.; Alagona, G.; Pofeta, S.; Weiner, P. J . Am. Chem. SOC. 1984, 106, 765. (b) Weiner, S. J.; Kollman, P. A.; Nguyen, D. T.; Case, D. A. J . Comput. Chem. 1986, 7, 230-252.
(3) Comell, W. D.; Cieplak, P.; Kollman, P. A. J . Am. Chem. SOC., in press.
(4) Sun, Y.; Spellmeyer, D.; Pearlman, D. A,; Kollman, P. A. J. Am. Chem. SOC. 1992, 114, 6798-6801.
(5) Gough, C. A.; Debolt, S. E.; Kollman, P. A. J . Comput. Chem.
(6) Singh, U. C.; Kollman, P. A. J . Comput. Chem. 1984, 5, 129- 1992, 13, 963-970.
145.


