The inverse relationship between reduced folate carrier function
Structure and Function Relationship inthe Abdominal Stretch Receptor Organs
of the Crayfish
NUHAN PURALI*
Hacettepe University, Medical Faculty, Department of Biophysics, Sihhiye,06100 Ankara, Turkey
ABSTRACTThe structure/function relationship in the rapidly and slowly adapting stretch receptor
organs of the crayfish (Astacus leptodactylus) was investigated using confocal microscopy andneuronal modeling methods. Both receptor muscles were single muscle fibers with structuralproperties closely related to the function of the receptors. Dendrites of the rapidly adaptingneuron terminated in a common pile of nerve endings going in all directions. Dendrites of theslowly adapting neuron terminated in a characteristic T shape in multiple regions of thereceptor muscle. The slowly adapting main dendrite, which was on average 2.1 times longerand 21% thinner than the rapidly adapting main dendrite, induced larger voltage attenua-tion. The somal surface area of the slowly adapting neuron was on average 51% larger thanthat of the rapidly adapting neuron. Variation in the neuronal geometry was greatest amongthe slowly adapting neurons. A computational model of a neuron pair demonstrated that therapidly and the slowly adapting neurons attenuated the dendritic receptor potential likelow-pass filters with cut-off frequencies at 100 and 20 Hz, respectively. Recurrent dendriteswere observed mostly in the slowly adapting neurons. Voltage signals were calculated to bepropagated 23% faster in the rapidly adapting axon, which is 51% thicker than the slowlyadapting axon. The present findings support the idea that the morphology of the rapidly andthe slowly adapting neurons evolved to optimally sense the dynamic and the static featuresof the mechanical stimulus, respectively. J. Comp. Neurol. 488:369–383, 2005.© 2005 Wiley-Liss, Inc.
Indexing terms: mechanoreceptor; receptor muscle; receptor neuron; morphology; confocal
microscopy; neuronal modeling
Crustacean abdominal stretch receptor organs haveperhaps been the most common primary mechanoreceptorpreparation since they were first described by Alexand-rowicz (1951). The organ in situ is relatively easy to iden-tify and prepare for many types of electrophysiological andpharmacological experiments which may not be possiblein any other preparation. These properties of the prepa-ration prompted several pioneering studies on the mech-anotransduction, excitability, and synaptic inhibitorymechanisms (for review, see Swerup and Rydqvist, 1992;Purali, 1997). Furthermore, the presence of two closelypositioned mechanoreceptors with different adaptiveproperties makes it a unique preparation for studyingmechanisms of adaptation. In a series of studies, the vis-coelastic properties of the receptor muscles (Rydqvist etal., 1990, 1994), properties of the neuronal potassium cur-rent (Rydqvist and Purali, 1991; Purali and Rydqvist,1992), transducer current (Rydqvist and Purali, 1993),
sodium current (Purali and Rydqvist, 1998), and the firingproperties of the receptor neurons (Purali, 2002) havebeen investigated comparatively in the rapidly and slowlyadapting receptors to explore the cause(s) of adaptation(Purali, 1997). However, up to the present there has beenno study investigating the relationship between the mor-
Grant sponsor: Hacettepe University Research Fund; Grant number:0102101003; Grant sponsor: Research Council of Turkey; Grant number:AYD-287; Grant number: DPT (98K-121670).
*Correspondence to: Nuhan Purali, Hacettepe University, Medical Fac-ulty, Department of Biophysics, Sihhiye, 06100 Ankara, Turkey.E-mail: [email protected]
Received 11 November 2004; Revised 19 January 2005; Accepted 25February 2005
DOI 10.1002/cne.20590Published online in Wiley InterScience (www.interscience.wiley.com).
THE JOURNAL OF COMPARATIVE NEUROLOGY 488:369–383 (2005)
© 2005 WILEY-LISS, INC.
phology of the receptors and the reported differences inthe receptor responses.
The intracellular microinjection technique, allowing aspecific labeling and differential imaging of the neuronsand muscle fibers, was used for the first time in thepresent work. Using confocal microscopy and digital im-age processing methods in live preparations, 3D images ofthe receptor muscles, neurons, and subcellular structureswere obtained. Physical dimensions of the neuronal struc-tures were measured and the corresponding electrotonicparameters calculated. These values were inserted into acomputational neuron model simulating passive propaga-tion of the receptor potential through the dendritic tree.Images and computed receptor responses were compara-tively discussed with regard to the physiological functionof the rapidly and the slowly adapting receptors.
MATERIALS AND METHODS
Preparation
Rapidly and slowly adapting stretch receptor organswere dissected from the first to fourth abdominal seg-ments of the crayfish, Astacus leptodactylus, as previouslydescribed (Purali, 2002). Dissected receptor organs weremounted in their original orientation in a recording cham-ber and perfused in the control solution. The bottom of thechamber was a coverglass. The surface of the coverglasswas the X-Y plane and the Z axis was perpendicular tothat (see Fig. 2A). The composition of the control solutionwas (in mM): 200 NaCl, 5.4 KCl, 13.5 CaCl2, 2.6 MgCl2(van Harreveld, 1936) and buffered to pH 7.4 using 10 mMHEPES. In the majority of the experiments, one or moremicroelectrodes were inserted into the receptor neurons ormuscle fibers to load the fluorescent dyes. An amplifier(EPC-8, Heka, Germany) was used for membrane poten-tial recording and current injection. In some experiments,fluorescent dyes were injected into cells through an intra-cellular microelectrode (using a pneumatic pico-pump;PV-830, WPI, Sarasota, FL). In the handling of the exper-imental animals, national guidelines were followed andapproval from the Hacettepe University Ethics Commit-tee was obtained.
Fluorescent labeling and imaging
In the majority of the experiments polar fluorescenttracers, Alexa-hydrazide 488 or 568, were used for imag-ing the cell morphology. Dyes were loaded into the neu-rons by passing a constant negative current via an intra-cellular microelectrode filled with 10 mM dye solution in200 mM KCl (Purali, 2002). However, the dyes werepressure-injected into the muscle fibers. Myofibrils of thereceptor muscle fibers were imaged by using a fluorescentconjugate of the F-actin specific mushroom toxin, phalloi-din (Waterman-Storer et al., 2000). The preparation wasfixed in 3.7% paraformaldehyde (in 100 mM PBS, pH 7.4)solution for 10 minutes followed by a permeabilization in0.1% Triton X-100 (in 100 mM PBS, pH 7.4) solution for 5minutes. The preparation was washed 3–4 times in PBSand incubated in 165 nM Alexa Fluor 546 phalloidin for 20minutes at room temperature. After washing in PBS, thepreparation was mounted in a 1:1 solution of PBS andglycerol. Oregon green 488 conjugated paclitaxel was usedto label the tubulin filaments. The preparation was incu-bated in 20 �M conjugate for 2 hours, followed by several
washes in the control solution containing 2% bovine serumalbumin (Diaz et al., 2000). The nuclei of the cells in thepreparation were labeled by incubating the preparation in1 �M cell permeable fluorescent cyanine nucleic acidstain, SYTO-Orange (S-11360) (Frey, 1995). Labeled spec-imens were mounted onto an inverted microscopeequipped with a confocal laser scanner (200-M, LSM-Pascal, Zeiss, Germany). 488 and/or 543 nm laser linesfrom argon and helium-ion lasers were used to excite thefluorescent dyes. Images acquired in various experimentalconditions were processed in a 3D LSM (Zeiss, Germany)environment. The same program was used for the process-ing and production of the photomicrographs. Surface areaand volume measurements were performed using a spe-cial program developed for confocal image stacks obtainedin LSM Pascal confocal microscope (Zeiss, Germany).Briefly, contrast of the sequential images has been en-hanced and a subsequent Gauss filter was used forsmoothing. An erosion and dilation operation was appliedto reduce convex bulges in the contour of the region. Theimages were segmented as previously described by Schi-emann et al. (1992). Finally, the mask image was con-structed and surface and/or volume of the object was cal-culated. Fluorescent probes used in the present studywere commercially supplied from Molecular Probes Eu-rope (Leiden, The Netherlands) and the other chemicalswere obtained from Sigma (St. Louis, MO).
Neuronal modeling
Raw data about the length, width, volume, and surfacearea of the receptor neurons or neuron parts were ex-tracted from the stereo and projection images of the neu-rons. Physical measurements were converted into electri-cal terms by using some conventional constants andequations: �m � RmCm; T � t/�m; � � (aRm/2Ri)
1/2; X �x/�; L � l/�; and R� � �ri, where Rm is the specificmembrane resistance � 10,000� cm2; Ri is the specificaxoplasmic resistance � 65� cm; ri is the intracellularresistance per unit length (�/cm); Cm is the specific mem-brane capacitance � 1 �F/cm2; �m is the membrane timeconstant; � is the membrane length constant; a is theaxonal radius; X is the electrotonic distance; T is thedimensionless variable that is proportional to time; l is thephysical length of the cable; L is the electrotonic length;and R� is the input resistance of a � length of a dendrite.
Whenever applicable, the one-dimensional cable theorywas used to analyze electrotonic properties of the neuro-nal structures (Rall, 1959, 1962). For a nonisopotential cell(cylinder), spatial and temporal changes in the membranepotential were expressed by the general form of the cableequation:
d2Vm/dX2�dVm/dT�Vm�0 (1)
The general solution of the partial differential equationwas obtained for some conditions to calculate the voltageattenuation in a homogenous tubular dendrite as a func-tion of time and distance.
The arbitrary branching structure of the neuronal den-drites could not be represented by one-dimensional cableequations. Thus, a compartmental model was constructedto simulate the electrotonic properties of the neurons. Themodel allowed a realistic simulation of both the actualbranching patterns of the dendrites and the calculated
370 N. PURALI

equivalent cable, representing the whole dendritic tree(Koch and Segev, 1998; Johnston and Miao-Sin, 1995).The calculations and the modeling were performed inMatlab-simulink (MathWorks, Natick, MA) environment.
Statistical analysis
The results are expressed as means � standard error ofthe means (SEM); n is the number of experiments in thegroup. The statistical significance of the results was quan-tified using Student’s t-test. A P � 0.05 was consideredstatistically significant.
RESULTS
Stretch receptor organ preparation
In the abdominal segments of the crayfish there were apair of receptor organs on each side. The pair containedone rapidly and one slowly adapting receptor in a closelypositioned configuration. Each receptor consisted of a re-ceptor muscle and a bipolar sensory neuron inserting intothe receptor muscle with its fine dendrites. Afferent axonsextending from the proximal end of the receptor neuronsconstituted the segmental nerve, together with the effer-ent axons innervating the receptors. Receptors were cov-
ered by a connective tissue. The general structure of thereceptor pairs from various segments was similar (Fig. 1).
Receptor muscles
In order to supply some information about the generalmorphology and the fine structure of the receptor muscles,26 rapidly and 24 slowly adapting receptor muscles wereinvestigated. The specialized part of the receptor muscleswhere sensory neuronal dendrites terminate was investi-gated as an individual compartment. This part is referredto as the neuronal insertion zone (NIZ). Morphologicalmeasurements were obtained from the images acquired inthe transmitted light detection mode. Muscle compart-ments were tracked using 3D images of the Alexa-488-injected fibers. Myofibrils and tubulin filaments were la-beled by using fluorescent phalloidin and paclitaxelprobes, respectively.
Rapidly adapting receptor muscle
The rapidly adapting receptor muscle originated fromthe cephalic end of an abdominal segment and insertedinto the cephalic end of the consecutive segment (Fig. 2A).The muscle was parallel to the cephalo-caudal axis of theanimal in situ. The muscle length was related to the sizeof the segment and varied within the range of 3.3–5.5 mm.
Fig. 1. Various stretch receptor preparations. Fluorescent image of Alexa hydrazide-loaded receptorneurons were subtracted from the picture of the preparation obtained by transmitted light detectionmode. Scale bars � 200 �m.
371STRUCTURE AND FUNCTION IN STRETCH RECEPTOR
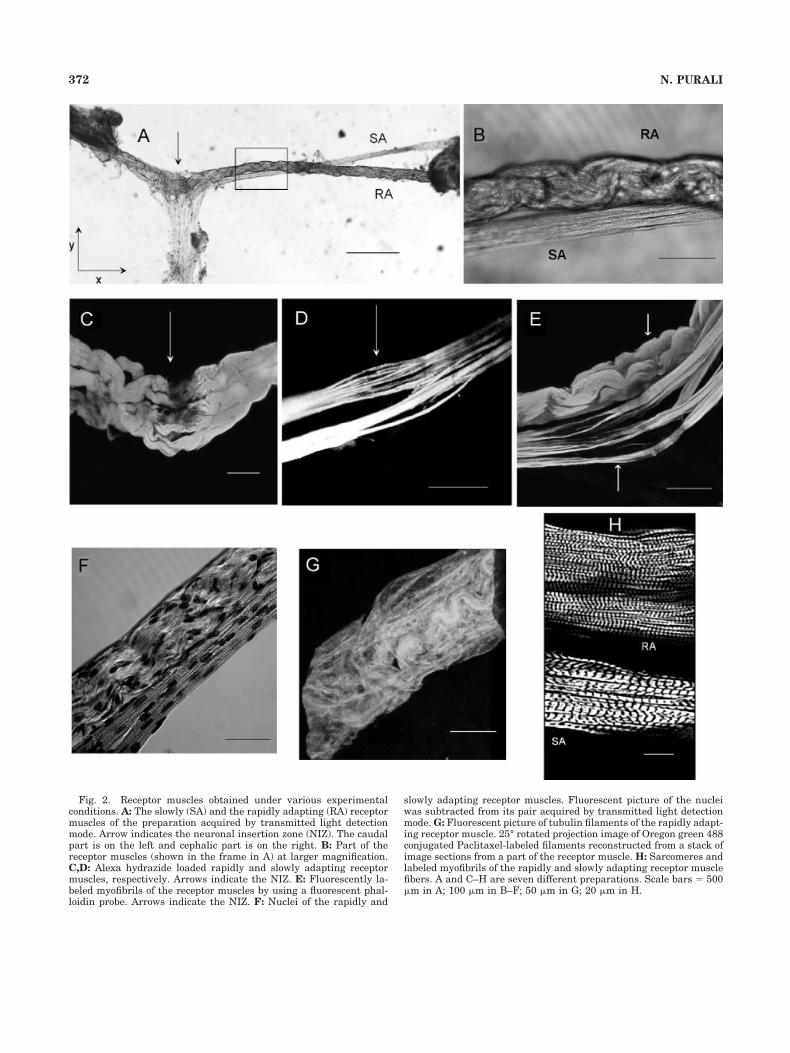
Fig. 2. Receptor muscles obtained under various experimentalconditions. A: The slowly (SA) and the rapidly adapting (RA) receptormuscles of the preparation acquired by transmitted light detectionmode. Arrow indicates the neuronal insertion zone (NIZ). The caudalpart is on the left and cephalic part is on the right. B: Part of thereceptor muscles (shown in the frame in A) at larger magnification.C,D: Alexa hydrazide loaded rapidly and slowly adapting receptormuscles, respectively. Arrows indicate the NIZ. E: Fluorescently la-beled myofibrils of the receptor muscles by using a fluorescent phal-loidin probe. Arrows indicate the NIZ. F: Nuclei of the rapidly and
slowly adapting receptor muscles. Fluorescent picture of the nucleiwas subtracted from its pair acquired by transmitted light detectionmode. G: Fluorescent picture of tubulin filaments of the rapidly adapt-ing receptor muscle. 25° rotated projection image of Oregon green 488conjugated Paclitaxel-labeled filaments reconstructed from a stack ofimage sections from a part of the receptor muscle. H: Sarcomeres andlabeled myofibrils of the rapidly and slowly adapting receptor musclefibers. A and C–H are seven different preparations. Scale bars � 500�m in A; 100 �m in B–F; 50 �m in G; 20 �m in H.
372 N. PURALI
The receptor muscle could conceptually be divided intocephalic and caudal parts, in reference to the place wheresensory neurons inserted. The caudal part was 40 � 5%(n � 13, P � 0.0004) shorter than the cephalic part (Fig.2A). The widths of the receptor muscle at the cephalic andcaudal parts were 123.8 � 4.12 and 129.7 � 6.2 �m (n �24), respectively (Fig. 2A,B). However, at the receptorneuronal insertion zone, muscle thickness 153.6 � 9.2 �mwas significantly (P � 0.0095) larger than that measuredat any other part of the muscle (Fig. 2C). Both parts of thefiber were spiral in shape, and had many sarcolemmalinvaginations developing gradually into some musclebranches. In the cephalic part of the receptor muscle 2–3main muscle branches were distinctly observed towardsthe NIZ. The major branches were subdivided into finer,closely located branches. Some branches inserted into theNIZ, while some passed through it to the caudal part of thereceptor muscle (Fig. 2C). The caudal part of the receptormuscle had 3–6 large muscle branches. The fluorescentdye injected into one of the major cephalic musclebranches diffused into its finer branches rapidly but re-quired 0.2–0.5 hours to diffuse into the other neighboringmajor muscle branches. If sufficient time was given thedye diffused into the caudal part through the NIZ anddistributed uniformly within the whole muscle fiber (Fig.2C).
In fixed and permeabilized preparations it was possibleto image the myofibrils by using a fluorescent phalloidinprobe. Spiral myofibrils, 0.7–1.3 �m in diameter, lay alongthe receptor muscle fiber (Fig. 2E). A bundle of 12–31 ofthe myofibrils made a muscle branch. Sarcomeres, imagedat larger magnifications, were 2.15 � 0.25 �m in length(n � 6) (Fig. 2H). Spiral organization of the receptor mus-cle branches was supported by a fine tubulin structurecovering the muscle branches, providing connectionswithin the branches (Fig. 2G). A nucleic acid specific probe(Syto-Orange) labeled many cell nuclei in the receptormuscle (Fig. 2F). Those were ovoid in shape with short andlong diameters of �20.6 and 9.3 �m, respectively. Nucleiwere uniformly distributed within and between the myo-fibril bundles of the muscle fiber. About 20 nuclei werecounted for each 100 �m length of the receptor muscle.
Slowly adapting receptor muscle
Slowly adapting receptor muscles lay in pairs with therapidly adapting receptor muscles. The muscle fibers wereparallel and adjacent to each other. However, slowlyadapting receptor muscle was generally located mediallyto the rapidly adapting muscle (Fig. 2A,B). The musclelength was usually 2–4% shorter than that of the adjacentrapidly adapting receptor muscle. The caudal part of themuscle was 34 � 8% shorter than the cephalic part. Ig-noring the NIZ, the slowly adapting receptor muscle wasflat in shape and had a width of 50.4 � 2.51 �m (n � 19).However, in the NIZ the muscle fiber was split into 10–16fine branches and the muscle width increased to 119.7 �6.3 �m (n � 19, P � 0.0001) (Fig. 2D,E). In the majority ofpreparations a major branch passed through the NIZ witha slight reduction in width. However, other branches ta-pered considerably while passing through the NIZ (Figs.2D, 3C). Towards the NIZ, 2–4 muscle branches wereseparated from the rest of the branches. They passed theNIZ by curving in the direction of the sensory neuron andjoined the other group at the other side (Fig. 3C). In itscross section the fiber was not circular but oval. Thus, in
the present work the thickness of the muscle fibers in X-Yplane was defined as the width of the fiber instead of itsdiameter.
Myofibrils were imaged using a fluorescent phalloidinprobe. As shown in Figure 2E, 15–24 myofibrils, 0.8–5.8�m in width, were counted in each receptor muscle fiber.A sarcomere length of 4.61 � 0.28 �m (n � 6) in the slowlyadapting receptor muscle was significantly (P � 0.0002)longer than that of the rapidly adapting receptor muscle(Fig. 2H). A nucleic acid-specific fluorescent probe (Syto-Orange) labeled a population of cell nuclei distributeduniformly within the receptor muscle. Spindly nuclei wereabout 30 and 6.7 �m in length and width, respectively.About 6–10 nuclei were counted for each 100 �m length ofthe receptor muscle (Fig. 2F).
Sensory neuronal insertion zone
In the present study the part of the muscle where sen-sory neuronal dendrites terminate is referred to as theNIZ. The general structure of this particular region inboth receptor muscles was similar. However, some prop-erties differed substantially. In the rapidly adapting re-ceptor the muscle length of the NIZ was 152.4 � 9.6 �m.The nonmuscular part of the NIZ was filled by a mass ofintercellular material, into which the dendrites of therapidly adapting neuron terminated in all directions. Themass of intercellular material was located between thespiral curls of the muscle fiber. The majority of musclebranches passed around the dendrite pile through the NIZwith no contact with the receptor neuron (Fig. 3A). How-ever, a few muscle branches inserted onto the edges of theNIZ (Fig. 3B). Thus, a close contact between the endings ofthe muscle branch and the sensory dendrites was seldomobserved. Myofibrils of the continuous and terminatingtype of muscle branches were similar to those observed inthe remainder of the receptor muscle.
Towards the NIZ the slowly adapting receptor musclerepeatedly subdivided into slender muscle branches (Figs.2D, 3C). Those branches all passed through the NIZ andunited progressively in the other part of the muscle. Con-nective tissue filled the intercellular space. The length ofthe NIZ, 246.7 � 22.6 �m, was significantly longer thanthat of the rapidly adapting muscle (P � 0.0047). Further-more, the increase in the width of the receptor muscle wasmore pronounced in the slowly adapting neuron. Somefine muscle branches intermingled with the neighboringparallel terminal dendrites of the sensory neuron. How-ever, not all of the muscle branches had a neighboringterminal dendrite. Some branches passed through the NIZwith no detectable contact with any part of the neuron(Fig. 3C), while some dendrites inserted into some parts ofthe intercellular material with no detectable musclebranch. The width of the myofibril bundles progressivelydecreased as the muscle fiber divided into branches. How-ever, myofibrils were continuous through the NIZ (Fig.2D). As can be followed in the 90° rotated image of thelabeled myofibrils, a large space surrounded by the musclebranches housed a mass of intercellular filling materialinto which dendrites of the slowly adapting neuron in-serted (Fig. 3D,E). The tubulin structure, supporting thewhole preparation, was continuous through the NIZ ofboth the rapidly and the slowly adapting receptors (Fig.3F).
373STRUCTURE AND FUNCTION IN STRETCH RECEPTOR

Receptor neurons
In the present study morphological measurements wereobtained from the images of 73 receptor neurons loadedwith a fluorescent cell tracker Alexa-488 or 568. Receptorcells were large peripherally located bipolar neurons. Den-drites extending from the peripheral pole of the somainserted into the receptor muscles, while a central exten-sion gave the afferent axon joining to the segmental nerve.The general morphology of both neuron types was similar.However, analysis of the images indicated some importantqualitative and quantitative differences between the re-ceptor neurons (Fig. 1, Table 1).
Rapidly adapting receptor neuron
The rapidly adapting receptor neuronal soma was lo-cated very close to the receptor muscle. In the majority ofpreparations the soma was observed within the branchesof the muscle fiber, and it was not parallel to the X-Y planebut tilted 10–30° around the Y axis (Figs. 1, 3). The somal
shape varied considerably within the preparations (Fig.4). In some preparations (Fig. 4A,D) a large fusiform somacould easily be identified, while a relatively small conicalsoma (Fig. 4C,G) was observed in other preparations. An-other group of neurons had a complex shape where theborders of the soma could hardly be defined (Fig. 4B). Theincidence of such somal shapes, independent of the seg-mental origin of the preparation, was 57, 29, and 14%,respectively. As shown in Figure 4F the neuronal surfacewas not smooth but had a lot of folding and invaginations.The width of the soma in the X-Y plane was 67.96 � 1.85�m (n � 31) and the height in the Z axis was 28.94 � 1.71�m (n � 25). Neuronal soma had a volume of 143*103 �19*103 �m3 and a surface area of 32.5*103 � 2*103 �m2
(n � 25). Peripheral extensions from the soma gave themain dendrite(s) which existed in three different configu-rations. In 38% of the neurons the soma tapered into asingle, thick main dendrite (Fig. 4D), and in another 24%of the neurons a distinctly observed thick dendrite was
Fig. 3. Various fluorescent pictures of the sensory neuronal inser-tion zone in the receptor muscles. A: Rapidly adapting receptor. Alexa488 and Alexa 568 hydrazide loaded into the receptor muscle andneuron, respectively. B: Section of the preparation (30 �m in height)shown in the frame in A imaged at a larger magnification. C: 25°rotated projection image of the slowly adapting receptor. Alexa 488and Alexa 568 hydrazide loaded into the receptor muscle and neuron,respectively. D: Phalloidin-labeled myofibrils in the sensory neuronal
insertion zone. E: 90° rotated image projection reconstructed from thepart shown in frame in D. F: Superimposed picture of tubulin fila-ments (gray) and the receptor neurons (red). Alexa 568 hydrazideiontophoretically loaded into the sensory neurons and preparationsubsequently incubated in Oregon green 488 Paclitaxel. In E, Y and Z,and in the other panels Y and X are the vertical and horizontal axes,respectively. Scale bars � 100 �m in A,C,D,F; 20 �m in B; 50 �m inE.
374 N. PURALI
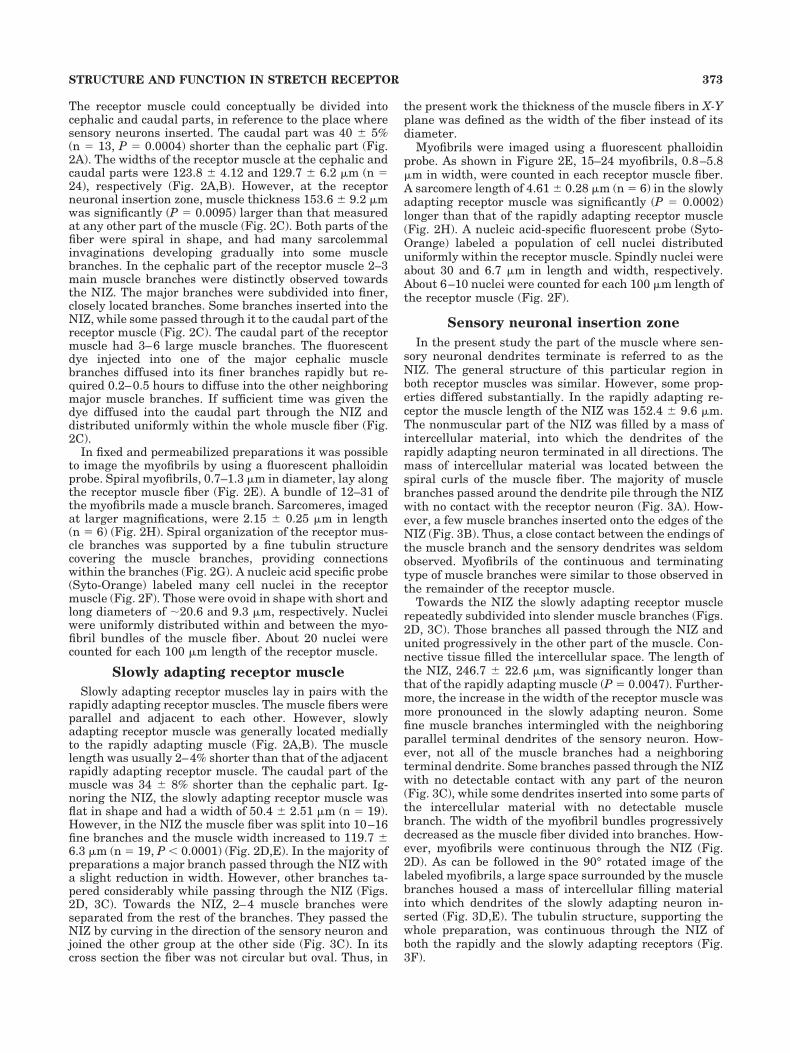
accompanied by several thin dendrites extending from thesoma (Fig. 4A,B). The remainder of the neurons (38%) had2–3 main dendrites similar in dimensions (Fig. 4C,E,G).In reference to the pooled data about the physical dimen-
sions of all the neurons: the main dendrite was 85.9 � 6.1�m long, and 31.8 � 1.5 �m wide (n � 25) with a volumeand surface area of 66.9*103 � 12.47*103 �m3 and32.9*103 � 10.6*103 �m2 (n � 20), respectively (Table 1).
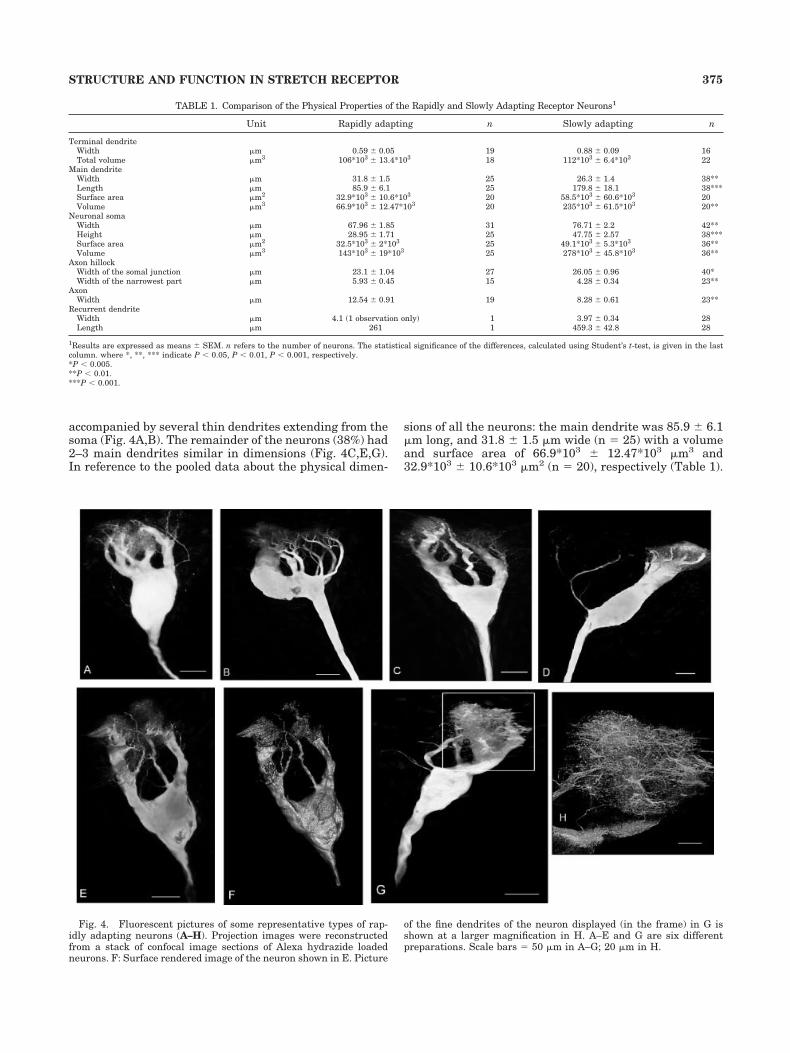
TABLE 1. Comparison of the Physical Properties of the Rapidly and Slowly Adapting Receptor Neurons1
Unit Rapidly adapting n Slowly adapting n
Terminal dendriteWidth �m 0.59 � 0.05 19 0.88 � 0.09 16Total volume �m3 106*103 � 13.4*103 18 112*103 � 6.4*103 22
Main dendriteWidth �m 31.8 � 1.5 25 26.3 � 1.4 38**Length �m 85.9 � 6.1 25 179.8 � 18.1 38***Surface area �m2 32.9*103 � 10.6*103 20 58.5*103 � 60.6*103 20Volume �m3 66.9*103 � 12.47*103 20 235*103 � 61.5*103 20**
Neuronal somaWidth �m 67.96 � 1.85 31 76.71 � 2.2 42**Height �m 28.95 � 1.71 25 47.75 � 2.57 38***Surface area �m2 32.5*103 � 2*103 25 49.1*103 � 5.3*103 36**Volume �m3 143*103 � 19*103 25 278*103 � 45.8*103 36**
Axon hillockWidth of the somal junction �m 23.1 � 1.04 27 26.05 � 0.96 40*Width of the narrowest part �m 5.93 � 0.45 15 4.28 � 0.34 23**
AxonWidth �m 12.54 � 0.91 19 8.28 � 0.61 23**
Recurrent dendriteWidth �m 4.1 (1 observation only) 1 3.97 � 0.34 28Length �m 261 1 459.3 � 42.8 28
1Results are expressed as means � SEM. n refers to the number of neurons. The statistical significance of the differences, calculated using Student’s t-test, is given in the lastcolumn. where *, **, *** indicate P � 0.05, P � 0.01, P � 0.001, respectively.*P � 0.005.**P � 0.01.***P � 0.001.
Fig. 4. Fluorescent pictures of some representative types of rap-idly adapting neurons (A–H). Projection images were reconstructedfrom a stack of confocal image sections of Alexa hydrazide loadedneurons. F: Surface rendered image of the neuron shown in E. Picture
of the fine dendrites of the neuron displayed (in the frame) in G isshown at a larger magnification in H. A–E and G are six differentpreparations. Scale bars � 50 �m in A–G; 20 �m in H.
375STRUCTURE AND FUNCTION IN STRETCH RECEPTOR
Several short intermediate dendrites originated fromthe periphery of the main dendrite. Finally, a vast numberof thin (0.59 � 0.05 �m, n � 19) terminal branches,extending from the tips of the intermediate branches to alldirections, made a pile of dendrites with a bushy appear-ance (Fig. 4H). The bushy structure of the terminal den-drites occupied a space of 229*103 � 38*103 �m3, 46% ofwhich belonged to the terminal dendrites. A recurrentdendrite, an exceptional type of dendrite originating fromthe axon hillock, was observed in only 1 out of 31 rapidlyadapting neurons examined (Fig. 4D). The central exten-sion from the neuronal soma tapered into a conical struc-ture, giving the axon hillock and, at a further distance, theafferent axon (Fig. 6A). the axon hillock had the largestwidth, 23.1 � 1.04 �m (n � 27), at the soma-axonal junc-tion, while at 261 � 14 �m away from the soma-axonaljunction the width gradually decreased to its smallestvalue, 5.93 � 0.45 �m (n � 15). The width of the afferentaxon at about 1 mm away from cell soma was 12.54 � 0.97�m (n � 19) (Table 1).
Slowly adapting receptor neuron
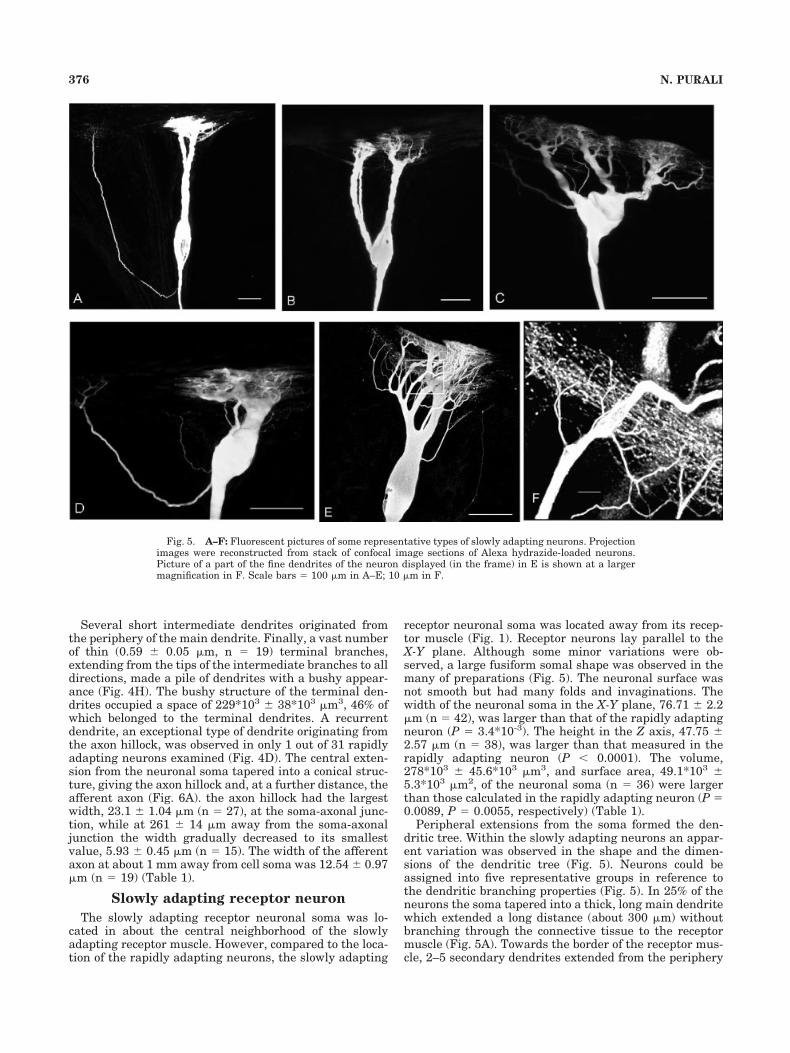
The slowly adapting receptor neuronal soma was lo-cated in about the central neighborhood of the slowlyadapting receptor muscle. However, compared to the loca-tion of the rapidly adapting neurons, the slowly adapting
receptor neuronal soma was located away from its recep-tor muscle (Fig. 1). Receptor neurons lay parallel to theX-Y plane. Although some minor variations were ob-served, a large fusiform somal shape was observed in themany of preparations (Fig. 5). The neuronal surface wasnot smooth but had many folds and invaginations. Thewidth of the neuronal soma in the X-Y plane, 76.71 � 2.2�m (n � 42), was larger than that of the rapidly adaptingneuron (P � 3.4*10-3). The height in the Z axis, 47.75 �2.57 �m (n � 38), was larger than that measured in therapidly adapting neuron (P � 0.0001). The volume,278*103 � 45.6*103 �m3, and surface area, 49.1*103 �5.3*103 �m2, of the neuronal soma (n � 36) were largerthan those calculated in the rapidly adapting neuron (P �0.0089, P � 0.0055, respectively) (Table 1).
Peripheral extensions from the soma formed the den-dritic tree. Within the slowly adapting neurons an appar-ent variation was observed in the shape and the dimen-sions of the dendritic tree (Fig. 5). Neurons could beassigned into five representative groups in reference tothe dendritic branching properties (Fig. 5). In 25% of theneurons the soma tapered into a thick, long main dendritewhich extended a long distance (about 300 �m) withoutbranching through the connective tissue to the receptormuscle (Fig. 5A). Towards the border of the receptor mus-cle, 2–5 secondary dendrites extended from the periphery
Fig. 5. A–F: Fluorescent pictures of some representative types of slowly adapting neurons. Projectionimages were reconstructed from stack of confocal image sections of Alexa hydrazide-loaded neurons.Picture of a part of the fine dendrites of the neuron displayed (in the frame) in E is shown at a largermagnification in F. Scale bars � 100 �m in A–E; 10 �m in F.
376 N. PURALI

of the main dendrite and penetrated the receptor muscle.At the insertion region, intermediate dendrites gave manyterminal branches. All the neurons in the group had one ormore recurrent dendrites originating from the axon hill-ock. Doubling of the long primary dendrites characterizedthe main morphological feature of another group of neu-rons (15%). Both the main dendrites were of similar width(Fig. 5B). Furthermore, the branching properties of themain dendrites were similar to those discussed in theformer group. However, none of the neurons in the grouphad a recurrent dendrite. The volume of the neuronalsoma and main dendrite was similar in both groups.
In 23% of the neurons several thin and short dendritesconnected the soma to the terminal dendrites (Fig. 5C).Such neurons were relatively small and located very closeto the receptor muscle. The mean length of the maindendrite in this group of neurons, 97.1 �m, was similar tothat obtained in the rapidly adapting neurons. The meanvolume of the soma (190*103 �m3), and main dendrites(104*103 �m3), of the neurons in the group were smallerthan those calculated in the rest of the slowly adaptingneurons investigated (P � 0.047, P � 0.03, respectively).
Eighteen percent of the neurons had a rather thick(27.1 � 2.6 �m) and significantly shorter (71.8 � 5.4 �m,P � 0.0001) main dendrite as compared to those in theremainder (Fig. 5D). Those neurons received a short re-current dendrite. Twenty percent of the neurons wereobserved in various intermediate shapes which could notbe sorted into any of the groups defined above (Fig. 5E).
When the data from all the slowly adapting neuronswere compiled, the length (179.8 � 18.1 �m), width(26.3 � 1.4 �m), and volume (235*103 � 61.5*103 �m3) ofthe main dendrite of the slowly adapting neuron wassignificantly different from those of the rapidly adaptingneuron (n � 38, P � 0.0001, P � 0.0091, P � 0.01, respec-tively) (Table 1).
Contrary to the apparent morphological variations inthe main dendrites the peripheral parts of the dendritictree had a rather common structure. Two to ten secondarydendrites branched from the main dendrite. The majorityof those branched from the periphery of the main dendrite.However, a few dendrites extended from various parts ofthe main dendrite (Fig. 5C). Secondary dendritesbranched 2–4 times and gave intermediate dendrites ofvarious sizes. Those branches penetrated almost perpen-dicularly into the receptor muscle. The width of the finalintermediate branch was 2.42 � 0.15 �m (n � 16). Termi-nal dendrites bifurcated from the tip of the intermediatebranches in both directions in parallel to the receptormuscle fiber. They extended from the parent dendritealmost perpendicularly and gave the characteristic T pat-tern for dendritic termination in the slowly adapting neu-rons. The width of the terminal dendrites was 0.88 � 0.09�m (n � 16). Some neighboring terminal branches haddendro-dendritic connections (Fig. 5F). Thus, in all theslowly adapting neurons, dendrites characteristically ter-minated in the receptor muscle by forming a fine latticelying parallel to the receptor muscle. In about half of theneurons investigated all the dendrites terminated at acertain location of the receptor muscle (Fig. 5A,D). How-ever, in the rest of the neurons they terminated at multi-ple sites in the receptor muscle (Fig. 5B,C,E). As shown inFigure 5B,C, terminal dendrites at a certain location ex-tended from a distinct intermediate dendrite. However, ina few neurons an intermediate dendrite supplied branches
to multiple terminal lattices at various locations (Fig.5E,F). Terminal dendrites occupied a volume of 327*103 �56*103 �m3, 34% of which belonged to the terminal den-drites.
A recurrent dendrite was observed in 66.7% of theslowly adapting neurons investigated. Furthermore, in15% of the neurons 2–3 recurrent dendrites were present(Figs. 1, 5). Recurrent dendrites originated, as finebranches of the dendrite, mostly from the axon hillockand, in a few neurons, from the axon. They extended to thereceptor muscle without branching or a change in width.Many small secondary branches developed from the pe-ripheral part of the recurrent dendrite prior to the inser-tion into the receptor muscle at a distant location. Themean width and the length of the nonbranching stem ofthe recurrent dendrite were 3.97 � 0.34 and 459.3 � 42.8�m, respectively (n � 28).
The central extension from the neuronal soma taperedinto a conical structure and produced an axon hillock andafferent axon with qualitative properties similar to thoseobserved in the rapidly adapting axon (Fig. 6A, Table 1).
Fig. 6. Images of the fluorescently labeled axons in the stretchreceptor preparation. A: Afferent axons in fluorescent dye loaded intorapidly (red) and slowly (green) adapting neurons. B: Fluorescentimage of an efferent axon (red) terminating onto the receptor neurons(green) and muscles. C: Section (20 �m in height) of the preparationshown in frame in B imaged at a larger magnification. Scale bars � 25�m in A,C; 100 �m in B.
377STRUCTURE AND FUNCTION IN STRETCH RECEPTOR

However, the initial width (26.05 � 0.96 �m, n � 40) andwidth of the narrowest part of the axonal hillock (4.28 �0.34 �m, n � 23) were smaller than those measured in therapidly adapting neuron (P � 0.04, P � 0.01, respectively).The axonal width at about 1 mm away from the neuronalsoma (8.28 � 0.61 �m, n � 23) was smaller than that inthe rapidly adapting axon (P � 0.0093).
Simulation of electrotonic spread of thereceptor potential
Physiological consequences of morphological differencesbetween the rapidly and the slowly adapting neurons havebeen calculated using the cable equation and a computa-tional neuron model simulating the electrotonic spread ofthe receptor potential.
A major difference between the rapidly and slowlyadapting neurons was related to the physical dimensionsof the main dendrite. Considering the mean values (Table1) it was possible to calculate the attenuation of the re-ceptor potential through the main dendrite. Figure 7shows the calculated charging curves and the steady-statevoltage decrement with the distance for both types of maindendrites. The calculated input resistance (R�) of the av-erage slowly adapting main dendrite (1.9 M�) was largerthan that of the rapidly adapting main dendrite (1.4 M�).Thus, the same current stimulus (10 nA) induced a largerpotential amplitude in the slowly adapting main dendriteat the site of current stimulus than that in the rapidlyadapting main dendrite (Fig. 7A). However, the electro-tonic decay was faster and took place at a shorter distancein the slowly adapting main dendrite (Fig. 7B). The elec-trotonic length of the rapidly adapting main dendrite(0.025) was 55% shorter than that of the slowly adaptingmain dendrite (0. 056). The receptor potential was calcu-lated to attenuate by 2.4% and 5.5% during the electro-tonic propagation in the rapidly and slowly adapting maindendrite, respectively.
At the dendro-somal junction the output resistance ofthe main dendrite, which was also the input resistance of
the somal compartment, was calculated according to thefollowing equation:
R��(RmRi)1/2/(�d3/2) (2)
If there was more than one dendrite, the equivalent diam-eter, deq, was calculated according to the following equa-tion (Rall and Rinzell, 1973) where all the dendrites werecomputationally lumped together into a single virtual den-drite at the junction, Xj:
deq(Xj)�[(di(Xj)3/2]2/3
i�1
n
(3)
In the slowly adapting neurons studied, the calculatedequivalent diameter and output resistance of the maindendrites was in the range of 27–29 �m and 1.8–1.6 M�,respectively.
As shown in Figures 4 and 5, arbitrary branching of thedendrites deviated apparently from that of an idealizedneuron; neither dendrites terminated at the same electro-tonic distance nor was the 3/2 power rule was satisfied toin branching (Rall, 1959; Rall and Rinzell, 1973). Further-more, the physical dimensions of the individual neuronsdiffered considerably from the mean values, particularlywithin the slowly adapting neurons (see Fig. 5). Thus,propagation of the receptor potential could not convinc-ingly be simulated by using mean values and conventionalcable equations (Rall, 1959, 1962). Therefore, individualneurons were modeled.
The 3D image of the neuron pair shown in Figure 1Bwas reduced to a 2D projection. A physical dendrogram(Fig. 8A) was constructed for each neuron by convertingthe dendrites to the equivalent cylinders. An analogoussimplification method was used to produce a single “equiv-alent dendrite” accurately describing the electrotonic be-havior of the dendrites (Clemets and Redman, 1989;Fleshman et al., 1988). The physical dendrogram wasconverted into the electrotonic dendrogram by assumingappropriate values for Rm and Ri (Fig. 8B). An electrotonicequivalent cable was constructed by lumping together thecorresponding parts of the dendritic tree within incre-ments (X � 0.004) of electrotonic distance (Fig. 8C).Thus, at a given electrotonic distance, Xi, the equivalentdiameter, deq(Xi), was calculated according to Eq. 3. Thephysical length of each sequential cable compartment, i,was calculated using the deq(Xi) for that compartment andthe X:
li�X�i (4)
Thus, an equivalent physical cable, with a sequence ofcompartments of varying diameter, was obtained (Fig.8D). Rapidly and slowly adapting equivalent cables con-sisted of a chain of 49 and 77 consecutive compartments,respectively.
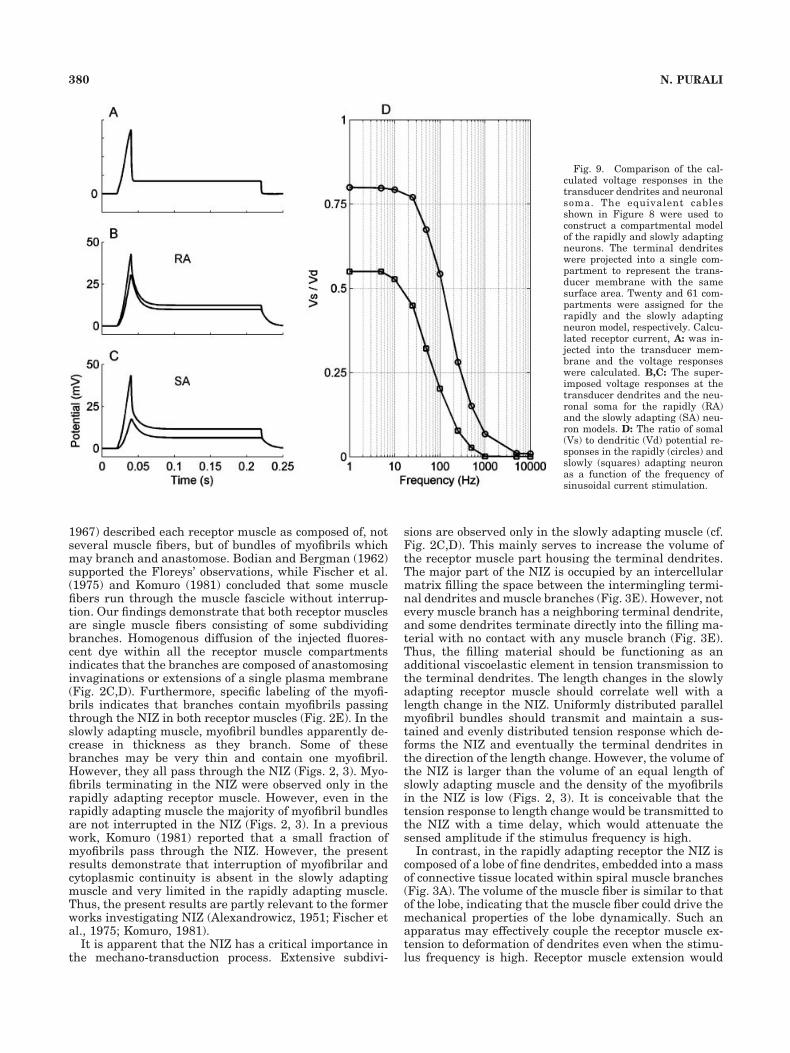
Terminal dendrites have been projected into an equiv-alent compartment and a calculated receptor current witha 30% extension (Fig. 9A) was applied to this compart-ment (Purali, 2002). In both the rapidly (Fig. 9B) andslowly (Fig. 9C) adapting neuron model, a phase delay anda voltage attenuation was observed when the dendriticreceptor potential is compared to the somal receptor po-
Fig. 7. Calculated potential responses in the main dendrites of theslowly (solid line) and rapidly (dashed lines) adapting main dendrites.Potential responses to 10 nA constant current injection at the site ofstimulation A, and decay of the responses as a function of distance B.
378 N. PURALI

tential. Dynamic peak amplitude attenuated more thanthe steady-state level in both models. In the rapidly adapt-ing neuron model the reduction in the dynamic peak andsteady-state potential level was 41 and 25%, respectively(Fig. 9B). However, in the slowly adapting model the re-duction was larger. Dynamic peak amplitude and steady-state level of the somal potential was 2.5 and 1.8 timessmaller than those in the dendritic potential, respectively(Fig. 9C).
Alternatively, sinusoidal current stimulation at variousfrequencies was used to define the frequency-dependentattenuation in the receptor responses. Voltage attenua-tion was related to the frequency of the current stimulus(Fig. 9D). If the steady-state voltage attenuation was ig-nored, the slowly and rapidly adapting dendrites behavedas a sort of low-pass filter with cut-off frequencies at about20 and 100 Hz, respectively (Fig. 9D).
DISCUSSION
Comparison of the structural properties ofthe receptor muscles
In the receptor muscles stretch is transformed into ten-sion, which leads to the deformation of the dendrites andgates the mechano-sensitive transducer channels. As aconsequence, a receptor current is generated giving rise toreceptor potential and impulse responses. Development ofa tension response is the principle function common toboth receptor muscles. However, it was reported that sim-ilar length changes produce different tension responses in
the rapidly and the slowly adapting receptor muscles(Ryqvist et al., 1990, 1994). Furthermore, upon stimula-tion, contraction rates of the slowly and rapidly adaptingmuscles differ substantially (Fields, 1976). Thus, it isnoteworthy to discuss whether morphological differencescorrelate with the physiological properties of the receptormuscle. Thin myofibrils, with short sarcomeres, are neatlyarranged in spiral bundles in the rapidly adapting muscle(Fig. 2). Such properties are typically observed in fastmuscle fibers (Jahromi and Atwood, 1967). The musclefiber is thick and has a spiral shape, supported by atubulin structure (Fig. 2G). Contrary to the spiral shape ofthe rapidly adapting muscle, the slowly adapting muscleis flat. Randomly organized thick and flat myofibril bun-dles of the muscle (Fig. 2) are similar to those of a slowmuscle fiber (Jahromi and Atwood, 1967). Thus, thepresent findings support the notion that the structuraldifferences correlate with the differences in the tensionresponses (Ryqvist et al., 1990, 1994; Purali, 1997).
The part of the receptor muscles where sensory neuro-nal dendrites insert has received particular interest sincethe description of receptors by Alexandrowicz (1951). Theregion was formerly termed the “intercalated tendon.”However, Komuro (1981) used the term “intermediate re-gion” since some myofibrils were shown to pass throughthe region. In the present study this part of the receptormuscle is named the “neuronal insertion zone” to empha-size the specific function of the region. Florey and Florey(1956) reported that each receptor muscle was composedof several muscle fibers. However, Alexandrowicz (1951,
Fig. 8. Embodying neuronalmorphology of the receptors inequivalent models. Morphology ofthe slowly (SA) and the rapidlyadapting (RA) receptor neuronpair displayed in Figure 1B hasbeen projected into a 2D physicaldendrogram, A: Assuming Rm �10,000� cm2 and Ri � 65� cm anelectrotonic dendrogram was cal-culated. B: Corresponding parts ofthe dendrites were computation-ally lumped together for each in-crement of electrotonic distance,X � 0.004, to construct the elect-rotonic equivalent cable. C: Fi-nally, a physical equivalent cableof the whole dendritic tree wasconstructed by calculating thephysical length of each compart-ment. D: The slowly and the rap-idly adapting neurons were dis-played in the left and rightcolumns, respectively. Horizontalaxis in B and C are the same; ver-tical bar is 10 �m.
379STRUCTURE AND FUNCTION IN STRETCH RECEPTOR
1967) described each receptor muscle as composed of, notseveral muscle fibers, but of bundles of myofibrils whichmay branch and anastomose. Bodian and Bergman (1962)supported the Floreys’ observations, while Fischer et al.(1975) and Komuro (1981) concluded that some musclefibers run through the muscle fascicle without interrup-tion. Our findings demonstrate that both receptor musclesare single muscle fibers consisting of some subdividingbranches. Homogenous diffusion of the injected fluores-cent dye within all the receptor muscle compartmentsindicates that the branches are composed of anastomosinginvaginations or extensions of a single plasma membrane(Fig. 2C,D). Furthermore, specific labeling of the myofi-brils indicates that branches contain myofibrils passingthrough the NIZ in both receptor muscles (Fig. 2E). In theslowly adapting muscle, myofibril bundles apparently de-crease in thickness as they branch. Some of thesebranches may be very thin and contain one myofibril.However, they all pass through the NIZ (Figs. 2, 3). Myo-fibrils terminating in the NIZ were observed only in therapidly adapting receptor muscle. However, even in therapidly adapting muscle the majority of myofibril bundlesare not interrupted in the NIZ (Figs. 2, 3). In a previouswork, Komuro (1981) reported that a small fraction ofmyofibrils pass through the NIZ. However, the presentresults demonstrate that interruption of myofibrilar andcytoplasmic continuity is absent in the slowly adaptingmuscle and very limited in the rapidly adapting muscle.Thus, the present results are partly relevant to the formerworks investigating NIZ (Alexandrowicz, 1951; Fischer etal., 1975; Komuro, 1981).
It is apparent that the NIZ has a critical importance inthe mechano-transduction process. Extensive subdivi-
sions are observed only in the slowly adapting muscle (cf.Fig. 2C,D). This mainly serves to increase the volume ofthe receptor muscle part housing the terminal dendrites.The major part of the NIZ is occupied by an intercellularmatrix filling the space between the intermingling termi-nal dendrites and muscle branches (Fig. 3E). However, notevery muscle branch has a neighboring terminal dendrite,and some dendrites terminate directly into the filling ma-terial with no contact with any muscle branch (Fig. 3E).Thus, the filling material should be functioning as anadditional viscoelastic element in tension transmission tothe terminal dendrites. The length changes in the slowlyadapting receptor muscle should correlate well with alength change in the NIZ. Uniformly distributed parallelmyofibril bundles should transmit and maintain a sus-tained and evenly distributed tension response which de-forms the NIZ and eventually the terminal dendrites inthe direction of the length change. However, the volume ofthe NIZ is larger than the volume of an equal length ofslowly adapting muscle and the density of the myofibrilsin the NIZ is low (Figs. 2, 3). It is conceivable that thetension response to length change would be transmitted tothe NIZ with a time delay, which would attenuate thesensed amplitude if the stimulus frequency is high.
In contrast, in the rapidly adapting receptor the NIZ iscomposed of a lobe of fine dendrites, embedded into a massof connective tissue located within spiral muscle branches(Fig. 3A). The volume of the muscle fiber is similar to thatof the lobe, indicating that the muscle fiber could drive themechanical properties of the lobe dynamically. Such anapparatus may effectively couple the receptor muscle ex-tension to deformation of dendrites even when the stimu-lus frequency is high. Receptor muscle extension would
Fig. 9. Comparison of the cal-culated voltage responses in thetransducer dendrites and neuronalsoma. The equivalent cablesshown in Figure 8 were used toconstruct a compartmental modelof the rapidly and slowly adaptingneurons. The terminal dendriteswere projected into a single com-partment to represent the trans-ducer membrane with the samesurface area. Twenty and 61 com-partments were assigned for therapidly and the slowly adaptingneuron model, respectively. Calcu-lated receptor current, A: was in-jected into the transducer mem-brane and the voltage responseswere calculated. B,C: The super-imposed voltage responses at thetransducer dendrites and the neu-ronal soma for the rapidly (RA)and the slowly adapting (SA) neu-ron models. D: The ratio of somal(Vs) to dendritic (Vd) potential re-sponses in the rapidly (circles) andslowly (squares) adapting neuronas a function of the frequency ofsinusoidal current stimulation.
380 N. PURALI
produce a rotation and extension deforming the lobe. Mul-tidirectional forces, deforming the bushy dendrites, maywell be the cause of the hump observed in the tensionresponses to the short range of muscle extensions (Ry-dqvist et al., 1994). Thus, morphological properties of theNIZ in both receptor muscles are relevant to the viscoelas-tic properties of the receptor muscle fibers (Rydqvist et al.,1990, 1994), and contribute significantly to the receptorresponses (Purali, 1997).
Comparison of the structural andelectrotonic properties of the
receptor neurons
Mechano-electrical transduction is the most specializedfeature of this sense organ. Alexandrowicz (1951) pro-posed that this event should take place in the fine den-drites of the receptor neurons. Tao-Cheng et al. (1981),using electron microscopy, concluded that the dendritic tipmembrane might be the region where receptor potential isproduced. However, Erxleben (1989), using patch-clamptechnique, reported that mechano-sensitive transducerchannels are present in the main dendrite and cell soma ofthe receptor neurons. Thus, the transducer current couldalso be generated at those sites. At present, it is notpossible to compare the relative magnitude of the trans-ducer current evoked at those sites to that generated inthe terminal dendrites, since the density distribution ofthe transducer channels in the neuronal membrane hasnot yet been explored. What is known is that in bothreceptor neurons a large volume of terminal dendrites arepresent with a comparable surface area to that of the maindendrite or neuronal soma. Furthermore, receptor muscleextension evokes the maximum deformation specifically inthe terminal dendrites. Thus, terminal dendrites of thereceptor neurons should be the primary elements wheremechanical stimulus is converted into ionic current evenwhen a homogeneous transducer channel distribution ispresumed.
Terminal dendrites occupy a similar space in both re-ceptor neurons. However, a major difference is observed intheir shape and location, which may influence their func-tion. In the slowly adapting neuron the T-shaped bifurca-tion of the terminal dendrites, and their longitudinal in-sertion into the receptor muscle, correlate with themorphological properties of the NIZ (Fig. 5F). The thinand long terminals enable a specific selectivity to sensethe length changes over a broad range with high precision.However, potential signals might be attenuated signifi-cantly in long dendrites. The electrotonic length (L) in-creases as the thickness decreases. Thus, in a 33-�m longterminal dendrite, during the electrotonic transmissionfrom dendrite tip to the bifurcation point, the receptorpotential would be attenuated at a similar magnitude tothat which takes place throughout the main dendrite (l �180 �m). However, the connections between the longitu-dinal dendrite branches create a lattice which increasesthe conductance of the terminal dendrites and facilitatesthe passive propagation of the receptor potential (Fig. 5).Thus, in response to a mechanical stimulation, by theconcerted action of each terminal dendrite unit, an evenlydistributed receptor potential would be generated in thefine dendritic lattice.
In the rapidly adapting neuron a similar volume ofterminal dendrites are concentrated in a lobe of connective
tissue located within the curls of the receptor muscle(Figs. 3A, 4). The physical and electrotonic length of theterminal dendrites are considerably shorter than those inthe slowly adapting neuron. Thus, the receptor potentialpropagates with less attenuation compared to that in theslowly adapting neuron.
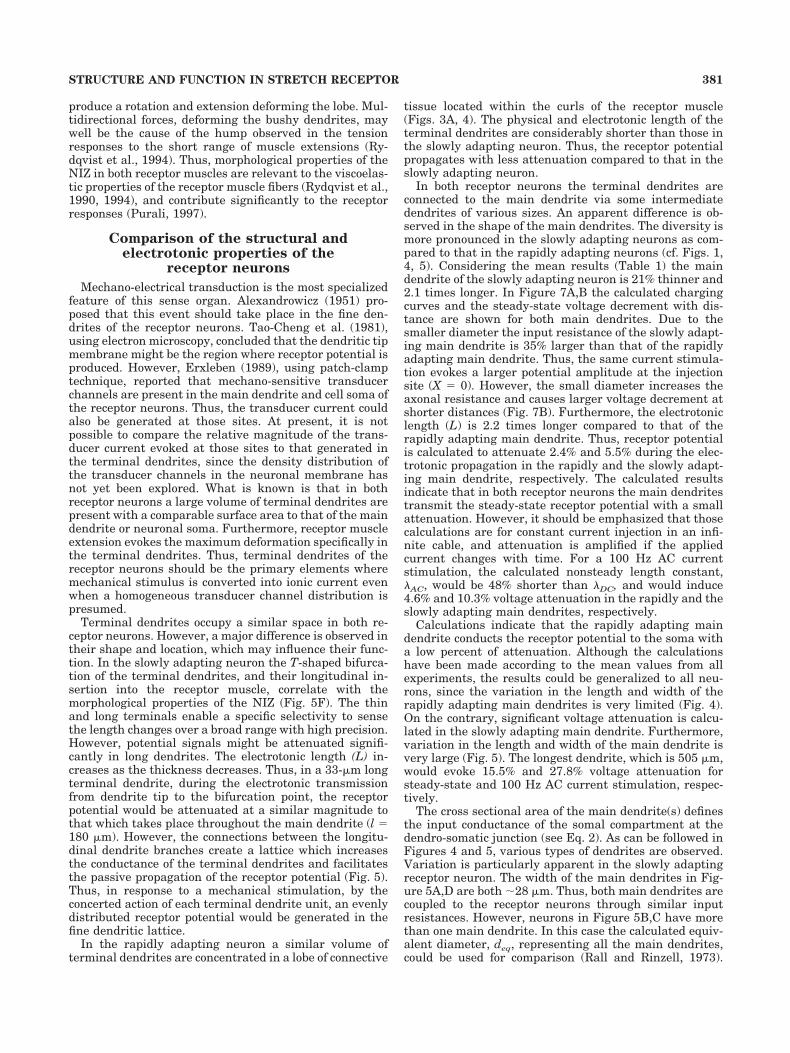
In both receptor neurons the terminal dendrites areconnected to the main dendrite via some intermediatedendrites of various sizes. An apparent difference is ob-served in the shape of the main dendrites. The diversity ismore pronounced in the slowly adapting neurons as com-pared to that in the rapidly adapting neurons (cf. Figs. 1,4, 5). Considering the mean results (Table 1) the maindendrite of the slowly adapting neuron is 21% thinner and2.1 times longer. In Figure 7A,B the calculated chargingcurves and the steady-state voltage decrement with dis-tance are shown for both main dendrites. Due to thesmaller diameter the input resistance of the slowly adapt-ing main dendrite is 35% larger than that of the rapidlyadapting main dendrite. Thus, the same current stimula-tion evokes a larger potential amplitude at the injectionsite (X � 0). However, the small diameter increases theaxonal resistance and causes larger voltage decrement atshorter distances (Fig. 7B). Furthermore, the electrotoniclength (L) is 2.2 times longer compared to that of therapidly adapting main dendrite. Thus, receptor potentialis calculated to attenuate 2.4% and 5.5% during the elec-trotonic propagation in the rapidly and the slowly adapt-ing main dendrite, respectively. The calculated resultsindicate that in both receptor neurons the main dendritestransmit the steady-state receptor potential with a smallattenuation. However, it should be emphasized that thosecalculations are for constant current injection in an infi-nite cable, and attenuation is amplified if the appliedcurrent changes with time. For a 100 Hz AC currentstimulation, the calculated nonsteady length constant,�AC, would be 48% shorter than �DC, and would induce4.6% and 10.3% voltage attenuation in the rapidly and theslowly adapting main dendrites, respectively.
Calculations indicate that the rapidly adapting maindendrite conducts the receptor potential to the soma witha low percent of attenuation. Although the calculationshave been made according to the mean values from allexperiments, the results could be generalized to all neu-rons, since the variation in the length and width of therapidly adapting main dendrites is very limited (Fig. 4).On the contrary, significant voltage attenuation is calcu-lated in the slowly adapting main dendrite. Furthermore,variation in the length and width of the main dendrite isvery large (Fig. 5). The longest dendrite, which is 505 �m,would evoke 15.5% and 27.8% voltage attenuation forsteady-state and 100 Hz AC current stimulation, respec-tively.
The cross sectional area of the main dendrite(s) definesthe input conductance of the somal compartment at thedendro-somatic junction (see Eq. 2). As can be followed inFigures 4 and 5, various types of dendrites are observed.Variation is particularly apparent in the slowly adaptingreceptor neuron. The width of the main dendrites in Fig-ure 5A,D are both �28 �m. Thus, both main dendrites arecoupled to the receptor neurons through similar inputresistances. However, neurons in Figure 5B,C have morethan one main dendrite. In this case the calculated equiv-alent diameter, deq, representing all the main dendrites,could be used for comparison (Rall and Rinzell, 1973).
381STRUCTURE AND FUNCTION IN STRETCH RECEPTOR

Such a calculation gives 28 �m, for the three main den-drites in Figure 5C, and 29 �m for the two main dendritesin Figure 5B, indicating a similarity in the input conduc-tance of the neurons even when multiple main dendritesare present.
Beyond the dendro-somal junction the dendrite enlargesconsiderably and becomes the neuronal soma. Consideringthe nongeometrical shape (Figs. 4, 5), it is not possible tofit an equation properly representing the electrotonicproperties of the soma. However, on the basis of surfacearea measurements some discussion is possible. As a bio-logical cable the soma is the best conducting part of thereceptor neuron, since it has the largest cross-sectionalarea. However, the soma is the leakiest compartment.Considering the mean volume and surface measurements,the volume/surface ratio of the rapidly and slowly adapt-ing soma is 4.4 and 5.6, respectively (Table 1). This ismuch lower than that calculated for a sphere with themeasured mean diameter. It is possible to propose thatboth the irregular shape and surface folding (see Fig. 4F)decrease the conductance of the soma considerably. Thus,a part of the receptor current generated in the terminaldendrites would flow across the somal membrane. Thesomal surface area of the slowly adapting neuron is largerby a factor of 1.51 compared to that of the rapidly adaptingneuron (Table 1). Thus, an additional 51% current stimu-lus would be needed to charge the slowly adapting soma tothe same potential as the rapidly adapting soma. In phys-iological conditions the current stimulus is the receptorcurrent which flows from terminal dendrites through thedendritic tree to the soma (Brown et al., 1978; Rydqvistand Purali, 1993). Considering the electrotonic properties,for a given stimulation (i.e., receptor muscle extension) aslowly adapting soma is estimated to depolarize less com-pared to that which takes place in the rapidly adaptingsoma. The electrotonic voltage attenuation, evoked by thesomal membrane, should particularly be important in therapidly adapting neuron, where action potentials are ini-tiated in the initial part of the axon (Purali, 1997; Puraliand Rydqvist, 1998). As shown in Figure 4B, the rapidlyadapting soma contracted to a smaller size probably toreduce the attenuation.
By using the mean values and the conventional cableequations (Rall, 1959, 1962) passive properties of the re-ceptor neurons could only be partly simulated. For exam-ple, the diameter of the thick main dendrites of the neu-rons shown in Figure 5A,D are both about 28 �m. They are25–33% thicker than the diameter of any main dendritesof the neurons shown in Figure 5B,C. However, the calcu-lated equivalent diameters of the dendrites in Figure 5B,Care 29 and 28 �m, respectively. Thus, the equivalent di-ameter of the slowly adapting main dendrite is larger thanthe mean of the measurements. Therefore, a realisticmodel, taking arbitrary branching and anatomic varia-tions into consideration, is required to improve the fidelityof the simulations. In the present work, as a representa-tive example, the receptor neuron pair shown in Figure 1Bwas modeled. Using 3D images, physical and electrotonicdendrograms were constructed (Fig. 8A,B). At this stage itis possible to construct a compartmental neuron model,where each segment uniquely specifies the location of eachcompartment in the electrical circuit representing the to-pology of the original neuron (Nitzan et al., 1990). How-ever, in that case the number of compartments wouldincrease to several hundreds. Thus, the analogs simplifi-
cation method (Clemets and Redman, 1989; Fleshman etal., 1988) supplied a reliable alternative by reducing boththe geometrical complexity and number of compartments(Fig. 8D).
In both the rapidly and slowly adapting model, thedynamic and steady parts of the potential responses at-tenuated significantly when a calculated current stimuluswas used (Fig. 9A–C). As compared to those obtained byconventional calculations the attenuation in the completeneuron model is much larger. The passive properties ofneuronal soma and the intermediate dendrites, repre-sented in the complete neuron model, should be the causeof the difference. Contrary to the short physical length,the electrotonic length of the intermediate dendrites maybe comparable to that of the main dendrites, since theirdiameter is quite small (see Fig. 8B). The neuronal soma isanother cause of the attenuation. However, the somal sizeof the neuron pair used in the simulations differs by about11%; therefore, the cause of further differences shouldstem from the variations in the dendritic morphology. Itshould be emphasized that the intermediate dendrites,main dendrite(s), and soma lie in series from the primarytransducer site, terminal dendrites, to the impulse initia-tion site, axon hillock. The controlled parameter in biologyand in the model is the receptor current generated in theterminal dendrites. Thus, the membrane potentialchanges are defined by the current clamp conditions. Inconsequence, an increase in the size of the soma would notonly reduce the somal potential response, but also thereceptor potential in the primary transducer will be re-duced even though the stimulus is the same.
The electrotonic voltage attenuation is related to thefrequency of the current stimulus (Fig. 9D). The slowlyand rapidly adapting dendrites constitute a type of low-pass filter with cut-off frequencies at about 20 and 100 Hz,respectively (Fig. 9D). The thick and short dendritic struc-ture of the rapidly adapting neuron enables rapid propa-gation of the receptor potential. Furthermore, propertiesof the electrotonic filter fit well with the firing capacity ofthe receptor neuron, which could fire more frequently than100 Hz (Purali, 2002). Thus, rapid changes in the den-dritic potential could be converted into neural activity inthe soma (or axon hillock) with a small attenuation, asexpected from a dynamic receptor. These properties arecompatible with the morphological properties of the rap-idly adapting receptor muscle discussed above. In con-trast, the thin and long dendritic structure of the slowlyadapting neuron attenuates and slows down the electro-tonic propagation of the dendritic potential to the soma. Inresponse to an incremental increase in the receptor mus-cle length, due to the passive properties of the dendriticpathway, the duration and amplitude of the dendriticpotential response would be represented in finer incre-ments of receptor potential in the soma. Thus, only suffi-ciently large and/or long changes in the dendritic potentialwould be converted into neural activity. Flattening of thetransient peak and reduction of the steady part of theresponse may contribute to the slow adaptation in theneuron by preventing the depolarization block, responsi-ble for the termination of the impulse responses (Purali,1997, 2002; Purali and Rydqvist, 1998). The electrotonicproperties of the slowly adapting neuron are relevant tothe morphological properties of the slowly adapting recep-tor muscle discussed above.
382 N. PURALI
In a former study, using somal electrodes, Rydqvist andPurali (1993) reported that in the slowly adapting neuronthe amplitude of the receptor current was smaller andflattening of the initial peak amplitude was more appar-ent compared to those in the rapidly adapting neuron. Thedifferences may partly stem from the visco-elastic proper-ties of the receptor muscles (Rydqvist et al., 1994). How-ever, considering present recordings and calculations, dif-ferences in neuronal morphology may have a significantrole in the genesis of the reported differences (Fig. 9B,C).
A recurrent dendrite has been observed in the majorityof slowly adapting neurons investigated. In relation to themean length and diameter (459 and 3.97 �m), the poten-tial contribution of a recurrent dendrite to receptor re-sponses would be much fainter compared to those of theprinciple dendrite.
The central extension from the neuronal soma gives theaxon hillock and the afferent axon. The surface area of theaxon hillock is comparable to that of the soma. Thus, thespecific shape of the axon hillock may serve to increase theamount of current directed into the axonal compartment(Fig. 6A). Considering the equation � � 2�/�m, giving theconduction velocity in a tubular axon, and the 51% differ-ence between the axonal diameters, we find the calculatedconduction velocity is 23% faster in the rapidly adaptingaxon. This is compatible with the other properties of theneurons discussed above.
The present work demonstrates that the morphology ofthe rapidly and slowly adapting neurons might haveevolved to construct a sort of biological filter to optimallysense the dynamic and the static features of the mechan-ical stimulus, respectively. Future studies should focus onthe investigation of the density and topographical distri-bution of the voltage-gated and mechano-sensitive ionicchannels.
ACKNOWLEDGMENT
I thank Prof. S. Yorukan for reading the article.
LITERATURE CITED
Alexandrowicz JS. 1951. Muscle receptor organs in the abdomen of Homa-rus vulgaris and Palinurus vulgaris. J Microsc Sci 92:163–200.
Alexandrowicz JS. 1967. Receptor organs in thoracic and abdominal mus-cles of Crustacea. Biol Rev 42:288–326.
Bodian D, Bergman RA. 1962. Muscle receptor organs of the crayfish:functional and anatomical correlations. Bull Johns Hopkins Hosp 110:78–106.
Brown HM, Ottoson D, Rydqvist B. 1978. Crayfish stretch receptor: aninvestigation with voltage-clamp and ion-sensitive electrodes. J Physiol284:155–179.
Clemets JD, Redman S. 1989. Cable properties of cat spinal motoneuronsmeasured by combining voltage clamp, current clamp and intracellularstaining. J Physiol 409:63–87.
Diaz JF, Strobe R, Engelborghs Y, Souto AA, Andreu JM. 2000. Molecularrecognition of taxol by microtubules. Kinetics and thermodynamics ofbinding of fluorescent taxol derivatives to an exposed site. J Biol Chem275:26265–26276.
Erxleben C. 1989. Stretch-activated current through single ion channels inthe abdominal stretch receptor organ of the crayfish. J Gen Physiol94:1071–1083.
Fields HL. 1976. Crustacean abdominal and thoracic muscle receptor or-gans. In: Mill PJ, editor. Structure and function of proprioceptors in theinvertebrates. London: Chapman and Hall. p 65–114.
Fischer W, Fisher H, Uerlingo I, David H. 1975. Licht und electronenmik-roskopishe Untersuchungen an den langsam adaptierenden abdomina-len Dehnungsrezetoren des amerikanishen Fluss Krebses Orconecteslimosus (RAF). Z Microsk Anat Forsch 89:340–366.
Fleshman JW, Segev I, Burke RE. 1988. Electrotonic architecture of type-identified alpha-motoneurons in the cat spinal cord. J Neurophysiol60:60–85.
Florey E, Florey E. 1956. Microanatomy of the abdominal stretch receptorsof the crayfish (Astacus fluviatilis). J Gen Physiol 39:69–85.
Frey T. 1995. Nucleic acid dyes for detection of apoptosis in live cells.Cytometry 21:265–274.
Jahromi SS, Atwood HL. 1967. Ultrastructural features of crayfish phasicand tonic muscle fibres. Can J Zool 45:601–606.
Johnston D, Mia-Sin WD. 1995. Functional properties of dendrites. In:Johnston D, Mia-Sin WD, editors. Foundations of cellular neurophys-iology. Cambridge, MA: MIT Press. p 55–109.
Koch C, Segev I. 1998. Cable theory for dendritic neurons. In: Koch C,Segev I, editors. Methods in neuronal modeling. Cambridge, MA: MITPress. p 28–136.
Komuro T. 1981. Fine structural study of the abdominal muscle receptororgans of the crayfish (Procambarus clarkii). Fast and slow receptormuscles. Tissue Cell 13:79–92.
Nitzan R, Segev I, Yarom Y. 1990. Voltage behavior along the irregulardendritic structure of morphologically and physiologically character-ized vagal motoneurons in the guinea pig. J Neuropysiol 63:333–346.
Purali N. 1997. Mechanism of adaptation in a mechanoreceptor. A study ofmechanical and ionic factors in the crayfish stretch receptors. Stock-holm: Repro Print.
Purali N. 2002. Firing properties of the soma and axon of the abdominalstretch receptor neurons in the crayfish (Astacus leptodactylus). GenPhysiol Biophys 21:205–226.
Purali N, Rydqvist B. 1992. Block of potassium outward currents in thecrayfish stretch receptor neurons by 4-aminopyridine, tetraethylammo-nium chloride and some other chemical substances. Acta Physiol Scand146:67–77.
Purali N, Rydqvist B. 1998. Action potential and sodium current in thestretch receptor neurons in the crayfish. J Neurophysiol 80:2121–2132.
Rall W. 1959. Branching dendritic trees and motoneuron membrane resis-tivity. Exp Neurol 1:491–527.
Rall W. 1962. Theory of biophysical properties of dendrites. Ann N Y AcadSci 96:1071–92.
Rall W, Rinzel J. 1973. Branch input resistance and steady attenuation forinput to one branch of a dendritic neuron model. Biophys J 13:648–688.
Rydqvist B, Purali N. 1991. Potential-dependent potassium currents in therapidly adapting stretch receptor neuron of the crayfish. Acta PhysiolScand 142:67–76.
Rydqvist B, Purali N. 1993. Transducer properties of the rapidly adaptingstretch receptor neuron in the crayfish (Pacifastacus leniusculus).J Physiol 469:193–211.
Rydqvist B, Swerup C, Lannergren J. 1990. Visco-elastic properties of theslowly adapting stretch receptor muscle of the crayfish. Acta PhysiolScand 139:519–527.
Rydqvist B, Purali N, Lannergren J. 1994. Visco-elastic properties of therapidly adapting stretch receptor muscle of the crayfish. Acta PhysiolScand 150:151–159.
Schiemann T, Bomans M, Tiede U, Hohne K-H. 1992. Interactive 3-Dsegmentation of tomographic image volumes. 14. DAGM symposiumMustererkenung. Berlin: Springer. p 73–80.
Swerup C, Rydqvist B. 1992. The abdominal stretch receptor organ of thecrayfish. Comp Biochem Physiol 103A:423–431.
Tao-Cheng JH, Hirosawa K, Nakajima Y. 1981. Ultrastructure of thecrayfish stretch receptor in relation to its function. J Comp Neurol200:1–21.
van Harreveld A. 1936. A physiological solution for freshwater crusta-ceans. Proc Soc Exp Biol 34:428–432.
Waterman-Storer C, Duey DY, Weber KL, Keech J, Cheney RE, SalmonED, Bement WM. 2000. Microtubules remodel actomyosin networks inXenopus egg extracts via two mechanisms of F-actin transport. J CellBiol 150:361–376.
383STRUCTURE AND FUNCTION IN STRETCH RECEPTOR