Structure and Formation of the Lunar Farside Highlands Science 330
4
DOI: 10.1126/science.1193424 , 949 (2010); 330 Science et al. Ian Garrick-Bethell, Highlands Structure and Formation of the Lunar Farside This copy is for your personal, non-commercial use only. . clicking here colleagues, clients, or customers by , you can order high-quality copies for your If you wish to distribute this article to others . here following the guidelines can be obtained by Permission to republish or repurpose articles or portions of articles (this information is current as of November 12, 2010 ): The following resources related to this article are available online at www.sciencemag.org http://www.sciencemag.org/cgi/content/full/330/6006/949 version of this article at: including high-resolution figures, can be found in the online Updated information and services, http://www.sciencemag.org/cgi/content/full/330/6006/949/DC1 can be found at: Supporting Online Material http://www.sciencemag.org/cgi/content/full/330/6006/949#otherarticles , 3 of which can be accessed for free: cites 24 articles This article http://www.sciencemag.org/cgi/collection/planet_sci Planetary Science : subject collections This article appears in the following registered trademark of AAAS. is a Science 2010 by the American Association for the Advancement of Science; all rights reserved. The title Copyright American Association for the Advancement of Science, 1200 New York Avenue NW, Washington, DC 20005. (print ISSN 0036-8075; online ISSN 1095-9203) is published weekly, except the last week in December, by the Science on November 12, 2010 www.sciencemag.org Downloaded from
Transcript of Structure and Formation of the Lunar Farside Highlands Science 330

DOI: 10.1126/science.1193424 , 949 (2010); 330Science
et al.Ian Garrick-Bethell,HighlandsStructure and Formation of the Lunar Farside
This copy is for your personal, non-commercial use only.
. clicking herecolleagues, clients, or customers by , you can order high-quality copies for yourIf you wish to distribute this article to others
. herefollowing the guidelines can be obtained byPermission to republish or repurpose articles or portions of articles
(this information is current as of November 12, 2010 ):The following resources related to this article are available online at www.sciencemag.org
http://www.sciencemag.org/cgi/content/full/330/6006/949version of this article at:
including high-resolution figures, can be found in the onlineUpdated information and services,
http://www.sciencemag.org/cgi/content/full/330/6006/949/DC1 can be found at: Supporting Online Material
http://www.sciencemag.org/cgi/content/full/330/6006/949#otherarticles, 3 of which can be accessed for free: cites 24 articlesThis article
http://www.sciencemag.org/cgi/collection/planet_sciPlanetary Science
: subject collectionsThis article appears in the following
registered trademark of AAAS. is aScience2010 by the American Association for the Advancement of Science; all rights reserved. The title
CopyrightAmerican Association for the Advancement of Science, 1200 New York Avenue NW, Washington, DC 20005. (print ISSN 0036-8075; online ISSN 1095-9203) is published weekly, except the last week in December, by theScience
on
Nov
embe
r 12
, 201
0 w
ww
.sci
ence
mag
.org
Dow
nloa
ded
from
Structure and Formation of the LunarFarside HighlandsIan Garrick-Bethell,1*† Francis Nimmo,2 Mark A. Wieczorek3
The formation of the lunar farside highlands has long been an open problem in lunar science. Weshow that much of the topography and crustal thickness in this terrain can be described by adegree-2 harmonic. No other portion of the Moon exhibits comparable degree-2 structure. Thequantified structure of the farside highlands unites them with the nearside and suggests a relationbetween lunar crustal structure, nearside volcanism, and heat-producing elements. The farsidetopography cannot be explained by a frozen-in tidal bulge. However, the farside crustal thicknessand the topography it produces may have been caused by spatial variations in tidal heating whenthe ancient crust was decoupled from the mantle by a liquid magma ocean, similar to Europa’spresent ice shell.
Since the Apollo 15 laser altimeter experi-ment, it has been widely known that thetopography of the lunar farside highlands
is the highest on the Moon (1). This elevatedregion makes up a large part of the FeldspathicHighlandsTerrane (FHT), the largest of theMoon’sthree major geologic provinces (2). Because thefarside highlands may be a relict of very earlythermal processes (2, 3), understanding their struc-ture and formation may help constrain models ofglobal lunar evolution and magma-ocean pro-cesses in general (4). Theories for the formation ofthe farside highlands include South Pole–Aitken(SP-A) basin ejecta deposits (5), asymmetricnearside/farside cratering (6), magma-ocean con-vective asymmetries (7), and asymmetric crustalgrowth (3). However, there has been no quantita-tive description of the farside highlands to date;therefore, models that describe their formation arepoorly constrained.
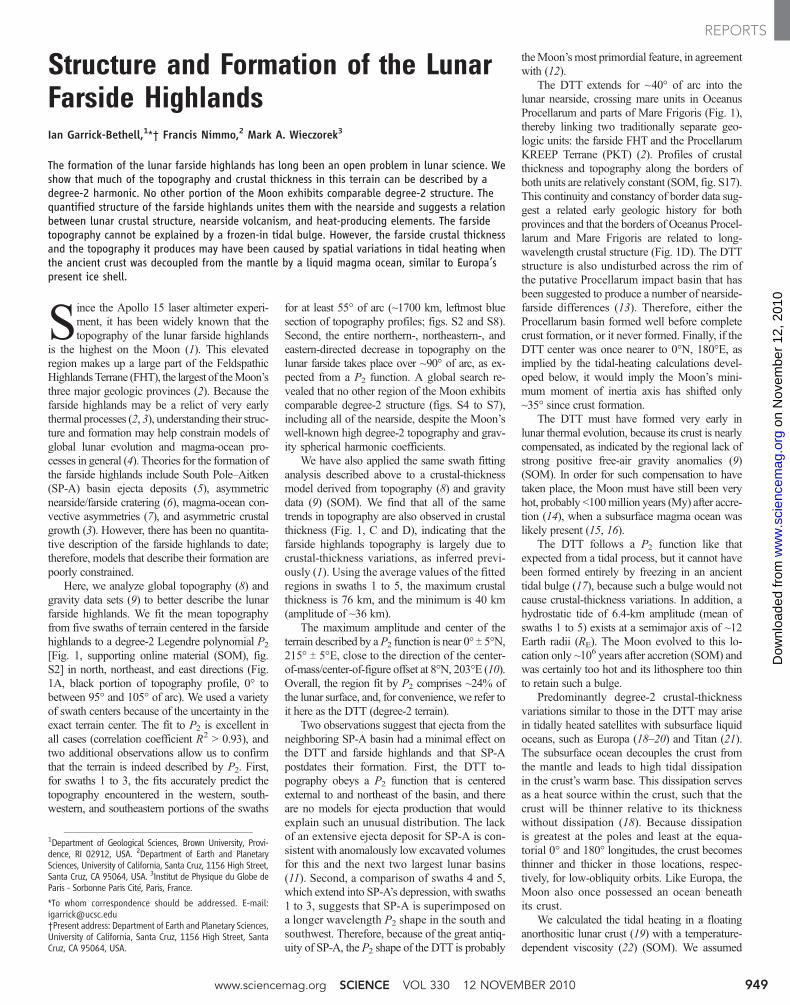
Here, we analyze global topography (8) andgravity data sets (9) to better describe the lunarfarside highlands. We fit the mean topographyfrom five swaths of terrain centered in the farsidehighlands to a degree-2 Legendre polynomial P2[Fig. 1, supporting online material (SOM), fig.S2] in north, northeast, and east directions (Fig.1A, black portion of topography profile, 0° tobetween 95° and 105° of arc). We used a varietyof swath centers because of the uncertainty in theexact terrain center. The fit to P2 is excellent inall cases (correlation coefficient R2 > 0.93), andtwo additional observations allow us to confirmthat the terrain is indeed described by P2. First,for swaths 1 to 3, the fits accurately predict thetopography encountered in the western, south-western, and southeastern portions of the swaths
for at least 55° of arc (~1700 km, leftmost bluesection of topography profiles; figs. S2 and S8).Second, the entire northern-, northeastern-, andeastern-directed decrease in topography on thelunar farside takes place over ~90° of arc, as ex-pected from a P2 function. A global search re-vealed that no other region of the Moon exhibitscomparable degree-2 structure (figs. S4 to S7),including all of the nearside, despite the Moon’swell-known high degree-2 topography and grav-ity spherical harmonic coefficients.
We have also applied the same swath fittinganalysis described above to a crustal-thicknessmodel derived from topography (8) and gravitydata (9) (SOM). We find that all of the sametrends in topography are also observed in crustalthickness (Fig. 1, C and D), indicating that thefarside highlands topography is largely due tocrustal-thickness variations, as inferred previ-ously (1). Using the average values of the fittedregions in swaths 1 to 5, the maximum crustalthickness is 76 km, and the minimum is 40 km(amplitude of ~36 km).
The maximum amplitude and center of theterrain described by aP2 function is near 0° T 5°N,215° T 5°E, close to the direction of the center-of-mass/center-of-figure offset at 8°N, 203°E (10).Overall, the region fit by P2 comprises ~24% ofthe lunar surface, and, for convenience, we refer toit here as the DTT (degree-2 terrain).
Two observations suggest that ejecta from theneighboring SP-A basin had a minimal effect onthe DTT and farside highlands and that SP-Apostdates their formation. First, the DTT to-pography obeys a P2 function that is centeredexternal to and northeast of the basin, and thereare no models for ejecta production that wouldexplain such an unusual distribution. The lackof an extensive ejecta deposit for SP-A is con-sistent with anomalously low excavated volumesfor this and the next two largest lunar basins(11). Second, a comparison of swaths 4 and 5,which extend into SP-A’s depression, with swaths1 to 3, suggests that SP-A is superimposed ona longer wavelength P2 shape in the south andsouthwest. Therefore, because of the great antiq-uity of SP-A, the P2 shape of the DTT is probably
theMoon’smost primordial feature, in agreementwith (12).
The DTT extends for ~40° of arc into thelunar nearside, crossing mare units in OceanusProcellarum and parts of Mare Frigoris (Fig. 1),thereby linking two traditionally separate geo-logic units: the farside FHT and the ProcellarumKREEP Terrane (PKT) (2). Profiles of crustalthickness and topography along the borders ofboth units are relatively constant (SOM, fig. S17).This continuity and constancy of border data sug-gest a related early geologic history for bothprovinces and that the borders of Oceanus Procel-larum and Mare Frigoris are related to long-wavelength crustal structure (Fig. 1D). The DTTstructure is also undisturbed across the rim ofthe putative Procellarum impact basin that hasbeen suggested to produce a number of nearside-farside differences (13). Therefore, either theProcellarum basin formed well before completecrust formation, or it never formed. Finally, if theDTT center was once nearer to 0°N, 180°E, asimplied by the tidal-heating calculations devel-oped below, it would imply the Moon’s mini-mum moment of inertia axis has shifted only~35° since crust formation.
The DTT must have formed very early inlunar thermal evolution, because its crust is nearlycompensated, as indicated by the regional lack ofstrong positive free-air gravity anomalies (9)(SOM). In order for such compensation to havetaken place, the Moon must have still been veryhot, probably <100million years (My) after accre-tion (14), when a subsurface magma ocean waslikely present (15, 16).
The DTT follows a P2 function like thatexpected from a tidal process, but it cannot havebeen formed entirely by freezing in an ancienttidal bulge (17), because such a bulge would notcause crustal-thickness variations. In addition, ahydrostatic tide of 6.4-km amplitude (mean ofswaths 1 to 5) exists at a semimajor axis of ~12Earth radii (RE). The Moon evolved to this lo-cation only ~106 years after accretion (SOM) andwas certainly too hot and its lithosphere too thinto retain such a bulge.
Predominantly degree-2 crustal-thicknessvariations similar to those in the DTT may arisein tidally heated satellites with subsurface liquidoceans, such as Europa (18–20) and Titan (21).The subsurface ocean decouples the crust fromthe mantle and leads to high tidal dissipationin the crust’s warm base. This dissipation servesas a heat source within the crust, such that thecrust will be thinner relative to its thicknesswithout dissipation (18). Because dissipationis greatest at the poles and least at the equa-torial 0° and 180° longitudes, the crust becomesthinner and thicker in those locations, respec-tively, for low-obliquity orbits. Like Europa, theMoon also once possessed an ocean beneathits crust.
We calculated the tidal heating in a floatinganorthositic lunar crust (19) with a temperature-dependent viscosity (22) (SOM). We assumed
1Department of Geological Sciences, Brown University, Provi-dence, RI 02912, USA. 2Department of Earth and PlanetarySciences, University of California, Santa Cruz, 1156 High Street,Santa Cruz, CA 95064, USA. 3Institut de Physique du Globe deParis - Sorbonne Paris Cité, Paris, France.
*To whom correspondence should be addressed. E-mail:[email protected]†Present address: Department of Earth and Planetary Sciences,University of California, Santa Cruz, 1156 High Street, SantaCruz, CA 95064, USA.
www.sciencemag.org SCIENCE VOL 330 12 NOVEMBER 2010 949
REPORTS
on
Nov
embe
r 12
, 201
0 w
ww
.sci
ence
mag
.org
Dow
nloa
ded
from

-50 0 50 100 150
60
80
100
120
140
160
Cru
stal
th
ickn
ess
(km
)
Degrees of arc90
Tidal reference frame shifted 35° east
Model Data x 0.4
A B Tidal Model Crustal Thickness (km)
Sub-Earth point
1
2
5
12
5
4
4
PKT border (3.5 ppm Th)
58 60 62 64 66 68 70 72 74 76 78
1
3
4
2
5
Fit region 95-105°Prediction region
Origin
One half oscillationPlotted on globe
3
3
South Pole-Aitken basin
X
Fit direction
Predictiondirection
X
Imbrium basin
Fig. 2. Lunar crustal thickness compared with a tidal-dissipation model. (A)Mean profiles of lunar crustal-thickness swaths derived from tidal dissipationat a = 20 RE, e = 0.02, Tb = 1175°C, and qo = 27 mW/m2 (black lines), alongwith the profiles from Fig. 1C (multiplied by 0.4, blue lines, arbitrarily offset).Swath dimensions are the same as in Fig. 1. Vertical axis applies to model
swath 1 only, but scale is constant throughout. Fit directions are indicated, butno fits were performed in this figure. (B) Map of crustal thickness used for (A).Model data in both (A) and (B) have been shifted 35° east, because the DTTcenter is ~35° east of the theoretical maximum crustal thickness at 0°N, 180°E.Compare with Fig. 1, C and D; see also fig. S10.
-50 0 50 100 150
-5
0
5
10
15
20
25
30
35
To
po
gra
ph
y (k
m)
Degrees of arc
NearsideFarside
Topography (km)1
2
1
2
3
4
5
5
Fit direction
Predictiondirection
12
5
-90
A
B
270° E
Imbrium basin
Imbrium basin
SP-A basin
South Pole-Aitken basin
43
34
X
Fit region 95-105°Prediction region
One half oscillationPlotted on globe
90
Origin
Oceanus Procellarum &Mare Frigoris border
PKT border
X
Y
Y
Y
-50 0 50 100 1500
50
100
150
200
250
300
350
Cru
stal
th
ickn
ess
(km
)
Degrees of arc
Crustal Thickness (km)
1
2
3
4
5
Fit region 95-105°Prediction region
One half oscillationPlotted on globe
-9090
C
D
Imbrium basin
South Pole-Aitken basin
NearsideFarside
1
2
5
12
5
270° E
Imbrium basin
SP-A basin
43
3
4
Origin
X
Oceanus Procellarum &Mare Frigoris border
PKT border
Fit direction
Predictiondirection
X
Y
Y
Y
-8 -6 -4 -2 0 2 4 6 8 10 10 20 30 40 50 60 70 80 90
Fig. 1. The degree-2 structure of the lunar farside highlands. (A) Meantopography inside the five great-circle swaths shown in (B), fitted to a P2function in the black region, and vertically offset for clarity. Data and fitted P2function beyond the fit region are illustrated in blue with 95% confidenceintervals (dashed lines). Vertical axis applies to swath 1 only, but scale isconstant throughout. X, region described by a possible degree-4 harmonic
(see text and Fig. 2A); Y, point on the PKT border and central to swaths 1 and4. (B) Portions of swaths from (A) plotted over topography data (8). Swaths1 (black) and 5 (red) are averages over large regions. The PKT boundary isbased on the 3.5–parts per million thorium contour (2). Points X and Y from(A) are shown. Black and blue arrows indicate fit and prediction directions,respectively. (C) and (D) Same as (A) and (B), but for crustal thickness.
12 NOVEMBER 2010 VOL 330 SCIENCE www.sciencemag.org950
REPORTS
on
Nov
embe
r 12
, 201
0 w
ww
.sci
ence
mag
.org
Dow
nloa
ded
from
synchronous rotation and that the crust is inconductive thermal equilibrium with tidal heat-ing and an additional basal heat flux (qo) frommantle cooling and radiogenic heat. Importantparameters are the eccentricity (e), semimajoraxis (a), and magma-ocean temperature (Tb).We calculate that, 100 My after accretion, therewas an approximate mean basal heat flux of~27 mW/m2: ~20 mW/m2 from radiogenic magma-ocean liquids and ~7 mW/m2 from mantle cool-ing (SOM).
We find that crustal-thickness differences of21 km (mean = 65 km, minimum = 50 km, max-imum= 71 km) can be generated for e = 0.02, a =20RE, Tb = 1175°C, and qo = 27mW/m2 (Fig. 2).The mean thickness is slightly higher than thepresent estimate of ~45 km, but it is lower thanpresent farside values. The value of a corre-sponds to up to tens of million years of lunarevolution, during which the crust may havegrown by tens of kilometers (SOM), relativelyconsistent with the calculated thickness, givenour uncertainty in early orbital evolution. Further,the value of e is not inconsistent with our knowl-edge of the early lunar eccentricity (SOM). Thevalue of Tb is reasonable based on the tempera-ture of late-stage crystallization products [for in-stance, KREEP basalt liquidus of ~1185°C (23);pyroxene-ilmenite cumulate solidus of ~1125°C(24)] (SOM).
The net crustal-thickness difference arisingfrom dissipation depends on numerous orbitaland thermal parameters that are difficult to con-strain precisely (25). Higher differences mayresult from a basal partially molten zone (26)(SOM), a different rheology, higher e, or higherTb. For example, the use of the above param-eters (with Tb = 1225°C and qo = 30 mW/m2)yields a crustal-thickness amplitude of 44 km(mean thickness = 39 km), which is close tothe observed values. Such a temperature maybe too hot for late-stage magma-ocean liquids
(SOM), but it illustrates the effect of increaseddissipation.
Despite these uncertainties in crustal ampli-tude, the detailed crustal-thickness pattern is verysimilar for all models in which dissipation isstrong, and it can, therefore, be used to test ourpredictions (Fig. 2, SOM, fig. S12). The crustal-thickness patterns in swaths 3 to 5 are in goodagreement with amplitude-scaled tidal modeldata (27), over the regions plotted on the globein Fig. 2B, except for the effect of SP-A. Swath1 has good agreement over ~90° of arc, but ispoorer elsewhere. Swath 2 has good agreementfrom –90° to +50° and also predicts the terrainlabeled “X” in Fig. 1. Generally, the lack ofagreement is due to the superposition of a weakpole-to-equator surface temperature effect anddegree-4 harmonic on the model’s strongerdegree-2 pattern (SOM). Note that swath 2 showsevidence of the predicted degree-4 harmonic atsite X. The case for Tb = 1225°C gives evenbetter agreement in shape without any rescalingof the actual crustal thickness (fig. S10).
Though there is disagreement between modeland observations in some locations, the modelshows clear evidence for a degree-2 pattern thatdominates higher-order effects (SOM). Physically,the imperfect agreementmay be due to subsequentthermal processes that altered the distribution ofcrustal thickness near the PKTand elsewhere (28).Alternatively, polar wander about the axis throughthe primordial sub and anti-Earth points (29)could have averaged out harmonics other than thedominant degree-2 harmonic. In addition, lowercrustal flow may have preferentially removed thehigher-order degree-4 thickness variations (SOM).Most importantly, however, whereas other large-scale geophysical processes (such as convectionandRayleigh-Taylor instabilities) can be describedmathematically in spherical harmonics, there is nosimple reason that they must manifest themselvesgeologicallywith a predominantlyP2 shape (SOM),in contrast to the tidal-dissipation mechanismdiscussed here. Therefore, early tidal dissipationis presently the strongest candidate for the for-mation of the DTT.
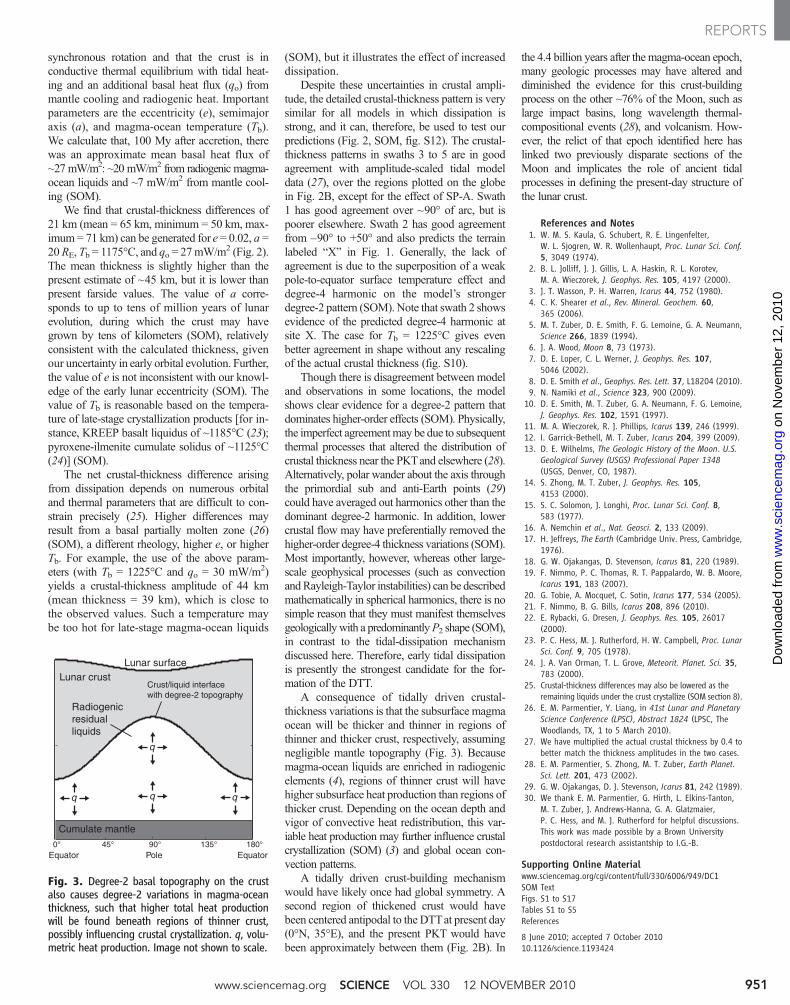
A consequence of tidally driven crustal-thickness variations is that the subsurface magmaocean will be thicker and thinner in regions ofthinner and thicker crust, respectively, assumingnegligible mantle topography (Fig. 3). Becausemagma-ocean liquids are enriched in radiogenicelements (4), regions of thinner crust will havehigher subsurface heat production than regions ofthicker crust. Depending on the ocean depth andvigor of convective heat redistribution, this var-iable heat production may further influence crustalcrystallization (SOM) (3) and global ocean con-vection patterns.
A tidally driven crust-building mechanismwould have likely once had global symmetry. Asecond region of thickened crust would havebeen centered antipodal to the DTTat present day(0°N, 35°E), and the present PKT would havebeen approximately between them (Fig. 2B). In
the 4.4 billion years after the magma-ocean epoch,many geologic processes may have altered anddiminished the evidence for this crust-buildingprocess on the other ~76% of the Moon, such aslarge impact basins, long wavelength thermal-compositional events (28), and volcanism. How-ever, the relict of that epoch identified here haslinked two previously disparate sections of theMoon and implicates the role of ancient tidalprocesses in defining the present-day structure ofthe lunar crust.
References and Notes1. W. M. S. Kaula, G. Schubert, R. E. Lingenfelter,
W. L. Sjogren, W. R. Wollenhaupt, Proc. Lunar Sci. Conf.5, 3049 (1974).
2. B. L. Jolliff, J. J. Gillis, L. A. Haskin, R. L. Korotev,M. A. Wieczorek, J. Geophys. Res. 105, 4197 (2000).
3. J. T. Wasson, P. H. Warren, Icarus 44, 752 (1980).4. C. K. Shearer et al., Rev. Mineral. Geochem. 60,
365 (2006).5. M. T. Zuber, D. E. Smith, F. G. Lemoine, G. A. Neumann,
Science 266, 1839 (1994).6. J. A. Wood, Moon 8, 73 (1973).7. D. E. Loper, C. L. Werner, J. Geophys. Res. 107,
5046 (2002).8. D. E. Smith et al., Geophys. Res. Lett. 37, L18204 (2010).9. N. Namiki et al., Science 323, 900 (2009).
10. D. E. Smith, M. T. Zuber, G. A. Neumann, F. G. Lemoine,J. Geophys. Res. 102, 1591 (1997).
11. M. A. Wieczorek, R. J. Phillips, Icarus 139, 246 (1999).12. I. Garrick-Bethell, M. T. Zuber, Icarus 204, 399 (2009).13. D. E. Wilhelms, The Geologic History of the Moon. U.S.
Geological Survey (USGS) Professional Paper 1348(USGS, Denver, CO, 1987).
14. S. Zhong, M. T. Zuber, J. Geophys. Res. 105,4153 (2000).
15. S. C. Solomon, J. Longhi, Proc. Lunar Sci. Conf. 8,583 (1977).
16. A. Nemchin et al., Nat. Geosci. 2, 133 (2009).17. H. Jeffreys, The Earth (Cambridge Univ. Press, Cambridge,
1976).18. G. W. Ojakangas, D. Stevenson, Icarus 81, 220 (1989).19. F. Nimmo, P. C. Thomas, R. T. Pappalardo, W. B. Moore,
Icarus 191, 183 (2007).20. G. Tobie, A. Mocquet, C. Sotin, Icarus 177, 534 (2005).21. F. Nimmo, B. G. Bills, Icarus 208, 896 (2010).22. E. Rybacki, G. Dresen, J. Geophys. Res. 105, 26017
(2000).23. P. C. Hess, M. J. Rutherford, H. W. Campbell, Proc. Lunar
Sci. Conf. 9, 705 (1978).24. J. A. Van Orman, T. L. Grove, Meteorit. Planet. Sci. 35,
783 (2000).25. Crustal-thickness differences may also be lowered as the
remaining liquids under the crust crystallize (SOM section 8).26. E. M. Parmentier, Y. Liang, in 41st Lunar and Planetary
Science Conference (LPSC), Abstract 1824 (LPSC, TheWoodlands, TX, 1 to 5 March 2010).
27. We have multiplied the actual crustal thickness by 0.4 tobetter match the thickness amplitudes in the two cases.
28. E. M. Parmentier, S. Zhong, M. T. Zuber, Earth Planet.Sci. Lett. 201, 473 (2002).
29. G. W. Ojakangas, D. J. Stevenson, Icarus 81, 242 (1989).30. We thank E. M. Parmentier, G. Hirth, L. Elkins-Tanton,
M. T. Zuber, J. Andrews-Hanna, G. A. Glatzmaier,P. C. Hess, and M. J. Rutherford for helpful discussions.This work was made possible by a Brown Universitypostdoctoral research assistantship to I.G.-B.
Supporting Online Materialwww.sciencemag.org/cgi/content/full/330/6006/949/DC1SOM TextFigs. S1 to S17Tables S1 to S5References
8 June 2010; accepted 7 October 201010.1126/science.1193424
Lunar surface
Cumulate mantle
Radiogenic residual liquids
Crust/liquid interface with degree-2 topography
45° 90° 180°0° 135°PoleEquator Equator
q q
q
q
Lunar crust
Fig. 3. Degree-2 basal topography on the crustalso causes degree-2 variations in magma-oceanthickness, such that higher total heat productionwill be found beneath regions of thinner crust,possibly influencing crustal crystallization. q, volu-metric heat production. Image not shown to scale.
www.sciencemag.org SCIENCE VOL 330 12 NOVEMBER 2010 951
REPORTS
on
Nov
embe
r 12
, 201
0 w
ww
.sci
ence
mag
.org
Dow
nloa
ded
from