STRUCTURAL STYLE AND TECTONIC EVOLUTION OF THE …
103
STRUCTURAL STYLE AND TECTONIC EVOLUTION OF THE NORTHERN MAVERICK BASIN A Thesis by M. STUART SASSER, JR. Submitted to the Office of Graduate and Professional Studies of Texas A&M University in partial fulfillment of the requirements for the degree of MASTER OF SCIENCE Chair of Committee, Bobby Reece Co-Chair of Committee, Judith Chester Committee Member, Zoya Haidari Head of Department, Mike Pope May 2016 Major Subject: Geology Copyright 2016 M. Stuart Sasser, Jr.
Transcript of STRUCTURAL STYLE AND TECTONIC EVOLUTION OF THE …

STRUCTURAL STYLE AND TECTONIC EVOLUTION OF THE NORTHERN
MAVERICK BASIN
A Thesis
by
M. STUART SASSER, JR.
Submitted to the Office of Graduate and Professional Studies of
Texas A&M University
in partial fulfillment of the requirements for the degree of
MASTER OF SCIENCE
Chair of Committee, Bobby Reece
Co-Chair of Committee, Judith Chester
Committee Member, Zoya Haidari
Head of Department, Mike Pope
May 2016
Major Subject: Geology
Copyright 2016 M. Stuart Sasser, Jr.

ii
ABSTRACT
An incorporation of seismic data from the Maverick Basin with other studies
reveals influence from the Paleozoic Ouachita thrust on the Triassic-Jurassic Chittim
Rift’s formation and the influence of this rift on the later Cretaceous-Eocene Laramide
compressional event. These features are the geologic remnant of a complete cycle of
continental tectonics; from collision to rifting and eventual flooding. Signatures of all of
these events are preserved in the subsurface of southwest Texas. I suggest that tectonic
inheritance at a range of scales is recognized in the successive imprints of the continental
margins preserved within the crust of the present Maverick Basin.
The lithology and structure of a portion of the Maverick Basin in Maverick and
Kinney Counties, Texas, have been reanalyzed using a new 3D seismic volume and two
existing 2D seismic profiles. Amplitude reflectors in the volume were traced, mapped
and correlated with reflectors in the 2D lines. These data were compared with published
well data and used to develop a stratigraphic-structural model of the basin identifying the
probably lithologies of the subsurface layers and key structural features. The geographic
and geologic relationships established are used to illustrate a sequence of tectonic
inheritance and the role of preexisting structural styles in subsequent tectonic events.
The model reveals northeast directed thrusting of Paleozoic marine sediments
along a west-northwest to east-southeast striking thrust fault related to the Ouachita
Orogeny. This thrusting abated against the pre-existing Devil’s River Uplift north of the
study area. Subsequent to thrusting, Triassic-Jurassic rifting formed the Chittim Rift,

iii
one of many half-graben sub-basins to form in the Maverick Basin during this time. The
orientation of the rift axis parallel to the Ouachita thrust fault and not to the ultimate
spreading center in the Gulf of Mexico, suggests utilization of pre-existing structural
weaknesses. A left lateral transform fault active during rifting potentially formed along
an existing tear fault in the Ouachita thrust. Movement along this fault constrained the
northern wall of the Chittim Rift as well as lead to a stratigraphically distinct mini-basin
within the Chittim Rift from pull-apart motion along the fault. Compression during the
Laramide Orogeny produced the Chittim Anticline in Cretaceous marine layers above
the Chittim Rift. The Chittim anticlinal axis is parallel and geographically collocated
with the Chittim Rift axis, providing further evidence of tectonic inheritance and
utilization of pre-exiting features.
The data presented here helps to demonstrate the role of inherited structural
features from specific tectonic events at the local scale on subsequent sedimentation and
deformation, and how the presence of these local-scale subsurface features are
significant to the overall development of the current south Texas continental margin.
The resultant stratigraphic-structural model of this portion of the Maverick Basin helps
to further unravel the history of the Gulf of Mexico passive margin specifically, and the
development of passive margins in general, where features may not always appear to be
oriented optimally to the far-field stress state. The study also presents a clear
interpretation of the little-studied Central Maverick Basin area and adds to the limited
studies on the region.

iv
DEDICATION
To Dan A. Hughes, Sr.: Aggie, Wildcatter & Grandfather

v
ACKNOWLEDGEMENTS
I would like to thank my committee co-chairs, Dr. Bobby Reece and Dr. Judi
Chester, and my other committee member, Dr. Zoya Haidari, for their guidance and
support throughout the course of this research, and for their course instruction during my
graduate studies.
Thank you to Dan A. Hughes Co. for the access to the seismic survey that formed
the foundation of this research. I also want to extend my gratitude to the Houston
Geologic Society, the American Association of Petroleum Geologists, and the Society of
Independent Professional Earth Scientists for financial support in pursuit of my degree.
Thanks also go to my friends and colleagues and the faculty and staff of the
Geology and Geophysics Department for making my time at Texas A&M University a
great experience.
Finally, thanks to my mother and father for their understanding.

vi
TABLE OF CONTENTS
Page
1. INTRODUCTION ................................................................................................ 1
1.1 Purpose of the Study ..................................................................................... 2
1.2 Geologic Background .................................................................................... 2
1.2.1 Deformation Predating Events Interpreted in this Study ...................... 3
1.2.2 Assembly of Pangea: The Ouachita Orogeny ....................................... 7
1.2.3 Breakup of Pangea: Opening of the Gulf of Mexico ............................ 12
1.2.4 Post-Rift Environment and Laramide Compression ............................. 13
1.2.5 Location of the Study Area Relative to Geologic Features .................. 17
1.2.6 Stratigraphic Assumptions Used in this Study ..................................... 18
1.3 Data ............................................................................................................... 21
1.3.1 3D Seismic Data ................................................................................... 21
1.3.2 Well Log Data ....................................................................................... 23
1.4 Methods ......................................................................................................... 23
1.5 Velocity Assumptions ................................................................................... 28
2. SEISMIC RESPONSE IN THE MAVERICK BASIN ......................................... 30
2.1 Deep Seismic Observation in Study Area ..................................................... 30
2.2 Seismic Observations above Deep Reflectors in Study Area ....................... 35
2.3 Seismic Observations from Surface of Study Area ....................................... 40
3. STRUCTURAL INTERPRETATION OF SEISMIC DATA ............................... 42
3.1 Seismic Response in Passive Margins Cut by Thrust Faults ........................ 42
3.2 Interpretation of Ouachita Thrust .................................................................. 44
3.3 Interpretation of Maverick Basin Rifting ...................................................... 51
3.3.1 Rift Geometry ......................................................................................... 52
3.3.2 Change in Geometry Across Rift Axis ................................................... 55
3.3.3 Relation of Rift to Ouachita Thrusting ................................................... 55
3.4 Changes in Rift Geometry and Interpretation of Transform Faulting ........... 57
3.4.1 Axial Change in Rift Geometry .............................................................. 57
3.4.2 Seismic Interpretation of Transform Faulting ........................................ 58
3.4.3 Transform Faulting and Effect on Rift Geometry .................................. 59
3.5 Stratigraphy in Thrusted Zone ....................................................................... 64
3.6 Stratigraphy of the Rift .................................................................................. 64
3.6.1 Relation to Well Data ............................................................................. 64
3.6.2 Relation to Structure ............................................................................... 67

vii
Page
4. EVOLUTION OF MAVERICK BASIN CARBONATE SYSTEM .................... 68
4.1 Carbonate Sequence in Seismic Data ............................................................ 68
4.2 End of Rifting and Transition in Depositional Environment ........................ 69
4.3 Folding During the Laramide Orogeny ......................................................... 72
4.4 Carbonate Deposition, Rifting, and Differential Compaction ....................... 74
5. SUMMARY OF FINDINGS: RECONSTRUCTION OF THE CENTRAL
MAVERICK BASIN ............................................................................................. 77
5.1 Stratigraphic-Structural Model Relating Subsurface Structures in the
Study Area ..................................................................................................... 77
5.1.1 Hypothesis on Relationship of the Texas Lineament to Study Area ...... 78
5.1.2 Ouachita Thrust ...................................................................................... 79
5.1.3 Relationship of Ouachita Thrust to Maverick Basin Rifting .................. 80
5.1.4 Relationship of Laramide-Age Folding to Maverick Basin Rifting ....... 82
5.2 Reactivation of Deep Faulting ....................................................................... 83
5.2.1 Carta Valley Fault Zone .......................................................................... 83
5.2.2 Possible Reactivation of Faults in Study Area ....................................... 84
5.3 Implications of Evolutionary Models ............................................................ 86
5.4 Conclusions ................................................................................................... 87
REFERENCES........................................................................................................ 90

viii
LIST OF FIGURES
Page
Figure 1 Comparison of Paleo-structures from two studies representing the
assembly of the southern North American continent ..................................... 4
Figure 2 Map of Paleozoic tectonic features in North America from extensional
rifting .............................................................................................................. 5
Figure 3 Regional map showing subsurface location of key tectonic features in the
study area ....................................................................................................... 8
Figure 4 2D profile with interpretation of thrust ramp in Ouachita Interior Zone
presented by Evans and Zoerb (1984) ........................................................... 11
Figure 5 Paleogeographic reconstruction of North America in the Late Triassic ....... 14
Figure 6 Location of Maverick Basin and Cretaceous carbonate reef trends .............. 15
Figure 7 Generalized stratigraphic section for regional area of the study area
with formation names, ages, and lithology ................................................... 20
Figure 8 Google Earth image of a portion of Maverick County, Texas and
surrounding areas and location of 2D profiles extracted from 3D data
in this study ................................................................................................... 22
Figure 9 2D seismic line in central Maverick County depicting buried
half-graben feature below flat-lying sediments............................................. 26
Figure 10 2D profile extraction from 3D data reflecting structure below thrust
ramp defined in this study ............................................................................. 31
Figure 11 Time slices at the 2,384 ms (A & C) and 2,568 ms (B & D) two-way
travel time level for the study area ................................................................ 32
Figure 12 2D seismic profile extracted from 3D data showing in-strike structure
below thrust ramp defined in this study ........................................................ 33
Figure 13 2D seismic profile extracted from 3D data showing structure along
the rift axis defined in this study ................................................................... 37
Figure 14 2D seismic profile extracted from 3D data showing reflectors
representing the thrust ramp in a perpendicular to rift axis perspective
as defined by this study ................................................................................. 38

ix
Page
Figure 15 Time slices through 3D data identifying major structural features and
lithology at Paleozoic (A), Jurassic (B) and Cretaceous (C) time periods ... 39
Figure 16 Time slice displaying discontinuity data at the time level 1,232 ms in
the study area depicting major structural features affecting Jurassic
aged strata...................................................................................................... 41
Figure 17 Alignment of the northwestern edge of Fig. 12 and southeastern edge of
the 2D seismic profile from Evans and Zoerb (1984) (Fig. 4) to form a
long 2D profile from the study area through Kinney County to the area
of the Devil’s River Uplift ............................................................................ 45
Figure 18 2D profile extraction from 3D data reflecting relation of interpreted
lithology to thrust and rift geometry defined by this study ........................... 46
Figure 19 3D cube view of seismic data from the study area depicting structural
features identified in the data and the associated lithology .......................... 54
Figure 20 2D seismic profiles extracted from 3D data depicting seismic responses
along interpreted strike-slip faulting in the study area .................................. 61
Figure 21 2D profile extraction from 3D data showing seismic response to
mini-basin forming along strike-slip fault defined by this study .................. 62
Figure 22 Two-way-travel time map of the Sligo formation (Figs. 13, 14) and
interpreted structure ...................................................................................... 70
Figure 23 2D seismic profile through central Maverick County flattened along
Glen Rose marker to show thickening of Cretaceous sediments above
the interpreted rift .......................................................................................... 75
Figure 24 3D stratigraphic-structural model of the entire data set showing relation
of structural features defined by this study to interpreted lithology ............. 81
Figure 25 2D profile extraction from 3D data reflecting broken seismic reflectors
in vertical zones in the Cretaceous rock overlying deeper structures
identified in this study ................................................................................... 85

x
LIST OF TABLES
Page
Table 1 Table of wells identified in the region of the study area that penetrated
strata below the thick Carbonate section overtopping the Paleozoic
through Jurassic aged structural features ...................................................... 25

1
1. INTRODUCTION
The development of fracking technology has engendered new interest in the
geology of South Texas and spawned debate over the evolution of the Maverick Basin
and surrounding area. Research on the Maverick Basin has focused largely on the
carbonate succession of Cretaceous limestones, chalks and shales because of their
potential for hydrocarbon production [e.g., Hackley, 2012; Donovan & Staerker, 2010;
Bebout & Loucks, 1974]. Research into the structural development and origin of the
southern North American continent in southwest Texas has been limited. Studies that
have focused on the deeper structure have argued that the greater Maverick Basin is
anchored by a late Triassic or Jurassic-aged rift structure that may reflect the extensional
regime that opened the proto-Gulf of Mexico [Alexander, 2014; Scott, 2004; Salvador,
1987]. Further investigation has revealed that structures in the Maverick Basin may
have been influenced by the broadly defined Paleozoic Delaware Rift (sometimes called
the Rio Grande Rift) and by the Appalachian-Ouachita-Marathon orogenic episode [e.g.,
Salvador, 1987]. The Maverick Basin most likely represents a series of sub-basins each
with a unique, but related, geologic and tectonic character. As this area repeatedly
flooded during the post-rifting stage, the shale-gas and carbonate hydrocarbon reservoirs
such as the Eagle Ford, Wilcox, and Buda, were deposited on top of the structure.

2
1.1. Purpose of the Study
The purpose of this investigation is to (1) characterize the stratigraphic and
structural evolution of a portion of the Maverick Basin located in northern Maverick
County, Texas (Fig. 1), by analyzing a newly available 3D seismic volume, and
combining with previous work of others, (2) develop a stratigraphic-structural model for
the study area that illustrates the influence of regional tectonic events in the formation,
subsequent filling, and deformation of the rift basin in northern Maverick County, Texas.
Specific questions addressed include: (1) What does the geometry of the Maverick Basin
tell us about the basin’s relation to the Rio Grande Rift, Ouachita orogenic processes,
and the opening of the Gulf of Mexico, and is there evidence of structural inheritance for
subsequent events? (2) What do the basin shape, thickness of lithologic units, and
stratigraphic relationships indicate regarding the relative timing of rift propagation and
depositional events? (3) How does this study change our understanding of a complicated
tectonic system that has undergone multiple deformation events with respect to the full
range of scales for continental reconstruction?
1.2. Geologic Background
A complex structural history, dating back as far as the Proterozoic, is evident in
the subsurface in the portion of the Maverick Basin located in Maverick County, south
of Del Rio, Texas. Faults and distinct macroscopic lineaments are local signatures of

3
ancient tectonic events associated with the formation and destruction of the
supercontinents Rodinia and Pangea, and later deformation and deposition
commensurate with the opening of the Gulf of Mexico, transgression during the
Cretaceous, and the Laramide orogeny [Condon and Dyman, 2006].
1.2.1. Deformation Predating Events Interpreted in this Study
The southwest Texas subsurface contains several structural features of the late
Proterozoic that formed in response to the assembly and subsequent break-up of Rodinia
[e.g., Adams, 1993; Ewing, 1987, Muehlberger, 1980]. Between ~1 and 1.3 Ga, the
assembly of Rodinia occurred as multiple events sutured different elements together with
the cratonic Laurentia [e.g., McLelland et. al., 1996; Mosher, 1998]. The Grenville front
at the leading edge of this suture can be mapped in the subsurface through north and
west Texas [Thomas, 2006; Muehlberger, 1980] (Fig. 1). Thomas (2006) suggests
possible inheritance from a dextral offset in the Laurentian craton along a bend in the
Grenville front from south of central Tennessee to where the front can be located in the
subsurface in north Texas (Fig. 1b). Another linear zone, termed alternately the Texas
Lineament or Frio River Line, is located along the present day Rio Grande River near
the study area, and extends south to near Corpus Christi and west-northwestward to El
Paso, Texas [Ewing, 1985, 1987; Muehlberger, 1965] (Fig. 1a). The Texas Lineament is
a well-defined zone of fracture that was reactivated multiple times and that separates less
deformed crust to the north and east, from more deformed crust to the south

4
Figure 1. Comparison of Paleo-structures from two studies representing the assembly of the southern North American
continent. Color scheme is added to interpretation from Muehlberger (1965) to coincide with color scheme from
compressional and rifting events of Thomas (2006). The study area for this paper is located on the southwest side of the
Texas Lineament described by Muehlberger (1965, 1980). Note similarity in geographic position with similar demarcation
lines related to Iapetus opening and Pangea accretion from Thomas (2006). A comparison of the two figures indicates that the
continental margin of the southern Laurentia formed promontories to the east of transforms and embayments to the southwest,
and these features acted as controls on each successive collisional or rifting event. The Ouachita thrust front broadly curves
along the eastern and southern margin around these lineaments of deformation and pre-existing structural highs such as the
Marathon Uplift (MU), Devil’s River Uplift (DRU), and Llano Uplift (LU). Additional features and locations from
Muehlberger (1965) include San Antonio, TX (SA), Austin, TX (AU), El Paso, TX (EP), Amarillo, TX (AM), Del Rio, TX
(DR), Ouachita Mountains (OM), Midland Basin (MB), Delaware Basin (DB), Central Basin Platform (CBP), Grenville Front
(GF), Matador Arch (MA), and Fort Clabourne Fault Zone (FCFZ)

5
Figure 2. Map of Paleozoic tectonic features in North America from extensional rifting.
The tectonic features are related to extensional tectonics that began during the first
separation of North American continent from the continent of South America and Africa.
Failed rift basins such as the Reelfoot opened perpendicular to the direction of extension.
Additional rifts parallel to extension opened in the midcontinent along a transfer line
perpendicular to extension from the Florida panhandle to northeast Arkansas (South
Mtn., Mt. Rogers, So. Ok., and Delaware). The rift most closely associated with this
study is the Delaware, and was the last to form probably near the end of the
Pennsylvanian. Map is modified from Adams (1993).

6
[Muehlberger, 1980]. The Texas Lineament is interpreted to be a byproduct of the
assembly of Rodinia similar to the lineament through Tennessee and Arkansas to north
Texas [Thomas, 2006; Muhlberger, 1980].
Rifting during the Cambrian separated the stranded Laurentian craton into the
North American and the South American-African counterparts [Adams, 1993]. An
eastward extension of a large branching rift system throughout the southwestern United
States paralleled the Texas Lineament and separated present day Siberia from the
Laurentia craton between 740 and 800 Ma [Hoffman, 1991; Muehlberger, 1980]. This
lineament parallels broader structural discontinuities in northeastern Mexico and Texas
near Del Rio, extending into the Maverick Basin in southern Val Verde and Maverick
Counties, and defined a zone of deformation throughout subsequent tectonic events
[Ewing, 2010, Muehlberger, 1980]. This rift separated the Laurentian craton from South
American-African proto-continents during Cambrian time (530 Ma), forming the Iapetus
Ocean between them [Thomas, 2006] (Fig. 1b). This event produced the Delaware rift
system that has a northwest-southeast trend along the present day Rio Grande River; the
rift is approximately parallel to the Proterozoic Texas Lineament (Fig. 2).
A restoration of the Iapeatian Ocean rifted margin follows a zig-zag pattern with
northeast striking rift segments and offsetting northwest striking transforms [Thomas,
2006]. In this reconstruction, one such transform parallels the bend in the Grenville
front through Arkansas and to north Texas, and another parallels the Texas Lineament.
The assembly and breakup of Rodinia along the Grenville orogenic front, and the Texas
Lineament, all predate the subsequent events interpreted as part of this study.

7
1.2.2. Assembly of Pangea: The Ouachita Orogeny
During Mississippian to Permian time, the re-convergence of North America and
South America-Africa closed the Iapetus Ocean and formed the supercontinent Pangea
[Thomas, 2006; Hatcher, et. al., 1989] (Fig. 1b). This convergence produced northward
directed thrusting along thrust faults, east-west trending folds, and uplifted Paleozoic
rocks in the area of the present day Maverick Basin [Condon and Dyman, 2006]. The
signature of this uplift is evident in the modern-day Gulf Coast as the Ouachita orogenic
zone and uplift that trends east-northeast to the northeast of the Maverick Basin, and the
Marathon uplift that trends west-northwest, west of the Maverick Basin (Fig. 1a). The
thrust belt displays a sharp change in trend at location of the Texas Lineament similar to
changes in the trend of the thrust beneath the Gulf Coastal Plane through western
Arkansas and eastern Oklahoma [Thomas, 2006] (Fig. 1). As the Ouachita thrust zone
crosses the area of the Texas Lineament from east to west, it bends sharply to the
northwest and then back west across west Texas, south of Marathon [Muehlberger,
1985].
The Devil’s River Uplift is an east-west trending basement high overlain by
metamorphosed Paleozoic strata, located in Val Verde and Kinney Counties at the
northern extent of the Maverick Basin [Webster, 1980; Ewing, 1985] (Fig. 3). Isotopic
dating has shown the Devil’s River Uplift to be middle, and possibly early, Paleozoic in
origin and therefore a preexisting structure during the Ouachita orogeny [Nicholas and
Rozendal, 1975]. This uplift is colocated with a change in the strike of the thrust belt,

8
Figure 3. Regional map showing subsurface location of key tectonic features in the
study area. The Maverick Basin is divided into at least three rifts that are buried beneath
Cretaceous carbonates. From north to south these are the Moody Basin, Paloma Basin
and Chittim Basin. The Moody and Paloma Basin form the buried structure below the
Northern Maverick Sub-basin. The Chittim Basin forms the structure below the Central
Maverick Sub-basin. At the intersection of these two sub-basins, and in the area of the
study area, Alexander (2014) recognized a series of basement highs separating the sub-
basins that he attributed to a feature named the Edward Arch. Additional important
features for this study include the Devil’s River Uplift, Anacacho Mountains, and
Tequesquite and Fitzpatrick Fault Zones. Location of wells from Table 1 shown in this
map. Image modified from Alexander (2014).

9
east-northeast to west-southwest to the west of the Devil’s River Uplift to southeast-
northwest to the west. (Fig. 1a). During the Ouachita event, the Devil’s River Uplift
acted as a buttress to thrust faulting [Webster, 1983]. The angle of collision between
North America and South America-Africa varied along its trend due to the interaction of
salients and promontories along the collision front [Thomas, 2006]. The decollement of
the Appalachian-Ouachita thrust is thin-skinned and affected only Paleozoic sedimentary
overburden in salients but cuts down into crystalline basement ricks beneath thinner
sedimentary cover on promontories [Thomas, 2006]. This orientation resulted in the
continual rearrangement of oceanic mini-basins opening and closing between North and
South America in the proto-Gulf of Mexico [Ewing, 1991; Salvador, 1991].
In 1981, Grant Geophysical acquired 2D seismic profiles along the buried
southern extension of the Ouachita orogenic system across southwest Texas. One
seismic profile follows U.S. Highway 277 northward from the Kinney-Maverick County
line to a location northeast of Del Rio (Fig. 3, purple line). To the south of the Devil’s
River Uplift, the line is interpreted to show a thrust fault moving Paleozoic Ouachita
metamorphic and metasediments in the hanging wall against Cambrian through
Pennsylvanian foreland basin deposits [Flawn, 1961; Webster, 1983; Evans and Zoerb,
1984] (Fig. 4). The younger sediments are presumed to have been exposed to only
incipient or low-grade metamorphism during thrust faulting but significant distributed
shearing and hydrothermal alteration [Flawn, 1961, Ewing, 2010]. The consensus
interpretation is that the southern margin of the Devil’s River Uplift is the apex of a
large, low-angle thrust that places weakly metamorphosed Paleozoic rocks on top of un-

10
metamorphosed Paleozoic carbonate and clastic sedimentary rocks formed in the Iapetus
Ocean basin [Thomas, 2006]. The study area lies south of a positive gravity anomaly
and negative magnetic gradient that rims the entirety of the southern United States and
Appalachians and is interpreted to mark the early Paleozoic edge of North American
cratonic continental crust [Nicholas and Rozendal 1975].
The Texas Lineament could mark a zone of change in depositional patterns and
tectonic deformation in southwest Texas [e.g., Evans and Zoerb, 1984; Ewing, 1987;
Adams, 1993]. Evans and Zoerb (1984) suggest that the Texas Lineament and associated
or parallel features, such as the Devil’s River Uplift and Delaware rift, have acted as a
control on the orientations of the shallower faults in the region. 2D seismic
interpretation included the observation that deep-seated faults and basement highs
cutting into and displacing Precambrian metamorphic and lower Paleozoic carbonates
and clastics are expressed in the overlying Cretaceous strata as normal or transform
faults [Evans and Zoerb, 1984] (Fig. 4). Evans and Zoerb (1984) showed that this
thrusting originated deeper than 3,000 ms to the south of the Devil’s River Uplift. Their
interpretation also included multiple thrusts exhibiting a ramp-flat geometry, the flats are
between 1,000 and 1,500 ms two-way travel time near the uplift and closer to 2,000 ms
two-way travel time at the southeastern edge of the 2D seismic profile. The main thrust
of the system is interpreted to terminate unconformably into Cretaceous sediments near
the Devil River’s Uplift in southeastern Val Verde County [Evans and Zoerb, 1984;
Webster, 1980] (Fig. 4, red dashed line). The greater Gulf of Mexico basin, which
includes the Maverick Basin, utilized the general northwest-southeast striking features

11
Figure 4. 2D profile with interpretation of thrust ramp in Ouachita Interior Zone presented by Evans and Zoerb (1984).
Thrust-ramp architecture includes Paleozoic Ouachita Interior Zone Metamorphics (pink) over Lower and Middle Cambrian
metasediments, clastics and Ordovician dolomite (orange). Location of front of Ouachita Thrust (red) interpreted by Evans
and Zoerb. Cretaceous carbonates (blue) rest unconformably on to of thrusts. For approximate location of line see Figure 3.
The location of the Devil’s River Uplift would be to the right of the image, and the interpretation here shows high angle thrust
faults with the hanging wall thrusted up and onto the pre-existing Devil’s River Uplift. Colors added for clarity to reflect
original interpretation by Evans and Zoerb (1984). Descriptions by Evans & Zoerb: Brown: Precambrian basement; Pink:
Paleozoic Ouachita interior zone metamorphics, Orange: Lower and middle Cambrian metasediments, Yellow: Upper
Cambrian clastics (Wilbern and Riley fms.), Green: Ordovician-Ellenburger dolomite. Unshaded regions were not identified
by Evans & Zoerb (1984). Blue: Cretaceous carbonates (not identified by Evans & Zoerb (1984)).

12
associated with the assembly and breakup of Rodinia and the assembly of Pangea during
its formation.
1.2.3. Breakup of Pangea: Opening of the Gulf of Mexico
In the late Triassic, the breakup of Pangea formed a series of failed rift basins
across the Western Gulf Province and the new North American continental margin as it
opened from southwest to northeast [Condon and Dyman, 2006; Salvador, 1991; Adams,
1993] (Fig. 1b). This series of failed rifts stretches from southwest Texas and eastern
Mexico eastward to southern Alabama and along the North American east coast
[Thomas, 2006; Salvador, 1991; Adams, 1993; Ochoa-Camarillo, 1999] (Fig. 5). Unlike
the records of earlier cycles of opening, the failed rifts associated with the breakup of
Pangea are recorded in the modern continental shelf and ocean floor [Thomas, 2006].
Some of those failed rifts were periodically flooded in the middle Jurassic and filled
through the late Jurassic with an extensive sequence of flood deposits, including
carbonates, redbed clastics, and salt [Condon and Dyman, 2006]. The Gulf Embayment
along which the Gulf of Mexico formed was offset from the pull-apart motion of the
Atlantic along a northwest trending transform zone known as the Bahamas fracture zone
[Thomas, 2006] (Fig. 5; see also, Oklahoma-Alabama Transform, Fig. 1). The west-
northwest to east-southeast orientation of rifting west of the Bahamas fracture zone
would allow for the southeastward movement of the Yucatan block of the North
American craton between two transform zones, one roughly parallel to the Texas
13
Lineament and the other parallel and near-to a line through Arkansas and the present-day
Florida escarpment during the Jurassic [e.g., Salvador, 1987] (Fig. 5). This spreading
lead to the extension and thinning of the continental crust to such an extent that the
central Gulf of Mexico basin is underlain by oceanic crust, while the southern United
States from Georgia to Texas, eastern Mexico, the Yucatan, and their associated
continental shelves are underlain by continental crust [Salvador, 1987].
1.2.4. Post-Rift Environment and Laramide Compression
By the Cretaceous period, sandy deltaic clastic sediment as well as carbonates
were deposited in southwest Texas as the Gulf of Mexico and Western Interior Seaway
intermittently connected across a vast swath of North America [Condon and Dyman,
2006]. A geographically stable shelf-edge Sligo reef trend formed southwest to
northeast along the break between the continental shelf and the Gulf of Mexico basin
(Fig. 6a). This reef front was south and east of the rifted portion of the Maverick Basin,
but was overtopped and retreated northward in the region south of the Maverick between
the early Aptian and early Albian to form the Stuart City reef trend [Condon and Dyman,
2006; Rose, 1984] (Fig. 6b). The Sligo and Stuart City shelf-edge reef building events
were separated by a transgressing sea that deposited a lime mudstone and shale known
as the Pearsall formation across all of South Texas, including the Maverick Basin
[Ewing, 2010]. The shelf edge that formed south of the Maverick Basin, influenced the
deposition of the upper Cretaceous carbonate groups in the Maverick Basin by forming a

14
Figure 5. Paleogeographic reconstruction of North America in the Late Triassic, just as rifting began to the south of the
Appalachian-Ouachita-Marathon thrust front (purple). Rift basins formed in the southeastern United States and followed the
front of the belt through Oklahoma (reactivating part of the Southern Oklahoma aulacogen). This study is located in
southwest Texas, to the south of the Ouachita thrust front. Rift basins formed similarly to those in Oklahoma and Mexico in
the area marked simply as “land” in this interpretation in the area now known as the Maverick basin. Interpretation is from
Salvador (1987), with location of Ouachita thrust front and study area superimposed.

15
Figure 6. Location of Maverick Basin and Cretaceous carbonate reef trends. The rift basins that formed in the Triassic and
Jurassic and were filled in through the early Cretaceous and were the location of marine deposition during this time. The
Sligo reef trend (A) is overtopped in the middle Cretaceous and reforms northwestward as the Stuart City reef trend (B).
Stuart City reef trend is closer to the study area than the Sligo. Images modified from Condon and Dyman (2006) and Rose
(1984).

16
lower energy landward-to-reef environment that allowed fine-grained carbonates to bury
the rift structure [Condon and Dyman, 2006; Salvador, 1991]. Although extensive
carbonate deposition occurred at this time, including the Austin chalk and Eagle Ford
shale, no large reefs formed in the Maverick Basin during the late Cretaceous [Condon
and Dyman, 2006; Salvador, 1991].
The transition to marine depositional environment occurred early in the
Cretaceous, but the influx of clastic sediments continued until at least the middle
Cretaceous [Weise, 1979; Bain, 2003]. This is possibly due to the geographic proximity
of the Maverick Basin to the Devil’s River Uplift. Deltas formed within this broad basin
on the shelf [Weise, 1979]. This lead to the Cretaceous section of the Maverick Basin, as
a whole, containing a higher percentage of clastic grains imbedded within carbonates
than the rest of South Texas [Weise, 1979]. Jurassic rift related Maverick Basin
sediments were buried more deeply at this time than equivalent formations of East Texas
[Ewing, 2010].
Finally, the Laramide orogeny affected the area from the west in the latest
Cretaceous and into the Paleogene, producing a series of anticlines and synclines with
axes oriented northwest-southeast across the western Maverick Basin [Ewing, 1991]
(Fig. 3). Surface mapping shows that formations of early Eocene age were affected by
the compression and so the Eocene is assumed to represent the end of Laramide
compression (Scott, 2004). The surface deposits in the Maverick Basin are unique in
South Texas in that there is no longer a thick sequence of Cenozoic clastics present
above the Cretaceous deposits [Condon and Dyman, 2006; Ewing, 2010; Scott, 2004].

17
Condon and Dyman (2006) argues that rapid accumulation of Cenozoic sediments
farther out in the Gulf of Mexico basin resulted from these clastic sediments bypassing
the high shelf areas such as the Maverick Basin where deltaic sands and carbonates had
previously been deposited in the Late Cretaceous. Still, other studies argue that as much
as 21,000 feet (6,400 m) of sediment may have been exhumed from areas of north-
central Mexico from the Late Paleogene to Eocene [Ewing, 2010; Scott 2004]. Since the
Cretaceous, minor uplift and erosion has resulted in a general southeastward dip of two
degrees or less across all of South Texas and in the Maverick Basin area [Condon and
Dyman, 2006; Udden, 1916].
1.2.5. Location of Study Area Relative to Geologic Features
The Northern Maverick Basin sits at the intersection of two tectonic and
depositional regimes: the older Ouachita thrust front and Devil’s River Uplift to the
north and the younger Cretaceous shelf margin to the south (Compare Figs. 1 and 6).
Alexander (2014) described the Northern Maverick Basin as a broad Cretaceous basin
located over a series of narrow Jurassic rift basins, the latter of which reflect a left-
stepping system of grabens and half-grabens associated with a regional southeast to
northwest shear zone (Fig. 3). The Northern Maverick Basin is separated from the
Central Maverick Basin by a southwesterly trending series of basement highs attributed
to a feature termed the Edwards Arch [Alexander, 2014] (Fig. 3). The Edwards Arch is
not extensively used in previous literature, but one interpretation describes it as a pre-

18
Cretaceous positive anticlinal structure with an axis running from south-southwest to
north-northeast in Edwards County (Kunianski, 2001). The origin of the Central
Maverick Basin is unresolved. Alexander (2015) suggests that the Central Maverick
Basin is a single rift basin that formed during the Jurassic and that is overlain by the
Chittim anticline. Scott (2004) describes the Central Maverick Basin as a half-graben
that is filled with Cretaceous carbonates and located behind the reef-dominated shelf
margin. A left-lateral wrench fault system cutting to the basement rocks that is overlain
by zones of intensely faulted rocks are now exposed to the north and on top of the Devils
River Uplift [Webster, 1980]. This study will focus on the area to the south of that
described and mapped by Webster (1980), and between the Northern and Central
Maverick Basins identified by Alexander (2014) (Fig. 3).
1.2.6 Stratigraphic Assumptions Used in this Study
During the Cretaceous, Texas was periodically flooded by a series of shallow
inland seaways that led to the deposition of carbonate shales, limestone and other
carbonates with varying amounts of detrital clastic influence [Ewing, 2010]. Since the
Cretaceous, Texas has been above sea level and has been the site of erosion of sediments
from north to south, and varying degrees of deposition that produced thick Paleogene
and Neogene clastics and unconsolidated alluvium [Salvador, 1987].
The most comprehensive study of pre-late Cretaceous rock units in South Texas
included thorough analysis of limited deep well data [Ewing, 2010]. Basement consists

19
mainly of metamorphosed Paleozoic sandstone, shale and chert laid down in either the
Iapetus or another earlier marine basin [Ewing, 2010; Thomas, 2006]. This basement
rock was variably thrusted and unconformably overlain (to varying extent) by redbed
clastics that formed in response to topographic weathering in rift valleys [Ewing, 2010].
Louann salt was deposited during the Mesozoic but does not extend into the Maverick
Basin according to Ewing (2010), nor does the upper Jurassic “Louark” cycle of
carbonates, overlying evaporates and downdip limestone and shale. The Cotton Valley
cycle in the latest Jurassic likely deposited abundant sand, to the extent that it is present
in the Maverick Basin [Ewing, 2010] (Fig. 7). The Cotton Valley is overlain by the
basal Hosston lowstand of the earliest Cretaceous, that was a time of abundant sandy
sediment deposition seaward into the Gulf of Mexico Basin [Ewing, 2010] (Fig. 7).
Regional transgression deposited mud, followed by a varied clastic-carbonate
succession. Finally, clastic input ceased and carbonates blanketed the area behind the
Sligo reef trend. As this carbonate platform was transgressed, shoals formed behind it
ending with deposition of Pearsall marine muds [Ewing, 2010]. After deposition of the
Pearsall, the Maverick Basin remained flooded throughout the Cretaceous and a series of
carbonates were deposited throughout that time in a relatively low energy, back-reef
environment (Fig. 7). In the study area, the major outcrop and surficial deposit is the
Austin Chalk of the Upper Cretaceous [Dan A. Hughes, personal comm.].

20
Figure 7. Generalized stratigraphic section for regional area of the study area with
formation names, ages, and lithology. Major regional unconformities are also indicated.
The location and timing of the set-up for the two Cretaceous reef trends are shown, with
deposition in the Maverick Basin area occurring landward of both the Sligo and Stuart
City margins. Deposition prior to the Coahuilian is presumed to be all clastic in the
study area. Clastic deposits (brown), carbonate shales (purple) and other carbonates
(blue). Stratigraphic units and unconformities identified by Ewing (2010).

21
1.3 Data
Scott (2004) provided a structural evaluation of the Maverick Basin that looked
beyond the Cretaceous section of the basin. Drawing largely from Scott (2004),
Alexander (2014) extended an interpretation northward into Kinney County and
provided a regional structural context near the 3D Seismic volume analyzed here. The
previous studies did not have access to the 3D Seismic volume.
1.3.1 3D Seismic Data
The 3D seismic data was provided by Dan A. Hughes Company LP located in
Beeville, Texas. The company commissioned over 16,000 acres of 3D seismic on fee
interest property in northern Maverick County, Texas (Fig. 8). The seismic data was
acquired and processed by Reservoir Geophysical in Sugar Land, Texas, and provided to
Dan A. Hughes Company LP in 2009 and 2010. A total of 2,501 samples and 147,681
traces were acquired at a sample rate of 4 ms and a record length of 4,996 ms in 32-bit
IBM Floating Point format. The zero phase, pre-stack time migrated data has a final
datum of 900 feet and a replacement velocity of 8,000 feet per second. The seismic data
is analyzed using Halliburton Corp. Landmark DecisionSpace Interpretation Software to
produce a 3D subsurface interpretation.

22
Figure 8. Google Earth image of a portion of Maverick County, Texas and surrounding areas and location of 2D profiles
extracted from 3D data in this study. The 3D Seismic data is outlined by the thick red line. The study area is bounded to the
west by the Rio Grande River, to the east by Farm to Market Road 1908 and to the north by the Maverick County-Kinney
County line. Seismic boundary locations provided by Dan. A. Hughes Co. Google Earth image insert shows the location of
Maverick County within the State of Texas. Location of 2D seismic profiles from the 3D Seismic volume and presented as
figures to this study are marked in the image for reference.

23
1.3.2 Well Log Data
The Dan A. Hughes Company LP has drilled many shallow wells on the
property, the deepest reaching a max depth of 3,000 feet (914 m). These wells only
encountered carbonate deposits [Dan A. Hughes, personal comm., 2015]. Eight
additional wells, some with publically available paper well logs have been identified
near the study area that were drilled beyond 6,000 feet (1,828 m) and exit the carbonate
sequences overlying the deeper structures (Table 1; for well locations see Fig. 3). The
eight wells are located within fifty kilometers of the 3D seismic data. The publically
available well log data include at least one well with a gamma ray, sonic and porosity
logs. Table 1 summarizes the available data for each well, the prior studies where non-
publically available data was used and from which interpretations have been borrowed,
and the formation tops taken from these prior studies.
1.4 Methods
Using the Landmark software, major seismic amplitude reflectors were mapped
using a combination of auto-tracking and manual picks to define the geographic extent
and shape of distinct reflective units or packages. Amplitude discontinuities within
layers are interpreted as faults, and mapped within the volume. Following this analysis,
structural and stratigraphic features are correlated with specific tectonic events.
Additionally, seismic attributes were extracted from the 3D volume using DecisionSpace

24
software. A coherency extraction generates a volume that can localize waveform
similarity in both in-line and cross-line directions and transform the dataset into a
volume of coherence coefficients [Bahorich and Farmer, 1995]. Coherency cubes can
be generated in a 360-degree format to allow for cube volumes that show coherency in
the x-, y-, and z- coordinate directions. Coherency cubes allow for the easy tracing of
discontinuities between adjacent points in the seismic data. Small regions of seismic
traces cut by fault surfaces generally have a different seismic character than the
corresponding regions of neighboring traces [Bahorich and Farmer, 1995]. Coherency
cubes have been generated in the study area in the inline, crossline, and 360-degree
direction, and have been used to generate coherence horizon slice maps and 3D data
coherency sets for interpretation. This aids in the interpretation of faults or lateral
changes in depositional environments such as in trough and river systems. In addition, a
3D dip volume was generated. This post-stack attribute computes, for each trace in the
seismic, the best fit plane between its immediate neighbor-traces on any time-slice
horizon and outputs the magnitude of the dip gradient of that plane [DecisionSpace
Manual].
After horizons were identified within the 3D seismic volume and mapped in
DecisionSpace software, two-way travel time maps were generated using some of these
horizons to show the attitude of bedding, and locations of folds and faults. In addition,
cross-sectional views in different orientations were flattened along mapped horizons.
Flattening served to unfold the units to remove Laramide folding and allow

25
Table 1. Study Area Vicinity Wells Used to Estimate Seismic Data Depth
Well Number*
Well Name API Number County Studies where Cited
Total Log
Depth
Well Logs
Available
Formation Tops
1 Jack L. Phillips Co. Tequesquite Ranch #1
42-323-33338 Maverick 8,211’ 2502.7m
GR, SP, Res
None reported
2 Humble Oil & Refining Company Bandera
County #1
42-323-00092 Maverick Alexander (2014), Ewing (2010), Scott
(2004)
13,500’ 4114.8m
GR, SP, Res, NPhi
Cal
Sligo – 6140’, 1871.5m Paleozoic – 13462’,
4103.2m
3 Cornerstone E&P Company, LP Chittim
126-2
42-323-33028 Maverick Ewing (2010) 15,972’ 4868.3m
None None reported
4 Blue Star Operating Company Taylor 132-1
42-323-32657 Maverick Alexander (2014), Ewing (2010), Scott
(2004)
22,396’ 6826.3m
GR, SP, Res,
RWA, Sonic, Cal
Sligo – 7274’, 2217.1m Upper Jurassic – 14192’,
4325.7m Lower Jurassic – 18438’,
5619.9m
5 Continental Oil Company Halsell Foundation #1
42-323-30072 Maverick Ewing (2010), Scott (2004)
15,266’ 4653.1m
GR, SP, Res,
Density, NPhi,
Con, Cal
Sligo – 8696’, 2650.5m Jurassic – 12050’, 3672.8m
6 Phillips Petroleum Company Beidler #1
Kinney Ewing (2010) 5,302’ 1616.1m
SP, Res Sligo – 4003’, 1220.1m Paleozoic – 4960’, 1511.8m
7 Coffman #1 Summers Kinney Alexander (2014)
13,500’ 4114.8m
None Upper Jurassic – 5060’, 1542.3m, Ordovician –
9225’, 2811.8m
8 Austral #1 Whitehead Kinney Alexander (2014)
4,296’ 1309.4m
None Ordovician – 3750’, 1143m
Table 1. Table of wells identified in the region of the study area that penetrated strata below the thick Carbonate section
overtopping the Paleozoic through Jurassic aged structural features. Full well name, the API number (where available) and
the previous studies that describe the well encounters, as well as key tops from those studies, are listed. For location of wells
relative to the study area, see Fig. 3.

26
Figure 9. 2D seismic line in central Maverick County depicting buried half-graben feature below flat-lying sediments. High
angle normal faults are interpreted by Scott (2004) to form the north wall of a half-graben rifted basin. For approximate
location of line, see Fig. 3. This interpretation has been altered to show the faults (purple lines, northeast wall) terminating
into interpreted metamorphic Paleozoic thrusted basement (pink). Stratigraphy of the basement appears to maintain structure
beneath the thrusted block, as is seen in the study area. The southern rift wall appears much lower angle, and normal faulting
(purple lines, southwestern wall) does appear to continue into Paleozoic stratigraphy. Jurassic rift sediment packages in
shades of green show pronounced thickening along the northern rift wall and on the downthrown sides of normal faults. The
packages progressively flatten upwards. Location of Wells 2 & 4 (see Table 1) are projected onto the profile with calculated
depth of Paleozoic metamorphics (1,600 ms, Well 2), Jurassic Upper clastics (1,620 ms, Well 4) and Jurassic Lower clastics
(2,100 ms, Well 4) indicated. Line and interpretation modified from Scott (2004).

27
interpretations of the tectonic setting during the time of deposition of rift-fill sediments
and Cretaceous carbonates.
Other studies used unpublished industry data in order to define tops of horizons
in the wells [Alexander, 2014; Ewing, 2010; Scott, 2004] (Table 1). The formation
depths reported by these authors are used to estimate depth of tops on the 2D seismic
data (Fig. 9). By correlating structures seen in 2D seismic, and utilizing the velocity
assumptions below, approximate depths of the lithology identified by other authors in
the well data were correlated to the 3D seismic in the study area. Through the process of
comparing well lithology interpreted by other authors to 2D seismic, then relating the 2D
lines to the 3D data, a model has been developed that incorporates interpreted lithology
along with structural geometries identified in seismic.
The 3D seismic data was analyzed using stratigraphic interpretations made by
others from publically available well data [Alexander, 2014; Ewing, 2010; Scott, 2004].
The data and interpretations of the eight deep wells in the region surrounding the 3D
seismic volume were used to establish a framework to interpret the key lithologic
packages captured by the 3D seismic volume. These stratigraphic interpretations have
been compared to the 3D seismic utilized in this study to constrain the interpretations
into stratigraphic packages present in the 3D seismic. This is done through a
combination of relative positions of stratigraphic packages to each other in data,
positions of stratigraphic packages relative to structural features, and by comparison to
similar packages in other studies.

28
The well data indicates that carbonate rocks have been deposited above clastic
sedimentary and metamorphic rocks (Table 1). Well 2 encountered the Sligo formation
(Fig. 7), a known carbonate shale of the middle Cretaceous, at 1,871.5 m [Ewing, 2010].
Well 4 also encountered this formation at a depth of 2,217.1 m [Ewing, 2010]. These
wells have been projected onto a 2D seismic profile located in central Maverick County
that was first interpreted by Scott (2004) (Fig. 9, for location of profile, see Fig 3). Well
4 encountered Jurassic clastic rocks at 4325.7 m and another lower layer at 5,619.9 m
[Alexander, 2014]. Well 2, by contrast, encountered metamorphic Paleozoic rocks and
metamorphic basalt at 4,103.2 m [Ewing, 2010]. Using velocity assumptions described
below, approximate two-way travel time values have been determined for these depths
(Fig. 9). The relationship of these values to the structure interpreted in the profile help
form the basis of the stratigraphic assumptions presented in this paper. The eight deep
wells used in this study are not located in the seismic volume so a direct well-seismic tie
was not possible. The tying of well data using a combination of regional geologic
features, such as regional dip of stratigraphic units and the orientation of key structural
features allowed for the addition of lithology to the stratigraphic-structural model.
1.5 Velocity Assumptions
There are no established comprehensive velocity studies for the Maverick Basin
stratigraphy; data presented in this study is in two-way travel time. For the purposes of
reference, however, a seismic velocity will be assumed to help scale the size of structural

29
and stratigraphic features, and lithologic thicknesses presented in this study. Prior
studies have assumed a range of S- and P-wave velocities when interpreting seismic data
in the region. Evans and Zoerb (1980) interpreted approximate thicknesses and offsets
in their study using an explicit assumption of 17,500 feet per second (fps) (~5,300
meters per second (m/s)) velocity. In calculating approximate thickness of the rift fill
within the seismic line presented in Scott (2004), 500 ms of fill was interpreted to
represent approximately 3,500 feet (1,067 m) of sediment, indicating an assumed
velocity of ~14,000 fps (~4,250 m/s) [Ewing, 2010].
Measured laboratory values for limestone carbonates is between 3,000 and 6,000
m/s (9,843-19,685 fps) and is highly dependent on porosity [Baechle, et. al., 2003].
Carbonate deposits in the top 1000ms of the 3D seismic data represent south Texas
carbonate shales [Ewing, 2010]. Estimates on the higher end of the carbonate range
would be consistent with lower porosity shale and consistent with the assumptions by
Evans and Zoerb (1984) and Scott (2004). For the carbonate section of the 3D seismic
data, a velocity assumption of 5,000 m/s is used. For the rift-fill section of clastic
sandstone, the assumption is lowered to 4,250 m/s, consistent with Scott (2004). For
metamorphic rocks or basalt interpreted to be part of the rift walls and stranded rift
block, the velocity assumption is 5,500 m/s, consistent with well studies in basaltic crust
[Christensen, et. al., 1980]. These velocity assumptions are used to calculate
approximate thicknesses and depths for the geologic and stratigraphic features observed
in the 3D seismic data of this study.

30
2. SEISMIC RESPONSE IN THE MAVERICK BASIN
This Chapter outlines the observations made in the 3D seismic data described in
Chapter 1. From these observations, a stratigraphic-structural model of the Maverick
Basin rift system in the study area has been created. The locations of all 2D seismic
lines discussed in this and subsequent chapters are shown in Figure 8.
2.1 Deep Seismic Observations in Study Area
In the northeast quadrant of the 3D seismic volume a deep, bright reflector is
located between 2,300 and 2,568 ms (Fig. 10, red horizon). This reflector dips to the
southwest, which is ~90̊ to the regional trend (2̊, southeast) [Udden, 1916]. In cross-
sectional view, there are additional sets of parallel reflectors from 2,600 ms to 3,800 ms
(Fig. 10, yellow horizons). These reflectors dip to the southwest. The package of
reflectors from 2,600 to 3,800 ms that have amplitudes reflections brighter than the
surrounding area are also apparent in 3D seismic time slices (Fig. 11). In map view, the
bright reflectors strike northwest to southeast at the 2,384 ms time slice (Fig. 11a, yellow
arrow). The upper bright reflector (Fig. 10, red horizon) is less laterally continuous as it
dips down-section, and with depth is more clearly imaged in the east where it has an
east-west strike (Fig. 11b, compare reflector indicated by yellow arrow on east and west
side of red line). Additional sets of bright reflectors paralleling the main reflector at the
northeastern edge of the study area (Fig. 11a, 11b). Coherency volume extractions show

31
Figure 10. 2D profile extraction from 3D data reflecting structure below thrust ramp defined in this study. For location of
line, see Fig. 8. South-southwestward dipping discontinuous bright reflector (red) marks the top of a zone of systematically
southwestward dipping reflectors (yellow). Dip of this zone of reflectors is counter to regional dip of southeast (toward the
viewer in the top-most flat-lying reflectors of image). Each individual bright amplitude event (yellow lines) is subparallel to
those above and below it and separated from the others by zones of lower reflective intensity. Location of time slices from
Fig. 11 indicated, as well as location of seismic profile presented in Fig. 12.

32
Figure 11. Time slices at the 2,384 ms (A & C) and 2,568 ms (B & D) two-way travel
time level for the study area. (A) Strike of bright reflector (red horizon, Fig. 10) is
shown to be northwest to southeast and relatively continuous across the study area
(yellow arrow). Location of seismic profile from Fig. 10 is indicated. (B) Bright
reflector (red horizon, Fig. 10) loses character to the west down section and becomes
broken (to west of red line), but appears more well imaged on east side of study area (to
east of red line). (C) Discontinuity map at same time-level as A, shows obvious change
in character of discontinuities from sub-parallel and linear in northeast of study area,
north of the bright reflector (red horizon, Fig. 10, represented here by yellow line) but
chaotic and non-uniform in south (southwest of yellow line). (D) Discontinuity map at
same level as B, shows potential forward step in linear pattern of discontinuities (offset
in solid yellow line at red line).

33
Figure 12. 2D seismic profile extracted from 3D data showing in-strike structure below
thrust ramp defined in this study. For location of line see Fig. 8. Bright reflector (red) is
the same bright amplitude event separating zone of southwestward dipping reflectors
(toward viewer in image) traced in Fig. 10. The red reflector has a concave downward
geometry. Below this bright reflector, sub-horizontal reflectors dipping to the southeast
are mapped, separated by zones with diminished reflectivity (yellow lines). The deeper
reflectors do not exhibit the concave-down geometry of the top-most reflector; however,
with depth the reflectors appear to flatten out compared with shallower horizons.

34
a change in the character of discontinuities northeast of the bright reflector when
compared to discontinuities to the southwest (Fig. 11c, 11d). To the north of the
brightest reflector (Fig. 11c, indicated by yellow line), discontinuities are generally
parallel to each other and strike east-west with a gradual change in strike to the
northwest (Fig. 11c, northeast of yellow line). South of the brightest reflector, the
discontinuities are random and do not show a clearly defined linear pattern (Fig. 11c,
southwest of yellow line). At the 2,568 ms time slice, the brightest and uppermost
reflector is located only near the far eastern section of the study area (Fig. 11b). At
shallower intervals (2,384 ms) the same reflector extends to the northwest (Fig. 11a).
This shows two distinct zones to this reflector at different depths, with a change in
amplitude, strike, and linear continuity with change in two-way travel time (Figs. 11a,
11b). There is a linear separation between the two zones of reflectors that trends
southwest to northeast and separates these two zones by ~1,600 m (Fig. 11d).
In strike-oriented view, the bright amplitude reflector appears as a concave
downward shape with an apex near 2,320 ms (Fig. 12, red horizon). This reflector
changes dip along its trend to be northwest to the west and southeast to east. The set of
reflectors below the uppermost (Fig. 10, yellow horizons) do not exhibit this change in
dip or concave downward geometry across a vertical line through the red horizon’s apex
(Fig. 12, yellow horizons). Rather, these reflectors maintain a mostly constant dip
toward the southeast (Fig. 12, yellow horizons). Below 3,000 ms, these reflectors have
more variability in dip angle, but maintain a generally southeast dip direction (Fig. 12,
yellow horizons). The coherency volume exhibits the discontinuities between the bright

35
amplitudes mapped as yellow horizons in Figs. 10 and 12 formed by the lower amplitude
areas above and below them. The discontinuities maintain a linear relationship to each
other to the northeast of the brightest reflector (Fig. 11c, 11d, northeast of yellow line).
The discontinuities are sub-parallel in the coherency time slice at 2,384 ms (Fig. 11c).
At 2,586 ms, the sub-parallel relationship of these discontinuities is extended farther to
the south on the east side of the study area (Fig. 11d). This offset is marked as a linear
feature separating the two zones of sub-parallel discontinuities at 2,586 ms (Fig. 11d, red
line).
2.2 Seismic Observations above Deep Reflectors in Study Area
Continuous, horizontal to sub-horizontal horizons generally dipping to the
southeast can be mapped from the surface to 1,900 ms two-way travel time in the
southeast quadrant of the study area (Fig. 13). Many horizons exhibit lateral changes in
amplitude response, shown by varying amounts of brightness to the reflector. These
horizons can be mapped to the edge of the southern border of the study area. There are
multiple horizons with high amplitude responses that are bounded by zones with low
amplitudes; these high amplitude horizons can be seen at approximately 200 ms, 300 ms,
700 ms, 970 ms, and 1,350 ms (Figs. 13, 14). The lower amplitude zones are
characterized by weak reflection of horizons but still show some lateral continuity of
layers, such as between 750 and 950 ms (Fig. 13).

36
At about 950 ms, a horizon has been laterally mapped across the study area (Figs.
13, 14, pink horizon labeled Jr-K Boundary). This zone marks a change in the character
of the amplitude response and the geometry of horizons. Above this horizon, seismic
reflectors are laterally continuous and exhibit generally constant, low-angle dips (Figs.
13, 14, e.g. green horizon labeled Sligo). Below this horizon, seismic reflectors are less
laterally continuous, and have dips that change along section in both dip angle and dip
direction (Figs. 13, 14, e.g. yellow and light green horizons labeled Jr-U and Jr-L).
Similarly to horizons above 950 ms, the horizons show high amplitude reflectors
separated by zones of low amplitude response; however, the bright amplitudes do not
extend continuously across the section and broken by sub-vertical discontinuities (Fig.
13) or terminate completely into a zone of chaotic reflectors (Fig. 14). The horizon
along 1,350 ms (Figs. 13, 14, yellow reflector labeled Jr-U) terminates along a horizontal
line that runs northwest to southeast across the western two thirds of the data set (Fig.
15). Along the eastern third of the study area, the horizon can be extended much farther
to the north (Fig. 15).
In cross-section, the brightest reflectors between 950 and 1,800 ms exhibit lateral
discontinuity along sub-vertical discontinuity zones (Fig. 13, dashed purple lines) or at a
zone of chaotic reflectors (Fig. 14, pink shading). The sub-vertical discontinuities and
zone of chaotic reflectors can be interpreted and laterally mapped in coherency time
slices (Fig. 16). When extended laterally, many of the sub-vertical zones strike from the
northwest to southeast (Fig. 16, purple lines). The one exception is a sub-vertical to
vertical discontinuity that strikes counter to the others, from the west-southwest to the

37
Figure 13. 2D seismic profile extracted from 3D data showing structure along the rift axis defined in this study. For location
of line see Fig. 8. Relatively flat-lying reflectors can be traced dipping to the southeast from the surface down to 1,900 ms
along the southeast end of profile. Sligo layer (green) is continuous across the profile and exhibits a relatively constant, bright
amplitude. Jurassic-Cretaceous (Jr-K) boundary layer (magenta), is traced across the profile and is generally parallel to Sligo
layer. The Jr-K marks a change in the character of the reflectors above and below ~1,000 ms. Jurassic-Upper (Jr-U) and
Jurassic-Lower (Jr-L) layers show variable dip angles and directions along this profile. Jr-L cannot be traced along the
northwest side of the profile. Sub-vertical discontinuities (dashed purple and yellow lines) mark breaks in the Jr-U and Jr-L
and surrounding reflectors. A zone of chaotic reflectors (pink shading) begins at 1,650 ms. Location of Fig. 13 is shown.

38
Figure 14. 2D seismic profile extracted from 3D data showing reflectors representing
the thrust ramp in a perpendicular to rift axis perspective as defined by this study. For
location of line see Fig. 8. Sligo layer (green) is continuous across the profile and
exhibits a relatively constant, bright amplitude. Jurassic-Cretaceous (Jr-K) boundary
layer (magenta), is traced across the profile and is generally parallel to Sligo layer,
including apparent anticline in southwest of profile. The Jr-K marks a change in the
character of the reflectors above and below ~1,000 ms. Bright reflector (red line, Figs.
10, 12) is traced in northeast edge of the profile, with zone of chaotic amplitudes (pink
shading, Fig. 13) present above the bright reflector but not below. Below the bright
reflector, sub-horizontal dipping reflectors (yellow lines, also shown in Figs. 10, 12) are
separated by zones of limited reflectivity. The Jr-K boundary layer is continuous above
the zone of chaotic reflectors. Jurassic Upper and Lower (Jr-U and Jr-L) terminate into
the zone of chaotic reflectors and cannot be mapped to the northeast side of it. Location
of seismic profile from Fig. 13 is shown.

39
Figure 15. Time slices through 3D data identifying major structural features and
lithology at Paleozoic (A), Jurassic (B) and Cretaceous (C) time periods. (A) Ouachita
thrust moves metamorphic Paleozoic sediments (pink) over other Paleozoic undeformed
sediments (brown). Thrust is separate along a tear fault with aligns approximately with
the transform fault through the study area. (B): Chittim Rift forms along the
southwestern side of metamorphic Paleozoic block (pink) with multiple down to the
southwest high angle normal faults (purple) forming the northern rim. Left-lateral
transform fault offsets rift sediments and acted to move the Paleozoic block
southwestward, opening a distinctly structurally separate mini-basin behind the block and
from pull-apart motion along the fault (orange). (C): Cretaceous carbonates at level of
the Sligo layer. Chittim anticline axis is located above and parallel to the axis of the
Chittim Rift.

40
east-northeast (Fig. 16, yellow line). The zone of chaotic reflectors is up to a mile wide
(1.6 km) and about five miles long (8 km) and trends from the northwest edge of the
study area southeast to the center of the data, where it abruptly terminates (Fig. 16, pink
shading).
2.3 Seismic Observations from Surface of Study Area
A thick succession of sediments, represented by sub-horizontal, laterally
continuous reflectors beginning at the surface, unconformably overtops the deeper
reflectors in the study area above 950 ms (Fig. 13, 14). In places, the package is very
near, or in contact with, discontinuous sets of reflectors with no linear continuity (e.g.
near contact with upper reflectors to top of pink basement in Fig. 14). In addition, the
package maintains a thickness of about 1000 ms, from the surface down. A major bright
amplitude has been mapped in this interval between 650 and 700 ms. This is defined as
the Sligo horizon for this study and is the single most continuous and laterally extensive
reflector in the study area. There is very little amplitude change within the zone, and it
exhibits a distinct brightness in amplitude compared to low amplitude events above and
below it.

41
Figure 16. Time slice displaying discontinuity data at the time level 1,232 ms in the
study area depicting major structural features affecting Jurassic aged strata.
Discontinuities can be laterally traced (purple lines) as trending west-northwest to east-
southeast. Zone of deformation is indicated sub-perpendicular to the strike of other
discontinuities (yellow line). Zone of non-linear discontinuities (pink shading) is
mapped above the location of the bright reflector (Fig. 14).

42
3. STRUCTURAL INTERPRETATION OF SEISMIC DATA
In this Chapter, the seismic responses described in Chapter 2 are interpreted to
identify faults, related stratigraphic packages and other structural features. These
features are related to the known tectonic events that have affected the Maverick Basin
area through time. Comparisons are made to seismic studies in similar tectonic
environments in order to strengthen and better develop the interpretations presented
here, and used to build a 3D structural model for the Maverick Basin.
3.1 Seismic Response in Passive Margins Cut by Thrust Faults
Reflection studies of modern passive continental margins have often revealed
seaward dipping reflections [Lillie, 1985]. Basinward-dipping reflection sequences have
been observed in interior parts of the Appalachians [Cook, et. al., 1981; Ando et. al.,
1983]. In southern Georgia, large-scale, thin-skinned thrusting of crystalline rocks of the
southern Appalachians generated seaward dipping reflections of the fault surfaces and
metamorphosed strata of the late Precambrian-early Paleozoic [Cook, et. al., 1981].
Basinward-dipping reflectors related to Ouachita thrusting have also been observed in
southern Arkansas [Lillie, 1983, 1985; Iverson and Smithson, 1982]. There are multiple
proposed interpretations for these reflectors. The sequences could be entirely structural
sequences, formed during the Paleozoic Ouachita collision and represent thrust faults
that emanate from a common root zone and truncate pre-collisional North American

43
crystalline basement [Iverson and Smith, 1982]. Alternatively, stratigraphic layers may
have overprinted structure where postrift strata and underlying basement were
imbricated against the former continental edge during collision [Cook, et. al., 1981].
Finally, another interpretation is that original stratigraphy of the lower plate is preserved
and the basinward dipping reflectors image the dips of superimposed stratigraphic
packages [Lillie, 1985].
Detachment faults in deeper shear zones may be imaged as significant seismic
reflectors because of velocity contrast between the hanging wall and footwall of the
thrust [Listin, 1985]. The velocity contrast that occurs from preferred orientation of
mylonitic rocks within a fault zone can also be the cause of bright amplitudes within
deep faults [Fountain, 1984]. If the bright reflectors in the northeast corner of the study
area are interpreted to be thrust faults, then either of these explanations could be causting
the bright seismic response exhibited in the reflectors. In addition, low grade
metamorphism and possible hydrothermal alteration occurred during thin-skinned
Ouachita thrusting in the area of the Devil’s River Uplift [Ewing, 2010; Flawn, 1961].
A change in rock character reflecting low-grade metamorphism or hydrothermal
alteration during deformation can likewise affect the acoustic impedance along that
plane and lead to a brightened amplitude response.

44
3.2 Interpretation of Ouachita Thrust
The interpretation by Evans and Zoerb (1984) of the 2D Seismic line implies that
multiple thrust faults exhibiting a ramp-flat geometry are present, with flats between
1,000 and 1,500 ms nearer the uplift and deeper flats near 2,000 ms at the southeastern
edge of the seismic line (Fig. 4). The deep reflectors between 2,300 and 2,600 ms in the
study area are consistent in time-depth with the interpretation of thrust faults presented
by Evans and Zoerb (1984) (Compare Figs. 4 and 17). The downward curvature of the
reflectors when viewed across strike can be seen in both the study area and the
southeastern end of the 2D Vibroseis line (Fig. 17, upper Panel).
The plane separates two zones with a different reflective pattern (Fig. 17, red
line; compare with Fig. 12, red line). The plane represents the brightest and uppermost
reflector in a set of relatively parallel reflectors located below it (Fig. 17). Above the
plane, there is a group of heterogeneous responses with little lateral continuity (Fig. 17).
The heterogeneity of this group suggests that it is either a highly deformed sedimentary
package or not of sedimentary origin. The upper most of the deep reflectors in the study
area is interpreted to be a signature resulting from the Ouachita thrust of Paleozoic
marine sediments over other Paleozoic sediments at the end of the late-Paleozoic.
Evidence for this interpretation includes (1) the strike and dip of the surface being
consistent with the regional Ouachita event, (2) the consistency of the thrusts with prior
interpretations on 2D seismic north of the study area, (3) the superposition of
heterogeneous seismic response above homogeneous and sub-parallel seismic response,

45
Figure 17. Alignment of the northwestern edge of Fig. 12 and southeastern edge of the 2D seismic profile from Evans and
Zoerb (1984) (Fig. 4) to form a long 2D profile from the study area through Kinney County to the area of the Devil’s River
Uplift (see insert, for location of 2D profile relative to regional features, see Fig. 3). Upper panel is uninterpreted and shows
the continuation of concave downward reflectors in the study area and along the 2D line, as well as an easy correlation for
upper Cretaceous strata that dip southeast. Interpreted section, bottom panel, shows undeformed stratigraphy of the footwall
below the bright reflector (red) preserved. Bright reflector is interpreted to be a thrust ramp related to Ouachita thrusting, with
thrusting directed away from the plane of view above the ramp. To the left of the image, thrusting is directed onto the Devil’s
River Uplift (DRU). Interpretation of Moody Basin and Chittim Basin from Alexander (2014) (Fig. 3) is shown, indicating
that the Chittim Basin is imaged in the study area. The Moody Basin is located north of the study area. Note approximately 5
kilometers of offset between the two lines, and that the change in orientation of 2D line along the left edge of the image.

46
Figure 18. 2D profile extraction from 3D data reflecting relation of interpreted lithology to thrust and rift geometry defined
by this study. This line is reproduced from Fig 10 and presented here with additional interpretation, showing the relation of
interpreted lithology to the thrust and rift defined by this study. For location of line see Fig. 8. Thrust plane (red line), with
movement of deformed Paleozoic rocks (pink) along thrust ramp to the northeast. Sub-parallel steeply dipping reflectors
below ramp (yellow) are indicative of the thin-skinned northeast directed thrusting of Ouachita sediments over preserved
stratigraphic section of same sediments. Southwest end of block terminates along transform fault (yellow) in this view.
Jurassic aged rift sediments (green) and similarly aged mini-basin sediments (orange) are indicated, as well as Cretaceous
layers overtopping the system. Jurassic-Cretaceous (Jr-K) boundary layer (magenta) is continuous above the thrusted block.

47
and (4) known mechanisms that would cause such thrusting events to exhibit the bright
amplitude anomaly seen in the 3D seismic volume.
It is suggested here that this block represents the southernmost emplacement of
Ouachita low-grade metamorphosed Paleozoic clastics and carbonates. To the northeast
and below the mapped thrust plane, reflectors are more laterally continuous and stacked
than within the block (Fig. 14, yellow lines). This suggests that the reflectors below the
fault have retained much of their original stratigraphic character obtained during
deposition. The fault plane is dipping southwest indicating that the direction of thrusting
was to the northeast (Fig. 17, 18, red line). This direction is consistent with what we
expect for the Ouachita event, and suggests that the study area is west of the Frio River
Line of Ewing (1991).
The change in amplitude along a linear zone at different time slices, suggests that
the thrusting event may not have occurred uniformly across the plane in the northeast
quadrant of the study area (Fig. 11). Tear faults are common transverse features in
thrusted margins that transfer displacement laterally and are characterized by high cut-
off angles [e.g. Dixon and Spratt, 2004]. Tear faults may be stratigraphically controlled
or influenced by preexisting structures, such as early normal faults, but they can also
nucleate in otherwise laterally continuous strata in an evolving thrust system [Dixon and
Spratt, 2004]. It is possible that the seismic data in the study area is imaging a tear fault
that formed along the Ouachita thrust fault. Evidence for this would include (1) the
nearly linear and vertical nature of the zone that the bright amplitudes change across

48
with depth, (2) the slight change in strike of the brightest amplitudes across this zone and
(3) the fact that the zone is normal to the direction of thrusting.
Evans and Zoerb (1984) indicate in their interpretation that thrusting of Paleozoic
sediments due to the Ouachita event was directed toward the northwest. This would
result in a transport direction that was parallel to, rather than normal to, the Devil’s River
Uplift (see, Fig. 3). The interpretation presented here, and supported by the 3D seismic
data, requires that thrusting be directed to the northeast. Northeast directed thrusting is
consistent with the dip direction of the imaged thrust fault and with the general curvature
of the Ouachita thrust around the southern periphery of the Devil’s River Uplift (Figs. 1
& 5). If this is true, then the thrust direction is perpendicular to the plane of the 2D
seismic profile where the line runs from southeast to northwest, but onto the Devil’s
River Uplift (as depicted by the authors) on the left side of the seismic profile where it
runs south to north (Fig. 17, bottom Panel; compare to Fig. 4). The 2D line, therefore, is
not imaging the ramps as depicted by Evans and Zoerb (1984), but is actually imaging
the deep expressions of flats at about 2,300 and 2,600ms (Fig. 17, bottom Panel).
Northeastward directed thrusting is further supported by the sets of parallel deep
reflectors seen below the thrust ramps in the 2D seismic line (Fig. 17). These parallel
reflectors are similar to the same feature below the interpreted thrust plane in the study
area (Fig. 17). This suggests that Paleozoic stratigraphy is preserved in the footwall of
the thrust fault [e.g. Cook, et. al., 1981].
The most southern extent of Ouachita thrusting is interpreted to be imaged in the
study area and the thrust faults extend no deeper than 3,000 ms in Maverick County.
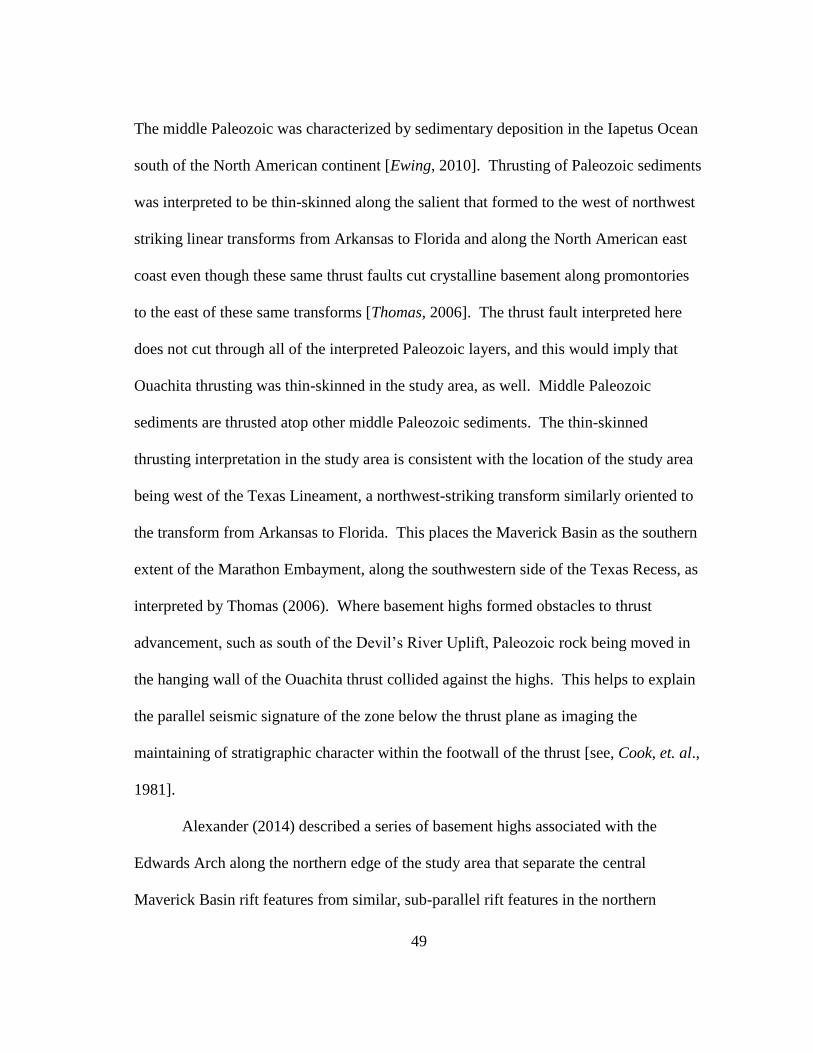
49
The middle Paleozoic was characterized by sedimentary deposition in the Iapetus Ocean
south of the North American continent [Ewing, 2010]. Thrusting of Paleozoic sediments
was interpreted to be thin-skinned along the salient that formed to the west of northwest
striking linear transforms from Arkansas to Florida and along the North American east
coast even though these same thrust faults cut crystalline basement along promontories
to the east of these same transforms [Thomas, 2006]. The thrust fault interpreted here
does not cut through all of the interpreted Paleozoic layers, and this would imply that
Ouachita thrusting was thin-skinned in the study area, as well. Middle Paleozoic
sediments are thrusted atop other middle Paleozoic sediments. The thin-skinned
thrusting interpretation in the study area is consistent with the location of the study area
being west of the Texas Lineament, a northwest-striking transform similarly oriented to
the transform from Arkansas to Florida. This places the Maverick Basin as the southern
extent of the Marathon Embayment, along the southwestern side of the Texas Recess, as
interpreted by Thomas (2006). Where basement highs formed obstacles to thrust
advancement, such as south of the Devil’s River Uplift, Paleozoic rock being moved in
the hanging wall of the Ouachita thrust collided against the highs. This helps to explain
the parallel seismic signature of the zone below the thrust plane as imaging the
maintaining of stratigraphic character within the footwall of the thrust [see, Cook, et. al.,
1981].
Alexander (2014) described a series of basement highs associated with the
Edwards Arch along the northern edge of the study area that separate the central
Maverick Basin rift features from similar, sub-parallel rift features in the northern

50
Maverick Basin (Fig. 3). In Alexander’s (2014) interpretation, the highs of the Edwards
Arch extend south of the Devil’s River Uplift. The Edwards Arch is not discussed much
in the literature, but has been described as a pre-Cretaceous positive anticlinal structure
with an axis running from south-southwest to north-northeast in Edwards County
(Kunianski, 2001). If correct, Kunianski’s (2001) interpretation would make the
Edwards Arch of the appropriate age to be related to both Paleozoic thrusting and early
Mesozoic rifting. If the disposition of the hanging wall block imaged in the 3D seismic
reflects a basement high related to the Edwards Arch, it would be offset by well over 70
kilometers to the south of the arch and located on the opposite side of the Devil’s River
Uplift. It is difficult to reconcile an event related to Ouachita thrusting crossing the
Devil’s River Uplift, as it has already been demonstrated that the Devil’s River Uplift
appears to have acted as a buttress to thrust faulting (Fig. 17). This study suggests a
different interpretation. The basement highs described by Alexander (2014) that
separate the Northern and Central Maverick Sub-basins (Fig. 3) are now shown to be a
result of the northeastward transport and uplift of metamorphosed Paleozoic sedimentary
rock during the Ouachita orogeny. This process would not create a broad arch feature
trending south-southwest to north-northeast, and extending north of the Devil’s River
Uplift.
The Anacacho Mountains, also identified in the map from Alexander (2014),
might however, be related to the basement highs separating the Northern and Central
Maverick Sub-basins (Fig. 3). The Anacacho Mountains are a little studied range,
approximately 40 meters high, composed of middle Cretaceous limestone cliffs located

51
east of Spofford and west of the Nueces River in Kinney County, east-northeast of the
study area [Udden, et. al., 1916] (Fig. 3). The range is aligned with the trend of the
highs seen in the 3D seismic data, and parallels the strike of the thrust fault exhibiting
high amplitudes in map view (Fig. 11). The geographic proximity of the Anacacho
Mountains to the thrusted block in the study area and the apparent alignment with the
strike of the thrust suggest that the Anacacho Mountains are the likely regional structural
feature that were influenced by the geometry and kinematics of the thrusted block. If a
Paleozoic high were present along the Ouachita thrust and this high retained some
topographic relief post-Cretaceous flooding, lithologic boundaries paralleling the
uplifted regions could have formed and persisted to the present time, creating the low-
relied Anacacho Mountain chain. Although not possible during this study because of
access restrictions and lack of public data, the proximity of the thrust fault and similarity
in strike suggest that the origin of the Anacacho Mountains should be explored.
3.3 Interpretation of Maverick Basin Rifting
The Maverick Basin remained sub-aerially exposed and significant erosion
occurred across the newly formed Ouachita highs situated north of the study area and
south of the Devil’s River Uplift [Webster, 1980]. These eroded sediments likely filled
the low valleys between the thrust blocks and were trapped along the tear (transverse)
faults. Alternatively, others have argued that rifting occurred in the broader Gulf of

52
Mexico basin beginning in the Triassic, and that individual rift systems were offset along
transform faults [e.g. Salvador, 1991].
3.3.1 Rift Geometry
Sub-horizontal horizons reflect sedimentary fill within a rifted valley, below the
Jurassic-Cretaceous boundary layer (Fig. 13, 14). The stacked character of these
reflectors, along with their lateral extent, suggest that they are sedimentary rock deposits.
The axis of the rift intersects the study area at the midpoint along the western edge, and
plunges gently to the southeast across the region (Fig. 15). The sediment fill is up to
2,300 ms thick in the southwest corner of the rift (Fig. 18). Along the rift axis, sediment
fill is on the order of 600 ms in the northwest and thickens to 900 ms towards the
southeast (Fig. 13). Velocity assumptions applied to the data suggest that the
sedimentary rock within the rift could be over 10,000 feet (3,000 meters) thick in some
portions of the study area.
The geographic location of this rift feature is consistent with a northern extension
to the extensional half-graben rift, known as the Chittim Rift, previously identified and
described in the Central Maverick Sub-basin [Alexander, 2014; Scott, 2004] (Fig. 3). It
is also possible that the rift is the southern extension of the similarly oriented Moody
Basin in the Northern Maverick Sub-basin in Kinney County described in the same study
[Alexander, 2014] (Figs. 3 & 17). The data presented here favors the relation to the
Chittim Rift in central Maverick County and identified in 2D Seismic (Fig. 17).

53
On the 2D line reproduced from Scott (2004), the Chittim Rift is interpreted as an
asymmetrical half-graben with a steep northern wall and flat southern rim (Fig. 9).
High-angle normal faults associated with the graben strike west-northwest to east-
southeast and exhibit downward throw to south-southwest (Figs. 19). Multiple parallel
fault sets are apparent, with individual faults exhibiting curvature along their
southeastern ends to the northeast and terminating against adjacent faults to their north
(Fig. 16). This pattern is indicative of interrelated normal faults accompanying offset of
adjacent faults along fault ramps with short connecting faults accommodating the offset
that was occurring during rift formation along the high-angle faults forming the rift
[Frisch, 2010]. I interpret these normal faults to be the northern wall of the half-graben
Chittim Rift. It is not known to what extent the rift might extend to the northwest into
Mexico, and the southern shallower-angle rift wall apparent in 2D seismic does not
appear to be imaged in the study area (Fig. 9). The sub-horizontal reflectors that fill the
half-graben terminate along the northeastern wall of the graben, against the zone of
heterogeneous reflectors previously described as a Paleozoic thrust block related to the
Ouachita Orogen (Fig. 14). The reflectors near the top of the rift wall appear to have
slight upward curvature onto the Paleozoic block, possibly indicating onlap of rift
sediments onto the pre-existing high (Fig. 14). In the study area this Paleozoic block
separates the Chittim Rift from the Moody Basin to the north (Fig. 17). The Moody
Basin, while not imaged in the study area, can be seen along the 2D seismic line north of
the study area and is reinterpreted here (Fig. 17).

54
Figure 19. 3D cube view of seismic data from the study area depicting structural features identified in the data and the
associated lithology. Basement highs run from southeast through northwest in the study area (pink shading). (A): Minibasin
sediments are unconformably above thrusted Paleozoic basement (pink) and undeformed Paleozoic sediments (brown). (B):
Strike slip faulting separates Paleozoic thrusted highs, minibasin (orange), and Maverick rift sediments (greens). Strike-slip
fault exhibits signs of reverse high-angle thrusting along local compression at fault bends. (C): Normal, high-angle faults
paralleling or oblique to the rift basin are shown with offset down to the southeast. (D): Strike-slip fault separates Jurassic
rift sediments from Jurassic rift sediments. Major bounding, down to the south west rift fault is also imaged (purple).

55
3.3.2 Change in Geometry Across Rift Axis
I interpret the normal faults of the northern wall in the half graben to be located
above and to the southwest of the thrusted Paleozoic sediments. In the study area, all
mapped normal faults that trend parallel to the rift axis have throws that are down to the
southwest. This places the study area along the northeast half of the 2D seismic line,
consistent with Alexander’s (2014) interpretation of the Chittim Rift (Fig. 3). The high
angle northern wall with reflectors dipping to the southwest in the southwestern quadrant
of the study area indicate that the half-graben shape of the rift imaged in the 2D seismic
line is continued to the northwest into the study area. The 2D seismic provided by Scott
(2004) depicts a clear half-graben that is bounded on the north by steeply dipping faults
displaying greater throws and thicker sedimentary packages than those on the south side
(Fig. 9). The southwest wall of the rifted valley shows a ramp structure with
sedimentary packages clearly thinning out along the ramp. The ramp is segmented by a
series of normal faults antithetic to the large bounding faults of the northeast wall.
3.3.3 Relation of Rift to Ouachita Thrusting
The Chittim Rift basin formed just to the southwest of the most southwesterly
thrust fault mapped using the 2D seismic line in Kinney County and 3D seismic data
(Fig. 11). The axis of the Chittim Rift is parallel to the strike of the Ouachita thrust
fault. The rift formed south of the Paleozoic high that was emplaced by Ouachita

56
thrusting along the north edge of the study area (Fig. 15, 19). The northern rift wall of
the Chittim Rift basin is southwest of the trace of the stranded, thrust block. The
orientation compatibility of these features suggests that their positions and geometries
were constrained by the pre-existing structural fabric, thereby supporting the role of
tectonic inheritance in this region. Generally, northwet-southeast extension occurred
during the opening of the Gulf of Mexico, opposite to the sense of opening for the study
area [Salvador, 1987]. Even though not preferentially oriented to the major extensional
event, rifting in the study area seems to have begun along the pre-existing thrust fault
plane and did not rift the more resistant thrusted block that had moved north as the
hanging wall of the thrust. It is suggested here that the block of Paleozoic-aged
sedimentary rock that moved northeastward along the southern Ouachita thrust in the
study area locally controlled both the orientation and geometry of the subsequent rift
valley. Extensional reactivation of the thrust fault bounding the uplifted block produced
a steep northern boundary of the Chittim Rift and led to the development of the half-
graben geometry. This reversal of slip isolated a structural high that could serve as a
sediment source for the rift-basin fill.

57
3.4 Changes in Rift Geometry and Interpretation of Transform Faulting
3.4.1 Axial Change in Rift Geometry
A seismic line down the axis of the rift valley shows sub-parallel reflectors that
generally dip toward the southeast, parallel to the plunge of the rift axis (Fig. 13). The
reflectors are truncated by a series of short normal faults that dip steeply to the southeast
(Fig. 13). Views along parallel seismic lines that step to the northeast and southwest,
show that these faults are not well-defined or laterally continuous, especially when
compared to the normal faults that form the northern boundary of the rift (Fig. 19d,
purple faults). In addition, the average strike of these faults is oblique to the faults
bounding the northern rift wall. There is evidence for some stratigraphic thickening
along the downthrown side of many of these faults, suggesting syn-depositional faulting
during rifting (Fig. 19c, purple faults). This process would be consistent with the
apparent variations in sedimentary rock package thicknesses noted in the rift-fill,
particularly along the downthrown sides of faults (Fig. 19c).
The vertical extent of the faults is on the order of 500 ms, with some larger faults
extending nearly 1,000 ms (Fig. 9, 19). Some faults extend down nearly to the Paleozoic
basement, and none affect strata above the Jurassic-Cretaceous boundary (Fig. 19).
These relationships suggests that the rifting event was largely over and the area was
becoming a tectonically stable continental platform prior to the onset of flooding and the
subsequent deposition of carbonates in the Cretaceous.

58
A nearly vertical fault, trending west-southwest to east-northeast, can be traced
across the entirety of the study area (Fig. 16, yellow line). This fault is oblique to the
orientation of the normal faults imaged along the northern rift wall (Fig. 16). It is also
generally parallel to the linear zone that affected Ouachita thrusting, possibly indicating
that it formed along the tear fault that formed along with the Ouachita thrust (compare
Fig. 11c, 11d to Fig. 16). The fault is generally vertical but in some places is a steeply
dipping curviplanar surface that has down to the northwest and down to the southeast
segments (Fig. 19b, 19c).
3.4.2 Seismic Interpretation of Transfer Faulting
Strike-slip faults are commonly formed in conjunction with rifting of continental
crust and in other extensional tectonic regimes [e.g. Lister, 1986]. Such faults can be
difficult to image in 3D seismic data because of their geometry relative to the sound
source during acquisition and their lack of vertical offset. There are ways to identify
strike-slip faults in 3D Seismic beyond their minimal dip-oriented offset and vertical to
sub-vertical nature [e.g. Harding, 1985]. There are also seismic signatures that can be
used to differentiate them from normal faults, which are also common in extensional
settings and can also be nearly vertically oriented. Without good lithologic data from
wells and surface outcrop studies, a change in structural geometry in reflectors across a
zone can be evidence of a normal fault [e.g., Escalona, 2006; Zouaghi, 2005]. In
addition, seismic imaging of strike-slip faults can exhibit a zone of deformation, with

59
multiple splays accommodating slip that can locally change along fault strike from
transtensional to transpressional [e.g. Reece, 2013; Harding, 1985].
The change along strike from transpressional to transtensional will produce
multiple changes in 3D Seismic data that can help to distinguish strike-slip faulting from
sets of normal faults. Transpressional deformation along the fault can create local high
angle reverse faults along convergent oversteps that are not present in purely normal
faulting environments [Harding, 1985]. The convergent oversteps can cause strike-slip
faults to reverse their apparent upthrown side along strike [Harding, 1985]. Further, it is
common for strike-slip faults to be bounded by inward facing monoclines of otherwise
horizontal reflectors and change in structural appearance along strike, when imaged in
seismic data [Harding, 1985]. Finally, normal faults are generally found in sets while
transform faults are typically characterized as an isolated through-going zone of
deformation with no related faults and widely spaced offset from other strike-slip faults.
[Harding, 1985].
3.4.3 Transform Faulting and Effect on Rift Geometry
As has been described, there is a thrusted basement block that formed a
topographic high along the northern edge of the study area. The location of the eastern
termination of this basement high is generally aligned with the tear fault that was
interpreted to have possibly accompanied Ouachita thrusting (compare Fig. 11 to Fig.
16). If indeed a tear fault, the Ouachita thrust transported the block farther to the

60
northeast on the eastern side of the tear fault than on the western side, effectively
“stranding” the block on its west side in the study area. In this scenario, the tear fault
acted as a left-lateral transform fault.
Due to the oblique strike of the fault as compared to the normal faults, the
vertical orientation of the fault along strike, and the through-going and localized
character of the fault, I interpret the vertical fault as a transform fault. There is
additional evidence indicating that the fault displays strike-slip displacement. Evidence
of trans-tensional movement within the study area across the transform fault during rift
opening includes (1) abrupt change in amplitude of layers across the fault with limited
vertical offset, (2) a slight upward dip in some reflectors as the fault is approached from
both the west and east, and (3) a change in dip across the fault as reflectors on the east
side generally dip more steeply to the southeast (Fig. 20). A transform fault could
produce amplitude changes laterally due to an abrupt lithologic change. In addition, the
subaerial nature of the fault during deposition of the rift fill could cause a slight
topographic rise in the immediate vicinity of the fault. The change in dip across the fault
likely reflects a small component of oblique-slip localized on the southeast side,
consistent with the regional dip, direction of extension, and the trans-tensional motion
along the fault that is suggested here. This evidence supports the suggestion that the tear
fault that produced during Ouachita thrusting was reactivated as a transform fault
throughout the Triassic and Jurassic during rifting. Reactivation imparted a left-lateral
sense of shear across the northern part of the Chittim Rift, oblique to the rift axis, during
rifting and sedimentation.

61
Figure 20. 2D seismic profiles extracted from 3D data depicting seismic responses
along interpreted strike-slip faulting in the study area. For location of lines see insert.
(A): 2D Seismic line depicting the change in amplitude response of seismic reflectors
across the interpreted vertical transform fault. Multiple reflectors appear to change
polarity across the fault. (B): 2D Seismic line depicting a slightly steeper and opposite
dips to reflectors on each side of the transform fault. (C): 2D Seismic line depicting
change in dip across the transform fault (yellow). On the west side of the transform
fault, sediments are dipping more steeply to the southeast than on the east.

62
Figure 21. 2D profile extraction from 3D data showing seismic response to mini-basin
forming along strike-slip fault defined by this study. For location of line see Fig. 8.
Hanging wall of Ouachita thrust (pink) is thrusted away from viewer in this orientation,
but then moved toward the viewer along a left lateral strike slip fault (yellow). A mini-
basin filled with rift sediments (orange) is located northeast of the basement high block.
The mini-basin is filled with sediments that dip to the southeast and are in contact with
Chittim Rift sediments (green) at the location of the transform fault. Individual horizons
(JrFill_NE) are shown mapped with DecisionSpace interpretation software and cannot
be followed to the east of the transform fault. In addition, these horizons terminate into
flat-lying reflectors below the Jurassic-Cretaceous (Jr-K) boundary layer (pink).

63
Movement on the transform fault transported the preexisting basement
southwestward along the fault to its present position within the study area (Fig. 19).
Heterogeneous reflectors within the block terminate along the west side of the transform
fault (Fig. 20). This indicates a structural change across the fault.
On the northeast side of the basement high (west side of the transform fault),
multiple continuous sub-parallel reflectors can be mapped (Fig. 21). The reflectors are
bounded by the basement high to the southwest and the transform fault to the southeast
(Fig. 18 & 21), and have a steeper southeasterly dip than the average regional dip (Fig.
21). Thickening of sedimentary packages is also apparent near the transform fault (Fig.
21). To the north, the reflectors terminate either unconformably against the relatively
flat-lying Jurassic-Cretaceous boundary layer or pinch-out (Fig. 21). These are
interpreted to represent sediments within a small, isolated mini-basin that formed a
topographic low as a result of local transtension produced as a releasing bend in the
transform fault and movement of the thrusted basement block to the southwest (Fig. 19a,
19b, orange shading). These observations are evidence of the mini-basin forming near
the transform fault and expanding northwestward behind the basement high as rifting
progressed (Fig. 19, orange sediments). Analysis of the transform fault along each wall
of the mini-basin shows locally transpressional features with reverse sense-of-throw
within these small, bounding positive flower structures (Fig. 19b, yellow line).

64
3.5 Stratigraphy in Thrusted Zone
Two wells in the region of the study area penetrated metamorphic rocks, Well 2
to the southeast that was drilled near the northern flank of the central rift and Well 6 to
the northeast that is near the Devil’s River Uplift [Ewing, 2010] (Fig. 9). Well 2
penetrated basalt at 13,462 feet (4,103 m) [Ewing, 2010]. Outcrop of metamorphic
sandstones and carbonates cut by thrust faults are present in the Ouachita Mountains in
Oklahoma and the Marathon uplift in West Texas [Salvador, 1989]. The single basalt
show in Well 2 is also consistent with interpretations of 2D seismic of oceanic crust that
was thrusted northward in the Ouachita orogeny in Arkansas [Lillie, 1985]. Consistent
with these observations, the srock along each side of the Ouachita thrust are interpreted
as metamorphosed shale and sandstones, with the possibility of some oceanic crust
present locally.
3.6 Stratigraphy of the Rift
3.6.1 Relation to Well Data
Well 2 encountered metamorphosed Paleozoic strata at a depth of 13,462 feet
(4,103 meters) and is located southeast of the study area [Ewing, 2010]. This would
equate to about 1,600 ms using the assumptions from Chapter 1. From the structural
map of Alexander (2014), it appears that Well 2 might have been drilled along the

65
northeast rim of the buried rift basin, which is the higher, more steeply dipping side (Fig.
9, see Fig. 3 for location of Well 2). The approximate location of Well 2 projected onto
the 2D seismic line in central Maverick County is indicated on Figure 8 and the depth of
the Paleozoic show appears to be coincident with the northern rift wall of the Chittim
Rift half-graben. The 2D Seismic line exhibits seismic characteristics that are similar to
the seismic responses of the northern rift wall in the study area. Both exhibit
heterogeneous discontinuous reflectors above a set of parallel deeper reflectors with sub-
horizontal rift sediment reflectors terminating against them. Extending the interpretation
within the 2D line to the northwest, the rift basement is interpreted to be filled with
Paleozoic sediments emplaced during Ouachita thrusting. These sediments were
exposed to low-grade metamorphism during Ouachita thrusting, which may have been
aided by hydrothermal processes [Flawn, 1961; Ewing, 2010].
Immediately above this basement is a thick sequence of sub-parallel horizontal
reflectors associated with the rift fill (Fig. 9). This sediment package is up to 900 ms
thick south of the thrusted Ouachita block and west of the transform fault, and southeast
of the transform fault, these sediments are up to 1,600 ms thick (Fig. 13, 14). No wells
within the study area penetrate rift sediments; however, Wells 3, 4 and 5 are all drilled
past 15,000 feet (4,572 meters) in the central portion of Maverick County near the
extension of this rift (Fig. 9, see Fig. 3 for location of Wells 3, 4, and 5). All were found
in other studies to have encountered Jurassic aged sediments. Well 4 is reported to have
topped “Upper Jurassic” clastic sediments at 14,192 feet (4,325 meters) and “Lower
Jurassic” clastic sediments at 18,438 feet (5,620 meters) [Alexander, 2014]. This would

66
equate to 1,620 ms for the Upper Jurassic and 2,100 ms in two-way travel time for the
Lower Jurassic. By comparing this well point with the 2D seismic line through the
Chittim Rift, it can be determined that the Upper Jurassic coincides roughly with the
depth of the top of the northeastern rift wall (Fig. 9). This indicates that the well is
drilled within the Chittim Rift. Therefore, the rift is interpreted to have begun opening
and filling at least by the Lower Jurassic. The top of the Upper Jurassic in this well
would coincide with the Jurassic-Cretaceous (Jr-K) Boundary as defined in this study
and mapped in the study area.
In eastern Mexico, similarly aged redbed sediments have been dated to be
Jurassic age in similarly oriented rift features of the Huayacocotla Anticlinorium
[Ochoa-Camarillo, 1999; Salvador, 1991]. This region is south and west of the study
area and exhumed rift fill has been shown to be completely of Jurassic age [Ochoa-
Camarillo, 1999]. These units are described as a sequence of siltstones with interbedded
sandstones, conglomerates, and some lenses of limestone [Ochoa-Camarillo, 1999].
The presence of fossilized plants leads to an interpretation that these are sub-aerial
deposits. The rifts in the study area are the result of the same extension of continental
crust and the initial phase of the Gulf of Mexico, so they likely have sediment fill similar
to those in Mexico.

67
3.6.2 Relation to Structure
There is no local large-scale thickening of sediments within the rift valley in
either an axial or across-rift direction except where interaction with transform faulting
has occurred (compare Fig. 13, 14 to Fig. 18). Regionally, sediment appears to be
thickest along the northern wall of the Chittim Rift and along the southwest side of
bounding normal faults (Fig. 9). Sediment source was relatively constant and in close
proximity to the study area. It is probable that sedimentation occurred along with rift
opening, so that the actual rift valley never acquired much depth relative to the
surrounding topography. As previously described, growth strata along the downthrown
sides of normal faults within the rift contribute to this interpretation of sedimentation
during opening (Fig. 9).

68
4. EVOLUTION OF MAVERICK BASIN CARBONATE SYSTEM
During the early Cretaceous, much of Texas and the central portion of the North
American continent was flooded due to a combination of post-rifting subsidence and
global sea level rise [Condon and Dyman, 2006]. During this event, well and outcrop
data indicate that a series of shallow marine carbonates including carbonate shales,
limestone and chalk were deposited across South Texas and in the Maverick Basin. In
the study area, the Austin Chalk is the dominant surface outcrop, and the rest of the
south Texas carbonate stratigraphic series below this formation remains in the
subsurface.
4.1 Carbonate Sequence in Seismic Data
A thick succession of reflectors, beginning at the surface, unconformably
overlies the structural features and sedimentary rock formed and deposited during the
Paleozoic Ouachita thrust event and Jurassic rift event (Figs. 17, 18, 21). In places, the
package is very near, or in contact with, the metamorphic Ouachita basement high such
as along the northern wall of the Chittim Rift (Fig. 18). In other areas, the reflectors are
in contact with the rift fill sediments (Fig. 14).
The reflectors in this package are relatively flat-lying and have a southeasterly
dip of about 02̊. Laterally, these reflectors maintain a uniform amplitude, though
individual reflectors vary from extremely bright (high) amplitude to almost no seismic

69
response (Fig. 13). A two-way travel time map for the top of this horizon has been
generated across the study area that shows two anticlines embedded within a gentle
southeastward dip (Fig. 22). The entire package has been deformed to include a
northwest to southeast, southeasterly plunging anticline that is located above the Chittim
Rift in the study area (Fig. 22).
It is known that Cretaceous carbonates are in direct contact with the Devil’s
River Uplift north of the study area [Evans & Zoerb, 1984] (Figs. 4, 17). Well data from
Dan A. Hughes, Co. indicates that carbonates are encountered at shallow depths in the
study area, through about 3,000 feet (915 meters) [Dan A. Hughes Co. well reports].
The sub-horizontal package of reflectors above the structural features describes in
Chapter 3 are representative of the carbonates deposited during Cretaceous flooding and
marine-style deposition.
4.2 End of Rifting and Transition in Depositional Environment
Normal faults mapped within the rift valley fill do not cut into the horizontal
Cretaceous sediments above the Jurassic-Cretaceous boundary layer (Figs. 8, 19). Other
studies have determined that Cretaceous sediments unconformably overlie the Maverick
Rift basin [e.g., Evans and Zoerb, 1981; Ewing, 2010]. This also appears to be the case
both with respect to contact with the Devil’s River Uplift and the Ouachita thrust faults
along the 2D Seismic line north of the study area (Fig. 17). Further, the reflectors that

70
.
Figure 22. Two-way-travel time map of the Sligo formation (Figs. 13, 14) and
interpreted structure. Northwest to southeast trending anticlines are shown, plunging
southeast, the southernmost of which is interpreted to be an extension of the Chittim
Anticline (Scott, 2004).

71
fill the pull-apart basin, and that are related to transtensional movement of the transform
fault, terminate unconformably against the flat overlying Cretaceous reflectors (Fig. 21).
Within the study area, the thickness of seismic reflectors increases on the
downthrown side of normal faults within the rifted basin (Fig. 19c, 19d). This is
evidence that deposition was occurring as these faults were forming. The sedimentary
package of rocks within the rift increases in thickness to the southeast of the study area
(Fig. 13). These same sediment packages cannot be traced over the thrusted Paleozoic
basement high and to the northwest of the study area (Fig. 14, 18). Reflectors that are
mapped as part of the Jurassic rift fill thin out in some places as they approach the highs
associated with Paleozoic thrusted sedimentary rocks (Fig. 21). In addition, other
reflectors appear to terminate as unconformities shown by the reflectors terminating
parallel to dip into the flat-lying Jurassic-Cretaceous boundary layer (Fig. 21).
The termination of all structural features in the 2D Seismic lines and within the
3D volume, as well as the termination of some rift-fill sediments, into Cretaceous
sediments, indicates that rifting ended by the early Cretaceous. The sharp unconformity
between these two depositional settings leads to an interpretation that the area underwent
a period of erosion as a low-relief sub-aerial surface prior to flooding. This resulted in
the erosion of some late Jurassic sediments (or early Cretaceous clastic sediments) as
well as removal of the upper-most portion of the exposed Ouachita thrust and Maverick
rift-related normal faults. This occurred immediately before subsidence allowed
flooding and a transition to a marine environment during the Cretaceous. A thicker

72
package of post-rift sediments overlying the rift just to the southeast of the study area
indicates that flooding may have occurred earlier toward southeast (Fig. 9).
It is not clear exactly how much erosion may have taken place during the time
between the formation of the Jurassic-Cretaceous boundary and the deposition of the
carbonates. There is no place in the study area where Paleozoic basement highs are
directly in contact with Cretaceous sedimentary rocks, though there is considerable
thinning of Jurassic sediments toward the northern edge of the study area (Fig. 18).
Cretaceous sediments do directly contact Paleozoic basement in the Devil’s River Uplift
(Evans and Zoerb, 1984). The transition to a marine depositional environment is
apparent in seismic data from (1) the thickening of packages of reflectors ending above
the Jurassic-Cretaceous, (2) reflectors becoming consistently parallel and sub-horizontal
above the Jurassic-Cretaceous boundary across the study area, and (3) amplitudes
becoming more laterally uniform within Cretaceous layers (Fig. 18). The Jurassic-
Cretaceous horizon is inferred to be the transition from a sub-aerial to marine
depositional environment, though as has been pointed out, the transition likely occurred
sometime after the start of the Cretaceous.
4.3 Folding During the Laramide Orogeny
A low amplitude anticline is imaged in the southwest quadrant of the 3D seismic
data in the Cretaceous layers that are present across the entire study area (Fig. 22). A
second anticline is imaged in the northeast quadrant of the study area; the limbs of this

73
fold are less steeply dipping than those of the fold to the southwest (Fig. 22). Both folds
are most clearly displayed in the Sligo layer. The Jurassic-Cretaceous boundary also
exhibits the same anticlinal geometries (Fig. 9). Shallower layers, such as the Glen Rose
and Buda, also appear to be gently folded in the same geographic position (Fig. 9). The
data quality at shallow depths is not as good so the layer geometry is somewhat less
continuous than within the Sligo. The southwestern fold is composed of Paleozoic
deformed clastics and is located above the rift valley and south of the basement high
(Fig. 9). The fold axes in the Cretaceous layers trend northwest-southeast, parallel to the
axis of the rift valley (Fig. 22), and plunge to the southeast within the study area (Fig.
22). In addition, the northeasterly dipping limb of the southern folf is steeper than the
more broadly dipping southwesterly limb.
The orientation and stratigraphic position of the southern fold is consistent with
the Chittim Anticline mapped through north-central Maverick County by Alexander
(2014) (Fig. 3). In the study area, just as in the 2D seismic, the axis of the Chittim
Anticline and of the Chittim Rift appear to be parallel to and vertically aligned with each
other. The orientations of the fold axes are compatible with a northeast-southwest
maximum principal compressive stress direction. Loading during the Laramide Orogeny
in the late Eocene produced northwest to southeasterly trending folds and thrust faults in
northwest Mexico [Salvador, 1991]. Alexander (2014) attributed the Chittim Anticline
to the Laramide Orogeny. The folds imaged in the study area are interpreted to be a
northern extension of the Chittim Anticline. This interpretation is consistent with other

74
features in northeastern Mexico from the Coahuila Fold Belt, which is composed of
similarly oriented folds that are attributed to Laramide deformation [Yutsis, 2011].
The main limb of the Chittim Anticline appears to follow the structural half-
graben of the Northern Maverick Basin that trends through Maverick County and into
the study area. Some studies have hinted at a slight curvature to the right of the axis of
the anticline down-plunge following the orientation of the Chittim Rift [e.g., Cardneaux,
2012]. The structural high between the Central and Northern Maverick Sub-Basins,
could have served as an obstacle to this compression, focusing the fold axis above the
Chittim Rift. Some studies have suggested that reactivation of the deep graben from
reverse movement along normal faults aided fold formation [e.g., Scott, 2006;
Alexander, 2014].
4.4 Carbonate Deposition, Rifting, and Differential Compaction
A series of horizontal layers about 0.6 ms thick are indicated from the Jurassic-
Cretaceous boundary above the buried rift through the Sligo marker (Fig. 23). These
layers are subparallel to each other and exhibit very low amplitudes. No faults that form
offsets within the rift fill strata affect the sediments within this layer (Fig. 23).
Folding of the Cretaceous layers occurred during Laramide Orogeny. Therefore,
flattening along carbonate layers using the interpretation software will unfold the
anticline observed in the reflectors and give a representation of layer geometries at the
time of deposition in the marine environment. Flattening along the 2D Seismic line in
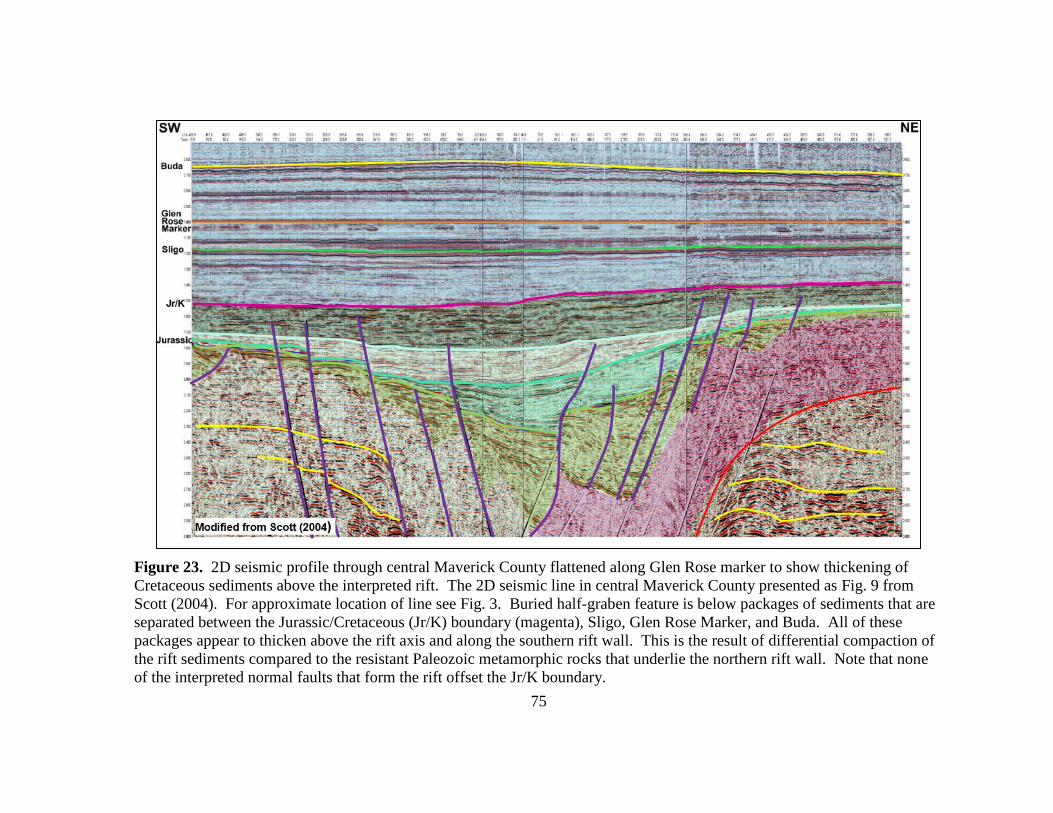
75
Figure 23. 2D seismic profile through central Maverick County flattened along Glen Rose marker to show thickening of
Cretaceous sediments above the interpreted rift. The 2D seismic line in central Maverick County presented as Fig. 9 from
Scott (2004). For approximate location of line see Fig. 3. Buried half-graben feature is below packages of sediments that are
separated between the Jurassic/Cretaceous (Jr/K) boundary (magenta), Sligo, Glen Rose Marker, and Buda. All of these
packages appear to thicken above the rift axis and along the southern rift wall. This is the result of differential compaction of
the rift sediments compared to the resistant Paleozoic metamorphic rocks that underlie the northern rift wall. Note that none
of the interpreted normal faults that form the rift offset the Jr/K boundary.

76
central Maverick County was done by Scott (2004) in order to point out thickening in the
Glen Rose and other formations, which he attributed to possible reactivation of the rift
during Ouachita thrusting (Fig. 23). Along this seismic line, there is apparent thickening
of some of the low-amplitude and high-amplitude packages above the Chittim Rift as
compared to the same packages above the northern rim of the rift (Fig. 23). Within the
3D Seismic normal faults cannot be traced into the Cretaceous sediment package above.
This observation is consistent with no movement on the normal faults during deposition
of Cretaceous carbonates, and no reactivation at a later date to allow for increased
deposition lest we would expect less uniform thickening and propagation of the normal
faults up-section. The increase in thicknesses of carbonates above the Chittim Rift as
compared to the same packages above the northern rim is interpreted to be reflect
differential compaction of the sediment below the carbonate sequence. It was shown in
Chapter 2 that over 8,000 feet (2,440 meters) of Jurassic aged sediment might fill
portions of the Chittim Rift in the study area, whereas very little Jurassic sediment is
present along the Paleozoic thrusted basement block on the northern half-graben rift
wall. This would allow for additional accommodation space for deposition of carbonates
above the Chittim Rift.

77
5. SUMMARY OF FINDINGS:
RECONSTRUCTION OF THE CENTRAL MAVERICK BASIN
The series of events that would eventually shape the presently preserved
Maverick Basin area began with the Proterozoic Texas Lineament. The Texas
Lineament has continually represented a linear zone across which structural styles of
deformation recorded abrupt changes during tectonic events. Ouachita thrust-related
features change orientation across this line. In the Mesozoic, the rift basins buried in the
Maverick Basin formed along the Texas Lineament. Seismic data in the study area has
helped to construct a geometrically and geologically reasonable subsurface interpretation
of the buried structure. It has allowed inferences as to how the different tectonic events
interacted and built on pre-existing structure to form the basin. In this Chapter, the
geologic features described in this study will be combined into a stratigraphic-structural
model and related to regional tectonic events.
5.1 Stratigraphic-Structural Model Relating Subsurface Structures in the
Study Area
A stratigraphic-structural model shows the interaction and location of all of the
geologic features described above (Fig. 24). The model shows the northwest striking
Ouachita thrust with metamorphic Paleozoic sediments in its hanging wall. The footwall
is composed of undisturbed Paleozoic sediments. Above this thrust, down to the
southwest normal faults form the northern wall of the Chittim Rift, which has an axis

78
trend to the southeast. Multiple normal faults interact to form the northern wall and the
Paleozoic thrusted hanging wall further restricts the geometry of the rift. A transform
fault with an east-northeast strike cuts through the rift and associated Jurassic rift fill.
This transform fault has a left lateral sense-of-shear and bends to the left as it approaches
the end of the thrust hanging wall and the apparent tear fault in the Ouachita Thrust. A
pull-apart basin formed at this bend and was filled with Paleozoic metamorphic rocks
which eroded off of the basement block high that moved along the Ouachita Thrust.
This sediment also filled the Chittim Rift during the Jurassic. Local variations in
transtensional and transpressional settings have led to reverse high-angle faults along the
boundaries of the mini-basin. Finally, the entire structural system is overlain by
Cretaceous carbonates. The carbonates are approximately flat-lying, subparallel, and dip
slightly to the southeast consistent with regional dip. Northwest to southeast trending
anticlines, the southernmost being the Chittim Anticline, formed in these Cretaceous
layers.
5.1.1 Hypothesis on Relationship of the Texas Lineament to Study Area
The broadly defined Texas Lineament and the structural high known as the
Devil’s River Uplift were in place at the start of the Ouachita Orogeny. The presence of
the Devil’s River Uplift prior to the Ouachita Orogeny is clear from the 2D seismic line
provided by Evans and Zoerb (1984). This seismic profile shows Ouachita thrust faults
and the associated hanging walls thrusted onto the Devil’s River Uplift (Fig. 4). The

79
origin of the Devil’s River Uplift and its relation to the Texas Lineament are beyond the
scope of this paper, however the mere presence of this feature is instrumental in
controlling the orientation of the Ouachita thrust faults. As a result of inherited structure
related to the shape of the Rodinian continental margin, the Texas Lineament acted as a
zone of transform movement separating a promontory to its east and an embayment to its
west [e.g. Thomas, 2006].
5.1.2 Ouachita Thrust
The Texas Lineament defines the zone across which the orientation of the
Ouachita Orogenic Belt changed. As the Ouachita thrust zone approaches the Maverick
Basin from the east, it changes trend from west-southwest to the north-northwest around
the Devil’s River Uplift and then back to the west as it crosses through northern Mexico
and into the Big Bend region of Texas [Muehlberger, 1985] (Fig. 1). This is consistent
with the thrust orientation interpreted in the northeast corner of the 3D seismic data (Fig.
24). Northeast directed thrusting indicates that the study area is located west of the
Texas Lineament. This would place the study area along an embayment on the southern
continental margin of Laurentia as closing occurred. This setting would have caused the
thrust to cut through a thicker succession of sediments above the crystalline basement in
the area of the Maverick Basin than it would to the northeast of the Maverick Basin
where a promontory was present (Fig. 1).

80
The interpretation of a thicker Paleozoic sedimentary sequence present in the
Maverick Basin than to its east is supported by the determination from seismic data that
the Ouachita Thrust did not cut crystalline basement rock. Seismic shows thin-skinned
thrusting resulting in Paleozoic sediments being deformed and moved as the thrust’s
hanging wall onto other Paleozoic sedimentary rocks (Fig. 24). I propose that as the
collision zone progressed from east to west across the Texas Lineament, the change in
orientation of the thrust zone resulted in an oblique collision in the study area. This is an
example of tectonic inheritance between the preexisting Laurentian margin geometry
and the Ouachita thrust.
5.1.3 Relationship of Ouachita Thrust to Maverick Basin Rifting
Extension in the study area is oriented parallel to the strike of the Ouachita thrust
fault in the 3D seismic data. The opening of the Gulf-Atlantic took place from the
southwest to northeast, as a reversal of the closing that occurred in the Paleozoic and
formed to Ouachita front [Adams, 1991]. Paleogeographic reconstruction of the Triassic
Gulf of Mexico points to one continuous landmass undergoing tensional extension
[Salvador, 1987]. The Yucatan block is interpreted to have split away and rotated south
then southeastward to its present position [Salvador, 1987] (Fig. 1). Extension in
southern North America resulted in mainly southwest to northeast oriented rift valleys
[Thomas, 2006]. This is because rift axes will form perpendicular to the direction of
extension. The Chittim Rift within the Maverick Basin (along with the Moody and

81
Figure 24. 3D stratigraphic-structural model of the entire data set showing relation of structural features defined by this study
to interpreted lithology. Paleozoic sediments (pink) are thrusted along Ouachita thrust (red) onto undeformed Paleozoic
sediment (brown). Jurassic rift (green) forms to the southwest of the thrusted Paleozoic block. Normal faults (purple) affect
sediments within the rift but do not penetrate Cretaceous lithologic units (blue). Left-lateral strike-slip faulting (yellow) cuts
the Jurassic rift and Ouachita thrust and form a pull-apart basin (orange) behind Paleozoic thrust. Plunging to the southeast
anticlines are present in the Cretaceous layers.

82
Paloma Rift Basins from Alexander (2014)) are oriented west-northwest to east-
southeast. This is not consistent with the greater extensional regime in the Gulf of
Mexico. This is potentially an example of local inheritance of pre-existing structure
whereby the rifts took advantage of the Ouachita thrust geometry and oriented counter to
the extensional direction. This could be explained as potentially a third-arm to a failed
triple junction that did not advance to the stage of oceanic spreading like the other
spreading arms that eventually extruded oceanic crust in the Gulf of Mexico. By
continuing along strike of the Maverick Basin rift axes to the southeast, they appear to
align to form a triple junction with the two spreading centers in the Gulf of Mexico.
5.1.4 Relationship of Laramide-Age Folding to Maverick Basin Rifting
Northwest to southeast oriented folds in the Cretaceous layers above the deep
structure end abruptly to the east of the Maverick Basin [Ewing, 1987; Salvador, 1992]
(Fig. 24). These end east of the Texas Lineament and the Frio River Line [Muehlberger,
1980; Ewing, 1987]. It is possible that thrust faulting associated with the Ouachita
Orogeny, normal faulting within the half-grabens of the Maverick Basin, and extensive
rift sediments and Paleozoic sediments within the study area, acted as an abatement to
continued eastward propagation of deformation from the Laramide Orogeny. The
position of the Chittim Anticline directly over the Chittim Rift is a possible indication of
the interaction of these two features.

83
5.2 Reactivation of Deep Faulting
This study determined that west-northwest oriented normal faults and an east-
northeast oriented left-lateral transform fault affected Jurassic rift fill, but were not
active during the deposition of Cretaceous carbonates. This section will hypothesize as
to whether these faults could have been active after deposition of the Cretaceous
carbonates
5.2.1 Carta Valley Fault Zone
The Carta Valley Fault system trends east to west north of the Devil’s River
Uplift through Edwards and Val Verde Counties [Webster, 1980]. The Carta Valley
fault zone forms a topographic corridor of reduced relief discernable on elevation maps
of the region [Webster, 1980]. A major high-angle reverse fault is interpreted from 2D
Seismic data to underlie the Carta Valley fault zone [Webster, 1980]. The pattern of
faulting in the Cretaceous strata above the high-angle reverse fault, is consistent with
wrench faulting along the fault and the area above the basement fault deforms into a
series of in echelon folds and then a horst and graben system [Webster 1980; Wilcox,
1973]. The conclusion drawn by Webster is that the Carta Valley fault zone, now
exposed at the surface in Cretaceous rocks, was the result of slight movement along a
wrench fault beneath the Cretaceous rocks. Laramide compression could provide a

84
mechanism for this reactivation of high angle normal and transform faults related to the
Maverick basin.
5.2.2 Possible Reactivation of Faults in Study Area
If the Laramide Orogeny was shown to have reactivated deep faults north of the
Devil’s River Uplift, it is possible that similar reactivation occurred along faults located
south of the Devil’s River Uplift. The axis of the Chittim Anticline curves southeast to
follow the axis of the Chittim Rift (Fig. 24). In addition, it appears that the fold
broadens and becomes less distinct to the southeast of the Jurassic transform fault in the
study area (Fig. 15).
It is possible that movement similar to that in the Carta Valley Fault Zone
occurred along deep faults in the study area, and is expressed in the Cretaceous rocks
above them. Some seismic lines appear to show more lateral discontinuity in Cretaceous
aged reflectors in zones above the deep high-angle normal faults and the transform fault
interpreted within the study area (Fig. 25). Reactivation of transfer faults in a wrenching
manner could have caused fractures to form in the Cretaceous rocks above the fault that
could now show expression in the surface. This wrenching and faulting would have
occurred under substantial overburden that has now been removed [Ewing, 1987]. A
surface study to determine any evidence of rotated blocks, normal or reverse faults,
similar to the features seen at the surface in the Carta Valley Fault Zone, would be
imperative to determine whether this reactivation occurred. If reactivation did occur,

85
Figure 25. 2D profile extraction from 3D data reflecting broken seismic reflectors in
vertical zones in the Cretaceous rock overlying deeper structures identified in this study.
For location of line see Fig. 9. Cretaceous layers exhibit vertical zones that appear to be
more discontinuous than other sections (black boxes). These zones of discontinuity are
located above major high-angle normal faults (purple) and the transform fault mapped in
the study area (yellow). This could be an indication of the reactivation of these faults to
form vertical zones of fracture within the overlying Cretaceous rocks. This discontinuity
is further seen in the shallow Buda layers that show flat horizon layers outside of the
zones but ragged amplitude continuity within the black boxes.

86
deep basement faults reactivated only to an extent that an induced fracture zone
occurred, but this zone likely did not propagate enough to develop a through-going fault
in the Cretaceous strata. This is consistent with reactivation in the Carta Valley Fault
Zone [Webster, 1980]
5.3 Implications for Evolutionary Models
Transform faults, aligned compressional structures, and extensional faults and
structures might show repeated tectonic inheritance in places that have undergone
multiple episodes of tectonic compression and extension. At the lithospheric scale,
successive reoccupation of traces of transform faults at the continental margin and
differential crustal subsidence along transform faults at rift offsets in continental
embayments suggest structural inheritance [Thomas, 2006]. Recognition of tectonic
inheritance and of reactivation has implications for a range of applications beyond the
evolution of structural features. Reactivation of faults or other zones of weakness from
earlier tectonic events can occur even when not preferentially oriented. This has
implications for the reconstruction of tectonic environments whereby preserved
structures may not accurately reflect the direction of maximum stress. In addition,
calculations of slip along fault planes at the local level may not reflect maximum
transport, or may reflect too much transport for a single event, if sense of slip reversed
during later reactivation or the faults were utilized during two similarly oriented tectonic
events. Evolutionary models must take into account earlier events to the extent they are

87
known, as earlier tectonic events appear to set the stage for later deformation. Pre-
existing structure appears to be a greater control, especially locally, on preserved
structures than the overall trend of the compression or extension affecting the area.
5.4 Conclusions
The previously unstudied 3D Seismic set provided by Dan A. Hughes Co. for the
central Maverick Basin south of Del Rio, Texas has revealed significant reflecting
boundaries near deeper crystalline crust, within Jurassic rifting, and in Cretaceous
carbonate rock layers to the surface. The following major points are important to the
interpretation of the structure currently preserved in the subsurface in this area.
1. The Paleozoic Ouachita thrust imaged in the study area moved Paleozoic
passive margin sediments northeastward as the hanging wall along the thrust
ramp, but preserved the Paleozoic stratigraphy in the footwall in the study area.
2. The position of the thrust acted as a control on the Triassic-Jurassic Chittim
Rift location, with the axes of the rift forming parallel to the thrust’s strike in the
study area, even though this orientation is not preferential to greater Gulf of
Mexico extension.
3. Parallel normal faults form the northern rift wall of the Chittim Rift in the
study area.

88
4. A left-lateral strike slip fault cut the rift axis and the normal faults of the rift’s
northern wall at an oblique angle and was active during the opening of the
Chittim Rift; further, the rift formed a localized pull-apart basin as a result of
trans-tensional environment formed in a leftward bend in the fault’s strike.
5. Rifting ended and the basin was buried prior to onset of flooding in the
Cretaceous, and normal and transform faults associated with rift formation do not
propagate into the Cretaceous carbonate section above the rift.
6. Thickening of carbonate layers above the rift basin, as compared to the same
packages over the northern rim of the Chittim Rift, reflect the consequence of
differential compaction of rift fill sediments under the Cretaceous overburden.
7. Laramide-aged folding impacted the area after the Cretaceous and deformed
the overlying Cretaceous sediments to form low-amplitude southeast plunging
anticlines within the carbonates; the Chittim Anticline being located parallel to
and stratigraphically above the axis of the Chittim Rift.
The acquisition of well data to the crystalline basement would provide definitive
information regarding the age of rift sediments and help to better constrain the geologic
time periods of each tectonic event and better interpret the paleoenvironment during
each deformation event. In addition, surface studies in the study area, or in areas near
the study area, could help to relate geologic structures at depth to their present day
surface expression. This would also aid in determining whether these structures affected
the deposition of the Cretaceous aged carbonates that overtop them. Nevertheless, the

89
data presented here helps to demonstrate the role of inherited structural tectonics on the
local scale, and to illustrate the presence of small-scale subsurface features that are
related to regional tectonics and structures, and are significant to the development of the
current south Texas continental margin.

90
REFERENCES
Adams, R. L. (1993), Effects of Inherited Pre-Jurassic Tectonics on the U.S. Gulf Coast,
Gulf Coast Association of Geological Societies Transactions, 43, 1-9.
Alexander, M. (2014), A New Look at Maverick Basin Basement Tectonics, Bulletin of
the South Texas Geological Society, 55, 32-45.
Ando, C. J., F. A. Cook, J. E. Oliver, L. D. Brown and S. Kaufman (1983), Crustal
Geometry of the Appalachian Orogen from Seismic Reflection Studies, in
Hatcher, R. D., Williams, H., and Zietz, L., eds. Contributions to the Tectonics
and Geophysics of Mountain Chains: Geological Society of America Memoir
158, 113-124.
Baechle, G. T., R. J. Weger, G. P. Eberli, J-L. Massaferro and Y-F. Sun (2003), Changes
of Shear Moduli in Carbonate Rocks: Implications for Gassmann Applicability:
2003 SEG Post Convention Carbonate Rocks Physics Workshop, Dallas, Texas.
Bahorich, M. and S. Farmer (1995), 3-D Seismic Discontinuity for Faults and
Stratigraphic Features: The Coherence Cube: The Leading Edge 105.
Bain, R. C. (2003), Exploitation of Thin Basin-Floor Fan Sandstones, Navarro
Formation (Upper Cretaceous), South Texas, Gulf Coast Association of
Geological Societies Transactions, 53, 30-37.
Bebout, D. G. and R. G. Loucks (1974), Stuart City Trend Lower Cretaceous, South
Texas: A Carbonate Shelf-Margin Model for Hydrocarbon Exploration, Bureau
of Economic Geology, The University of Texas at Austin, Report No. 78.
Cardneaux, A. P. (2012), Mapping of the Oil Window in the Eagle Ford Shale Play of
Southwest Texas Using Thermal Modeling and Log Overlay Analysis, Louisiana
State University Agricultural and Mechanical College, Department of Geology
and Geophysics, August 2012.
Condon, S. M. and T. S. Dyman (2006), 2003 Geologic Assessment of Undiscovered
Conventional Oil and Gas Resources in The Upper Cretaceous Navarro and
Taylor Groups, Western Gulf Province, Texas, U. S. Geological Survey, Reston,
Virginia.
Cook, F. A., L. D. Brown, S. Kaufman, J. E. Oliver and T. A. Peterson, (1981),
COCORP Seismic Profiling of the Appalachian Orogen Beneath the Coastal
Plain of Georgia: Geological Society of America Bulletin, v. 92, 738-748.
Donovan, A. D. and T. S. Staerker (2010), Sequence Stratigraphy of the Eagle Ford
(Boquillas) Formation in the Subsurface of South Texas and Outcrops of West
Texas: Gulf Coast Association of Geological Sciences Transactions, 60, 861-899.
Escalona, A. and P. Mann (2006), Tectonic Controls of the Right-Lateral Burro Negro
Tear Fault on Paleogene Structure and Stratigraphy, Northeastern Maracaibo
Basin, AAPG Bulletin, v. 90, No. 4, 479-504.

91
Evans, S. L. and R. M. Zoerb (1984), Possible Relationships Between Deep Structure
and Shallow Fault Patterns, Northwest Maverick Basin, Val Verde County,
Texas, in Stratigraphy and Structure of the Maverick Basin and Devil’s River
Trend, Lower Cretaceous, Southwest Texas, South Texas Geological Society, 94.
Ewing, T. E. (1985), Westward Extension of the Devil’s River Uplift – Implications for
the Paleozoic Evolution of the Southern Margin of North America, Geology, 13,
433-436.
Ewing, T. E. (1987), The Frio River Line in South Texas – Transition from Cordilleral to
Northern Gulf Tectonic Regimes, Gulf Coast Association of Geological Societies
Transactions, 37, 87-94.
Ewing, T. E. (1991), Structural Framework, in The Gulf of Mexico Basin, edited by
Salvador, A., J, pp. 31-52, Geological Society of America, Geology of North
America, Boulder, Colorado.
Ewing, T. E. (2010), Pre-Pearsall Geology and Exploration Plays in South Texas, Gulf
Coast Association of Geological Societies Transactions, 60, 241-260.
Flawn, P. T. (1961), The Ouachita System, in No. 6120. Bureau of Economic Geology,
The University of Texas.
Fountain, D. M., C. A. Hurich and S. B. Smithson (1984), Seismic Reflectivity of
Mylonite Zones in the Crust: Geology, v. 12. 195-198.
Hackley, P. C. (2012), Geological and Geochemical Characterization of the Lower
Cretaceous Pearsall Formation, Maverick Basin, South Texas: A Future Shale
Gas Resource?, American Association of Petroleum Geologists Bulletin, v. 96,
No. 8, 1449-1482.
Harding, T. P. (1985), Seismic Characteristics and Identification of Negative Flower
Structures, Positive Flower Structures, and Positive Structural Inversion, The
Association of Petroleum Geologists Bulletin, v. 69, No. 4, 582-600.
Hatcher, R. D., Jr., W. A. Thomas, P. A. Geiser, A. W. Snoke, S. Mosher, and D. V.
Wiltschko (1989), Alleganian Orogen, in Hatcher, R. D., Jr., W. A. Thomas, G.
W. Viele, eds. The Appalachian-Ouachita Orogen in the United States:
Geological Society of America, The Geology of North Amercia, v. F-2, 233-318.
Hoffman, P. F. (1991), Did the Breakout of Laurentia turn Gondwanaland Inside-Out?,
Science, v. 252, 1409-1412.
Kunianski, E. L., L. Fahlquist and A. F. Ardis (2001), Travel Times Along Selected
Flow Paths of the Edwards Aquifer, Central Texas, in E. L. Kunianski, ed., U.S.
Geological Survey Karst Interest Group Proceedings, Water-Resources
Investigations Report 01-4011, 69-77.
Lillie, R. J. (1983), Tectonic Implications of Subthrust Structures Revealed by Seismic
Profiling of Appalachian-Ouachita Orogenic Belt: Tectonics, v. 3, No. 6, 619-
646.

92
Lillie, R. J. (1985), Tectonically Buried Continent/Ocean Boundary, Ouachita
Mountains, Arkansas: Geology, v. 13, 18-21.
Lister, G. S., M. A. Etheridge and P. A. Symonds (1986), Detachment Faulting and the
Evolution of Passive Continental Margins: Geology, v. 14, 246-250.
McLelland, J., J. S. Daly and J. M. McLelland (1996), The Grenville Orogenic Cycle
(ca. 1350-1000 Ma): An Adirondack Perspective, Tectonophysics, v. 265, 1-28.
Mosher, S. (1998), Tectonic Evolution of the Southern Laurentian Grenville Orogenic
Belt, Geological Society of America Bulletic, v. 110, 1357-1375.
Muehlberger, W. R. (1965), Late Paleozoic Movement Along the Texas Lineament,
Transactions of the New York Academy of Sciences, v. 27, Issue 4 Series II,
385-392.
Muehlberger, W. R. (1980), Texas Lineament Revisited, in Trans-Pecos Region: New
Mexico Geological Society Guidebook, 31st Field Conference.
Nicholas, R. L. and R. A. Rozendal (1975), Subsurface Positive Elements within
Ouachita Foldbelt in Texas and Their Relation to Paleozoic Cratonic Margin, The
American Association of Petroleum Geologists Bulletin, v. 59 No. 2, 193-216.
Ochoa-Camarillo, H., B. E. Buitrón-Sánchez, and A. Silva-Pineda (1999), Redbeds of
the Huayacoctla anticlinorium, state of Hidalgo, east-central Mexico, in
Bartolini, C., Wilson, J. L., and Lawton, T. F., eds., Mesozoic Sedimentary and
Tectonic History of North-Central Mexico: Boulder, Colorado, Geological
Society of America Special Paper 340.
Salvador, A. (1987), Late Triassic-Jurassic Paleogeography and Origin of the Gulf of
Mexico Basin, American Association of Petroleum Geologists Bulletin, v. 71
Issue 4, 419-451.
Salvador, A. (1991), Origin and Development of the Gulf of Mexico Basin, in The Gulf
of Mexico Basin, Vol. J, pp. 389-444, Geological Society of America, Geology of
North America, Boulder, Colorado.
Scott, R. J. (2004), The Maverick Basin: New Technology --- New Successes, Gulf
Coast Association of Geological Societies Transactions, 54, 603-620.
Thomas, W. A. (2006), Tectonic Inheritance at a Continental Margin, GSA Today, v. 16,
no. 2, doi: 10.1130/1052-5173(2006)016<4:TIAACM.2.0.CO;2.
Udden, J. A., C. L. Baker, and E. Bose (1916), Review of the Geology of Texas, Bureau
of Economic Geology and Technology, Bulletin of the University of Texas No.
44.
Webster, R. E. (1980), Structural Analysis of Devil’s River Uplift – Southern Val Verde
Basin, Southwest, Texas, Association of Petroleum Geologists Bulletin, 64, no.
10, 221-241.

93
Webster, R. E. and G. G. Calhoun (1983), Geologic Expressions of the Devil’s River
Uplift, Kinney and Val Verde Counties, Texas, in Stratigraphy and Structure of
the Maverick Basin and Devil’s River Trend, Lower Cretaceous, Southwest
Texas, pp. 60-79, San Antonio Geological Society, San Antonio, Texas.
Weise, B. R. (1979), Wave-Dominated Deltaic Systems of the Upper Cretaceous San
Miguel Formation, Maverick Basin, South Texas, The University of Texas at
Austin, May, 1979.
Yutsis, V., Ponce, A. T., and Krivosheya, K. (2011), Geophysical Modeling of the
Surroundings of La Popa Basin, NE Mexico, with Gravity and Magnetic Data, in
New Frontiers in Tectonic Research – General Problems, Sedimentary Basins
and Island Arcs, InTech, July 27, 2011.
Zouaghi, T., M. Bedir, and M. H. Inoubli (2005), 2D Seismic Interpretation of Strike-
Slip Faulting, Salt Tectonics, and Cretaceous Unconformities, Atlas Mountains,
Central Tunisia, Journal of African Earth Sciences, v. 43, 464-486.