Structural Style and Hydrocarbon Potential Evaluation of ... Badin block is located in the Lower...
5
Available on: www.bahria.edu.pk/bukc/burjes2016 Bahria University Research Journal of Earth Sciences Vol. 2, Issue 1, June 2017 ISSN 2415-2234 © BURJES Page 30 Structural Style and Hydrocarbon Potential Evaluation of Badin Block, Lower Indus Basin, Pakistan Muhammad Fahad Mahmood, Urooj Shakir, M. Raiees Amjad, Asad Taimur Department of Earth and Environmental Sciences, Bahria University, Islamabad Campus, Pakistan. Corresponding Author Email: [email protected] Abstract - Badin area is located in the southwestern periphery of the Indian plate, in lower Indus basin. The research is carried out to delineate the subsurface geometry of the area with the help of seismic data in order to understand its petroleum system. Main emphasize is to analyze reservoir formations and sealing characteristics. Time and depth contour maps are generated to reveal the subsurface structural geometry along with petrophysical analysis for formation evaluation and reserves estimation to calculate the hydrocarbon potential. Interpretation results show extensional regime, dominated by horst and graben structures. Grabens are of immense exploratory importance in research area as they are believed to be the kitchen area of hydrocarbon generation. The faults show different aspects, of which the foremost is trap formation and their role to facilitate the hydrocarbon migration from source to reservoir. Study area holds all the major elements of petroleum system considering risk and volumetric analysis results. Keywords – Seismic data, Petrophysical analysis, Formation evaluation, Reserves estimation INTRODUCTION The Badin block is located in the Lower Indus Basin, southern portion of the Sindh, Pakistan, approximately 160 km east to the Karachi city (Figure 1). The total area of the concessions is 7,650 km 2 . The location of Badin South block lies between 68゜11’ E to 68゜47’ E longitude and 24゜06’ N to 25゜02’ N latitude as shown in Figure 1. The Badin South block covering an area of 1265.3 km2, bounded on the north by Hyderabad district, on the east by Tharparkar districts, while Thatta district is present on its west side and Arabian Sea on its southern side Ahmad et al., (2003). In this research seismic data is used to investigate the structural styles, tectonic setting and hydrocarbon potential of the Badin Block. For future exploration strategies, the seismic lines used for seismic data interpretation are shown in Figure 2. Fig. 1 Geological map showing location of the study area not drawn to scale (modified after Kazmi et al., 1979). TECTONICS AND STRATIGRAPHY Badin is part of the Lower Indus basin. The Lower Indus Basin stretches north-south along the Indus River and south of Khairpur-Jacobabad High towards Arabian Sea. The Nagar Parker Granite in the extreme southeastern corner of Pakistan is the exposed part of the Indian craton. The areas located to the west and northwest of Nagar Parker are the Tharparkar slope that dips westward and northwestward and where Indus basin is most prospective for hydrocarbon exploration (Mozaffar et al., 2002). The Badin Rift (Figure 1) is characterized by a series of horst and graben structures present below the base Paleocene unconformity. These horsts and graben structures were formed as a result of rifting between India and Seychelles during the Late Cretaceous (Khan et al., 2013). Fig. 2 Basemap of study area showing the orientation of seismic lines and wells locations The oldest formation penetrated in Badin is the Jurassic Chiltan Limestone (Mozaffar et al., 2002), which overlies Triassic strata within the Badin Block (Khan et al., 2013). Whereas, Chiltan Formation (Figure 3) overlain by the Lower Cretaceous marine sand-shale sequence of the Sembar and Goru Formations (Wasimuddin et al., 2005). The lower most Sembar Formation of the Early Cretaceous sequence is composed of organic rich shale. The Lower Goru sequence overlies the Sembar Formation. The Lower Goru horizon is divided into five members based on predominant
Transcript of Structural Style and Hydrocarbon Potential Evaluation of ... Badin block is located in the Lower...

Available on: www.bahria.edu.pk/bukc/burjes2016 Bahria University Research Journal of Earth Sciences Vol. 2, Issue 1, June 2017
ISSN 2415-2234 © BURJES Page 30
Structural Style and Hydrocarbon Potential Evaluation of Badin Block,
Lower Indus Basin, Pakistan
Muhammad Fahad Mahmood, Urooj Shakir, M. Raiees Amjad, Asad Taimur
Department of Earth and Environmental Sciences, Bahria University, Islamabad Campus, Pakistan.
Corresponding Author Email: [email protected]
Abstract - Badin area is located in the southwestern
periphery of the Indian plate, in lower Indus basin. The
research is carried out to delineate the subsurface geometry of
the area with the help of seismic data in order to understand its
petroleum system. Main emphasize is to analyze reservoir
formations and sealing characteristics. Time and depth contour
maps are generated to reveal the subsurface structural
geometry along with petrophysical analysis for formation
evaluation and reserves estimation to calculate the
hydrocarbon potential. Interpretation results show extensional
regime, dominated by horst and graben structures. Grabens are
of immense exploratory importance in research area as they are
believed to be the kitchen area of hydrocarbon generation. The
faults show different aspects, of which the foremost is trap
formation and their role to facilitate the hydrocarbon migration
from source to reservoir. Study area holds all the major
elements of petroleum system considering risk and volumetric
analysis results.
Keywords – Seismic data, Petrophysical analysis,
Formation evaluation, Reserves estimation
INTRODUCTION
The Badin block is located in the Lower Indus Basin,
southern portion of the Sindh, Pakistan, approximately 160
km east to the Karachi city (Figure 1). The total area of the
concessions is 7,650 km2. The location of Badin South block
lies between 68゜11’ E to 68゜47’ E longitude and 24゜06’
N to 25゜02’ N latitude as shown in Figure 1. The Badin
South block covering an area of 1265.3 km2, bounded on the
north by Hyderabad district, on the east by Tharparkar
districts, while Thatta district is present on its west side and
Arabian Sea on its southern side Ahmad et al., (2003).
In this research seismic data is used to investigate the
structural styles, tectonic setting and hydrocarbon potential
of the Badin Block. For future exploration strategies, the
seismic lines used for seismic data interpretation are shown
in Figure 2.
Fig. 1 Geological map showing location of the study area
not drawn to scale (modified after Kazmi et al., 1979).
TECTONICS AND STRATIGRAPHY
Badin is part of the Lower Indus basin. The Lower Indus
Basin stretches north-south along the Indus River and south
of Khairpur-Jacobabad High towards Arabian Sea. The
Nagar Parker Granite in the extreme southeastern corner of
Pakistan is the exposed part of the Indian craton. The areas
located to the west and northwest of Nagar Parker are the
Tharparkar slope that dips westward and northwestward and
where Indus basin is most prospective for hydrocarbon
exploration (Mozaffar et al., 2002). The Badin Rift (Figure
1) is characterized by a series of horst and graben structures
present below the base Paleocene unconformity. These
horsts and graben structures were formed as a result of rifting
between India and Seychelles during the Late Cretaceous
(Khan et al., 2013).
Fig. 2 Basemap of study area showing the orientation of
seismic lines and wells locations
The oldest formation penetrated in Badin is the Jurassic
Chiltan Limestone (Mozaffar et al., 2002), which overlies
Triassic strata within the Badin Block (Khan et al., 2013).
Whereas, Chiltan Formation (Figure 3) overlain by the
Lower Cretaceous marine sand-shale sequence of the
Sembar and Goru Formations (Wasimuddin et al., 2005).
The lower most Sembar Formation of the Early Cretaceous
sequence is composed of organic rich shale. The Lower Goru
sequence overlies the Sembar Formation. The Lower Goru
horizon is divided into five members based on predominant

Available on: www.bahria.edu.pk/bukc/burjes2016 Bahria University Research Journal of Earth Sciences Vol. 2, Issue 1, June 2017
ISSN 2415-2234 © BURJES Page 31
lithologies. The Upper Goru unconformably overlies the
Lower Goru Formation, which consists of mainly marl and
calcareous claystone (Figure 3) occasionally with interbeds
of silt and limestone (Mozaffar et al., 2002).
Fig. 3 Stratigraphic column of Badin Area (modified
after Mozaffar et al., 2002).
METHODOLOGY AND RESULTS
A) Seismic Data Interpretation and Mapping
Before carrying out seismic interpretation of study area
the seismic to well tie was performed. For this purpose
synthetic seismogram was generated using Forward
Modeling Technique (figure 4). Synthetic seismograms were
generated at well Keyhole-1 and Doti-1 by using acoustic
and density log (Figures 5 & 6). The well logs were also used
throughout the correlation process
Fig. 4 Synthetic seismogram generated at
Keyhole-01 well
Red line in Figure 4 denotes the velocity curves derived
from the sonic log. Blue line is the density curve, while green
curve denotes the acoustic impedance. Extracted Ricker
wavelet is also shown in Figure 4. The final trace is displayed
in the right part in Figure 4. On the basis of all above sonic,
density, acoustic impedance, and the GR log response is
observed for Formations Lower Goru and its sub divisions.
Fig. 5 Formation tops from Doti-1 overlain
on seismic section
Seismic data is interpreted and many favorable spots for
oil and gas accumulation were identified as shown in Figure
7, and with integrated geological and geophysical data
Fig. 6 Formation tops from Keyhole-1 overlain
on seismic section
The data quality is from average to good due to which
horizons and major faults were easily sorted out. All the
major faults were marked and assigned a specified color in
order for fault correlation to create fault polygons in Two
Way Time and subsequently Depth Mapping. Minor faults
indicated on single lines were unassigned and were left in
their natural black color scheme. Interpretation below

Available on: www.bahria.edu.pk/bukc/burjes2016 Bahria University Research Journal of Earth Sciences Vol. 2, Issue 1, June 2017
ISSN 2415-2234 © BURJES Page 32
Khadro indicated tilted fault blocks, normal faults with
north-south trend and a significant throw, as well as horst and
graben structures. All this interpretation correlate with the
regional geology of the area (Jadoon et al., 2016) which
indicates the confidence of the interpretation as shown in
Figure 7.
Fig. 7 Interpreted Seismic Line PK92-1682
Fig. 8 Two Way Time contour map at TLG
As per the seismic reflection data interpretation, two
way time maps were generated on all levels described above.
Faults polygons were prepared for all assigned and
unassigned faults and were associated to the grid of the
specified horizon. These grids were subjected to certain
calculations after which the two way time contours were
generated. Initially regional maps were generated and
analyzed carefully before any depth conversion. Various
structural closures were identified on all four levels as shown
in figure 8.
Velocities for depth conversion were determined by a
velocity-time curve utilizing the data of Doti and Keyhole
wells. The velocities determined from the curve were utilized
in the preparation of ‘Depth Structure’ Maps. While the maps
on TLG were prepared using variable velocity method as
shown in figure 9.
Fig. 9 Depth contour map at TLG
The contour maps of top Lower Goru indicate that
formation is deepening in the western side on contrary to
Ranikot formation. This change of dipping indicates the
change in basin tilt at the later stage. The contour maps of
TLG, show horst and graben geometry in which major faults
are running from northwest to southeast direction. Faults are
dipping towards west and east. The red color indicates the
prominent highs whereas the deep blue color shows the
graben structure. One high is present in the eastern side, as
the leading structure. The high present in the center where
well Doti-01 was drilled is the prominent structure (Figures
8 & 9).
B) Petrophysical Evaluation
Digital LAS files of Doti-01 and Keyhole-01 were
loaded in Kingdom software for petrophysical analysis. The
petrophysical techniques were used to calculate the Shale
Volume, Average Porosity, Effective Porosity and Water
Saturation. Details of the petrophysical methodology
adopted and derivation of petrophysical parameters used
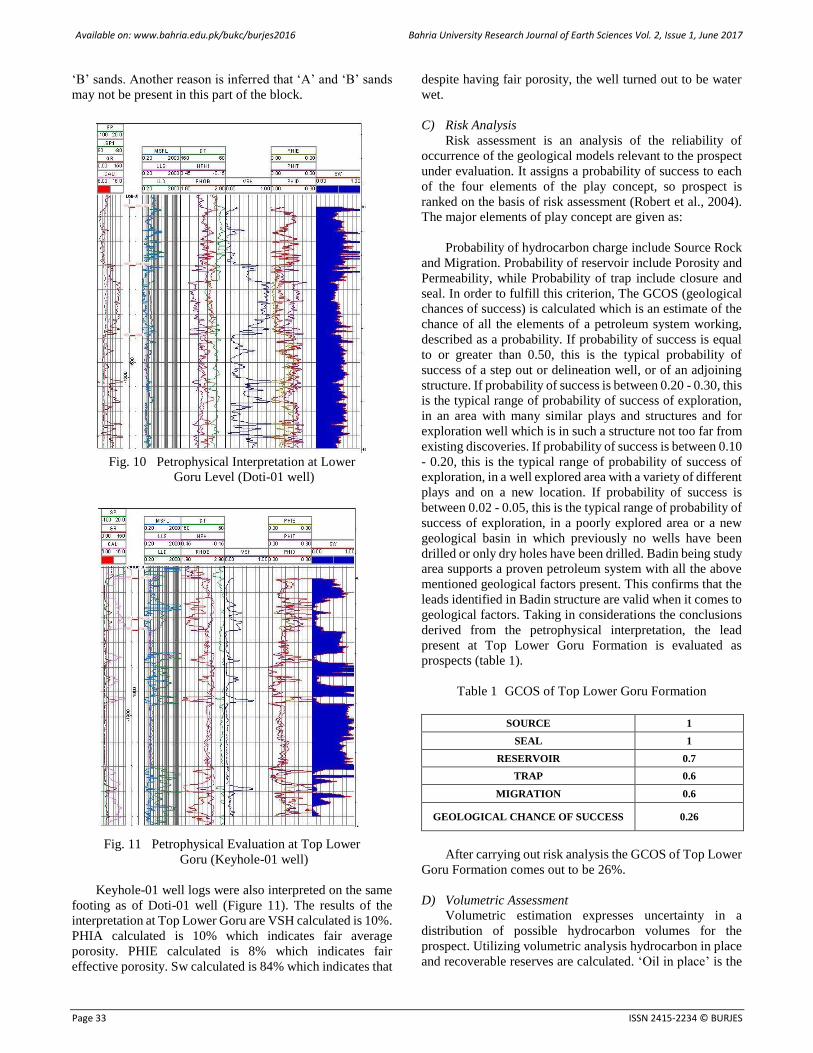
therein are described as following. Interpretation is carried
out at Cretaceous Lower Goru Sands (figure 10). Volume of
shale, average and effective porosities, and water saturation
are calculated. The results of the calculation at Top Lower
Goru level in Doti-01 well are given below:
Vsh calculated is 32%. PHIA calculated is 14% which
indicates good average porosity. PHIE calculated is 9%
which indicates fair effective porosity. SW calculated is 71%
which indicates that despite having fair to good porosity, the
well turned out to be water wet. Most of the hydrocarbon
accumulation in Badin is in ‘A’ and ‘B’ sands. The ‘C’ sand
is either wet or has shown strong water support to
hydrocarbon accumulations. This leads to a conclusion that
Doti has not encountered ‘A’ and ‘B’ sands. Either the well
was drilled inside the fault due to which it missed the ‘A’ and
Available on: www.bahria.edu.pk/bukc/burjes2016 Bahria University Research Journal of Earth Sciences Vol. 2, Issue 1, June 2017
ISSN 2415-2234 © BURJES Page 33
‘B’ sands. Another reason is inferred that ‘A’ and ‘B’ sands
may not be present in this part of the block.
Fig. 10 Petrophysical Interpretation at Lower
Goru Level (Doti-01 well)
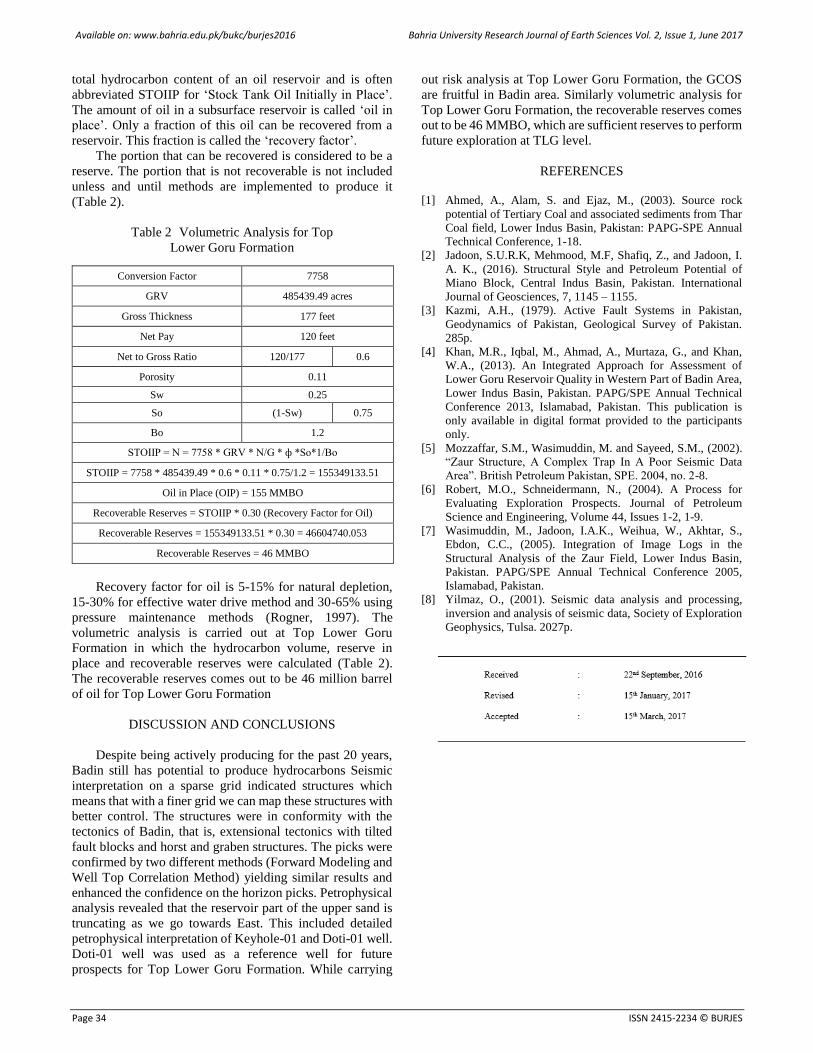
Fig. 11 Petrophysical Evaluation at Top Lower
Goru (Keyhole-01 well)
Keyhole-01 well logs were also interpreted on the same
footing as of Doti-01 well (Figure 11). The results of the
interpretation at Top Lower Goru are VSH calculated is 10%.
PHIA calculated is 10% which indicates fair average
porosity. PHIE calculated is 8% which indicates fair
effective porosity. Sw calculated is 84% which indicates that
despite having fair porosity, the well turned out to be water
wet.
C) Risk Analysis
Risk assessment is an analysis of the reliability of
occurrence of the geological models relevant to the prospect
under evaluation. It assigns a probability of success to each
of the four elements of the play concept, so prospect is
ranked on the basis of risk assessment (Robert et al., 2004).
The major elements of play concept are given as:
Probability of hydrocarbon charge include Source Rock
and Migration. Probability of reservoir include Porosity and
Permeability, while Probability of trap include closure and
seal. In order to fulfill this criterion, The GCOS (geological
chances of success) is calculated which is an estimate of the
chance of all the elements of a petroleum system working,
described as a probability. If probability of success is equal
to or greater than 0.50, this is the typical probability of
success of a step out or delineation well, or of an adjoining
structure. If probability of success is between 0.20 - 0.30, this
is the typical range of probability of success of exploration,
in an area with many similar plays and structures and for
exploration well which is in such a structure not too far from
existing discoveries. If probability of success is between 0.10
- 0.20, this is the typical range of probability of success of
exploration, in a well explored area with a variety of different
plays and on a new location. If probability of success is
between 0.02 - 0.05, this is the typical range of probability of
success of exploration, in a poorly explored area or a new
geological basin in which previously no wells have been
drilled or only dry holes have been drilled. Badin being study
area supports a proven petroleum system with all the above
mentioned geological factors present. This confirms that the
leads identified in Badin structure are valid when it comes to
geological factors. Taking in considerations the conclusions
derived from the petrophysical interpretation, the lead
present at Top Lower Goru Formation is evaluated as
prospects (table 1).
Table 1 GCOS of Top Lower Goru Formation
SOURCE 1
SEAL 1
RESERVOIR 0.7
TRAP 0.6
MIGRATION 0.6
GEOLOGICAL CHANCE OF SUCCESS 0.26
After carrying out risk analysis the GCOS of Top Lower
Goru Formation comes out to be 26%.
D) Volumetric Assessment
Volumetric estimation expresses uncertainty in a
distribution of possible hydrocarbon volumes for the
prospect. Utilizing volumetric analysis hydrocarbon in place
and recoverable reserves are calculated. ‘Oil in place’ is the
Available on: www.bahria.edu.pk/bukc/burjes2016 Bahria University Research Journal of Earth Sciences Vol. 2, Issue 1, June 2017
ISSN 2415-2234 © BURJES Page 34
total hydrocarbon content of an oil reservoir and is often
abbreviated STOIIP for ‘Stock Tank Oil Initially in Place’.
The amount of oil in a subsurface reservoir is called ‘oil in
place’. Only a fraction of this oil can be recovered from a
reservoir. This fraction is called the ‘recovery factor’.
The portion that can be recovered is considered to be a
reserve. The portion that is not recoverable is not included
unless and until methods are implemented to produce it
(Table 2).
Table 2 Volumetric Analysis for Top
Lower Goru Formation
Recovery factor for oil is 5-15% for natural depletion,
15-30% for effective water drive method and 30-65% using
pressure maintenance methods (Rogner, 1997). The
volumetric analysis is carried out at Top Lower Goru
Formation in which the hydrocarbon volume, reserve in
place and recoverable reserves were calculated (Table 2).
The recoverable reserves comes out to be 46 million barrel
of oil for Top Lower Goru Formation
DISCUSSION AND CONCLUSIONS
Despite being actively producing for the past 20 years,
Badin still has potential to produce hydrocarbons Seismic
interpretation on a sparse grid indicated structures which
means that with a finer grid we can map these structures with
better control. The structures were in conformity with the
tectonics of Badin, that is, extensional tectonics with tilted
fault blocks and horst and graben structures. The picks were
confirmed by two different methods (Forward Modeling and
Well Top Correlation Method) yielding similar results and
enhanced the confidence on the horizon picks. Petrophysical
analysis revealed that the reservoir part of the upper sand is
truncating as we go towards East. This included detailed
petrophysical interpretation of Keyhole-01 and Doti-01 well.
Doti-01 well was used as a reference well for future
prospects for Top Lower Goru Formation. While carrying
out risk analysis at Top Lower Goru Formation, the GCOS
are fruitful in Badin area. Similarly volumetric analysis for
Top Lower Goru Formation, the recoverable reserves comes
out to be 46 MMBO, which are sufficient reserves to perform
future exploration at TLG level.
REFERENCES
[1] Ahmed, A., Alam, S. and Ejaz, M., (2003). Source rock
potential of Tertiary Coal and associated sediments from Thar
Coal field, Lower Indus Basin, Pakistan: PAPG-SPE Annual
Technical Conference, 1-18.
[2] Jadoon, S.U.R.K, Mehmood, M.F, Shafiq, Z., and Jadoon, I.
A. K., (2016). Structural Style and Petroleum Potential of
Miano Block, Central Indus Basin, Pakistan. International
Journal of Geosciences, 7, 1145 – 1155.
[3] Kazmi, A.H., (1979). Active Fault Systems in Pakistan,
Geodynamics of Pakistan, Geological Survey of Pakistan.
285p.
[4] Khan, M.R., Iqbal, M., Ahmad, A., Murtaza, G., and Khan,
W.A., (2013). An Integrated Approach for Assessment of
Lower Goru Reservoir Quality in Western Part of Badin Area,
Lower Indus Basin, Pakistan. PAPG/SPE Annual Technical
Conference 2013, Islamabad, Pakistan. This publication is
only available in digital format provided to the participants
only.
[5] Mozzaffar, S.M., Wasimuddin, M. and Sayeed, S.M., (2002).
“Zaur Structure, A Complex Trap In A Poor Seismic Data
Area”. British Petroleum Pakistan, SPE. 2004, no. 2-8.
[6] Robert, M.O., Schneidermann, N., (2004). A Process for
Evaluating Exploration Prospects. Journal of Petroleum
Science and Engineering, Volume 44, Issues 1-2, 1-9.
[7] Wasimuddin, M., Jadoon, I.A.K., Weihua, W., Akhtar, S.,
Ebdon, C.C., (2005). Integration of Image Logs in the
Structural Analysis of the Zaur Field, Lower Indus Basin,
Pakistan. PAPG/SPE Annual Technical Conference 2005,
Islamabad, Pakistan.
[8] Yilmaz, O., (2001). Seismic data analysis and processing,
inversion and analysis of seismic data, Society of Exploration
Geophysics, Tulsa. 2027p.
Conversion Factor 7758
GRV 485439.49 acres
Gross Thickness 177 feet
Net Pay 120 feet
Net to Gross Ratio 120/177 0.6
Porosity 0.11
Sw 0.25
So (1-Sw) 0.75
Bo 1.2
STOIIP = N = 7758 * GRV * N/G * ф *So*1/Bo
STOIIP = 7758 * 485439.49 * 0.6 * 0.11 * 0.75/1.2 = 155349133.51
Oil in Place (OIP) = 155 MMBO
Recoverable Reserves = STOIIP * 0.30 (Recovery Factor for Oil)
Recoverable Reserves = 155349133.51 * 0.30 = 46604740.053
Recoverable Reserves = 46 MMBO